Embed Size (px)
Citation preview
Acknowledgments Skills for Care would like to thank all of the employers who have completed NMDS-SC data, as without their efforts estimates of this detail and accuracy would not be possible. This report has been researched and compiled by Skills for Care’s Workforce Intelligence Analysis team; Dave Griffiths, Will Fenton, Sarah Davison, Gary Polzin, Roy Price, Jess Arkesden and Daisy Cox. Feedback on any aspect of this report will be very welcome and will help to improve future editions. Please contact Skills for Care’s analysis team [email protected]. The state of the adult social care sector and workforce in England, 2017 Published by Skills for Care, West Gate, 6 Grace Street, Leeds LS1 2RP www.skillsforcare.org.uk © Skills for Care 2017 Copies of this work may be made for non-commercial distribution to aid social care workforce development. Any other copying requires the permission of Skills for Care. Skills for Care is the employer-led strategic body for workforce development in social care for adults in England. This work was researched and complied by Skills for Care’s Workforce Intelligence team. Bibliographical reference data for Harvard-style author/data referencing system: Short: Skills for Care [or SfC] 2017 Long: Skills for Care, The state of the adult social care sector and workforce in England, 2017 (Leeds, 2017). Available at www.skillsforcare.org.uk/stateof.

Foreword from our CEO I’m pleased to introduce the 2017 State of the Adult Social Care Sector and Workforce Report which is one of the key documents used to monitor the changes and trends in our growing sector. Skills for Care first started to produce this report in 2004 using data from the Labour Force Survey, the Annual Survey of Hourly Earnings, the Information Centre (now NHS Digital), the Commission for Social Care Inspection (now the Care Quality Commission) and other sources. At that time it was necessary for us to use these varied data sources, often with small sample sizes that were not directly comparable to each other, because a workforce data collection across adult social care simply did not exist. There was very little data on the independent sector, despite this being where the vast majority of the workforce is employed and this overall lack of intelligence really hindered the sector when it came to providing reliable evidence on which to make planning and funding decisions. 2017 marks the ten year anniversary of the National Minimum Data Set for Social Care (NMDS-SC) as an online system, and as we reach this milestone its success is reflected in our ability to produce reports of this breadth and quality. We are now able to tell you with confidence how the sector has grown over the last 5 years but may be beginning to plateau; how pay rates have progressed (or not); how many EU workers work in adult social care; which services areas are growing and much, much more. I sometimes have to remind myself not to take this wealth of intelligence for granted as it just did not exist a decade ago.
On behalf of Skills for Care I want to once again thank all the employers who engage with the NMDS-SC who understand that the information they provide is vital in their business planning as well as for local and national level policy makers. Not only does the intelligence derived from the NMDS-SC allow us to understand the sector today, we can also track how it is has evolved over the last five to ten years and project forward using our demand models. Different projections produced by our Workforce Intelligence team show that by 2030, the sector may need between 350,000 and 700,000 new jobs. The workforce intelligence contained in this report is vital in planning and making decisions about the sector based on the best evidence available. This report is an invaluable resource helping the sector confidently make decisions based on quality data as we look to meet the significant challenges head for all of us, the most important of which is to ensure that citizens in communities throughout England receive consistently high quality care and support from a skilled, confident and capable workforce. Sharon Allen CEO, Skills for Care
Executive summary The ‘State of the adult social care sector and workforce in England, 2017’ report produced by Skills for Care provides information about the sector including; its size and shape, employment information, recruitment and retention issues, workforce demographics, pay, qualification rates and future workforce forecasts. Skills for Care, as the leading source of adult social care workforce intelligence, helps to create a better-led, skilled and valued adult social care workforce. We provide practical tools and support to help adult social care organisations in England recruit, retain, develop and lead their workforce. We work with employers and related services to ensure dignity and respect are at the heart of service delivery. The National Minimum Data Set for Social Care (NMDS-SC) is an online workforce data collection system for the adult social care sector. 2017 marks ten years since the launch of NMDS-SC online. That is ten years of workforce intelligence helping to shape and provide evidence about the sector. Adult social care is a growing sector that, in 2016, had around 20,300 organisations, 40,400 care providing locations and a workforce of around 1.58 million jobs. The number of full-time equivalent jobs was estimated at 1.11 million and the number of people working in adult social care was estimated at 1.45 million. As at 2016/17 the adult social care sector was estimated to contribute £41.8 billion per annum to the English economy. The total wage bill of the sector, calculated using NMDS-SC information, accounted for almost half (46%) of this amount, at £19.3 billion (up 16% from 2011/2012).
The number of adult social care jobs has increased by 19% since 2009 (by 255,000 jobs). The number of jobs increased by around 1.5% (by 20,000 jobs) between 2015 and 2016. This rate of increase was slower than in previous years. From here on, the executive summary refers to those 1.34 million jobs
working in the independent sector (87% of jobs) and the local authority sector (7% of jobs) only. Jobs for people using direct payments to employ their own care and support staff, and those working in the NHS are not included1. The information in this report was taken from local authorities as at September 2016 and from independent sector employers as at March 20172. Employment information The majority (90%) of the adult social care workforce were employed on permanent contracts. Approximately half of the workforce (51%) worked on a full-time basis, 37% were part-time and the remaining 12% had no fixed hours.
1 Detailed workforce information about jobs working in the NHS were not available and therefore could not be included
in Skill for Cares estimates by characteristics. Jobs for people using direct payments to employ their own care and
support staff are shown in chapter six of this report. 2 Local authority employers compete the NMDS-SC in September each year, independent sector employers have no
fixed census date so March data is used as it is the end of the financial year, before National Living Wage changes.
19%
Around a quarter of the workforce were recorded as being on zero-hours contracts (24%, 325,000 jobs). Domiciliary care services had the highest proportion of workers on zero-hours contracts (47%), especially among care workers (56%) and registered nurses (55%). The percentage of workers on zero-hours contracts between 2012/13 and 2016/17 remained relatively stable, going down by two percentage points over the period. Recruitment and retention
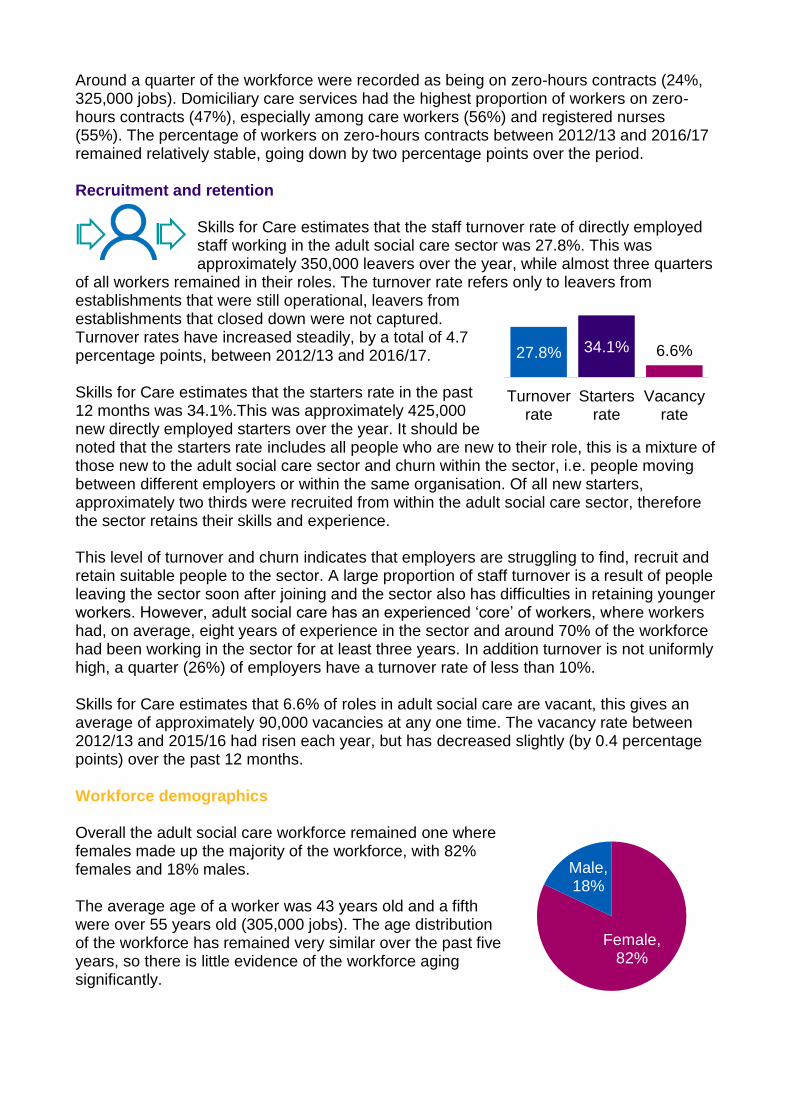
Skills for Care estimates that the staff turnover rate of directly employed staff working in the adult social care sector was 27.8%. This was approximately 350,000 leavers over the year, while almost three quarters
of all workers remained in their roles. The turnover rate refers only to leavers from establishments that were still operational, leavers from establishments that closed down were not captured. Turnover rates have increased steadily, by a total of 4.7 percentage points, between 2012/13 and 2016/17. Skills for Care estimates that the starters rate in the past 12 months was 34.1%.This was approximately 425,000 new directly employed starters over the year. It should be noted that the starters rate includes all people who are new to their role, this is a mixture of those new to the adult social care sector and churn within the sector, i.e. people moving between different employers or within the same organisation. Of all new starters, approximately two thirds were recruited from within the adult social care sector, therefore the sector retains their skills and experience. This level of turnover and churn indicates that employers are struggling to find, recruit and retain suitable people to the sector. A large proportion of staff turnover is a result of people leaving the sector soon after joining and the sector also has difficulties in retaining younger workers. However, adult social care has an experienced ‘core’ of workers, where workers had, on average, eight years of experience in the sector and around 70% of the workforce had been working in the sector for at least three years. In addition turnover is not uniformly high, a quarter (26%) of employers have a turnover rate of less than 10%. Skills for Care estimates that 6.6% of roles in adult social care are vacant, this gives an average of approximately 90,000 vacancies at any one time. The vacancy rate between 2012/13 and 2015/16 had risen each year, but has decreased slightly (by 0.4 percentage points) over the past 12 months. Workforce demographics Overall the adult social care workforce remained one where females made up the majority of the workforce, with 82% females and 18% males. The average age of a worker was 43 years old and a fifth were over 55 years old (305,000 jobs). The age distribution of the workforce has remained very similar over the past five years, so there is little evidence of the workforce aging significantly.
27.8% 34.1% 6.6%
Turnoverrate
Startersrate
Vacancyrate
Female, 82%
Male, 18%
Fewer than 70% 70 to 79% 80 to 89% 90 or higher
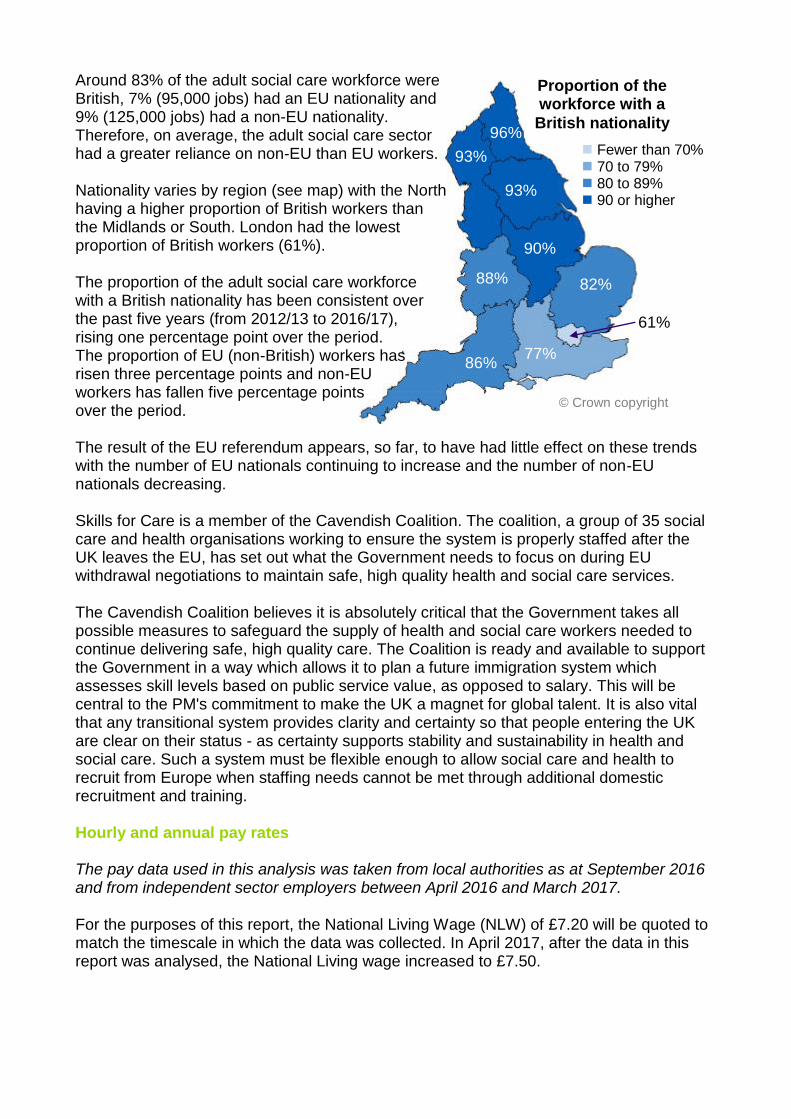
Around 83% of the adult social care workforce were British, 7% (95,000 jobs) had an EU nationality and 9% (125,000 jobs) had a non-EU nationality. Therefore, on average, the adult social care sector had a greater reliance on non-EU than EU workers. Nationality varies by region (see map) with the North having a higher proportion of British workers than the Midlands or South. London had the lowest proportion of British workers (61%). The proportion of the adult social care workforce with a British nationality has been consistent over the past five years (from 2012/13 to 2016/17), rising one percentage point over the period. The proportion of EU (non-British) workers has risen three percentage points and non-EU workers has fallen five percentage points over the period. The result of the EU referendum appears, so far, to have had little effect on these trends with the number of EU nationals continuing to increase and the number of non-EU nationals decreasing. Skills for Care is a member of the Cavendish Coalition. The coalition, a group of 35 social care and health organisations working to ensure the system is properly staffed after the UK leaves the EU, has set out what the Government needs to focus on during EU withdrawal negotiations to maintain safe, high quality health and social care services. The Cavendish Coalition believes it is absolutely critical that the Government takes all possible measures to safeguard the supply of health and social care workers needed to continue delivering safe, high quality care. The Coalition is ready and available to support the Government in a way which allows it to plan a future immigration system which assesses skill levels based on public service value, as opposed to salary. This will be central to the PM's commitment to make the UK a magnet for global talent. It is also vital that any transitional system provides clarity and certainty so that people entering the UK are clear on their status - as certainty supports stability and sustainability in health and social care. Such a system must be flexible enough to allow social care and health to recruit from Europe when staffing needs cannot be met through additional domestic recruitment and training. Hourly and annual pay rates The pay data used in this analysis was taken from local authorities as at September 2016 and from independent sector employers between April 2016 and March 2017. For the purposes of this report, the National Living Wage (NLW) of £7.20 will be quoted to match the timescale in which the data was collected. In April 2017, after the data in this report was analysed, the National Living wage increased to £7.50.
© Crown copyright
Proportion of the workforce with a
British nationality
82%
86%
88%
90%
93%
93%
96%
77%
61%
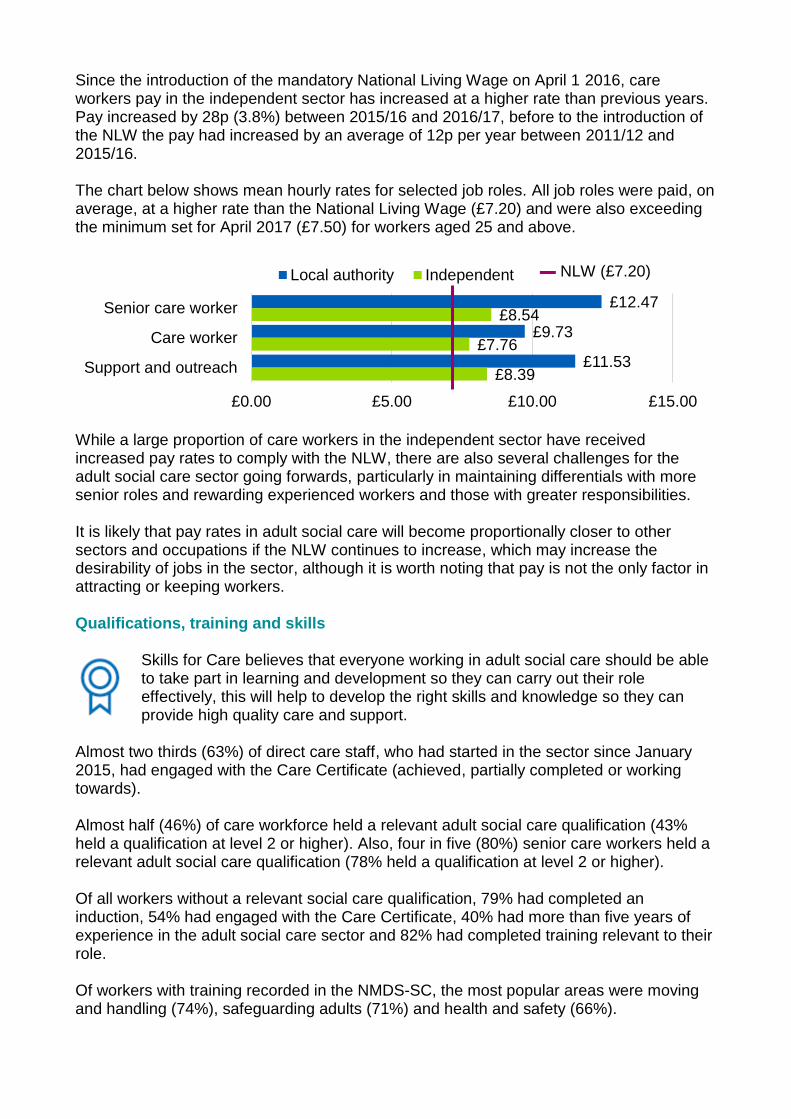
Since the introduction of the mandatory National Living Wage on April 1 2016, care workers pay in the independent sector has increased at a higher rate than previous years. Pay increased by 28p (3.8%) between 2015/16 and 2016/17, before to the introduction of the NLW the pay had increased by an average of 12p per year between 2011/12 and 2015/16. The chart below shows mean hourly rates for selected job roles. All job roles were paid, on average, at a higher rate than the National Living Wage (£7.20) and were also exceeding the minimum set for April 2017 (£7.50) for workers aged 25 and above.
While a large proportion of care workers in the independent sector have received increased pay rates to comply with the NLW, there are also several challenges for the adult social care sector going forwards, particularly in maintaining differentials with more senior roles and rewarding experienced workers and those with greater responsibilities. It is likely that pay rates in adult social care will become proportionally closer to other sectors and occupations if the NLW continues to increase, which may increase the desirability of jobs in the sector, although it is worth noting that pay is not the only factor in attracting or keeping workers. Qualifications, training and skills
Skills for Care believes that everyone working in adult social care should be able to take part in learning and development so they can carry out their role effectively, this will help to develop the right skills and knowledge so they can provide high quality care and support.
Almost two thirds (63%) of direct care staff, who had started in the sector since January 2015, had engaged with the Care Certificate (achieved, partially completed or working towards). Almost half (46%) of care workforce held a relevant adult social care qualification (43% held a qualification at level 2 or higher). Also, four in five (80%) senior care workers held a relevant adult social care qualification (78% held a qualification at level 2 or higher). Of all workers without a relevant social care qualification, 79% had completed an induction, 54% had engaged with the Care Certificate, 40% had more than five years of experience in the adult social care sector and 82% had completed training relevant to their role. Of workers with training recorded in the NMDS-SC, the most popular areas were moving and handling (74%), safeguarding adults (71%) and health and safety (66%).
£12.47
£9.73
£11.53
£8.54
£7.76
£8.39
£0.00 £5.00 £10.00 £15.00
Senior care worker
Care worker
Support and outreach
Local authority Independent ▬ NLW (£7.20)
Workforce forecasts The ‘Projecting Older People Population Information System’ (POPPI) uses figures taken from Office for National Statistics to project forward the population aged 65 and over from 2016 to 2030. This population is projected to increase
between 2016 and 2030 from 9.74 million to 13.25 million people in England, an increase of around 36%. In the short and medium term this poses potential challenges for the adult social care sector and workforce. Skills for Care brings together adult social care workforce estimates with population projection information to forecast the number of adult social care jobs that may be needed to keep up with demand in the future. These projections should be treated as ‘base case’ projections as they only account for demographic and population change over the period. They do not account for any political, economic, technological or social factors that could have an impact on the future size of the workforce. Skills for Care forecasts show that if the adult social care workforce grows proportionally to the projected number of people aged 65 and over in the population between 2016 and 2030, an increase of 31% (500,000 jobs) would be required by 2030. The 75 and over population is forecasts to grow at a faster rate than those aged 65-74, and if the workforce increases proportionally to this demographic then a 44% (700,000 jobs) increase would be required. It is acknowledged that other factors, as previously mentioned, could have a large influence on the size of the workforce over the next 15 years. The projections do, however, give an indication on the pressures created by demographic change on the size of the adult social care workforce.
Contents 1 Size and structure of the sector and workforce 13 2 Employment overview 25 3 Recruitment and retention 31 4 Workforce demographics 49 5 Pay, qualifications and training 61 6 Personal assistants 79 7 Workforce forecasts 95 8 Further resources 99
Introduction It is crucial that the adult social care sector has clear, robust workforce intelligence about its size and shape, this will help reinforce its position as a major part of the economy. Good quality information about the workforce is vital to help improve the planning and quality of social care services, which will improve outcomes for people who use these services, both now and in the future. Skills for Care is the leading source of adult social care workforce intelligence Skills for Care is the leading source of adult social care workforce intelligence. Our expertise comes from the workforce intelligence we collect in the National Minimum Data Set for Social Care (NMDS-SC), from our experience of analysing and interpreting social care data, and from our network of Locality Managers all over England, talking with, and learning from employers. This workforce intelligence expertise is at the centre of everything we do at Skills for Care. About Skills for Care Skills for Care helps create a better-led, skilled and valued adult social care workforce. Using our workforce intelligence, in conjunction with what we hear from employers, we understand the adult social care workforce, its strengths, issues (both present issues, future risks and opportunities). Based on this we provide practical tools and support, to help adult social care organisations in England recruit, develop and lead their workforce. We work with employers and related services to ensure dignity and respect are at the heart of service delivery. For more information about Skills for Care please see our website www.skillsforcare.org.uk About the NMDS-SC The National Minimum Data Set for Social Care (NMDS-SC) is an online workforce data collection system for the social care sector. The NMDS-SC is managed by Skills for Care on behalf of the Department of Health and has been collecting information about social care providers and their staff online since 2007. This year marks ten years since the launch of NMDS-SC online. That is ten years of workforce intelligence helping shape and inform the sector. The NMDS-SC collects information on the size and structure of the whole adult social care sector including; types of care services that are provided and a detailed picture of the workforce, including retention, demographics, pay rates and qualifications. For more information about the NMDS-SC please visit www.nmds-sc-online.org.uk. For information about how workforce intelligence is used across the adult social care sector please see chapter 8 ‘further resources’.
NMDS-SC coverage of the adult social care sector There were an estimated 1.58 million jobs in the adult social care sector. Around 1.34 million of these were within local authority and independent sector employers in 2016. Approximately half of the workforce were recorded in the NMDS-SC. This coverage varies by care services, job role and geographical area. Local authorities (adult social services departments) For the past five years NMDS-SC has been the adult workforce data return for local authorities. In 2016, for the 5th year in a row, all 152 local authorities in England have met the criteria of a full NMDS-SC return for people working in their adult social services departments. CQC regulated services Skills for Care estimates that there were 40,400 care establishments providing or organising adult social care in England in 2016, around 25,250 of these services were CQC regulated. At the end of March 2017, the NMDS-SC had 56% coverage of all CQC regulated social care establishments (14,000 out of 25,250). These CQC regulated establishments had completed around 553,000 NMDS-SC worker records between them (out of a total population of around 1.1 million workers employed by CQC registered employers). A sample of this size provides a solid basis for creating reliable and precise analyses about the regulated adult social care workforce at both a national and local level. All data in the NMDS-SC has been updated or confirmed to be up to date within the last two years and 90% of employers updated their data in the past 12 months. Every effort is made to ensure that information derived from the NMDS-SC is reliable. All NMDS-SC data is validated at source and has been through rigorous data quality checks before analysis. Methodology used to estimate characteristics of the adult social care sector As explained above, the NMDS-SC, as a non-mandatory return for the independent sector, does not have 100% coverage of the adult social care sector, however, it does have a large enough sample to provide a solid basis for creating reliable and precise adult social care sector and workforce estimates at both a national and local level. Skills for Care’s Workforce Intelligence team use data collected by the NMDS-SC to create workforce models that, in turn, allow for estimates of the whole adult social care workforce to be produced. A simplified explanation of how the information is produced is that Skills for Care use NMDS-SC data to make estimates of workforce characteristics (e.g. demographics, pay rates, employment statuses) for each geographical area, service type, employer type and job role combination that we report by. These estimates are then ‘weighted’ according to NMDS-SC’s coverage/completeness of the sector in each of the above areas. For example, an area with 50% coverage would use more weighted data in the final analysis than an area with 90% coverage. Using this methodology allows for the analysis to be representative of all adult social care workers even if the NMDS-SC has uneven levels of data coverage. Skills for Care is confident in the quality of these estimates and the methodologies used have been peer reviewed by universities and an independent statistician. For a detailed methodology of how these estimates are produced please see www.skillsforcare.org.uk/workforceestimates.
In this report, Independent sector information is derived from the NMDS-SC as at March 2017, local authority information is correct as at September 20163. Terminology used in this report Adult social care and terminology used to describe it, continues to change. We have tried to maintain a degree of consistency and comparability with previous reports. So we have: Used the term ‘domiciliary care’ to describe ‘home care’, to avoid any confusion or
inadvertent word reversal with ‘care home’. Used the term ‘local authority’ to refer to councils’ adult social services departments. The independent sector as the sum of the private and the voluntary (third) sectors. The NMDS-SC collects information about 31 job roles, these are then aggregated into four groups for the purposes of analysis. The main roles within each job role group are as follows; Managerial, including; senior, middle and first line managers, registered managers,
supervisors and ‘managers and staff in care-related but not care-providing roles’. Regulated professions, including; social workers, occupational therapists, registered
nurses, allied health professionals and other regulated professions. Direct care, including; senior care workers, care workers, community support and
outreach workers (called support and outreach throughout this report) and other care-providing job roles.
Other roles, including; ‘administrative or office staff not care-providing’, ‘ancillary staff not care-providing’ and ‘other non-care-providing job roles’.
Similarly, the NMDS-SC collects information about 58 care services, these are also then aggregated into four groups for the purposes of analysis. Selected main care services within each group are as follows; Adult residential includes care homes with nursing and care homes without nursing, Adult day care services Adult domiciliary includes supported living and extra care housing Adult community care includes; community support and outreach, social work and
care management, carers support, occupational or employment related services and other adult community care services.
3 Local authority employers compete the NMDS-SC in September each year, independent sector employers have no
fixed census date so March data is used as it is the end of the financial year, before National Living Wage changes.

Size and structure
01
01 14
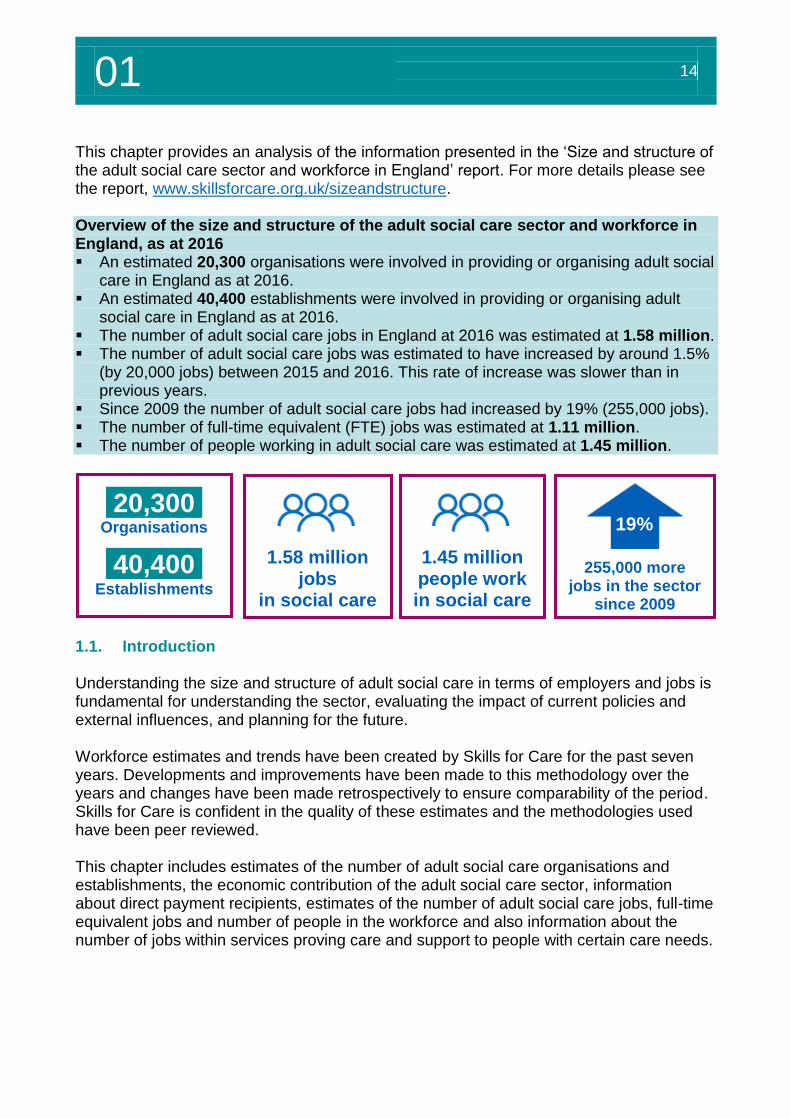
This chapter provides an analysis of the information presented in the ‘Size and structure of the adult social care sector and workforce in England’ report. For more details please see the report, www.skillsforcare.org.uk/sizeandstructure. 1. Size and structure of the sector and workforce Overview of the size and structure of the adult social care sector and workforce in England, as at 2016 An estimated 20,300 organisations were involved in providing or organising adult social
care in England as at 2016. An estimated 40,400 establishments were involved in providing or organising adult
social care in England as at 2016. The number of adult social care jobs in England at 2016 was estimated at 1.58 million. The number of adult social care jobs was estimated to have increased by around 1.5%
(by 20,000 jobs) between 2015 and 2016. This rate of increase was slower than in previous years.
Since 2009 the number of adult social care jobs had increased by 19% (255,000 jobs). The number of full-time equivalent (FTE) jobs was estimated at 1.11 million. The number of people working in adult social care was estimated at 1.45 million.
1.1. Introduction Understanding the size and structure of adult social care in terms of employers and jobs is fundamental for understanding the sector, evaluating the impact of current policies and external influences, and planning for the future. Workforce estimates and trends have been created by Skills for Care for the past seven years. Developments and improvements have been made to this methodology over the years and changes have been made retrospectively to ensure comparability of the period. Skills for Care is confident in the quality of these estimates and the methodologies used have been peer reviewed. This chapter includes estimates of the number of adult social care organisations and establishments, the economic contribution of the adult social care sector, information about direct payment recipients, estimates of the number of adult social care jobs, full-time equivalent jobs and number of people in the workforce and also information about the number of jobs within services proving care and support to people with certain care needs.
1.58 million jobs
in social care
1.45 million people work in social care
255,000 more jobs in the sector
since 2009
20,300. Organisations
40,400. Establishments
19%
01 15
Siz
e a
nd
str
uctu
re
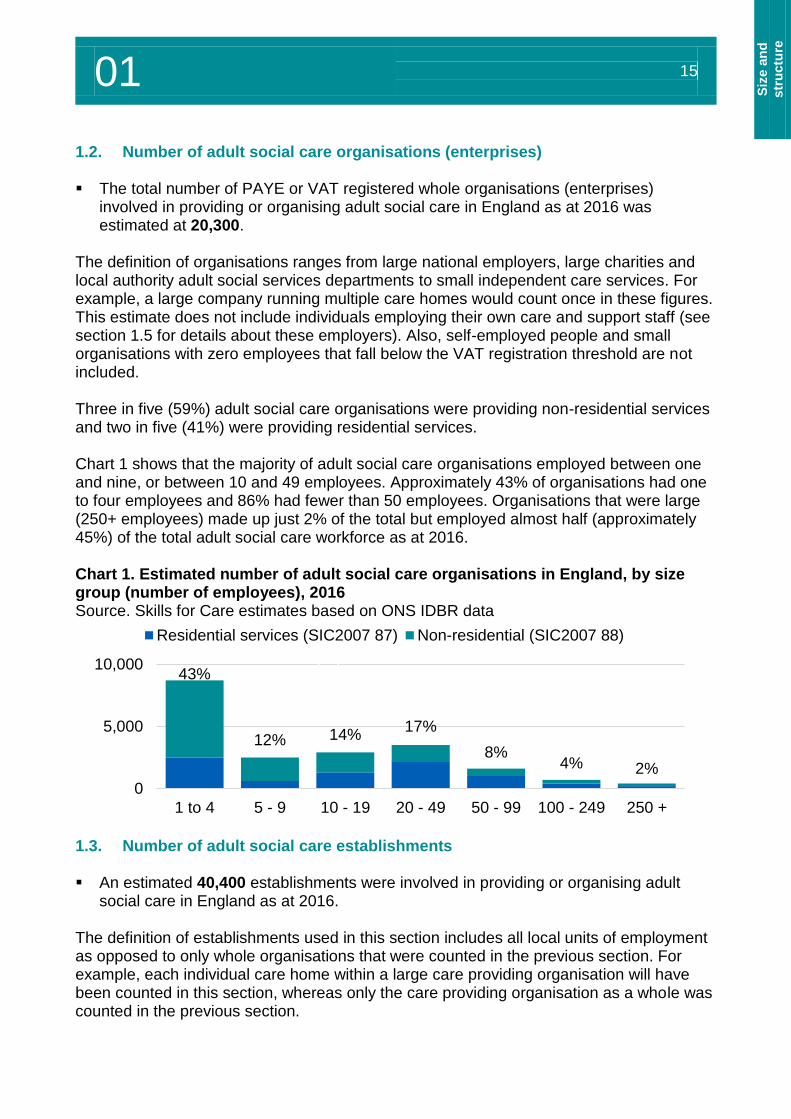
1.2. Number of adult social care organisations (enterprises) The total number of PAYE or VAT registered whole organisations (enterprises)
involved in providing or organising adult social care in England as at 2016 was estimated at 20,300.
The definition of organisations ranges from large national employers, large charities and local authority adult social services departments to small independent care services. For example, a large company running multiple care homes would count once in these figures. This estimate does not include individuals employing their own care and support staff (see section 1.5 for details about these employers). Also, self-employed people and small organisations with zero employees that fall below the VAT registration threshold are not included. Three in five (59%) adult social care organisations were providing non-residential services and two in five (41%) were providing residential services. Chart 1 shows that the majority of adult social care organisations employed between one and nine, or between 10 and 49 employees. Approximately 43% of organisations had one to four employees and 86% had fewer than 50 employees. Organisations that were large (250+ employees) made up just 2% of the total but employed almost half (approximately 45%) of the total adult social care workforce as at 2016. Chart 1. Estimated number of adult social care organisations in England, by size group (number of employees), 2016 Source. Skills for Care estimates based on ONS IDBR data
1.3. Number of adult social care establishments An estimated 40,400 establishments were involved in providing or organising adult
social care in England as at 2016. The definition of establishments used in this section includes all local units of employment as opposed to only whole organisations that were counted in the previous section. For example, each individual care home within a large care providing organisation will have been counted in this section, whereas only the care providing organisation as a whole was counted in the previous section.
43%
12% 14%17%
8%4% 2%
0%
5%
10%
15%
20%
25%
30%
35%
40%
45%
0
5,000
10,000
1 to 4 5 - 9 10 - 19 20 - 49 50 - 99 100 - 249 250 +
Residential services (SIC2007 87) Non-residential (SIC2007 88)
Total adult social care (%)
01 16
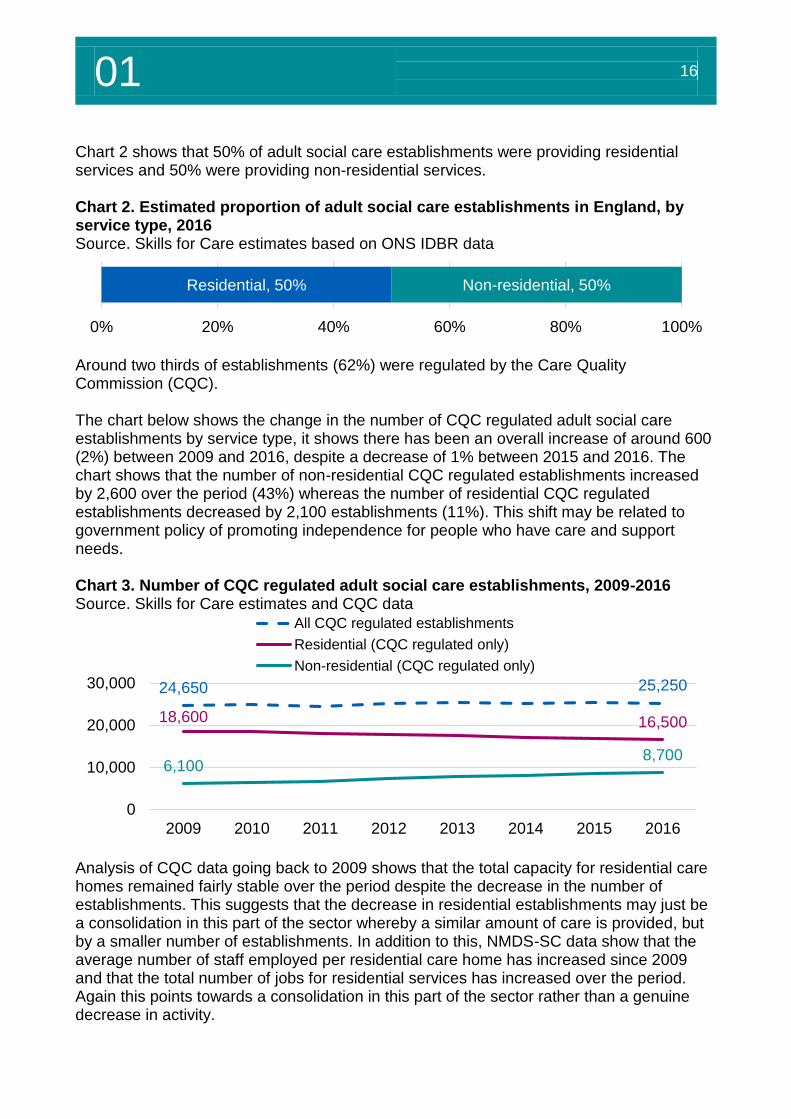
Chart 2 shows that 50% of adult social care establishments were providing residential services and 50% were providing non-residential services. Chart 2. Estimated proportion of adult social care establishments in England, by service type, 2016 Source. Skills for Care estimates based on ONS IDBR data
Around two thirds of establishments (62%) were regulated by the Care Quality Commission (CQC). The chart below shows the change in the number of CQC regulated adult social care establishments by service type, it shows there has been an overall increase of around 600 (2%) between 2009 and 2016, despite a decrease of 1% between 2015 and 2016. The chart shows that the number of non-residential CQC regulated establishments increased by 2,600 over the period (43%) whereas the number of residential CQC regulated establishments decreased by 2,100 establishments (11%). This shift may be related to government policy of promoting independence for people who have care and support needs. Chart 3. Number of CQC regulated adult social care establishments, 2009-2016 Source. Skills for Care estimates and CQC data
Analysis of CQC data going back to 2009 shows that the total capacity for residential care homes remained fairly stable over the period despite the decrease in the number of establishments. This suggests that the decrease in residential establishments may just be a consolidation in this part of the sector whereby a similar amount of care is provided, but by a smaller number of establishments. In addition to this, NMDS-SC data show that the average number of staff employed per residential care home has increased since 2009 and that the total number of jobs for residential services has increased over the period. Again this points towards a consolidation in this part of the sector rather than a genuine decrease in activity.
Residential, 50% Non-residential, 50%
0% 20% 40% 60% 80% 100%
24,650 25,250
18,600 16,500
6,1008,700
0
10,000
20,000
30,000
2009 2010 2011 2012 2013 2014 2015 2016
All CQC regulated establishments
Residential (CQC regulated only)
Non-residential (CQC regulated only)
01 17
Siz
e a
nd
str
uctu
re
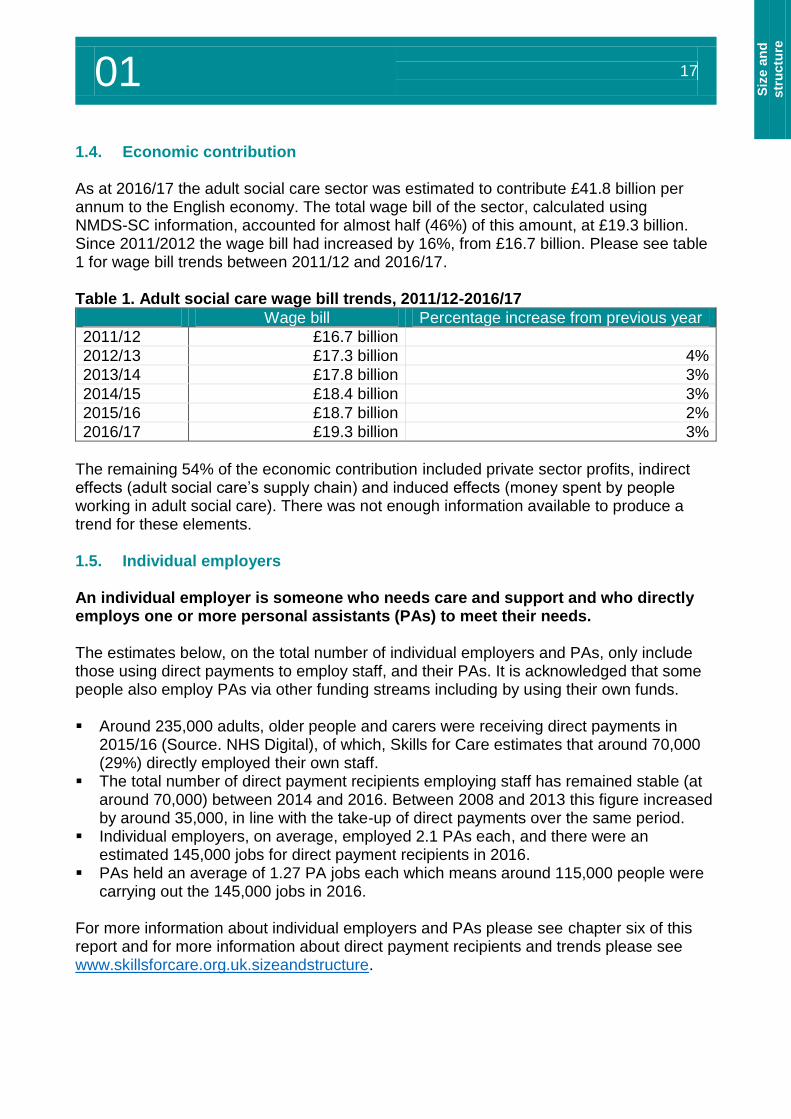
1.4. Economic contribution As at 2016/17 the adult social care sector was estimated to contribute £41.8 billion per annum to the English economy. The total wage bill of the sector, calculated using NMDS-SC information, accounted for almost half (46%) of this amount, at £19.3 billion. Since 2011/2012 the wage bill had increased by 16%, from £16.7 billion. Please see table 1 for wage bill trends between 2011/12 and 2016/17. Table 1. Adult social care wage bill trends, 2011/12-2016/17
Wage bill Percentage increase from previous year
2011/12 £16.7 billion
2012/13 £17.3 billion 4%
2013/14 £17.8 billion 3%
2014/15 £18.4 billion 3%
2015/16 £18.7 billion 2%
2016/17 £19.3 billion 3%
The remaining 54% of the economic contribution included private sector profits, indirect effects (adult social care’s supply chain) and induced effects (money spent by people working in adult social care). There was not enough information available to produce a trend for these elements. 1.5. Individual employers An individual employer is someone who needs care and support and who directly employs one or more personal assistants (PAs) to meet their needs. The estimates below, on the total number of individual employers and PAs, only include those using direct payments to employ staff, and their PAs. It is acknowledged that some people also employ PAs via other funding streams including by using their own funds. Around 235,000 adults, older people and carers were receiving direct payments in
2015/16 (Source. NHS Digital), of which, Skills for Care estimates that around 70,000 (29%) directly employed their own staff.
The total number of direct payment recipients employing staff has remained stable (at around 70,000) between 2014 and 2016. Between 2008 and 2013 this figure increased by around 35,000, in line with the take-up of direct payments over the same period.
Individual employers, on average, employed 2.1 PAs each, and there were an estimated 145,000 jobs for direct payment recipients in 2016.
PAs held an average of 1.27 PA jobs each which means around 115,000 people were carrying out the 145,000 jobs in 2016.
For more information about individual employers and PAs please see chapter six of this report and for more information about direct payment recipients and trends please see www.skillsforcare.org.uk.sizeandstructure.
01 18
1.6. The adult social care workforce The number of adult social care jobs in England as at 2016 was estimated at 1.58
million. o 1.34 million jobs working within the local authority and the independent sectors only.
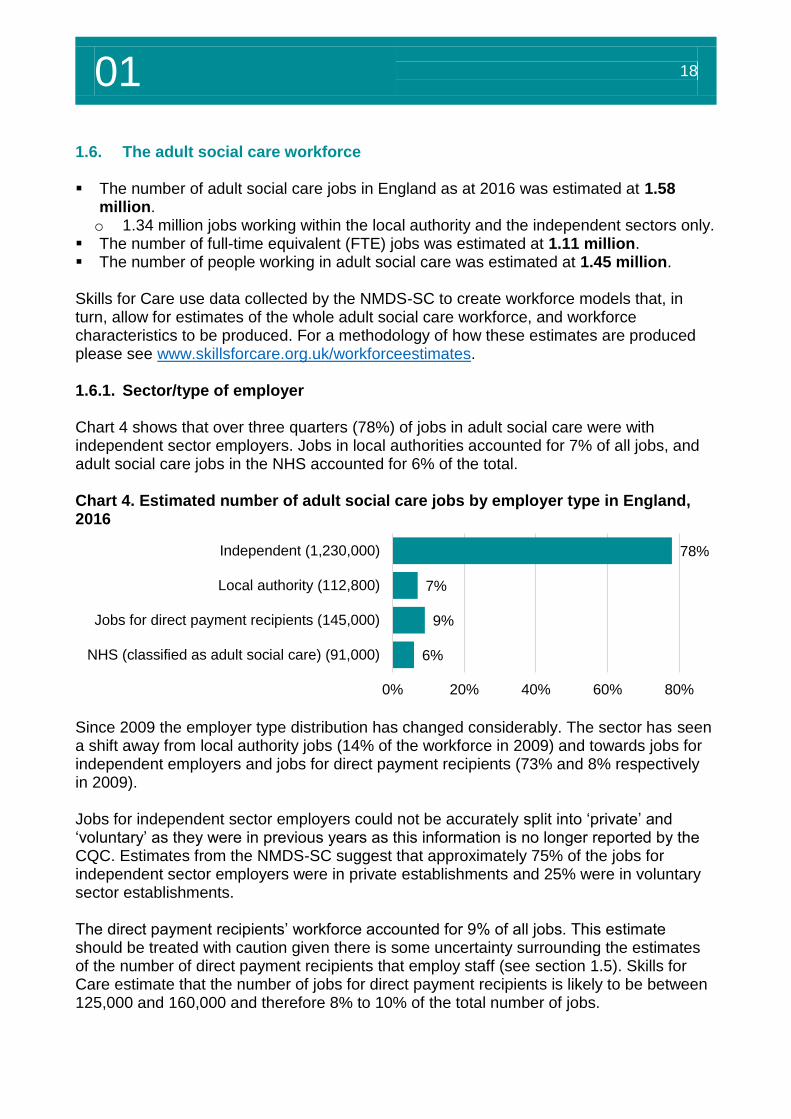
The number of full-time equivalent (FTE) jobs was estimated at 1.11 million. The number of people working in adult social care was estimated at 1.45 million. Skills for Care use data collected by the NMDS-SC to create workforce models that, in turn, allow for estimates of the whole adult social care workforce, and workforce characteristics to be produced. For a methodology of how these estimates are produced please see www.skillsforcare.org.uk/workforceestimates. 1.6.1. Sector/type of employer Chart 4 shows that over three quarters (78%) of jobs in adult social care were with independent sector employers. Jobs in local authorities accounted for 7% of all jobs, and adult social care jobs in the NHS accounted for 6% of the total. Chart 4. Estimated number of adult social care jobs by employer type in England, 2016
Since 2009 the employer type distribution has changed considerably. The sector has seen a shift away from local authority jobs (14% of the workforce in 2009) and towards jobs for independent employers and jobs for direct payment recipients (73% and 8% respectively in 2009). Jobs for independent sector employers could not be accurately split into ‘private’ and ‘voluntary’ as they were in previous years as this information is no longer reported by the CQC. Estimates from the NMDS-SC suggest that approximately 75% of the jobs for independent sector employers were in private establishments and 25% were in voluntary sector establishments. The direct payment recipients’ workforce accounted for 9% of all jobs. This estimate should be treated with caution given there is some uncertainty surrounding the estimates of the number of direct payment recipients that employ staff (see section 1.5). Skills for Care estimate that the number of jobs for direct payment recipients is likely to be between 125,000 and 160,000 and therefore 8% to 10% of the total number of jobs.
78%
7%
9%
6%
0% 20% 40% 60% 80%
Independent (1,230,000)
Local authority (112,800)
Jobs for direct payment recipients (145,000)
NHS (classified as adult social care) (91,000)
01 19
Siz
e a
nd
str
uctu
re
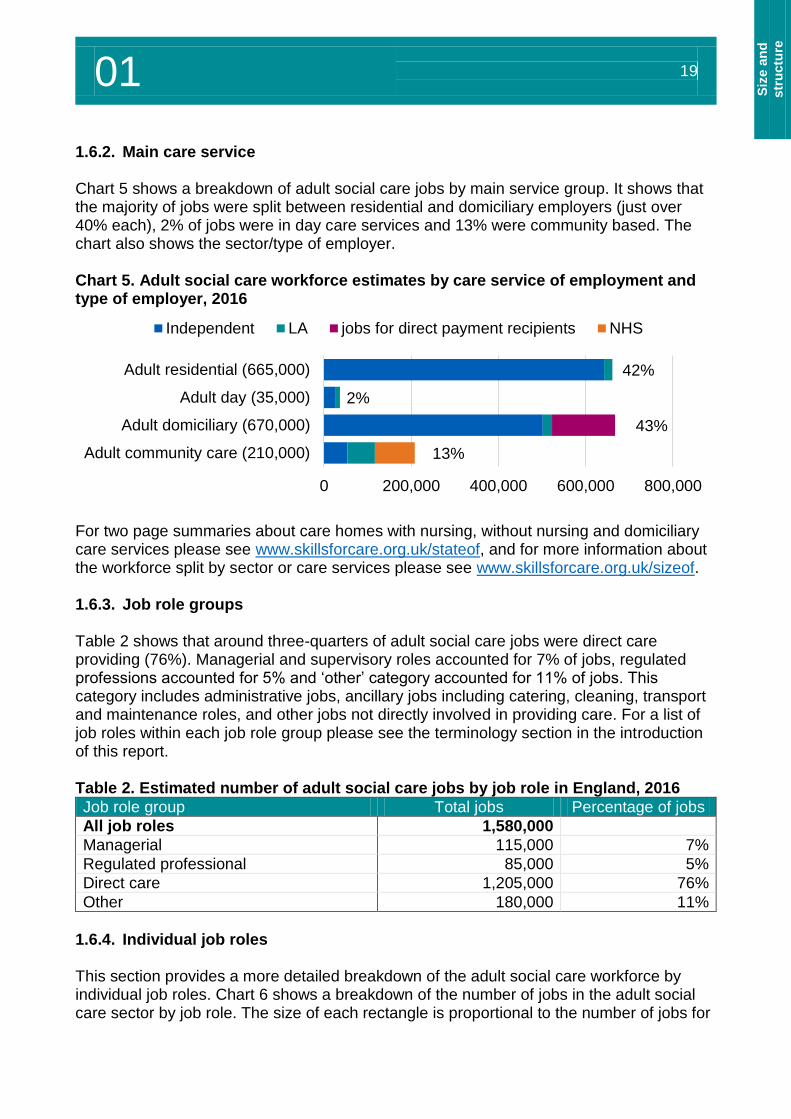
1.6.2. Main care service Chart 5 shows a breakdown of adult social care jobs by main service group. It shows that the majority of jobs were split between residential and domiciliary employers (just over 40% each), 2% of jobs were in day care services and 13% were community based. The chart also shows the sector/type of employer. Chart 5. Adult social care workforce estimates by care service of employment and type of employer, 2016
For two page summaries about care homes with nursing, without nursing and domiciliary care services please see www.skillsforcare.org.uk/stateof, and for more information about the workforce split by sector or care services please see www.skillsforcare.org.uk/sizeof. 1.6.3. Job role groups Table 2 shows that around three-quarters of adult social care jobs were direct care providing (76%). Managerial and supervisory roles accounted for 7% of jobs, regulated professions accounted for 5% and ‘other’ category accounted for 11% of jobs. This category includes administrative jobs, ancillary jobs including catering, cleaning, transport and maintenance roles, and other jobs not directly involved in providing care. For a list of job roles within each job role group please see the terminology section in the introduction of this report. Table 2. Estimated number of adult social care jobs by job role in England, 2016
Job role group Total jobs Percentage of jobs
All job roles 1,580,000
Managerial 115,000 7%
Regulated professional 85,000 5%
Direct care 1,205,000 76%
Other 180,000 11%
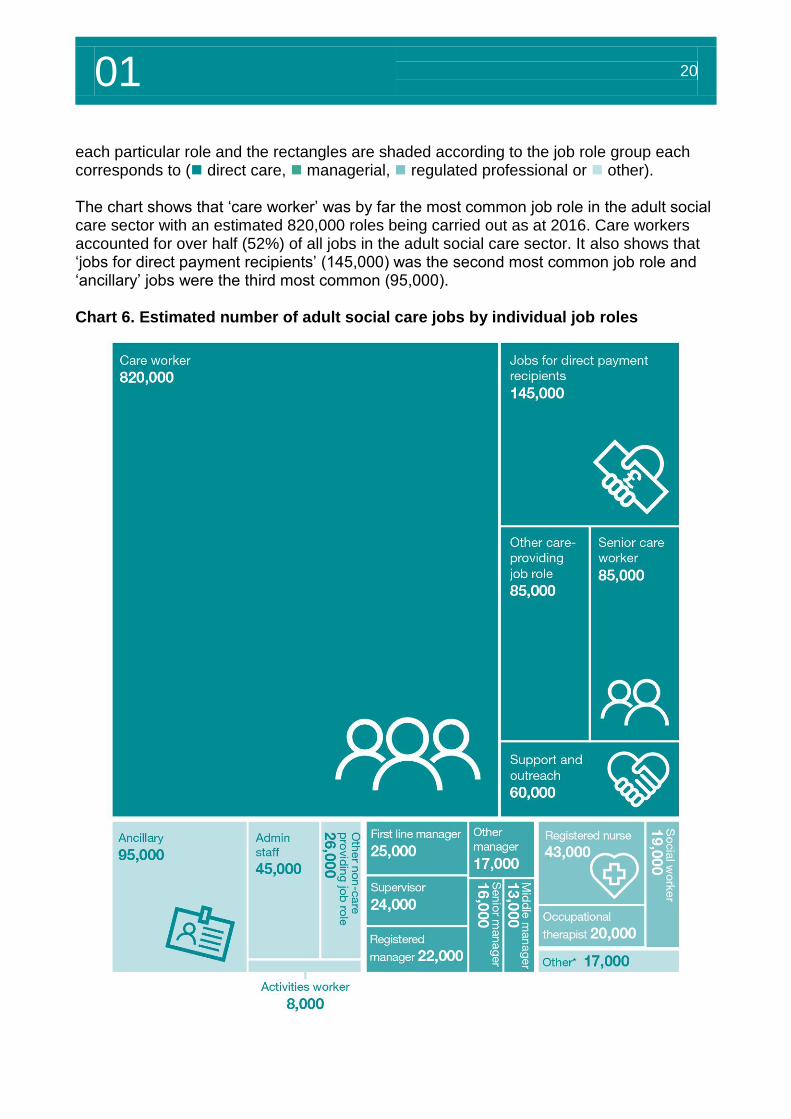
1.6.4. Individual job roles This section provides a more detailed breakdown of the adult social care workforce by individual job roles. Chart 6 shows a breakdown of the number of jobs in the adult social care sector by job role. The size of each rectangle is proportional to the number of jobs for
42%
2%
43%
13%
0 200,000 400,000 600,000 800,000
Adult residential (665,000)
Adult day (35,000)
Adult domiciliary (670,000)
Adult community care (210,000)
Independent LA jobs for direct payment recipients NHS
01 20
each particular role and the rectangles are shaded according to the job role group each corresponds to ( direct care, managerial, regulated professional or other). The chart shows that ‘care worker’ was by far the most common job role in the adult social care sector with an estimated 820,000 roles being carried out as at 2016. Care workers accounted for over half (52%) of all jobs in the adult social care sector. It also shows that ‘jobs for direct payment recipients’ (145,000) was the second most common job role and ‘ancillary’ jobs were the third most common (95,000). Chart 6. Estimated number of adult social care jobs by individual job roles
01 21
Siz
e a
nd
str
uctu
re
*The ‘others’ category includes 14 job roles that were estimated to have fewer than 5,000 jobs. This includes roles such as allied health professionals, occupational therapy assistants and advice, guidance and advocacy roles. A full list of NMDS-SC job roles and descriptions can be found on the NMDS-SC website. Regulated professional roles The sub-sections below focuses on the three main regulated professions in the adult social care sector. Although these roles make-up a relatively small proportion of the total adult social care workforce, they are vital in terms of the success of the social care system and also in terms of integrated health and social care planning and delivery. Registered nurses As at 2016 there were an estimated 43,000 registered nurse jobs in the adult social care sector. The vast majority of these jobs were in care homes with nursing in the independent sector (37,500) and around 3,000 were for independent sector non-residential care providers. This figure does not include registered nurse jobs in the NHS. For information about registered nurse job trends please see section 2.6. Occupational therapists There were an estimated 20,000 occupational therapist jobs in the adult social care sector as at 2016. This estimate includes 16,800 occupational therapist jobs in the NHS, these roles are considered to be adult social care related and have therefore been included as part of the adult social care workforce in this report. The majority of the remaining occupational therapist jobs were employed by local authorities (2,500). Social workers As at 2016 there were an estimated 19,000 social worker jobs in the adult social care sector. The majority of these jobs (16,100) were within local authorities and around 1,000 were in the independent sector. Data from NHS Digital (formally the Health and Social Care Information Centre) shows that there were around 2,100 social worker jobs in the NHS. As with occupational therapists, these jobs have been included as they are considered to be social care related. 1.7. Number of full-time equivalent jobs The number of full-time equivalent (FTE) adult social care jobs in England as at 2016
was estimated at 1.11 million. In this section Skills for Care has produced FTE estimates of the size of the adult social care workforce. These estimates have been created by applying contracted and additional hours data collected by the NMDS-SC to estimates of the total number of jobs. 37 hours per week has been classed as ‘full-time’. Please note that the methodology for producing these estimates has been improved this year to better capture the hours worked by workers on zero hours contracts. This change has resulted in a slightly lower ratio in the independent sector than previously estimated.
01 22
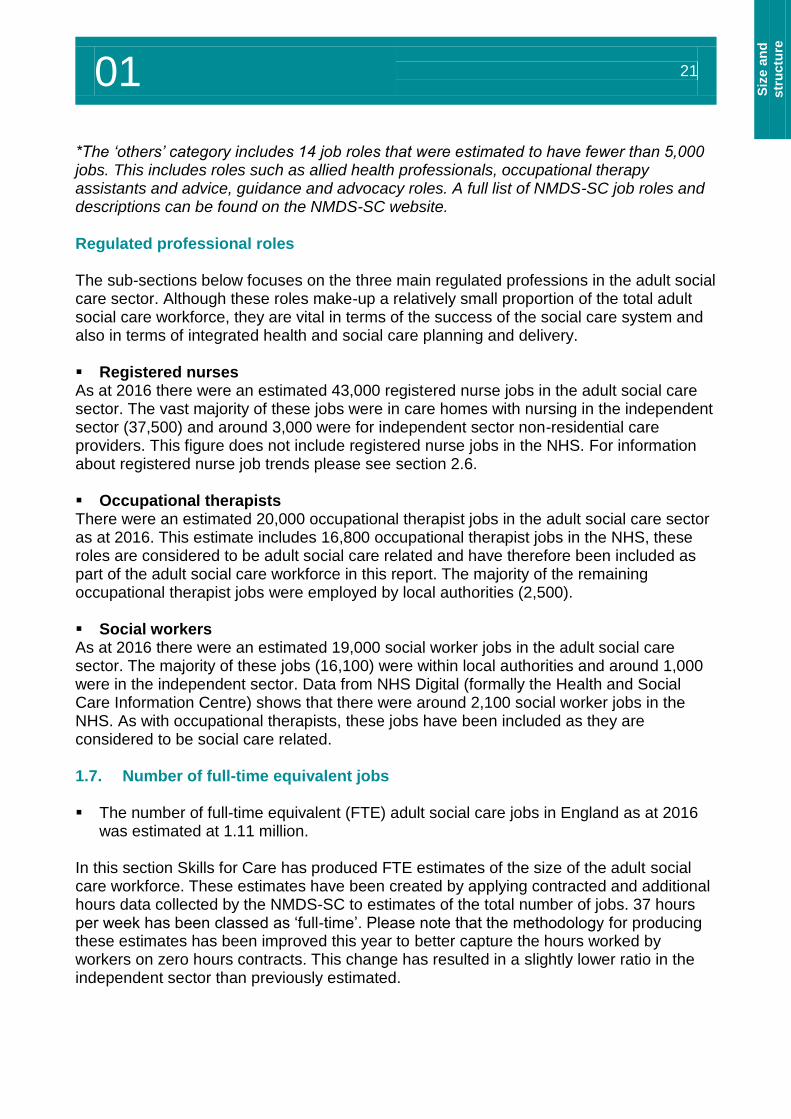
Table 3 shows the total number of jobs and the number of FTE jobs by employer type. It shows that, as at 2016, there were an estimated 1.11 million FTE adult social care jobs. This estimate was considerably smaller than the total number of jobs (1.58 million), which reflects the part-time nature of many adult social care jobs. This was especially true of jobs for direct payment recipients which make up a significantly smaller percentage of FTE jobs (6%) than all jobs (9%). Table 3. Estimated adult social care jobs and FTE jobs in England, 2016
Employer type Jobs Percentage
of jobs FTE jobs
Percentage of FTE jobs
Total 1,580,000 1,110,000
Independent 1,230,000 78% 870,000 79%
Local authority 112,000 7% 90,000 8%
Jobs for direct payment recipients 145,000 9% 70,000 6%
NHS 90,000 6% 75,000 7%
1.8. Number of people The number of people working in adult social care in England as at 2016 was
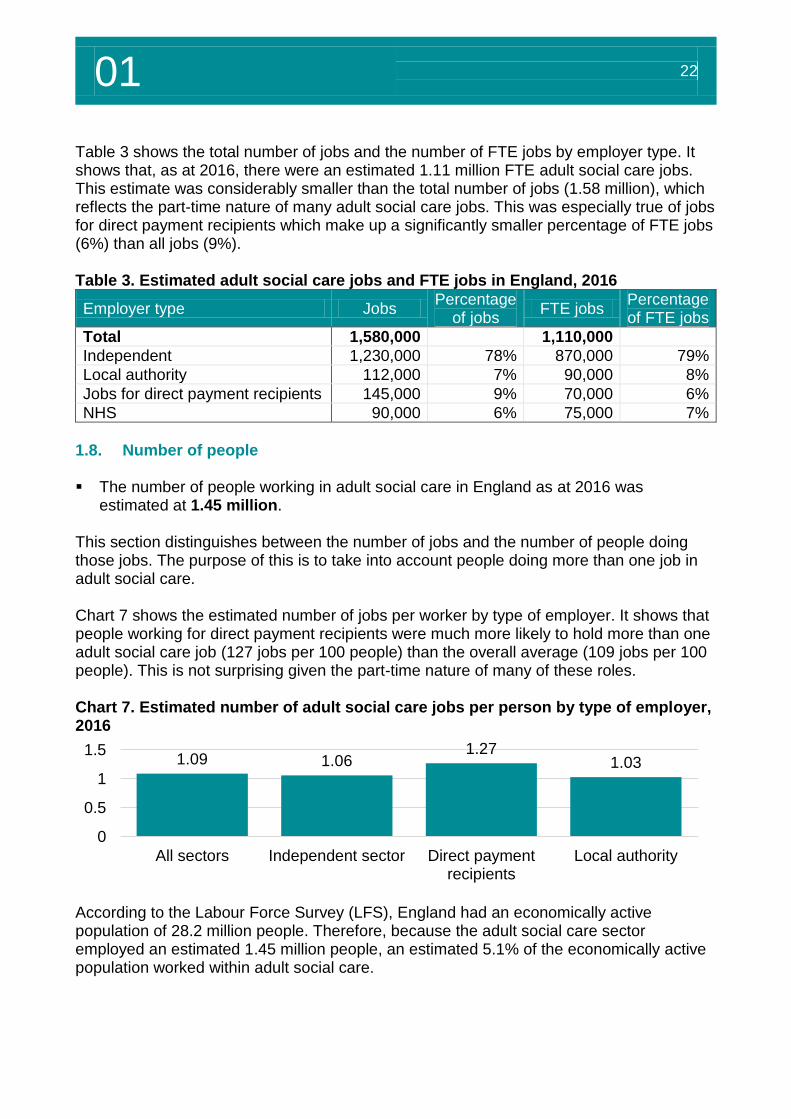
estimated at 1.45 million. This section distinguishes between the number of jobs and the number of people doing those jobs. The purpose of this is to take into account people doing more than one job in adult social care. Chart 7 shows the estimated number of jobs per worker by type of employer. It shows that people working for direct payment recipients were much more likely to hold more than one adult social care job (127 jobs per 100 people) than the overall average (109 jobs per 100 people). This is not surprising given the part-time nature of many of these roles. Chart 7. Estimated number of adult social care jobs per person by type of employer, 2016
According to the Labour Force Survey (LFS), England had an economically active population of 28.2 million people. Therefore, because the adult social care sector employed an estimated 1.45 million people, an estimated 5.1% of the economically active population worked within adult social care.
1.09 1.061.27
1.03
0
0.5
1
1.5
All sectors Independent sector Direct paymentrecipients
Local authority
01 23
Siz
e a
nd
str
uctu
re
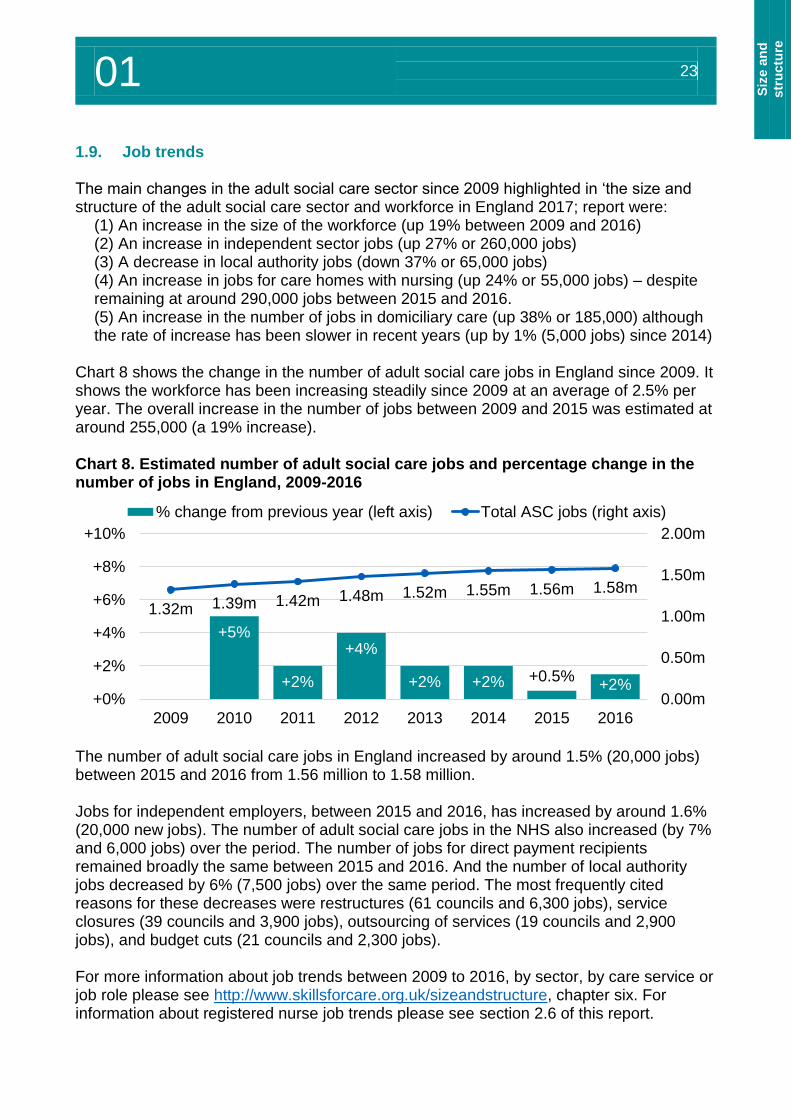
1.9. Job trends The main changes in the adult social care sector since 2009 highlighted in ‘the size and structure of the adult social care sector and workforce in England 2017; report were:
(1) An increase in the size of the workforce (up 19% between 2009 and 2016) (2) An increase in independent sector jobs (up 27% or 260,000 jobs) (3) A decrease in local authority jobs (down 37% or 65,000 jobs) (4) An increase in jobs for care homes with nursing (up 24% or 55,000 jobs) – despite remaining at around 290,000 jobs between 2015 and 2016. (5) An increase in the number of jobs in domiciliary care (up 38% or 185,000) although the rate of increase has been slower in recent years (up by 1% (5,000 jobs) since 2014)
Chart 8 shows the change in the number of adult social care jobs in England since 2009. It shows the workforce has been increasing steadily since 2009 at an average of 2.5% per year. The overall increase in the number of jobs between 2009 and 2015 was estimated at around 255,000 (a 19% increase). Chart 8. Estimated number of adult social care jobs and percentage change in the number of jobs in England, 2009-2016
The number of adult social care jobs in England increased by around 1.5% (20,000 jobs) between 2015 and 2016 from 1.56 million to 1.58 million. Jobs for independent employers, between 2015 and 2016, has increased by around 1.6% (20,000 new jobs). The number of adult social care jobs in the NHS also increased (by 7% and 6,000 jobs) over the period. The number of jobs for direct payment recipients remained broadly the same between 2015 and 2016. And the number of local authority jobs decreased by 6% (7,500 jobs) over the same period. The most frequently cited reasons for these decreases were restructures (61 councils and 6,300 jobs), service closures (39 councils and 3,900 jobs), outsourcing of services (19 councils and 2,900 jobs), and budget cuts (21 councils and 2,300 jobs). For more information about job trends between 2009 to 2016, by sector, by care service or job role please see http://www.skillsforcare.org.uk/sizeandstructure, chapter six. For information about registered nurse job trends please see section 2.6 of this report.
+5%
+2%
+4%
+2% +2% +0.5%+2%
1.32m 1.39m 1.42m 1.48m 1.52m 1.55m 1.56m 1.58m
0.00m
0.50m
1.00m
1.50m
2.00m
+0%
+2%
+4%
+6%
+8%
+10%
2009 2010 2011 2012 2013 2014 2015 2016
% change from previous year (left axis) Total ASC jobs (right axis)
01 24
1.10. People who receive care and support
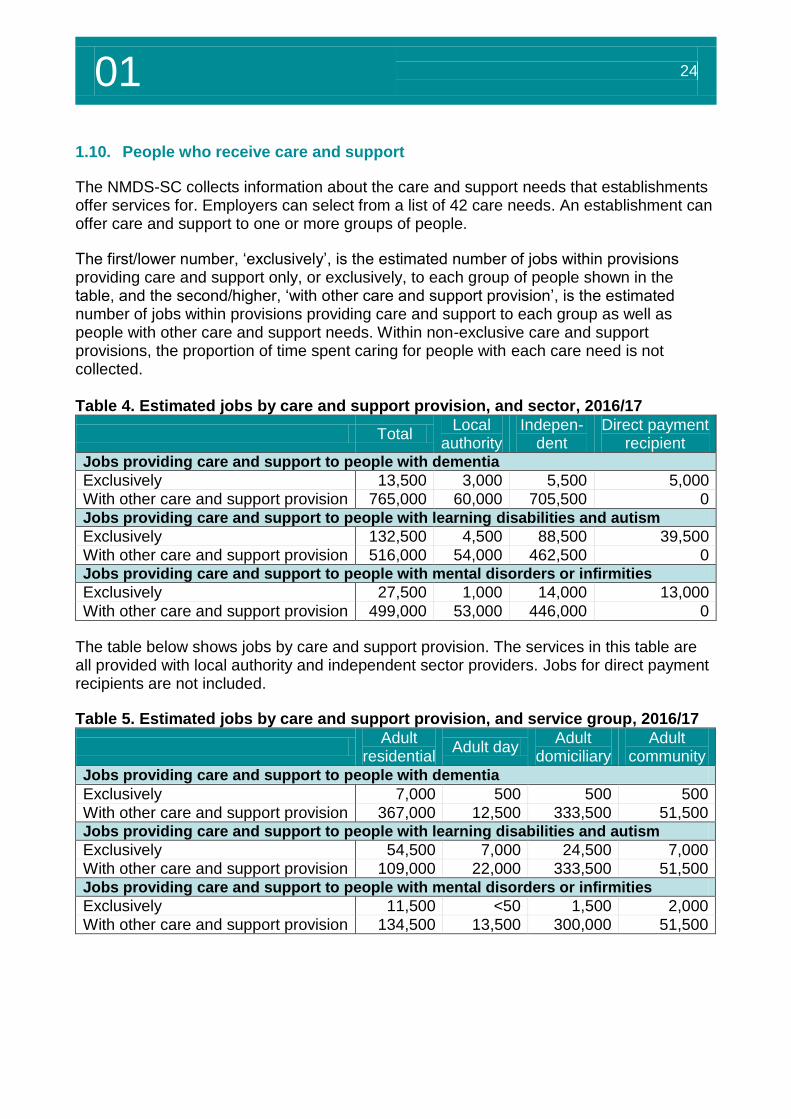
The NMDS-SC collects information about the care and support needs that establishments offer services for. Employers can select from a list of 42 care needs. An establishment can offer care and support to one or more groups of people.
The first/lower number, ‘exclusively’, is the estimated number of jobs within provisions providing care and support only, or exclusively, to each group of people shown in the table, and the second/higher, ‘with other care and support provision’, is the estimated number of jobs within provisions providing care and support to each group as well as people with other care and support needs. Within non-exclusive care and support provisions, the proportion of time spent caring for people with each care need is not collected. Table 4. Estimated jobs by care and support provision, and sector, 2016/17
Total Local
authority Indepen-
dent Direct payment
recipient Jobs providing care and support to people with dementia
Exclusively 13,500 3,000 5,500 5,000 With other care and support provision 765,000 60,000 705,500 0 Jobs providing care and support to people with learning disabilities and autism
Exclusively 132,500 4,500 88,500 39,500 With other care and support provision 516,000 54,000 462,500 0 Jobs providing care and support to people with mental disorders or infirmities
Exclusively 27,500 1,000 14,000 13,000
With other care and support provision 499,000 53,000 446,000 0
The table below shows jobs by care and support provision. The services in this table are all provided with local authority and independent sector providers. Jobs for direct payment recipients are not included.
Table 5. Estimated jobs by care and support provision, and service group, 2016/17
Adult
residential Adult day
Adult domiciliary
Adult community
Jobs providing care and support to people with dementia
Exclusively 7,000 500 500 500 With other care and support provision 367,000 12,500 333,500 51,500 Jobs providing care and support to people with learning disabilities and autism
Exclusively 54,500 7,000 24,500 7,000 With other care and support provision 109,000 22,000 333,500 51,500 Jobs providing care and support to people with mental disorders or infirmities
Exclusively 11,500 <50 1,500 2,000 With other care and support provision 134,500 13,500 300,000 51,500

Employment overview
02
02 26
2. Employment overview4
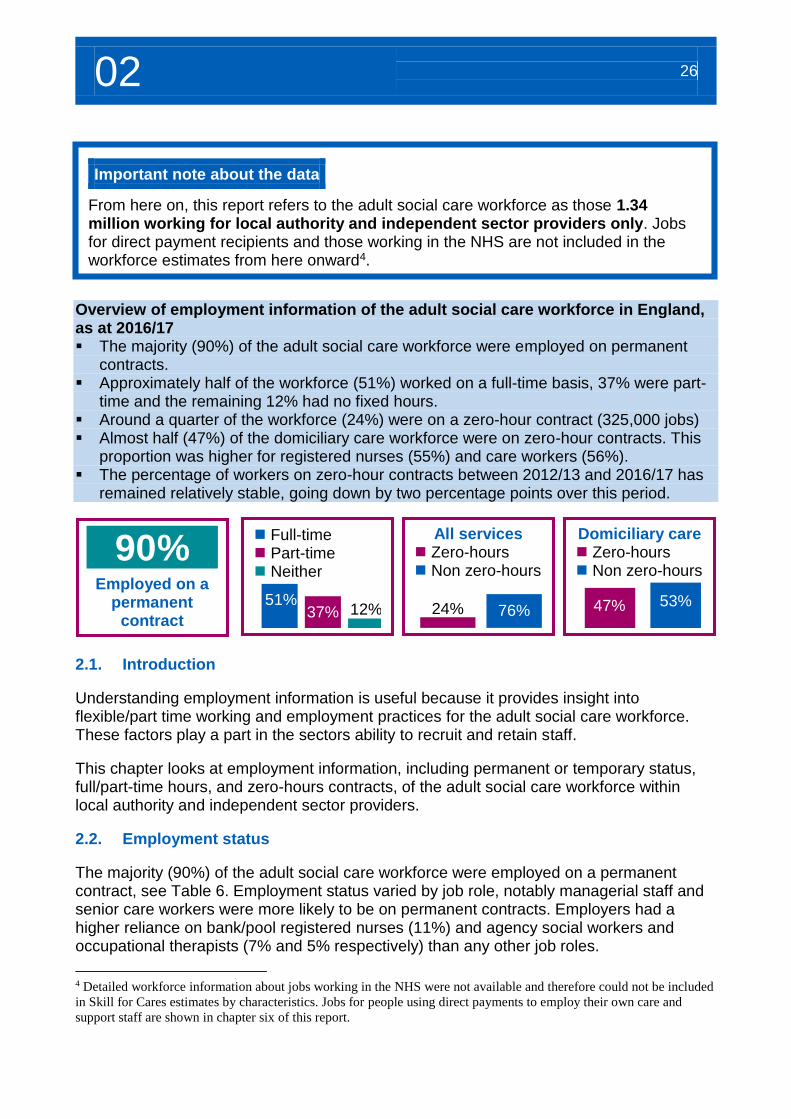
Overview of employment information of the adult social care workforce in England, as at 2016/17 The majority (90%) of the adult social care workforce were employed on permanent
contracts. Approximately half of the workforce (51%) worked on a full-time basis, 37% were part-
time and the remaining 12% had no fixed hours. Around a quarter of the workforce (24%) were on a zero-hour contract (325,000 jobs) Almost half (47%) of the domiciliary care workforce were on zero-hour contracts. This
proportion was higher for registered nurses (55%) and care workers (56%). The percentage of workers on zero-hour contracts between 2012/13 and 2016/17 has
remained relatively stable, going down by two percentage points over this period.
2.1. Introduction
Understanding employment information is useful because it provides insight into flexible/part time working and employment practices for the adult social care workforce. These factors play a part in the sectors ability to recruit and retain staff.
This chapter looks at employment information, including permanent or temporary status, full/part-time hours, and zero-hours contracts, of the adult social care workforce within local authority and independent sector providers.
2.2. Employment status
The majority (90%) of the adult social care workforce were employed on a permanent contract, see Table 6. Employment status varied by job role, notably managerial staff and senior care workers were more likely to be on permanent contracts. Employers had a higher reliance on bank/pool registered nurses (11%) and agency social workers and occupational therapists (7% and 5% respectively) than any other job roles.
4 Detailed workforce information about jobs working in the NHS were not available and therefore could not be included
in Skill for Cares estimates by characteristics. Jobs for people using direct payments to employ their own care and
support staff are shown in chapter six of this report.
Important note about the data
From here on, this report refers to the adult social care workforce as those 1.34 million working for local authority and independent sector providers only. Jobs for direct payment recipients and those working in the NHS are not included in the workforce estimates from here onward4.
90%
Employed on a permanent
contract
Full-time Part-time Neither
51%37% 12%
All services Zero-hours Non zero-hours
24% 76%
Domiciliary care Zero-hours Non zero-hours
47% 53%
02 27
E
mp
loym
en
t
overv
iew
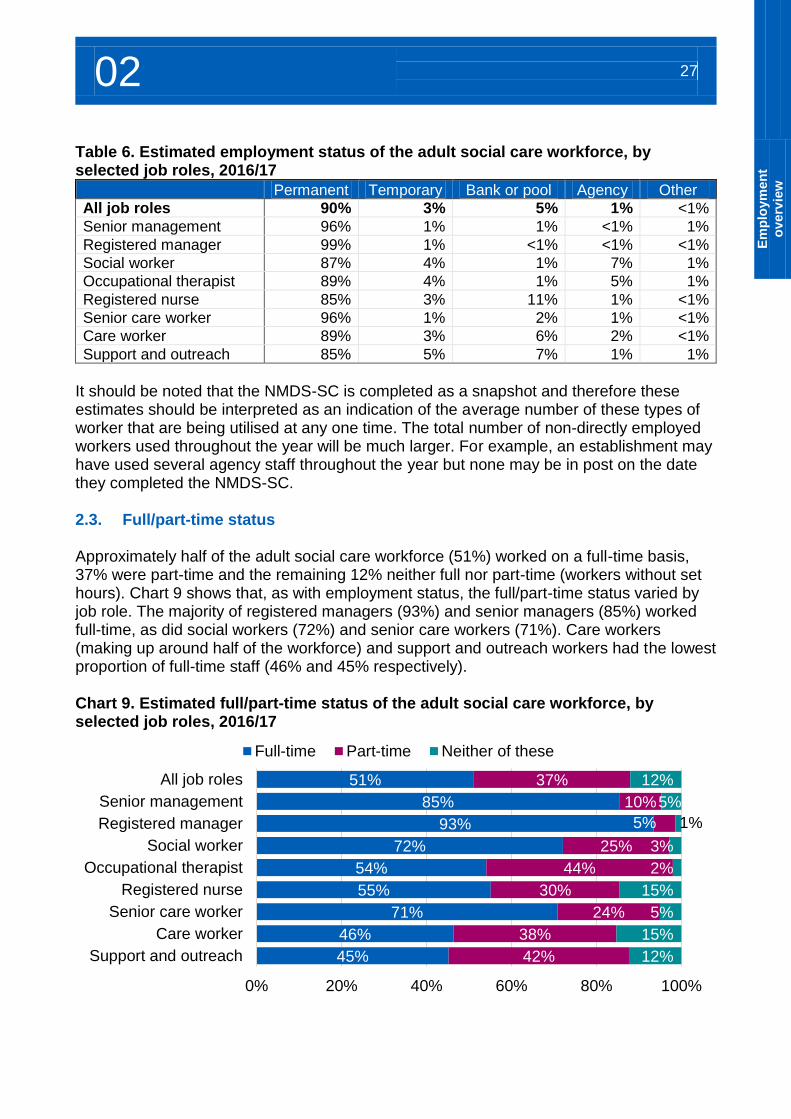
Table 6. Estimated employment status of the adult social care workforce, by selected job roles, 2016/17
Permanent Temporary Bank or pool Agency Other
All job roles 90% 3% 5% 1% <1%
Senior management 96% 1% 1% <1% 1%
Registered manager 99% 1% <1% <1% <1%
Social worker 87% 4% 1% 7% 1%
Occupational therapist 89% 4% 1% 5% 1%
Registered nurse 85% 3% 11% 1% <1%
Senior care worker 96% 1% 2% 1% <1%
Care worker 89% 3% 6% 2% <1%
Support and outreach 85% 5% 7% 1% 1%
It should be noted that the NMDS-SC is completed as a snapshot and therefore these estimates should be interpreted as an indication of the average number of these types of worker that are being utilised at any one time. The total number of non-directly employed workers used throughout the year will be much larger. For example, an establishment may have used several agency staff throughout the year but none may be in post on the date they completed the NMDS-SC. 2.3. Full/part-time status Approximately half of the adult social care workforce (51%) worked on a full-time basis, 37% were part-time and the remaining 12% neither full nor part-time (workers without set hours). Chart 9 shows that, as with employment status, the full/part-time status varied by job role. The majority of registered managers (93%) and senior managers (85%) worked full-time, as did social workers (72%) and senior care workers (71%). Care workers (making up around half of the workforce) and support and outreach workers had the lowest proportion of full-time staff (46% and 45% respectively). Chart 9. Estimated full/part-time status of the adult social care workforce, by selected job roles, 2016/17
51%
85%
93%
72%
54%
55%
71%
46%
45%
37%
10%
5%
25%
44%
30%
24%
38%
42%
12%
5%
1%
3%
2%
15%
5%
15%
12%
0% 20% 40% 60% 80% 100%
All job roles
Senior management
Registered manager
Social worker
Occupational therapist
Registered nurse
Senior care worker
Care worker
Support and outreach
Full-time Part-time Neither of these
02 28
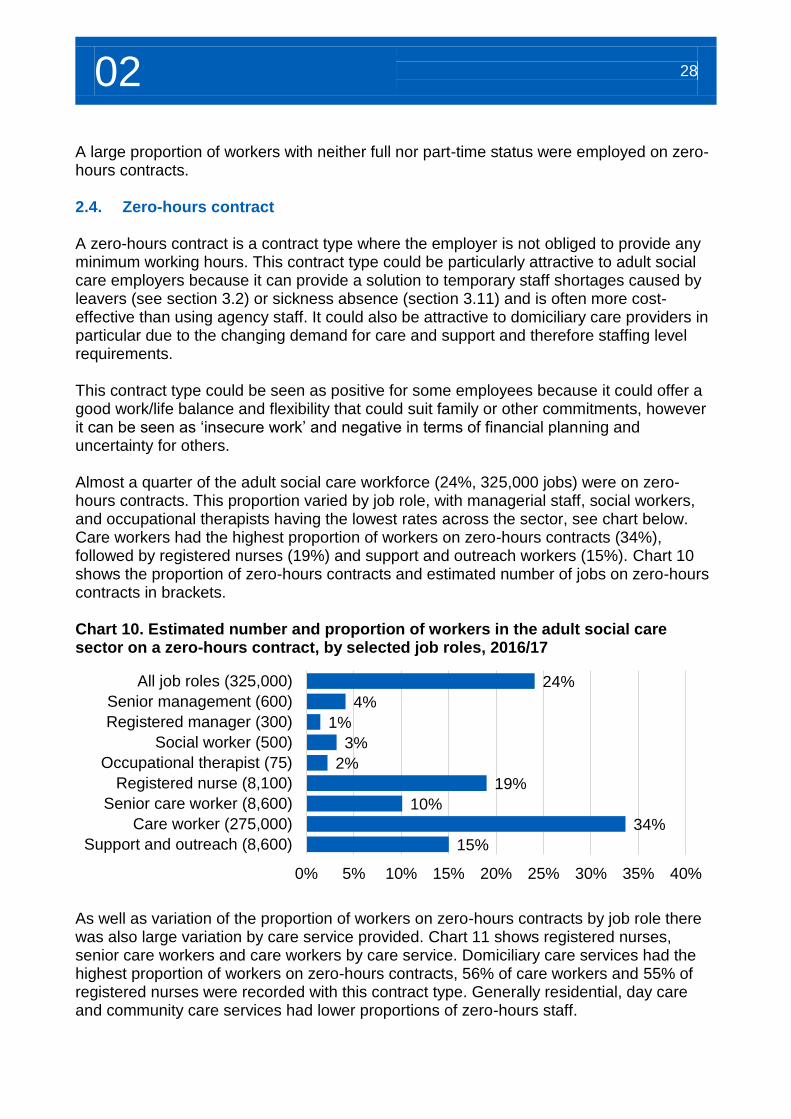
A large proportion of workers with neither full nor part-time status were employed on zero-hours contracts. 2.4. Zero-hours contract A zero-hours contract is a contract type where the employer is not obliged to provide any minimum working hours. This contract type could be particularly attractive to adult social care employers because it can provide a solution to temporary staff shortages caused by leavers (see section 3.2) or sickness absence (section 3.11) and is often more cost-effective than using agency staff. It could also be attractive to domiciliary care providers in particular due to the changing demand for care and support and therefore staffing level requirements. This contract type could be seen as positive for some employees because it could offer a good work/life balance and flexibility that could suit family or other commitments, however it can be seen as ‘insecure work’ and negative in terms of financial planning and uncertainty for others. Almost a quarter of the adult social care workforce (24%, 325,000 jobs) were on zero-hours contracts. This proportion varied by job role, with managerial staff, social workers, and occupational therapists having the lowest rates across the sector, see chart below. Care workers had the highest proportion of workers on zero-hours contracts (34%), followed by registered nurses (19%) and support and outreach workers (15%). Chart 10 shows the proportion of zero-hours contracts and estimated number of jobs on zero-hours contracts in brackets. Chart 10. Estimated number and proportion of workers in the adult social care sector on a zero-hours contract, by selected job roles, 2016/17
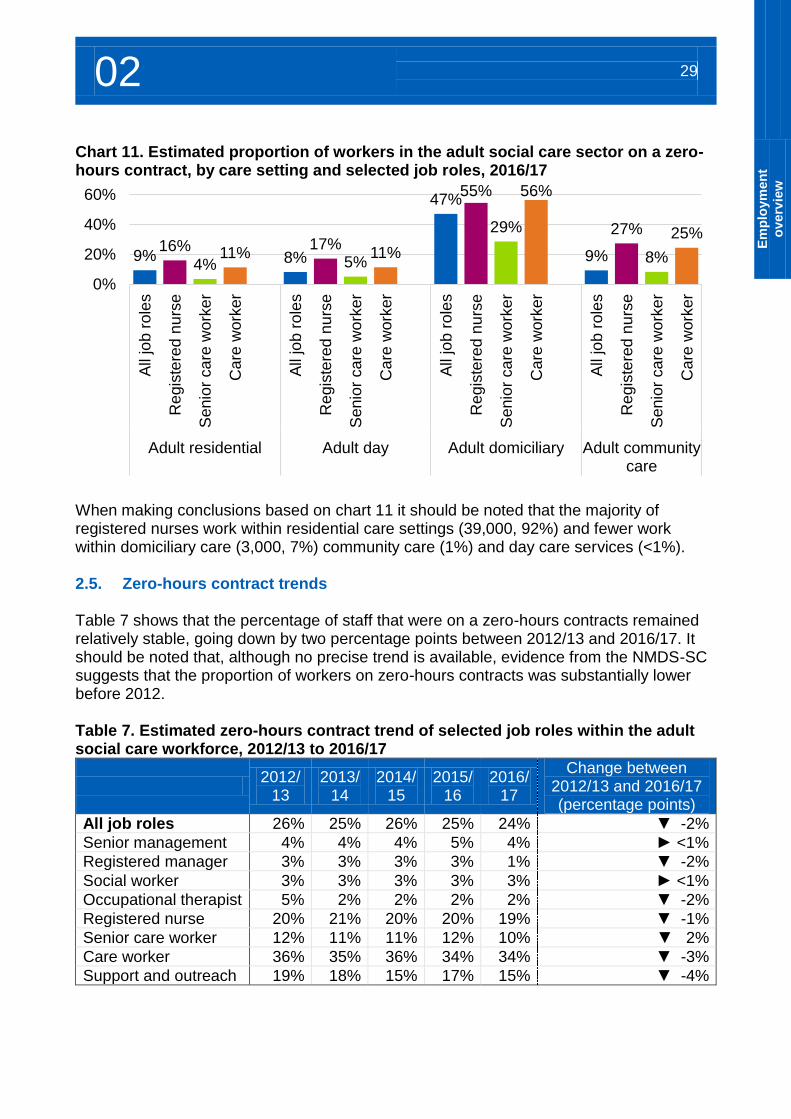
As well as variation of the proportion of workers on zero-hours contracts by job role there was also large variation by care service provided. Chart 11 shows registered nurses, senior care workers and care workers by care service. Domiciliary care services had the highest proportion of workers on zero-hours contracts, 56% of care workers and 55% of registered nurses were recorded with this contract type. Generally residential, day care and community care services had lower proportions of zero-hours staff.
24%
4%
1%
3%
2%
19%
10%
34%
15%
0% 5% 10% 15% 20% 25% 30% 35% 40%
All job roles (325,000)
Senior management (600)
Registered manager (300)
Social worker (500)
Occupational therapist (75)
Registered nurse (8,100)
Senior care worker (8,600)
Care worker (275,000)
Support and outreach (8,600)
02 29
E
mp
loym
en
t
overv
iew
Chart 11. Estimated proportion of workers in the adult social care sector on a zero-hours contract, by care setting and selected job roles, 2016/17
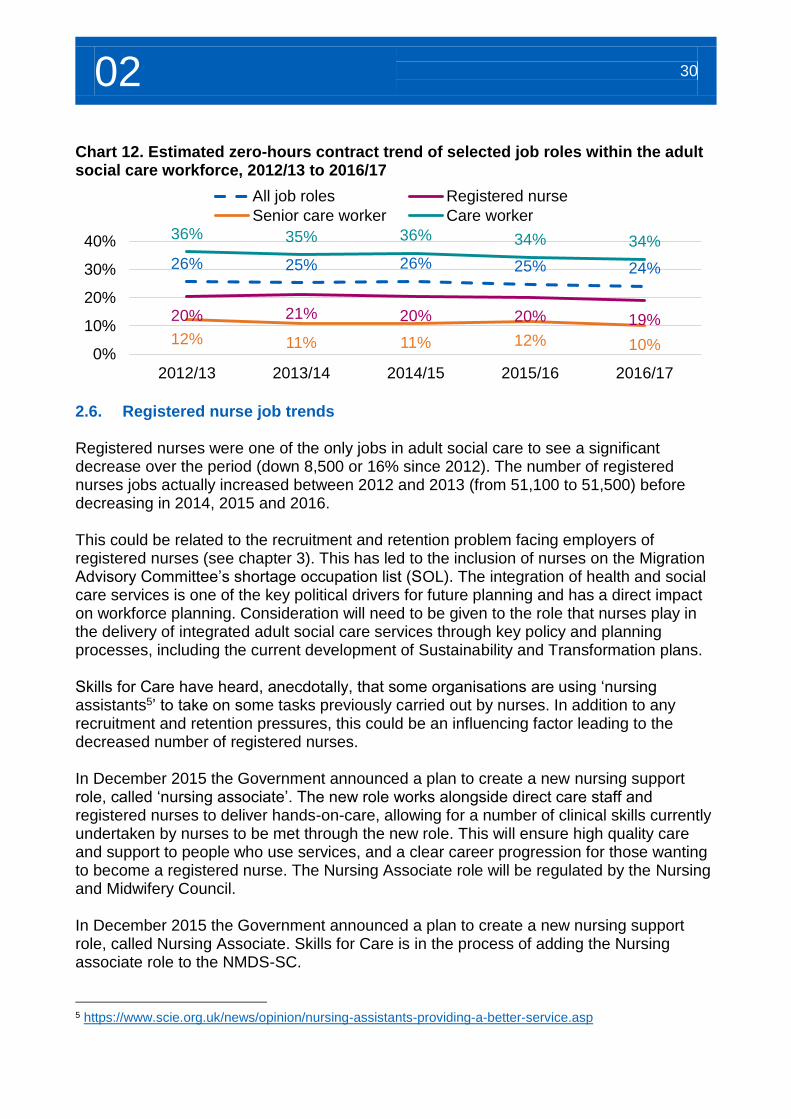
When making conclusions based on chart 11 it should be noted that the majority of registered nurses work within residential care settings (39,000, 92%) and fewer work within domiciliary care (3,000, 7%) community care (1%) and day care services (<1%). 2.5. Zero-hours contract trends Table 7 shows that the percentage of staff that were on a zero-hours contracts remained relatively stable, going down by two percentage points between 2012/13 and 2016/17. It should be noted that, although no precise trend is available, evidence from the NMDS-SC suggests that the proportion of workers on zero-hours contracts was substantially lower before 2012. Table 7. Estimated zero-hours contract trend of selected job roles within the adult social care workforce, 2012/13 to 2016/17
2012/
13 2013/
14 2014/
15 2015/
16 2016/
17
Change between 2012/13 and 2016/17 (percentage points)
All job roles 26% 25% 26% 25% 24% ▼ -2%
Senior management 4% 4% 4% 5% 4% ► <1%
Registered manager 3% 3% 3% 3% 1% ▼ -2%
Social worker 3% 3% 3% 3% 3% ► <1%
Occupational therapist 5% 2% 2% 2% 2% ▼ -2%
Registered nurse 20% 21% 20% 20% 19% ▼ -1%
Senior care worker 12% 11% 11% 12% 10% ▼ 2%
Care worker 36% 35% 36% 34% 34% ▼ -3%
Support and outreach 19% 18% 15% 17% 15% ▼ -4%
9%16%
4%11% 8%
17%5%
11%
47%55%
29%
56%
9%
27%
8%
25%
0%
20%
40%
60%
All
job r
ole
s
Regis
tere
d n
urs
e
Sen
ior
ca
re w
ork
er
Care
work
er
All
job r
ole
s
Regis
tere
d n
urs
e
Sen
ior
ca
re w
ork
er
Care
work
er
All
job r
ole
s
Regis
tere
d n
urs
e
Sen
ior
ca
re w
ork
er
Care
work
er
All
job r
ole
s
Regis
tere
d n
urs
e
Sen
ior
ca
re w
ork
er
Care
work
er
Adult residential Adult day Adult domiciliary Adult communitycare
02 30
Chart 12. Estimated zero-hours contract trend of selected job roles within the adult social care workforce, 2012/13 to 2016/17
2.6. Registered nurse job trends Registered nurses were one of the only jobs in adult social care to see a significant decrease over the period (down 8,500 or 16% since 2012). The number of registered nurses jobs actually increased between 2012 and 2013 (from 51,100 to 51,500) before decreasing in 2014, 2015 and 2016. This could be related to the recruitment and retention problem facing employers of registered nurses (see chapter 3). This has led to the inclusion of nurses on the Migration Advisory Committee’s shortage occupation list (SOL). The integration of health and social care services is one of the key political drivers for future planning and has a direct impact on workforce planning. Consideration will need to be given to the role that nurses play in the delivery of integrated adult social care services through key policy and planning processes, including the current development of Sustainability and Transformation plans. Skills for Care have heard, anecdotally, that some organisations are using ‘nursing assistants5’ to take on some tasks previously carried out by nurses. In addition to any recruitment and retention pressures, this could be an influencing factor leading to the decreased number of registered nurses. In December 2015 the Government announced a plan to create a new nursing support role, called ‘nursing associate’. The new role works alongside direct care staff and registered nurses to deliver hands-on-care, allowing for a number of clinical skills currently undertaken by nurses to be met through the new role. This will ensure high quality care and support to people who use services, and a clear career progression for those wanting to become a registered nurse. The Nursing Associate role will be regulated by the Nursing and Midwifery Council. In December 2015 the Government announced a plan to create a new nursing support role, called Nursing Associate. Skills for Care is in the process of adding the Nursing associate role to the NMDS-SC.
5 https://www.scie.org.uk/news/opinion/nursing-assistants-providing-a-better-service.asp
26% 25% 26% 25% 24%
20% 21% 20% 20% 19%
12% 11% 11% 12% 10%
36% 35% 36% 34% 34%
0%
10%
20%
30%
40%
2012/13 2013/14 2014/15 2015/16 2016/17
All job roles Registered nurse
Senior care worker Care worker

Recruitment and retention
03
03 32
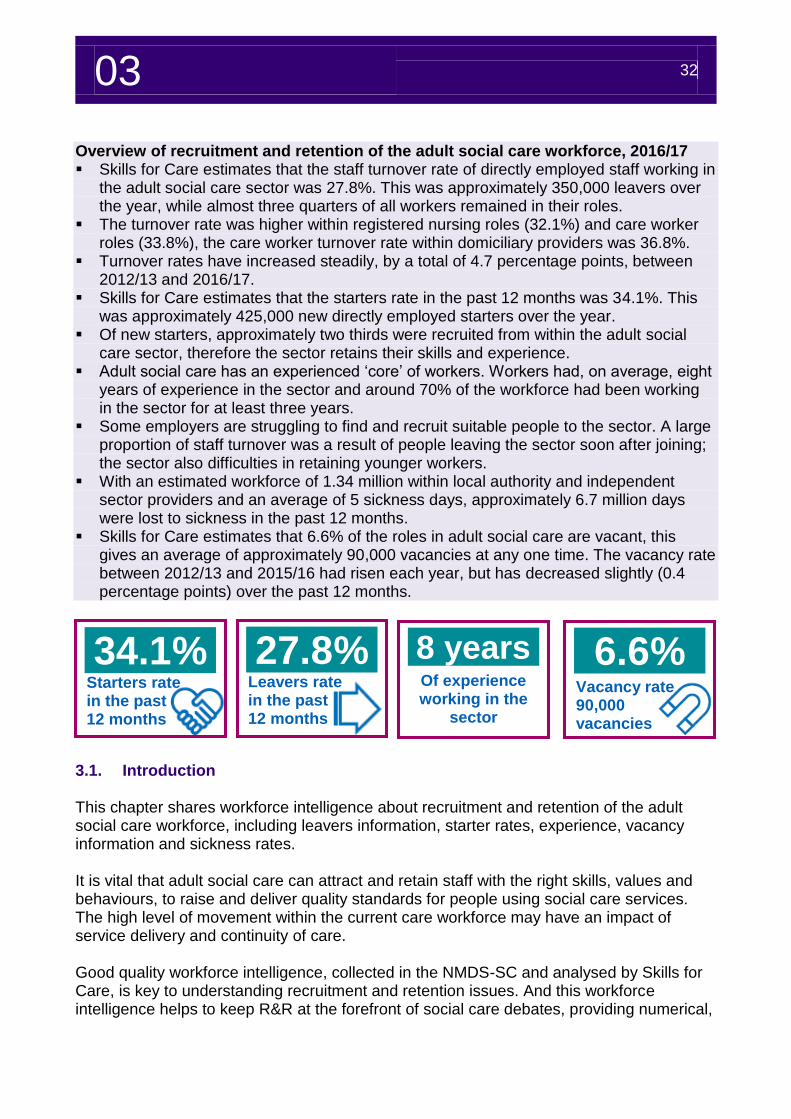
Overview of recruitment and retention of the adult social care workforce, 2016/17 Skills for Care estimates that the staff turnover rate of directly employed staff working in
the adult social care sector was 27.8%. This was approximately 350,000 leavers over the year, while almost three quarters of all workers remained in their roles.
The turnover rate was higher within registered nursing roles (32.1%) and care worker roles (33.8%), the care worker turnover rate within domiciliary providers was 36.8%.
Turnover rates have increased steadily, by a total of 4.7 percentage points, between 2012/13 and 2016/17.
Skills for Care estimates that the starters rate in the past 12 months was 34.1%. This was approximately 425,000 new directly employed starters over the year.
Of new starters, approximately two thirds were recruited from within the adult social care sector, therefore the sector retains their skills and experience.
Adult social care has an experienced ‘core’ of workers. Workers had, on average, eight years of experience in the sector and around 70% of the workforce had been working in the sector for at least three years.
Some employers are struggling to find and recruit suitable people to the sector. A large proportion of staff turnover was a result of people leaving the sector soon after joining; the sector also difficulties in retaining younger workers.
With an estimated workforce of 1.34 million within local authority and independent sector providers and an average of 5 sickness days, approximately 6.7 million days were lost to sickness in the past 12 months.
Skills for Care estimates that 6.6% of the roles in adult social care are vacant, this gives an average of approximately 90,000 vacancies at any one time. The vacancy rate between 2012/13 and 2015/16 had risen each year, but has decreased slightly (0.4 percentage points) over the past 12 months.
3. Recruitment and retention
3.1. Introduction This chapter shares workforce intelligence about recruitment and retention of the adult social care workforce, including leavers information, starter rates, experience, vacancy information and sickness rates. It is vital that adult social care can attract and retain staff with the right skills, values and behaviours, to raise and deliver quality standards for people using social care services. The high level of movement within the current care workforce may have an impact of service delivery and continuity of care. Good quality workforce intelligence, collected in the NMDS-SC and analysed by Skills for Care, is key to understanding recruitment and retention issues. And this workforce intelligence helps to keep R&R at the forefront of social care debates, providing numerical,
34.1% Starters rate in the past 12 months
27.8% Leavers rate in the past 12 months
8 years Of experience working in the
sector
6.6% Vacancy rate 90,000 vacancies
03 33
Re
cru
itm
en
t
an
d r
ete
nti
on
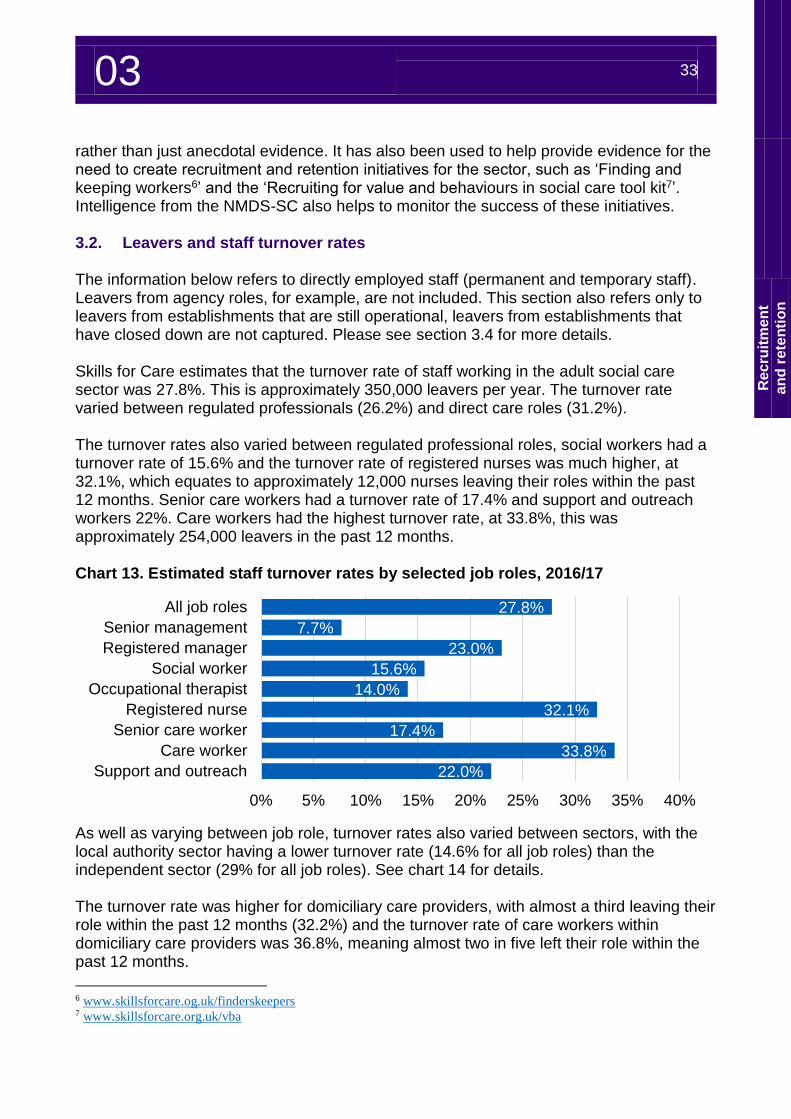
rather than just anecdotal evidence. It has also been used to help provide evidence for the need to create recruitment and retention initiatives for the sector, such as ‘Finding and keeping workers6’ and the ‘Recruiting for value and behaviours in social care tool kit7’. Intelligence from the NMDS-SC also helps to monitor the success of these initiatives. 3.2. Leavers and staff turnover rates The information below refers to directly employed staff (permanent and temporary staff). Leavers from agency roles, for example, are not included. This section also refers only to leavers from establishments that are still operational, leavers from establishments that have closed down are not captured. Please see section 3.4 for more details. Skills for Care estimates that the turnover rate of staff working in the adult social care sector was 27.8%. This is approximately 350,000 leavers per year. The turnover rate varied between regulated professionals (26.2%) and direct care roles (31.2%). The turnover rates also varied between regulated professional roles, social workers had a turnover rate of 15.6% and the turnover rate of registered nurses was much higher, at 32.1%, which equates to approximately 12,000 nurses leaving their roles within the past 12 months. Senior care workers had a turnover rate of 17.4% and support and outreach workers 22%. Care workers had the highest turnover rate, at 33.8%, this was approximately 254,000 leavers in the past 12 months. Chart 13. Estimated staff turnover rates by selected job roles, 2016/17
As well as varying between job role, turnover rates also varied between sectors, with the local authority sector having a lower turnover rate (14.6% for all job roles) than the independent sector (29% for all job roles). See chart 14 for details. The turnover rate was higher for domiciliary care providers, with almost a third leaving their role within the past 12 months (32.2%) and the turnover rate of care workers within domiciliary care providers was 36.8%, meaning almost two in five left their role within the past 12 months.
6 www.skillsforcare.og.uk/finderskeepers 7 www.skillsforcare.org.uk/vba
27.8%
7.7%
23.0%
15.6%
14.0%
32.1%
17.4%
33.8%
22.0%
0% 5% 10% 15% 20% 25% 30% 35% 40%
All job roles
Senior management
Registered manager
Social worker
Occupational therapist
Registered nurse
Senior care worker
Care worker
Support and outreach
03 34
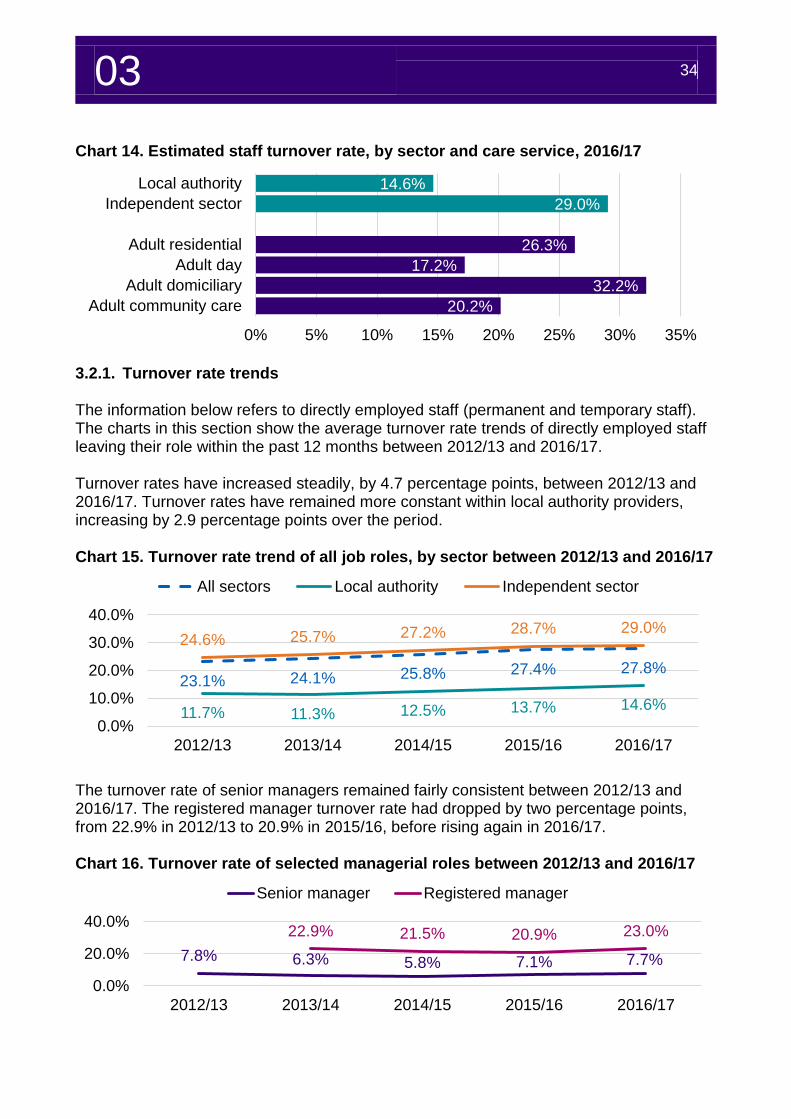
Chart 14. Estimated staff turnover rate, by sector and care service, 2016/17
3.2.1. Turnover rate trends The information below refers to directly employed staff (permanent and temporary staff). The charts in this section show the average turnover rate trends of directly employed staff leaving their role within the past 12 months between 2012/13 and 2016/17. Turnover rates have increased steadily, by 4.7 percentage points, between 2012/13 and 2016/17. Turnover rates have remained more constant within local authority providers, increasing by 2.9 percentage points over the period. Chart 15. Turnover rate trend of all job roles, by sector between 2012/13 and 2016/17
The turnover rate of senior managers remained fairly consistent between 2012/13 and 2016/17. The registered manager turnover rate had dropped by two percentage points, from 22.9% in 2012/13 to 20.9% in 2015/16, before rising again in 2016/17. Chart 16. Turnover rate of selected managerial roles between 2012/13 and 2016/17
14.6%
29.0%
26.3%
17.2%
32.2%
20.2%
0% 5% 10% 15% 20% 25% 30% 35%
Local authority
Independent sector
Adult residential
Adult day
Adult domiciliary
Adult community care
23.1% 24.1% 25.8% 27.4% 27.8%
11.7% 11.3% 12.5% 13.7% 14.6%
24.6% 25.7% 27.2% 28.7% 29.0%
0.0%
10.0%
20.0%
30.0%
40.0%
2012/13 2013/14 2014/15 2015/16 2016/17
All sectors Local authority Independent sector
7.8% 6.3% 5.8% 7.1% 7.7%
22.9% 21.5% 20.9% 23.0%
0.0%
20.0%
40.0%
2012/13 2013/14 2014/15 2015/16 2016/17
Senior manager Registered manager
03 35
Re
cru
itm
en
t
an
d r
ete
nti
on
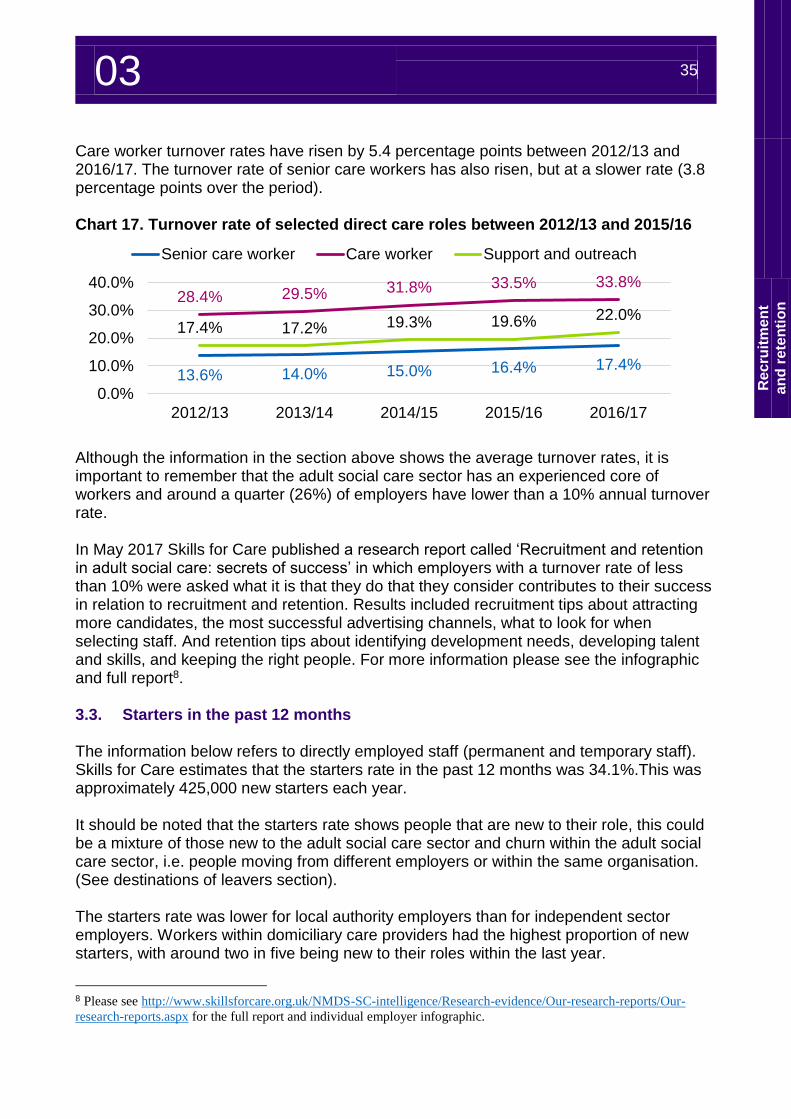
Care worker turnover rates have risen by 5.4 percentage points between 2012/13 and 2016/17. The turnover rate of senior care workers has also risen, but at a slower rate (3.8 percentage points over the period). Chart 17. Turnover rate of selected direct care roles between 2012/13 and 2015/16
Although the information in the section above shows the average turnover rates, it is important to remember that the adult social care sector has an experienced core of workers and around a quarter (26%) of employers have lower than a 10% annual turnover rate. In May 2017 Skills for Care published a research report called ‘Recruitment and retention in adult social care: secrets of success’ in which employers with a turnover rate of less than 10% were asked what it is that they do that they consider contributes to their success in relation to recruitment and retention. Results included recruitment tips about attracting more candidates, the most successful advertising channels, what to look for when selecting staff. And retention tips about identifying development needs, developing talent and skills, and keeping the right people. For more information please see the infographic and full report8. 3.3. Starters in the past 12 months The information below refers to directly employed staff (permanent and temporary staff). Skills for Care estimates that the starters rate in the past 12 months was 34.1%.This was approximately 425,000 new starters each year. It should be noted that the starters rate shows people that are new to their role, this could be a mixture of those new to the adult social care sector and churn within the adult social care sector, i.e. people moving from different employers or within the same organisation. (See destinations of leavers section). The starters rate was lower for local authority employers than for independent sector employers. Workers within domiciliary care providers had the highest proportion of new starters, with around two in five being new to their roles within the last year.
8 Please see http://www.skillsforcare.org.uk/NMDS-SC-intelligence/Research-evidence/Our-research-reports/Our-
research-reports.aspx for the full report and individual employer infographic.
13.6% 14.0% 15.0% 16.4% 17.4%
28.4% 29.5% 31.8% 33.5% 33.8%
17.4% 17.2% 19.3% 19.6% 22.0%
0.0%
10.0%
20.0%
30.0%
40.0%
2012/13 2013/14 2014/15 2015/16 2016/17
Senior care worker Care worker Support and outreach
03 36
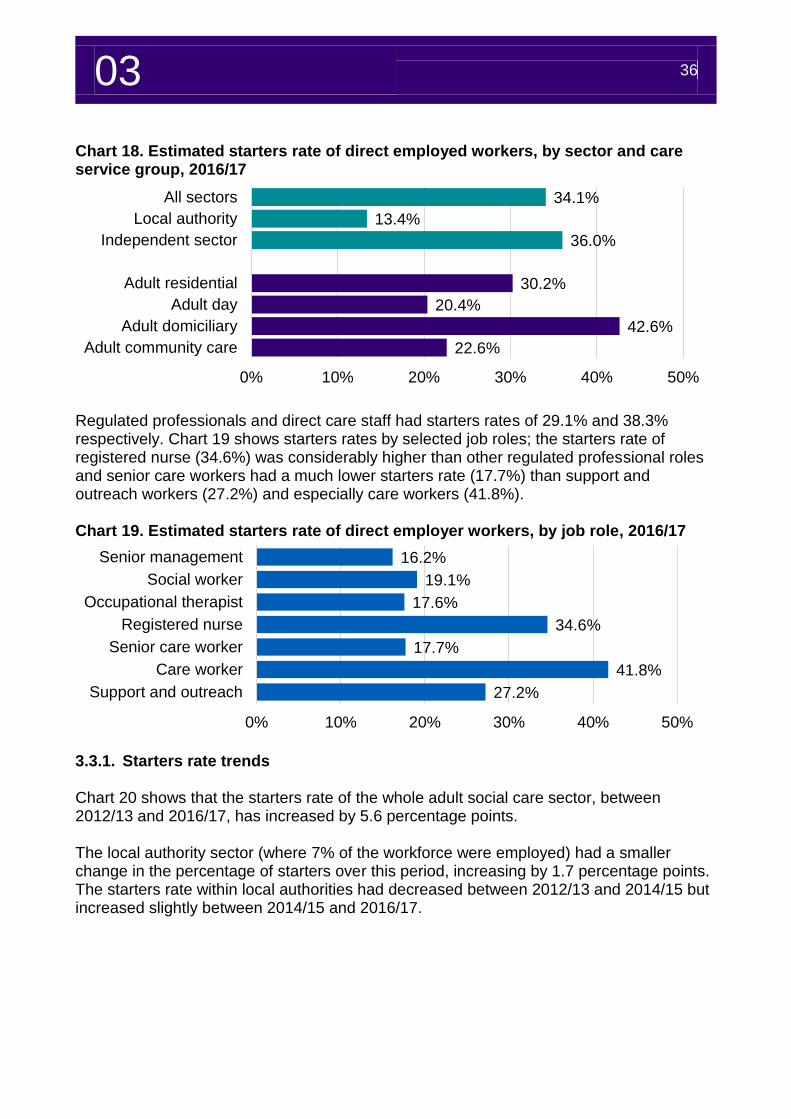
Chart 18. Estimated starters rate of direct employed workers, by sector and care service group, 2016/17
Regulated professionals and direct care staff had starters rates of 29.1% and 38.3% respectively. Chart 19 shows starters rates by selected job roles; the starters rate of registered nurse (34.6%) was considerably higher than other regulated professional roles and senior care workers had a much lower starters rate (17.7%) than support and outreach workers (27.2%) and especially care workers (41.8%). Chart 19. Estimated starters rate of direct employer workers, by job role, 2016/17
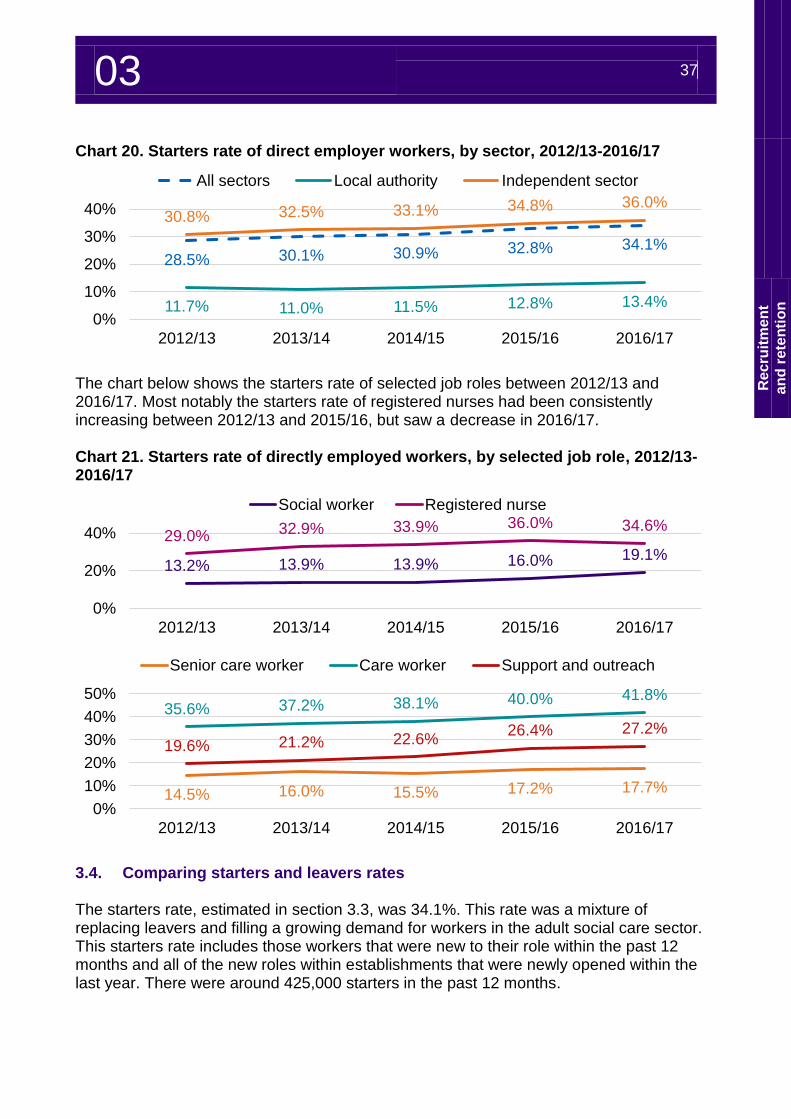
3.3.1. Starters rate trends Chart 20 shows that the starters rate of the whole adult social care sector, between 2012/13 and 2016/17, has increased by 5.6 percentage points. The local authority sector (where 7% of the workforce were employed) had a smaller change in the percentage of starters over this period, increasing by 1.7 percentage points. The starters rate within local authorities had decreased between 2012/13 and 2014/15 but increased slightly between 2014/15 and 2016/17.
34.1%
13.4%
36.0%
30.2%
20.4%
42.6%
22.6%
0% 10% 20% 30% 40% 50%
All sectors
Local authority
Independent sector
Adult residential
Adult day
Adult domiciliary
Adult community care
16.2%
19.1%
17.6%
34.6%
17.7%
41.8%
27.2%
0% 10% 20% 30% 40% 50%
Senior management
Social worker
Occupational therapist
Registered nurse
Senior care worker
Care worker
Support and outreach
03 37
Re
cru
itm
en
t
an
d r
ete
nti
on
Chart 20. Starters rate of direct employer workers, by sector, 2012/13-2016/17
The chart below shows the starters rate of selected job roles between 2012/13 and 2016/17. Most notably the starters rate of registered nurses had been consistently increasing between 2012/13 and 2015/16, but saw a decrease in 2016/17. Chart 21. Starters rate of directly employed workers, by selected job role, 2012/13-2016/17
3.4. Comparing starters and leavers rates The starters rate, estimated in section 3.3, was 34.1%. This rate was a mixture of replacing leavers and filling a growing demand for workers in the adult social care sector. This starters rate includes those workers that were new to their role within the past 12 months and all of the new roles within establishments that were newly opened within the last year. There were around 425,000 starters in the past 12 months.
28.5% 30.1% 30.9% 32.8% 34.1%
11.7% 11.0% 11.5% 12.8% 13.4%
30.8% 32.5% 33.1% 34.8% 36.0%
0%
10%
20%
30%
40%
2012/13 2013/14 2014/15 2015/16 2016/17
All sectors Local authority Independent sector
13.2% 13.9% 13.9% 16.0% 19.1%
29.0% 32.9% 33.9% 36.0% 34.6%
0%
20%
40%
2012/13 2013/14 2014/15 2015/16 2016/17
Social worker Registered nurse
14.5% 16.0% 15.5% 17.2% 17.7%
35.6% 37.2% 38.1% 40.0% 41.8%
19.6% 21.2% 22.6%26.4% 27.2%
0%
10%
20%
30%
40%
50%
2012/13 2013/14 2014/15 2015/16 2016/17
Senior care worker Care worker Support and outreach
03 38
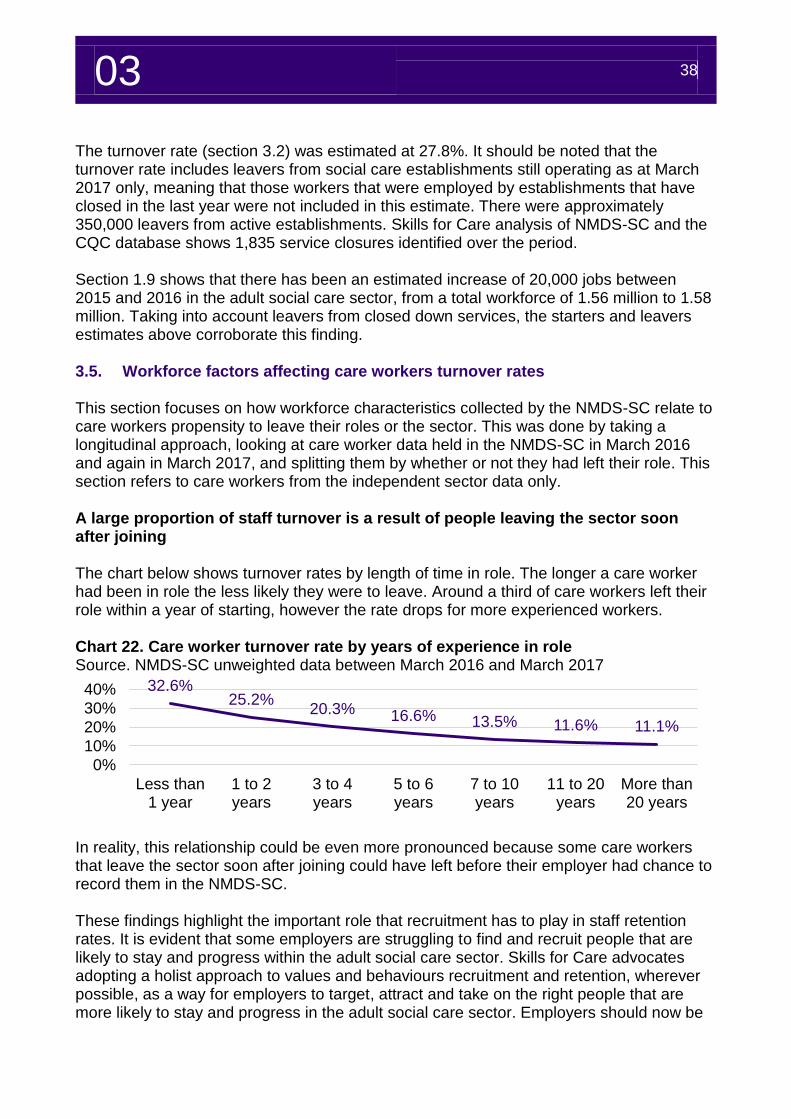
The turnover rate (section 3.2) was estimated at 27.8%. It should be noted that the turnover rate includes leavers from social care establishments still operating as at March 2017 only, meaning that those workers that were employed by establishments that have closed in the last year were not included in this estimate. There were approximately 350,000 leavers from active establishments. Skills for Care analysis of NMDS-SC and the CQC database shows 1,835 service closures identified over the period. Section 1.9 shows that there has been an estimated increase of 20,000 jobs between 2015 and 2016 in the adult social care sector, from a total workforce of 1.56 million to 1.58 million. Taking into account leavers from closed down services, the starters and leavers estimates above corroborate this finding. 3.5. Workforce factors affecting care workers turnover rates This section focuses on how workforce characteristics collected by the NMDS-SC relate to care workers propensity to leave their roles or the sector. This was done by taking a longitudinal approach, looking at care worker data held in the NMDS-SC in March 2016 and again in March 2017, and splitting them by whether or not they had left their role. This section refers to care workers from the independent sector data only. A large proportion of staff turnover is a result of people leaving the sector soon after joining The chart below shows turnover rates by length of time in role. The longer a care worker had been in role the less likely they were to leave. Around a third of care workers left their role within a year of starting, however the rate drops for more experienced workers. Chart 22. Care worker turnover rate by years of experience in role Source. NMDS-SC unweighted data between March 2016 and March 2017
In reality, this relationship could be even more pronounced because some care workers that leave the sector soon after joining could have left before their employer had chance to record them in the NMDS-SC. These findings highlight the important role that recruitment has to play in staff retention rates. It is evident that some employers are struggling to find and recruit people that are likely to stay and progress within the adult social care sector. Skills for Care advocates adopting a holist approach to values and behaviours recruitment and retention, wherever possible, as a way for employers to target, attract and take on the right people that are more likely to stay and progress in the adult social care sector. Employers should now be
32.6%25.2%
20.3% 16.6% 13.5% 11.6% 11.1%
0%
10%
20%
30%
40%
Less than1 year
1 to 2years
3 to 4years
5 to 6years
7 to 10years
11 to 20years
More than20 years
03 39
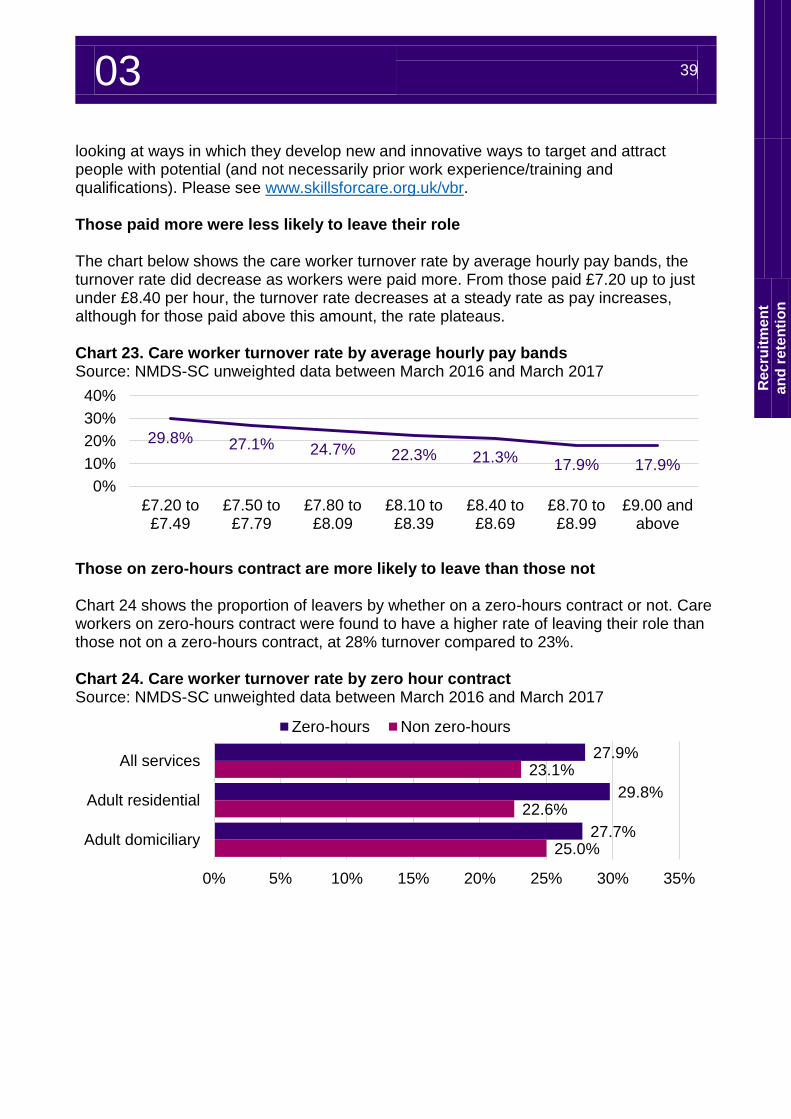
Re
cru
itm
en
t
an
d r
ete
nti
on
looking at ways in which they develop new and innovative ways to target and attract people with potential (and not necessarily prior work experience/training and qualifications). Please see www.skillsforcare.org.uk/vbr. Those paid more were less likely to leave their role The chart below shows the care worker turnover rate by average hourly pay bands, the turnover rate did decrease as workers were paid more. From those paid £7.20 up to just under £8.40 per hour, the turnover rate decreases at a steady rate as pay increases, although for those paid above this amount, the rate plateaus. Chart 23. Care worker turnover rate by average hourly pay bands Source: NMDS-SC unweighted data between March 2016 and March 2017
Those on zero-hours contract are more likely to leave than those not Chart 24 shows the proportion of leavers by whether on a zero-hours contract or not. Care workers on zero-hours contract were found to have a higher rate of leaving their role than those not on a zero-hours contract, at 28% turnover compared to 23%. Chart 24. Care worker turnover rate by zero hour contract Source: NMDS-SC unweighted data between March 2016 and March 2017
29.8% 27.1% 24.7% 22.3% 21.3%17.9% 17.9%
0%
10%
20%
30%
40%
£7.20 to£7.49
£7.50 to£7.79
£7.80 to£8.09
£8.10 to£8.39
£8.40 to£8.69
£8.70 to£8.99
£9.00 andabove
27.9%
29.8%
27.7%
23.1%
22.6%
25.0%
0% 5% 10% 15% 20% 25% 30% 35%
All services
Adult residential
Adult domiciliary
Zero-hours Non zero-hours
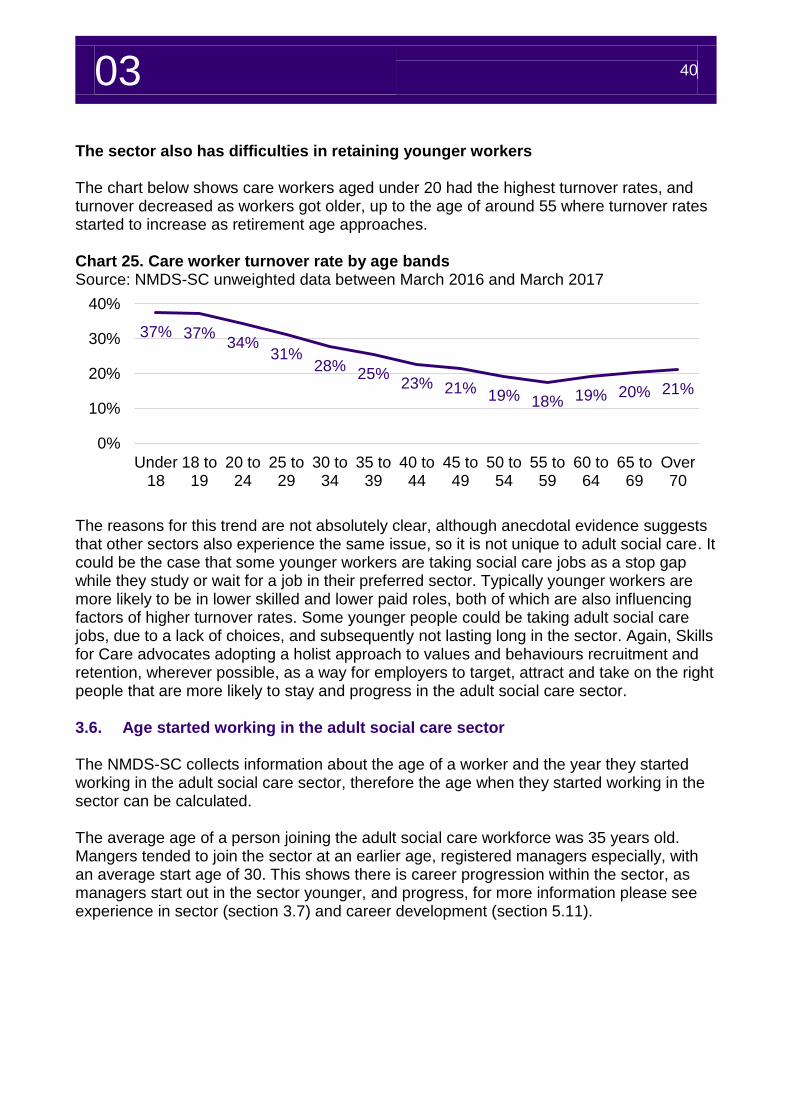
03 40
The sector also has difficulties in retaining younger workers The chart below shows care workers aged under 20 had the highest turnover rates, and turnover decreased as workers got older, up to the age of around 55 where turnover rates started to increase as retirement age approaches. Chart 25. Care worker turnover rate by age bands Source: NMDS-SC unweighted data between March 2016 and March 2017
The reasons for this trend are not absolutely clear, although anecdotal evidence suggests that other sectors also experience the same issue, so it is not unique to adult social care. It could be the case that some younger workers are taking social care jobs as a stop gap while they study or wait for a job in their preferred sector. Typically younger workers are more likely to be in lower skilled and lower paid roles, both of which are also influencing factors of higher turnover rates. Some younger people could be taking adult social care jobs, due to a lack of choices, and subsequently not lasting long in the sector. Again, Skills for Care advocates adopting a holist approach to values and behaviours recruitment and retention, wherever possible, as a way for employers to target, attract and take on the right people that are more likely to stay and progress in the adult social care sector. 3.6. Age started working in the adult social care sector The NMDS-SC collects information about the age of a worker and the year they started working in the adult social care sector, therefore the age when they started working in the sector can be calculated. The average age of a person joining the adult social care workforce was 35 years old. Mangers tended to join the sector at an earlier age, registered managers especially, with an average start age of 30. This shows there is career progression within the sector, as managers start out in the sector younger, and progress, for more information please see experience in sector (section 3.7) and career development (section 5.11).
37% 37%34%
31%28%
25%23% 21% 19% 18% 19% 20% 21%
0%
10%
20%
30%
40%
Under18
18 to19
20 to24
25 to29
30 to34
35 to39
40 to44
45 to49
50 to54
55 to59
60 to64
65 to69
Over70
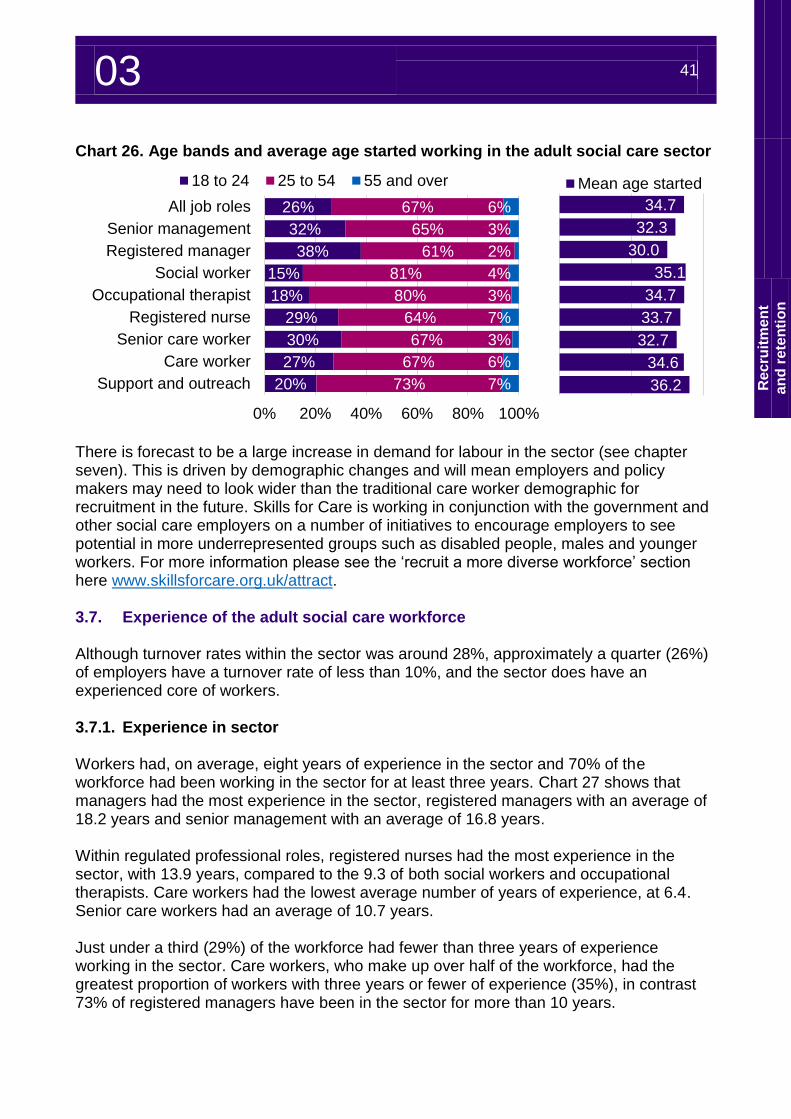
03 41
Re
cru
itm
en
t
an
d r
ete
nti
on
Chart 26. Age bands and average age started working in the adult social care sector
There is forecast to be a large increase in demand for labour in the sector (see chapter seven). This is driven by demographic changes and will mean employers and policy makers may need to look wider than the traditional care worker demographic for recruitment in the future. Skills for Care is working in conjunction with the government and other social care employers on a number of initiatives to encourage employers to see potential in more underrepresented groups such as disabled people, males and younger workers. For more information please see the ‘recruit a more diverse workforce’ section here www.skillsforcare.org.uk/attract. 3.7. Experience of the adult social care workforce Although turnover rates within the sector was around 28%, approximately a quarter (26%) of employers have a turnover rate of less than 10%, and the sector does have an experienced core of workers. 3.7.1. Experience in sector Workers had, on average, eight years of experience in the sector and 70% of the workforce had been working in the sector for at least three years. Chart 27 shows that managers had the most experience in the sector, registered managers with an average of 18.2 years and senior management with an average of 16.8 years. Within regulated professional roles, registered nurses had the most experience in the sector, with 13.9 years, compared to the 9.3 of both social workers and occupational therapists. Care workers had the lowest average number of years of experience, at 6.4. Senior care workers had an average of 10.7 years. Just under a third (29%) of the workforce had fewer than three years of experience working in the sector. Care workers, who make up over half of the workforce, had the greatest proportion of workers with three years or fewer of experience (35%), in contrast 73% of registered managers have been in the sector for more than 10 years.
26%
32%
38%
15%
18%
29%
30%
27%
20%
67%
65%
61%
81%
80%
64%
67%
67%
73%
6%
3%
2%
4%
3%
7%
3%
6%
7%
0% 20% 40% 60% 80% 100%
All job roles
Senior management
Registered manager
Social worker
Occupational therapist
Registered nurse
Senior care worker
Care worker
Support and outreach
18 to 24 25 to 54 55 and over
34.7
32.3
30.0
35.1
34.7
33.7
32.7
34.6
36.2
Mean age started
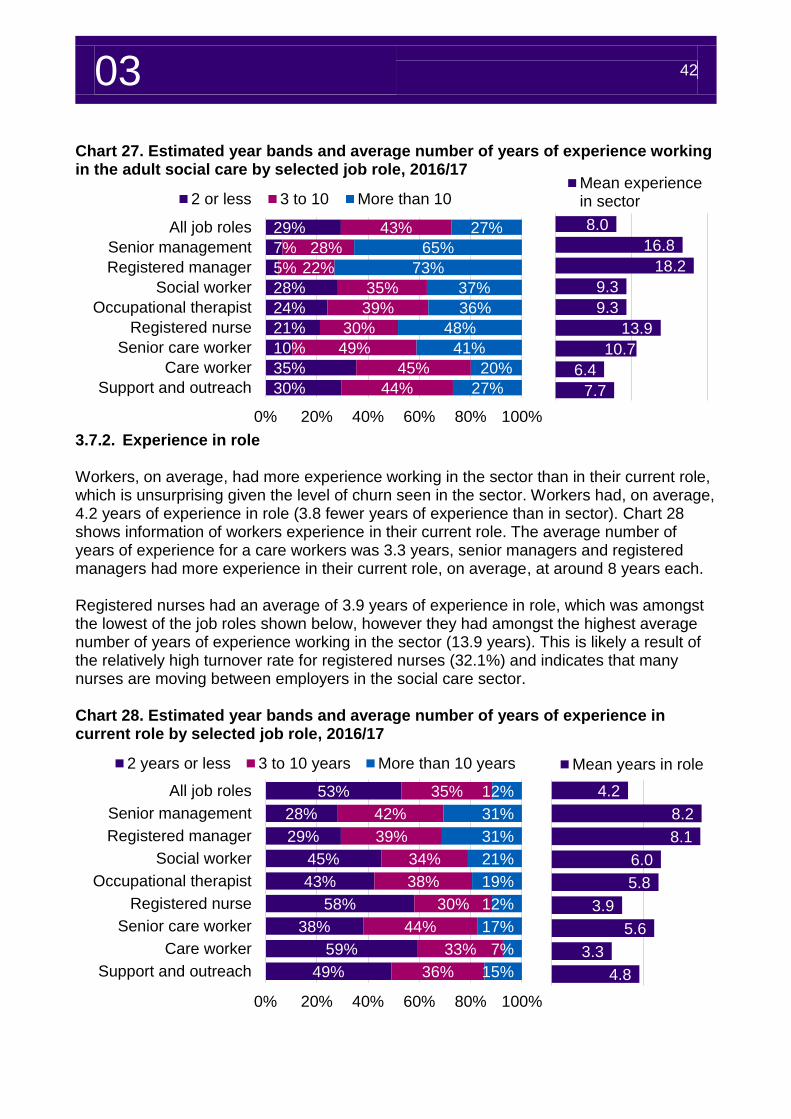
03 42
8.0
16.8
18.2
9.3
9.3
13.9
10.7
6.4
7.7
Mean experiencein sector
4.2
8.2
8.1
6.0
5.8
3.9
5.6
3.3
4.8
Mean years in role
Chart 27. Estimated year bands and average number of years of experience working in the adult social care by selected job role, 2016/17
3.7.2. Experience in role Workers, on average, had more experience working in the sector than in their current role, which is unsurprising given the level of churn seen in the sector. Workers had, on average, 4.2 years of experience in role (3.8 fewer years of experience than in sector). Chart 28 shows information of workers experience in their current role. The average number of years of experience for a care workers was 3.3 years, senior managers and registered managers had more experience in their current role, on average, at around 8 years each. Registered nurses had an average of 3.9 years of experience in role, which was amongst the lowest of the job roles shown below, however they had amongst the highest average number of years of experience working in the sector (13.9 years). This is likely a result of the relatively high turnover rate for registered nurses (32.1%) and indicates that many nurses are moving between employers in the social care sector. Chart 28. Estimated year bands and average number of years of experience in current role by selected job role, 2016/17
29%
7%
5%
28%
24%
21%
10%
35%
30%
43%
28%
22%
35%
39%
30%
49%
45%
44%
27%
65%
73%
37%
36%
48%
41%
20%
27%
0% 20% 40% 60% 80% 100%
All job roles
Senior management
Registered manager
Social worker
Occupational therapist
Registered nurse
Senior care worker
Care worker
Support and outreach
2 or less 3 to 10 More than 10
53%
28%
29%
45%
43%
58%
38%
59%
49%
35%
42%
39%
34%
38%
30%
44%
33%
36%
12%
31%
31%
21%
19%
12%
17%
7%
15%
0% 20% 40% 60% 80% 100%
All job roles
Senior management
Registered manager
Social worker
Occupational therapist
Registered nurse
Senior care worker
Care worker
Support and outreach
2 years or less 3 to 10 years More than 10 years
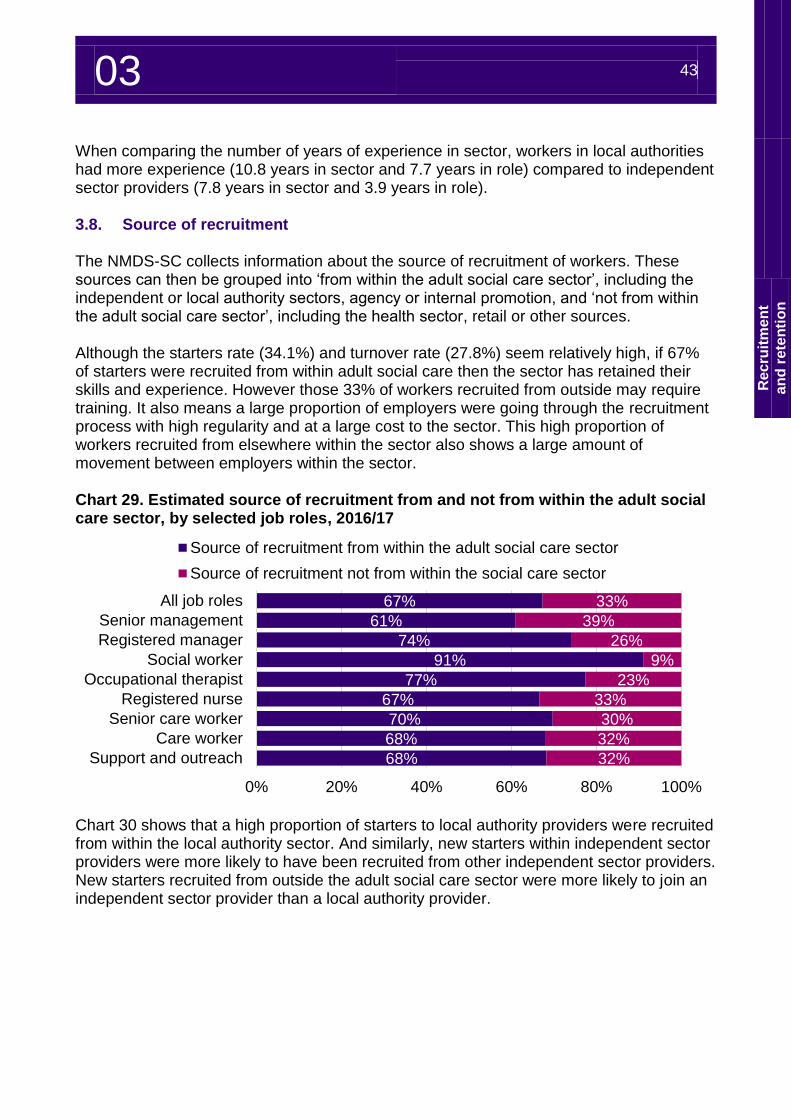
03 43
Re
cru
itm
en
t
an
d r
ete
nti
on
When comparing the number of years of experience in sector, workers in local authorities had more experience (10.8 years in sector and 7.7 years in role) compared to independent sector providers (7.8 years in sector and 3.9 years in role). 3.8. Source of recruitment The NMDS-SC collects information about the source of recruitment of workers. These sources can then be grouped into ‘from within the adult social care sector’, including the independent or local authority sectors, agency or internal promotion, and ‘not from within the adult social care sector’, including the health sector, retail or other sources. Although the starters rate (34.1%) and turnover rate (27.8%) seem relatively high, if 67% of starters were recruited from within adult social care then the sector has retained their skills and experience. However those 33% of workers recruited from outside may require training. It also means a large proportion of employers were going through the recruitment process with high regularity and at a large cost to the sector. This high proportion of workers recruited from elsewhere within the sector also shows a large amount of movement between employers within the sector. Chart 29. Estimated source of recruitment from and not from within the adult social care sector, by selected job roles, 2016/17
Chart 30 shows that a high proportion of starters to local authority providers were recruited from within the local authority sector. And similarly, new starters within independent sector providers were more likely to have been recruited from other independent sector providers. New starters recruited from outside the adult social care sector were more likely to join an independent sector provider than a local authority provider.
67%
61%
74%
91%
77%
67%
70%
68%
68%
33%
39%
26%
9%
23%
33%
30%
32%
32%
0% 20% 40% 60% 80% 100%
All job roles
Senior management
Registered manager
Social worker
Occupational therapist
Registered nurse
Senior care worker
Care worker
Support and outreach
Source of recruitment from within the adult social care sector
Source of recruitment not from within the social care sector
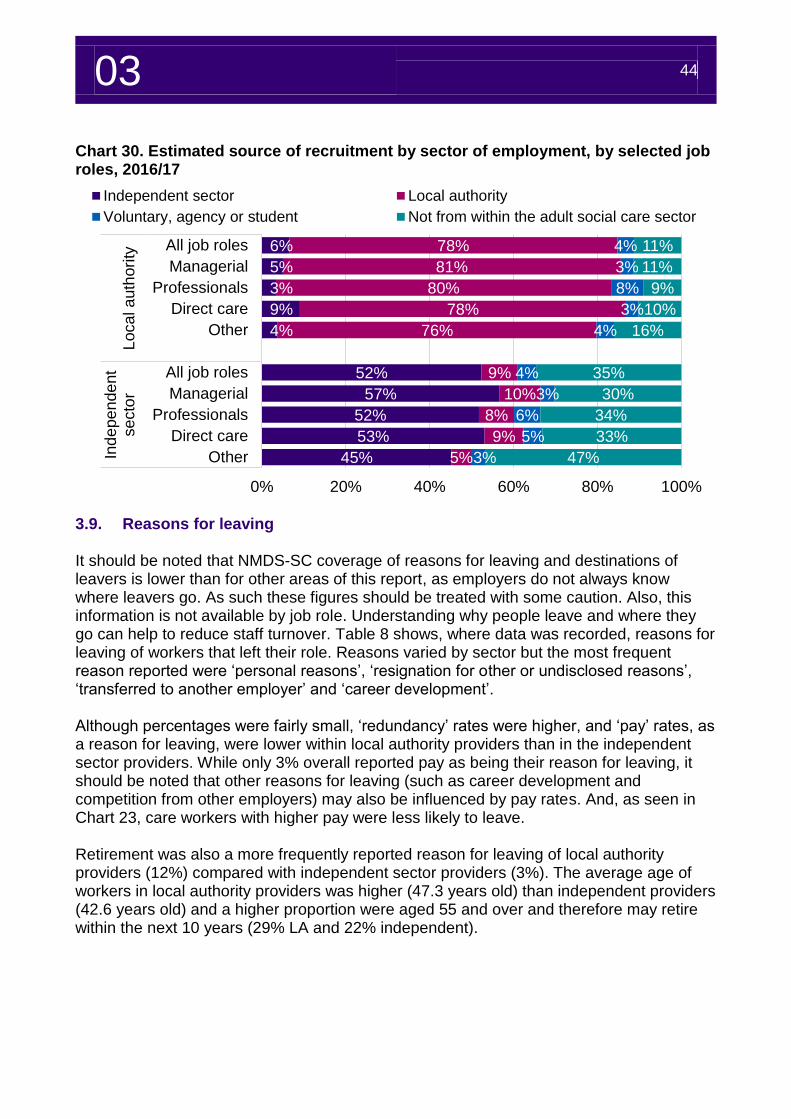
03 44
Chart 30. Estimated source of recruitment by sector of employment, by selected job roles, 2016/17
3.9. Reasons for leaving It should be noted that NMDS-SC coverage of reasons for leaving and destinations of leavers is lower than for other areas of this report, as employers do not always know where leavers go. As such these figures should be treated with some caution. Also, this information is not available by job role. Understanding why people leave and where they go can help to reduce staff turnover. Table 8 shows, where data was recorded, reasons for leaving of workers that left their role. Reasons varied by sector but the most frequent reason reported were ‘personal reasons’, ‘resignation for other or undisclosed reasons’, ‘transferred to another employer’ and ‘career development’. Although percentages were fairly small, ‘redundancy’ rates were higher, and ‘pay’ rates, as a reason for leaving, were lower within local authority providers than in the independent sector providers. While only 3% overall reported pay as being their reason for leaving, it should be noted that other reasons for leaving (such as career development and competition from other employers) may also be influenced by pay rates. And, as seen in Chart 23, care workers with higher pay were less likely to leave. Retirement was also a more frequently reported reason for leaving of local authority providers (12%) compared with independent sector providers (3%). The average age of workers in local authority providers was higher (47.3 years old) than independent providers (42.6 years old) and a higher proportion were aged 55 and over and therefore may retire within the next 10 years (29% LA and 22% independent).
6%
5%
3%
9%
4%
52%
57%
52%
53%
45%
78%
81%
80%
78%
76%
9%
10%
8%
9%
5%
4%
3%
8%
3%
4%
4%
3%
6%
5%
3%
11%
11%
9%
10%
16%
35%
30%
34%
33%
47%
0% 20% 40% 60% 80% 100%
All job roles
Managerial
Professionals
Direct care
Other
All job roles
Managerial
Professionals
Direct care
Other
Loca
l a
uth
ori
tyIn
de
pe
nde
nt
se
cto
r
Independent sector Local authority
Voluntary, agency or student Not from within the adult social care sector
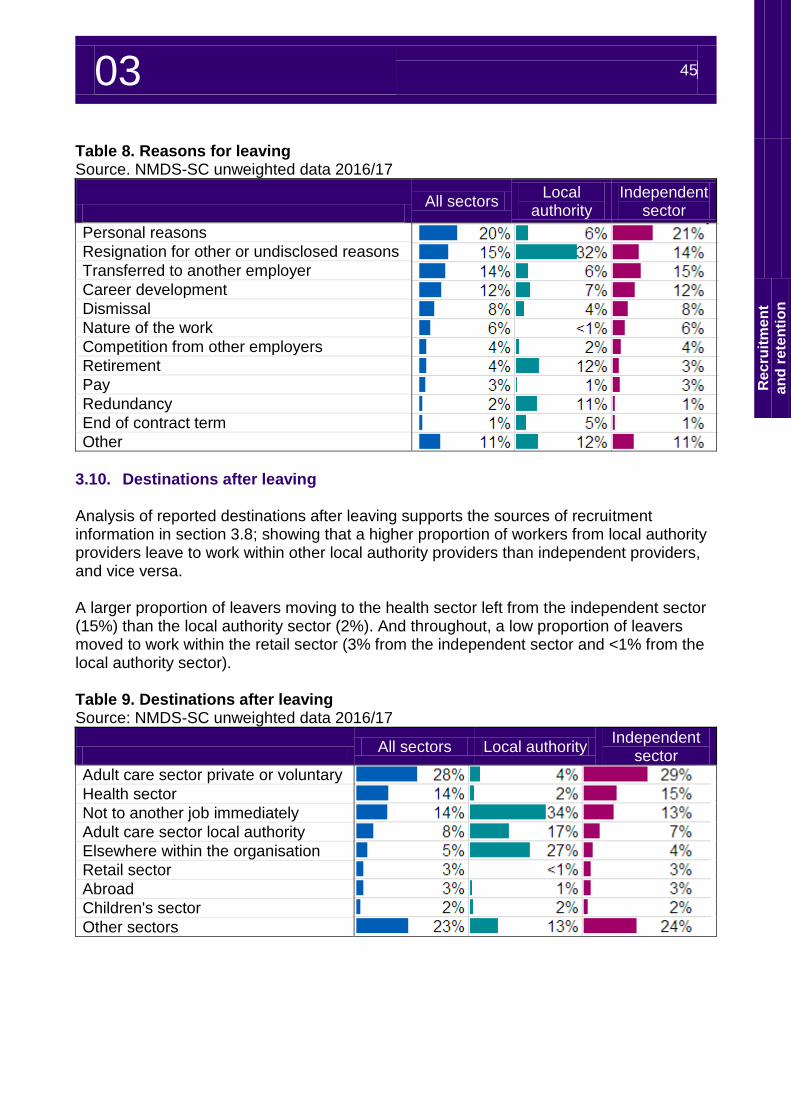
03 45
Re
cru
itm
en
t
an
d r
ete
nti
on
Table 8. Reasons for leaving Source. NMDS-SC unweighted data 2016/17
All sectors
Local authority
Independent sector
Personal reasons
Resignation for other or undisclosed reasons
Transferred to another employer
Career development
Dismissal
Nature of the work
Competition from other employers
Retirement
Pay
Redundancy
End of contract term
Other
3.10. Destinations after leaving Analysis of reported destinations after leaving supports the sources of recruitment information in section 3.8; showing that a higher proportion of workers from local authority providers leave to work within other local authority providers than independent providers, and vice versa. A larger proportion of leavers moving to the health sector left from the independent sector (15%) than the local authority sector (2%). And throughout, a low proportion of leavers moved to work within the retail sector (3% from the independent sector and <1% from the local authority sector). Table 9. Destinations after leaving Source: NMDS-SC unweighted data 2016/17
All sectors Local authority
Independent sector
Adult care sector private or voluntary
Health sector
Not to another job immediately
Adult care sector local authority
Elsewhere within the organisation
Retail sector
Abroad
Children's sector
Other sectors
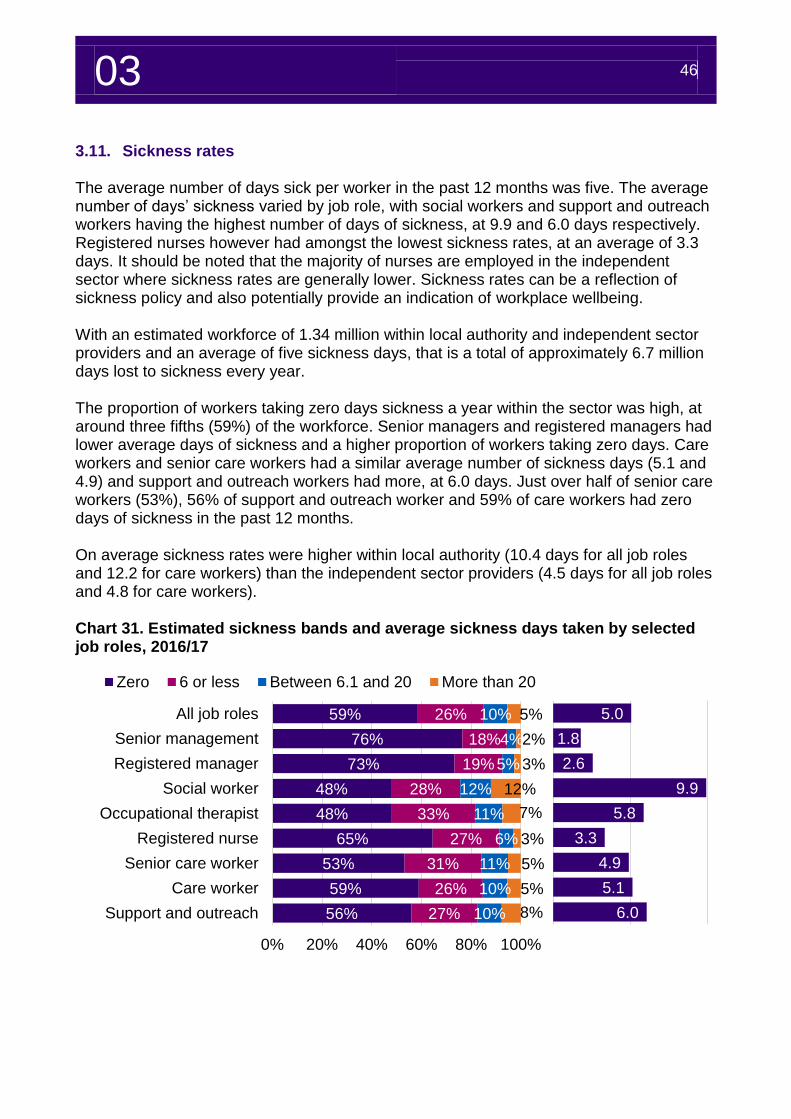
03 46
5.0
1.8
2.6
9.9
5.8
3.3
4.9
5.1
6.0
3.11. Sickness rates The average number of days sick per worker in the past 12 months was five. The average number of days’ sickness varied by job role, with social workers and support and outreach workers having the highest number of days of sickness, at 9.9 and 6.0 days respectively. Registered nurses however had amongst the lowest sickness rates, at an average of 3.3 days. It should be noted that the majority of nurses are employed in the independent sector where sickness rates are generally lower. Sickness rates can be a reflection of sickness policy and also potentially provide an indication of workplace wellbeing. With an estimated workforce of 1.34 million within local authority and independent sector providers and an average of five sickness days, that is a total of approximately 6.7 million days lost to sickness every year. The proportion of workers taking zero days sickness a year within the sector was high, at around three fifths (59%) of the workforce. Senior managers and registered managers had lower average days of sickness and a higher proportion of workers taking zero days. Care workers and senior care workers had a similar average number of sickness days (5.1 and 4.9) and support and outreach workers had more, at 6.0 days. Just over half of senior care workers (53%), 56% of support and outreach worker and 59% of care workers had zero days of sickness in the past 12 months. On average sickness rates were higher within local authority (10.4 days for all job roles and 12.2 for care workers) than the independent sector providers (4.5 days for all job roles and 4.8 for care workers). Chart 31. Estimated sickness bands and average sickness days taken by selected job roles, 2016/17
59%
76%
73%
48%
48%
65%
53%
59%
56%
26%
18%
19%
28%
33%
27%
31%
26%
27%
10%
4%
5%
12%
11%
6%
11%
10%
10%
5%
2%
3%
12%
7%
3%
5%
5%
8%
0% 20% 40% 60% 80% 100%
All job roles
Senior management
Registered manager
Social worker
Occupational therapist
Registered nurse
Senior care worker
Care worker
Support and outreach
Zero 6 or less Between 6.1 and 20 More than 20
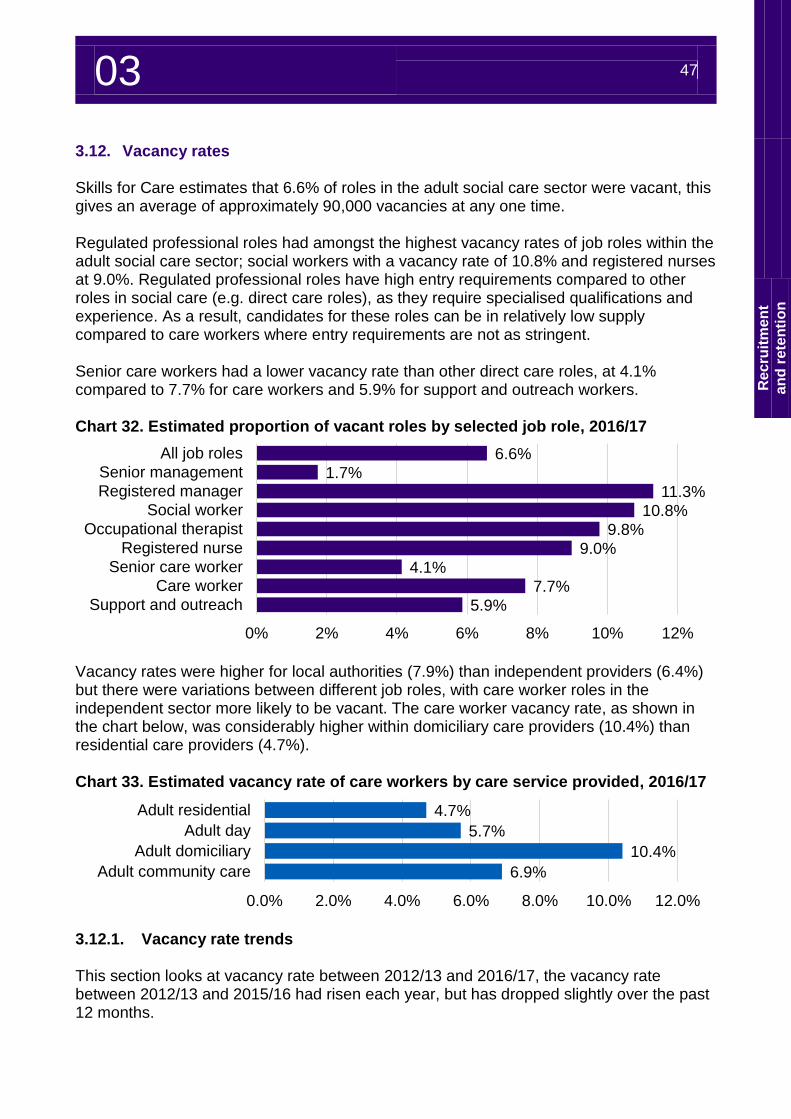
03 47
Re
cru
itm
en
t
an
d r
ete
nti
on
3.12. Vacancy rates Skills for Care estimates that 6.6% of roles in the adult social care sector were vacant, this gives an average of approximately 90,000 vacancies at any one time. Regulated professional roles had amongst the highest vacancy rates of job roles within the adult social care sector; social workers with a vacancy rate of 10.8% and registered nurses at 9.0%. Regulated professional roles have high entry requirements compared to other roles in social care (e.g. direct care roles), as they require specialised qualifications and experience. As a result, candidates for these roles can be in relatively low supply compared to care workers where entry requirements are not as stringent. Senior care workers had a lower vacancy rate than other direct care roles, at 4.1% compared to 7.7% for care workers and 5.9% for support and outreach workers. Chart 32. Estimated proportion of vacant roles by selected job role, 2016/17
Vacancy rates were higher for local authorities (7.9%) than independent providers (6.4%) but there were variations between different job roles, with care worker roles in the independent sector more likely to be vacant. The care worker vacancy rate, as shown in the chart below, was considerably higher within domiciliary care providers (10.4%) than residential care providers (4.7%). Chart 33. Estimated vacancy rate of care workers by care service provided, 2016/17
3.12.1. Vacancy rate trends This section looks at vacancy rate between 2012/13 and 2016/17, the vacancy rate between 2012/13 and 2015/16 had risen each year, but has dropped slightly over the past 12 months.
6.6%
1.7%
11.3%
10.8%
9.8%
9.0%
4.1%
7.7%
5.9%
0% 2% 4% 6% 8% 10% 12%
All job roles
Senior management
Registered manager
Social worker
Occupational therapist
Registered nurse
Senior care worker
Care worker
Support and outreach
4.7%
5.7%
10.4%
6.9%
0.0% 2.0% 4.0% 6.0% 8.0% 10.0% 12.0%
Adult residential
Adult day
Adult domiciliary
Adult community care
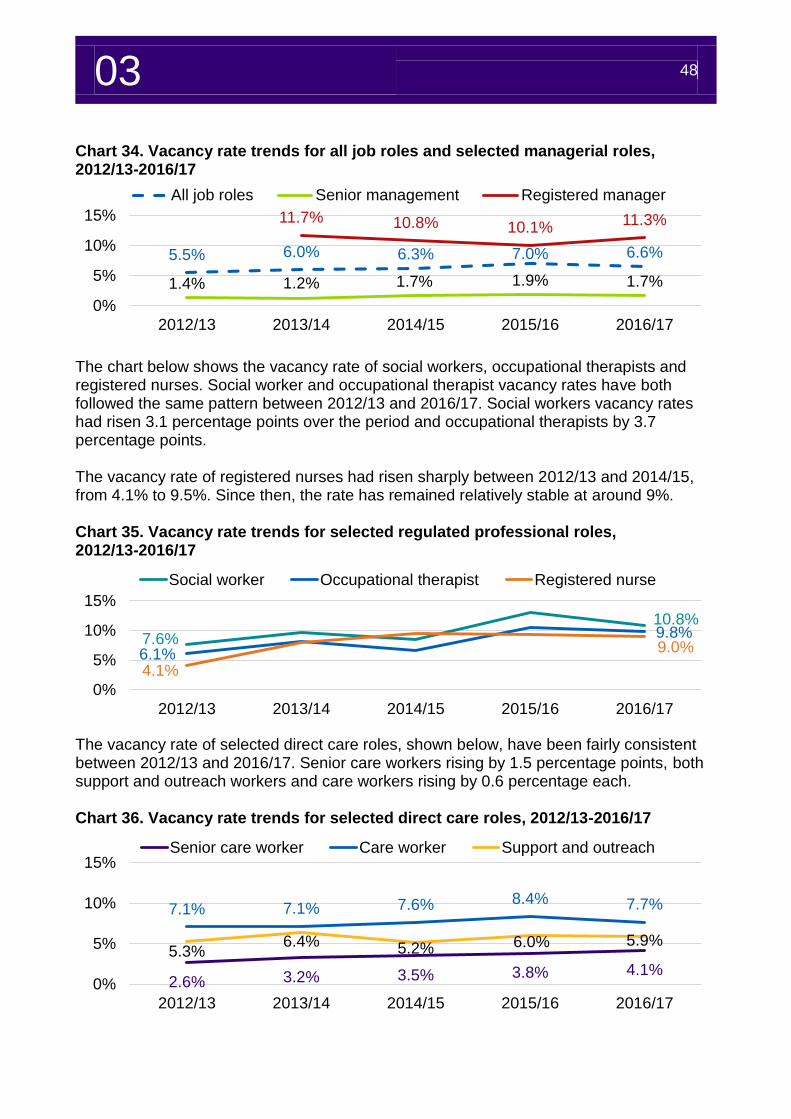
03 48
Chart 34. Vacancy rate trends for all job roles and selected managerial roles, 2012/13-2016/17
The chart below shows the vacancy rate of social workers, occupational therapists and registered nurses. Social worker and occupational therapist vacancy rates have both followed the same pattern between 2012/13 and 2016/17. Social workers vacancy rates had risen 3.1 percentage points over the period and occupational therapists by 3.7 percentage points. The vacancy rate of registered nurses had risen sharply between 2012/13 and 2014/15, from 4.1% to 9.5%. Since then, the rate has remained relatively stable at around 9%. Chart 35. Vacancy rate trends for selected regulated professional roles, 2012/13-2016/17
The vacancy rate of selected direct care roles, shown below, have been fairly consistent between 2012/13 and 2016/17. Senior care workers rising by 1.5 percentage points, both support and outreach workers and care workers rising by 0.6 percentage each. Chart 36. Vacancy rate trends for selected direct care roles, 2012/13-2016/17
5.5% 6.0% 6.3% 7.0% 6.6%
1.4% 1.2% 1.7% 1.9% 1.7%
11.7% 10.8% 10.1%11.3%
0%
5%
10%
15%
2012/13 2013/14 2014/15 2015/16 2016/17
All job roles Senior management Registered manager
7.6%
10.8%
6.1%
9.8%
4.1%
9.0%
0%
5%
10%
15%
2012/13 2013/14 2014/15 2015/16 2016/17
Social worker Occupational therapist Registered nurse
2.6% 3.2% 3.5% 3.8% 4.1%
7.1% 7.1% 7.6% 8.4% 7.7%
5.3%6.4% 5.2% 6.0% 5.9%
0%
5%
10%
15%
2012/13 2013/14 2014/15 2015/16 2016/17
Senior care worker Care worker Support and outreach

Workforce demographics
04
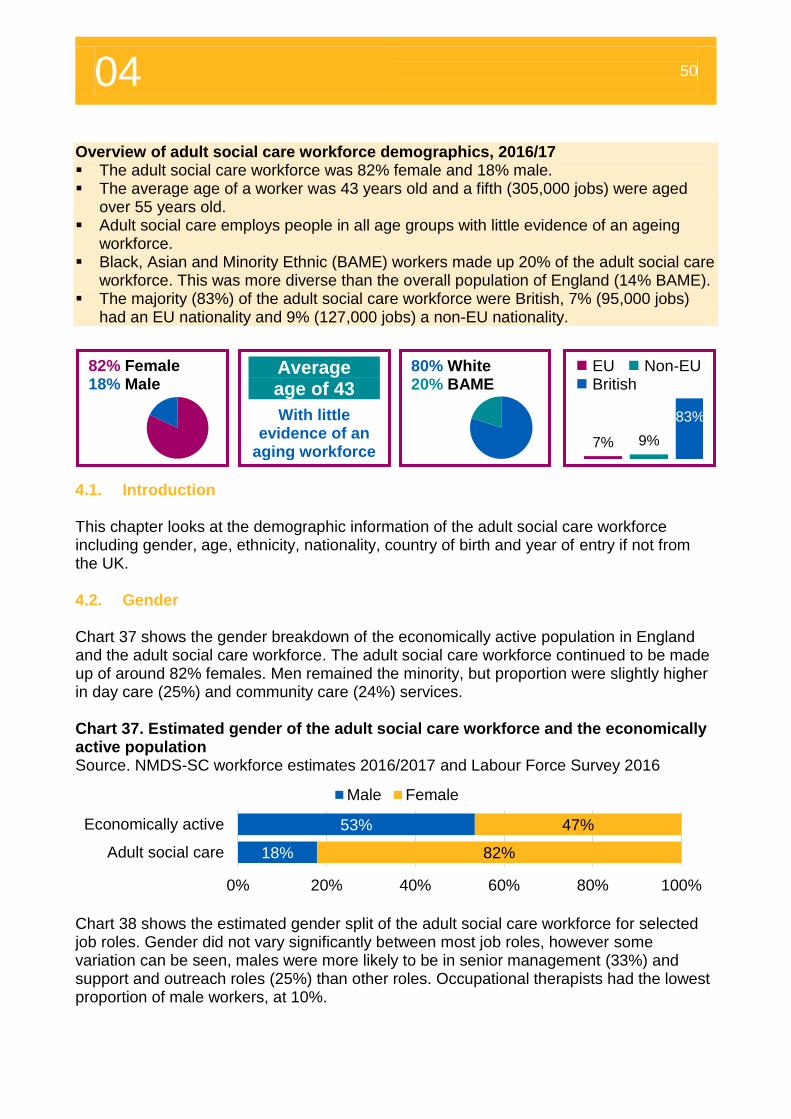
04 50
Overview of adult social care workforce demographics, 2016/17 The adult social care workforce was 82% female and 18% male. The average age of a worker was 43 years old and a fifth (305,000 jobs) were aged
over 55 years old. Adult social care employs people in all age groups with little evidence of an ageing
workforce. Black, Asian and Minority Ethnic (BAME) workers made up 20% of the adult social care
workforce. This was more diverse than the overall population of England (14% BAME). The majority (83%) of the adult social care workforce were British, 7% (95,000 jobs)
had an EU nationality and 9% (127,000 jobs) a non-EU nationality. 4. Workforce demographics
4.1. Introduction This chapter looks at the demographic information of the adult social care workforce including gender, age, ethnicity, nationality, country of birth and year of entry if not from the UK. 4.2. Gender Chart 37 shows the gender breakdown of the economically active population in England and the adult social care workforce. The adult social care workforce continued to be made up of around 82% females. Men remained the minority, but proportion were slightly higher in day care (25%) and community care (24%) services. Chart 37. Estimated gender of the adult social care workforce and the economically active population Source. NMDS-SC workforce estimates 2016/2017 and Labour Force Survey 2016
Chart 38 shows the estimated gender split of the adult social care workforce for selected job roles. Gender did not vary significantly between most job roles, however some variation can be seen, males were more likely to be in senior management (33%) and support and outreach roles (25%) than other roles. Occupational therapists had the lowest proportion of male workers, at 10%.
18%
53%
82%
47%
0% 20% 40% 60% 80% 100%
Adult social care
Economically active
Male Female
82% Female 18% Male
Average age of 43
With little evidence of an
aging workforce
80% White 20% BAME
EU Non-EU British
7% 9%
83%
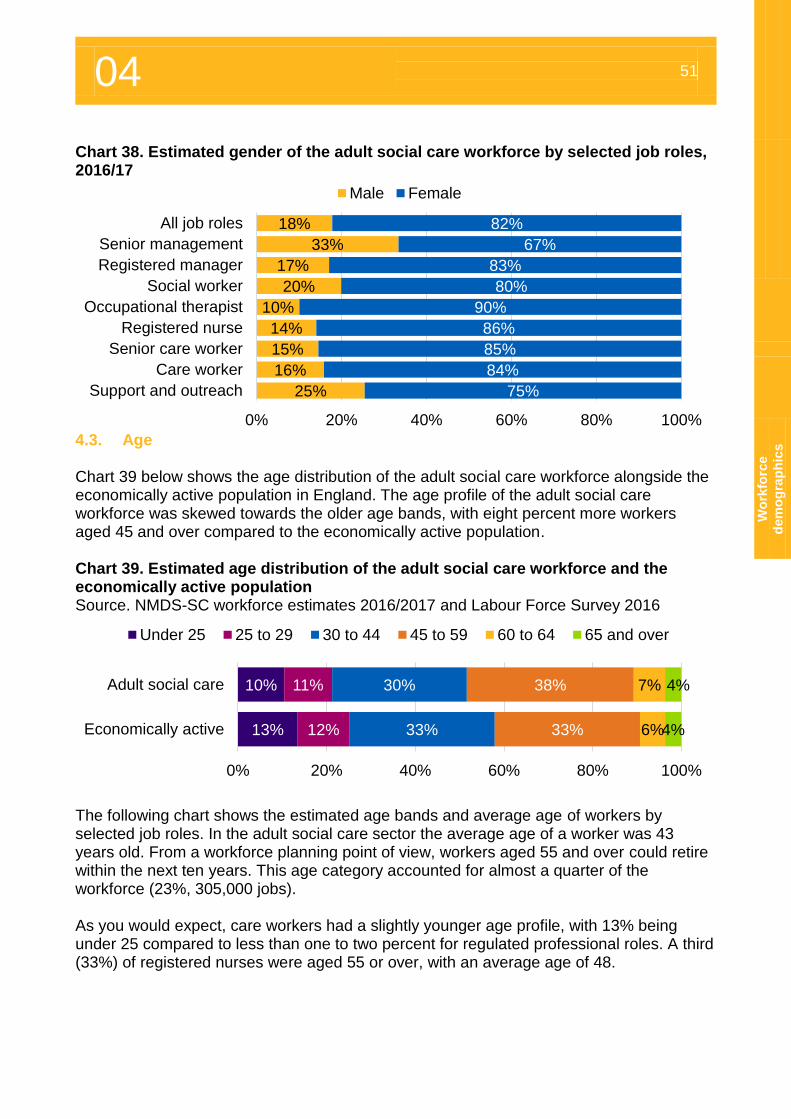
04 51
Wo
rkfo
rce
dem
og
rap
hic
s
Chart 38. Estimated gender of the adult social care workforce by selected job roles, 2016/17
4.3. Age Chart 39 below shows the age distribution of the adult social care workforce alongside the economically active population in England. The age profile of the adult social care workforce was skewed towards the older age bands, with eight percent more workers aged 45 and over compared to the economically active population. Chart 39. Estimated age distribution of the adult social care workforce and the economically active population Source. NMDS-SC workforce estimates 2016/2017 and Labour Force Survey 2016
The following chart shows the estimated age bands and average age of workers by selected job roles. In the adult social care sector the average age of a worker was 43 years old. From a workforce planning point of view, workers aged 55 and over could retire within the next ten years. This age category accounted for almost a quarter of the workforce (23%, 305,000 jobs). As you would expect, care workers had a slightly younger age profile, with 13% being under 25 compared to less than one to two percent for regulated professional roles. A third (33%) of registered nurses were aged 55 or over, with an average age of 48.
18%
33%
17%
20%
10%
14%
15%
16%
25%
82%
67%
83%
80%
90%
86%
85%
84%
75%
0% 20% 40% 60% 80% 100%
All job roles
Senior management
Registered manager
Social worker
Occupational therapist
Registered nurse
Senior care worker
Care worker
Support and outreach
Male Female
10%
13%
11%
12%
30%
33%
38%
33%
7%
6%
4%
4%
0% 20% 40% 60% 80% 100%
Adult social care
Economically active
Under 25 25 to 29 30 to 44 45 to 59 60 to 64 65 and over
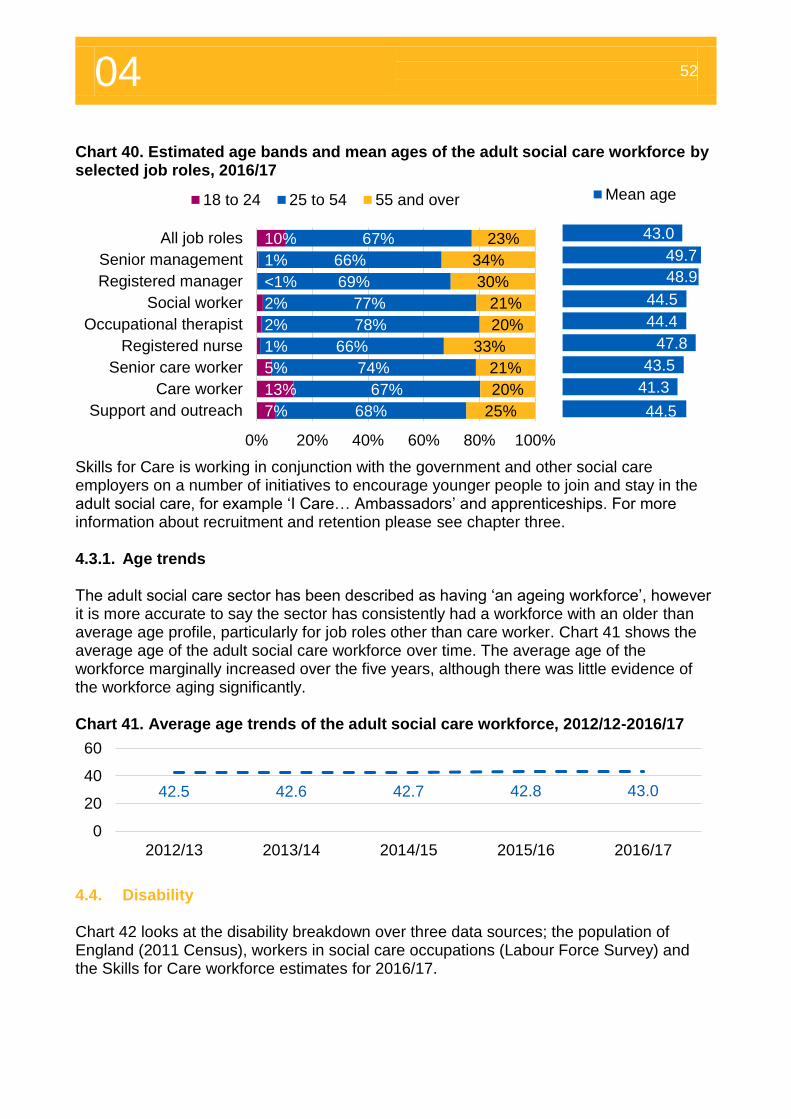
04 52
Chart 40. Estimated age bands and mean ages of the adult social care workforce by selected job roles, 2016/17
Skills for Care is working in conjunction with the government and other social care employers on a number of initiatives to encourage younger people to join and stay in the adult social care, for example ‘I Care… Ambassadors’ and apprenticeships. For more information about recruitment and retention please see chapter three. 4.3.1. Age trends The adult social care sector has been described as having ‘an ageing workforce’, however it is more accurate to say the sector has consistently had a workforce with an older than average age profile, particularly for job roles other than care worker. Chart 41 shows the average age of the adult social care workforce over time. The average age of the workforce marginally increased over the five years, although there was little evidence of the workforce aging significantly. Chart 41. Average age trends of the adult social care workforce, 2012/12-2016/17
4.4. Disability Chart 42 looks at the disability breakdown over three data sources; the population of England (2011 Census), workers in social care occupations (Labour Force Survey) and the Skills for Care workforce estimates for 2016/17.
10%
1%
<1%
2%
2%
1%
5%
13%
7%
67%
66%
69%
77%
78%
66%
74%
67%
68%
23%
34%
30%
21%
20%
33%
21%
20%
25%
0% 20% 40% 60% 80% 100%
All job roles
Senior management
Registered manager
Social worker
Occupational therapist
Registered nurse
Senior care worker
Care worker
Support and outreach
18 to 24 25 to 54 55 and over
42.5 42.6 42.7 42.8 43.0
0
20
40
60
2012/13 2013/14 2014/15 2015/16 2016/17
43.0
49.7
48.9
44.5
44.4
47.8
43.5
41.3
44.5
Mean age
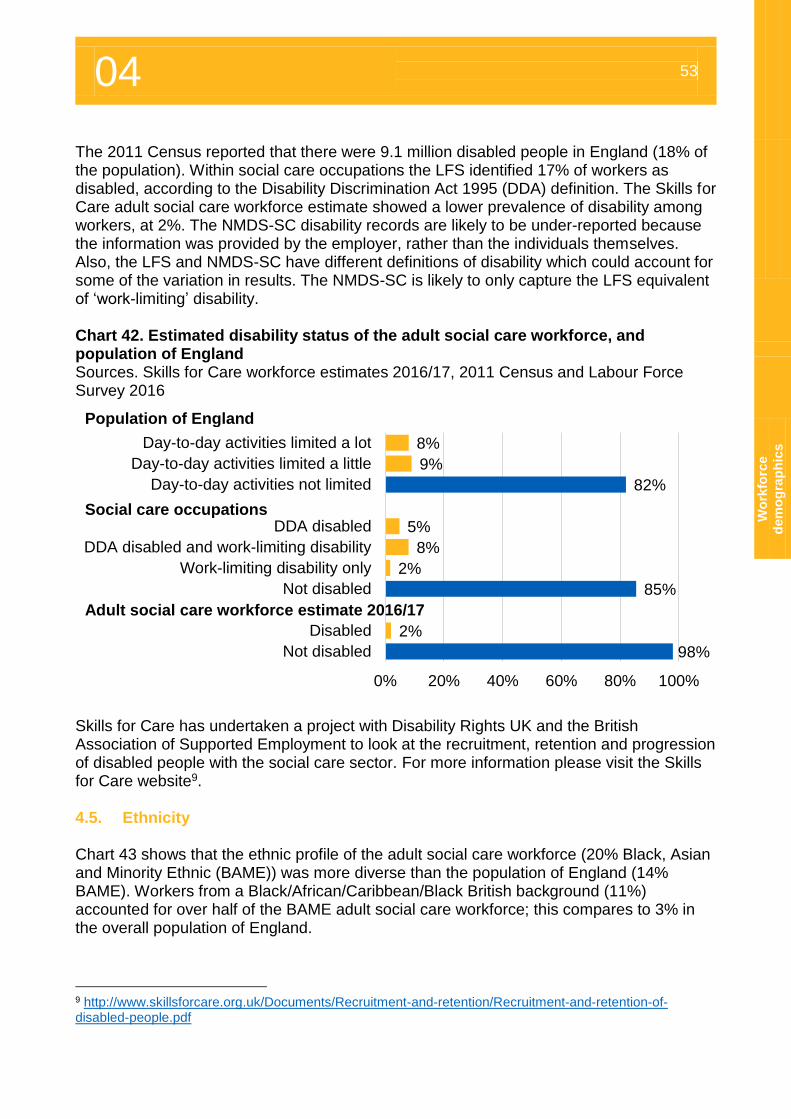
04 53
Wo
rkfo
rce
dem
og
rap
hic
s
The 2011 Census reported that there were 9.1 million disabled people in England (18% of the population). Within social care occupations the LFS identified 17% of workers as disabled, according to the Disability Discrimination Act 1995 (DDA) definition. The Skills for Care adult social care workforce estimate showed a lower prevalence of disability among workers, at 2%. The NMDS-SC disability records are likely to be under-reported because the information was provided by the employer, rather than the individuals themselves. Also, the LFS and NMDS-SC have different definitions of disability which could account for some of the variation in results. The NMDS-SC is likely to only capture the LFS equivalent of ‘work-limiting’ disability. Chart 42. Estimated disability status of the adult social care workforce, and population of England Sources. Skills for Care workforce estimates 2016/17, 2011 Census and Labour Force Survey 2016
Skills for Care has undertaken a project with Disability Rights UK and the British Association of Supported Employment to look at the recruitment, retention and progression of disabled people with the social care sector. For more information please visit the Skills for Care website9. 4.5. Ethnicity Chart 43 shows that the ethnic profile of the adult social care workforce (20% Black, Asian and Minority Ethnic (BAME)) was more diverse than the population of England (14% BAME). Workers from a Black/African/Caribbean/Black British background (11%) accounted for over half of the BAME adult social care workforce; this compares to 3% in the overall population of England.
9 http://www.skillsforcare.org.uk/Documents/Recruitment-and-retention/Recruitment-and-retention-of-disabled-people.pdf
8%
9%
82%
5%
8%
2%
85%
2%
98%
0% 20% 40% 60% 80% 100%
Day-to-day activities limited a lot
Day-to-day activities limited a little
Day-to-day activities not limited
DDA disabled
DDA disabled and work-limiting disability
Work-limiting disability only
Not disabled
Disabled
Not disabled
Population of England
Adult social care workforce estimate 2016/17
Social care occupations
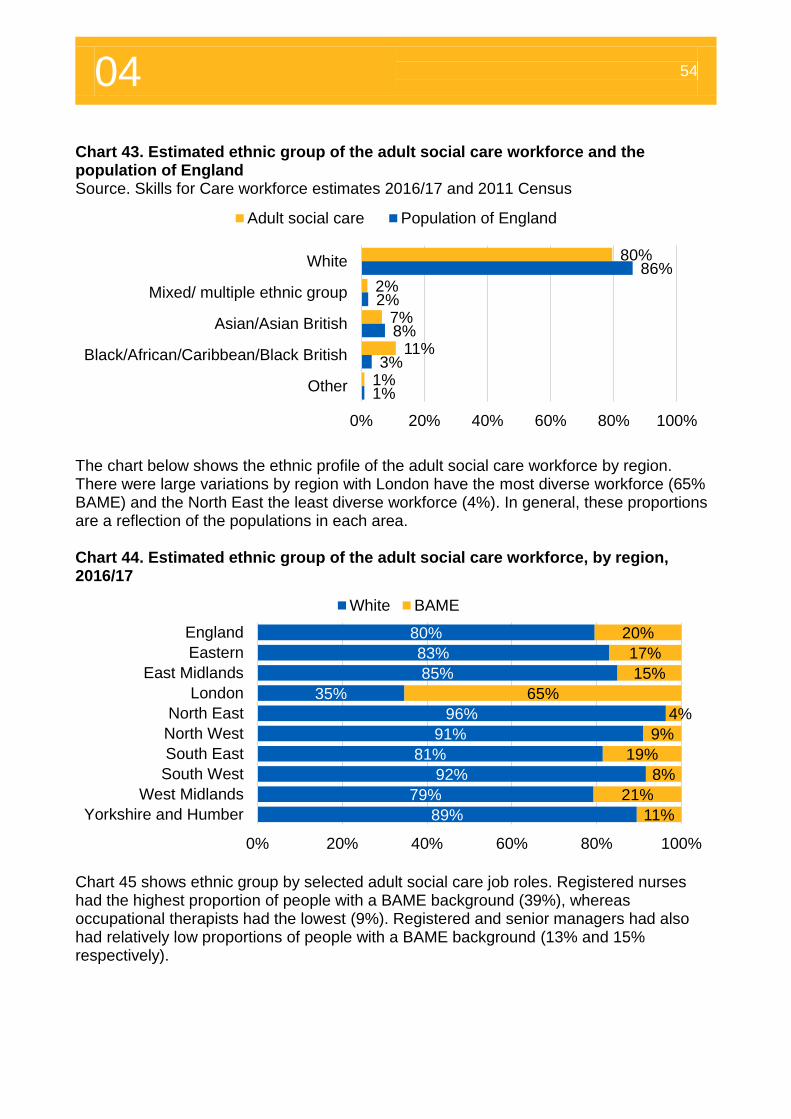
04 54
Chart 43. Estimated ethnic group of the adult social care workforce and the population of England Source. Skills for Care workforce estimates 2016/17 and 2011 Census
The chart below shows the ethnic profile of the adult social care workforce by region. There were large variations by region with London have the most diverse workforce (65% BAME) and the North East the least diverse workforce (4%). In general, these proportions are a reflection of the populations in each area. Chart 44. Estimated ethnic group of the adult social care workforce, by region, 2016/17
Chart 45 shows ethnic group by selected adult social care job roles. Registered nurses had the highest proportion of people with a BAME background (39%), whereas occupational therapists had the lowest (9%). Registered and senior managers had also had relatively low proportions of people with a BAME background (13% and 15% respectively).
80%
2%
7%
11%
1%
86%
2%
8%
3%
1%
0% 20% 40% 60% 80% 100%
White
Mixed/ multiple ethnic group
Asian/Asian British
Black/African/Caribbean/Black British
Other
Adult social care Population of England
80%
83%
85%
35%
96%
91%
81%
92%
79%
89%
20%
17%
15%
65%
4%
9%
19%
8%
21%
11%
0% 20% 40% 60% 80% 100%
England
Eastern
East Midlands
London
North East
North West
South East
South West
West Midlands
Yorkshire and Humber
White BAME
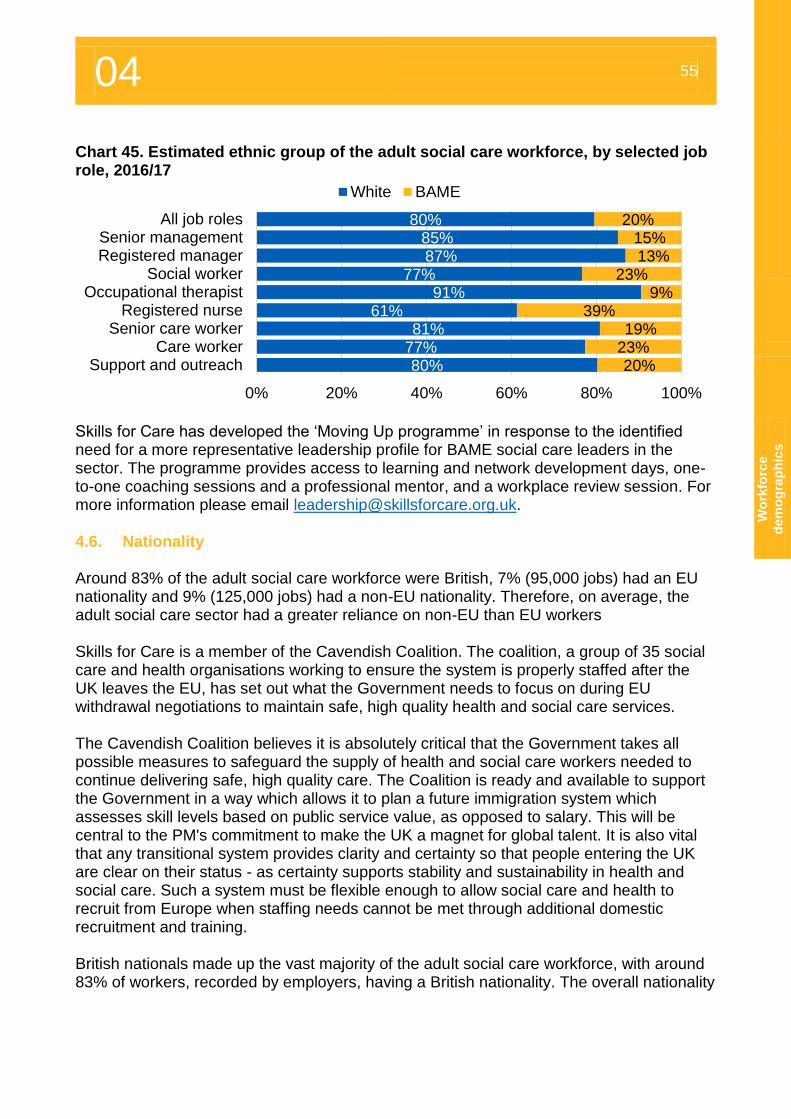
04 55
Wo
rkfo
rce
dem
og
rap
hic
s
Chart 45. Estimated ethnic group of the adult social care workforce, by selected job role, 2016/17
Skills for Care has developed the ‘Moving Up programme’ in response to the identified need for a more representative leadership profile for BAME social care leaders in the sector. The programme provides access to learning and network development days, one-to-one coaching sessions and a professional mentor, and a workplace review session. For more information please email [email protected]. 4.6. Nationality Around 83% of the adult social care workforce were British, 7% (95,000 jobs) had an EU nationality and 9% (125,000 jobs) had a non-EU nationality. Therefore, on average, the adult social care sector had a greater reliance on non-EU than EU workers Skills for Care is a member of the Cavendish Coalition. The coalition, a group of 35 social care and health organisations working to ensure the system is properly staffed after the UK leaves the EU, has set out what the Government needs to focus on during EU withdrawal negotiations to maintain safe, high quality health and social care services. The Cavendish Coalition believes it is absolutely critical that the Government takes all possible measures to safeguard the supply of health and social care workers needed to continue delivering safe, high quality care. The Coalition is ready and available to support the Government in a way which allows it to plan a future immigration system which assesses skill levels based on public service value, as opposed to salary. This will be central to the PM's commitment to make the UK a magnet for global talent. It is also vital that any transitional system provides clarity and certainty so that people entering the UK are clear on their status - as certainty supports stability and sustainability in health and social care. Such a system must be flexible enough to allow social care and health to recruit from Europe when staffing needs cannot be met through additional domestic recruitment and training. British nationals made up the vast majority of the adult social care workforce, with around 83% of workers, recorded by employers, having a British nationality. The overall nationality
80%85%87%
77%91%
61%81%
77%80%
20%15%13%
23%9%
39%19%
23%20%
0% 20% 40% 60% 80% 100%
All job rolesSenior managementRegistered manager
Social workerOccupational therapist
Registered nurseSenior care worker
Care workerSupport and outreach
White BAME
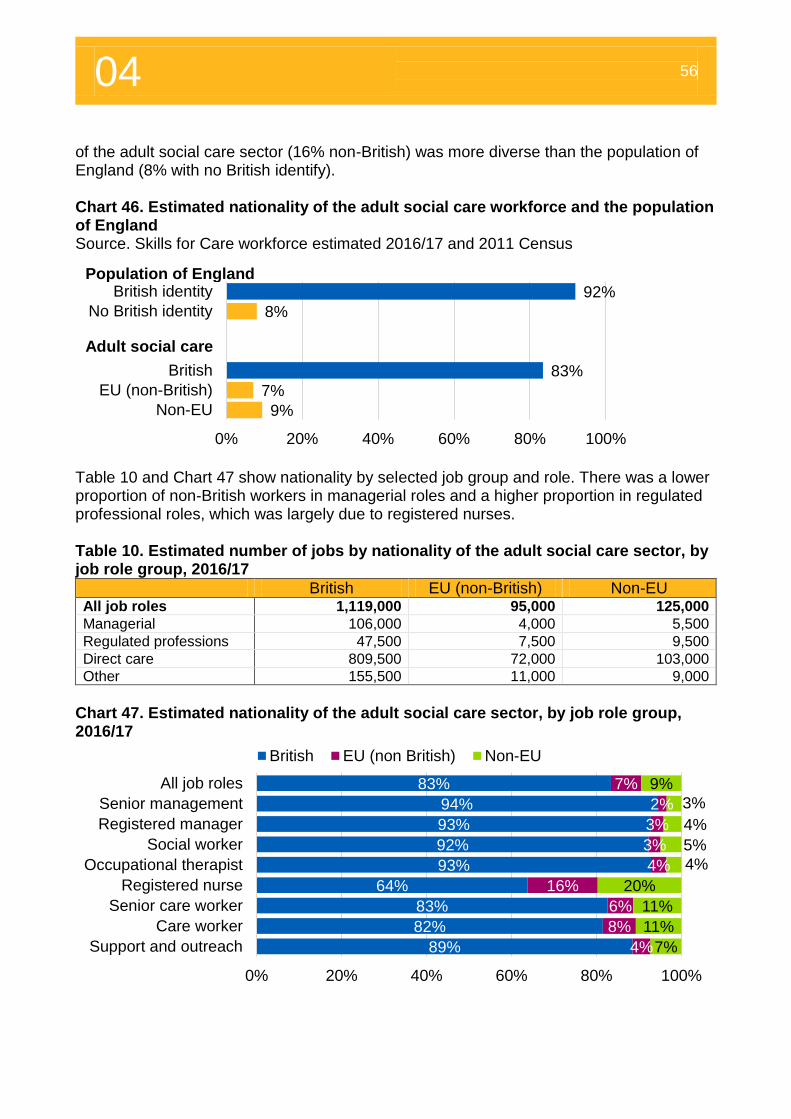
04 56
of the adult social care sector (16% non-British) was more diverse than the population of England (8% with no British identify). Chart 46. Estimated nationality of the adult social care workforce and the population of England Source. Skills for Care workforce estimated 2016/17 and 2011 Census
Table 10 and Chart 47 show nationality by selected job group and role. There was a lower proportion of non-British workers in managerial roles and a higher proportion in regulated professional roles, which was largely due to registered nurses. Table 10. Estimated number of jobs by nationality of the adult social care sector, by job role group, 2016/17
British EU (non-British) Non-EU All job roles 1,119,000 95,000 125,000
Managerial 106,000 4,000 5,500
Regulated professions 47,500 7,500 9,500
Direct care 809,500 72,000 103,000
Other 155,500 11,000 9,000
Chart 47. Estimated nationality of the adult social care sector, by job role group, 2016/17
92%
8%
83%
7%
9%
0% 20% 40% 60% 80% 100%
British identity
No British identity
British
EU (non-British)
Non-EU
83%
94%
93%
92%
93%
64%
83%
82%
89%
7%
2%
3%
3%
4%
16%
6%
8%
4%
9%
3%
4%
5%
4%
20%
11%
11%
7%
0% 20% 40% 60% 80% 100%
All job roles
Senior management
Registered manager
Social worker
Occupational therapist
Registered nurse
Senior care worker
Care worker
Support and outreach
British EU (non British) Non-EU
Population of England
Adult social care
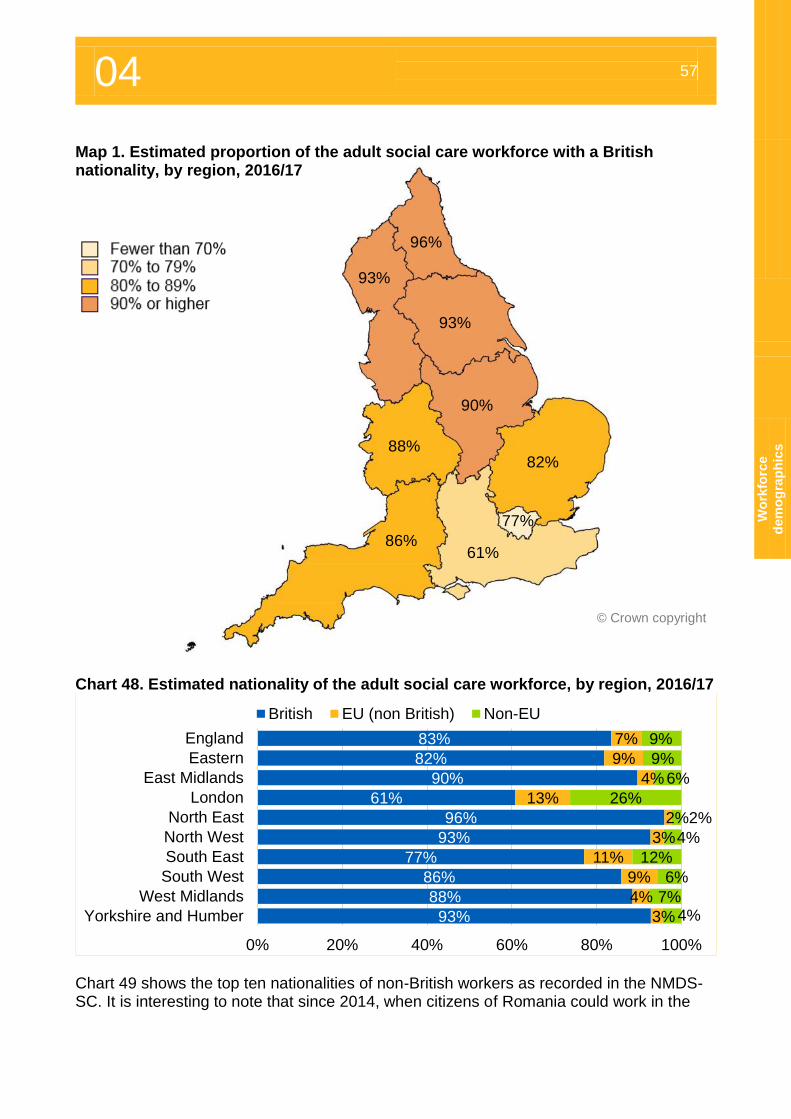
04 57
Wo
rkfo
rce
dem
og
rap
hic
s
Map 1. Estimated proportion of the adult social care workforce with a British nationality, by region, 2016/17
Chart 48. Estimated nationality of the adult social care workforce, by region, 2016/17
Chart 49 shows the top ten nationalities of non-British workers as recorded in the NMDS-SC. It is interesting to note that since 2014, when citizens of Romania could work in the
83%
82%
90%
61%
96%
93%
77%
86%
88%
93%
7%
9%
4%
13%
2%
3%
11%
9%
4%
3%
9%
9%
6%
26%
2%
4%
12%
6%
7%4%
0% 20% 40% 60% 80% 100%
England
Eastern
East Midlands
London
North East
North West
South East
South West
West Midlands
Yorkshire and Humber
British EU (non British) Non-EU
© Crown copyright
61%
77%
86%
88%
93%
93%
96%
90%
82%
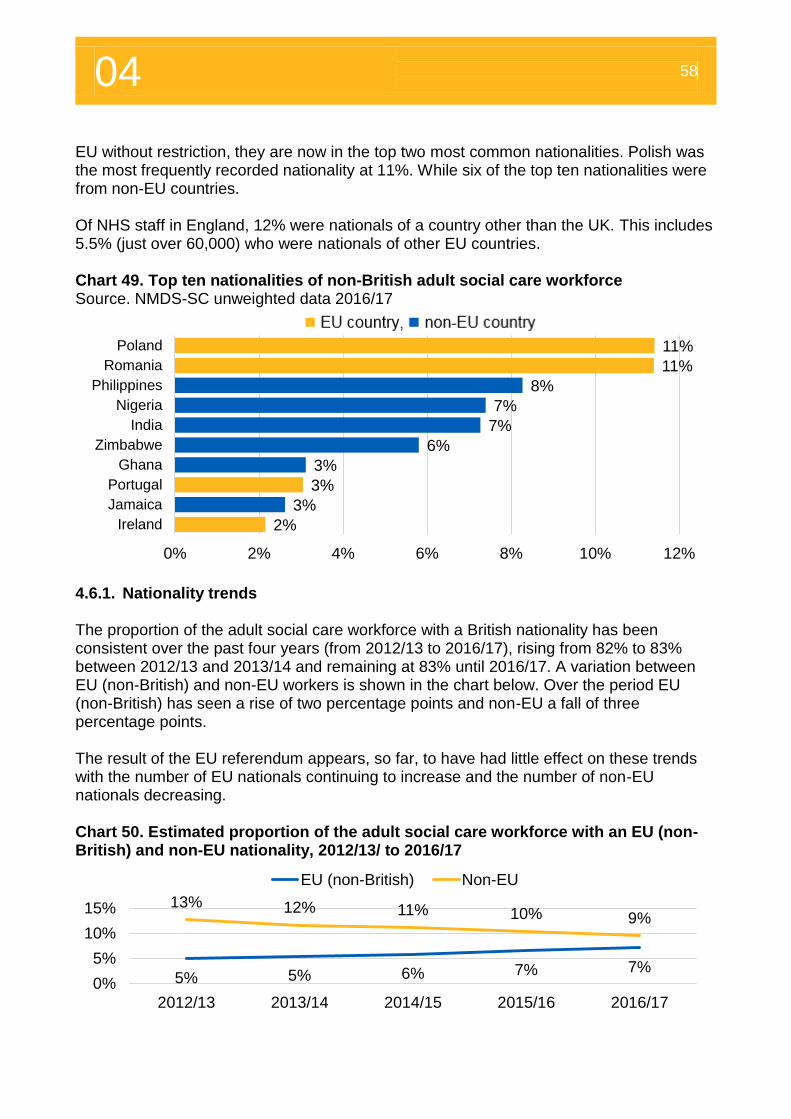
04 58
EU without restriction, they are now in the top two most common nationalities. Polish was the most frequently recorded nationality at 11%. While six of the top ten nationalities were from non-EU countries. Of NHS staff in England, 12% were nationals of a country other than the UK. This includes 5.5% (just over 60,000) who were nationals of other EU countries. Chart 49. Top ten nationalities of non-British adult social care workforce Source. NMDS-SC unweighted data 2016/17
4.6.1. Nationality trends The proportion of the adult social care workforce with a British nationality has been consistent over the past four years (from 2012/13 to 2016/17), rising from 82% to 83% between 2012/13 and 2013/14 and remaining at 83% until 2016/17. A variation between EU (non-British) and non-EU workers is shown in the chart below. Over the period EU (non-British) has seen a rise of two percentage points and non-EU a fall of three percentage points. The result of the EU referendum appears, so far, to have had little effect on these trends with the number of EU nationals continuing to increase and the number of non-EU nationals decreasing. Chart 50. Estimated proportion of the adult social care workforce with an EU (non-British) and non-EU nationality, 2012/13/ to 2016/17
11%
11%
8%
7%
7%
6%
3%
3%
3%
2%
0% 2% 4% 6% 8% 10% 12%
Poland
Romania
Philippines
Nigeria
India
Zimbabwe
Ghana
Portugal
Jamaica
Ireland
5% 5% 6% 7% 7%
13% 12% 11% 10% 9%
0%
5%
10%
15%
2012/13 2013/14 2014/15 2015/16 2016/17
EU (non-British) Non-EU
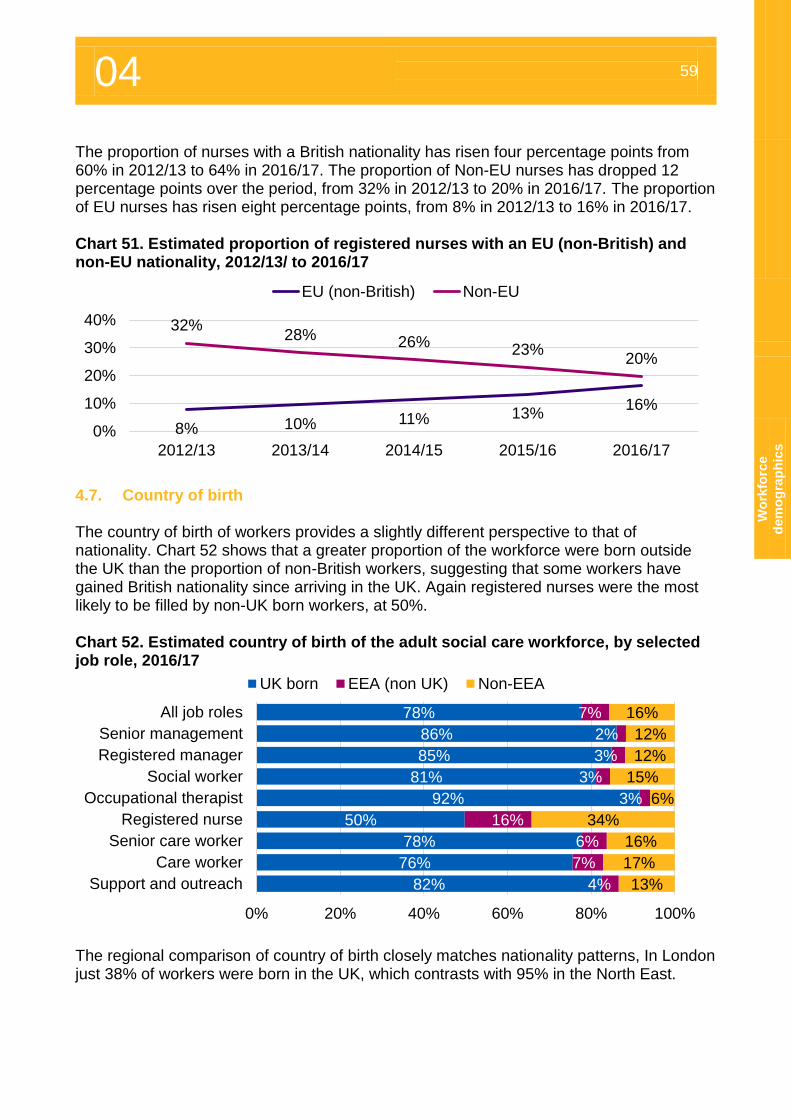
04 59
Wo
rkfo
rce
dem
og
rap
hic
s
The proportion of nurses with a British nationality has risen four percentage points from 60% in 2012/13 to 64% in 2016/17. The proportion of Non-EU nurses has dropped 12 percentage points over the period, from 32% in 2012/13 to 20% in 2016/17. The proportion of EU nurses has risen eight percentage points, from 8% in 2012/13 to 16% in 2016/17. Chart 51. Estimated proportion of registered nurses with an EU (non-British) and non-EU nationality, 2012/13/ to 2016/17
4.7. Country of birth The country of birth of workers provides a slightly different perspective to that of nationality. Chart 52 shows that a greater proportion of the workforce were born outside the UK than the proportion of non-British workers, suggesting that some workers have gained British nationality since arriving in the UK. Again registered nurses were the most likely to be filled by non-UK born workers, at 50%. Chart 52. Estimated country of birth of the adult social care workforce, by selected job role, 2016/17
The regional comparison of country of birth closely matches nationality patterns, In London just 38% of workers were born in the UK, which contrasts with 95% in the North East.
8% 10% 11% 13%16%
32%28% 26%
23%20%
0%
10%
20%
30%
40%
2012/13 2013/14 2014/15 2015/16 2016/17
EU (non-British) Non-EU
78%
86%
85%
81%
92%
50%
78%
76%
82%
7%
2%
3%
3%
3%
16%
6%
7%
4%
16%
12%
12%
15%
6%
34%
16%
17%
13%
0% 20% 40% 60% 80% 100%
All job roles
Senior management
Registered manager
Social worker
Occupational therapist
Registered nurse
Senior care worker
Care worker
Support and outreach
UK born EEA (non UK) Non-EEA
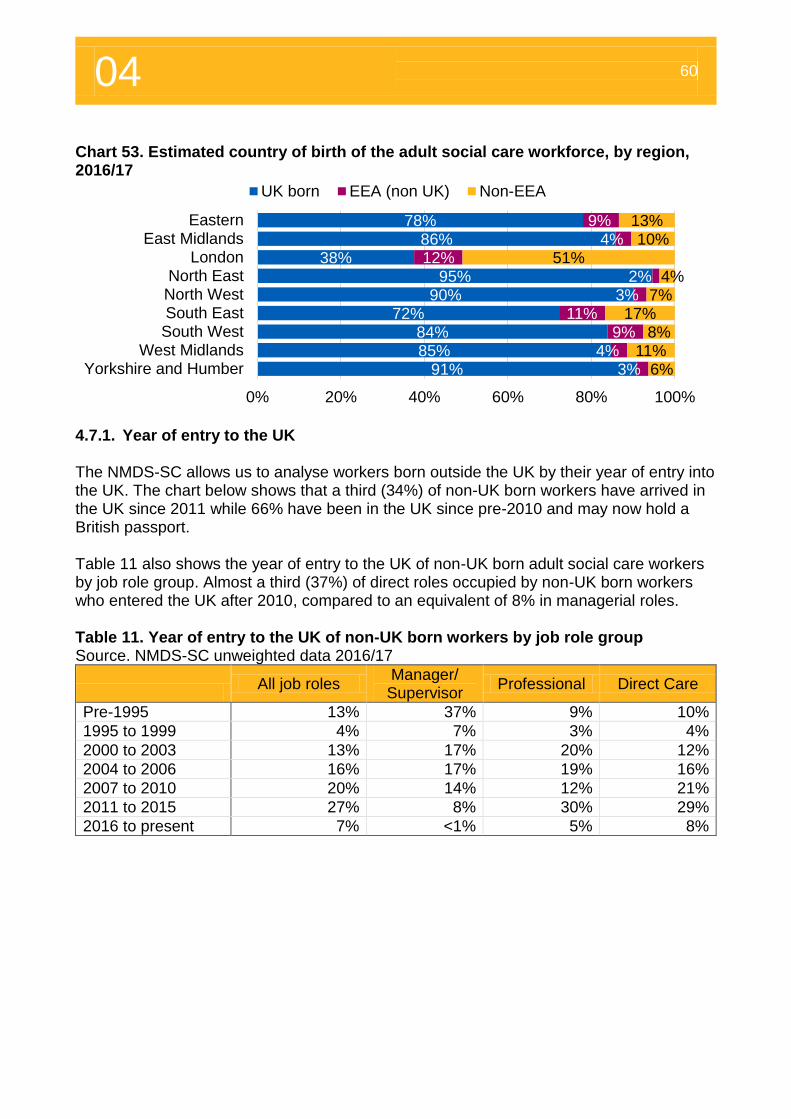
04 60
Chart 53. Estimated country of birth of the adult social care workforce, by region, 2016/17
4.7.1. Year of entry to the UK The NMDS-SC allows us to analyse workers born outside the UK by their year of entry into the UK. The chart below shows that a third (34%) of non-UK born workers have arrived in the UK since 2011 while 66% have been in the UK since pre-2010 and may now hold a British passport. Table 11 also shows the year of entry to the UK of non-UK born adult social care workers by job role group. Almost a third (37%) of direct roles occupied by non-UK born workers who entered the UK after 2010, compared to an equivalent of 8% in managerial roles. Table 11. Year of entry to the UK of non-UK born workers by job role group Source. NMDS-SC unweighted data 2016/17
All job roles
Manager/ Supervisor
Professional Direct Care
Pre-1995 13% 37% 9% 10%
1995 to 1999 4% 7% 3% 4%
2000 to 2003 13% 17% 20% 12%
2004 to 2006 16% 17% 19% 16%
2007 to 2010 20% 14% 12% 21%
2011 to 2015 27% 8% 30% 29%
2016 to present 7% <1% 5% 8%
78%86%
38%95%
90%72%
84%85%
91%
9%4%
12%2%
3%11%
9%4%
3%
13%10%
51%4%
7%17%
8%11%
6%
0% 20% 40% 60% 80% 100%
EasternEast Midlands
LondonNorth East
North WestSouth EastSouth West
West MidlandsYorkshire and Humber
UK born EEA (non UK) Non-EEA

Pay, qualifications and training
05
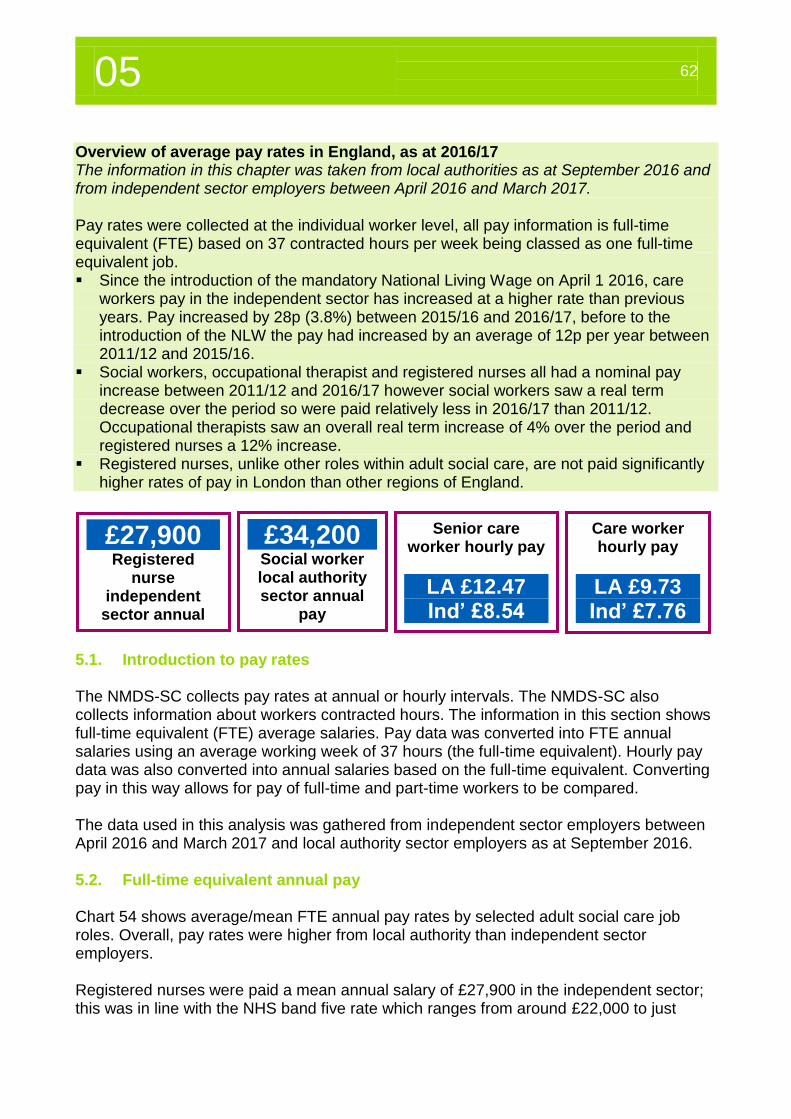
05 62
Overview of average pay rates in England, as at 2016/17 The information in this chapter was taken from local authorities as at September 2016 and from independent sector employers between April 2016 and March 2017. Pay rates were collected at the individual worker level, all pay information is full-time equivalent (FTE) based on 37 contracted hours per week being classed as one full-time equivalent job. Since the introduction of the mandatory National Living Wage on April 1 2016, care
workers pay in the independent sector has increased at a higher rate than previous years. Pay increased by 28p (3.8%) between 2015/16 and 2016/17, before to the introduction of the NLW the pay had increased by an average of 12p per year between 2011/12 and 2015/16.
Social workers, occupational therapist and registered nurses all had a nominal pay increase between 2011/12 and 2016/17 however social workers saw a real term decrease over the period so were paid relatively less in 2016/17 than 2011/12. Occupational therapists saw an overall real term increase of 4% over the period and registered nurses a 12% increase.
Registered nurses, unlike other roles within adult social care, are not paid significantly higher rates of pay in London than other regions of England.
5. Pay rates
5.1. Introduction to pay rates The NMDS-SC collects pay rates at annual or hourly intervals. The NMDS-SC also collects information about workers contracted hours. The information in this section shows full-time equivalent (FTE) average salaries. Pay data was converted into FTE annual salaries using an average working week of 37 hours (the full-time equivalent). Hourly pay data was also converted into annual salaries based on the full-time equivalent. Converting pay in this way allows for pay of full-time and part-time workers to be compared. The data used in this analysis was gathered from independent sector employers between April 2016 and March 2017 and local authority sector employers as at September 2016. 5.2. Full-time equivalent annual pay Chart 54 shows average/mean FTE annual pay rates by selected adult social care job roles. Overall, pay rates were higher from local authority than independent sector employers. Registered nurses were paid a mean annual salary of £27,900 in the independent sector; this was in line with the NHS band five rate which ranges from around £22,000 to just
£27,900 Registered
nurse independent
sector annual pay
£34,200 Social worker local authority sector annual
pay
Senior care worker hourly pay
LA £12.47 Ind’ £8.54
Care worker hourly pay
LA £9.73 Ind’ £7.76
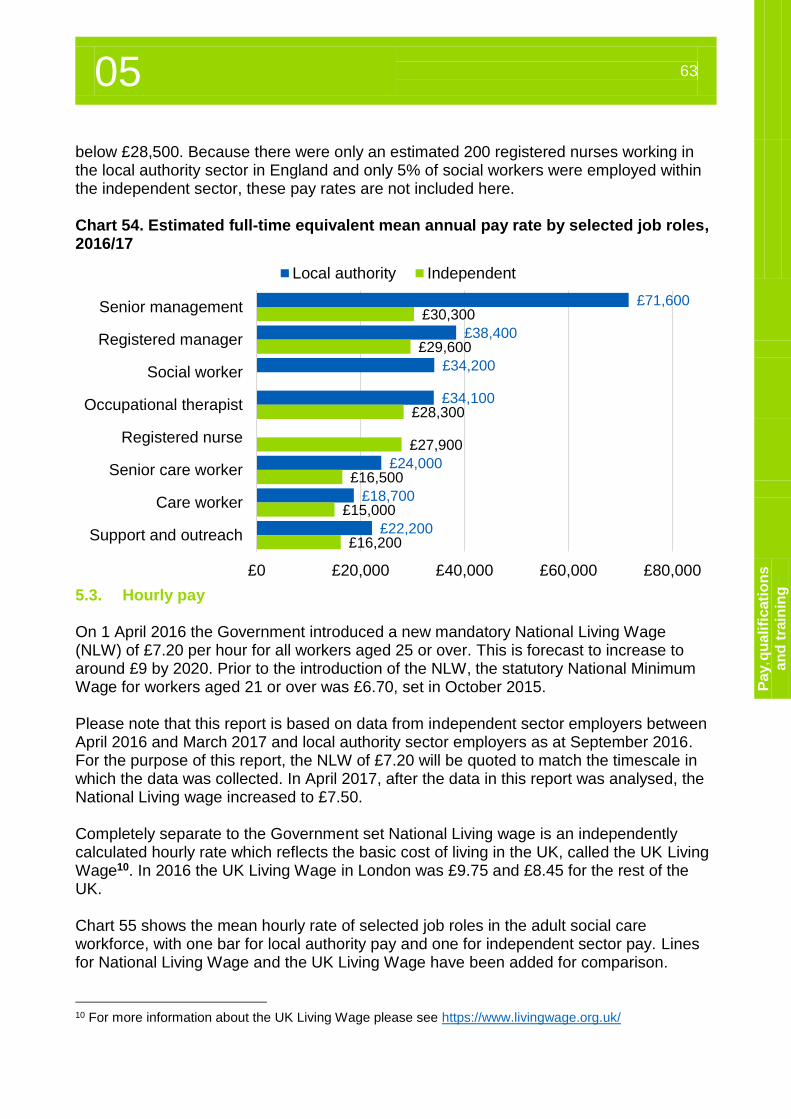
05 63
Pa
y, q
ua
lifi
cati
on
s
an
d t
rain
ing
below £28,500. Because there were only an estimated 200 registered nurses working in the local authority sector in England and only 5% of social workers were employed within the independent sector, these pay rates are not included here. Chart 54. Estimated full-time equivalent mean annual pay rate by selected job roles, 2016/17
5.3. Hourly pay On 1 April 2016 the Government introduced a new mandatory National Living Wage (NLW) of £7.20 per hour for all workers aged 25 or over. This is forecast to increase to around £9 by 2020. Prior to the introduction of the NLW, the statutory National Minimum Wage for workers aged 21 or over was £6.70, set in October 2015. Please note that this report is based on data from independent sector employers between April 2016 and March 2017 and local authority sector employers as at September 2016. For the purpose of this report, the NLW of £7.20 will be quoted to match the timescale in which the data was collected. In April 2017, after the data in this report was analysed, the National Living wage increased to £7.50. Completely separate to the Government set National Living wage is an independently calculated hourly rate which reflects the basic cost of living in the UK, called the UK Living Wage10. In 2016 the UK Living Wage in London was £9.75 and £8.45 for the rest of the UK. Chart 55 shows the mean hourly rate of selected job roles in the adult social care workforce, with one bar for local authority pay and one for independent sector pay. Lines for National Living Wage and the UK Living Wage have been added for comparison.
10 For more information about the UK Living Wage please see https://www.livingwage.org.uk/
£71,600
£38,400
£34,200
£34,100
£24,000
£18,700
£22,200
£30,300
£29,600
£28,300
£27,900
£16,500
£15,000
£16,200
£0 £20,000 £40,000 £60,000 £80,000
Senior management
Registered manager
Social worker
Occupational therapist
Registered nurse
Senior care worker
Care worker
Support and outreach
Local authority Independent
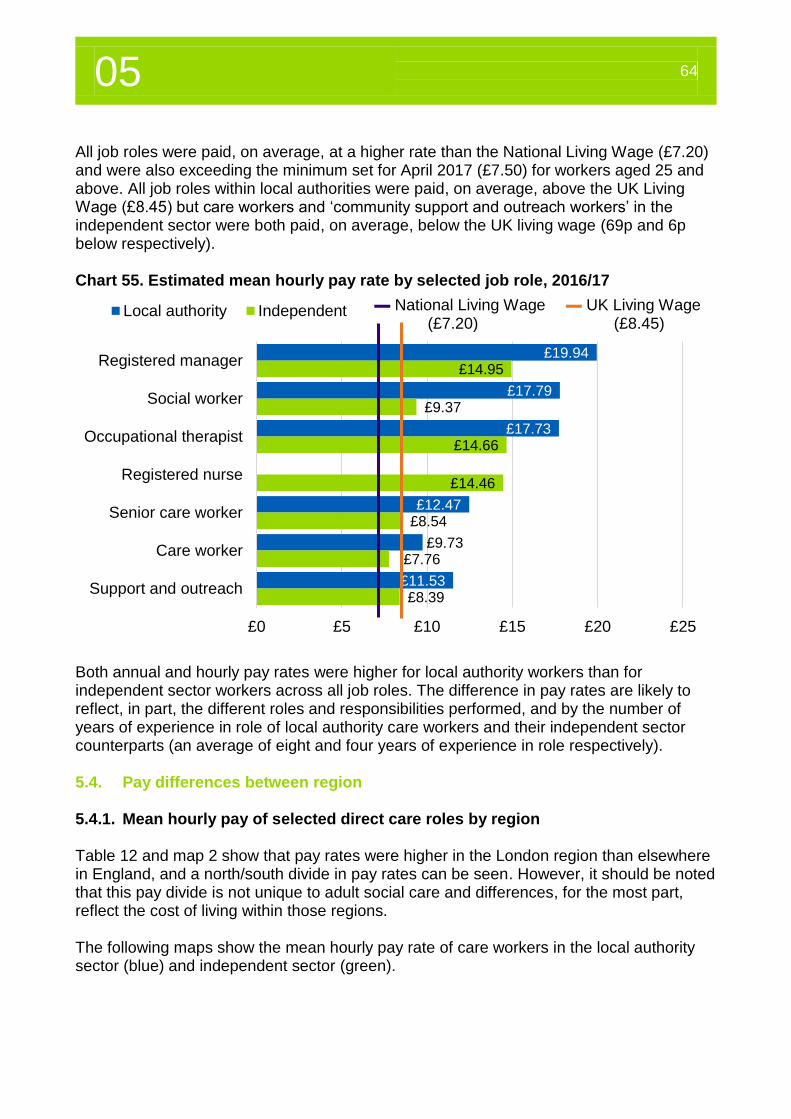
05 64
All job roles were paid, on average, at a higher rate than the National Living Wage (£7.20) and were also exceeding the minimum set for April 2017 (£7.50) for workers aged 25 and above. All job roles within local authorities were paid, on average, above the UK Living Wage (£8.45) but care workers and ‘community support and outreach workers’ in the independent sector were both paid, on average, below the UK living wage (69p and 6p below respectively). Chart 55. Estimated mean hourly pay rate by selected job role, 2016/17
Both annual and hourly pay rates were higher for local authority workers than for independent sector workers across all job roles. The difference in pay rates are likely to reflect, in part, the different roles and responsibilities performed, and by the number of years of experience in role of local authority care workers and their independent sector counterparts (an average of eight and four years of experience in role respectively). 5.4. Pay differences between region 5.4.1. Mean hourly pay of selected direct care roles by region Table 12 and map 2 show that pay rates were higher in the London region than elsewhere in England, and a north/south divide in pay rates can be seen. However, it should be noted that this pay divide is not unique to adult social care and differences, for the most part, reflect the cost of living within those regions. The following maps show the mean hourly pay rate of care workers in the local authority sector (blue) and independent sector (green).
£19.94
£17.79
£17.73
£12.47
£9.73
£11.53
£14.95
£9.37
£14.66
£14.46
£8.54
£7.76
£8.39
£0 £5 £10 £15 £20 £25
Registered manager
Social worker
Occupational therapist
Registered nurse
Senior care worker
Care worker
Support and outreach
Local authority Independent ▬ National Living Wage ▬ UK Living Wage (£7.20) (£8.45)
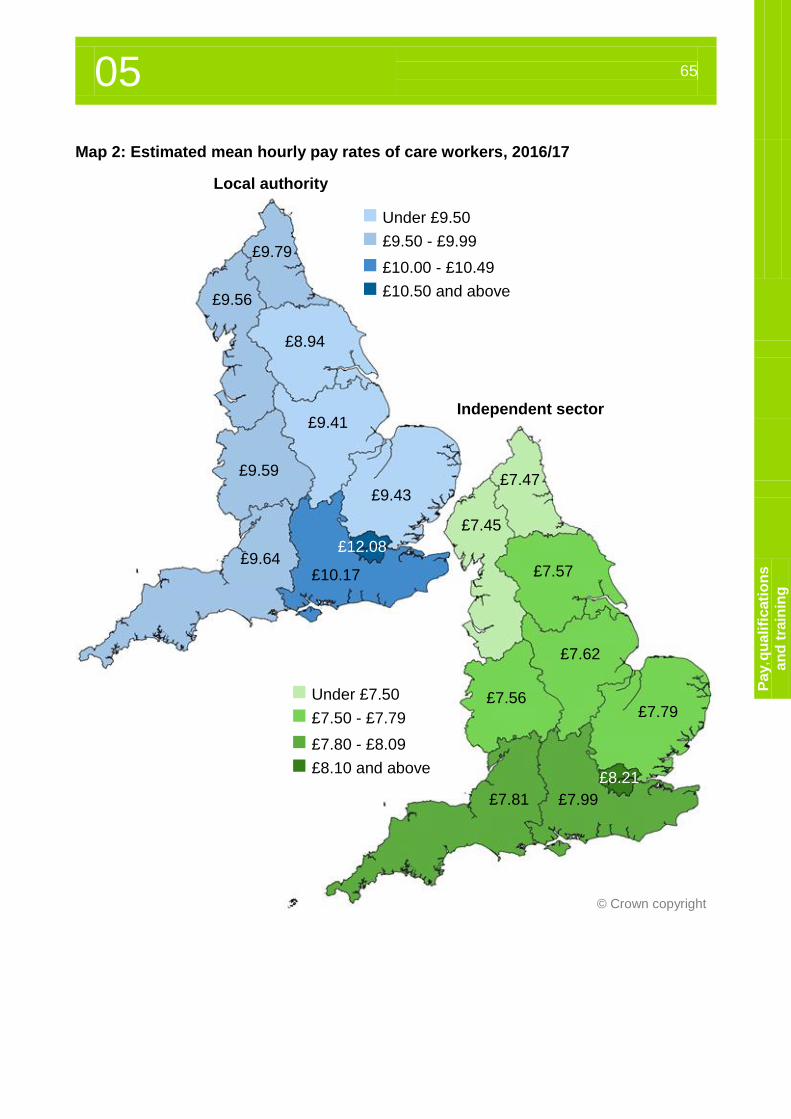
05 65
Pa
y, q
ua
lifi
cati
on
s
an
d t
rain
ing
Map 2: Estimated mean hourly pay rates of care workers, 2016/17
© Crown copyright
£7.47
£7.45
£7.57
£7.62
£7.56 £7.79
£8.21
£7.99 £7.81
£9.79
£9.56
£8.94
£9.41
£9.59
£9.43
£9.64 £10.17
£12.08
Under £9.50
£9.50 - £9.99
£10.00 - £10.49
£10.50 and above
Under £7.50
£7.50 - £7.79
£7.80 - £8.09
£8.10 and above
Local authority
Independent sector
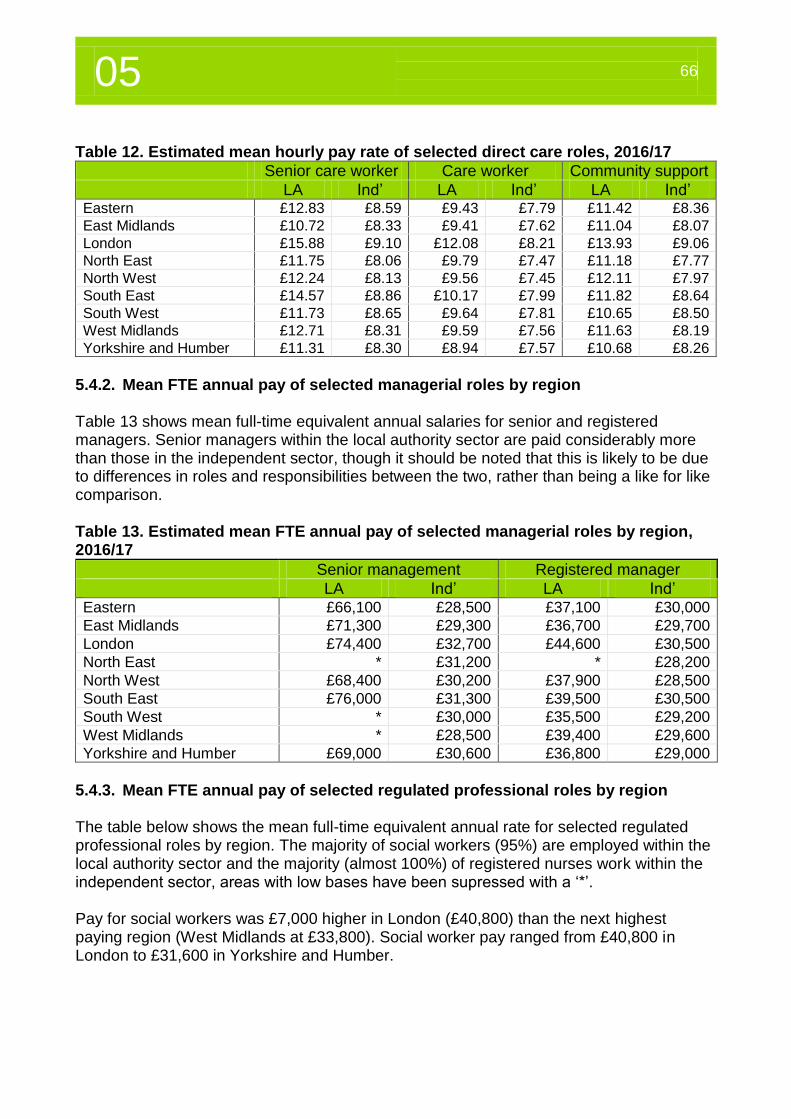
05 66
Table 12. Estimated mean hourly pay rate of selected direct care roles, 2016/17
Senior care worker Care worker Community support
LA Ind’ LA Ind’ LA Ind’ Eastern £12.83 £8.59 £9.43 £7.79 £11.42 £8.36
East Midlands £10.72 £8.33 £9.41 £7.62 £11.04 £8.07
London £15.88 £9.10 £12.08 £8.21 £13.93 £9.06
North East £11.75 £8.06 £9.79 £7.47 £11.18 £7.77
North West £12.24 £8.13 £9.56 £7.45 £12.11 £7.97
South East £14.57 £8.86 £10.17 £7.99 £11.82 £8.64
South West £11.73 £8.65 £9.64 £7.81 £10.65 £8.50
West Midlands £12.71 £8.31 £9.59 £7.56 £11.63 £8.19
Yorkshire and Humber £11.31 £8.30 £8.94 £7.57 £10.68 £8.26
5.4.2. Mean FTE annual pay of selected managerial roles by region Table 13 shows mean full-time equivalent annual salaries for senior and registered managers. Senior managers within the local authority sector are paid considerably more than those in the independent sector, though it should be noted that this is likely to be due to differences in roles and responsibilities between the two, rather than being a like for like comparison. Table 13. Estimated mean FTE annual pay of selected managerial roles by region, 2016/17
Senior management Registered manager
LA Ind’ LA Ind’ Eastern £66,100 £28,500 £37,100 £30,000
East Midlands £71,300 £29,300 £36,700 £29,700
London £74,400 £32,700 £44,600 £30,500
North East * £31,200 * £28,200
North West £68,400 £30,200 £37,900 £28,500
South East £76,000 £31,300 £39,500 £30,500
South West * £30,000 £35,500 £29,200
West Midlands * £28,500 £39,400 £29,600
Yorkshire and Humber £69,000 £30,600 £36,800 £29,000
5.4.3. Mean FTE annual pay of selected regulated professional roles by region The table below shows the mean full-time equivalent annual rate for selected regulated professional roles by region. The majority of social workers (95%) are employed within the local authority sector and the majority (almost 100%) of registered nurses work within the independent sector, areas with low bases have been supressed with a ‘*’. Pay for social workers was £7,000 higher in London (£40,800) than the next highest paying region (West Midlands at £33,800). Social worker pay ranged from £40,800 in London to £31,600 in Yorkshire and Humber.
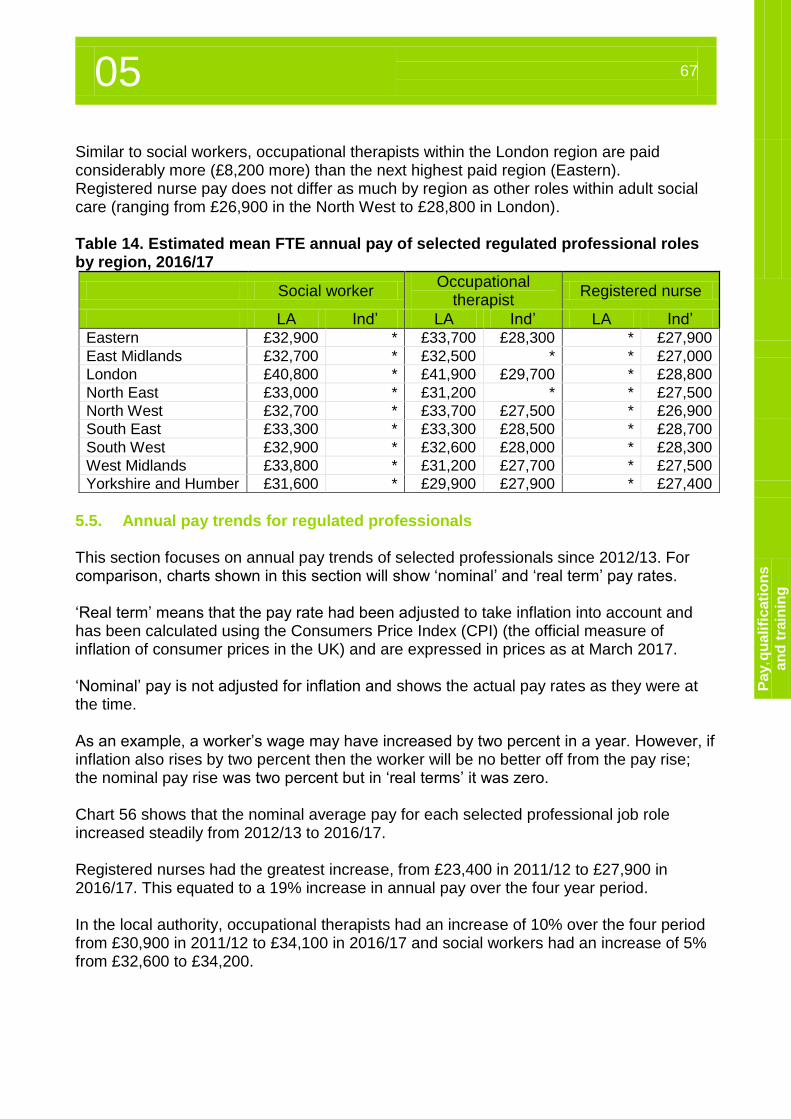
05 67
Pa
y, q
ua
lifi
cati
on
s
an
d t
rain
ing
Similar to social workers, occupational therapists within the London region are paid considerably more (£8,200 more) than the next highest paid region (Eastern). Registered nurse pay does not differ as much by region as other roles within adult social care (ranging from £26,900 in the North West to £28,800 in London). Table 14. Estimated mean FTE annual pay of selected regulated professional roles by region, 2016/17
Social worker Occupational
therapist Registered nurse
LA Ind’ LA Ind’ LA Ind’ Eastern £32,900 * £33,700 £28,300 * £27,900
East Midlands £32,700 * £32,500 * * £27,000
London £40,800 * £41,900 £29,700 * £28,800
North East £33,000 * £31,200 * * £27,500
North West £32,700 * £33,700 £27,500 * £26,900
South East £33,300 * £33,300 £28,500 * £28,700
South West £32,900 * £32,600 £28,000 * £28,300
West Midlands £33,800 * £31,200 £27,700 * £27,500
Yorkshire and Humber £31,600 * £29,900 £27,900 * £27,400
5.5. Annual pay trends for regulated professionals This section focuses on annual pay trends of selected professionals since 2012/13. For comparison, charts shown in this section will show ‘nominal’ and ‘real term’ pay rates. ‘Real term’ means that the pay rate had been adjusted to take inflation into account and has been calculated using the Consumers Price Index (CPI) (the official measure of inflation of consumer prices in the UK) and are expressed in prices as at March 2017. ‘Nominal’ pay is not adjusted for inflation and shows the actual pay rates as they were at the time. As an example, a worker’s wage may have increased by two percent in a year. However, if inflation also rises by two percent then the worker will be no better off from the pay rise; the nominal pay rise was two percent but in ‘real terms’ it was zero. Chart 56 shows that the nominal average pay for each selected professional job role increased steadily from 2012/13 to 2016/17. Registered nurses had the greatest increase, from £23,400 in 2011/12 to £27,900 in 2016/17. This equated to a 19% increase in annual pay over the four year period. In the local authority, occupational therapists had an increase of 10% over the four period from £30,900 in 2011/12 to £34,100 in 2016/17 and social workers had an increase of 5% from £32,600 to £34,200.
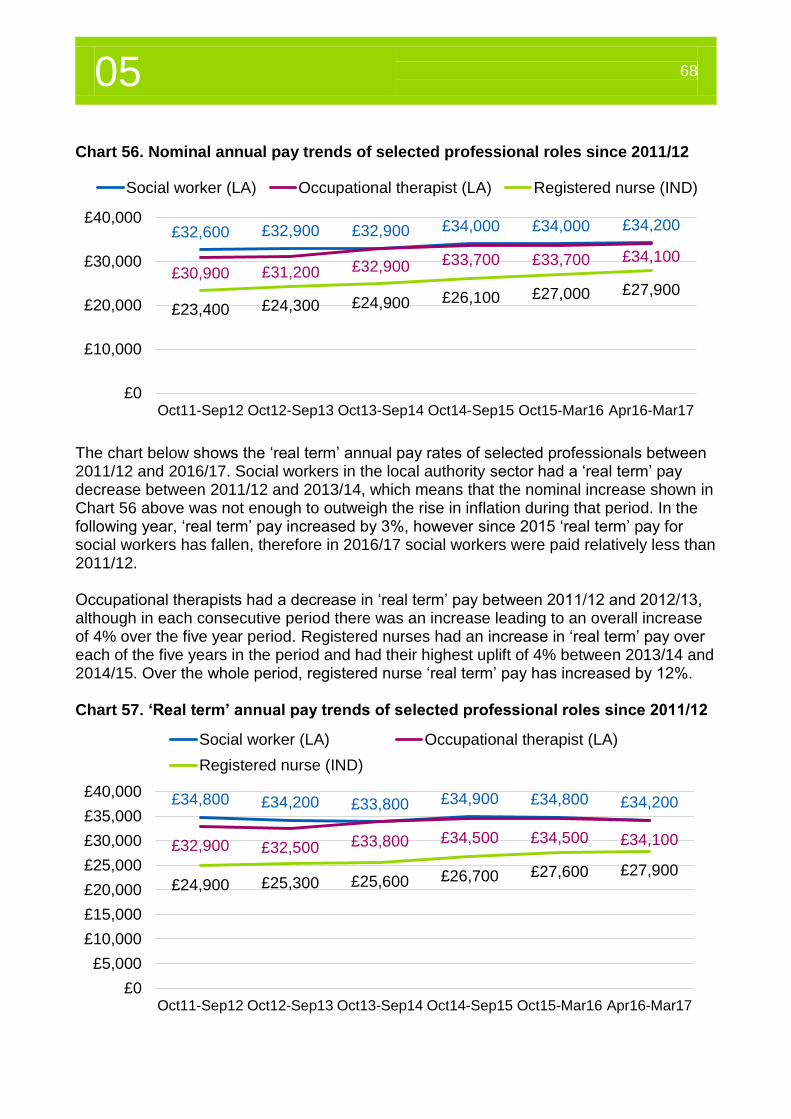
05 68
Chart 56. Nominal annual pay trends of selected professional roles since 2011/12
The chart below shows the ‘real term’ annual pay rates of selected professionals between 2011/12 and 2016/17. Social workers in the local authority sector had a ‘real term’ pay decrease between 2011/12 and 2013/14, which means that the nominal increase shown in Chart 56 above was not enough to outweigh the rise in inflation during that period. In the following year, ‘real term’ pay increased by 3%, however since 2015 ‘real term’ pay for social workers has fallen, therefore in 2016/17 social workers were paid relatively less than 2011/12. Occupational therapists had a decrease in ‘real term’ pay between 2011/12 and 2012/13, although in each consecutive period there was an increase leading to an overall increase of 4% over the five year period. Registered nurses had an increase in ‘real term’ pay over each of the five years in the period and had their highest uplift of 4% between 2013/14 and 2014/15. Over the whole period, registered nurse ‘real term’ pay has increased by 12%. Chart 57. ‘Real term’ annual pay trends of selected professional roles since 2011/12
£32,600 £32,900 £32,900 £34,000 £34,000 £34,200
£30,900 £31,200 £32,900 £33,700 £33,700 £34,100
£23,400 £24,300 £24,900 £26,100 £27,000 £27,900
£0
£10,000
£20,000
£30,000
£40,000
Oct11-Sep12 Oct12-Sep13 Oct13-Sep14 Oct14-Sep15 Oct15-Mar16 Apr16-Mar17
Social worker (LA) Occupational therapist (LA) Registered nurse (IND)
£34,800 £34,200 £33,800 £34,900 £34,800 £34,200
£32,900 £32,500 £33,800 £34,500 £34,500 £34,100
£24,900 £25,300 £25,600 £26,700 £27,600 £27,900
£0
£5,000
£10,000
£15,000
£20,000
£25,000
£30,000
£35,000
£40,000
Oct11-Sep12 Oct12-Sep13 Oct13-Sep14 Oct14-Sep15 Oct15-Mar16 Apr16-Mar17
Social worker (LA) Occupational therapist (LA)
Registered nurse (IND)
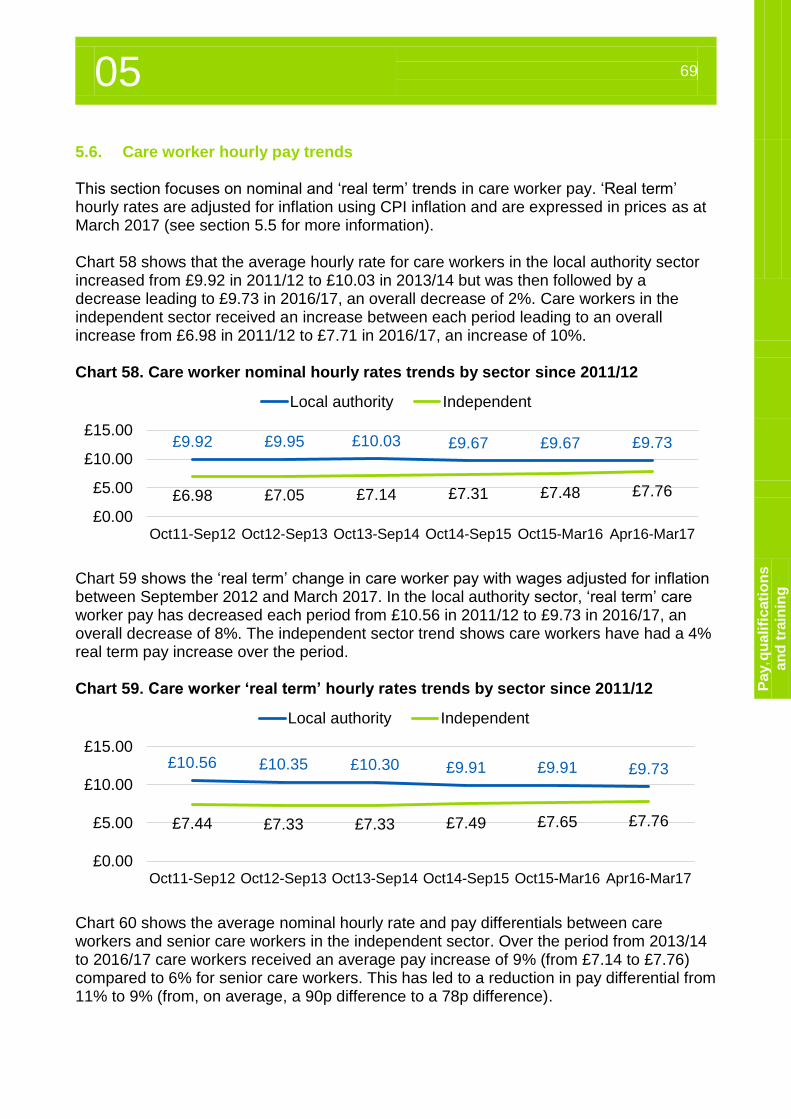
05 69
Pa
y, q
ua
lifi
cati
on
s
an
d t
rain
ing
5.6. Care worker hourly pay trends This section focuses on nominal and ‘real term’ trends in care worker pay. ‘Real term’ hourly rates are adjusted for inflation using CPI inflation and are expressed in prices as at March 2017 (see section 5.5 for more information). Chart 58 shows that the average hourly rate for care workers in the local authority sector increased from £9.92 in 2011/12 to £10.03 in 2013/14 but was then followed by a decrease leading to £9.73 in 2016/17, an overall decrease of 2%. Care workers in the independent sector received an increase between each period leading to an overall increase from £6.98 in 2011/12 to £7.71 in 2016/17, an increase of 10%. Chart 58. Care worker nominal hourly rates trends by sector since 2011/12
Chart 59 shows the ‘real term’ change in care worker pay with wages adjusted for inflation between September 2012 and March 2017. In the local authority sector, ‘real term’ care worker pay has decreased each period from £10.56 in 2011/12 to £9.73 in 2016/17, an overall decrease of 8%. The independent sector trend shows care workers have had a 4% real term pay increase over the period. Chart 59. Care worker ‘real term’ hourly rates trends by sector since 2011/12
Chart 60 shows the average nominal hourly rate and pay differentials between care workers and senior care workers in the independent sector. Over the period from 2013/14 to 2016/17 care workers received an average pay increase of 9% (from £7.14 to £7.76) compared to 6% for senior care workers. This has led to a reduction in pay differential from 11% to 9% (from, on average, a 90p difference to a 78p difference).
£9.92 £9.95 £10.03 £9.67 £9.67 £9.73
£6.98 £7.05 £7.14 £7.31 £7.48 £7.76
£0.00
£5.00
£10.00
£15.00
Oct11-Sep12 Oct12-Sep13 Oct13-Sep14 Oct14-Sep15 Oct15-Mar16 Apr16-Mar17
Local authority Independent
£10.56 £10.35 £10.30 £9.91 £9.91 £9.73
£7.44 £7.33 £7.33 £7.49 £7.65 £7.76
£0.00
£5.00
£10.00
£15.00
Oct11-Sep12 Oct12-Sep13 Oct13-Sep14 Oct14-Sep15 Oct15-Mar16 Apr16-Mar17
Local authority Independent
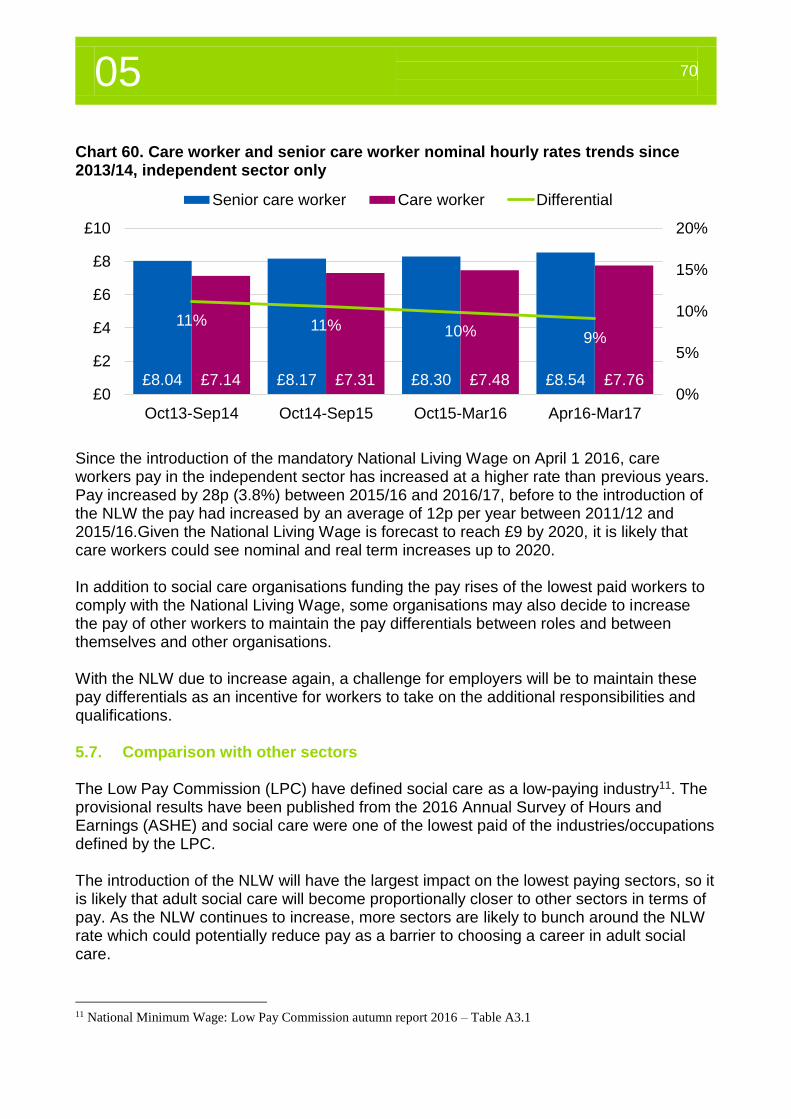
05 70
Chart 60. Care worker and senior care worker nominal hourly rates trends since 2013/14, independent sector only
Since the introduction of the mandatory National Living Wage on April 1 2016, care workers pay in the independent sector has increased at a higher rate than previous years. Pay increased by 28p (3.8%) between 2015/16 and 2016/17, before to the introduction of the NLW the pay had increased by an average of 12p per year between 2011/12 and 2015/16.Given the National Living Wage is forecast to reach £9 by 2020, it is likely that care workers could see nominal and real term increases up to 2020. In addition to social care organisations funding the pay rises of the lowest paid workers to comply with the National Living Wage, some organisations may also decide to increase the pay of other workers to maintain the pay differentials between roles and between themselves and other organisations. With the NLW due to increase again, a challenge for employers will be to maintain these pay differentials as an incentive for workers to take on the additional responsibilities and qualifications. 5.7. Comparison with other sectors The Low Pay Commission (LPC) have defined social care as a low-paying industry11. The provisional results have been published from the 2016 Annual Survey of Hours and Earnings (ASHE) and social care were one of the lowest paid of the industries/occupations defined by the LPC. The introduction of the NLW will have the largest impact on the lowest paying sectors, so it is likely that adult social care will become proportionally closer to other sectors in terms of pay. As the NLW continues to increase, more sectors are likely to bunch around the NLW rate which could potentially reduce pay as a barrier to choosing a career in adult social care.
11 National Minimum Wage: Low Pay Commission autumn report 2016 – Table A3.1
£8.04 £8.17 £8.30 £8.54£7.14 £7.31 £7.48 £7.76
11% 11% 10% 9%
0%
5%
10%
15%
20%
£0
£2
£4
£6
£8
£10
Oct13-Sep14 Oct14-Sep15 Oct15-Mar16 Apr16-Mar17
Senior care worker Care worker Differential
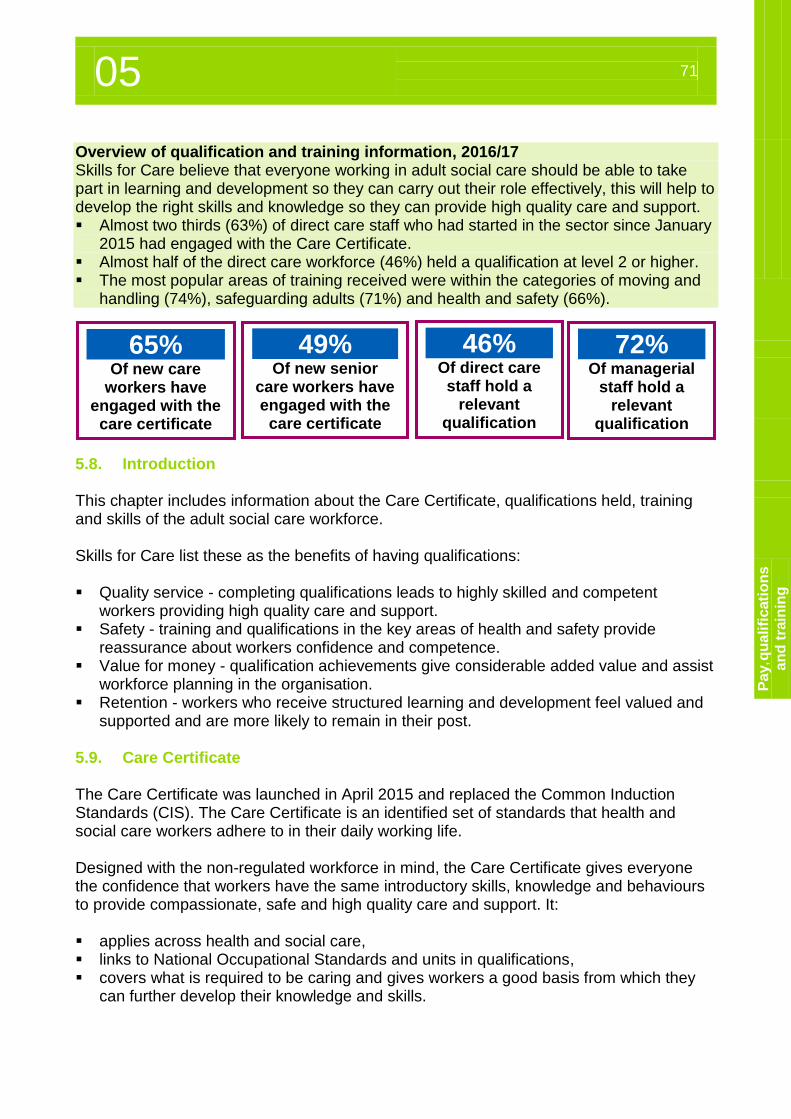
05 71
Pa
y, q
ua
lifi
cati
on
s
an
d t
rain
ing
Overview of qualification and training information, 2016/17 Skills for Care believe that everyone working in adult social care should be able to take part in learning and development so they can carry out their role effectively, this will help to develop the right skills and knowledge so they can provide high quality care and support. Almost two thirds (63%) of direct care staff who had started in the sector since January
2015 had engaged with the Care Certificate. Almost half of the direct care workforce (46%) held a qualification at level 2 or higher. The most popular areas of training received were within the categories of moving and
handling (74%), safeguarding adults (71%) and health and safety (66%).
5.8. Introduction This chapter includes information about the Care Certificate, qualifications held, training and skills of the adult social care workforce. Skills for Care list these as the benefits of having qualifications: Quality service - completing qualifications leads to highly skilled and competent
workers providing high quality care and support. Safety - training and qualifications in the key areas of health and safety provide
reassurance about workers confidence and competence. Value for money - qualification achievements give considerable added value and assist
workforce planning in the organisation. Retention - workers who receive structured learning and development feel valued and
supported and are more likely to remain in their post. 5.9. Care Certificate The Care Certificate was launched in April 2015 and replaced the Common Induction Standards (CIS). The Care Certificate is an identified set of standards that health and social care workers adhere to in their daily working life. Designed with the non-regulated workforce in mind, the Care Certificate gives everyone the confidence that workers have the same introductory skills, knowledge and behaviours to provide compassionate, safe and high quality care and support. It: applies across health and social care, links to National Occupational Standards and units in qualifications, covers what is required to be caring and gives workers a good basis from which they
can further develop their knowledge and skills.
65% Of new care
workers have engaged with the
care certificate
49% Of new senior
care workers have engaged with the
care certificate
46% Of direct care
staff hold a relevant
qualification
72% Of managerial
staff hold a relevant
qualification
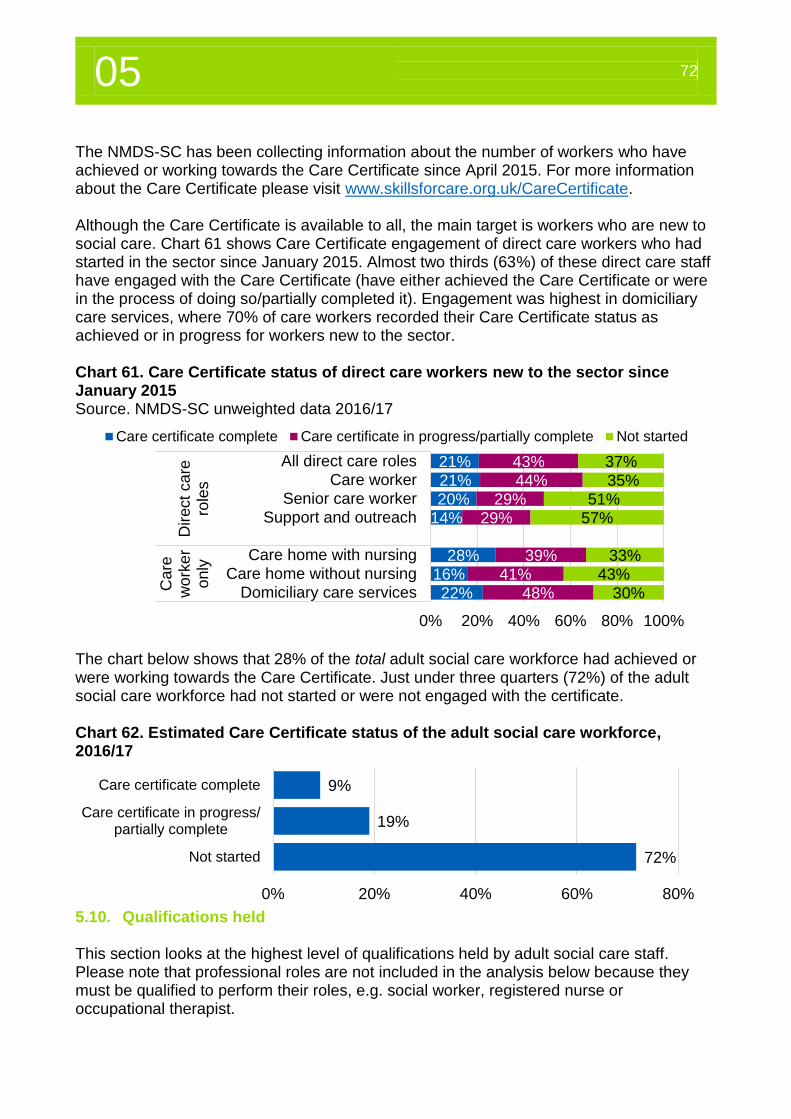
05 72
The NMDS-SC has been collecting information about the number of workers who have achieved or working towards the Care Certificate since April 2015. For more information about the Care Certificate please visit www.skillsforcare.org.uk/CareCertificate. Although the Care Certificate is available to all, the main target is workers who are new to social care. Chart 61 shows Care Certificate engagement of direct care workers who had started in the sector since January 2015. Almost two thirds (63%) of these direct care staff have engaged with the Care Certificate (have either achieved the Care Certificate or were in the process of doing so/partially completed it). Engagement was highest in domiciliary care services, where 70% of care workers recorded their Care Certificate status as achieved or in progress for workers new to the sector. Chart 61. Care Certificate status of direct care workers new to the sector since January 2015 Source. NMDS-SC unweighted data 2016/17
The chart below shows that 28% of the total adult social care workforce had achieved or were working towards the Care Certificate. Just under three quarters (72%) of the adult social care workforce had not started or were not engaged with the certificate. Chart 62. Estimated Care Certificate status of the adult social care workforce, 2016/17
5.10. Qualifications held This section looks at the highest level of qualifications held by adult social care staff. Please note that professional roles are not included in the analysis below because they must be qualified to perform their roles, e.g. social worker, registered nurse or occupational therapist.
21%
21%
20%
14%
28%
16%
22%
43%
44%
29%
29%
39%
41%
48%
37%
35%
51%
57%
33%
43%
30%
0% 20% 40% 60% 80% 100%
All direct care roles
Care worker
Senior care worker
Support and outreach
Care home with nursing
Care home without nursing
Domiciliary care services
Dir
ect
ca
rero
les
Care
work
er
only
Care certificate complete Care certificate in progress/partially complete Not started
9%
19%
72%
0% 20% 40% 60% 80%
Care certificate complete
Care certificate in progress/partially complete
Not started
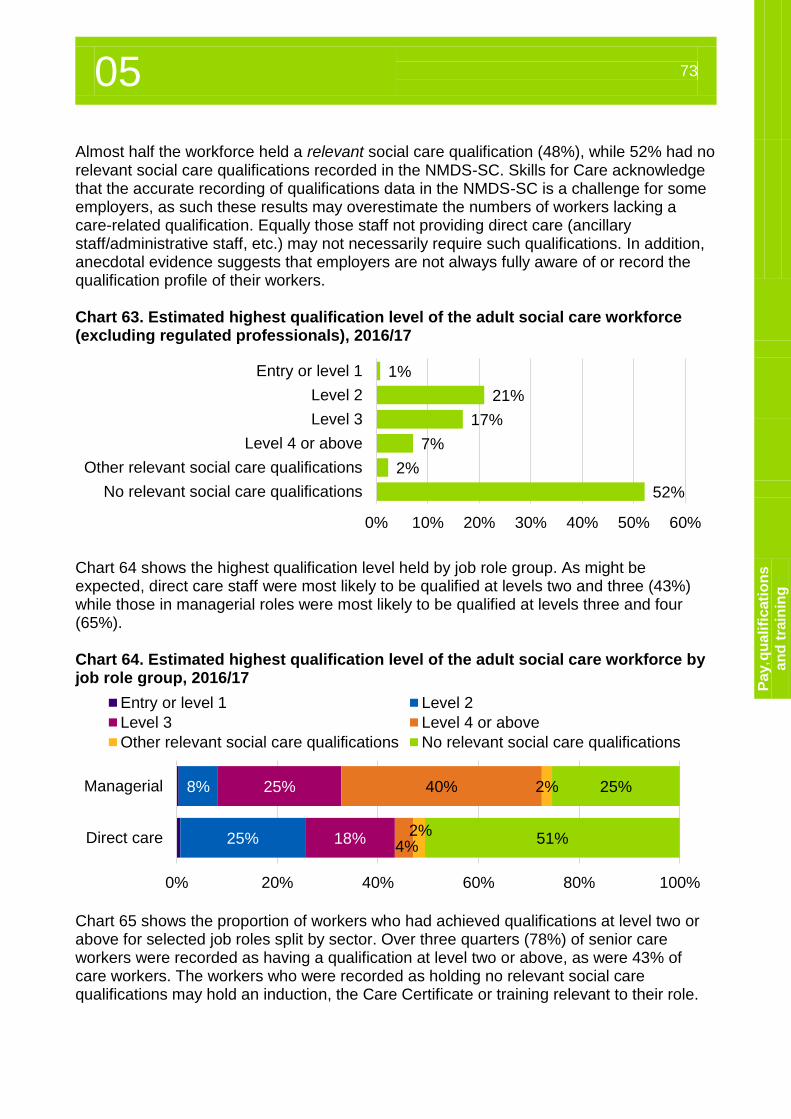
05 73
Pa
y, q
ua
lifi
cati
on
s
an
d t
rain
ing
Almost half the workforce held a relevant social care qualification (48%), while 52% had no relevant social care qualifications recorded in the NMDS-SC. Skills for Care acknowledge that the accurate recording of qualifications data in the NMDS-SC is a challenge for some employers, as such these results may overestimate the numbers of workers lacking a care-related qualification. Equally those staff not providing direct care (ancillary staff/administrative staff, etc.) may not necessarily require such qualifications. In addition, anecdotal evidence suggests that employers are not always fully aware of or record the qualification profile of their workers. Chart 63. Estimated highest qualification level of the adult social care workforce (excluding regulated professionals), 2016/17
Chart 64 shows the highest qualification level held by job role group. As might be expected, direct care staff were most likely to be qualified at levels two and three (43%) while those in managerial roles were most likely to be qualified at levels three and four (65%). Chart 64. Estimated highest qualification level of the adult social care workforce by job role group, 2016/17
Chart 65 shows the proportion of workers who had achieved qualifications at level two or above for selected job roles split by sector. Over three quarters (78%) of senior care workers were recorded as having a qualification at level two or above, as were 43% of care workers. The workers who were recorded as holding no relevant social care qualifications may hold an induction, the Care Certificate or training relevant to their role.
1%
21%
17%
7%
2%
52%
0% 10% 20% 30% 40% 50% 60%
Entry or level 1
Level 2
Level 3
Level 4 or above
Other relevant social care qualifications
No relevant social care qualifications
8%
25%
25%
18%
40%
4%
2%
2%
25%
51%
0% 20% 40% 60% 80% 100%
Managerial
Direct care
Entry or level 1 Level 2
Level 3 Level 4 or above
Other relevant social care qualifications No relevant social care qualifications
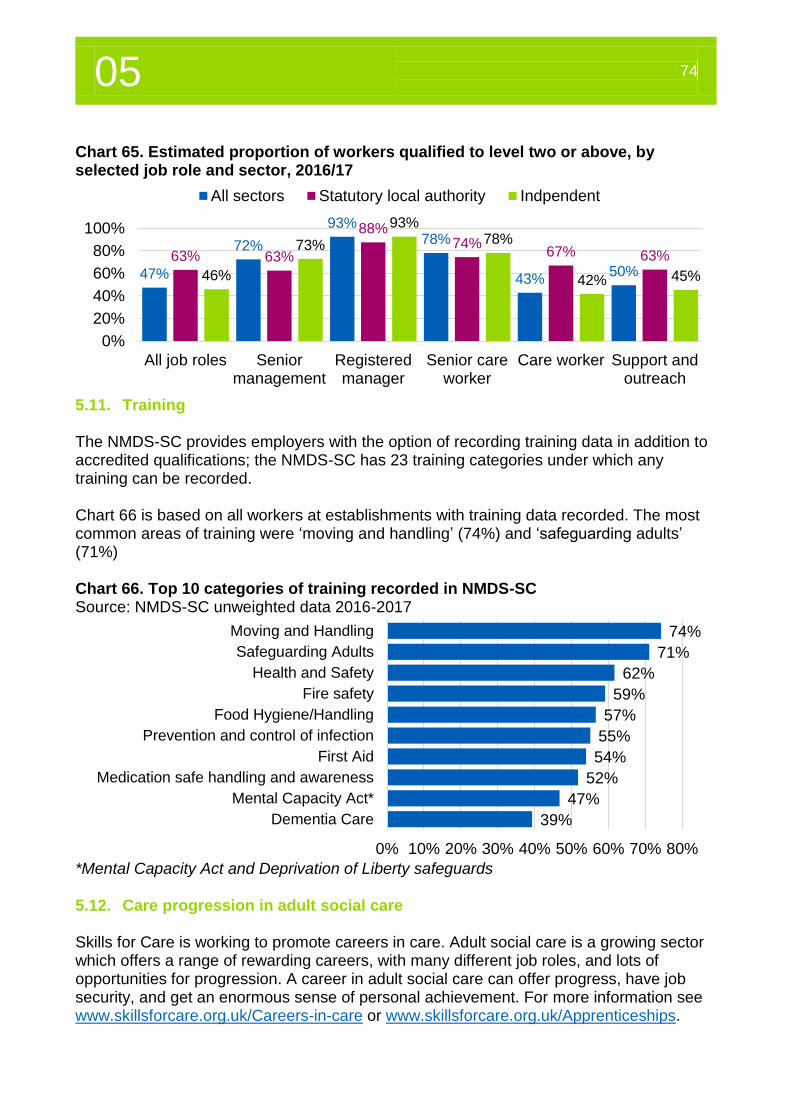
05 74
Chart 65. Estimated proportion of workers qualified to level two or above, by selected job role and sector, 2016/17
5.11. Training The NMDS-SC provides employers with the option of recording training data in addition to accredited qualifications; the NMDS-SC has 23 training categories under which any training can be recorded. Chart 66 is based on all workers at establishments with training data recorded. The most common areas of training were ‘moving and handling’ (74%) and ‘safeguarding adults’ (71%) Chart 66. Top 10 categories of training recorded in NMDS-SC Source: NMDS-SC unweighted data 2016-2017
*Mental Capacity Act and Deprivation of Liberty safeguards 5.12. Care progression in adult social care Skills for Care is working to promote careers in care. Adult social care is a growing sector which offers a range of rewarding careers, with many different job roles, and lots of opportunities for progression. A career in adult social care can offer progress, have job security, and get an enormous sense of personal achievement. For more information see www.skillsforcare.org.uk/Careers-in-care or www.skillsforcare.org.uk/Apprenticeships.
47%
72%
93%78%
43%50%
63% 63%
88%74%
67% 63%
46%
73%
93%78%
42% 45%
0%
20%
40%
60%
80%
100%
All job roles Seniormanagement
Registeredmanager
Senior careworker
Care worker Support andoutreach
All sectors Statutory local authority Indpendent
74%
71%
62%
59%
57%
55%
54%
52%
47%
39%
0% 10% 20% 30% 40% 50% 60% 70% 80%
Moving and Handling
Safeguarding Adults
Health and Safety
Fire safety
Food Hygiene/Handling
Prevention and control of infection
First Aid
Medication safe handling and awareness
Mental Capacity Act*
Dementia Care
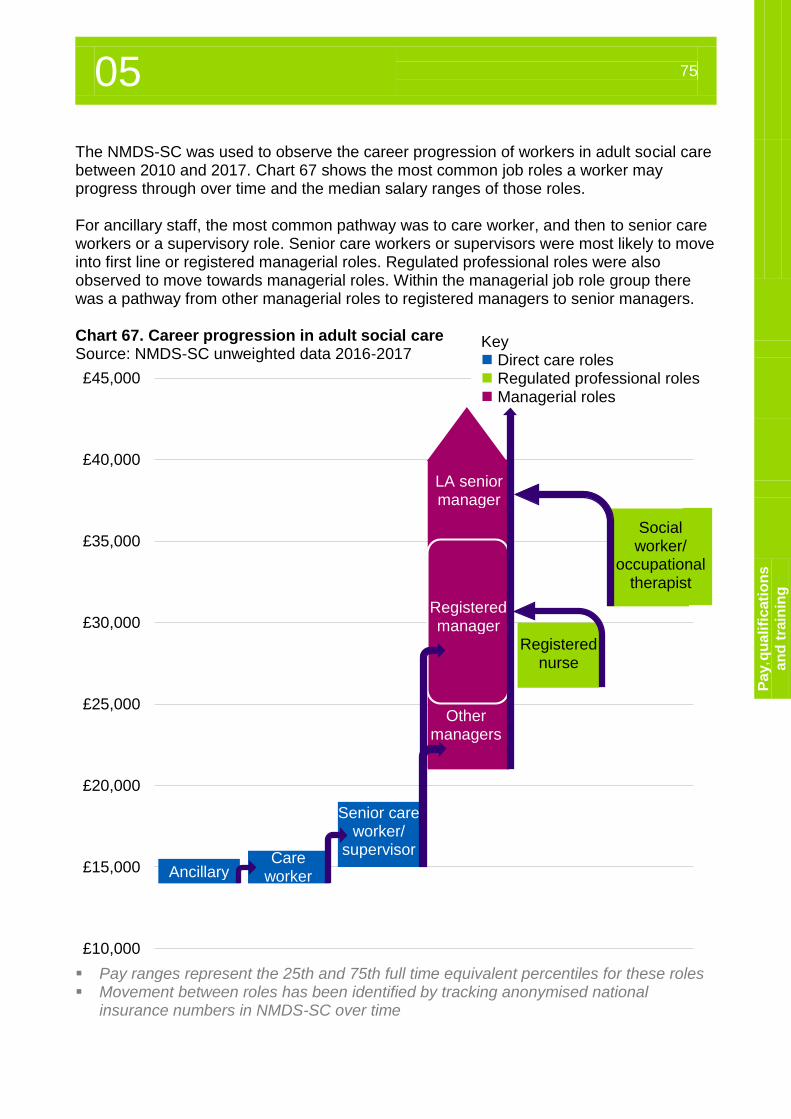
05 75
Pa
y, q
ua
lifi
cati
on
s
an
d t
rain
ing
The NMDS-SC was used to observe the career progression of workers in adult social care between 2010 and 2017. Chart 67 shows the most common job roles a worker may progress through over time and the median salary ranges of those roles. For ancillary staff, the most common pathway was to care worker, and then to senior care workers or a supervisory role. Senior care workers or supervisors were most likely to move into first line or registered managerial roles. Regulated professional roles were also observed to move towards managerial roles. Within the managerial job role group there was a pathway from other managerial roles to registered managers to senior managers. Chart 67. Career progression in adult social care Source: NMDS-SC unweighted data 2016-2017
Pay ranges represent the 25th and 75th full time equivalent percentiles for these roles Movement between roles has been identified by tracking anonymised national
insurance numbers in NMDS-SC over time
£10,000
£15,000
£20,000
£25,000
£30,000
£35,000
£40,000
£45,000
Key Direct care roles Regulated professional roles Managerial roles
Ancillary Care
worker
Senior care worker/
supervisor
Registered nurse
LA senior manager
Registered manager
Other managers
Social worker/
occupational therapist
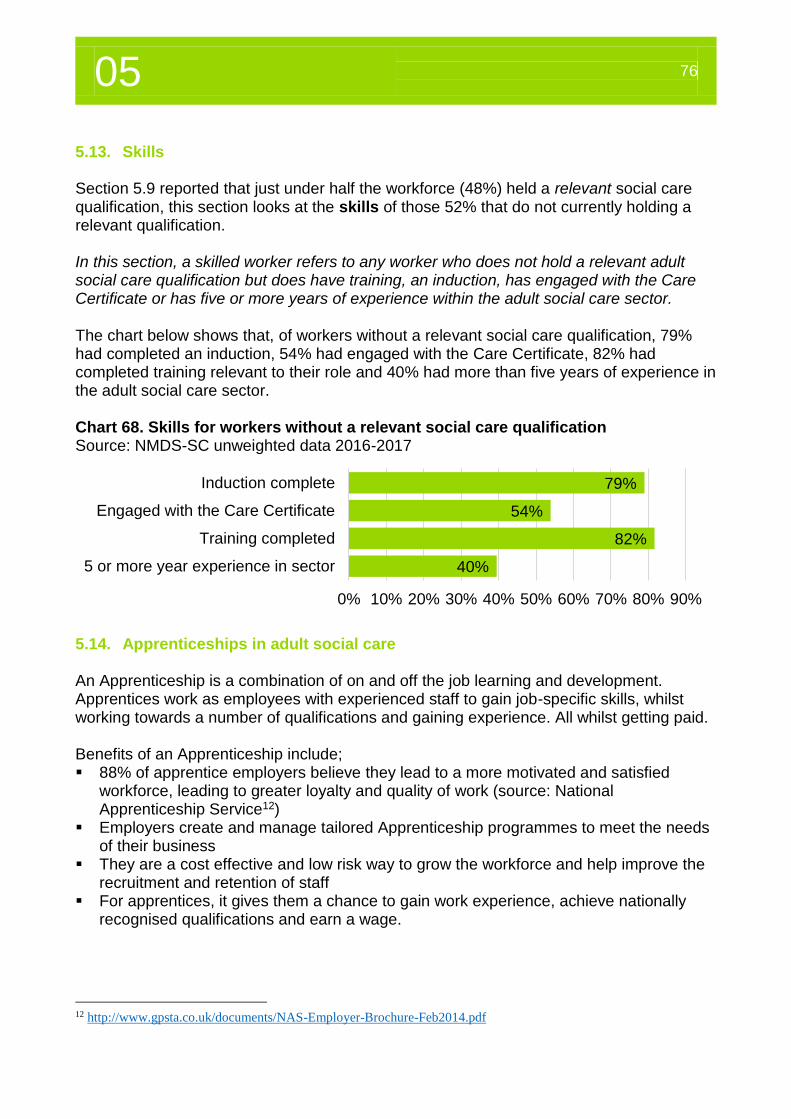
05 76
5.13. Skills Section 5.9 reported that just under half the workforce (48%) held a relevant social care qualification, this section looks at the skills of those 52% that do not currently holding a relevant qualification. In this section, a skilled worker refers to any worker who does not hold a relevant adult social care qualification but does have training, an induction, has engaged with the Care Certificate or has five or more years of experience within the adult social care sector. The chart below shows that, of workers without a relevant social care qualification, 79% had completed an induction, 54% had engaged with the Care Certificate, 82% had completed training relevant to their role and 40% had more than five years of experience in the adult social care sector. Chart 68. Skills for workers without a relevant social care qualification Source: NMDS-SC unweighted data 2016-2017
5.14. Apprenticeships in adult social care An Apprenticeship is a combination of on and off the job learning and development. Apprentices work as employees with experienced staff to gain job-specific skills, whilst working towards a number of qualifications and gaining experience. All whilst getting paid. Benefits of an Apprenticeship include; 88% of apprentice employers believe they lead to a more motivated and satisfied
workforce, leading to greater loyalty and quality of work (source: National Apprenticeship Service12)
Employers create and manage tailored Apprenticeship programmes to meet the needs of their business
They are a cost effective and low risk way to grow the workforce and help improve the recruitment and retention of staff
For apprentices, it gives them a chance to gain work experience, achieve nationally recognised qualifications and earn a wage.
12 http://www.gpsta.co.uk/documents/NAS-Employer-Brochure-Feb2014.pdf
79%
54%
82%
40%
0% 10% 20% 30% 40% 50% 60% 70% 80% 90%
Induction complete
Engaged with the Care Certificate
Training completed
5 or more year experience in sector
05 77
Pa
y, q
ua
lifi
cati
on
s
an
d t
rain
ing
In winter 2017 Skills for Care is publishing a paper about the return on investment in adult social care Apprenticeships. This is an update of the December 2013 research, which you can view on the Skills for Care website13. A person interested in becoming an apprentice in the social care sector can start on either the social care pathway of the Health and Social Care framework for learning at levels two and three, or the Care Leadership and Management framework at level five. More recently, due to major government reform of Apprenticeships, these frameworks are being replaced by standards. These new standards are: Adult Care Worker (level 2) – Launched in December 2016 Lead Adult Care Worker (level 3) – Launched in December 2016 Lead Practitioner in Adult Care (level 4) – Currently under review Leader in Adult Care (level 5) – Currently under review More information can be found at www.skillsforcare.org.uk/newstandards There were around 87,800 people who started a social care Apprenticeship in 2015/16. This was 1% more than in 2014/15 and a 20% rise since 2012/13 when the total was 73,100. Social care remains the largest Apprenticeship framework, with 17% of the starts across all frameworks. Of people who participated in a social care Apprenticeship during 2015/16 around 43% (70,700) finished studying during the year, 4% agreed to take a planned break from learning and 52% were still in learning. Three in every five (60%; 42,600) social care apprentices who finished their Apprenticeships during 2015/16 achieved their learning aim, 1% did not achieve their learning aim, 35% withdrew and 4% transferred to a new programme/provider. For further information about Apprenticeships in adult social care please see the ‘Think Care Careers’14 For a detailed report on Apprenticeships in adult social care please see the focussed report at www.skillsforcare.org.uk/WIpublications.
13 http://www.skillsforcare.org.uk/Documents/Learning-and-development/Apprenticeships/Homepage/Return-on-
investment-in-adult-social-care-Apprenticeships-case-studies.pdf 14 http://www.skillsforcare.org.uk/Careers-in-care/Think-Care-Careers.aspx

05 78

Personal assistants
06
06 80
6.1 Introduction 6. Introduction Direct payments were a significant part of the main mechanism to deliver the personalisation agenda for adult social care in England. Personalisation was a step change from the traditional service-led approach of care, to offering choice and control to people, with an increased emphasis put on wellbeing and lifestyle. 6.1. Introduction Direct payments were first introduced for adults in 1997 and for older people in 2000. With the introduction of the Care Act in 2014, it became mandatory for local authorities to provide direct payments to individuals who needed, and were eligible, to receive them. In the 2015 the ‘Department of Health15 defined a direct payment as;
“A payment of money from the local authority to either the person needing care and support, or to someone else acting on their behalf, to pay for the cost of arranging all or part of their own support. This ensures the adult can take full control over their own care.”
After a fairly slow start, the number of people receiving direct payments increased rapidly between 2008 and 2014 (from 65k to 235k). Many of these people were choosing to directly employ their own staff rather than using traditional adult social care services. Skills for Care estimates that, by 2016, around 70,000 of the 235,000 adults and older people receiving a direct payment directly employed their own staff (creating 145,000 PA jobs between them). And until this point, very little was known about this relatively new and large part of the adult social care sector and workforce. Skills for Care, as the leading source of social care workforce intelligence, has recently completed a new research study in this field to replicate the success it has had collecting and producing statistics via the NMDS-SC about the wider adult social care sector and workforce. This chapter outlines the results of this project. The survey was designed to mirror the NMDS-SC allowing for PA workforce characteristics to be compared to care workers and the wider adult social care workforce. Skills for Care surveyed approximately 10,400 individual employers and their PAs via two national organisations that provide support to people that employ their own staff; as well as an online survey. There were 968 individual employer and 1,218 PA responses from people with varying care needs, ages and from each region of England. For the first time we have a solid basis for producing statistics about this part of the sector16. In order to provide some context to this new PA workforce intelligence, as well as offer a comparison, information about PAs at times has been presented alongside that of care workers working in the adult social care sector. It is acknowledged that care workers and PAs have different roles and ways of working.
15 https://www.gov.uk/government/publications/care-act-statutory-guidance/care-and-support-statutory-guidance 16 For more information about the methodology and a representativeness review please see the appendix https://www.nmds-sc-online.org.uk/content/view.aspx?id=Adult%20social%20care%20workforce%20reports%20IEPA
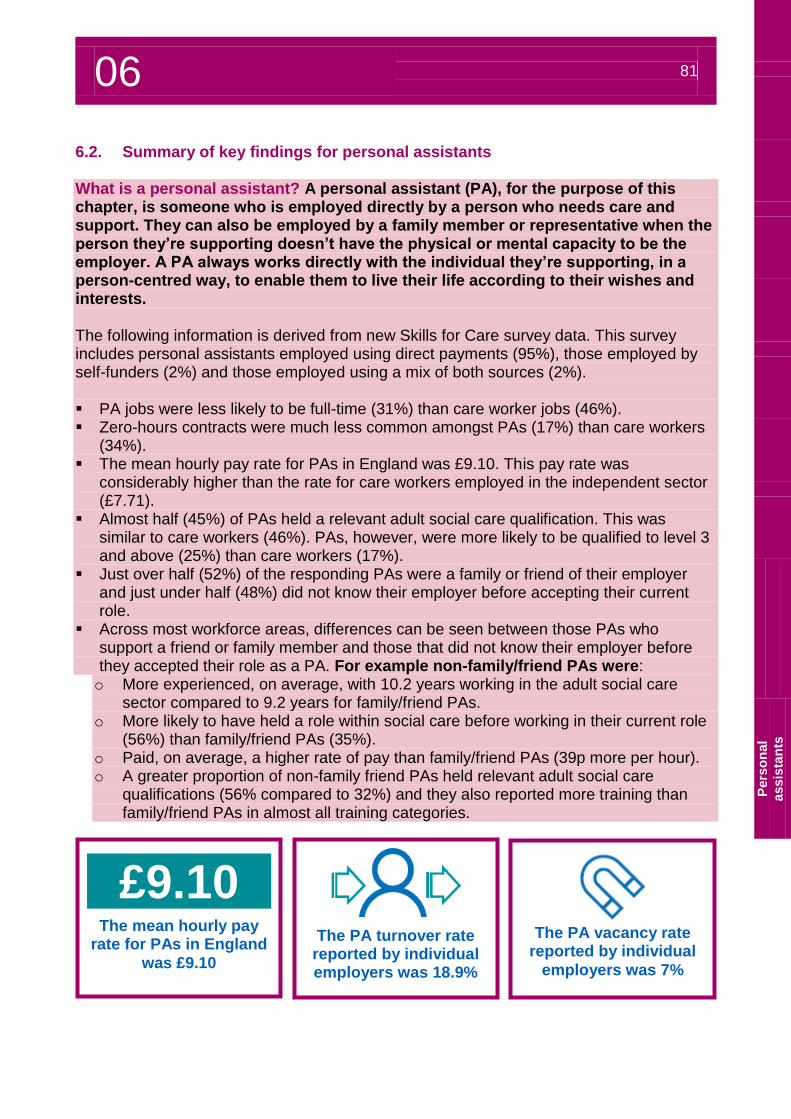
06 81
P
ers
on
al
assis
tan
ts
6.2. Summary of key findings for personal assistants What is a personal assistant? A personal assistant (PA), for the purpose of this chapter, is someone who is employed directly by a person who needs care and support. They can also be employed by a family member or representative when the person they’re supporting doesn’t have the physical or mental capacity to be the employer. A PA always works directly with the individual they’re supporting, in a person-centred way, to enable them to live their life according to their wishes and interests. The following information is derived from new Skills for Care survey data. This survey includes personal assistants employed using direct payments (95%), those employed by self-funders (2%) and those employed using a mix of both sources (2%). PA jobs were less likely to be full-time (31%) than care worker jobs (46%). Zero-hours contracts were much less common amongst PAs (17%) than care workers
(34%). The mean hourly pay rate for PAs in England was £9.10. This pay rate was
considerably higher than the rate for care workers employed in the independent sector (£7.71).
Almost half (45%) of PAs held a relevant adult social care qualification. This was similar to care workers (46%). PAs, however, were more likely to be qualified to level 3 and above (25%) than care workers (17%).
Just over half (52%) of the responding PAs were a family or friend of their employer and just under half (48%) did not know their employer before accepting their current role.
Across most workforce areas, differences can be seen between those PAs who support a friend or family member and those that did not know their employer before they accepted their role as a PA. For example non-family/friend PAs were: o More experienced, on average, with 10.2 years working in the adult social care
sector compared to 9.2 years for family/friend PAs. o More likely to have held a role within social care before working in their current role
(56%) than family/friend PAs (35%). o Paid, on average, a higher rate of pay than family/friend PAs (39p more per hour). o A greater proportion of non-family friend PAs held relevant adult social care
qualifications (56% compared to 32%) and they also reported more training than family/friend PAs in almost all training categories.
£9.10
The mean hourly pay rate for PAs in England
was £9.10
The PA turnover rate reported by individual employers was 18.9%
The PA vacancy rate
reported by individual
employers was 7%
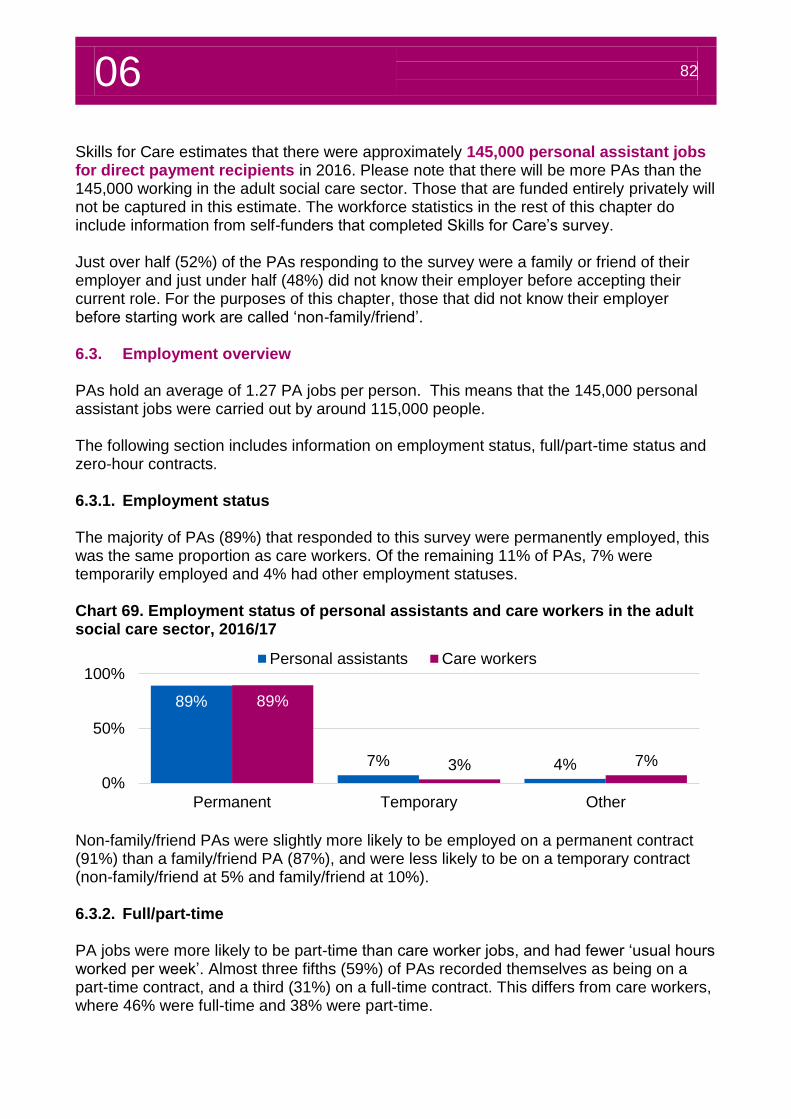
06 82
Skills for Care estimates that there were approximately 145,000 personal assistant jobs for direct payment recipients in 2016. Please note that there will be more PAs than the 145,000 working in the adult social care sector. Those that are funded entirely privately will not be captured in this estimate. The workforce statistics in the rest of this chapter do include information from self-funders that completed Skills for Care’s survey. Just over half (52%) of the PAs responding to the survey were a family or friend of their employer and just under half (48%) did not know their employer before accepting their current role. For the purposes of this chapter, those that did not know their employer before starting work are called ‘non-family/friend’. 6.3. Employment overview PAs hold an average of 1.27 PA jobs per person. This means that the 145,000 personal assistant jobs were carried out by around 115,000 people. The following section includes information on employment status, full/part-time status and zero-hour contracts. 6.3.1. Employment status The majority of PAs (89%) that responded to this survey were permanently employed, this was the same proportion as care workers. Of the remaining 11% of PAs, 7% were temporarily employed and 4% had other employment statuses. Chart 69. Employment status of personal assistants and care workers in the adult social care sector, 2016/17
Non-family/friend PAs were slightly more likely to be employed on a permanent contract (91%) than a family/friend PA (87%), and were less likely to be on a temporary contract (non-family/friend at 5% and family/friend at 10%). 6.3.2. Full/part-time PA jobs were more likely to be part-time than care worker jobs, and had fewer ‘usual hours worked per week’. Almost three fifths (59%) of PAs recorded themselves as being on a part-time contract, and a third (31%) on a full-time contract. This differs from care workers, where 46% were full-time and 38% were part-time.
89%
7% 4%
89%
3% 7%
0%
50%
100%
Permanent Temporary Other
Personal assistants Care workers
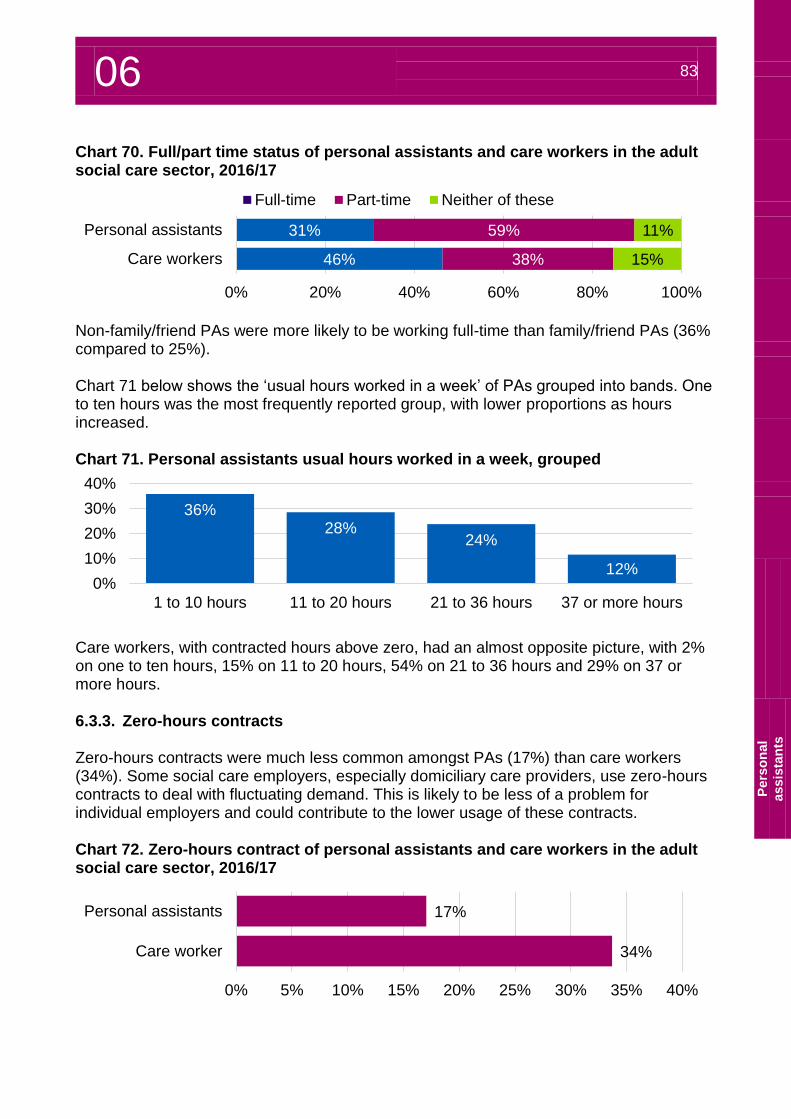
06 83
P
ers
on
al
assis
tan
ts
Chart 70. Full/part time status of personal assistants and care workers in the adult social care sector, 2016/17
Non-family/friend PAs were more likely to be working full-time than family/friend PAs (36% compared to 25%). Chart 71 below shows the ‘usual hours worked in a week’ of PAs grouped into bands. One to ten hours was the most frequently reported group, with lower proportions as hours increased. Chart 71. Personal assistants usual hours worked in a week, grouped
Care workers, with contracted hours above zero, had an almost opposite picture, with 2% on one to ten hours, 15% on 11 to 20 hours, 54% on 21 to 36 hours and 29% on 37 or more hours. 6.3.3. Zero-hours contracts Zero-hours contracts were much less common amongst PAs (17%) than care workers (34%). Some social care employers, especially domiciliary care providers, use zero-hours contracts to deal with fluctuating demand. This is likely to be less of a problem for individual employers and could contribute to the lower usage of these contracts. Chart 72. Zero-hours contract of personal assistants and care workers in the adult social care sector, 2016/17
31%
46%
59%
38%
11%
15%
0% 20% 40% 60% 80% 100%
Personal assistants
Care workers
Full-time Part-time Neither of these
36%28%
24%
12%0%
10%
20%
30%
40%
1 to 10 hours 11 to 20 hours 21 to 36 hours 37 or more hours
17%
34%
0% 5% 10% 15% 20% 25% 30% 35% 40%
Personal assistants
Care worker
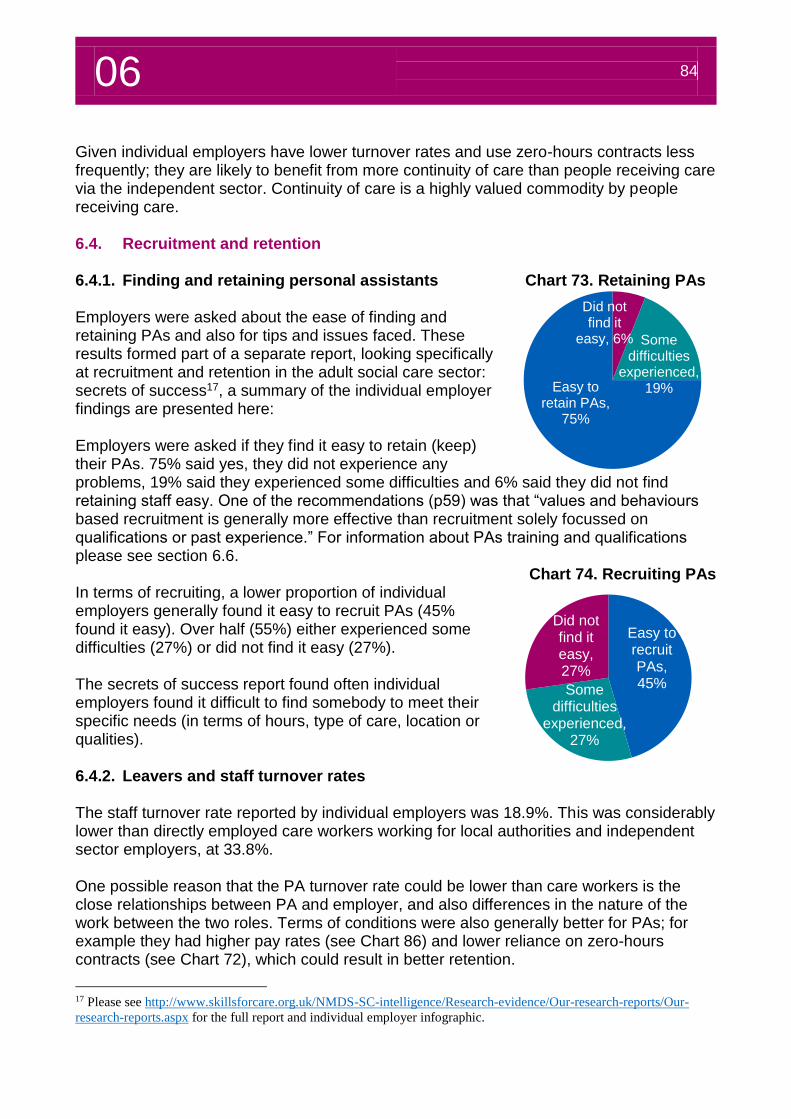
06 84
Given individual employers have lower turnover rates and use zero-hours contracts less frequently; they are likely to benefit from more continuity of care than people receiving care via the independent sector. Continuity of care is a highly valued commodity by people receiving care. 6.4. Recruitment and retention 6.4.1. Finding and retaining personal assistants Chart 73. Retaining PAs Employers were asked about the ease of finding and retaining PAs and also for tips and issues faced. These results formed part of a separate report, looking specifically at recruitment and retention in the adult social care sector: secrets of success17, a summary of the individual employer findings are presented here: Employers were asked if they find it easy to retain (keep) their PAs. 75% said yes, they did not experience any problems, 19% said they experienced some difficulties and 6% said they did not find retaining staff easy. One of the recommendations (p59) was that “values and behaviours based recruitment is generally more effective than recruitment solely focussed on qualifications or past experience.” For information about PAs training and qualifications please see section 6.6.
Chart 74. Recruiting PAs In terms of recruiting, a lower proportion of individual employers generally found it easy to recruit PAs (45% found it easy). Over half (55%) either experienced some difficulties (27%) or did not find it easy (27%). The secrets of success report found often individual employers found it difficult to find somebody to meet their specific needs (in terms of hours, type of care, location or qualities). 6.4.2. Leavers and staff turnover rates The staff turnover rate reported by individual employers was 18.9%. This was considerably lower than directly employed care workers working for local authorities and independent sector employers, at 33.8%. One possible reason that the PA turnover rate could be lower than care workers is the close relationships between PA and employer, and also differences in the nature of the work between the two roles. Terms of conditions were also generally better for PAs; for example they had higher pay rates (see Chart 86) and lower reliance on zero-hours contracts (see Chart 72), which could result in better retention.
17 Please see http://www.skillsforcare.org.uk/NMDS-SC-intelligence/Research-evidence/Our-research-reports/Our-
research-reports.aspx for the full report and individual employer infographic.
Easy to recruit PAs, 45%Some
difficulties experienced,
27%
Did not find it easy, 27%
Did not find it
easy, 6% Some difficulties
experienced, 19%Easy to
retain PAs, 75%
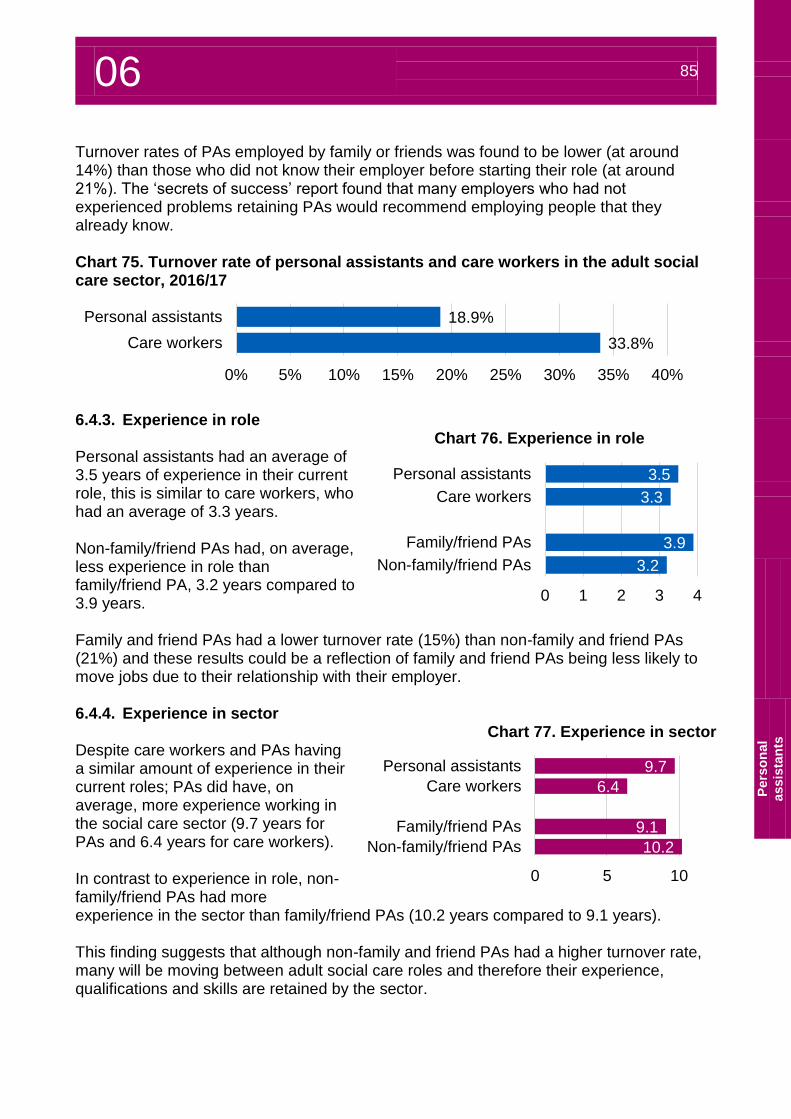
06 85
P
ers
on
al
assis
tan
ts
Turnover rates of PAs employed by family or friends was found to be lower (at around 14%) than those who did not know their employer before starting their role (at around 21%). The ‘secrets of success’ report found that many employers who had not experienced problems retaining PAs would recommend employing people that they already know. Chart 75. Turnover rate of personal assistants and care workers in the adult social care sector, 2016/17
6.4.3. Experience in role
Chart 76. Experience in role Personal assistants had an average of 3.5 years of experience in their current role, this is similar to care workers, who had an average of 3.3 years. Non-family/friend PAs had, on average, less experience in role than family/friend PA, 3.2 years compared to 3.9 years. Family and friend PAs had a lower turnover rate (15%) than non-family and friend PAs (21%) and these results could be a reflection of family and friend PAs being less likely to move jobs due to their relationship with their employer. 6.4.4. Experience in sector
Chart 77. Experience in sector Despite care workers and PAs having a similar amount of experience in their current roles; PAs did have, on average, more experience working in the social care sector (9.7 years for PAs and 6.4 years for care workers). In contrast to experience in role, non-family/friend PAs had more experience in the sector than family/friend PAs (10.2 years compared to 9.1 years). This finding suggests that although non-family and friend PAs had a higher turnover rate, many will be moving between adult social care roles and therefore their experience, qualifications and skills are retained by the sector.
18.9%
33.8%
0% 5% 10% 15% 20% 25% 30% 35% 40%
Personal assistants
Care workers
3.5
3.3
3.9
3.2
0 1 2 3 4
Personal assistants
Care workers
Family/friend PAs
Non-family/friend PAs
9.7
6.4
9.1
10.2
0 5 10
Personal assistants
Care workers
Family/friend PAs
Non-family/friend PAs
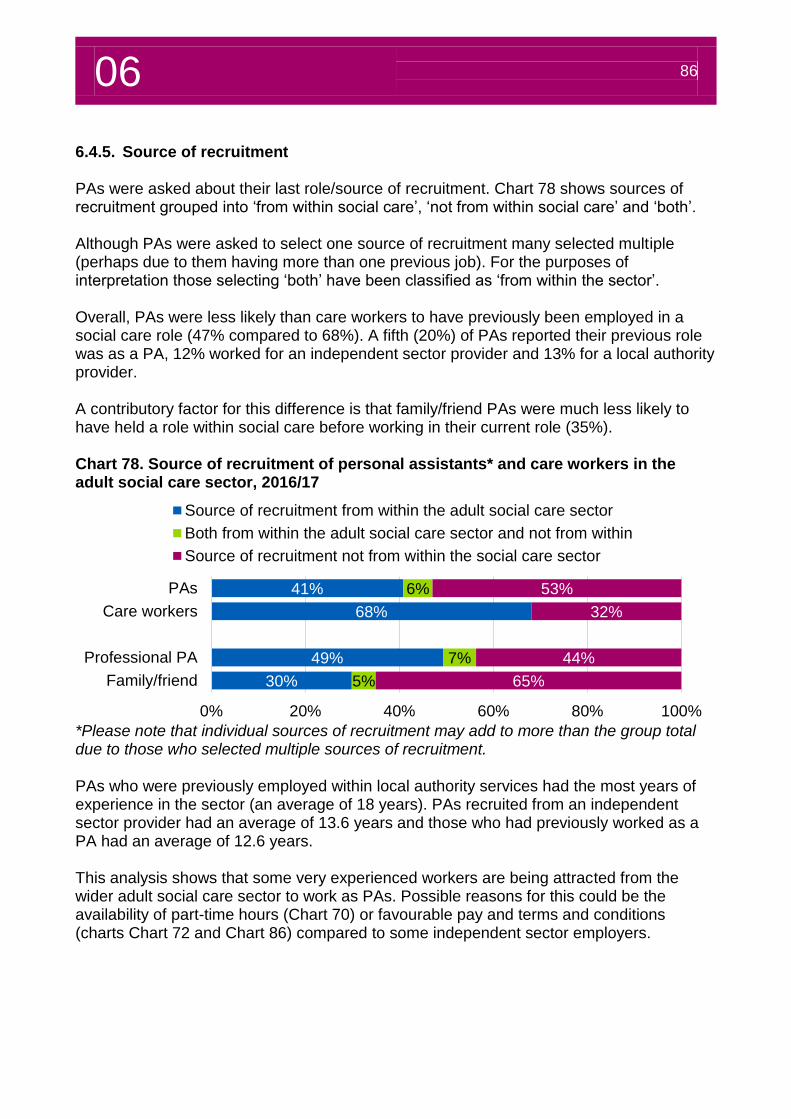
06 86
6.4.5. Source of recruitment PAs were asked about their last role/source of recruitment. Chart 78 shows sources of recruitment grouped into ‘from within social care’, ‘not from within social care’ and ‘both’. Although PAs were asked to select one source of recruitment many selected multiple (perhaps due to them having more than one previous job). For the purposes of interpretation those selecting ‘both’ have been classified as ‘from within the sector’. Overall, PAs were less likely than care workers to have previously been employed in a social care role (47% compared to 68%). A fifth (20%) of PAs reported their previous role was as a PA, 12% worked for an independent sector provider and 13% for a local authority provider. A contributory factor for this difference is that family/friend PAs were much less likely to have held a role within social care before working in their current role (35%). Chart 78. Source of recruitment of personal assistants* and care workers in the adult social care sector, 2016/17
*Please note that individual sources of recruitment may add to more than the group total due to those who selected multiple sources of recruitment. PAs who were previously employed within local authority services had the most years of experience in the sector (an average of 18 years). PAs recruited from an independent sector provider had an average of 13.6 years and those who had previously worked as a PA had an average of 12.6 years. This analysis shows that some very experienced workers are being attracted from the wider adult social care sector to work as PAs. Possible reasons for this could be the availability of part-time hours (Chart 70) or favourable pay and terms and conditions (charts Chart 72 and Chart 86) compared to some independent sector employers.
41%
68%
49%
30%
6%
7%
5%
53%
32%
44%
65%
0% 20% 40% 60% 80% 100%
PAs
Care workers
Professional PA
Family/friend
Source of recruitment from within the adult social care sector
Both from within the adult social care sector and not from within
Source of recruitment not from within the social care sector
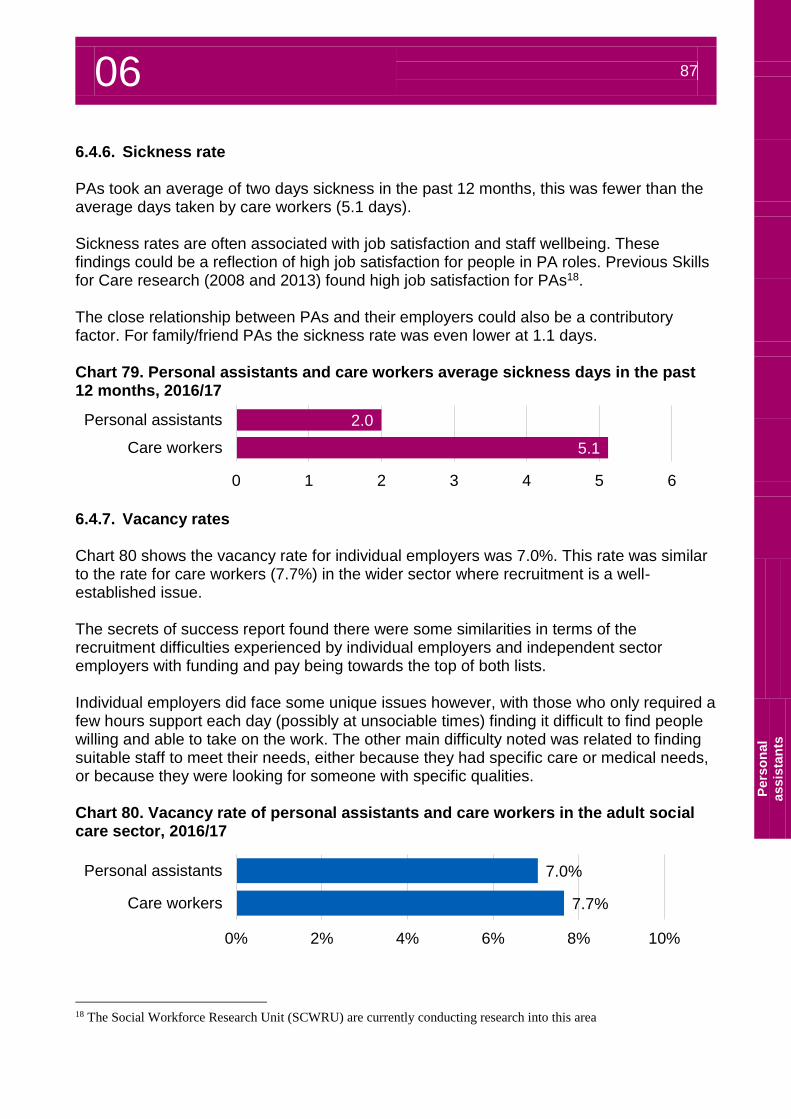
06 87
P
ers
on
al
assis
tan
ts
6.4.6. Sickness rate PAs took an average of two days sickness in the past 12 months, this was fewer than the average days taken by care workers (5.1 days). Sickness rates are often associated with job satisfaction and staff wellbeing. These findings could be a reflection of high job satisfaction for people in PA roles. Previous Skills for Care research (2008 and 2013) found high job satisfaction for PAs18. The close relationship between PAs and their employers could also be a contributory factor. For family/friend PAs the sickness rate was even lower at 1.1 days. Chart 79. Personal assistants and care workers average sickness days in the past 12 months, 2016/17
6.4.7. Vacancy rates Chart 80 shows the vacancy rate for individual employers was 7.0%. This rate was similar to the rate for care workers (7.7%) in the wider sector where recruitment is a well-established issue. The secrets of success report found there were some similarities in terms of the recruitment difficulties experienced by individual employers and independent sector employers with funding and pay being towards the top of both lists. Individual employers did face some unique issues however, with those who only required a few hours support each day (possibly at unsociable times) finding it difficult to find people willing and able to take on the work. The other main difficulty noted was related to finding suitable staff to meet their needs, either because they had specific care or medical needs, or because they were looking for someone with specific qualities. Chart 80. Vacancy rate of personal assistants and care workers in the adult social care sector, 2016/17
18 The Social Workforce Research Unit (SCWRU) are currently conducting research into this area
2.0
5.1
0 1 2 3 4 5 6
Personal assistants
Care workers
7.0%
7.7%
0% 2% 4% 6% 8% 10%
Personal assistants
Care workers
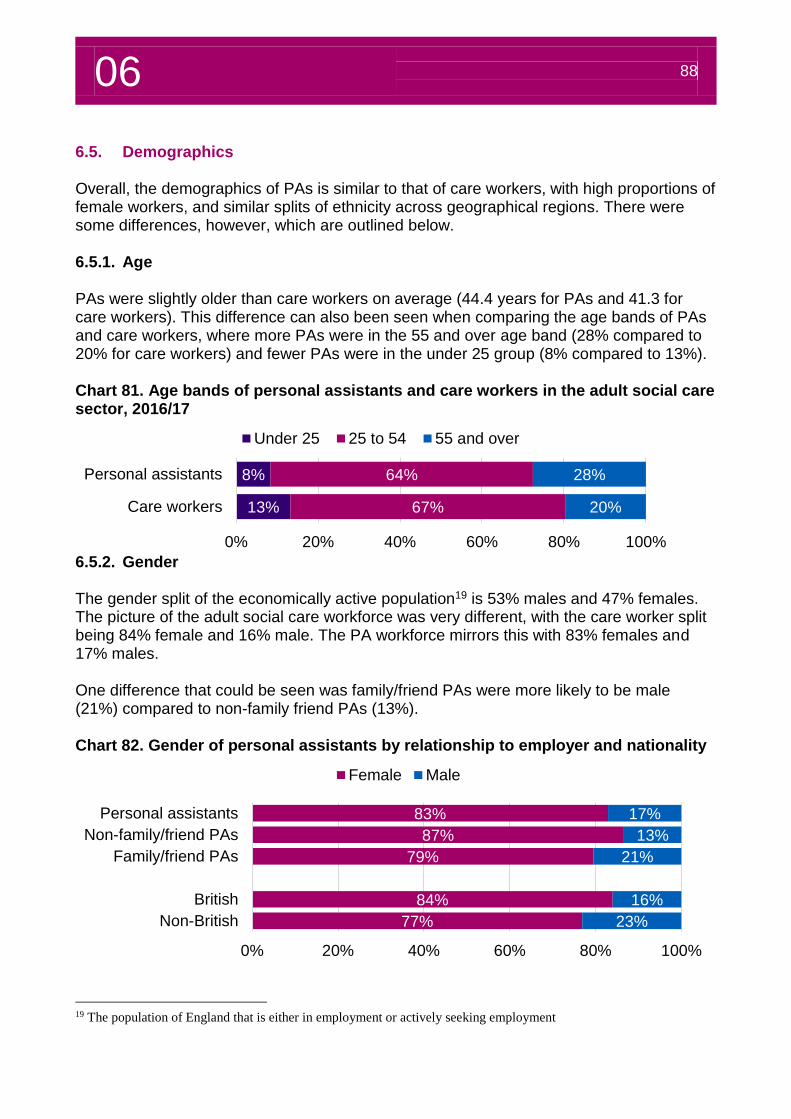
06 88
6.5. Demographics Overall, the demographics of PAs is similar to that of care workers, with high proportions of female workers, and similar splits of ethnicity across geographical regions. There were some differences, however, which are outlined below. 6.5.1. Age PAs were slightly older than care workers on average (44.4 years for PAs and 41.3 for care workers). This difference can also been seen when comparing the age bands of PAs and care workers, where more PAs were in the 55 and over age band (28% compared to 20% for care workers) and fewer PAs were in the under 25 group (8% compared to 13%). Chart 81. Age bands of personal assistants and care workers in the adult social care sector, 2016/17
6.5.2. Gender The gender split of the economically active population19 is 53% males and 47% females. The picture of the adult social care workforce was very different, with the care worker split being 84% female and 16% male. The PA workforce mirrors this with 83% females and 17% males. One difference that could be seen was family/friend PAs were more likely to be male (21%) compared to non-family friend PAs (13%). Chart 82. Gender of personal assistants by relationship to employer and nationality
19 The population of England that is either in employment or actively seeking employment
8%
13%
64%
67%
28%
20%
0% 20% 40% 60% 80% 100%
Personal assistants
Care workers
Under 25 25 to 54 55 and over
83%
87%
79%
84%
77%
17%
13%
21%
16%
23%
0% 20% 40% 60% 80% 100%
Personal assistants
Non-family/friend PAs
Family/friend PAs
British
Non-British
Female Male
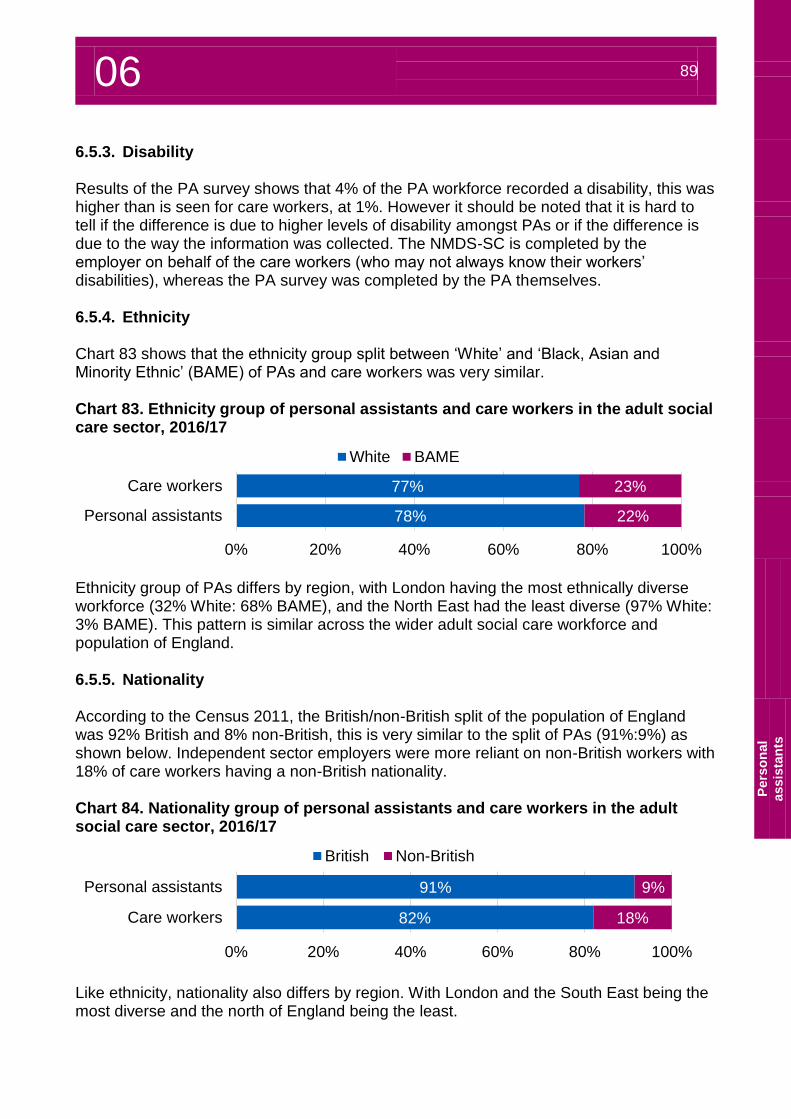
06 89
P
ers
on
al
assis
tan
ts
6.5.3. Disability Results of the PA survey shows that 4% of the PA workforce recorded a disability, this was higher than is seen for care workers, at 1%. However it should be noted that it is hard to tell if the difference is due to higher levels of disability amongst PAs or if the difference is due to the way the information was collected. The NMDS-SC is completed by the employer on behalf of the care workers (who may not always know their workers’ disabilities), whereas the PA survey was completed by the PA themselves. 6.5.4. Ethnicity Chart 83 shows that the ethnicity group split between ‘White’ and ‘Black, Asian and Minority Ethnic’ (BAME) of PAs and care workers was very similar. Chart 83. Ethnicity group of personal assistants and care workers in the adult social care sector, 2016/17
Ethnicity group of PAs differs by region, with London having the most ethnically diverse workforce (32% White: 68% BAME), and the North East had the least diverse (97% White: 3% BAME). This pattern is similar across the wider adult social care workforce and population of England. 6.5.5. Nationality According to the Census 2011, the British/non-British split of the population of England was 92% British and 8% non-British, this is very similar to the split of PAs (91%:9%) as shown below. Independent sector employers were more reliant on non-British workers with 18% of care workers having a non-British nationality. Chart 84. Nationality group of personal assistants and care workers in the adult social care sector, 2016/17
Like ethnicity, nationality also differs by region. With London and the South East being the most diverse and the north of England being the least.
78%
77%
22%
23%
0% 20% 40% 60% 80% 100%
Personal assistants
Care workers
White BAME
91%
82%
9%
18%
0% 20% 40% 60% 80% 100%
Personal assistants
Care workers
British Non-British
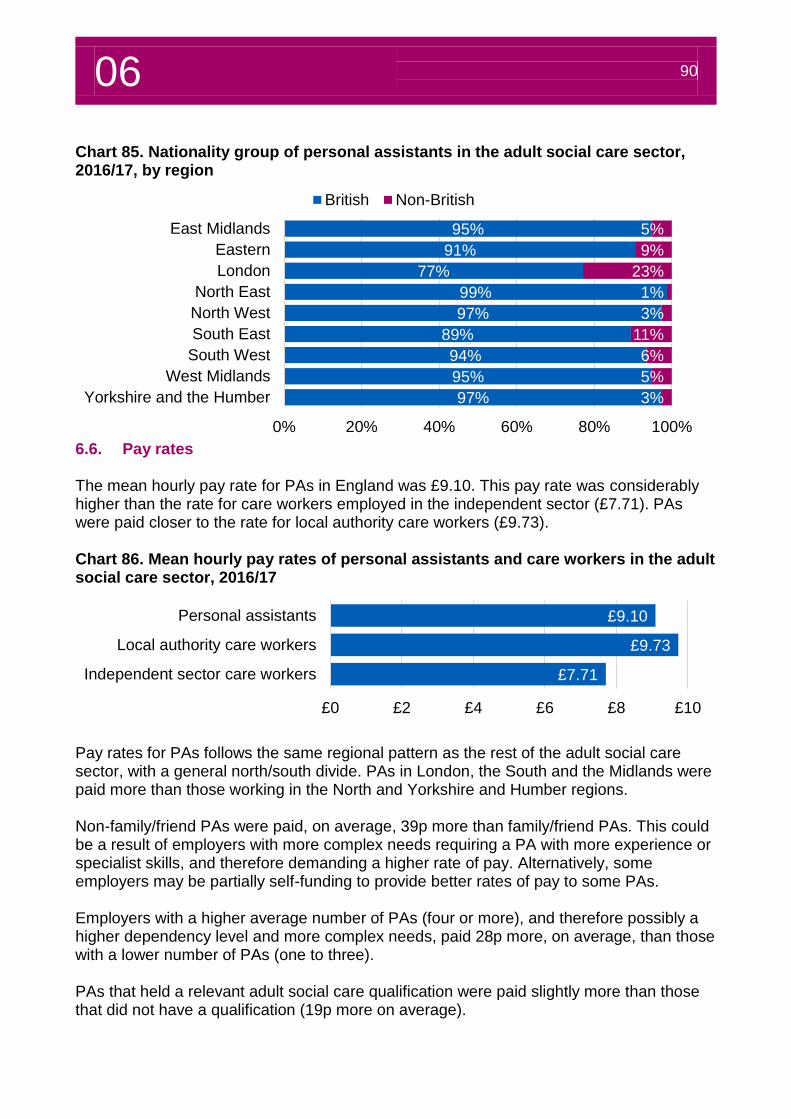
06 90
Chart 85. Nationality group of personal assistants in the adult social care sector, 2016/17, by region
6.6. Pay rates The mean hourly pay rate for PAs in England was £9.10. This pay rate was considerably higher than the rate for care workers employed in the independent sector (£7.71). PAs were paid closer to the rate for local authority care workers (£9.73). Chart 86. Mean hourly pay rates of personal assistants and care workers in the adult social care sector, 2016/17
Pay rates for PAs follows the same regional pattern as the rest of the adult social care sector, with a general north/south divide. PAs in London, the South and the Midlands were paid more than those working in the North and Yorkshire and Humber regions. Non-family/friend PAs were paid, on average, 39p more than family/friend PAs. This could be a result of employers with more complex needs requiring a PA with more experience or specialist skills, and therefore demanding a higher rate of pay. Alternatively, some employers may be partially self-funding to provide better rates of pay to some PAs. Employers with a higher average number of PAs (four or more), and therefore possibly a higher dependency level and more complex needs, paid 28p more, on average, than those with a lower number of PAs (one to three). PAs that held a relevant adult social care qualification were paid slightly more than those that did not have a qualification (19p more on average).
95%
91%
77%
99%
97%
89%
94%
95%
97%
5%
9%
23%
1%
3%
11%
6%
5%
3%
0% 20% 40% 60% 80% 100%
East Midlands
Eastern
London
North East
North West
South East
South West
West Midlands
Yorkshire and the Humber
British Non-British
£9.10
£9.73
£7.71
£0 £2 £4 £6 £8 £10
Personal assistants
Local authority care workers
Independent sector care workers
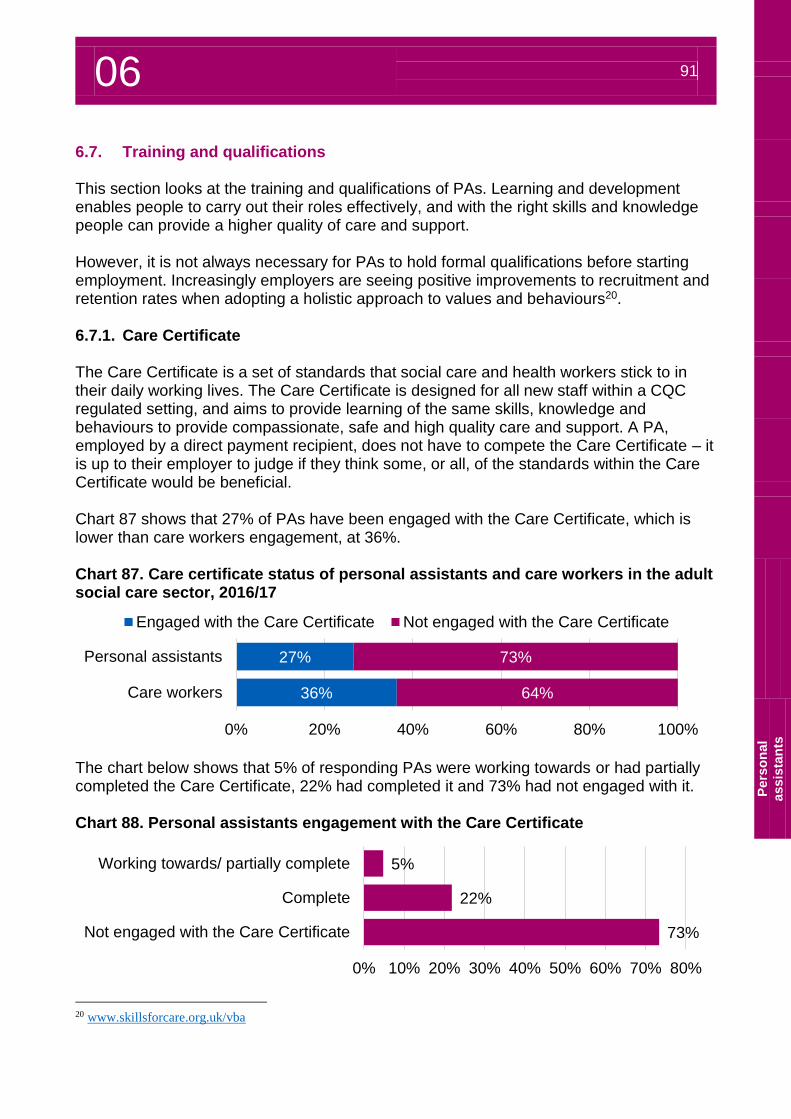
06 91
P
ers
on
al
assis
tan
ts
6.7. Training and qualifications This section looks at the training and qualifications of PAs. Learning and development enables people to carry out their roles effectively, and with the right skills and knowledge people can provide a higher quality of care and support. However, it is not always necessary for PAs to hold formal qualifications before starting employment. Increasingly employers are seeing positive improvements to recruitment and retention rates when adopting a holistic approach to values and behaviours20. 6.7.1. Care Certificate The Care Certificate is a set of standards that social care and health workers stick to in their daily working lives. The Care Certificate is designed for all new staff within a CQC regulated setting, and aims to provide learning of the same skills, knowledge and behaviours to provide compassionate, safe and high quality care and support. A PA, employed by a direct payment recipient, does not have to compete the Care Certificate – it is up to their employer to judge if they think some, or all, of the standards within the Care Certificate would be beneficial. Chart 87 shows that 27% of PAs have been engaged with the Care Certificate, which is lower than care workers engagement, at 36%. Chart 87. Care certificate status of personal assistants and care workers in the adult social care sector, 2016/17
The chart below shows that 5% of responding PAs were working towards or had partially completed the Care Certificate, 22% had completed it and 73% had not engaged with it. Chart 88. Personal assistants engagement with the Care Certificate
20 www.skillsforcare.org.uk/vba
27%
36%
73%
64%
0% 20% 40% 60% 80% 100%
Personal assistants
Care workers
Engaged with the Care Certificate Not engaged with the Care Certificate
5%
22%
73%
0% 10% 20% 30% 40% 50% 60% 70% 80%
Working towards/ partially complete
Complete
Not engaged with the Care Certificate
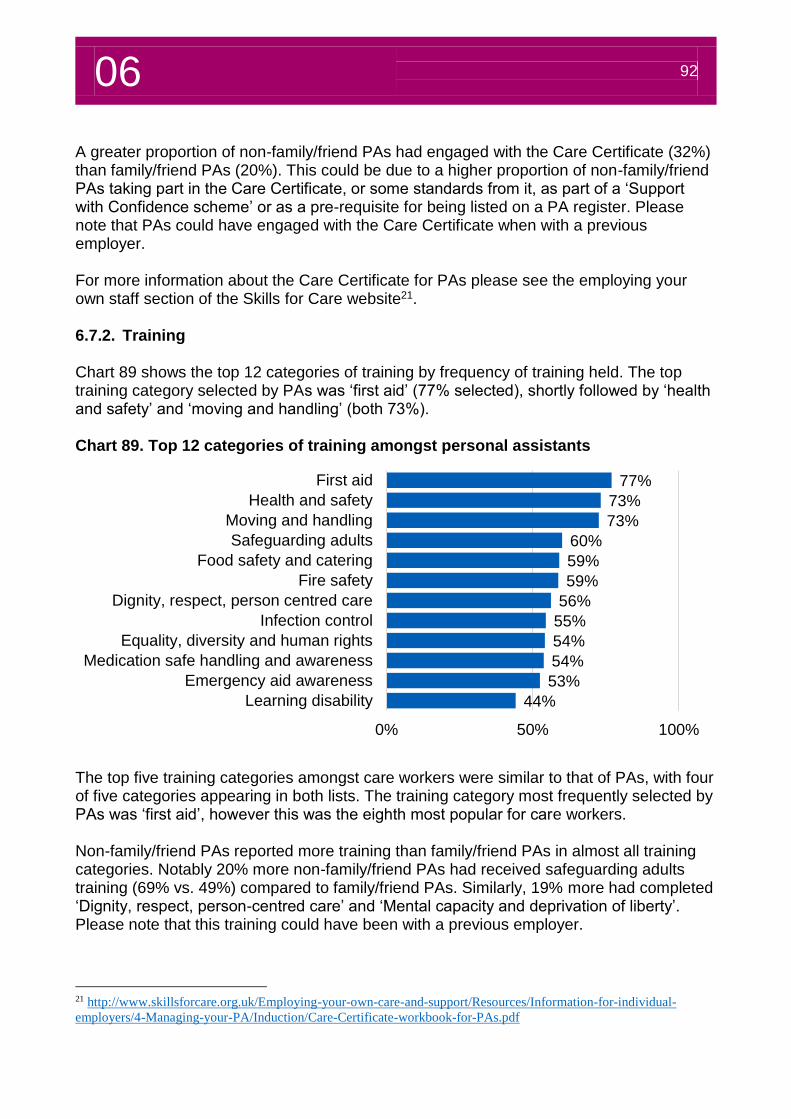
06 92
A greater proportion of non-family/friend PAs had engaged with the Care Certificate (32%) than family/friend PAs (20%). This could be due to a higher proportion of non-family/friend PAs taking part in the Care Certificate, or some standards from it, as part of a ‘Support with Confidence scheme’ or as a pre-requisite for being listed on a PA register. Please note that PAs could have engaged with the Care Certificate when with a previous employer. For more information about the Care Certificate for PAs please see the employing your own staff section of the Skills for Care website21. 6.7.2. Training Chart 89 shows the top 12 categories of training by frequency of training held. The top training category selected by PAs was ‘first aid’ (77% selected), shortly followed by ‘health and safety’ and ‘moving and handling’ (both 73%). Chart 89. Top 12 categories of training amongst personal assistants
The top five training categories amongst care workers were similar to that of PAs, with four of five categories appearing in both lists. The training category most frequently selected by PAs was ‘first aid’, however this was the eighth most popular for care workers. Non-family/friend PAs reported more training than family/friend PAs in almost all training categories. Notably 20% more non-family/friend PAs had received safeguarding adults training (69% vs. 49%) compared to family/friend PAs. Similarly, 19% more had completed ‘Dignity, respect, person-centred care’ and ‘Mental capacity and deprivation of liberty’. Please note that this training could have been with a previous employer.
21 http://www.skillsforcare.org.uk/Employing-your-own-care-and-support/Resources/Information-for-individual-
employers/4-Managing-your-PA/Induction/Care-Certificate-workbook-for-PAs.pdf
77%
73%
73%
60%
59%
59%
56%
55%
54%
54%
53%
44%
0% 50% 100%
First aid
Health and safety
Moving and handling
Safeguarding adults
Food safety and catering
Fire safety
Dignity, respect, person centred care
Infection control
Equality, diversity and human rights
Medication safe handling and awareness
Emergency aid awareness
Learning disability
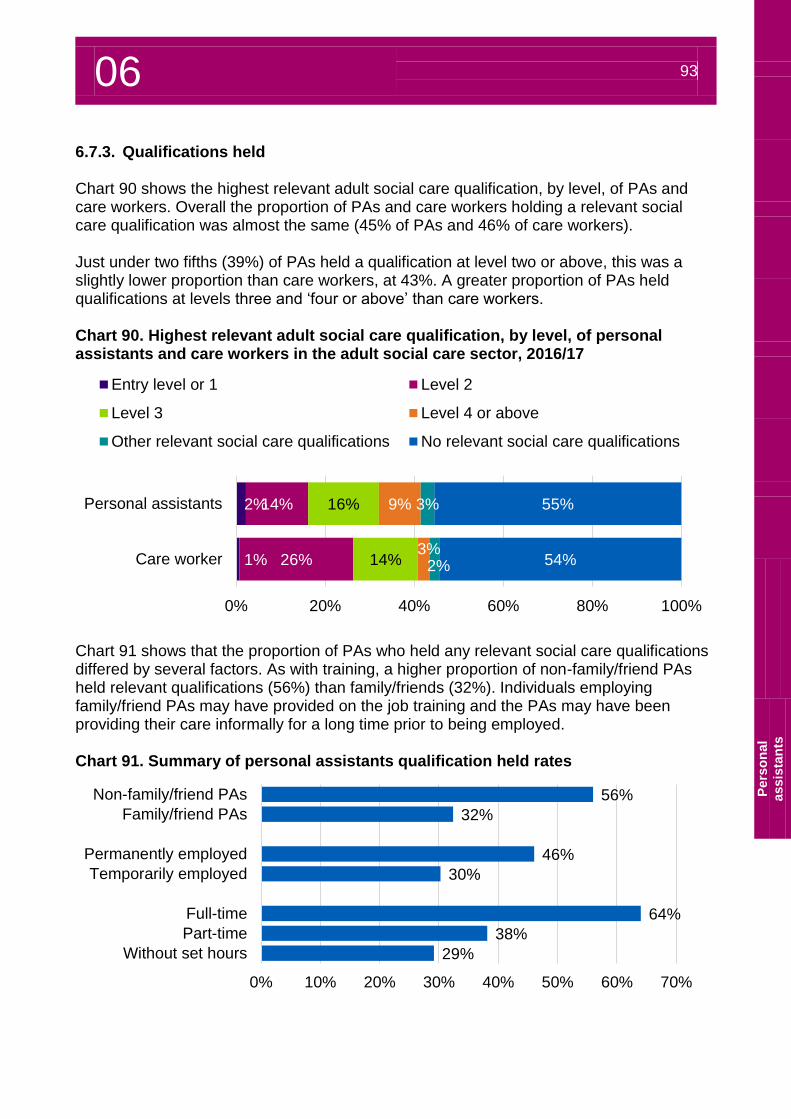
06 93
P
ers
on
al
assis
tan
ts
6.7.3. Qualifications held Chart 90 shows the highest relevant adult social care qualification, by level, of PAs and care workers. Overall the proportion of PAs and care workers holding a relevant social care qualification was almost the same (45% of PAs and 46% of care workers). Just under two fifths (39%) of PAs held a qualification at level two or above, this was a slightly lower proportion than care workers, at 43%. A greater proportion of PAs held qualifications at levels three and ‘four or above’ than care workers. Chart 90. Highest relevant adult social care qualification, by level, of personal assistants and care workers in the adult social care sector, 2016/17
Chart 91 shows that the proportion of PAs who held any relevant social care qualifications differed by several factors. As with training, a higher proportion of non-family/friend PAs held relevant qualifications (56%) than family/friends (32%). Individuals employing family/friend PAs may have provided on the job training and the PAs may have been providing their care informally for a long time prior to being employed. Chart 91. Summary of personal assistants qualification held rates
2%
1%
14%
26%
16%
14%
9%
3%
3%
2%
55%
54%
0% 20% 40% 60% 80% 100%
Personal assistants
Care worker
Entry level or 1 Level 2
Level 3 Level 4 or above
Other relevant social care qualifications No relevant social care qualifications
56%
32%
46%
30%
64%
38%
29%
0% 10% 20% 30% 40% 50% 60% 70%
Non-family/friend PAs
Family/friend PAs
Permanently employed
Temporarily employed
Full-time
Part-time
Without set hours

06 94

Workforce forecasts
07
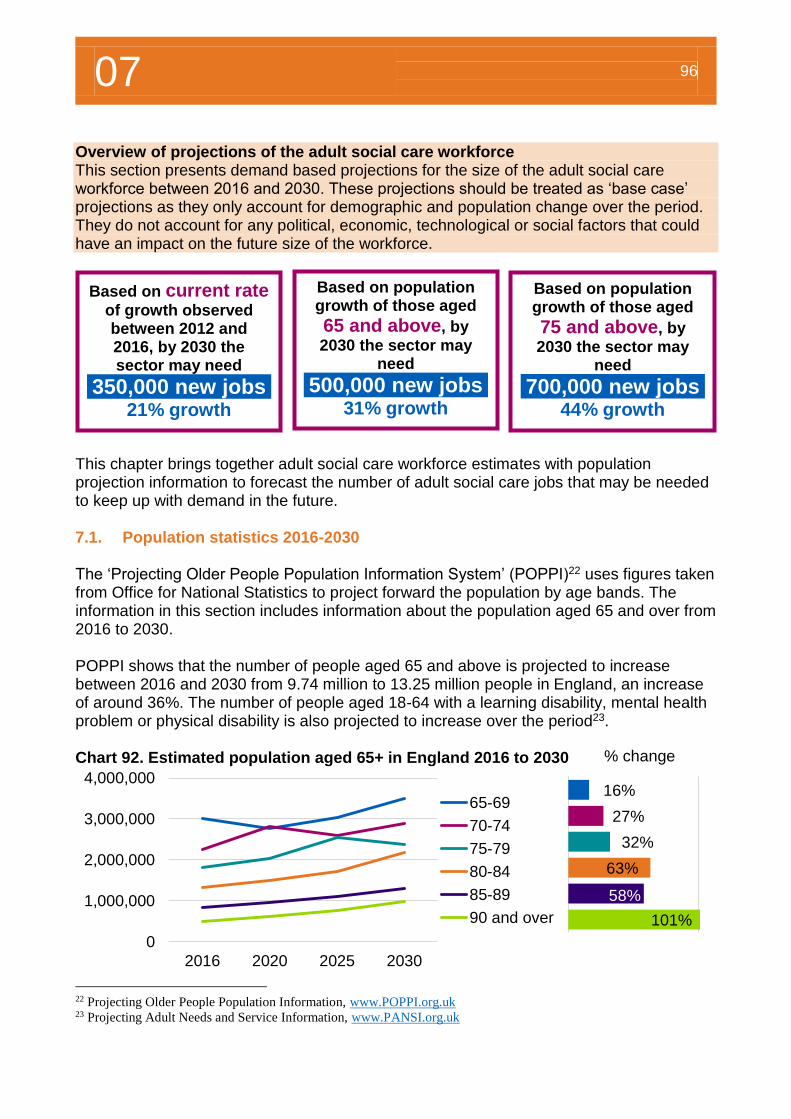
07 96
16%
27%
32%
63%
58%
101%
% change
Overview of projections of the adult social care workforce This section presents demand based projections for the size of the adult social care workforce between 2016 and 2030. These projections should be treated as ‘base case’ projections as they only account for demographic and population change over the period. They do not account for any political, economic, technological or social factors that could have an impact on the future size of the workforce.
7. Workforce forecasts This chapter brings together adult social care workforce estimates with population projection information to forecast the number of adult social care jobs that may be needed to keep up with demand in the future. 7.1. Population statistics 2016-2030 The ‘Projecting Older People Population Information System’ (POPPI)22 uses figures taken from Office for National Statistics to project forward the population by age bands. The information in this section includes information about the population aged 65 and over from 2016 to 2030. POPPI shows that the number of people aged 65 and above is projected to increase between 2016 and 2030 from 9.74 million to 13.25 million people in England, an increase of around 36%. The number of people aged 18-64 with a learning disability, mental health problem or physical disability is also projected to increase over the period23. Chart 92. Estimated population aged 65+ in England 2016 to 2030
22 Projecting Older People Population Information, www.POPPI.org.uk 23 Projecting Adult Needs and Service Information, www.PANSI.org.uk
0
1,000,000
2,000,000
3,000,000
4,000,000
2016 2020 2025 2030
65-69
70-74
75-79
80-84
85-89
90 and over
Based on current rate of growth observed between 2012 and 2016, by 2030 the sector may need
350,000 new jobs 21% growth
Based on population growth of those aged
65 and above, by
2030 the sector may need
500,000 new jobs 31% growth
Based on population growth of those aged
75 and above, by
2030 the sector may need
700,000 new jobs
44% growth
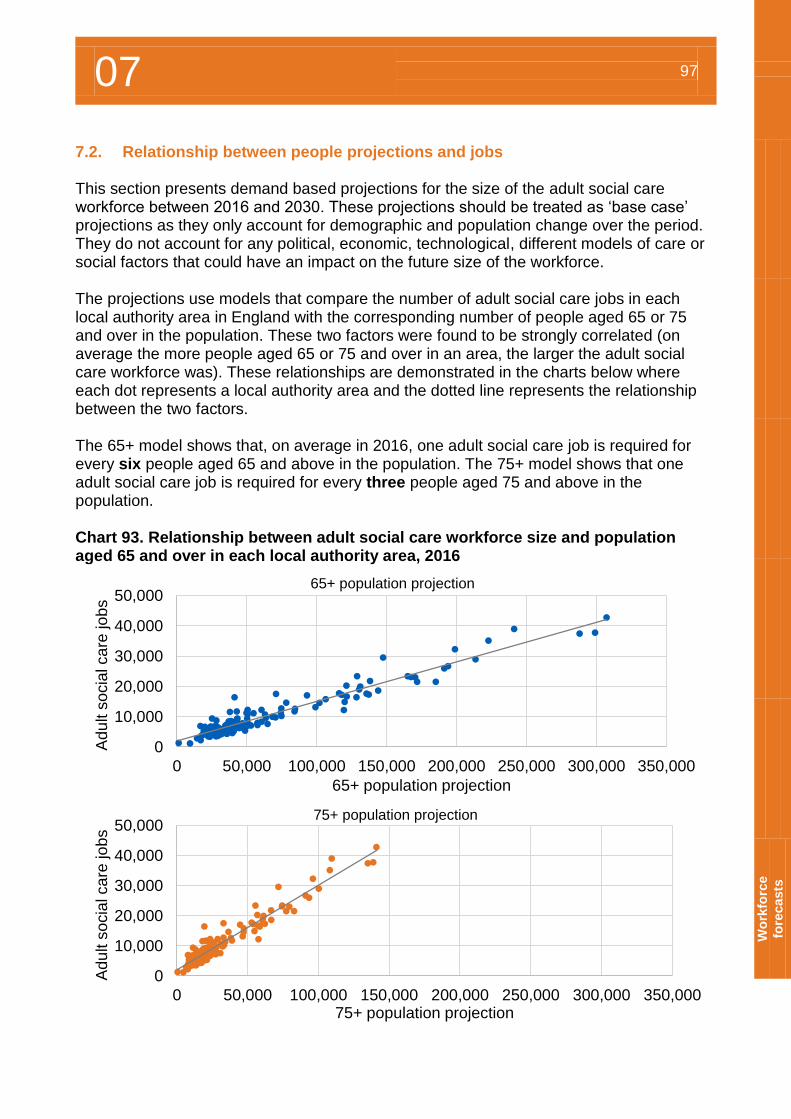
07 97
W
ork
forc
e
fore
casts
7.2. Relationship between people projections and jobs This section presents demand based projections for the size of the adult social care workforce between 2016 and 2030. These projections should be treated as ‘base case’ projections as they only account for demographic and population change over the period. They do not account for any political, economic, technological, different models of care or social factors that could have an impact on the future size of the workforce. The projections use models that compare the number of adult social care jobs in each local authority area in England with the corresponding number of people aged 65 or 75 and over in the population. These two factors were found to be strongly correlated (on average the more people aged 65 or 75 and over in an area, the larger the adult social care workforce was). These relationships are demonstrated in the charts below where each dot represents a local authority area and the dotted line represents the relationship between the two factors. The 65+ model shows that, on average in 2016, one adult social care job is required for every six people aged 65 and above in the population. The 75+ model shows that one adult social care job is required for every three people aged 75 and above in the population. Chart 93. Relationship between adult social care workforce size and population aged 65 and over in each local authority area, 2016
0
10,000
20,000
30,000
40,000
50,000
0 50,000 100,000 150,000 200,000 250,000 300,000 350,000
Ad
ult s
ocia
l ca
re jo
bs
65+ population projection
65+ population projection
0
10,000
20,000
30,000
40,000
50,000
0 50,000 100,000 150,000 200,000 250,000 300,000 350,000
Ad
ult s
ocia
l ca
re jo
bs
75+ population projection
75+ population projection
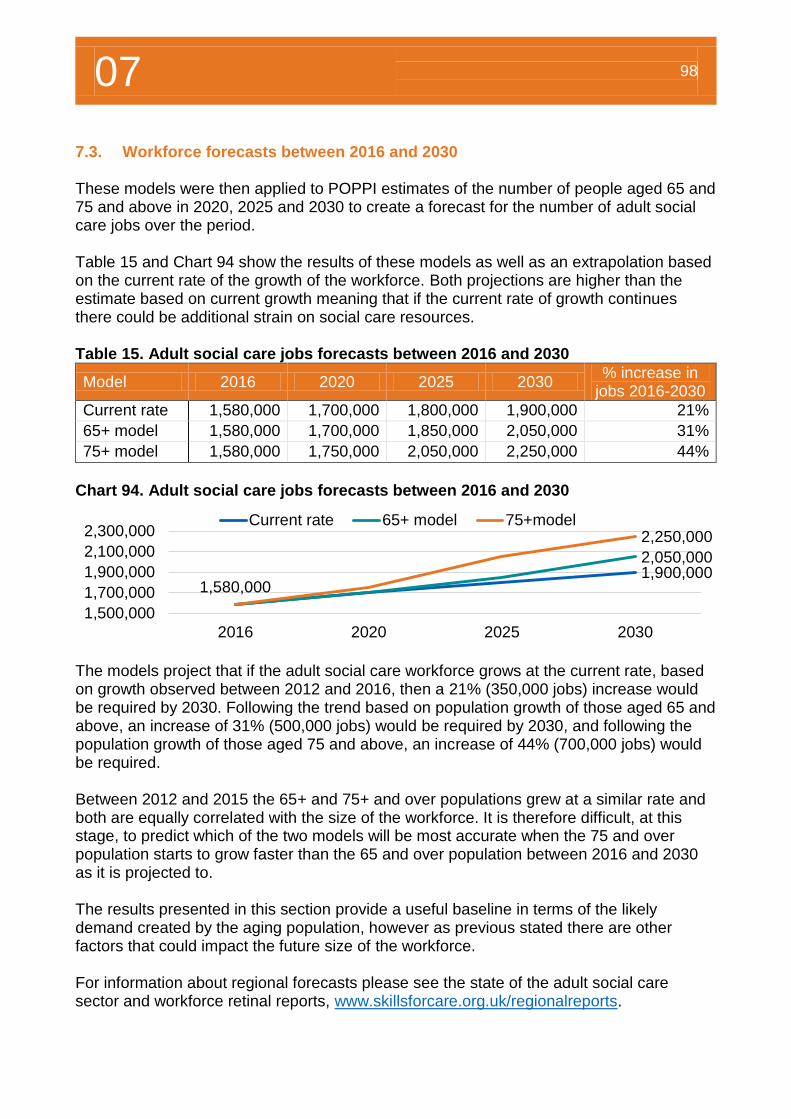
07 98
7.3. Workforce forecasts between 2016 and 2030 These models were then applied to POPPI estimates of the number of people aged 65 and 75 and above in 2020, 2025 and 2030 to create a forecast for the number of adult social care jobs over the period. Table 15 and Chart 94 show the results of these models as well as an extrapolation based on the current rate of the growth of the workforce. Both projections are higher than the estimate based on current growth meaning that if the current rate of growth continues there could be additional strain on social care resources. Table 15. Adult social care jobs forecasts between 2016 and 2030
Model 2016 2020 2025 2030 % increase in
jobs 2016-2030
Current rate 1,580,000 1,700,000 1,800,000 1,900,000 21%
65+ model 1,580,000 1,700,000 1,850,000 2,050,000 31%
75+ model 1,580,000 1,750,000 2,050,000 2,250,000 44%
Chart 94. Adult social care jobs forecasts between 2016 and 2030
The models project that if the adult social care workforce grows at the current rate, based on growth observed between 2012 and 2016, then a 21% (350,000 jobs) increase would be required by 2030. Following the trend based on population growth of those aged 65 and above, an increase of 31% (500,000 jobs) would be required by 2030, and following the population growth of those aged 75 and above, an increase of 44% (700,000 jobs) would be required. Between 2012 and 2015 the 65+ and 75+ and over populations grew at a similar rate and both are equally correlated with the size of the workforce. It is therefore difficult, at this stage, to predict which of the two models will be most accurate when the 75 and over population starts to grow faster than the 65 and over population between 2016 and 2030 as it is projected to. The results presented in this section provide a useful baseline in terms of the likely demand created by the aging population, however as previous stated there are other factors that could impact the future size of the workforce. For information about regional forecasts please see the state of the adult social care sector and workforce retinal reports, www.skillsforcare.org.uk/regionalreports.
1,900,0002,050,000
1,580,000
2,250,000
1,500,000
1,700,000
1,900,000
2,100,000
2,300,000
2016 2020 2025 2030
Current rate 65+ model 75+model

Further resources
08
8 100
Skills for Care provides outstanding workforce intelligence relied upon by government, strategic bodies, employers and individuals to make decisions that will improve outcomes for people who use services. NMDS-SC is recognised as the leading source of workforce intelligence for adult social care. This chapter provides an overview of some of the reports and resources published by Skills for Care that use NMDS-SC information. 8. Uses of NMDS-SC data and further resources 8.1. Workforce intelligence publications The size and structure of the adult social care sector and workforce in England The annual ‘size and structure of the adult social care sector and workforce in England’ includes estimates of the number of care providing organisations, establishments/care providing locations, people and job estimates, trend data and future projections. To access this report please visit www.skillsforcare.org.uk/sizeandstructure. Latest version, July 2017 The state of the adult social care sector and workforce by region
These nine annual regional reports provide an overview of adult social care services and the workforce in each region and have been generated using data from NMDS-SC. Each of these nine reports provides a regional look at much of the England level information provide in this report. To access any of these reports please visit www.skillsforcare.org.uk/regionalreports. Latest version, September 2017
Local authority area reports There are a series of two page summary reports for each of the 152 local authority areas in England, these reports are published twice a year, the latest reports focus on job role estimates by local authority area. To access any of these reports please visit www.skillsforcare.org.uk/regionalreports. Reports published twice a year, in March and September NMDS-SC briefings and trend briefings Skills for Care published short reports each year which highlight specific issues in the adult social care sector. Examples of briefing topics that have been covered in recently include; Care worker pay (post national living wage) Nationality of the adult social care workforce Social workers in the adult social care sector Diversity of the adult social care sector Registered nurses in the adult social care sector To access these briefings please visit www.skillsforcare.org.uk/briefings
8 101
Fu
rth
er
reso
urc
es
8.2. Workforce planning A good workforce plan will help your organisation be more successful and make sure that you have the right people in place to meet the changing needs and future opportunities for your business. The right people are those who are keen, skilled, have the right values and behaviours and know what they are doing. These people will provide high quality care and support and help your business to grow. Our resources are especially developed for small and medium sized organisations and explain: what workforce planning is and why it’s important what are the principles for it and who should be involved in it how it fits with how services are commissioned how workforce information should be used including data from the NMDS-SC how to do workforce planning using a step by step method. To access a copy of this guide and for more information about workforce planning, please visit www.skillsforcare.org.uk/workforceplanning. 8.3. Adult social care workforce estimates excel file To support workforce intelligence publications, Skills for Care has published an ‘Adult social care workforce estimates excel file’. This file includes the size and structure of the workforce, recruitment and retention information, employment information, demographics, pay rates, qualifications and training information, in England, by region, sector, service and job roles. Skills for Care uses data from the NMDS-SC as a basis for creating estimates of the size, structure and characteristics of the whole adult social care workforce. The 2017 adult social care workforce estimates are as at 2016/17. NMDS-SC data is as at March 2017 for the independent sector and September 2016 for local authorities. Please visit www.skillsforcare.org.uk/workforceestimates. New estimates are published in September each year, and updates made throughout the year when new workforce intelligence publications are released. 8.4. Analytical service The Skills for Care analysis team provide an external analysis service and can produce a range of in-depth reports depending on your specific requirements. Skills for Care’s highly experienced analysts can work with you to identify your requirements, and design and deliver bespoke workforce intelligence reports. We use NMDS-SC data to provide essential data in the form of reports or within a broader consultancy package to inform business decision making.
8 102
Our data services can be used when you need: evidence to help you make an important decision or develop a strategy information/analysis and a report that’s more in-depth and tailored to your needs trend information or help looking ahead with forecasts information for a bid benchmarking social care organisations/the workforce contributions to health and social care workforce integration projects. All available at the geographical level most relevant to your needs. Testimonial received by one of the directors of Carterwood, Ben Hartley, in 2017;
“Skills for Care has recently supplied Carterwood with data, and overall the service has proved to be very helpful, flexible, and prompt. The data provided has so far been exceedingly useful and exactly as agreed, and the Skills for Care team was keen to ensure it was exactly in the format that was most suitable for our needs. The data has helped form our understanding of the staffing market in the care sector, and provided some useful benchmarks with which to compare against in our new care home staffing report. I would most certainly recommend.”
Our locality staff deliver regular roadshows and events which include promoting NMDS-SC, and our support service offer free advice and support. If you and your organisation are looking for some more in-depth and one-to-one support in a variety of areas, for example ‘evidence-based decisions- getting the most from your NMDS-SC account for leaders and managers’ please email us so we can discuss your requirement in more detail. For more information about these services please email [email protected]. 8.5. Keeping Informed
To be kept up to date with Workforce Intelligence news please join our mailing list by registering with Skills for Care and selecting ‘workforce intelligence publications’. You can also follow us on twitter @SfC_NMDS_SC.


For more information
please contact
Skills for Care
West Gate
6 Grace Street
Leeds
LS1 2RP
© Skills for Care 2017