Embed Size (px)
Citation preview

STATE OF CALIFORNIA SEA-LEVEL RISE GUIDANCE DOCUMENT
Developed by the Coastal and Ocean Working Group of the California Climate Action Team (CO-CAT),
with science support provided by the Ocean Protection Council’s Science Advisory Team and the
California Ocean Science Trust
March 2013 update
Background, Purpose, and Intended Use
This document provides guidance for incorporating sea-level rise (SLR) projections into planning and
decision making for projects in California. This document was developed by the Coastal and Ocean
Working Group of the California Climate Action Team (CO-CAT) in response to Governor
Schwarzenegger‘s Executive Order S-13-08, issued on November 14, 2008, which directed state agencies
to plan for sea-level rise and coastal impacts. That executive order also requested the National Research
Council (NRC) to issue a report on sea-level rise (SLR) to advise California on planning efforts.
The final report from the NRC, Sea-Level Rise for the Coasts of California, Oregon, and Washington 1, was
released in June 2012. The Sea-Level Rise Guidance Document has been updated with the scientific
findings of the 2012 NRC report. The intent of this guidance document is to inform and assist state
agencies as they develop approaches for incorporating SLR into planning decisions with the most recent
and best available science, as published in the 2012 NRC report. Specifically, this document provides
information and recommendations to enhance consistency across agencies in their development of
approaches to SLR. Because of their differing mandates and decision-making processes, state agencies
will interpret and use this document in a flexible manner, taking into consideration risk tolerances,
timeframes, economic considerations, adaptive capacities, legal requirements and other relevant
factors. (Refer to Recommendation #2 below for a discussion of risk tolerance and adaptive capacity).
Although the estimates of future SLR provided in this document are intended to enhance consistency
across California state agencies, the document is not intended to prescribe that all state agencies use
specific or identical estimates of SLR as part of their assessments or decisions.
SLR potentially will cause many harmful economic, ecological, physical and social impacts and
incorporating SLR into agency decisions can help mitigate some of these potential impacts. For
example, SLR will threaten water supplies, coastal development, and infrastructure, but early
integration of projected SLR into project designs will lessen these potential impacts.
Summary of Guidance Development and Planned Future Updates
Staff from the CO-CAT member agencies worked collaboratively to develop the first version of this
document, the Interim Sea-Level Rise Guidance Document2 (2010), prior to the release of the NRC
1 Sea-Level Rise for the Coasts of California, Oregon, and Washington: Past, Present, and Future (2012).
http://www.nap.edu/catalog.php?record_id=13389 2 Sea-Level Rise Interim Guidance Document (2010).
http://opc.ca.gov/webmaster/ftp/pdf/agenda_items/20110311/12.SLR_Resolution/SLR-Guidance-Document.pdf

State of California Sea-Level Rise Guidance Document
Page 2 of 13
report. The Interim Sea-Level Rise Guidance Document (2010) was developed based on the best
available science at the time (the process for the development of the document is outlined in its
Appendix). As the Interim Sea-Level Rise Guidance Document explicitly called for an update when the
findings of the NRC report were available, the present document has been revised to include results
from the NRC report (for more information on the development of this version, please see Appendix A).
Because the science of SLR is continually advancing, this guidance document will be revised as necessary
to reflect the latest scientific understanding of how the climate is changing and how this change may
affect the rates of SLR.
Recommendations
CO-CAT reached agreement on the following policy recommendations based upon recent projections of
future SLR from the National Research Council’s 2012 report on Sea-Level Rise and input from the
scientists as listed in Appendix A.
1. Use the ranges of SLR presented in the June 2012 National Research Council report on Sea-
Level Rise for the Coasts of California, Oregon, and Washington as a starting place and
select SLR values based on agency and context-specific considerations of risk tolerance
and adaptive capacity. Table 1 (below) presents SLR projections based on the June 2012
NRC report on SLR. Refer to Recommendation # 2 for a discussion of time horizon, risk
tolerance, and adaptive capacity, which should be considered when choosing values of SLR
to use for specific assessments.
Table 1. Sea-Level Rise Projections using 2000 as the Baseline
Time Period North of Cape Mendocino3 South of Cape Mendocino
2000 - 2030 -4 to 23 cm
(-0.13 to 0.75 ft)
4 to 30 cm
(0.13 to 0.98 ft)
2000 – 2050 -3 to 48 cm
(-0.1 to 1.57 ft)
12 to 61 cm
(0.39 to 2.0 ft)
2000 – 2100 10 to 143 cm
(0.3 to 4.69 ft)
42 to 167 cm
(1.38 to 5.48 ft)
3 The differences in sea-level rise projections north and south of Cape Mendocino are due mainly to vertical land
movement. North of Cape Mendocino, geologic forces are causing much of the land to uplift, resulting in a lower
rise in sea level, relative to the land, than has been observed farther south.

State of California Sea-Level Rise Guidance Document
Page 3 of 13
Note: These projections incorporate a land ice component extrapolated from compilations
of observed ice mass accumulation and loss. It is important to note that the NRC report is
based on numerical climate models developed for the Intergovernmental Panel on Climate
Change (IPCC) Fourth Assessment Report4 which do not account for rapid changes in the
behavior of ice sheets and glaciers and thus likely underestimate sea-level rise (the new
suite of climate models for the Fifth Assessment Report was not available when the NRC
report was developed). The committee used the model results from the IPCC Fourth
Assessment Report, together with a forward extrapolation of land ice that attempts to
capture an ice dynamics component.5
2. Consider timeframes, adaptive capacity, and risk tolerance when selecting estimates of
SLR. The timeframe identified for a project is an important consideration for SLR projections
and will affect the approach for assessing SLR impacts. Until 2050, there is strong agreement
among the various climate models for the amount of SLR that is likely to occur. After mid-
century, projections of SLR become more uncertain; SLR projections vary with future
projections due in part to modeling uncertainties, but primarily due to uncertainties about
future global greenhouse gas emissions, and uncertainties associated with the modeling of
land ice melting rates. Therefore, for projects with timeframes beyond 2050, it is especially
important to consider adaptive capacity, impacts, and risk tolerance to guide decisions of
whether to use the low or high end of the ranges presented. Due to differing agencies
mandates, stakeholder input and other considerations, agencies may assess the adaptive
capacity of a project or action differently.
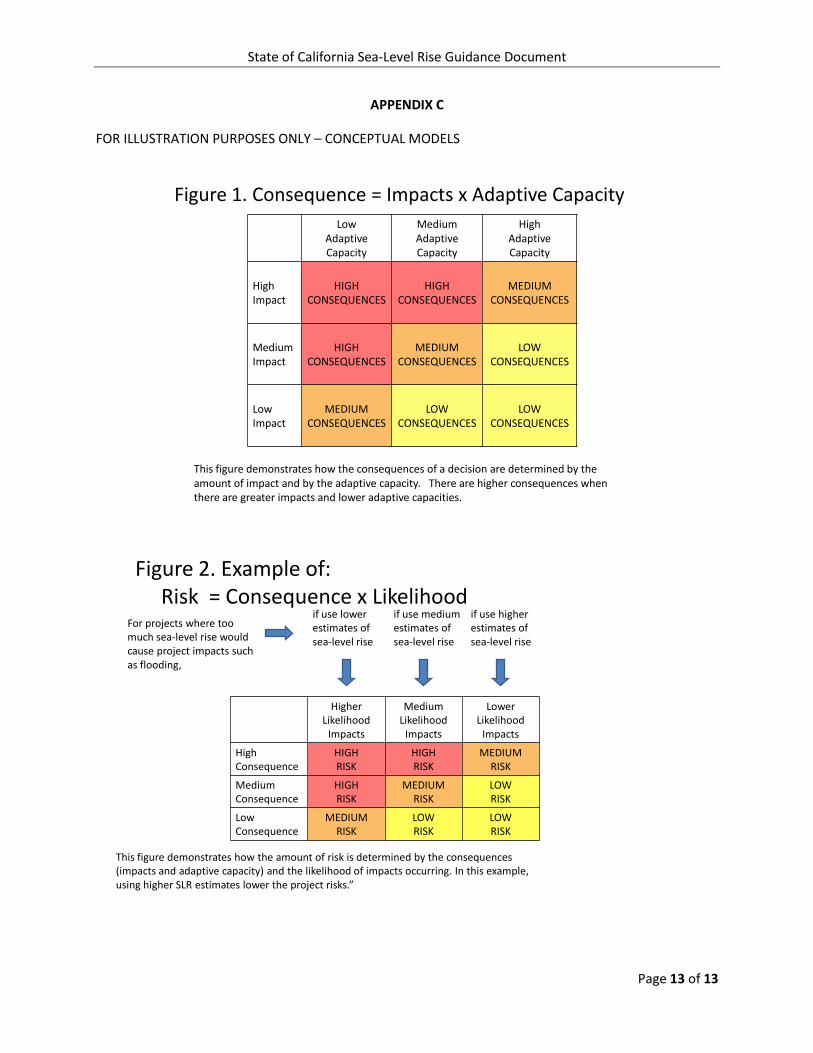
Consequences are a function of impacts and adaptive capacity
The consequences of failing to address SLR adequately for a particular project will depend
on both adaptive capacity and the potential impacts of SLR to public health and safety,
public investments, and the environment. Figure 1 in Appendix C illustrates how adaptive
capacity and potential impacts combine to produce consequences.
Adaptive capacity is the ability of a system to respond to climate change, to moderate
potential damages, to take advantage of opportunities, and to cope with the consequences.6
In most situations, adaptive capacity must be front-loaded, or built into the initial project; it
cannot be assumed that adaptive capacity can be developed when needed unless it has
been planned for in advance. A project that has high adaptive capacity and/or low potential
impacts will experience fewer consequences. For example, an unpaved trail built within a
4 Intergovernmental Panel on Climate Change (IPCC) Fourth Assessment Report (2007).
http://www.ipcc.ch/publications_and_data/publications_and_data_reports.shtml#1 5 Page 13, Sea-Level Rise for the Coasts of California, Oregon, and Washington: Past, Present, and Future (2012).
http://www.nap.edu/catalog.php?record_id=13389 6 Definition of adaptive capacity used in the 2009 California Climate Adaptation Strategy, based upon definition
provided in Climate Adaptation: Risk, Uncertainty and Decision-making, UK CIP (2003), UKCIP Technical Report, Oxford, Willows, R. I. and R. K. Cornell (eds.).

State of California Sea-Level Rise Guidance Document
Page 4 of 13
rolling easement with space to retreat has high adaptive capacity (because the trail and
easement can be relocated as sea level rises) and therefore will experience fewer harmful
consequences from SLR. In contrast, a new wastewater treatment facility located on a
shoreline with no space to relocate inland has low adaptive capacity and high potential
impacts from flooding (related to public health and safety, public investments, and the
environment). The negative consequences for such a project of failing to consider a large
amount of SLR would therefore be high.
Risk Tolerance
The amount of risk involved in a decision depends on both the consequences and the
likelihood of realized impacts that may result from SLR. These realized impacts, in turn,
depend on the extent to which the project design integrates an accurate projection of SLR.
However, current SLR projections provide a range of potential SLR values and lack precision
(see Table 1 above). Therefore, agencies must consider and balance the relative risks
associated with under- and/or over-estimating SLR in making decisions.7
Figure 2 in Appendix C illustrates this relationship for a project in which underestimating SLR
in the project design will result in harmful realized impacts such as flooding. In this case,
harmful impacts are more likely to occur if the project design is based upon a low projection
of SLR and less likely if higher estimates of SLR are used. In situations with high
consequences (high impacts and/or low adaptive capacity), using a low SLR value therefore
involves a higher degree of risk.
3. Consider storms and other extreme events. Coastal ecosystems, development, and public
access are most at risk from storm events, including the confluence of large waves, storm
surges, and high astronomical tides during a strong El Niño.8 Water levels reached during
these large, short-term events have caused significant damage along coast. For example, a
strong El Niño combined with a series of storms during high-tide events caused more than
$200 million dollars in damage (in 2010 dollars) to the California coast during the winter of
1982-83. In the next few decades, most of the damage along the coast will likely result from
extreme events. Historical records are one of the main sources for information on the
extremes that are possible, and the damages that can result. Planning activities and project
design would be improved by considering impacts from extreme events. Future sea level will
be a starting point for project design considerations. Where feasible, consideration should
7 Examples of harmful impacts that might result from underestimating SLR include damage to infrastructure, and
inundation of marsh restoration projects located too low relative to the tides. Examples of harmful impacts that might result from overestimating SLR include financial costs of over-engineering shoreline structures, locating in-water development in too shallow a depth to avoid navigational hazards, and marsh restoration projects located too high relative to the tides. 8 Page 7, Sea-Level Rise for the Coasts of California, Oregon, and Washington: Past, Present, and Future (2012).
http://www.nap.edu/catalog.php?record_id=13389

State of California Sea-Level Rise Guidance Document
Page 5 of 13
be given to scenarios that combine extreme oceanographic conditions on top of the highest
water levels projected to result from SLR over the expected life of a project.
4. Coordinate with other state agencies when selecting values of SLR and, where appropriate
and feasible, use the same projections of sea-level rise. For projects developed by or
under the regulatory authority of multiple agencies, using the same SLR values will increase
efficiency of analyses and promote consistency. Agencies may select other values depending
on their particular guiding policies and considerations related to risk, ability to incorporate
phased adaptation into design, and other factors.
5. Future SLR projections should not be based on linear extrapolation of historic sea level
observations. For estimates beyond one or two decades, linear extrapolation of SLR based
on historic observations is inadequate and would likely underestimate the actual SLR.
According to the OPC Science Advisory Team, because of non-linear increases in global
temperature and the unpredictability of complex natural systems, linear projections of
historical SLR are likely to be inaccurate.
6. Consider changing shorelines. California’s very dynamic coast will evolve under rising sea
level and assessments of impacts from SLR to shoreline projects must address local
shoreline changes. For example, there could be less significant coastal change due to SLR in
areas of high sediment supply (e.g., offshore of large northern CA rivers), whereas the coast
may recede or change very dramatically in other areas (low sediment supply, presence of
eroding bluffs or dunes, etc.). Existing resources for assessing future erosion/accretion rates
include: U.S. Geological Survey report on shoreline changes for California’s beach habitat,9
U.S. Geological Survey report on shoreline changes for California’s bluff habitat.10
7. Consider predictions in tectonic activity. The 2012 NRC report highlights the significant risk
posed to the region north of Cape Mendocino from a large earthquake (magnitude greater
than 8) along the Cascadia Subduction Zone, which could cause significant land subsidence
resulting in instantaneous sea-level rise as well as a tsunami. In subduction zones, strain
builds within the fault zone causing land to rise slowly before subsiding abruptly during an
earthquake. The last great earthquake of the region occurred in 1700, causing an
instantaneous rise in relative sea level of up to 2m due to land subsidence. Because this
guidance document is targeted towards advising on climate induced changes in sea level, it
will not provide guidance on changes in sea level from tectonic activity. However, this
information is included because it was an important finding of the NRC 2012 report.
9 Cheryl Hapke et. al, National Assessment of Shoreline Change Part 3: Historical Shoreline Change and Associated
Coastal Land Loss along Sandy Shorelines of the California Coast (U.S. Geological Survey Open File Report 2006-1219, 2006). http://pubs.usgs.gov/of/2006/1219/ 10
Cheryl Hapke et. al, National Assessment of Shoreline Change Part 4: Historical coastal cliff retreat along the California coast (U.S Geological Survey Open File Report 2007-1133, 2007). http://pubs.usgs.gov/of/2007/1133/

State of California Sea-Level Rise Guidance Document
Page 6 of 13
8. Consider trends in relative local mean sea level. Relative sea level is the sea level relative
to the elevation of the land. In California, the land elevation along the coast is changing due
to factors including tectonic activity and subsidence. The National Oceanic and Atmospheric
Administration provides a summary of the trends in the measured relative sea level at tidal
gauges (water level recorders) in California that have been operating for at least 30 years
http://tidesandcurrents.noaa.gov/sltrends/index.shtml. Predictions of future sea levels at
specific locations will be improved if relative trends in sea level from changes in land
elevation are factored into the analysis.

State of California Sea-Level Rise Guidance Document
Page 7 of 13
APPENDIX A
Development of this Document
The Coastal and Ocean Working Group of the California Climate Action Team (CO-CAT), led by the Ocean
Protection Council (OPC), developed this document. CO-CAT includes staff from the following state
entities:
Business, Transportation and Housing Agency,
Coastal Commission,
Department of Fish and Game,
Department of Parks and Recreation,
Department of Public Health,
Department of Toxic Substances Control,
Department of Transportation,
Department of Water Resources,
Environmental Protection Agency,
Governor’s Office of Planning and Research,
Natural Resources Agency,
Ocean Protection Council,
Ocean Science Trust,
San Francisco Bay Conservation and Development Commission,
State Coastal Conservancy,
State Lands Commission, and
State Water Resources Control Board.
Staff from these state entities worked collaboratively from July through October 2010 to develop the
interim version of this document, the Interim Guidance Document (2010), and reached agreement on
the document’s recommendations. Upon the release of the NRC Report in June 2012, numerous
meetings and workshops were held to familiarize agencies and the public with its findings. On
November of 2012 CO-CAT members reconvened to discuss the update of this document. CO-CAT
members came to consensus over retaining the policy recommendations stated in the Interim Guidance
Document (2010), and updating the Guidance Document per the new set of ranges of SLR presented in
the 2012 NRC report, and incorporating new scientific findings on the hazards associated with storms
and tectonic activity as a potential source of change in relative sea level.
The 2012 NRC Report, unlike the Interim Guidance Document, divides the California coast into two
separate regions – north of Cape Mendocino and south of Cape Mendocino. The projections for north of
Cape Mendocino incorporate the uplift trends that are partially associated with the Cascadia Subduction
Zone and result in very different projections for sea level rise than are anticipated for the rest of the
coast. For the coast from Cape Mendocino to the Mexican Border, the 2012 NRC projections for the
years 2030 and 2050 are similar to the projections presented in the Interim Guidance Document (2010),
but have a wider range. For this same area, the NRC projections by 2100 are slightly lower than those in

State of California Sea-Level Rise Guidance Document
Page 8 of 13
Interim Guidance Document (2010), due to differences in modeling approaches and consideration of
regional impacts.
OPC staff, directed by CO-CAT members, worked with the California Ocean Science Trust (whose
Executive Director is the OPC’s Science Advisor) to ensure that the update to this document best
incorporated the scientific findings in the 2012 NRC report. A sub-committee of relevant subject matter
experts from the OPC’s Science Advisory Team responded to questions posed on how to adapt tables
and figures from the NRC Study to better serve the Guidance Document’s audience. The questions
posed and responses can be found in Appendix B.

State of California Sea-Level Rise Guidance Document
Page 9 of 13
APPENDIX B
Responses to February 2013 Questions for the Ocean Protection Council’s Science Advisory Team from
the Sea Level Rise Task Force of the Ocean and Coastal Working Group of the California Climate Action
Team (CO-CAT)
March 1, 2013
These responses were developed by a sub-committee of scientists from the OPC Science Advisory Team
(OPC-SAT) who work directly on sea-level rise issues. Two of the scientists were also members of the
NRC Committee that prepared the 2012 Report on West Coast Sea-Level Rise:
1. Dr. Dan Cayan, Research Meteorologist, UC San Diego Scripps Institution of Oceanography
& United States Geological Survey
2. Dr. Gary Griggs, Director of Institute of Marine Sciences and Distinguished Professor of Earth
and Planetary Sciences, UC Santa Cruz
3. Dr. Sam Johnson, Research Geologist, United States Geological Survey Pacific Science
Center, Santa Cruz
Following the completion and release of the National Research Council’s report: Sea-Level Rise for the
Coasts of California, Oregon and Washington: Past, Present, and Future (2012), CO-CAT sought to
update the Sea-Level Rise Guidance Document. The following questions were posed to the OPC-SAT
sub-committee:
Questions
Sea-Level Rise for the Coasts of California, Oregon, and Washington: Past, Present, and Future
1. The report outlines ranges of sea-level rise rates for the time horizons 2030, 2050 and 2100
(Table 5.3, page 96):
a. We would like to be able to recommend ranges for the time horizons utilized (2030,
2050, and 2100) for zones north of Cape Mendocino and south of Cape Mendocino.
However, we are not sure what range of numbers we could recommend to the area
north of Cape Mendocino so that those communities can plan for sea-level rise given
the tectonic risks specific to that region.
b. Given the components in Table 5.3 (page 96), the sum of all contributions does not add
up. Can you please explain how the contributions add up?
2. There are sea-level rise ranges presented for major cities along the West Coast. Would utilizing
the rates presented for these cities more accurately reflect the science over utilizing the regional
(north or south of Cape Mendocino) ranges?

State of California Sea-Level Rise Guidance Document
Page 10 of 13
Responses
Prior to answering these specific questions, the sub-committee wants to reiterate some key points from
our September 1, 2010 response.
1. Over the next few decades, episodes of heightened sea level associated with large winter storms and
anomalous short period climate patterns will be of greater concern to infrastructure and development in
coastal areas than the relatively slow increases that are projected in association with global sea-level
rise alone. The coast of California has experienced two very large El Niño events over the past 20 years,
in 1982-83 and 1997-98, when large storms resulted in hundreds of millions of dollars in storm damage
to private property and public infrastructure. The damages occurred from a combination of elevated sea
levels and large storm waves, especially when these factors coincided with high tides. During the 1983
ENSO event, sea levels were the highest ever recorded in San Diego, Los Angeles and San Francisco, 29.0
cm) (11.4 in.), 32.3 cm (12.7 in), and 53.8 cm (21.2 in.), respectively, above predicted high tides.
This point was also made clear in the NRC Report (Executive Summary p. 6):
Most of the damage along the California, Oregon, and Washington coasts is caused by storms-
particularly the confluence of large waves, storm surges, and high astronomical tides during a strong El
Niño. The water levels reached during these large, short-term events have exceeded mean sea levels
projected for 2030 and are equivalent to values projected for 2050, so understanding their additive
effects is crucial for coastal planning.
2. Coastal hazards in California vary geographically and will evolve through this century based on a
combination of sea-level rise, possible changes in storm climate, and tectonic uplift or subsidence.
Different coastal environments will be exposed to different risks and these risks are expected to increase
in the future. Each of these needs to be understood, their risks assessed and adaptation measures
developed.
a. Inundation of coastal flooding along the low lying portions of the open coast
b. Inundation of low-lying areas around San Francisco Bay
c. Coastal erosion of cliffs, bluffs and dunes
d. Rapid land-level change (primarily subsidence) north of Cape Mendocino during a
subduction zone earthquake that is likely to occur in the next several hundred years
We do not believe that there is enough certainty in the sea-level rise projections nor is there a strong
scientific rationale for specifying specific sea-level rise values at individual locations along California’s
coastline. The uncertainties in future sea-level rise projections increase as the projected time horizon is
extended forward through the 21st Century. These uncertainties arise from an incomplete
understanding of the global climate system, the inherent unpredictability of natural climate variation,
the inability of global climate models to accurately represent all important global and regional

State of California Sea-Level Rise Guidance Document
Page 11 of 13
components, and the need to make assumptions about important climate drivers over future decades
(e.g., greenhouse gas emissions, aerosols, land use).
For the near future (out to 2030), confidence in the global and regional projections is relatively high, but
uncertainty grows larger as the time horizon of the projection is extended forward. There are large
uncertainties in projections for 2100 made using any existing methodology, including process-based
numerical models, extrapolations, and semi-empirical methods. The actual sea-level rise value for 2100
is likely to fall within the wide uncertainty bounds provided in the NRC West Coast Sea Level Rise Report,
but a precise value cannot be specified with any reasonable level of confidence.
The sections of coastline north and south of Cape Mendocino clearly are parts of different tectonic
regimes and tide gages have recorded distinct regional values over their periods of record. The tide gage
for the North Spit at Humboldt Bay extends back to 1977 and has recorded an average sea-level rise of
+4.73 +/- 1.58 mm/yr., equivalent to 1.55 ft./100 years. This is considerably higher than the global
average and indicates significant subsidence in this location. Sixty-five miles north at Crescent City, the
tide gage record extends back to 1933 and shows, over the period of record, a local drop in sea level of -
0.65 +/-0.36 mm/yr., equivalent to -0.21 ft./100 years. The drop in sea level is explained by a rising
coastline near Crescent City due to flexure of the North American tectonic plate above the subducting
Juan de Fuca plate. We believe it is advisable to use the two different rates (augmented by any future
acceleration in rates of sea level rise) for the areas closest to these two gages, with intermediate values
for the areas between them. What is certain to happen when the next large subduction zone
earthquake occurs, however, is that there will likely be essentially instantaneous coastal subsidence
north of Cape Mendocino that could be as much as three feet or more.
From Cape Mendocino to San Diego, based on the NRC report findings and the general lack of large
variation between the data from the open coast NOAA tide gage stations with the longest and most
consistent records, we believe that using a single sea-level rise value is the presently the best and most
tractable approach. Historic sea-level rise rates from tide gages range from about 0.8 to 2.1 mm/yr.
Table 5.2 in the NRC report projects essentially identical values for both San Francisco and Los Angeles
for 2030 (14.4-14.7 +/- 5 cm), 2050 (28.0-28.4 +/- 9.1 cm) and 2100 (91.0-93.1 +/- 25 cm).
These values can be refined in future decades as we continue to gather additional sea-level rise and
vertical land-motion data from tide gages, satellite altimetry, and GPS surveys, and as long-term trends
become clearer, but careful, sustained monitoring is essential to carry this out.
For the near future it will continue to be short-term extremes that flood low-lying areas and increase
rates of cliff, bluff and dune erosion that will generate the highest risks. These extremes will likely arise
when a combination of factors occur, including ENSO events, high tides, storm surges, wave set up and
wave run up. Along the California coast, these extreme storm events almost always occur in the winter
months, and expose coastal development, whether public or private, to the greatest hazard. As global
climate warms and global sea level continues to rise, these storm events, even if they do not increase in
intensity or duration, will likely have even greater impacts on the California coast.

State of California Sea-Level Rise Guidance Document
Page 12 of 13
Additional factors for state agencies to consider in selecting a sea-level rise rate from the projected
ranges that are included in the NRC report for any future coastal facility or infrastructure project
include:
1. The projected lifespan of the project of facility
2. The cost or value of the project or a replacement facility
3. The impact or consequence of damage to or loss of a facility or project
State of California Sea-Level Rise Guidance Document
Page 13 of 13
APPENDIX C
FOR ILLUSTRATION PURPOSES ONLY – CONCEPTUAL MODELS
HigherLikelihood
Impacts
Medium Likelihood
Impacts
Lower Likelihood
Impacts
HighConsequence
HIGH RISK
HIGH RISK
MEDIUMRISK
Medium Consequence
HIGHRISK
MEDIUMRISK
LOWRISK
LowConsequence
MEDIUMRISK
LOWRISK
LOWRISK
if use lower estimates ofsea-level rise
if use medium estimates ofsea-level rise
if use higher estimates ofsea-level rise
Figure 2. Example of:Risk = Consequence x Likelihood
This figure demonstrates how the amount of risk is determined by the consequences (impacts and adaptive capacity) and the likelihood of impacts occurring. In this example, using higher SLR estimates lower the project risks.”
For projects where too much sea-level rise would cause project impacts such as flooding,
Low Adaptive Capacity
Medium Adaptive Capacity
HighAdaptive Capacity
HighImpact
HIGH CONSEQUENCES
HIGH CONSEQUENCES
MEDIUMCONSEQUENCES
Medium Impact
HIGH CONSEQUENCES
MEDIUMCONSEQUENCES
LOWCONSEQUENCES
LowImpact
MEDIUMCONSEQUENCES
LOWCONSEQUENCES
LOWCONSEQUENCES
Figure 1. Consequence = Impacts x Adaptive Capacity
This figure demonstrates how the consequences of a decision are determined by the amount of impact and by the adaptive capacity. There are higher consequences when there are greater impacts and lower adaptive capacities.