Embed Size (px)
Citation preview
GUIDANCE FOR INCORPORATING SEA LEVEL RISE
INTO CAPITAL PLANNING IN SAN FRANCISCO:
ASSESSING VULNERABILITY AND RISK
TO SUPPORT ADAPTATION
Prepared by the City and County of San Francisco
Sea Level Rise Committee
for the San Francisco Capital Planning Committee
Adopted by the Capital Planning Committee
September 22, 2014
2
Guidance for Incorporating Sea Level Rise into Capital Planning in San Francisco September 22, 2014
THIS PAGE LEFT INTENTIONALLY BLANK
3
Guidance for Incorporating Sea Level Rise into Capital Planning in San Francisco September 22, 2014
GUIDANCE FOR INCORPORATING SEA LEVEL RISE INTO CAPITAL PLANNING IN SAN FRANCISCO
TABLE OF CONTENTS
Introduction and Goals of this Guidance 4 The Capital Planning Committee and Process 5 Revisiting and Updating this Guidance 5 Sea Level Rise and Coastal Hazards 6 Outline of this Guidance 8 1. Sea Level Science Review 10
a. Sea Level Rise Estimates 10 b. Storm Surge and Waves 11 c. Sea Level Rise Scenario Selection 13 d. Sea Level Rise Inundation Mapping 13
2. Vulnerability Assessment 15 a. Exposure 15 b. Sensitivity 15 c. Adaptive Capacity 16 3. Risk Assessment 17 4. Adaptation Plan Development 18 Permitting and Regulatory Considerations 20 Example Applications of Guidance in Capital Planning 22 Appendix 1: Sea Level Rise Committee Members 24 Appendix 2: Summary of the Science 25 Appendix 3: Sea Level Rise and Storm Surge 31 Appendix 4: Projections of Sea Level Rise for Other Years 33 Appendix 5: Checklist 34 Appendix 6: Links to Additional Resources 37
4
Guidance for Incorporating Sea Level Rise into Capital Planning in San Francisco September 22, 2014
GUIDANCE FOR INCORPORATING SEA LEVEL RISE INTO
CAPITAL PLANNING IN SAN FRANCISCO:
ASSESSING VULNERABILITY AND RISK
TO SUPPORT ADAPTATION
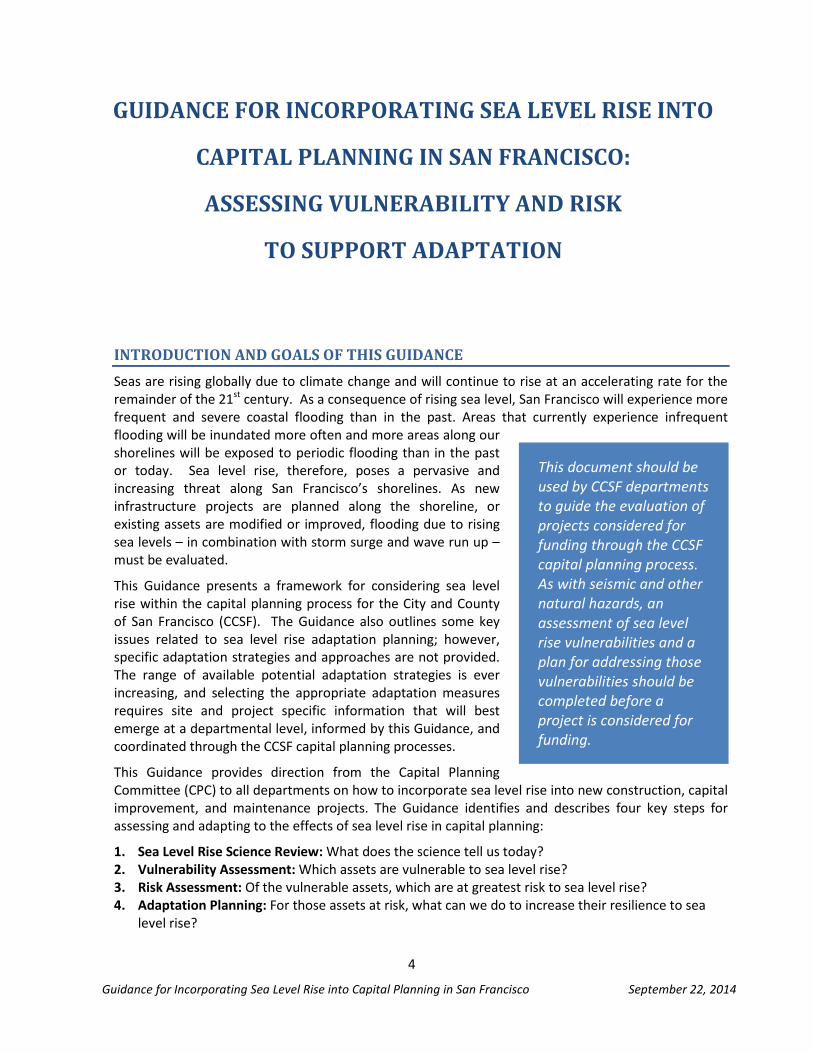
INTRODUCTION AND GOALS OF THIS GUIDANCE Seas are rising globally due to climate change and will continue to rise at an accelerating rate for the remainder of the 21st century. As a consequence of rising sea level, San Francisco will experience more frequent and severe coastal flooding than in the past. Areas that currently experience infrequent flooding will be inundated more often and more areas along our shorelines will be exposed to periodic flooding than in the past or today. Sea level rise, therefore, poses a pervasive and increasing threat along San Francisco’s shorelines. As new infrastructure projects are planned along the shoreline, or existing assets are modified or improved, flooding due to rising sea levels – in combination with storm surge and wave run up – must be evaluated.
This Guidance presents a framework for considering sea level rise within the capital planning process for the City and County of San Francisco (CCSF). The Guidance also outlines some key issues related to sea level rise adaptation planning; however, specific adaptation strategies and approaches are not provided. The range of available potential adaptation strategies is ever increasing, and selecting the appropriate adaptation measures requires site and project specific information that will best emerge at a departmental level, informed by this Guidance, and coordinated through the CCSF capital planning processes.
This Guidance provides direction from the Capital Planning Committee (CPC) to all departments on how to incorporate sea level rise into new construction, capital improvement, and maintenance projects. The Guidance identifies and describes four key steps for assessing and adapting to the effects of sea level rise in capital planning:
1. Sea Level Rise Science Review: What does the science tell us today? 2. Vulnerability Assessment: Which assets are vulnerable to sea level rise? 3. Risk Assessment: Of the vulnerable assets, which are at greatest risk to sea level rise? 4. Adaptation Planning: For those assets at risk, what can we do to increase their resilience to sea
level rise?
This document should be used by CCSF departments to guide the evaluation of projects considered for funding through the CCSF capital planning process. As with seismic and other natural hazards, an assessment of sea level rise vulnerabilities and a plan for addressing those vulnerabilities should be completed before a project is considered for funding.
5
Guidance for Incorporating Sea Level Rise into Capital Planning in San Francisco September 22, 2014
It should be noted that urban flooding – flooding that occurs inland when the storm sewer system exceeds its capacity – is not specifically addressed by this Guidance. Sea level rise will exacerbate urban flooding, particularly when precipitation events coincide with high tides, therefore this Guidance document can be used to inform urban flooding assessments. However, this Guidance focuses primarily on the contribution of sea level rise to coastal flooding hazards. It is recognized that some projects may require consideration of additional climate change impacts, such as changes in future precipitation events, in order to fully quantify climate change related vulnerability and risk.
THE CAPITAL PLANNING COMMITTEE AND PROCESS The CPC makes recommendations to the Mayor and Board of Supervisors on all of the City’s capital expenditures. The Committee is chaired by the City Administrator and includes all capital-intensive department heads as well as the President of the Board, the Planning Director, the Controller, and the Mayor’s Budget Director.
Each year the CPC reviews and approves the City’s Capital Budget and any issuances of long-term debt related to infrastructure projects. The CPC is also responsible for approving the City’s 10-Year Capital Plan – a constrained long-term finance plan that prioritizes projects based on an approved set of funding principles. The Capital Plan provides a road map for ensuring the long-term safety, accessibility and modernization of San Francisco’s public infrastructure and facilities. After the CPC approves the Capital Plan, it is sent to the Board of Supervisors and the Mayor for final adoption.
This Guidance provides CCSF departments with a step-by-step approach for considering sea level rise vulnerability, risk and adaptation planning within their department Capital Plans. The CPC, in turn, will use this Guidance to determine whether department Capital Plans have adequately addressed sea level rise vulnerabilities, risk and adaptation. If all departments follow this Guidance when developing their individual Capital Plans, the combined CCSF Capital Plan will ensure the resilience of San Francisco’s public infrastructure projects to anticipated sea level rise.
It is recognized that some departments may want to address sea level rise on a larger sub-regional level rather than at a project level. For those instances where SLR has been addressed at a larger sub-regional level, any future individual projects within the sub-region shall satisfy the requirements by reference to the sub-regional project. In these cases, the Guidance (and subsequent updates) should still be used to prepare Capital Plans, albeit at a larger or sub-regional level, and applied as individual projects are implemented.
While primary responsibility for developing resilient Capital Plans resides within each department, the CPC and the City Administrator’s Office (CAO) encourage and support collaborative planning across CCSF government. This Guidance facilitates the use of a common approach across all departments. The Guidance recommends using the same underlying science, tools (i.e., inundation maps), and methods, thereby increasing the potential for seamless collaboration and integration. This collaboration is most critical where infrastructure, and the adaptation plans needed to address the vulnerabilities of that infrastructure, cross departmental borders (see sidebars discussing Ocean Beach and the Bayside seawall).
REVISITING AND UPDATING THIS GUIDANCE The science related to understanding the impacts of climate change is continually evolving and advancing over time. Therefore, guidance documents like these must be revisited and updated at regular intervals. This Guidance will be revisited four years from publication in order to allow
6
Guidance for Incorporating Sea Level Rise into Capital Planning in San Francisco September 22, 2014
incorporation of new science after two capital planning cycles have been completed. Revision of the Guidance sooner than this will occur if new information comes to light requiring significant adjustment of SLR projections or other elements of the Guidance. In addition, it is anticipated that as usage of the Guidance increases, individual departments may identify process improvements and suggest updates to the Guidance for use by the CPC and others.
SEA LEVEL RISE AND COASTAL HAZARDS San Francisco is susceptible to coastal flooding and wave hazards along three sides of the city, with the open Pacific Ocean to the west and San Francisco Bay to the north and east. Several areas along the shoreline are already experiencing periodic inundation and erosion, including: Ocean Beach on the Pacific Coast, which is subjected to significant coastal storms and waves; the Embarcadero, which is overtopped in several areas during the annual extreme high tides, or King Tides; and San Francisco International Airport (SFO), which experiences wave overtopping of flood protection structures and inundation of low-lying areas. Projected sea level rise will worsen these existing hazards by increasing the frequency of flooding, extending the coastal flood hazard zone further inland, and accelerating shoreline erosion. Areas of the shoreline that have been filled, such as the Embarcadero, Mission Bay, SFO, and Treasure Island, are especially at risk, as rising sea levels may influence groundwater levels, resulting in increased subsidence and liquefaction hazards.
The following coastal flood hazards may increase due to sea level rise: • Daily tidal inundation: as sea level rises, the amount
of land and infrastructure subjected to daily inundation by high tides will increase. This would result in increased permanent future inundation of low-lying areas.
• Annual high tide inundation (King Tides): King Tides are abnormally high but predictable astronomical tides that occur approximately twice per year. King Tides are the highest tides that occur when the Moon and the Sun simultaneously exert their gravitational influence on the Earth (typically the two solstices). When King tides occur with winter storms, the effects are particularly pronounced and make these events more dramatic. King Tides result in temporary inundation, particularly associated with nuisance flooding, such as inundation of low-lying roads, boardwalks, and waterfront promenades. The Embarcadero waterfront (Pier 14) and the Marina area in San Francisco experience inundation under current King Tide conditions (see Port seawall sidebar, which highlights inundation that occurs under King Tides).
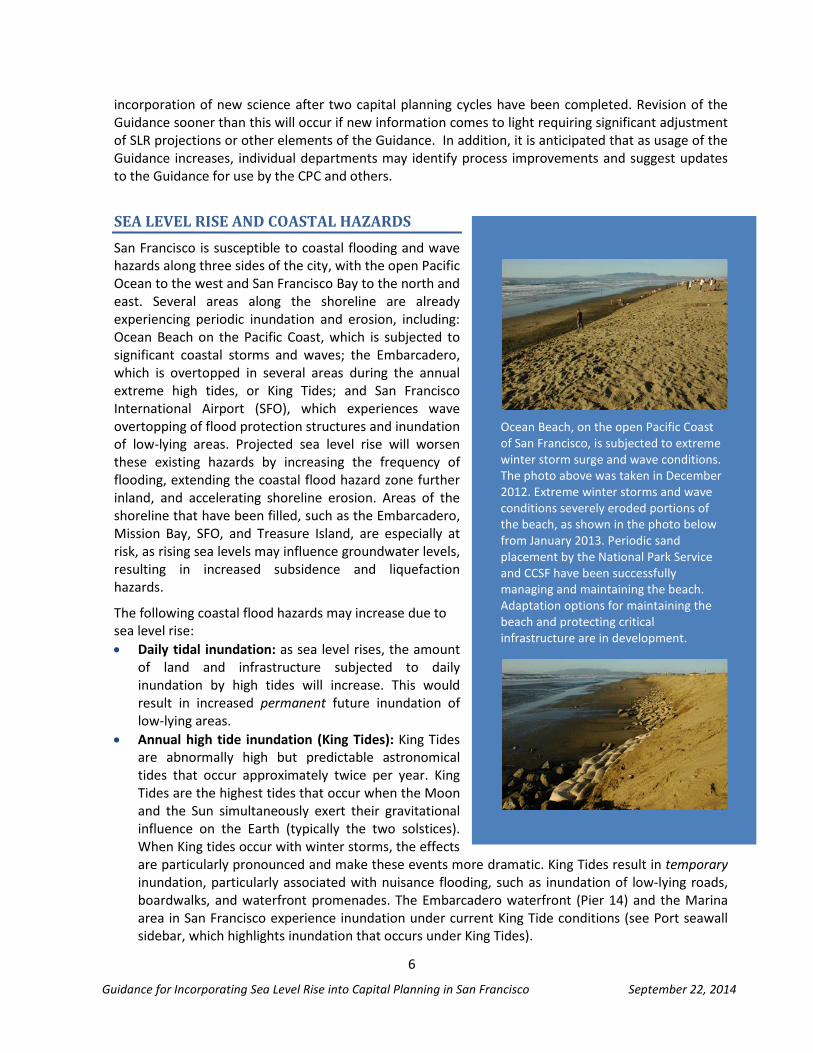
Ocean Beach, on the open Pacific Coast of San Francisco, is subjected to extreme winter storm surge and wave conditions. The photo above was taken in December 2012. Extreme winter storms and wave conditions severely eroded portions of the beach, as shown in the photo below from January 2013. Periodic sand placement by the National Park Service and CCSF have been successfully managing and maintaining the beach. Adaptation options for maintaining the beach and protecting critical infrastructure are in development.
7
Guidance for Incorporating Sea Level Rise into Capital Planning in San Francisco September 22, 2014
• Storm Surge: Pacific Ocean storms due to meteorological effects can elevate Pacific Ocean and San Francisco Bay water levels, resulting in a temporary increase in sea level. Such storm surge events occurred on January 27, 1983, December 3, 1983, February 6, 1998, January 8, 2005, and December 31, 2006. Storm surge in combination with extreme high tides can cause inundation of low-lying roads, boardwalks, and promenades; exacerbate coastal and riverine flooding and cause upstream flooding; and interfere with stormwater outfalls. The Ocean Beach area is prone to inundation and erosion associated with extreme high tides and storm surge.
• El Niño winter storms: During El Niño1 winters, atmospheric and oceanographic conditions in the Pacific Ocean may produce severe winter storms that impact the San Francisco shorelines. Pacific Ocean storms follow a more southerly route and bring intense rainfall and storm conditions to the Bay Area. Tides are often elevated 0.5 to 3.0 feet above normal along the coast and wave setup can elevate water levels even further. El Niño winter conditions prevailed in 1977-1978, 1982-1983, 1997-1998, and 2009-2010. Typical impacts include prolonged flooding of low-lying roads, boardwalks and waterfront promenades; storm drain backup; wave damage to coastal structures and erosion of natural shorelines (see Ocean Beach sidebar which highlights the power of coastal erosion).
• Ocean swell and wind-wave events (storm waves): Pacific Ocean storms and strong thermal gradients can produce high winds that blow across the ocean and the Bay. When the wind blows over long reaches of open water, large waves can be generated that impact the shoreline and cause damage. Typical impacts include wave damage along the shoreline, particularly to coastal structures such as levees, docks and piers, wharves, and revetments; backshore inundation due to wave overtopping of structures; and erosion of natural shorelines.
• Urban flooding: although urban flooding is primarily associated with rainfall runoff, higher tides due to sea level rise will reduce the capacity of existing storm sewer systems to discharge to the Bay via gravity. Typical impacts include flooding of low-lying areas during precipitation events that coincide with high tides or storm surge events.
Physical damage from floods could include the following:
• Inundation of facilities, causing operational closures at critical transportation facilities such as SFO, the Port, BART, and various facilities operated by MTA.
1 El Niño–Southern Oscillation (ENSO) is a natural oceanic-atmospheric cycle. El Niño conditions are defined by prolonged warming in the Pacific Ocean sea surface temperatures. Typically, this happens at irregular intervals of two to seven years, and can last anywhere from nine months to two years. [
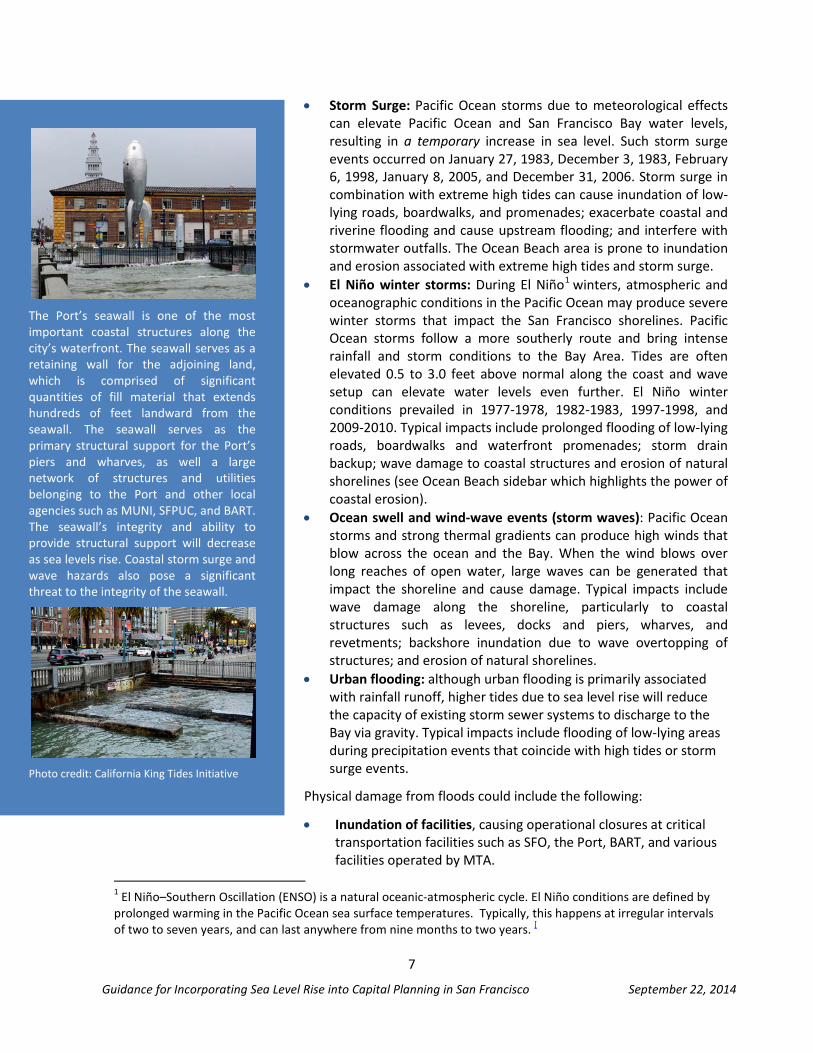
The Port’s seawall is one of the most important coastal structures along the city’s waterfront. The seawall serves as a retaining wall for the adjoining land, which is comprised of significant quantities of fill material that extends hundreds of feet landward from the seawall. The seawall serves as the primary structural support for the Port’s piers and wharves, as well a large network of structures and utilities belonging to the Port and other local agencies such as MUNI, SFPUC, and BART. The seawall’s integrity and ability to provide structural support will decrease as sea levels rise. Coastal storm surge and wave hazards also pose a significant threat to the integrity of the seawall.
Photo credit: California King Tides Initiative
8
Guidance for Incorporating Sea Level Rise into Capital Planning in San Francisco September 22, 2014
• Inundation and damage to various infrastructure including buildings, roads, bridges, culverts, pump stations, support structures, parks, and open space.
• Overland flooding may block access to underground utilities, may damage electrical boxes and substations causing prolonged power outages, and may damage pump stations and other electrical equipment resulting in equipment failure.
• Release of sewage and hazardous or toxic material as wastewater treatment plants, storage tanks and other facilities are inundated and compromised.
• Erosion of natural shorelines and stream banks that may disrupt wetlands and natural habitats, and also undermine the support foundations and structures of important facilities.
OUTLINE OF THIS GUIDANCE Many state and local governments are already preparing for the impacts of climate change through "adaptation,” the practice of planning for anticipated climate change and developing strategies to address potential impacts. Planning efforts can no longer rely on historical ocean levels, or even the rates of sea level rise observed over the past century. Instead, they must incorporate the latest climate science to determine how to protect and modify existing assets and design new assets to be more resilient to rising seas. Adaptation planning requires the consideration of uncertainty and risk, because the science supporting sea level rise and climate change projections has many underlying uncertainties. As such, a robust adaptation plan requires that potential adaptation strategies be revisited as the science progresses and projections are updated.
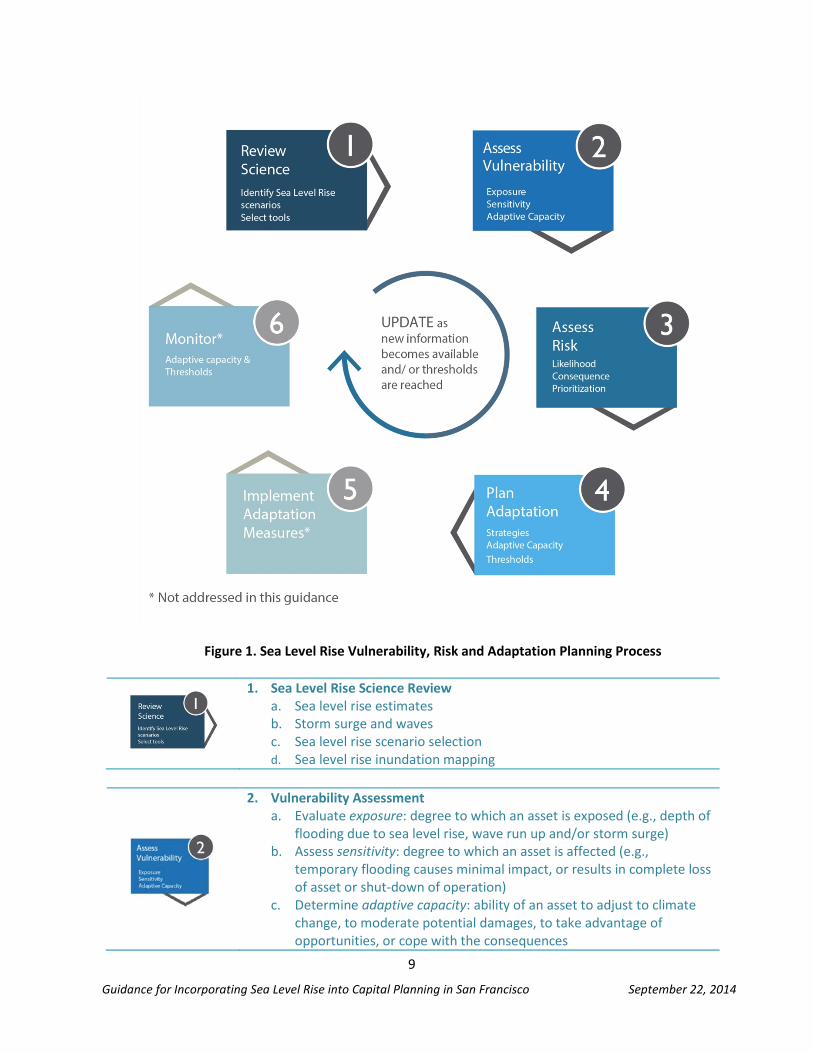
While adaptation planning can take many forms, the process of assessing sea level rise vulnerability and risk follows some basic steps (see Figure 1):
9
Guidance for Incorporating Sea Level Rise into Capital Planning in San Francisco September 22, 2014
Figure 1. Sea Level Rise Vulnerability, Risk and Adaptation Planning Process
1. Sea Level Rise Science Review a. Sea level rise estimates b. Storm surge and waves c. Sea level rise scenario selection d. Sea level rise inundation mapping
2. Vulnerability Assessment a. Evaluate exposure: degree to which an asset is exposed (e.g., depth of
flooding due to sea level rise, wave run up and/or storm surge) b. Assess sensitivity: degree to which an asset is affected (e.g.,
temporary flooding causes minimal impact, or results in complete loss of asset or shut-down of operation)
c. Determine adaptive capacity: ability of an asset to adjust to climate change, to moderate potential damages, to take advantage of opportunities, or cope with the consequences
10
Guidance for Incorporating Sea Level Rise into Capital Planning in San Francisco September 22, 2014
3. Risk Assessment Evaluate consequence to help set priorities for adaptation planning (i.e., cost of reconstruction or repair, economic impact of disruption, length of disruption, irreversibility of impact)
4. Adaptation Planning Assess the adaptive capacity of the asset (i.e. can it be modified in the future to respond to new, higher sea level rise projections) • Identify adaptation strategies and approaches to protect assets and
increase adaptive capacity • Prioritize strategies: where do they need to be implemented first,
second, third, etc. • Timing of strategies: when do they need to be implemented
The following sections provide an overview of each of the steps outlined above:
1. SEA LEVEL RISE SCIENCE REVIEW
Adaptation to sea level rise begins with an understanding of the current state-of-the-science on sea level rise2. The science associated with sea level rise is continually being updated, revised, and strengthened. Although there is no doubt that sea levels have risen and will continue to rise at an accelerated rate over the coming century, it is difficult to predict with certainty what amount of sea level rise will occur at any given time in the future. The uncertainty increases over time (e.g. the uncertainties associated with 2100 projections are greater than with 2050 projections) because of uncertainties in future greenhouse gas (GHG) emissions trends, the evolving understanding of the sensitivity of climate conditions to GHG concentrations, and the overall skill of climate models. Given these uncertainties, the sea level rise projections presented in this document for use in capital planning draw on the best available science on the potential effects of sea level rise in California as of January 2014.
a. Sea Level Rise Estimates In March 2013, the State of California adopted the 2012 National Research Council Report, Sea-Level Rise for the Coasts of California, Oregon, and Washington: Past Present and Future (NRC Report)3, as the best available science on sea level rise for the state and published guidance on incorporating sea level rise into state planning.4 The California Coastal Commission (CCC) also supported the use of the
2 See Appendix 2 for a summary of current sea level rise science (pending) 3 Sea-Level Rise for the Coasts of California, Oregon, and Washington: Past Present and Future. Prepared by the Committee on Sea Level Rise in California, Oregon, and Washington; Board on Earth Sciences and Resources; Ocean Studies Board; Division on Earth and Life Studies; National Research Council 2012. 4 State of California Sea-Level Rise Guidance Document. Developed by the Coastal and Ocean Working Group of the California Climate Action Team (CO-CAT), with science support provided by the Ocean Protection Council’s Science Advisory Team and the California Ocean Science Trust. March 2013 Update.
11
Guidance for Incorporating Sea Level Rise into Capital Planning in San Francisco September 22, 2014
NRC Report as best available current science. The CCC also noted that the science of sea level rise is continually advancing, and future research may enhance the scientific understanding of how the climate is changing, resulting in the need to regularly update sea level rise projections5. The NRC Report includes discussions of historic sea level observations, three projections of likely sea level rise for the coming century, high and low extremes for sea level rise in the coming century, and consideration of local conditions along the California, Oregon, and Washington coast that contribute to “relative sea level rise” (see discussion below). After the release of both the NRC Report and the CCC Draft Guidance, the Intergovernmental Panel on Climate Change (IPCC) released its 5th Assessment Report (AR5), which provides updated consensus estimates of global sea level rise6. While the IPCC report appeared on the surface to provide very different estimates of sea level rise than the NRC, the SLR Committee found upon closer investigation that the two bodies were in broad agreement when considering sea level rise (See Appendix 2, pending).
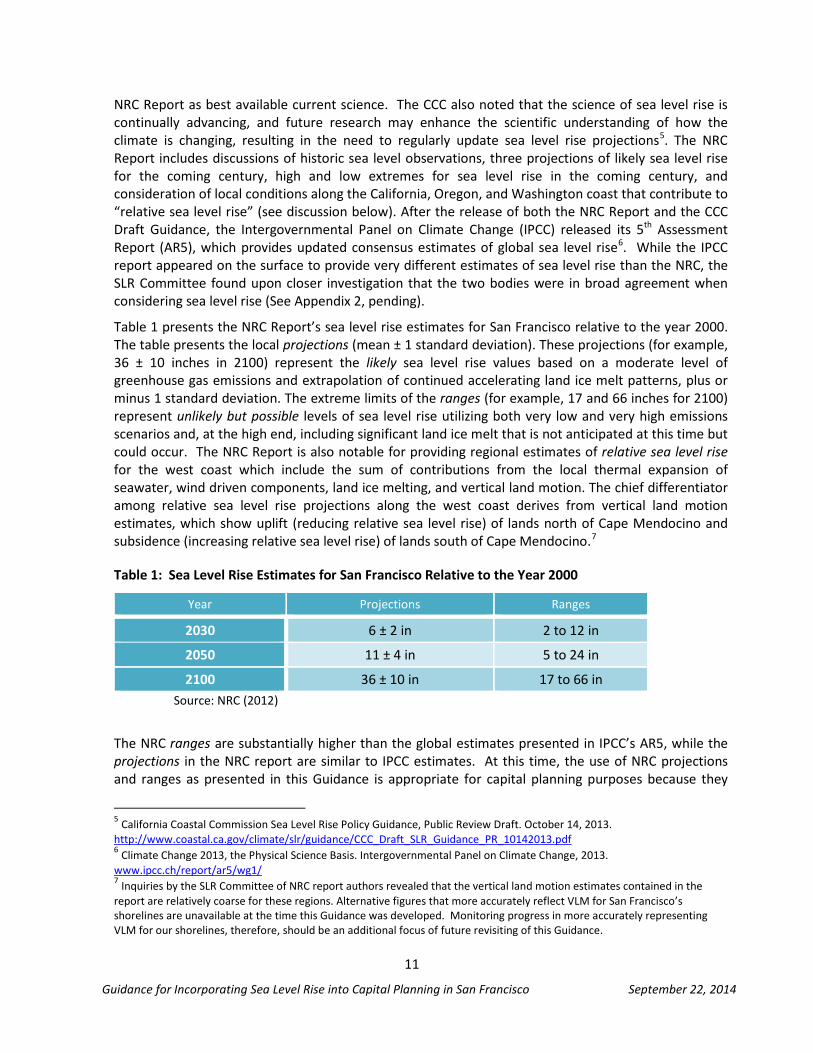
Table 1 presents the NRC Report’s sea level rise estimates for San Francisco relative to the year 2000. The table presents the local projections (mean ± 1 standard deviation). These projections (for example, 36 ± 10 inches in 2100) represent the likely sea level rise values based on a moderate level of greenhouse gas emissions and extrapolation of continued accelerating land ice melt patterns, plus or minus 1 standard deviation. The extreme limits of the ranges (for example, 17 and 66 inches for 2100) represent unlikely but possible levels of sea level rise utilizing both very low and very high emissions scenarios and, at the high end, including significant land ice melt that is not anticipated at this time but could occur. The NRC Report is also notable for providing regional estimates of relative sea level rise for the west coast which include the sum of contributions from the local thermal expansion of seawater, wind driven components, land ice melting, and vertical land motion. The chief differentiator among relative sea level rise projections along the west coast derives from vertical land motion estimates, which show uplift (reducing relative sea level rise) of lands north of Cape Mendocino and subsidence (increasing relative sea level rise) of lands south of Cape Mendocino.7
Table 1: Sea Level Rise Estimates for San Francisco Relative to the Year 2000
Year Projections Ranges
2030 6 ± 2 in 2 to 12 in
2050 11 ± 4 in 5 to 24 in
2100 36 ± 10 in 17 to 66 in Source: NRC (2012)
The NRC ranges are substantially higher than the global estimates presented in IPCC’s AR5, while the projections in the NRC report are similar to IPCC estimates. At this time, the use of NRC projections and ranges as presented in this Guidance is appropriate for capital planning purposes because they
5 California Coastal Commission Sea Level Rise Policy Guidance, Public Review Draft. October 14, 2013. http://www.coastal.ca.gov/climate/slr/guidance/CCC_Draft_SLR_Guidance_PR_10142013.pdf 6 Climate Change 2013, the Physical Science Basis. Intergovernmental Panel on Climate Change, 2013. www.ipcc.ch/report/ar5/wg1/ 7 Inquiries by the SLR Committee of NRC report authors revealed that the vertical land motion estimates contained in the report are relatively coarse for these regions. Alternative figures that more accurately reflect VLM for San Francisco’s shorelines are unavailable at the time this Guidance was developed. Monitoring progress in more accurately representing VLM for our shorelines, therefore, should be an additional focus of future revisiting of this Guidance.
12
Guidance for Incorporating Sea Level Rise into Capital Planning in San Francisco September 22, 2014
encompass the best available science, have been derived considering local and regional processes and conditions, and their use is consistent with current state guidance (See Appendix 2, pending). Approaches for using these figures in planning are provided in subsequent steps outlined below.
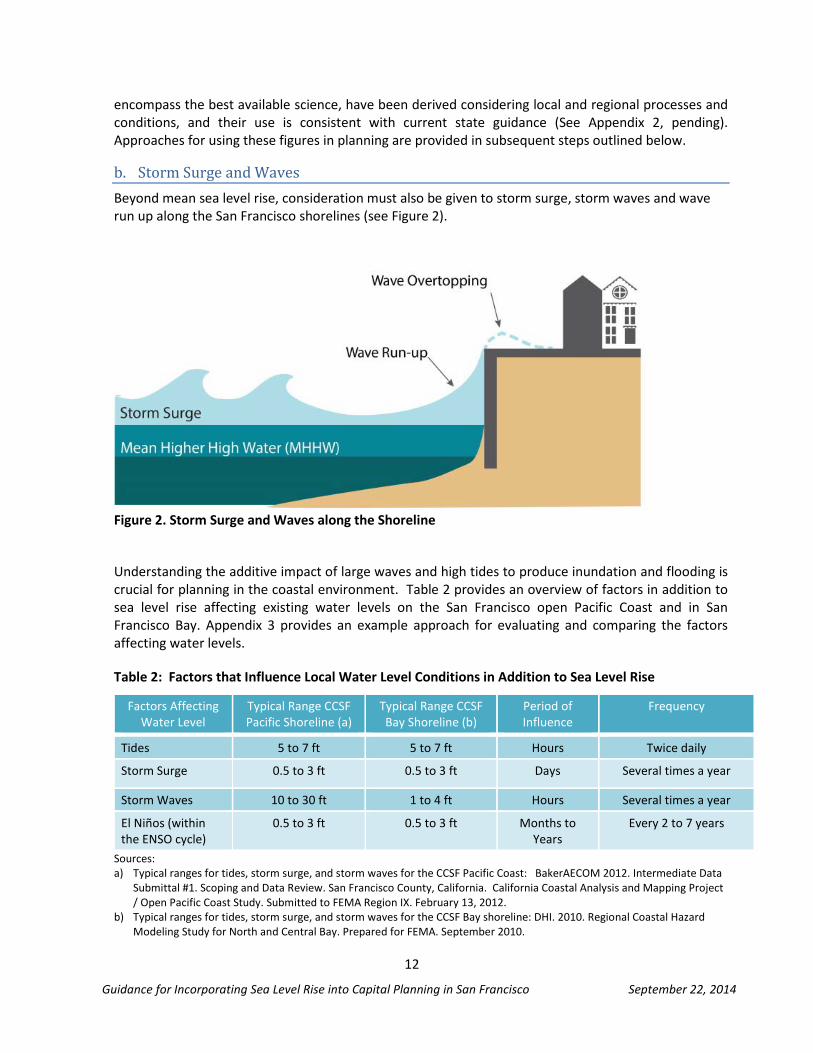
b. Storm Surge and Waves Beyond mean sea level rise, consideration must also be given to storm surge, storm waves and wave run up along the San Francisco shorelines (see Figure 2).
Figure 2. Storm Surge and Waves along the Shoreline
Understanding the additive impact of large waves and high tides to produce inundation and flooding is crucial for planning in the coastal environment. Table 2 provides an overview of factors in addition to sea level rise affecting existing water levels on the San Francisco open Pacific Coast and in San Francisco Bay. Appendix 3 provides an example approach for evaluating and comparing the factors affecting water levels.
Table 2: Factors that Influence Local Water Level Conditions in Addition to Sea Level Rise
Factors Affecting Water Level
Typical Range CCSF Pacific Shoreline (a)
Typical Range CCSF Bay Shoreline (b)
Period of Influence
Frequency
Tides 5 to 7 ft 5 to 7 ft Hours Twice daily
Storm Surge 0.5 to 3 ft 0.5 to 3 ft Days Several times a year
Storm Waves 10 to 30 ft 1 to 4 ft Hours Several times a year
El Niños (within the ENSO cycle)
0.5 to 3 ft 0.5 to 3 ft Months to Years
Every 2 to 7 years
Sources: a) Typical ranges for tides, storm surge, and storm waves for the CCSF Pacific Coast: BakerAECOM 2012. Intermediate Data
Submittal #1. Scoping and Data Review. San Francisco County, California. California Coastal Analysis and Mapping Project / Open Pacific Coast Study. Submitted to FEMA Region IX. February 13, 2012.
b) Typical ranges for tides, storm surge, and storm waves for the CCSF Bay shoreline: DHI. 2010. Regional Coastal Hazard Modeling Study for North and Central Bay. Prepared for FEMA. September 2010.
13
Guidance for Incorporating Sea Level Rise into Capital Planning in San Francisco September 22, 2014
c. Sea Level Rise Scenario Selection During project planning, the selection of the appropriate sea level rise scenario, or scenarios, for the vulnerability and risk assessment of a particular asset or set of assets can be challenging. There are several factors that should influence scenario selection:
• Lifespan (functional working life) – how long will the project be in use at this location (including regular repair and maintenance)?
• Location – is the project located in an inundation zone during its lifespan?
Capital project planners should consider all of the above as they evaluate sea level rise vulnerabilities and risks and plan to accommodate or adapt to future sea level rise. They may choose to plan now for the high end of the uncertainty range (i.e., 66 inches by 2100) – particularly for critical assets that must maintain their function if inundated – or it may be appropriate to plan for the most likely scenario by 2100 (i.e., 36 ± 10 inches) while completing sensitivity testing and developing appropriate adaptation strategies that could accommodate higher sea level rise estimates. This latter approach accommodates uncertainties in the science and allows for flexibility should the higher-end of the sea level rise projections become more likely.
Although the sea level rise estimates presented in Table 1 are presented relative to specific time horizons (i.e., 2030, 2050, and 2100), these estimates can be interpolated for alternate time horizons (i.e., 2080) if needed to consider different project planning horizons (See Appendix 4).
d. Sea Level Rise Inundation Mapping Inundation maps are a valuable tool for evaluating potential exposure to future sea level rise and storm surge conditions and the most up-to-date maps should be referenced during project planning and design. (Note that these maps, however, do not consider precipitation and runoff-driven flooding.) The maps are typically used to evaluate when (under what amount of sea level rise and/or storm surge) and by how much (what depth of inundation) an asset will be exposed. A variety of inundation maps exist today for evaluating potential future sea level rise exposure. At the time of publication of this Guidance, the following inundation maps represent state-of-the-art products and should be used by CCSF departments in planning near the San Francisco Bay and Pacific Coast shorelines. These inundation maps were prepared by the San Francisco Public Utilities Commission (SFPUC) in conjunction with the Sewer System Improvement Program (SSIP) and provide the highest resolution, most comprehensive inundation mapping to date for the entire CCSF shoreline.
For the Pacific Coast shoreline (i.e., Westside):
SFPUC Westside Inundation Maps: SFPUC has produced sea level rise inundation maps for the open Pacific Coast shoreline (from the Golden Gate Bridge to the Westside CCSF/San Mateo County border). The inundation maps use a 1-meter horizontal grid resolution DEM8 based on the
8 The horizontal grid resolution of a digital elevation model (DEM) defines the scale of the features which are resolved within the terrain. In order to resolve levees, berms, and other topographic features which are important for impacting floodwater conveyance, a 1-meter resolution DEM is recommended. Coarser grid resolutions (i.e., 2-meter, 5-meter) may not fully resolve these features, resulting in an over estimation of potential inundation extents.
14
Guidance for Incorporating Sea Level Rise into Capital Planning in San Francisco September 22, 2014
2010/2011 California Coastal Mapping Program (CCMP) LiDAR9. Along the open Pacific Coast, the importance and magnitude of coastal storm surge and wave hazards (see Table 2) requires an approach that capture these dynamic processes as they propagate landward. The Westside inundation maps leverage Federal Emergency Management Administration (FEMA) water level and storm surge data and coastal hazard analysis methods that consider shoreline types (i.e., sandy beaches, dunes, bluffs), presence of coastal structures, and erosion potential10. The inundation maps include a range of sea level rise estimates from 12 inches to 66 inches, and account for the dynamic overland water levels associated with sea level rise-driven changes to the 100-year coastal storm surge and wave hazards. These maps were published in June 2014 and are available through the SFPUC and the Sea Level Rise Committee.
For the San Francisco Bay shoreline (i.e., Bayside):
SFPUC Bayside Maps: SFPUC produced sea level rise inundation maps for the contiguous CCSF Bay shoreline, including Treasure Island, but not including SFO (from the Golden Gate Bridge to the Bayside CCSF/San Mateo County border). The inundation maps utilize a 1-meter horizontal grid resolution DEM based on the same 2010/2011 CCMP LiDAR used for the Westside inundation mapping. The water level analysis leverages data from FEMA’s California Coastal Mapping and Analysis Project. Inundation maps consider static sea level rise on top of mean higher high water (MHHW) in one-foot increments, as well as a range of storm surge and wave hazard events ranging from the 1-year to the 100-year storm surge event. These maps and the associated digital data were published in June 2014 and are available through the SFPUC and the Sea Level Rise Committee.
Airport Maps: Separate inundation maps are being developed for the Airport using a similar methodology as above.
It should be noted that all inundation maps, including those produced by SFPUC for SSIP, have caveats and uncertainties. Inundation maps, and the underlying associated analyses, are intended as planning level tools to illustrate the potential for flooding under future sea level rise and storm surge scenarios. Although this information is appropriate for conducting vulnerable and risk assessments, finer-grained information may be needed for detailed engineering design and implementation. The maps depict possible future inundation that could occur if nothing is done to adapt or prepare for sea level rise over the next century. The SFPUC SSIP maps relied on a 1-m digital elevation model created from LiDAR data collected in 2010 and 2011. Although care was taken to capture all relevant topographic features and coastal structures that may impact coastal inundation, it is possible that structures narrower than the 1-m horizontal map scale may not be fully represented. The maps are based on model outputs and do not account for all of the complex and dynamic San Francisco Bay and Pacific ocean coastal processes or future conditions such as erosion, subsidence, future construction or shoreline protection upgrades, and other changes to the region that may occur in response to sea level rise.
9 LiDAR (Light Detection and Ranging) is a remote sensing technology that measures distance by illuminating a target with a laser and analyzing the reflected light. LIDAR is commonly used to create high-resolution terrain models, topography data sets, and topographic maps. 10 Federal Emergency Management Agency (FEMA) California Coastal Analysis and Mapping Project (CCAMP). See www.r9coastal.org.
15
Guidance for Incorporating Sea Level Rise into Capital Planning in San Francisco September 22, 2014
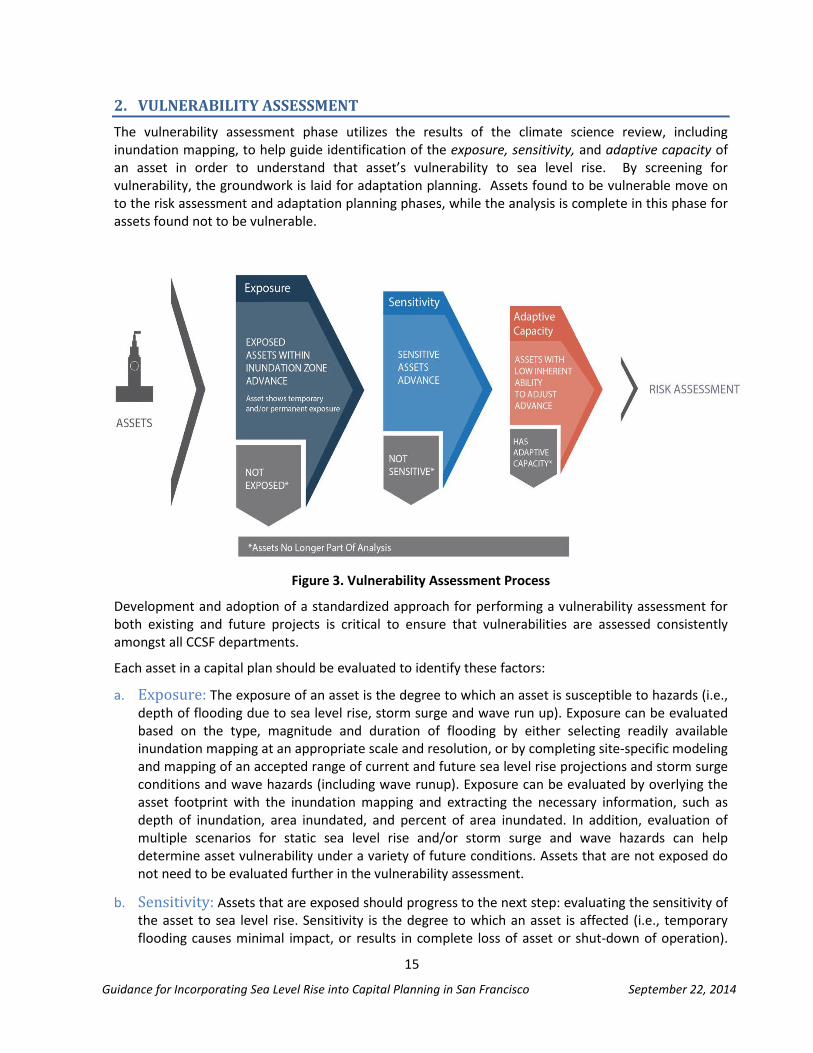
2. VULNERABILITY ASSESSMENT The vulnerability assessment phase utilizes the results of the climate science review, including inundation mapping, to help guide identification of the exposure, sensitivity, and adaptive capacity of an asset in order to understand that asset’s vulnerability to sea level rise. By screening for vulnerability, the groundwork is laid for adaptation planning. Assets found to be vulnerable move on to the risk assessment and adaptation planning phases, while the analysis is complete in this phase for assets found not to be vulnerable.
Figure 3. Vulnerability Assessment Process
Development and adoption of a standardized approach for performing a vulnerability assessment for both existing and future projects is critical to ensure that vulnerabilities are assessed consistently amongst all CCSF departments.
Each asset in a capital plan should be evaluated to identify these factors:
a. Exposure: The exposure of an asset is the degree to which an asset is susceptible to hazards (i.e., depth of flooding due to sea level rise, storm surge and wave run up). Exposure can be evaluated based on the type, magnitude and duration of flooding by either selecting readily available inundation mapping at an appropriate scale and resolution, or by completing site-specific modeling and mapping of an accepted range of current and future sea level rise projections and storm surge conditions and wave hazards (including wave runup). Exposure can be evaluated by overlying the asset footprint with the inundation mapping and extracting the necessary information, such as depth of inundation, area inundated, and percent of area inundated. In addition, evaluation of multiple scenarios for static sea level rise and/or storm surge and wave hazards can help determine asset vulnerability under a variety of future conditions. Assets that are not exposed do not need to be evaluated further in the vulnerability assessment.
b. Sensitivity: Assets that are exposed should progress to the next step: evaluating the sensitivity of the asset to sea level rise. Sensitivity is the degree to which an asset is affected (i.e., temporary flooding causes minimal impact, or results in complete loss of asset or shut-down of operation).
16
Guidance for Incorporating Sea Level Rise into Capital Planning in San Francisco September 22, 2014
For example, a roadway may be temporarily inundated under a storm surge scenario, but once the floodwaters recede, the roadway can resume useful service without the need for repair. Such a roadway would have a low sensitivity to periodic flooding; therefore it may not need to be carried further in the process. Assets with low sensitivity may still benefit from adaptation measures, such as infrastructure improvements and/or operational adjustments; therefore the inclusion or exclusion of exposed assets with low sensitivity should be considered on a case by case basis. On the other hand, an electrical substation may be taken completely out of service if it experiences even minor temporary inundation, requiring either major repairs or complete replacement. This asset would be considered highly sensitive to flood impacts and would be the subject of more complex analysis.
c. Adaptive Capacity: Assets that are both exposed and sensitive continue to the last phase: evaluation of adaptive capacity. Adaptive capacity is defined as the asset’s inherent ability to adjust to sea level rise impacts without the need for significant intervention or modification. An asset with adaptive capacity is less vulnerable to sea level rise impacts. For example, a boardwalk or building may have been designed with an ability to be easily raised in the future, or a floodwall may have been designed to accommodate future increases in height without the need for significant modifications. These assets are said to have adaptive capacity. (For new assets or assets with low adaptive capacity, enhancing or building in adaptive capacity will be an objective in the Adaptation Planning phase described below). The presence of redundancy in the system can also increase its adaptive capacity. If one section of roadway, for example, is impacted by flooding but another section could provide at least a portion of the impacted level of service, the system is able to take advantage of existing opportunities to minimize impacts, and therefore might score high for adaptive capacity.
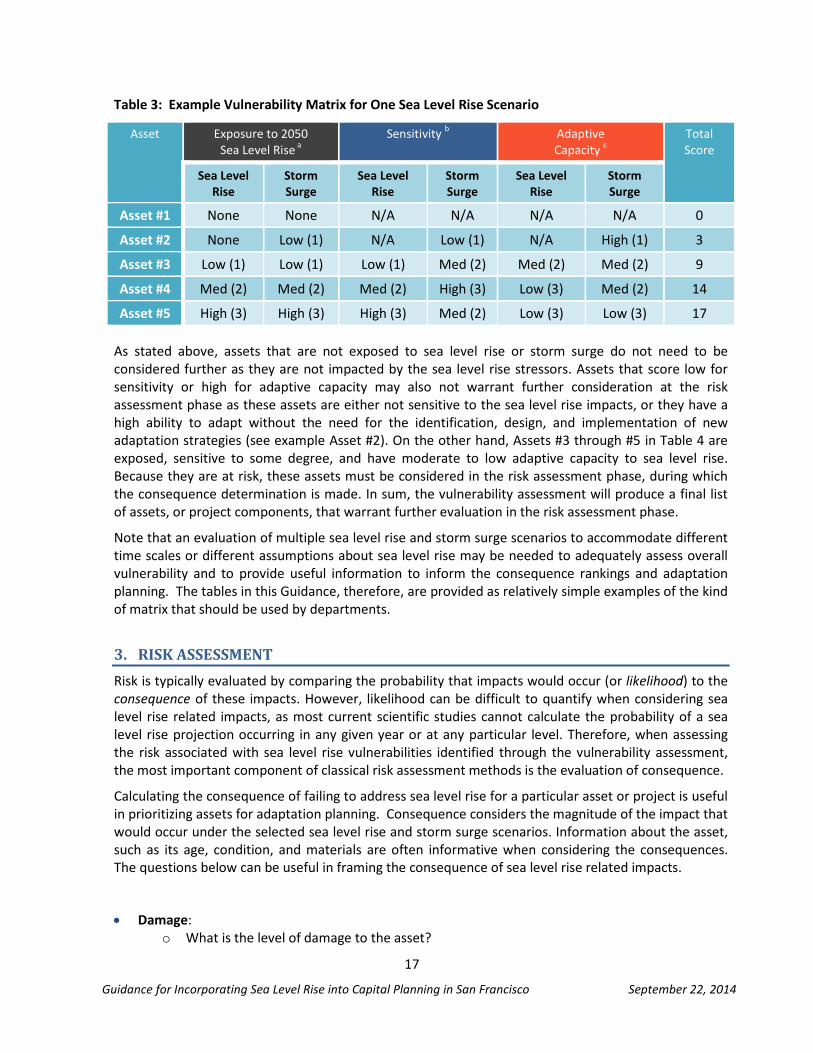
At the completion of the vulnerability assessment phase, each vulnerable asset 11, or project component, will have an associated rating (i.e., low, medium or high) for exposure, sensitivity, and adaptive capacity. The ratings are useful in the risk assessment phase for assessing the consequence of the vulnerabilities, and ultimately, in setting priorities for adaptation planning. Table 4 presents a simple example of a vulnerability assessment matrix for one sea level rise scenario.
As part of the vulnerability assessment phase, the low, medium and high ratings must be defined using thresholds appropriate for the group of assets. No single, simple scale for ranking exists: each department should be consistent internally in applying these ratings to produce supportable criteria for each step in the process. For example, exposure thresholds can be defined using inundated depth or inundation duration. This kind of subjective but consistent approach is also appropriate for subsequent phases of this Guidance as each department prepares its capital plan.
The rating scale presented in Table 4 was developed so that a low score (1) is associated with limited exposure, minimal sensitivity, and high adaptive capacity to sea level rise. A low score for all three characteristics would result in an asset with very low overall vulnerability. A high score (3) would represent an asset that is significantly exposed, highly sensitive, or with limited adaptive capacity to sea level rise. A high score for all three characteristics would result in a highly vulnerable asset. Thresholds for the ratings may vary based on different asset types and their tolerance for inundation.
11 SUB IN LANGUAGE BASED ON AIRPORT COMMENTS interreleated/program/projects.A project or group of projects can be evaluated as a whole, if appropriate. For example, the project may consist of a single building or structure. More complex projects may be divided into a suite of assets, or program components, so that each project can be assessed individually.
17
Guidance for Incorporating Sea Level Rise into Capital Planning in San Francisco September 22, 2014
Table 3: Example Vulnerability Matrix for One Sea Level Rise Scenario
Asset Exposure to 2050 Sea Level Rise a
Sensitivity b Adaptive Capacity c
Total Score
Sea Level Rise
Storm Surge
Sea Level Rise
Storm Surge
Sea Level Rise
Storm Surge
Asset #1 None None N/A N/A N/A N/A 0
Asset #2 None Low (1) N/A Low (1) N/A High (1) 3
Asset #3 Low (1) Low (1) Low (1) Med (2) Med (2) Med (2) 9
Asset #4 Med (2) Med (2) Med (2) High (3) Low (3) Med (2) 14
Asset #5 High (3) High (3) High (3) Med (2) Low (3) Low (3) 17
As stated above, assets that are not exposed to sea level rise or storm surge do not need to be considered further as they are not impacted by the sea level rise stressors. Assets that score low for sensitivity or high for adaptive capacity may also not warrant further consideration at the risk assessment phase as these assets are either not sensitive to the sea level rise impacts, or they have a high ability to adapt without the need for the identification, design, and implementation of new adaptation strategies (see example Asset #2). On the other hand, Assets #3 through #5 in Table 4 are exposed, sensitive to some degree, and have moderate to low adaptive capacity to sea level rise. Because they are at risk, these assets must be considered in the risk assessment phase, during which the consequence determination is made. In sum, the vulnerability assessment will produce a final list of assets, or project components, that warrant further evaluation in the risk assessment phase.
Note that an evaluation of multiple sea level rise and storm surge scenarios to accommodate different time scales or different assumptions about sea level rise may be needed to adequately assess overall vulnerability and to provide useful information to inform the consequence rankings and adaptation planning. The tables in this Guidance, therefore, are provided as relatively simple examples of the kind of matrix that should be used by departments.
3. RISK ASSESSMENT Risk is typically evaluated by comparing the probability that impacts would occur (or likelihood) to the consequence of these impacts. However, likelihood can be difficult to quantify when considering sea level rise related impacts, as most current scientific studies cannot calculate the probability of a sea level rise projection occurring in any given year or at any particular level. Therefore, when assessing the risk associated with sea level rise vulnerabilities identified through the vulnerability assessment, the most important component of classical risk assessment methods is the evaluation of consequence.
Calculating the consequence of failing to address sea level rise for a particular asset or project is useful in prioritizing assets for adaptation planning. Consequence considers the magnitude of the impact that would occur under the selected sea level rise and storm surge scenarios. Information about the asset, such as its age, condition, and materials are often informative when considering the consequences. The questions below can be useful in framing the consequence of sea level rise related impacts.
• Damage: o What is the level of damage to the asset?
18
Guidance for Incorporating Sea Level Rise into Capital Planning in San Francisco September 22, 2014
o Can the asset be repaired, or would the asset require complete replacement? • Disruption:
o Is there a disruption in service? o If yes, what is the length of that disruption, i.e., hours, days, weeks? Does the disruption
threatening public health and safety? • Cost:
o What is the cost to repair or replace the asset? o What are the economic (or health and safety) costs associated with the disruption in
service? o Are there secondary impacts that need to be considered (i.e., costs to other sectors, such
as the environment and public recreation)?
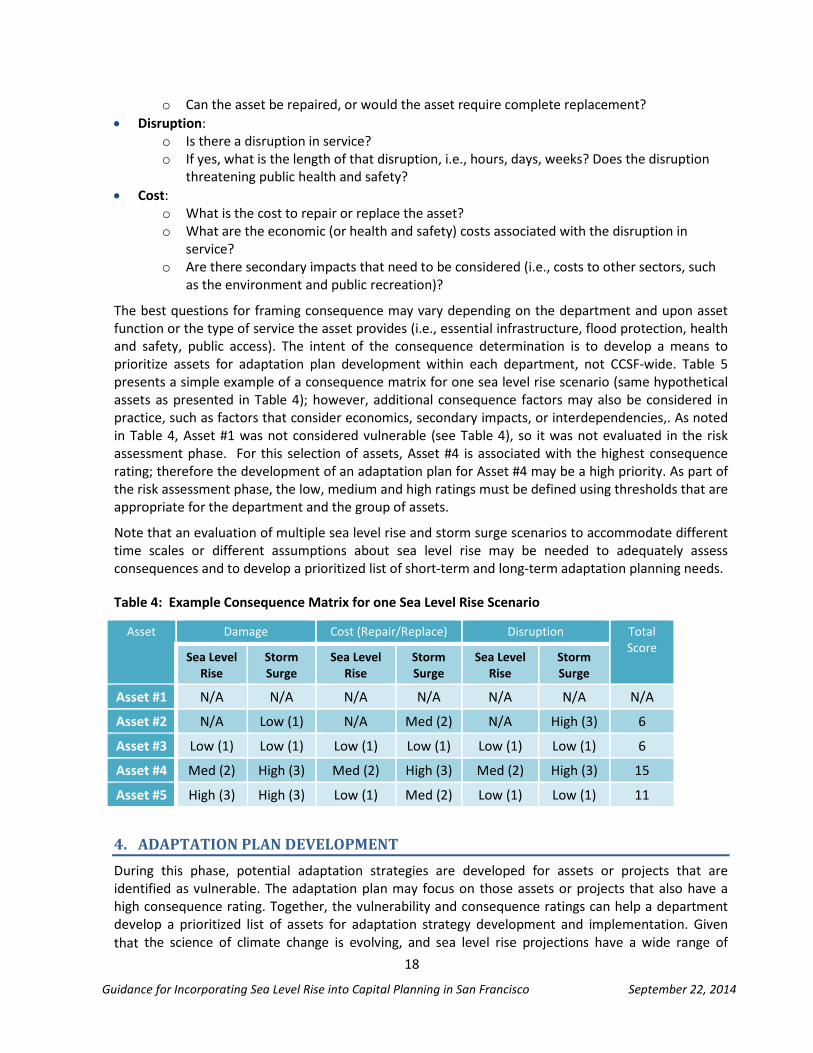
The best questions for framing consequence may vary depending on the department and upon asset function or the type of service the asset provides (i.e., essential infrastructure, flood protection, health and safety, public access). The intent of the consequence determination is to develop a means to prioritize assets for adaptation plan development within each department, not CCSF-wide. Table 5 presents a simple example of a consequence matrix for one sea level rise scenario (same hypothetical assets as presented in Table 4); however, additional consequence factors may also be considered in practice, such as factors that consider economics, secondary impacts, or interdependencies,. As noted in Table 4, Asset #1 was not considered vulnerable (see Table 4), so it was not evaluated in the risk assessment phase. For this selection of assets, Asset #4 is associated with the highest consequence rating; therefore the development of an adaptation plan for Asset #4 may be a high priority. As part of the risk assessment phase, the low, medium and high ratings must be defined using thresholds that are appropriate for the department and the group of assets.
Note that an evaluation of multiple sea level rise and storm surge scenarios to accommodate different time scales or different assumptions about sea level rise may be needed to adequately assess consequences and to develop a prioritized list of short-term and long-term adaptation planning needs.
Table 4: Example Consequence Matrix for one Sea Level Rise Scenario
Asset Damage Cost (Repair/Replace) Disruption Total Score
Sea Level Rise
Storm Surge
Sea Level Rise
Storm Surge
Sea Level Rise
Storm Surge
Asset #1 N/A N/A N/A N/A N/A N/A N/A
Asset #2 N/A Low (1) N/A Med (2) N/A High (3) 6
Asset #3 Low (1) Low (1) Low (1) Low (1) Low (1) Low (1) 6
Asset #4 Med (2) High (3) Med (2) High (3) Med (2) High (3) 15
Asset #5 High (3) High (3) Low (1) Med (2) Low (1) Low (1) 11
4. ADAPTATION PLAN DEVELOPMENT During this phase, potential adaptation strategies are developed for assets or projects that are identified as vulnerable. The adaptation plan may focus on those assets or projects that also have a high consequence rating. Together, the vulnerability and consequence ratings can help a department develop a prioritized list of assets for adaptation strategy development and implementation. Given that the science of climate change is evolving, and sea level rise projections have a wide range of
19
Guidance for Incorporating Sea Level Rise into Capital Planning in San Francisco September 22, 2014
values, projects should adopt a planning horizon based on project lifespan (see sea level rise scenario selection discussion) and include appropriate adaptation strategies to accommodate anticipated sea level rise.
In many instances, it is not feasible or cost effective to design and build for long-term potential sea level rise scenarios of a highly uncertain nature, such as at the upper end of the NRC Report range for the year 2100 (i.e., 66 inches of sea level rise). In this case, a project could be designed and constructed to account for likely mid-century sea level rise (i.e., 11 ± 4 inches by 2050), and be built with the ability to adapt to more severe sea level rise scenarios over time. An alternate approach would be to build resilience to likely sea level rise by 2100 (36 inches) now while identifying the adaptive capacity of the asset to the upper range SLR estimate for 2100 (66 inches) in case future projections indicate that level has become likely.
This approach seeks to create or enhance the adaptive capacity of the asset or asset location, thereby making that asset resilient. As defined in the Vulnerability Assessment phase description, adaptive capacity defines a project’s ability to adapt in a modular, or step-wise, fashion over time. The adaptation plan for the asset or project should include the level of sea level rise appropriate for near-term project planning and implementation, and the adaptation strategies that can be implemented over time if sea level rise exceeds or is anticipated to exceed the original estimate. The adaptation plan should clearly lay out the triggers or time horizons for implementation of the identified adaptation strategies, and the plan should include a means to monitor and respond to changes in the science or the condition of the asset.
In evaluating the adaptive capacity of a project, these questions are often asked: Does the project, project footprint, or adaptation feature(s) have the ability to be modified or changed to accommodate future higher sea level rise as new data and science emerges? In other words, can project resilience be secured for some logical period of time (e.g. through 2050) and also accommodate further adaptation measures based on new developments and science in subsequent years? And what are those triggers or time horizons for implementation of adaptation measures (make the project resilient now) and adaptive management approaches (respond to future trends with further measures).
If, however, due to site or project constraints it is determined that the adaptive capacity of a project is low (i.e. the ability to implement future adaptation strategies in response to new projections of
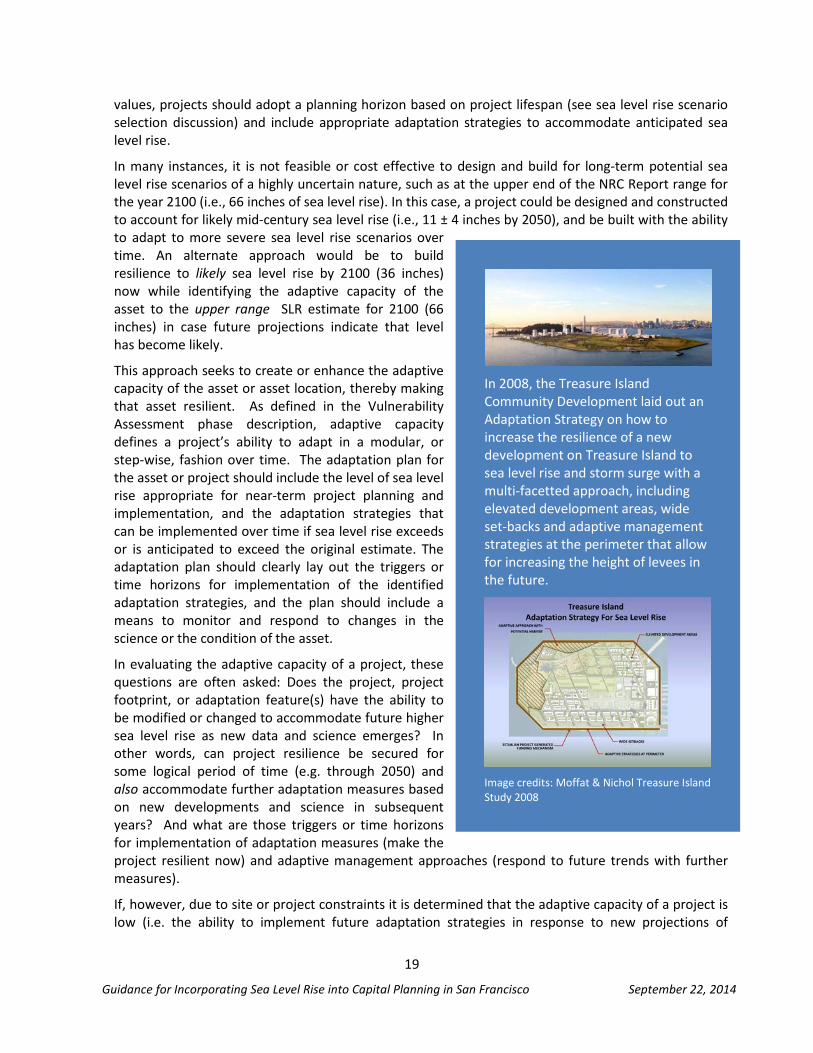
In 2008, the Treasure Island Community Development laid out an Adaptation Strategy on how to increase the resilience of a new development on Treasure Island to sea level rise and storm surge with a multi-facetted approach, including elevated development areas, wide set-backs and adaptive management strategies at the perimeter that allow for increasing the height of levees in the future.
Image credits: Moffat & Nichol Treasure Island Study 2008
20
Guidance for Incorporating Sea Level Rise into Capital Planning in San Francisco September 22, 2014
additional sea level rise is low), the use of worst-case projections in initial adaptation plan development may be merited.
For example, if an existing flood protection feature was designed and constructed in such a way that its height or location can be easily adjusted or increased in the future to accommodate sea level rise or more severe storm surge events, the project would have some inherent adaptive capacity as its ability to accommodate future sea level rise is higher than a project that would require substantial reconstruction to increase its level of protection (See Treasure Island side bar as an example).
Accountability
Adaptation plans should include clear accountability and trigger points for bringing adaptation strategies online. Sea level rise science is a relatively new field that is subject to change as new information and studies become available. A well-defined process should be developed within each department to ensure that milestones are being met, the latest science is being considered, and vulnerability assessments are being completed as part of the capital planning process.
PERMITTING AND REGULATORY CONSIDERATIONS Note: Zoning maps accompanying this section are in a separate document
Public and private development and infrastructure projects located in the City’s bay and ocean shoreline areas are regulated by local controls in the City’s General Plan and Planning Code as well as by California’s two coastal zone management agencies: the San Francisco Bay Conservation and Development Commission (BCDC) and the California Coastal Commission (CCC). These agencies are required to ensure that projects and plans subject to their jurisdiction avoid or minimize hazards related to sea level rise. As such, CCSF departments should consider the applicable state regulations, policies and guidance concerning sea level rise and coordinate with the relevant department staff.
San Francisco Bay Conservation and Development Commission BCDC has permit jurisdiction over San Francisco Bay and the land lying between the Bay shoreline and a line drawn parallel to, and 100 feet from, the Bay shoreline known as the 100-foot shoreline band.
In October 2011, BCDC adopted amendments to the San Francisco Bay Plan addressing sea level rise. These policies require sea level rise risk assessments when planning in shoreline areas or designing larger shoreline projects. If sea level rise and storm surge levels that are expected to occur during the life of the project would result in public safety risks, the project must be designed to cope with flood levels expected by mid-century. If it is likely that the project will remain in place longer than mid-century, the applicant must have a plan to address the flood risks expected at the end of the century.
California Coastal Commission All public and private projects in the City’s coastal zone must be undertaken in accordance with an approved coastal development permit from either the City Planning Department or the CCC.
The CCC oversees a grant program to support local government planning efforts addressing sea level rise, and released Draft Sea-Level Rise Policy Guidance for public review and comment on October 14, 2013. In that Draft Guidance, consistent with this CCSF Guidance, the CCC considers the NRC 2012 report as the best available science on sea level rise in California, though this Guidance treats the NRC 2012 report somewhat differently than the draft CCC Guidance.
21
Guidance for Incorporating Sea Level Rise into Capital Planning in San Francisco September 22, 2014
City departments with assets in the Coastal Zone should refer to the Coastal Commission’s Sea-Level Rise Policy Guidance for a detailed discussion of relevant Coastal Act policies and regulations.
California Environmental Quality Act (CEQA) Under the California Environmental Quality Act (CEQA), the CCSF is required to consider whether projects that the City undertakes or approves would expose people or structures to a significant risk of loss, injury or death due to flooding. In its role as the City’s CEQA lead agency, the Planning Department interprets this requirement to include flooding due to sea level rise. Consistent with this Guidance, the Planning Department evaluates whether projects, both public and private, that are subject to CEQA would be vulnerable to flooding during the project’s design life taking into consideration projected sea level rise. For purposes of this analysis, a project vulnerable to flooding during its design life under a 100-year flood condition in combination with projected sea level rise is considered to present a significant risk related to flooding. At the time of this Guidance, the Planning Department considers the NRC 2012 report as the best available source for sea level rise projections. As such, the methodologies and approach to evaluating risks related to sea level rise recommended in this Guidance are consistent with the City’s existing practices under CEQA.
City & County of San Francisco General Plan The guiding policy document for the City & County of San Francisco is the General Plan. This document, adopted by the Planning Commission and approved by the Board of Supervisors, serves as the embodiment of the community's vision for the future of San Francisco. The Charter establishes that changes of use and public construction projects be consistent with this policy document. The General Plan guides decisions that both direct the allocation of public resources and that shape private development. For this reason, managers of capital projects should confirm that their proposed project is consistent with the General Plan early in the planning process. A part of the General Plan is also our Local Coastal Program. Within the General Plan, the Western Shoreline Plan, combined with the related sections of the San Francisco Zoning Code, and Zoning District Maps, together constitute the City’s LCP. Meaning, projects in this area may require review by the City’s Planning Commission, the Historic Preservation Commission, the Board of Supervisors, and the Coastal Commission.
Similarly, the Port Commission uses the Waterfront Land Use Plan to govern property under the Port Commission’s jurisdiction. The Waterfront Land Use Plan (WLUP) was initially adopted by the Port Commission in 1997. It defines acceptable uses, policies and land use information applicable to all properties under the Commission’s jurisdiction. Property under the jurisdiction of the Port may require review by the San Francisco Planning Commission and Board of Supervisors, the San Francisco Bay Conservation and Development Commission (BCDC), and the State Lands Commission to align the various land use plans and policies held by each entity.
22
Guidance for Incorporating Sea Level Rise into Capital Planning in San Francisco September 22, 2014
EXAMPLE APPLICATIONS OF GUIDANCE IN CAPITAL PLANNING The following example illustrates how a City department could consider the effects of sea level rise in its capital planning process for several public assets in the same area – the construction of a new police station, the rehabilitation of an existing vacant waterfront building into a visitor center, and the construction of a new shoreline park. Based on a review of the readily-available inundation maps, these assets would be inundated permanently with 48 inches of sea level rise, and inundated periodically by the following flood scenarios:
• 6 inches of sea level rise plus a 100-year flood event • 12 inches of sea level rise plus a 50-year flood event • 24 inches of sea level rise plus a 5-year flood event • 36 inches of sea level rise and a 1-year extreme (King) tide event.
For each asset, the project manager would select the most appropriate sea level rise scenario, based on the asset’s expected lifespan, location, and other factors, and also determine if using the most likely projections is adequate for current planning, or if the extreme ranges should be used for more conservative planning or for the development of potential adaptation strategies.
New Police Station: • Sea Level Rise Scenario Selection: The police station would not be located directly adjacent the
shoreline, but it is within the future inundation zone. The functional lifespan of the asset is 50 years, and the consequence of the structure being flooded is extremely high as the fire station is considered a critical asset that is essential during emergency situations. The project manager selects the 100-year flood condition and uses Appendix 3 to determine upper sea level rise estimates for the year 2065 (34.6 inches as calculated using Appendix 4) as the appropriate scenarios for planning.
• Vulnerability Assessment: Although the police station will not be permanently inundated with 24” of sea level rise, it would be inundated by the 100-year flood event for all sea level rise projections greater than 6 inches. The asset is given a medium exposure rating, and is considered highly sensitive due to its function as a critical infrastructure that must be operational during an extreme flood event. The asset is not an existing asset; therefore its inherent adaptive capacity is not applicable and is not rated as part of the vulnerability assessment.
• Risk Assessment: If the police station were inundated, it could be repaired at substantial cost. But in addition, the disruption of its function during a flood event could lead to public safety impacts. The overall consequence, therefore, of siting the station in an area subject to this level of flooding is determined to be high. This project is a high priority for adaptation planning.
• Adaptation Planning: The project manager evaluates raising grades and flood proofing to increase the adaptive capacity of the fire station; however, these improvements are insufficient as the access roads surrounding the asset would also be compromised during an extreme flood event. It would be too costly to build in sufficient adaptive capacity to the fire station and its surroundings. The project manager decides that the police station should be sited in an alternate location at a higher grade.
Rehabilitated Visitor Center: • Sea Level Rise Scenario Selection: The existing vacant structure is located directly adjacent to the
shoreline where it could be exposed to storm surge and wave hazards. The functional lifespan of the rehabilitated structure is 25 years. The consequence of the structure being flooded is low as
23
Guidance for Incorporating Sea Level Rise into Capital Planning in San Francisco September 22, 2014
the structure is not a critical asset. The project manager selects the 2050 most likely sea level rise estimate (11 inches) as the appropriate scenario for planning. The project manager also selects the 2050 upper sea level rise estimate (24 inches) and the 5-year and 100-year flood events for the potential development of adaptation strategies (i.e. adaptive management).
• Vulnerability Assessment: The visitor center would have a high exposure rating based on its location, and a medium sensitivity rating since it could be temporarily closed after a flood event until it is repaired. It would have low adaptive capacity since the existing building was constructed without consideration of potential future flooding and may only partially recover from a flood event.
• Risk Assessment: Although damage from an extreme flood event could be moderate to high, the building could likely be repaired. Both the cost to repair the building and its potential disruption of service are considered acceptable. The temporary loss of the visitor center after a flood event would have minimal consequence on the public (no health or safety effects), resulting in an overall low risk.
• Adaptation Planning: The building is proposed to be retrofitted to meet flood resistant building standards, and shoreline improvements are planned that will make the overall site resilient to inundation by a 5-year flood event with 11 inches of sea level rise. The adaptation plan identifies additional shoreline improvements that can be constructed to make the site more resilient to a 5-year storm surge event if sea level rise tracks with the upper bound of 24 inches sea level rise by 2050. The adaptation plan also identifies short term closure strategies for more severe storm surge events.
New Shoreline Park: • Sea Level Rise Scenario Selection: A shoreline park site is located directly adjacent to the shoreline
in a highly exposed area. The shoreline improvements are intended to make the overall shoreline and inland developed areas more resilient to sea level rise through 2050. The project manager selects the 2050 most likely (11 inches) and upper bound (24 inches) sea level rise projections for project planning. The project manager also selects the 10-year and 100-year flood events for planning purposes. The park will be planned to be resilient to 10-year flood inundation, and to minimize adverse impacts associated with a 100-year flood event.
• Vulnerability Assessment: Based on its location, the park has a high exposure rating. The park is given a low sensitivity rating since the existing area, and the future park, will accommodate inundation by a range of events. The asset is not an existing asset; therefore its inherent adaptive capacity is not applicable and is not rated.
• Risk Assessment: The park is expected to require minimal repairs at relatively low cost after being inundated by an extreme event beyond the design event (10-year flood). The consequence to the public of not being able to access the park during repairs is also low. Therefore the overall risk rating is low risk.
• Adaptation Planning: The park will be constructed to accommodate flooding and provide protection to the adjacent areas. Flood resistant materials will be selected to minimize maintenance and repair requirements due to periodic flooding (e.g. benches are made of concrete and are securely anchored to the ground and the park is landscaped with salt tolerant species). The plan outlines shoreline strategies that could be implemented if a higher level of protection is needed to accommodate either higher sea level rates or flood scenarios.
24
Guidance for Incorporating Sea Level Rise into Capital Planning in San Francisco September 22, 2014
Appendix 1 Seal Level Rise Committee Members The following members comprise the City and County of San Francisco Sea Level Rise Committee:
David Behar (Chair), Climate Program Director, San Francisco Public Utilities Commission Lauren Eisele, Senior Environmental Planner, Port of San Francisco Frank Filice, Manager of Regulatory Affairs, San Francisco Department of Public Works Chris Kern, Senior Environmental Planner, San Francisco Planning Department Kris May, Senior Coastal Engineer and Scientist, AECOM Craig Raphael, Transportation Planner, San Francisco Municipal Transportation Agency Nohemy Revilla, Climate Change Liaison, San Francisco Public Utilities Commission Anna Roche, Climate Change Adaptation Manager, San Francisco Public Utilities Commission AnMarie Rodgers, Manager of Legislative Affairs, San Francisco Planning Department Tania Sheyner, Environmental Planner, San Francisco Planning Department Brian Strong, Directory, San Francisco Capital Planning Program Dilip Trivedi, Senior Coastal Engineer, Moffat and Nichol Rosalyn Yu, Associate Engineer, San Francisco International Airport
25
Guidance for Incorporating Sea Level Rise into Capital Planning in San Francisco September 22, 2014
Appendix 2 Summary of the Science
SCIENCE RESEARCH AND FINDINGS OF THE SEA LEVEL RISE COMMITTEE SUPPORTING RECOMMENDED SEA LEVEL RISE ESTIMATES FOR CAPITAL PLANNING
There is significant uncertainty associated with climate change. This uncertainty relates not to the fact of climate change, of which there is virtually no doubt within scientific circles, but to the nature and scope of climate change’s secondary effects such as sea level rise (SLR). New projections are emerging regularly, models are getting more complex, and observations are accumulating. In such a dynamic environment, decision-makers are regularly cautioned by climate scientists and science translation professionals to never rely upon a single source of information, be it a single climate model or a single expert, and to carefully consider uncertainties in the science when planning adaptation. At the same time, we know seas are rising and will continue to rise at an accelerated rate, threatening valuable infrastructure and public safety. We don’t have the luxury to wait for perfect information to arrive before assessing and, where advisable, adapting to the effects of sea level rise. The Sea Level Rise Committee (Committee) of the City and County of San Francisco (CCSF) surveyed three of the most highly respected science bodies and their recent reports in developing this Guidance. Intergovernmental Panel on Climate Change (IPCC). The most highly respected international climate science body is the Nobel Prize-winning IPCC. The IPCC’s 5th Assessment Report (Working Group I) was released in September, 2013 and included a comprehensive chapter on global sea level rise.
Climate Change 2013: The Physical Science Basis. Working Group 1 Contribution to the Fifth Assessment Report of the Intergovernmental Panel on Climate Change, Summary for Policymakers. 2013. Intergovernmental Panel on Climate Change.
National Research Council (NRC). The NRC is the principal operating agency of the National Academy of Sciences and National Academy of Engineering. In 2008, Governor Schwarzenegger in Executive Order S-13-08 asked the NRC to assess sea level rise in California to assist state agencies planning adaptation. Subsequently, the states of Washington and Oregon, as well as U.S. Army Corps of Engineers, National Oceanic and Atmospheric Administration, and U.S. Geological Survey joined California in sponsoring this study, which was released in 2012.
Sea Level Rise for the Coasts of California, Oregon, and Washington: Past, Present, and Future. National Research Council, 2012.
National Climate Assessment (NCA). The NCA is a massive national study mandated by Congress as a state-of-the-art assessment of the nation’s vulnerability to climate change. At the time of the Committee’s deliberations, the final 2014 NCA was not out, but an article commissioned by the NCA on SLR had been released.
Parris, A., et al. Global Sea Level Rise Scenarios for the United States National Climate Assessment, December 6, 2012, produced for NOAA, USGS, SERDP and USACE.
26
Guidance for Incorporating Sea Level Rise into Capital Planning in San Francisco September 22, 2014
In addition to the above reports, the Committee reviewed two important state agency documents providing guidance to government agencies seeking, like CCSF, to incorporate sea level rise projections into planning. These guidance documents were:
State of California Sea-Level Rise Guidance Document. Developed by the Coastal and Ocean Working Group of the California Climate Action Team (CO-CAT), with science support provided by the Ocean Protection Council’s Science Advisory Team and the California Ocean Science Trust. March 2013 Update.
California Coastal Commission Draft Sea-Level Rise Policy Guidance. California Coastal Commission, Public Review Draft. October 14, 2013.
Finally, the Committee also utilized a peer-reviewed survey of 90 international sea level rise experts to discern consensus estimates of SLR through the end of the century:
Benjamin P. Horton, Ramstorf, S, Engelhart, S, and Kemp, A. Expert assessment of sea-level rise by AD 2100 and AD 2300, Quarternary Science Reviews 84 (2014) 1-6. 12
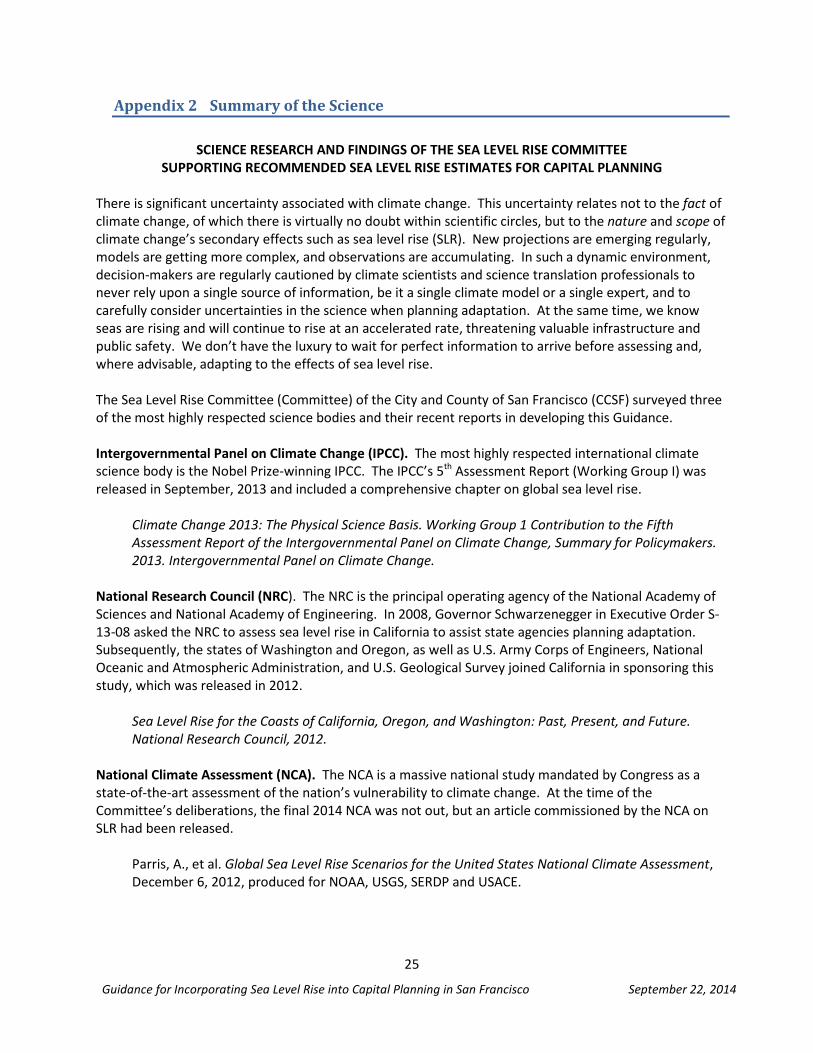
While a case could have been made that any of these sources individually represented “best available science” and could have been used alone to set policy, the Committee believed the strongest basis for planning would exist if a scientific consensus could be extracted from these sources. At first glance, however, the leading science reports appeared to provide a dizzying array of projections that held little hope of consensus. The range of sea level rise projections for the year 2100 provided by the scientific bodies cited above are shown in Figure 1.
Figure 1: Science sources used by the SLR Committee in developing Guidance. These are the “ranges,” or low and high bounded estimates, provided by each source.
12 This Summary of the Science does not review the findings related to either the NCA paper or the Horton, et al journal article. The information presented in each was found by the Committee to agree sufficiently with the conclusions outlined in this Summary to support the Committee’s recommendations.
8 17
11
79
66
39
01020304050607080
National ClimateAssessment (2013)
National Reseach Council(2012)
IPCC 5th AssessmentReport (2013)
Science Sources Used in Developing CCSF Guidance Year 2100 Projections (inches)
Lower Bound Upper Bound
27
Guidance for Incorporating Sea Level Rise into Capital Planning in San Francisco September 22, 2014
In particular, the upper estimates for SLR in 2100 in each report are strikingly different, particularly for the IPCC, whose upper bound of 39 inches is markedly different than the figures for NCA and NRC. The IPCC made the following statement explaining why it rejected estimating global SLR higher than 39 inches in 2100:
The basis for higher projections of global mean sea level rise in the 21st century has been considered and it has been concluded that there is currently insufficient evidence to evaluate the probability of specific levels above the assessed likely range. Many semi-empirical model projections of global mean sea level rise are higher than process-based model projections (up to about twice as large), but there is no consensus in the scientific community about their reliability and there is thus low confidence in their projections. (emphasis in original) 13
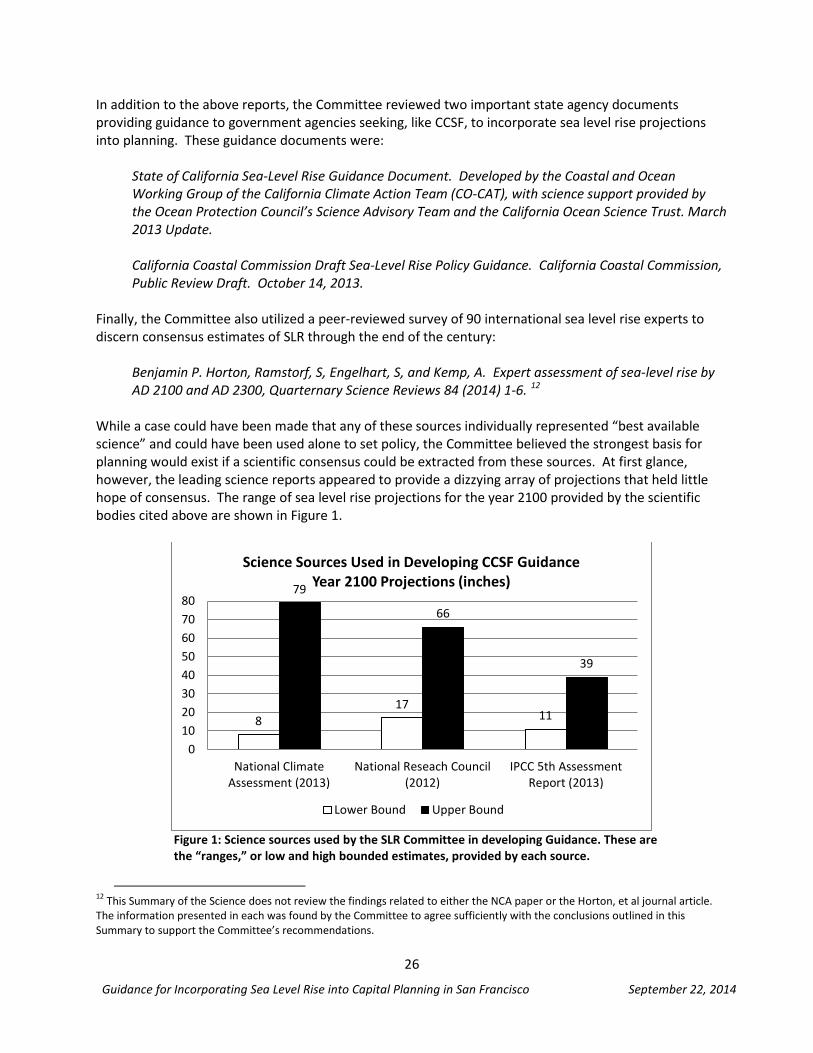
This reflects the approach of the IPCC, a demanding scientific consensus-building process with over 800 authors from over 100 countries requiring strong agreement before making official statements. In this instance, a consensus did not exist that significant land ice melt in Antarctica and Greenland beyond what is currently projected is likely to occur. Substantial Antarctic and Greenland melt leads to the highest SLR estimates for 2100 in the literature. The NRC report was found by the Committee to be different from IPCC in a number of ways. First, its origins in California Executive Order S-13-08 gave it special credence in Sacramento, and ostensibly particular usefulness for local and regional planners. Second, with a relatively small committee of thirteen scientists, it could venture into worst case scenarios, including for land ice melt – and did. And third, the report provided projections of relative sea level rise, as well as global SLR, by incorporating estimates of local thermal expansion of seawater, wind driven components, land ice melt local effects, and vertical land motion to differentiate relative SLR for different coastal regions across the west coast of the United States.14 Reflecting its origins in the Schwarzenegger Administration, the NRC report was adopted as “best available science” by the State of California when it came out and provided the basis of state guidance cited above from CO-CAT/OPC/OST and from the Coastal Commission. Both entities cited the ranges for each of three time periods cited in the report, as shown in Figure 2.
13 IPCC, Summary for Policymakers, p. 24. 14 The chief differentiator among relative sea level rise projections along the west coast derives from vertical land motion estimates,
which show uplift (reducing relative sea level rise) of lands north of Cape Mendocino and subsidence (increasing relative sea level rise) of lands south of Cape Mendocino. For San Francisco, then, the upper bound SLR figure of 66 inches in NRC reflects approximately 55 inches in estimated global SLR plus an additional 11 inches in subsidence by the year 2100. Inquiries by the SLR Committee of NRC report authors revealed that the vertical land motion estimates contained in the report are relatively coarse for these regions. Alternative figures that more accurately reflect VLM for San Francisco’s shorelines, however, were unavailable at the time this Guidance was developed. Monitoring progress in more accurately representing VLM for our shorelines should be a focus when revisiting this Guidance.
28
Guidance for Incorporating Sea Level Rise into Capital Planning in San Francisco September 22, 2014
Figure 2: Ranges of SLR cited by two State of California sea level rise guidance documents as of 2013. These represent low and high end ranges for the three time periods covered in the NRC report.
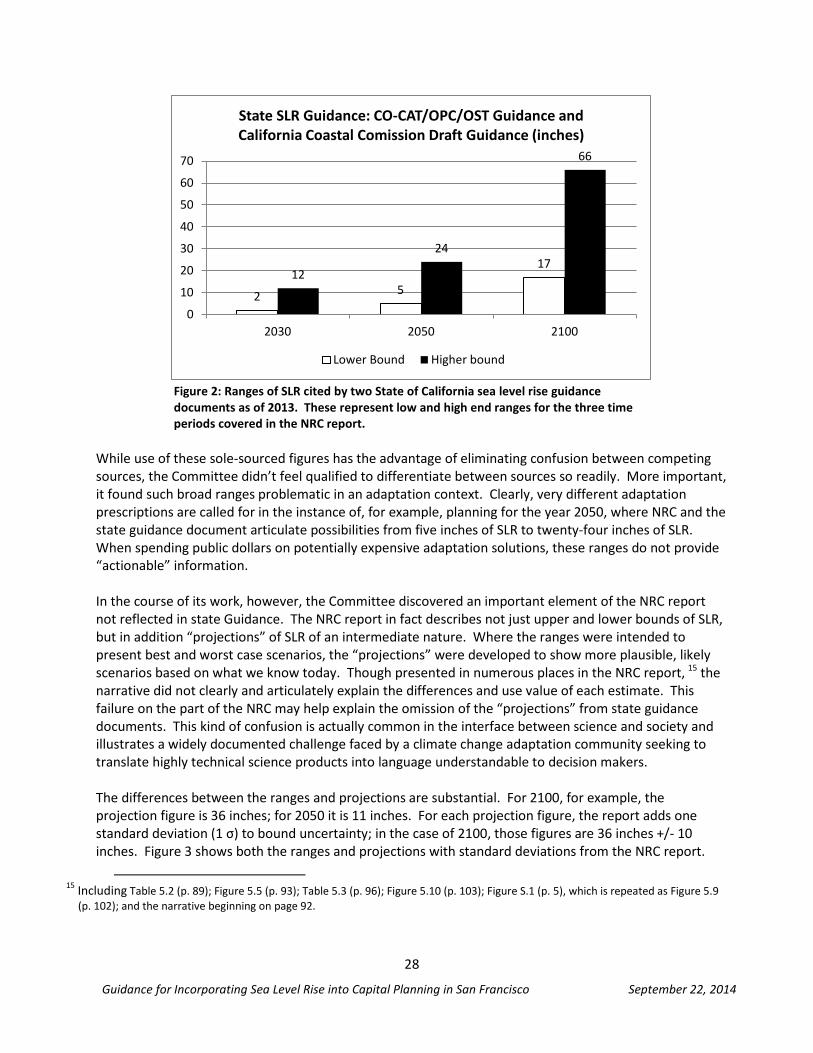
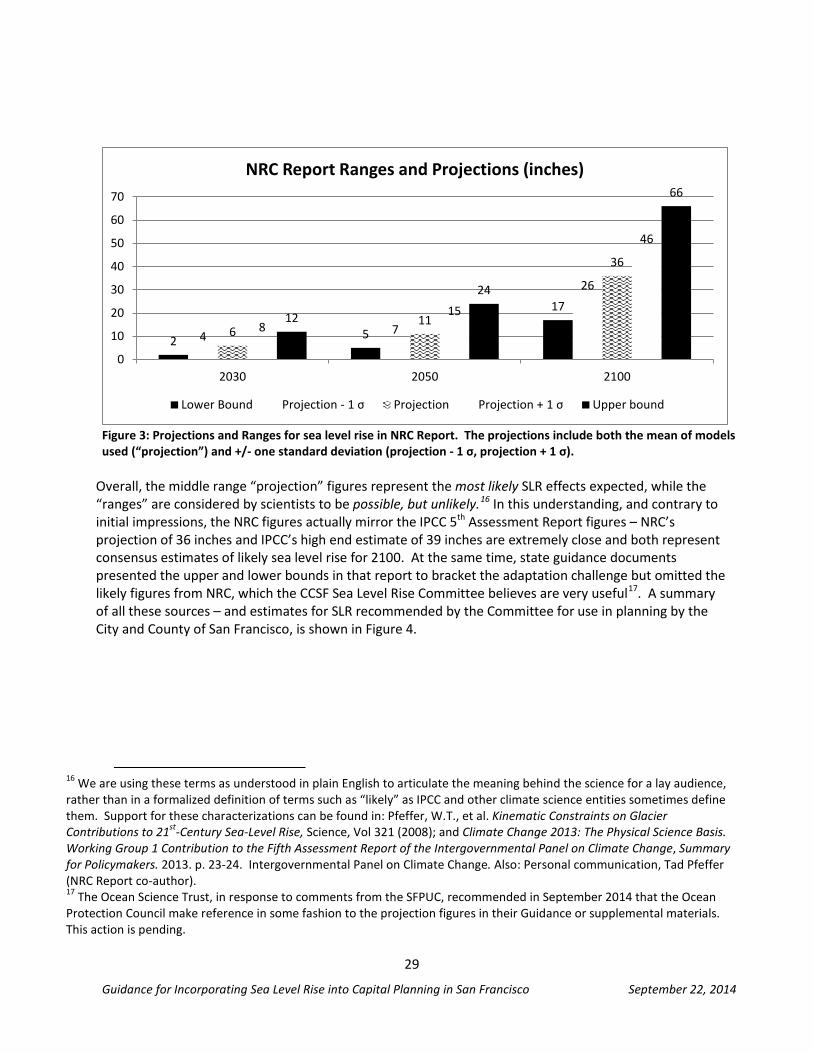
While use of these sole-sourced figures has the advantage of eliminating confusion between competing sources, the Committee didn’t feel qualified to differentiate between sources so readily. More important, it found such broad ranges problematic in an adaptation context. Clearly, very different adaptation prescriptions are called for in the instance of, for example, planning for the year 2050, where NRC and the state guidance document articulate possibilities from five inches of SLR to twenty-four inches of SLR. When spending public dollars on potentially expensive adaptation solutions, these ranges do not provide “actionable” information. In the course of its work, however, the Committee discovered an important element of the NRC report not reflected in state Guidance. The NRC report in fact describes not just upper and lower bounds of SLR, but in addition “projections” of SLR of an intermediate nature. Where the ranges were intended to present best and worst case scenarios, the “projections” were developed to show more plausible, likely scenarios based on what we know today. Though presented in numerous places in the NRC report, 15 the narrative did not clearly and articulately explain the differences and use value of each estimate. This failure on the part of the NRC may help explain the omission of the “projections” from state guidance documents. This kind of confusion is actually common in the interface between science and society and illustrates a widely documented challenge faced by a climate change adaptation community seeking to translate highly technical science products into language understandable to decision makers. The differences between the ranges and projections are substantial. For 2100, for example, the projection figure is 36 inches; for 2050 it is 11 inches. For each projection figure, the report adds one standard deviation (1 σ) to bound uncertainty; in the case of 2100, those figures are 36 inches +/- 10 inches. Figure 3 shows both the ranges and projections with standard deviations from the NRC report.
15 Including Table 5.2 (p. 89); Figure 5.5 (p. 93); Table 5.3 (p. 96); Figure 5.10 (p. 103); Figure S.1 (p. 5), which is repeated as Figure 5.9
(p. 102); and the narrative beginning on page 92.
2 5
17 12
24
66
0
10
20
30
40
50
60
70
2030 2050 2100
State SLR Guidance: CO-CAT/OPC/OST Guidance and California Coastal Comission Draft Guidance (inches)
Lower Bound Higher bound
29
Guidance for Incorporating Sea Level Rise into Capital Planning in San Francisco September 22, 2014
Figure 3: Projections and Ranges for sea level rise in NRC Report. The projections include both the mean of models used (“projection”) and +/- one standard deviation (projection - 1 σ, projection + 1 σ).
Overall, the middle range “projection” figures represent the most likely SLR effects expected, while the “ranges” are considered by scientists to be possible, but unlikely.16 In this understanding, and contrary to initial impressions, the NRC figures actually mirror the IPCC 5th Assessment Report figures – NRC’s projection of 36 inches and IPCC’s high end estimate of 39 inches are extremely close and both represent consensus estimates of likely sea level rise for 2100. At the same time, state guidance documents presented the upper and lower bounds in that report to bracket the adaptation challenge but omitted the likely figures from NRC, which the CCSF Sea Level Rise Committee believes are very useful17. A summary of all these sources – and estimates for SLR recommended by the Committee for use in planning by the City and County of San Francisco, is shown in Figure 4.
16 We are using these terms as understood in plain English to articulate the meaning behind the science for a lay audience, rather than in a formalized definition of terms such as “likely” as IPCC and other climate science entities sometimes define them. Support for these characterizations can be found in: Pfeffer, W.T., et al. Kinematic Constraints on Glacier Contributions to 21st-Century Sea-Level Rise, Science, Vol 321 (2008); and Climate Change 2013: The Physical Science Basis. Working Group 1 Contribution to the Fifth Assessment Report of the Intergovernmental Panel on Climate Change, Summary for Policymakers. 2013. p. 23-24. Intergovernmental Panel on Climate Change. Also: Personal communication, Tad Pfeffer (NRC Report co-author). 17 The Ocean Science Trust, in response to comments from the SFPUC, recommended in September 2014 that the Ocean Protection Council make reference in some fashion to the projection figures in their Guidance or supplemental materials. This action is pending.
2 5
17
4 7
26
6 11
36
8 15
46
12
24
66
0
10
20
30
40
50
60
70
2030 2050 2100
NRC Report Ranges and Projections (inches)
Lower Bound Projection - 1 σ Projection Projection + 1 σ Upper bound
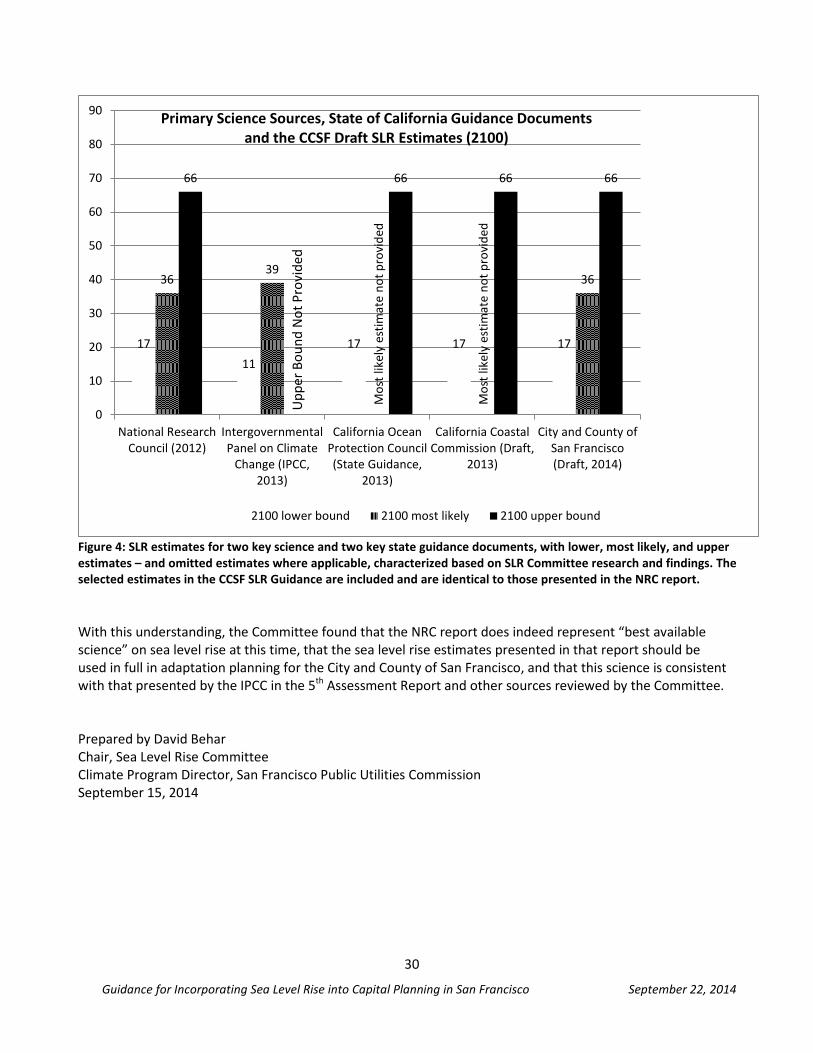
30
Guidance for Incorporating Sea Level Rise into Capital Planning in San Francisco September 22, 2014
Figure 4: SLR estimates for two key science and two key state guidance documents, with lower, most likely, and upper estimates – and omitted estimates where applicable, characterized based on SLR Committee research and findings. The selected estimates in the CCSF SLR Guidance are included and are identical to those presented in the NRC report.
With this understanding, the Committee found that the NRC report does indeed represent “best available science” on sea level rise at this time, that the sea level rise estimates presented in that report should be used in full in adaptation planning for the City and County of San Francisco, and that this science is consistent with that presented by the IPCC in the 5th Assessment Report and other sources reviewed by the Committee.
Prepared by David Behar Chair, Sea Level Rise Committee Climate Program Director, San Francisco Public Utilities Commission September 15, 2014
17 11
17 17 17
36 39
36
66 66 66 66
0
10
20
30
40
50
60
70
80
90
National ResearchCouncil (2012)
IntergovernmentalPanel on Climate
Change (IPCC,2013)
California OceanProtection Council(State Guidance,
2013)
California CoastalCommission (Draft,
2013)
City and County ofSan Francisco(Draft, 2014)
Primary Science Sources, State of California Guidance Documents and the CCSF Draft SLR Estimates (2100)
2100 lower bound 2100 most likely 2100 upper bound
Upp
er B
ound
Not
Pro
vide
d
Mos
t lik
ely
estim
ate
not p
rovi
ded
Mos
t lik
ely
estim
ate
not p
rovi
ded
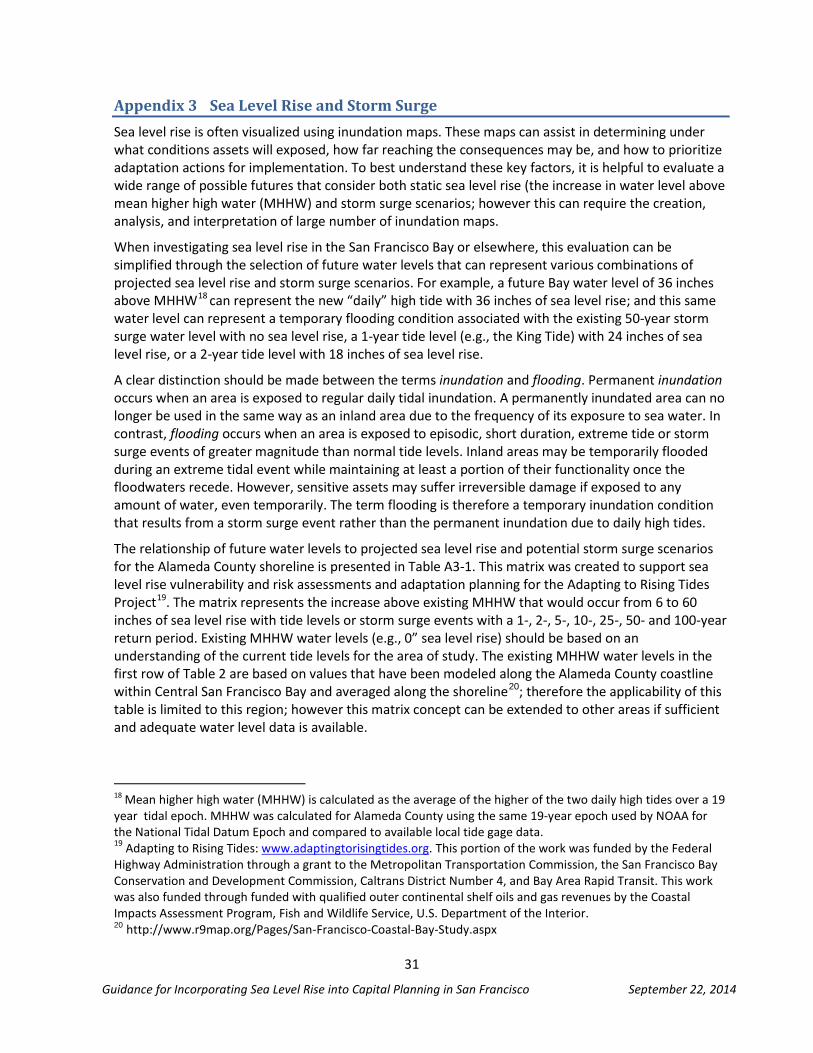
31
Guidance for Incorporating Sea Level Rise into Capital Planning in San Francisco September 22, 2014
Appendix 3 Sea Level Rise and Storm Surge Sea level rise is often visualized using inundation maps. These maps can assist in determining under what conditions assets will exposed, how far reaching the consequences may be, and how to prioritize adaptation actions for implementation. To best understand these key factors, it is helpful to evaluate a wide range of possible futures that consider both static sea level rise (the increase in water level above mean higher high water (MHHW) and storm surge scenarios; however this can require the creation, analysis, and interpretation of large number of inundation maps.
When investigating sea level rise in the San Francisco Bay or elsewhere, this evaluation can be simplified through the selection of future water levels that can represent various combinations of projected sea level rise and storm surge scenarios. For example, a future Bay water level of 36 inches above MHHW18 can represent the new “daily” high tide with 36 inches of sea level rise; and this same water level can represent a temporary flooding condition associated with the existing 50-year storm surge water level with no sea level rise, a 1-year tide level (e.g., the King Tide) with 24 inches of sea level rise, or a 2-year tide level with 18 inches of sea level rise.
A clear distinction should be made between the terms inundation and flooding. Permanent inundation occurs when an area is exposed to regular daily tidal inundation. A permanently inundated area can no longer be used in the same way as an inland area due to the frequency of its exposure to sea water. In contrast, flooding occurs when an area is exposed to episodic, short duration, extreme tide or storm surge events of greater magnitude than normal tide levels. Inland areas may be temporarily flooded during an extreme tidal event while maintaining at least a portion of their functionality once the floodwaters recede. However, sensitive assets may suffer irreversible damage if exposed to any amount of water, even temporarily. The term flooding is therefore a temporary inundation condition that results from a storm surge event rather than the permanent inundation due to daily high tides.
The relationship of future water levels to projected sea level rise and potential storm surge scenarios for the Alameda County shoreline is presented in Table A3-1. This matrix was created to support sea level rise vulnerability and risk assessments and adaptation planning for the Adapting to Rising Tides Project19. The matrix represents the increase above existing MHHW that would occur from 6 to 60 inches of sea level rise with tide levels or storm surge events with a 1-, 2-, 5-, 10-, 25-, 50- and 100-year return period. Existing MHHW water levels (e.g., 0” sea level rise) should be based on an understanding of the current tide levels for the area of study. The existing MHHW water levels in the first row of Table 2 are based on values that have been modeled along the Alameda County coastline within Central San Francisco Bay and averaged along the shoreline20; therefore the applicability of this table is limited to this region; however this matrix concept can be extended to other areas if sufficient and adequate water level data is available.
18 Mean higher high water (MHHW) is calculated as the average of the higher of the two daily high tides over a 19 year tidal epoch. MHHW was calculated for Alameda County using the same 19-year epoch used by NOAA for the National Tidal Datum Epoch and compared to available local tide gage data. 19 Adapting to Rising Tides: www.adaptingtorisingtides.org. This portion of the work was funded by the Federal Highway Administration through a grant to the Metropolitan Transportation Commission, the San Francisco Bay Conservation and Development Commission, Caltrans District Number 4, and Bay Area Rapid Transit. This work was also funded through funded with qualified outer continental shelf oils and gas revenues by the Coastal Impacts Assessment Program, Fish and Wildlife Service, U.S. Department of the Interior. 20 http://www.r9map.org/Pages/San-Francisco-Coastal-Bay-Study.aspx
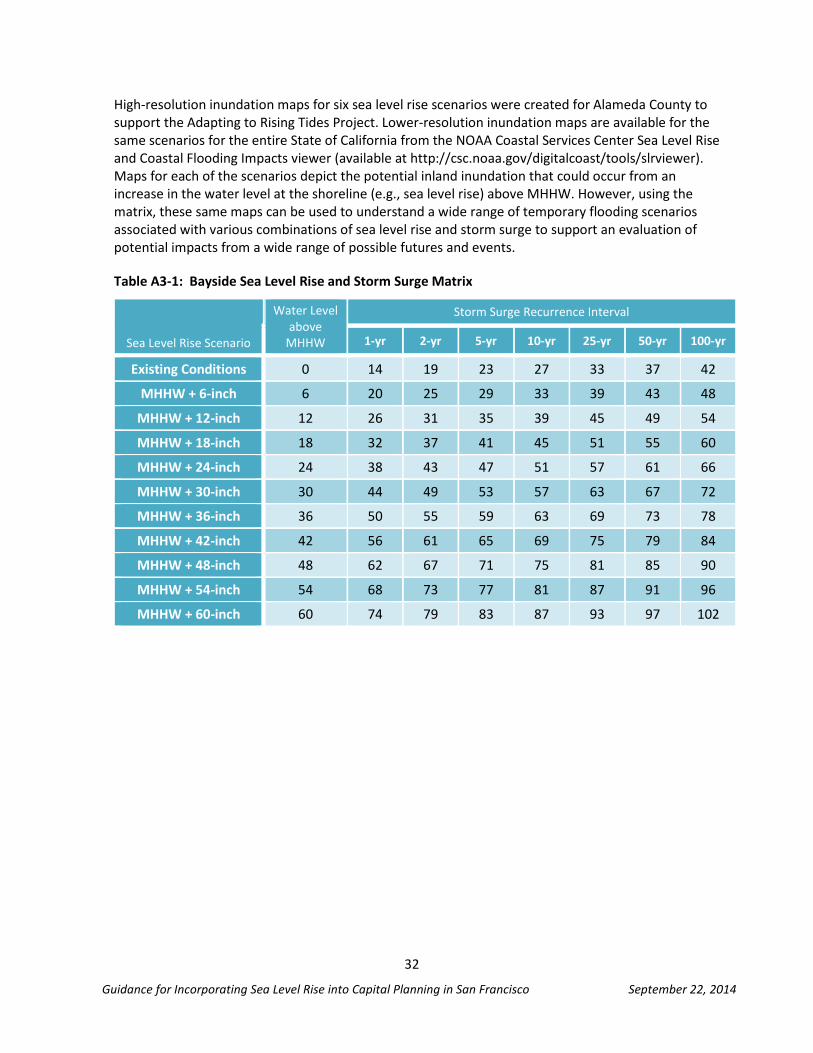
32
Guidance for Incorporating Sea Level Rise into Capital Planning in San Francisco September 22, 2014
High-resolution inundation maps for six sea level rise scenarios were created for Alameda County to support the Adapting to Rising Tides Project. Lower-resolution inundation maps are available for the same scenarios for the entire State of California from the NOAA Coastal Services Center Sea Level Rise and Coastal Flooding Impacts viewer (available at http://csc.noaa.gov/digitalcoast/tools/slrviewer). Maps for each of the scenarios depict the potential inland inundation that could occur from an increase in the water level at the shoreline (e.g., sea level rise) above MHHW. However, using the matrix, these same maps can be used to understand a wide range of temporary flooding scenarios associated with various combinations of sea level rise and storm surge to support an evaluation of potential impacts from a wide range of possible futures and events.
Table A3-1: Bayside Sea Level Rise and Storm Surge Matrix
Sea Level Rise Scenario
Water Level above
MHHW
Storm Surge Recurrence Interval
1-yr 2-yr 5-yr 10-yr 25-yr 50-yr 100-yr
Existing Conditions 0 14 19 23 27 33 37 42
MHHW + 6-inch 6 20 25 29 33 39 43 48
MHHW + 12-inch 12 26 31 35 39 45 49 54
MHHW + 18-inch 18 32 37 41 45 51 55 60
MHHW + 24-inch 24 38 43 47 51 57 61 66
MHHW + 30-inch 30 44 49 53 57 63 67 72
MHHW + 36-inch 36 50 55 59 63 69 73 78
MHHW + 42-inch 42 56 61 65 69 75 79 84
MHHW + 48-inch 48 62 67 71 75 81 85 90
MHHW + 54-inch 54 68 73 77 81 87 91 96
MHHW + 60-inch 60 74 79 83 87 93 97 102
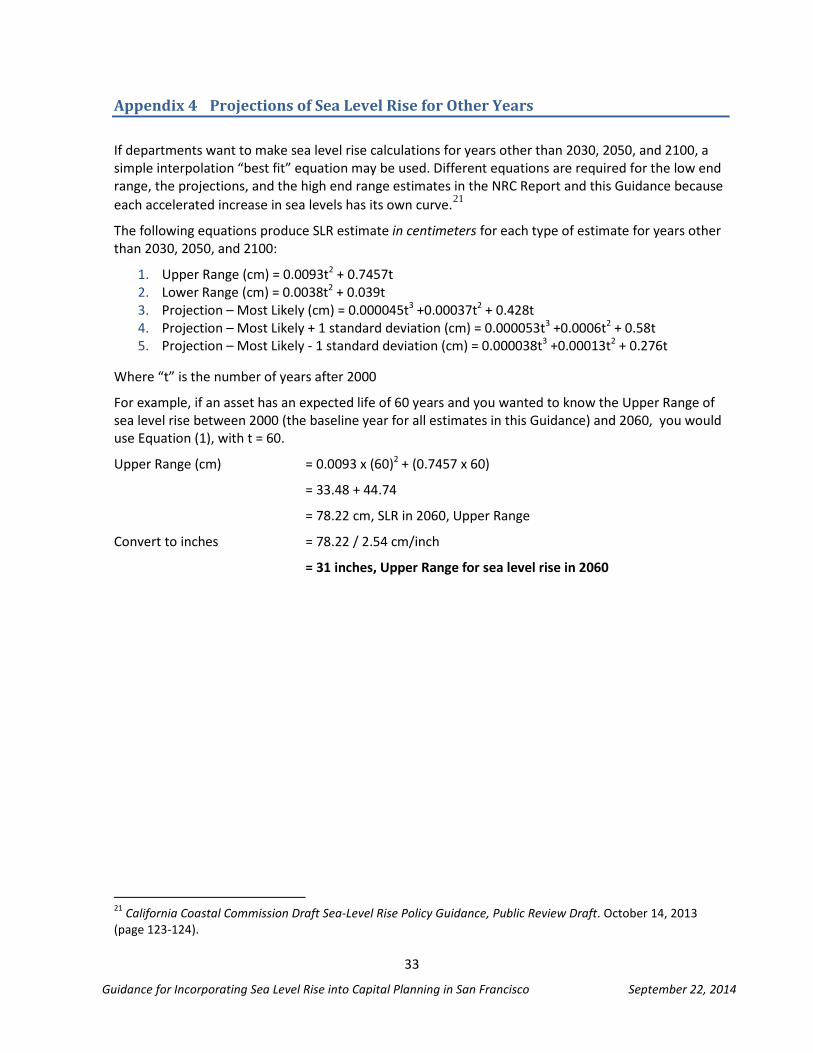
33
Guidance for Incorporating Sea Level Rise into Capital Planning in San Francisco September 22, 2014
Appendix 4 Projections of Sea Level Rise for Other Years
If departments want to make sea level rise calculations for years other than 2030, 2050, and 2100, a simple interpolation “best fit” equation may be used. Different equations are required for the low end range, the projections, and the high end range estimates in the NRC Report and this Guidance because each accelerated increase in sea levels has its own curve.21
The following equations produce SLR estimate in centimeters for each type of estimate for years other than 2030, 2050, and 2100:
1. Upper Range (cm) = 0.0093t2 + 0.7457t 2. Lower Range (cm) = 0.0038t2 + 0.039t 3. Projection – Most Likely (cm) = 0.000045t3 +0.00037t2 + 0.428t 4. Projection – Most Likely + 1 standard deviation (cm) = 0.000053t3 +0.0006t2 + 0.58t 5. Projection – Most Likely - 1 standard deviation (cm) = 0.000038t3 +0.00013t2 + 0.276t
Where “t” is the number of years after 2000
For example, if an asset has an expected life of 60 years and you wanted to know the Upper Range of sea level rise between 2000 (the baseline year for all estimates in this Guidance) and 2060, you would use Equation (1), with t = 60.
Upper Range (cm) = 0.0093 x (60)2 + (0.7457 x 60)
= 33.48 + 44.74
= 78.22 cm, SLR in 2060, Upper Range
Convert to inches = 78.22 / 2.54 cm/inch
= 31 inches, Upper Range for sea level rise in 2060
21 California Coastal Commission Draft Sea-Level Rise Policy Guidance, Public Review Draft. October 14, 2013 (page 123-124).
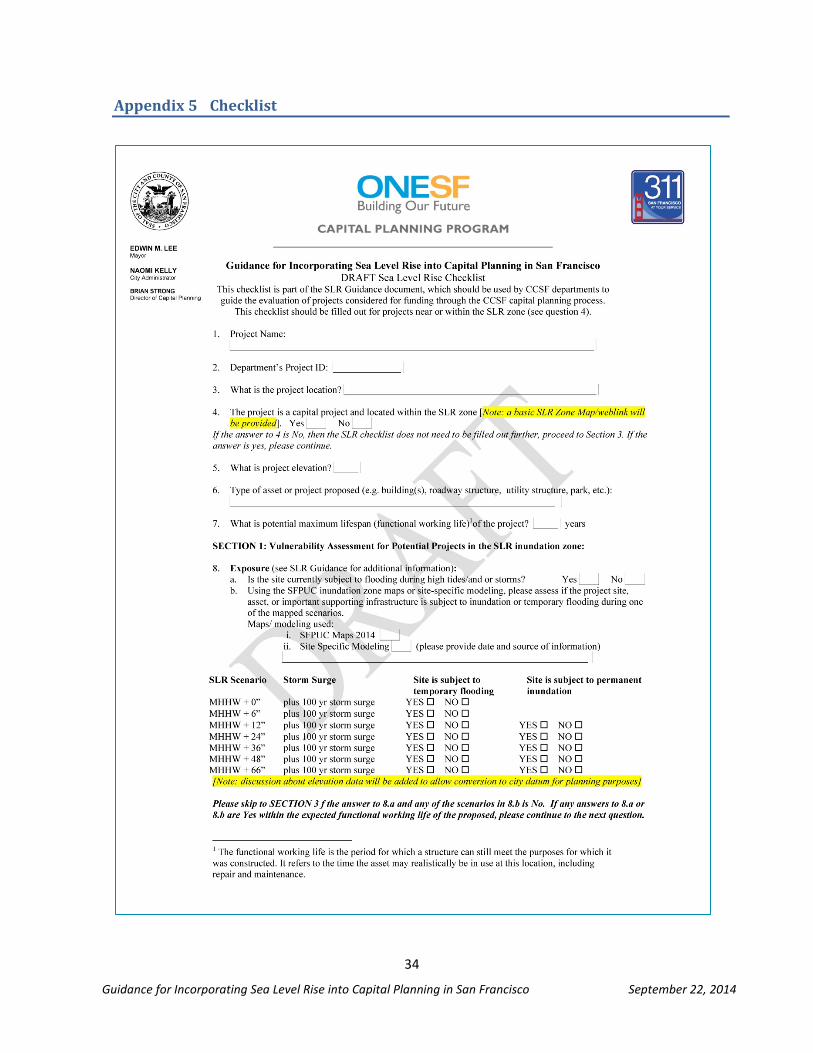
34
Guidance for Incorporating Sea Level Rise into Capital Planning in San Francisco September 22, 2014
Appendix 5 Checklist
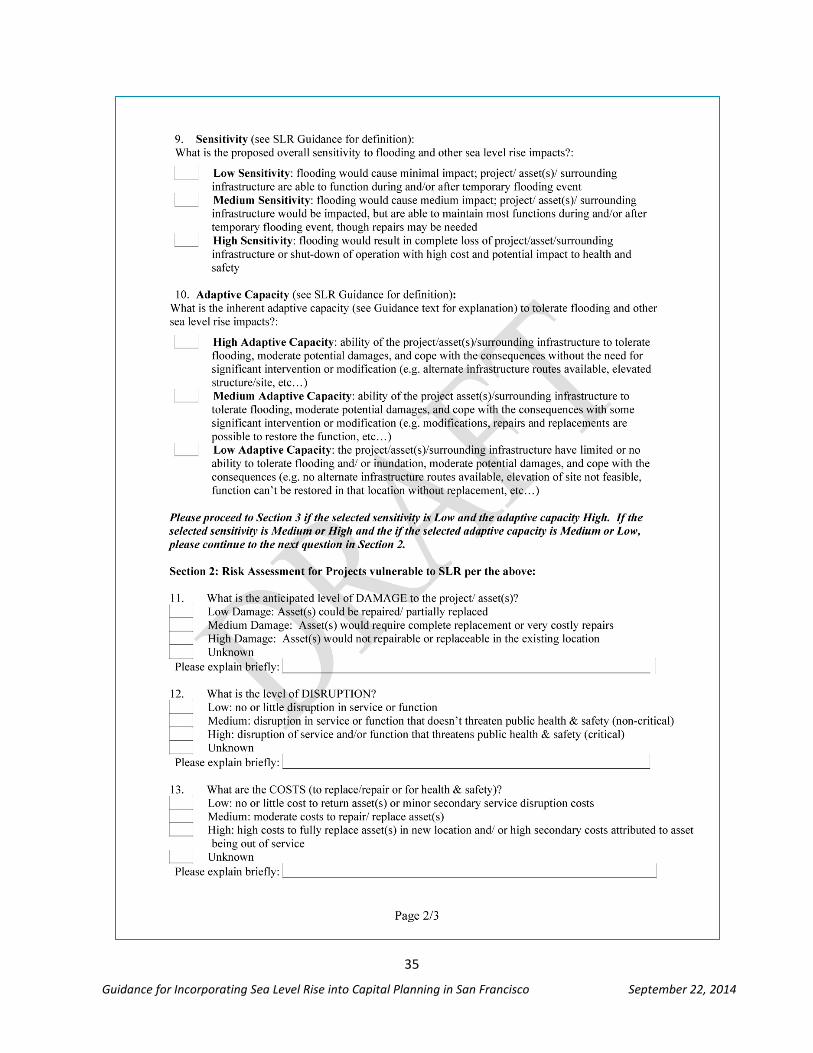
35
Guidance for Incorporating Sea Level Rise into Capital Planning in San Francisco September 22, 2014
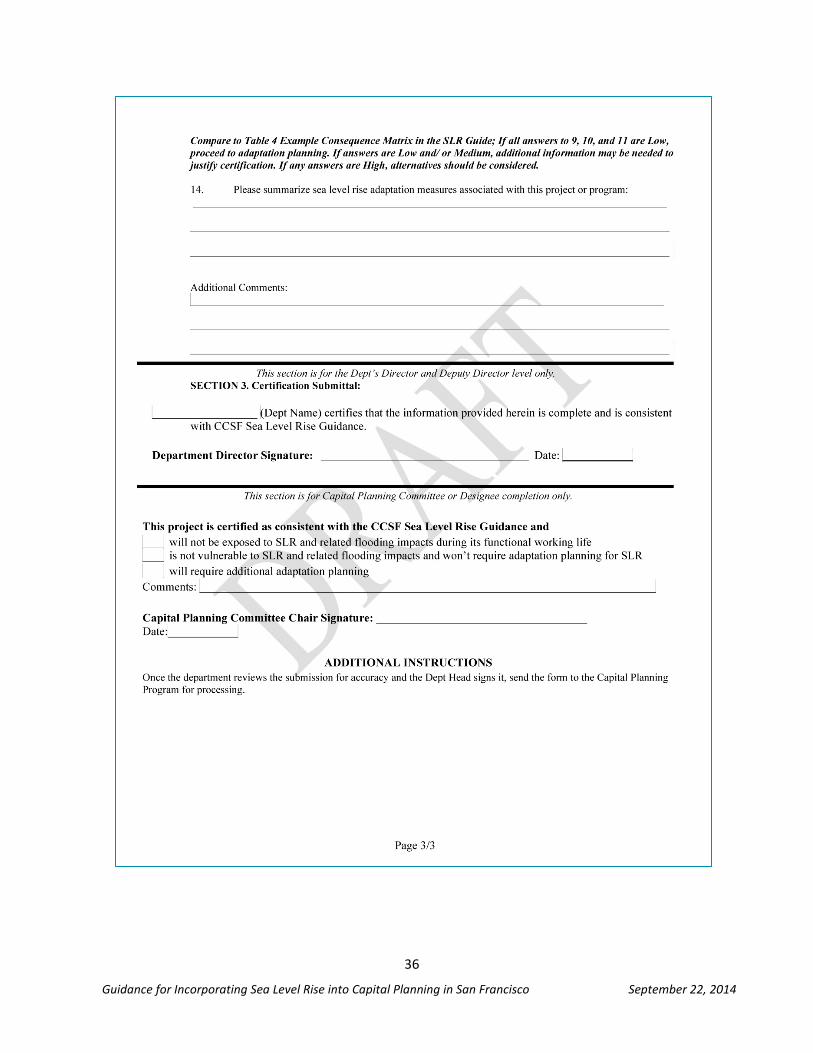
36
Guidance for Incorporating Sea Level Rise into Capital Planning in San Francisco September 22, 2014
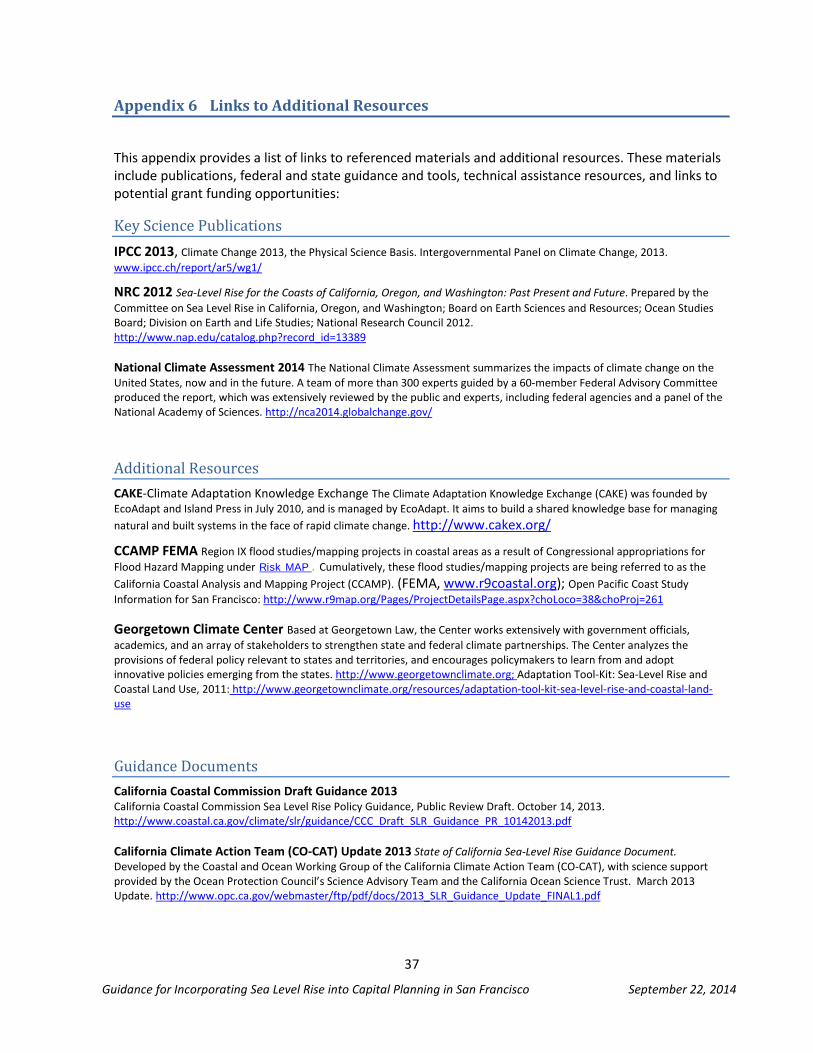
37
Guidance for Incorporating Sea Level Rise into Capital Planning in San Francisco September 22, 2014
Appendix 6 Links to Additional Resources
This appendix provides a list of links to referenced materials and additional resources. These materials include publications, federal and state guidance and tools, technical assistance resources, and links to potential grant funding opportunities:
Key Science Publications IPCC 2013, Climate Change 2013, the Physical Science Basis. Intergovernmental Panel on Climate Change, 2013. www.ipcc.ch/report/ar5/wg1/
NRC 2012 Sea-Level Rise for the Coasts of California, Oregon, and Washington: Past Present and Future. Prepared by the Committee on Sea Level Rise in California, Oregon, and Washington; Board on Earth Sciences and Resources; Ocean Studies Board; Division on Earth and Life Studies; National Research Council 2012. http://www.nap.edu/catalog.php?record_id=13389 National Climate Assessment 2014 The National Climate Assessment summarizes the impacts of climate change on the United States, now and in the future. A team of more than 300 experts guided by a 60-member Federal Advisory Committee produced the report, which was extensively reviewed by the public and experts, including federal agencies and a panel of the National Academy of Sciences. http://nca2014.globalchange.gov/
Additional Resources CAKE-Climate Adaptation Knowledge Exchange The Climate Adaptation Knowledge Exchange (CAKE) was founded by EcoAdapt and Island Press in July 2010, and is managed by EcoAdapt. It aims to build a shared knowledge base for managing natural and built systems in the face of rapid climate change. http://www.cakex.org/
CCAMP FEMA Region IX flood studies/mapping projects in coastal areas as a result of Congressional appropriations for Flood Hazard Mapping under Risk MAP . Cumulatively, these flood studies/mapping projects are being referred to as the California Coastal Analysis and Mapping Project (CCAMP). (FEMA, www.r9coastal.org); Open Pacific Coast Study Information for San Francisco: http://www.r9map.org/Pages/ProjectDetailsPage.aspx?choLoco=38&choProj=261
Georgetown Climate Center Based at Georgetown Law, the Center works extensively with government officials, academics, and an array of stakeholders to strengthen state and federal climate partnerships. The Center analyzes the provisions of federal policy relevant to states and territories, and encourages policymakers to learn from and adopt innovative policies emerging from the states. http://www.georgetownclimate.org; Adaptation Tool-Kit: Sea-Level Rise and Coastal Land Use, 2011: http://www.georgetownclimate.org/resources/adaptation-tool-kit-sea-level-rise-and-coastal-land-use
Guidance Documents California Coastal Commission Draft Guidance 2013 California Coastal Commission Sea Level Rise Policy Guidance, Public Review Draft. October 14, 2013. http://www.coastal.ca.gov/climate/slr/guidance/CCC_Draft_SLR_Guidance_PR_10142013.pdf California Climate Action Team (CO-CAT) Update 2013 State of California Sea-Level Rise Guidance Document. Developed by the Coastal and Ocean Working Group of the California Climate Action Team (CO-CAT), with science support provided by the Ocean Protection Council’s Science Advisory Team and the California Ocean Science Trust. March 2013 Update. http://www.opc.ca.gov/webmaster/ftp/pdf/docs/2013_SLR_Guidance_Update_FINAL1.pdf