Embed Size (px)
Citation preview

STATE GOVERNMENT FINANCEWashington State Data Book
Table Title PageGT01 Operating and Capital Expenditures by Major Fund 31GT02 All Revenue and Other Sources (Uses) by Major Fund 32GT03 All Revenue and Other Sources (Uses) by Major Source, General Fund 33GT04 All Revenue and Other Sources (Uses) by Major Source 34GT05 Operating and Capital Expenditures by Function, General Fund 35GT06 Operating and Capital Expenditures by Function 36GT07 Operating and Capital Expenditures by Functional Area 37GT08 Department of Social and Health Services 38GT09 Health Care Authority 39GT10 Department of Transportation 40GT11 State Research Universities 41GT12 State Regional Universities and College 42GT13 State Superintendent of Public Instruction 43GT14 Community and Technical College System 44GT15 Lottery Revenues 45GT16 Lottery Expenditures 46GT17 Full-Time Equivalent State Employees 47GT18 Budgeted Expenditures as a Percent of Total Personal Income 48GT19 Treasury Fund Bonded Indebtedness 49GT20 Washington State Government, State Agencies Based on Gubernatorial
Appointment Authority50
30
Motor AllVehicle Other
Biennium Total State Federal Private, Local Fund Funds
1987-89 19,788.7 10,340.4 2,674.2 46.2 1,603.1 5,124.81989-91 24,690.8 12,822.3 3,517.7 59.0 1,782.6 6,509.21991-931 29,432.2 15,179.9 4,890.4 136.2 1,462.3 7,763.41993-95 32,853.5 16,315.1 5,711.3 489.9 1,748.2 8,589.01995-97 36,009.7 17,732.4 6,183.6 386.5 1,455.4 10,251.81997-99 39,394.2 19,102.6 6,895.3 490.7 1,370.7 11,534.91999-01 44,547.8 21,046.4 8,327.1 493.5 1,718.4 12,962.42001-03 49,472.4 22,512.6 9,748.5 501.1 2,031.5 14,678.72003-05 53,463.3 23,671.7 10,791.2 600.7 1,705.8 16,693.92005-07 60,517.2 27,766.1 11,044.9 335.7 1,749.5 19,621.02007-09 68,492.9 29,233.1 13,319.1 427.1 1,883.7 23,629.92009-112 70,736.5 29,858.7 16,313.3 474.6 2,016.5 22,073.42011-133 70,732.7 30,758.5 14,109.6 501.5 2,150.9 23,212.22013-154 80,475.3 32,750.3 19,035.1 452.3 2,003.9 26,233.72015-17 90,285.7 37,509.9 21,938.3 519.2 1,933.2 28,385.1
1Beginning in the 1991-93 biennium, tuition-based expenditures in higher education agencies were
OPERATING AND CAPITAL EXPENDITURES BY MAJOR FUNDALL BUDGETED AND HIGHER EDUCATION FUNDS
Office of Financial Management | 360-725-0198 | http://www.ofm.wa.gov
$ in Millions
General Fund
program under the Affordable Care Act.
Table: GT01
transferred from the state general fund to a dedicated account.2In the 2009-11 biennium, $2.9 billion of the increase in federal expenditures was due to AmericanRecovery and Reinvestment Act (ARRA) grants.3In the 2011-13 biennium, federal expenditures decreased by $2.7 billion due to the phase out ofARRA grant funding.4In the 2013-15 biennium, federal expenditures increased due to the state expansion of its Medicaid
31

Motor AllVehicle Other
Biennium Total State Federal Private, Local Fund Funds
1987-89 21,762.8 10,664.9 2,674.7 22.7 1,680.7 6,719.81989-91 25,200.2 12,879.8 3,518.0 36.1 1,707.3 7,059.01991-93 28,758.0 15,006.5 4,883.5 167.9 1,493.2 7,206.91993-95 35,886.9 16,586.7 5,711.8 467.2 1,725.6 11,395.61995-97 38,705.0 17,888.7 6,178.5 351.1 1,477.6 12,809.11997-99 43,598.1 19,214.8 6,886.4 477.8 1,361.8 15,657.31999-01 47,312.2 21,173.4 8,323.6 492.2 1,768.9 15,554.12001-03 49,739.1 22,297.7 9,840.4 548.1 1,969.6 15,083.32003-05 55,928.1 24,142.4 10,886.0 603.7 1,685.2 18,610.82005-07 64,491.3 27,678.4 11,029.9 340.2 1,699.9 23,742.92007-09 67,303.0 28,528.6 13,308.4 429.4 1,902.5 23,134.12009-111 71,501.3 29,760.2 16,306.0 474.7 2,022.1 22,938.32011-132 72,955.9 30,795.3 14,105.6 503.5 2,170.8 25,380.72013-153 81,050.1 33,756.1 19,017.6 453.1 2,052.7 25,770.62015-17 91,801.0 37,893.7 21,867.6 519.5 1,891.2 29,629.0
Table: GT02
ALL REVENUE AND OTHER SOURCES (USES) BY MAJOR FUNDALL BUDGETED AND HIGHER EDUCATION FUNDS
Office of Financial Management | 360-725-0198 | http://www.ofm.wa.gov
$ in Millions
General Fund
1In the 2009-11 biennium, $2.9 billion of the increase in federal revenues were due to AmericanRecovery and Reinvestment Act (ARRA) grants.2In the 2011-13 biennium, federal revenues decreased by $2.7 billion due to the phase out ofARRA grant funding.3In the 2013-15 biennium, federal revenues increased due to the state expansion of its Medicaidprogram under the Affordable Care Act.
32

Licenses Lottery NetPermits & Liquor Distributions
Biennium Total Taxes & Fees Federal Profits1 & Transfers Other
1991-932 20,057.7 14,219.1 123.3 4,886.9 301.1 -132.8 660.11993-95 22,765.7 16,294.4 125.1 5,718.7 290.8 -341.0 677.71995-97 24,418.3 17,601.8 129.0 6,180.5 253.3 -372.2 625.91997-993 26,579.0 19,452.4 155.3 6,888.9 255.1 -903.5 730.81999-014 29,989.2 20,706.3 175.7 8,323.6 255.6 -181.5 709.52001-035 32,686.2 20,951.9 146.6 9,840.4 63.5 1,007.3 676.52003-05 35,632.1 23,206.8 150.8 10,886.0 100.7 433.7 854.12005-076 39,048.5 27,262.2 172.9 11,029.9 111.2 -159.8 632.12007-09 42,266.4 27,097.9 188.5 13,308.9 96.4 829.8 744.92009-117 46,541.0 27,592.9 170.7 16,306.0 189.8 1,408.8 872.82011-138 45,404.4 29,840.6 200.6 14,105.6 9.3 390.4 857.92013-159 53,226.8 33,033.8 219.0 19,017.6 0.6 52.7 903.12015-1710 60,280.7 37,528.8 242.3 21,867.6 48.7 -807.8 1,401.1
transferred to the private sector on June 1, 2012. This eliminated liquor profits as a source of revenue to the
ALL REVENUE AND OTHER SOURCES (USES) BY MAJOR SOURCEGENERAL FUND
Office of Financial Management | 360-725-0198 | http://www.ofm.wa.gov
$ in Millions
1In the 2011-13 biennium with the passage of Initiative 1183, the distribution and retail sale of spirits was
The Tobacco Settlement Authority transferred $450 million to the state in exchange for 29.2% of the state’s tobacco
state, but new retail license fees of $187.7 million were assessed and transferred into the General Fund.2Starting in the 1991-93 biennium, Bond Retirement and Interest and Debt Service in the General Fund were reclassified from negative revenue to an expenditure.3In the 1997-99 biennium, $514.5 million of General Fund-State revenues were transferred to the state'sEmergency Reserve Fund under provisions of Initiative 601, approved by Washington voters in theNovember 1993 general election.4In the 1999-01 biennium, the Initiative 601 mandated General Fund-State revenue transfer to the EmergencyReserve Fund decreased to $198.5 million. Additionally, under the provisions of Initiative 695, which was approvedby Washington voters in the November 1999 general election, Motor Vehicle Excise Taxes distributions from the General Fund-decreased $355.4 million from the prior biennium.5In the 2001-03 biennium, $325 million was transferred from the state’s Emergency Reserve to the General Fund-State.
9In the 2013-15 biennium, federal revenues increased due to the state expansion of its Medicaid program under
settlement revenue stream. Additionally, starting in the 2001-03 biennium, in accordance with the provisions of the Student Achievement Act, as required by Initiative 728, transfers from the State Lottery Account and a portion of the state property tax are deposited in the Student Achievement Account for expenditure by the Superintendent of PublicInstruction.6In the 2005-07 biennium, $1.2 million in transfers were made to dedicated accounts to pay for health services, education and pension funding stabilization.7In the 2009-11 biennium, $1.4 million in transfers were made from other accounts to address revenue shortfalls. Additionally, $2.9 billion of the increase in federal revenues were due to American Recovery and Reinvestment Act(ARRA) grants.8In the 2011-13 biennium, beer and wine taxes and license fees for alcoholic beverages of $152.9 million and federalrevenues decreased by $2.7 billion due to the phase out of ARRA grants funding.
the Affordable Care Act.10In the 2015-17 biennium, $1.3 billion was transferred from the General Fund Basic Account to the BudgetStabilization account in accordance with the Constitution.
Table: GT03
33

Licenses Lottery NetPermits & Liquor1 Distributions
Biennium Total Taxes & Fees Federal Profits & Transfers Other
1989-91 25,200.1 14,600.0 727.3 5,309.0 277.4 -101.6 4,388.01991-932 28,758.0 16,452.4 858.9 6,800.1 322.5 -1,019.3 5,343.41993-95 35,886.9 18,955.0 940.6 7,880.1 311.4 -1,182.9 8,982.71995-97 38,704.9 20,786.2 1,001.2 8,252.4 287.7 -1,302.9 9,680.31997-99 43,598.1 23,049.4 1,091.9 8,916.0 280.7 -1,405.3 11,665.41999-01 47,312.2 23,991.6 1,232.4 10,659.2 338.7 -1,097.5 12,187.82001-03 49,739.1 24,286.0 1,296.2 12,528.2 232.2 -734.9 12,131.42003-05 55,928.1 27,286.0 1,406.6 13,875.6 403.5 -750.7 13,707.12005-073 64,491.3 32,403.5 1,686.0 14,320.3 422.3 546.9 15,112.32007-09 67,303.0 32,477.4 1,856.7 16,762.3 413.4 -1,551.6 17,344.82009-114 71,501.3 31,325.7 2,111.1 20,406.2 481.7 -1,160.8 18,337.42011-135 72,955.8 33,324.9 2,898.3 18,465.7 274.3 -1,402.7 19,395.32013-156 81,050.1 36,834.5 3,314.9 23,258.8 272.8 -1,590.0 18,959.12015-17 91,800.9 42,744.9 3,554.8 26,284.4 327.8 -1,802.3 20,691.3
2Starting in the 1991-93 biennium, Bond Retirement and Interest and Debt Service in the General Fund were
ALL REVENUE AND OTHER SOURCES (USES) BY MAJOR SOURCEALL BUDGETED AND HIGHER EDUCATION FUNDS
Office of Financial Management | 360-725-0198 | http://www.ofm.wa.gov
$ in Millions
1In the 2011-13 biennium, with the passage of Initiative 1183, the distribution and retail sale of spirits was
transferred to the private sector on June 1, 2012. This eliminated liquor profits as a source of revenue to the state.6In the 2013-15 biennium, federal revenues increased due to the state expansion of its Medicaid programunder the Affordable Care Act.
Table: GT04
reclassified from a negative revenue to an expenditure.3In the 2005-07 biennium, $1.2 million in transfers were made to dedicated accounts to pay for health services, education, and pension funding stabilization.4In the 2009-11 biennium, $3.5 billion of the increase in federal revenues were due to American Recovery and Reinvestment Act (ARRA) grants.5In the 2011-13 biennium, federal revenues decreased by $2.7 billion due to the phase out of ARRA grants.
34
Biennium 1997-99 1999-01 2001-03 2003-05 2005-071 2007-09 2009-112 2011-133 2013-154 2015-17
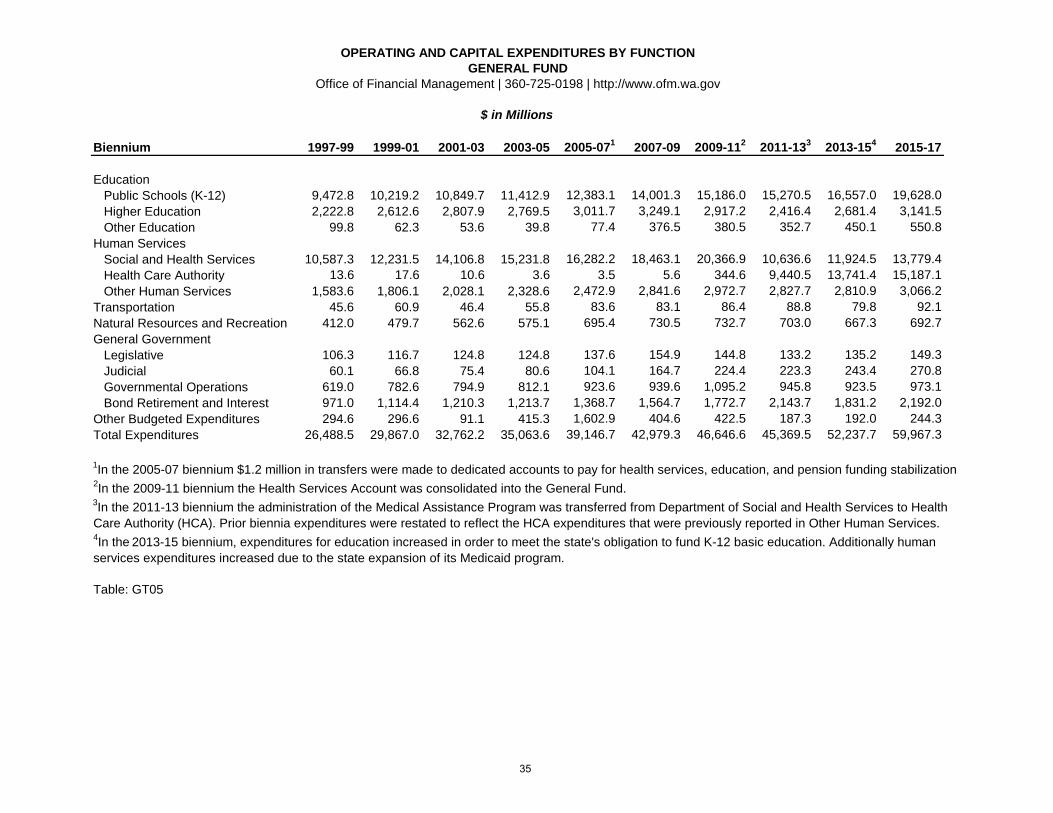
Education Public Schools (K-12) 9,472.8 10,219.2 10,849.7 11,412.9 12,383.1 14,001.3 15,186.0 15,270.5 16,557.0 19,628.0 Higher Education 2,222.8 2,612.6 2,807.9 2,769.5 3,011.7 3,249.1 2,917.2 2,416.4 2,681.4 3,141.5 Other Education 99.8 62.3 53.6 39.8 77.4 376.5 380.5 352.7 450.1 550.8Human Services Social and Health Services 10,587.3 12,231.5 14,106.8 15,231.8 16,282.2 18,463.1 20,366.9 10,636.6 11,924.5 13,779.4 Health Care Authority 13.6 17.6 10.6 3.6 3.5 5.6 344.6 9,440.5 13,741.4 15,187.1 Other Human Services 1,583.6 1,806.1 2,028.1 2,328.6 2,472.9 2,841.6 2,972.7 2,827.7 2,810.9 3,066.2Transportation 45.6 60.9 46.4 55.8 83.6 83.1 86.4 88.8 79.8 92.1Natural Resources and Recreation 412.0 479.7 562.6 575.1 695.4 730.5 732.7 703.0 667.3 692.7General Government Legislative 106.3 116.7 124.8 124.8 137.6 154.9 144.8 133.2 135.2 149.3 Judicial 60.1 66.8 75.4 80.6 104.1 164.7 224.4 223.3 243.4 270.8 Governmental Operations 619.0 782.6 794.9 812.1 923.6 939.6 1,095.2 945.8 923.5 973.1 Bond Retirement and Interest 971.0 1,114.4 1,210.3 1,213.7 1,368.7 1,564.7 1,772.7 2,143.7 1,831.2 2,192.0Other Budgeted Expenditures 294.6 296.6 91.1 415.3 1,602.9 404.6 422.5 187.3 192.0 244.3Total Expenditures 26,488.5 29,867.0 32,762.2 35,063.6 39,146.7 42,979.3 46,646.6 45,369.5 52,237.7 59,967.3
Care Authority (HCA). Prior biennia expenditures were restated to reflect the HCA expenditures that were previously reported in Other Human Services.
Table: GT05
3In the 2011-13 biennium the administration of the Medical Assistance Program was transferred from Department of Social and Health Services to Health
4In the 2013-15 biennium, expenditures for education increased in order to meet the state's obligation to fund K-12 basic education. Additionally human services expenditures increased due to the state expansion of its Medicaid program.
OPERATING AND CAPITAL EXPENDITURES BY FUNCTIONGENERAL FUND
Office of Financial Management | 360-725-0198 | http://www.ofm.wa.gov
$ in Millions
1In the 2005-07 biennium $1.2 million in transfers were made to dedicated accounts to pay for health services, education, and pension funding stabilization.2In the 2009-11 biennium the Health Services Account was consolidated into the General Fund.
35
Biennium 1997-99 1999-01 2001-03 2003-05 2005-071 2007-09 2009-11 2011-13 2013-152 2015-17
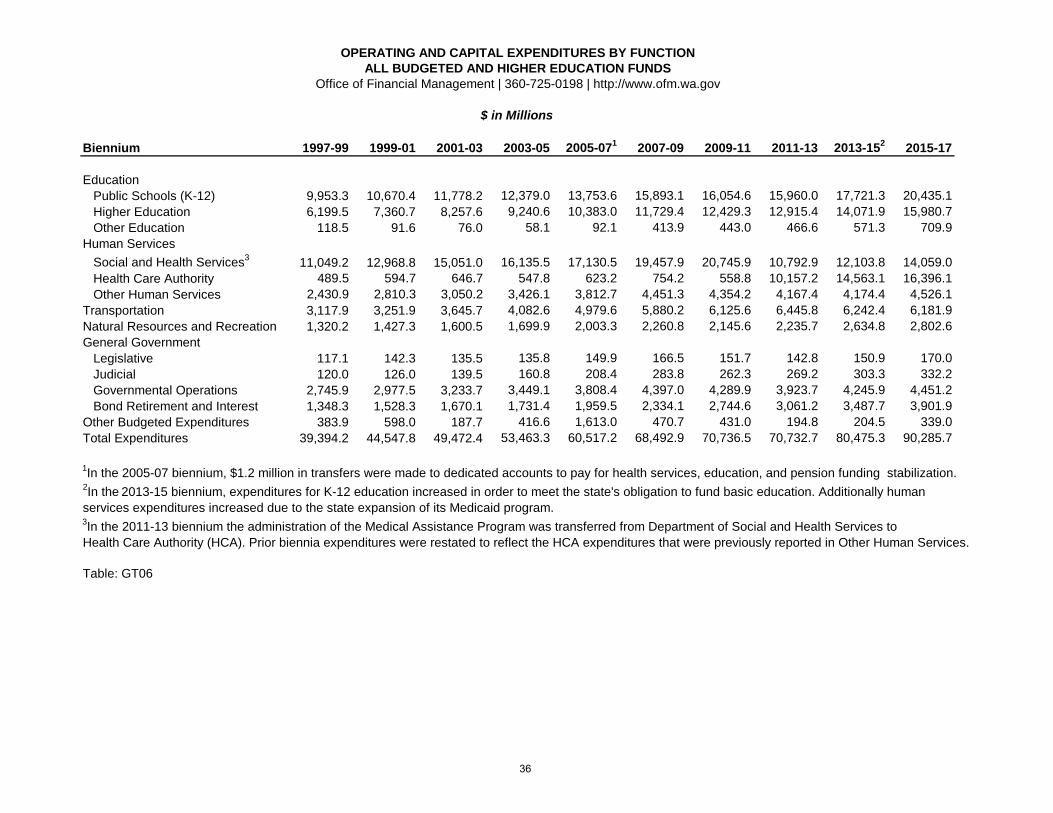
Education Public Schools (K-12) 9,953.3 10,670.4 11,778.2 12,379.0 13,753.6 15,893.1 16,054.6 15,960.0 17,721.3 20,435.1 Higher Education 6,199.5 7,360.7 8,257.6 9,240.6 10,383.0 11,729.4 12,429.3 12,915.4 14,071.9 15,980.7 Other Education 118.5 91.6 76.0 58.1 92.1 413.9 443.0 466.6 571.3 709.9Human Services Social and Health Services3 11,049.2 12,968.8 15,051.0 16,135.5 17,130.5 19,457.9 20,745.9 10,792.9 12,103.8 14,059.0 Health Care Authority 489.5 594.7 646.7 547.8 623.2 754.2 558.8 10,157.2 14,563.1 16,396.1 Other Human Services 2,430.9 2,810.3 3,050.2 3,426.1 3,812.7 4,451.3 4,354.2 4,167.4 4,174.4 4,526.1Transportation 3,117.9 3,251.9 3,645.7 4,082.6 4,979.6 5,880.2 6,125.6 6,445.8 6,242.4 6,181.9Natural Resources and Recreation 1,320.2 1,427.3 1,600.5 1,699.9 2,003.3 2,260.8 2,145.6 2,235.7 2,634.8 2,802.6General Government Legislative 117.1 142.3 135.5 135.8 149.9 166.5 151.7 142.8 150.9 170.0 Judicial 120.0 126.0 139.5 160.8 208.4 283.8 262.3 269.2 303.3 332.2 Governmental Operations 2,745.9 2,977.5 3,233.7 3,449.1 3,808.4 4,397.0 4,289.9 3,923.7 4,245.9 4,451.2 Bond Retirement and Interest 1,348.3 1,528.3 1,670.1 1,731.4 1,959.5 2,334.1 2,744.6 3,061.2 3,487.7 3,901.9Other Budgeted Expenditures 383.9 598.0 187.7 416.6 1,613.0 470.7 431.0 194.8 204.5 339.0Total Expenditures 39,394.2 44,547.8 49,472.4 53,463.3 60,517.2 68,492.9 70,736.5 70,732.7 80,475.3 90,285.7
Table: GT06
services expenditures increased due to the state expansion of its Medicaid program.3In the 2011-13 biennium the administration of the Medical Assistance Program was transferred from Department of Social and Health Services toHealth Care Authority (HCA). Prior biennia expenditures were restated to reflect the HCA expenditures that were previously reported in Other Human Services.
OPERATING AND CAPITAL EXPENDITURES BY FUNCTIONALL BUDGETED AND HIGHER EDUCATION FUNDS
Office of Financial Management | 360-725-0198 | http://www.ofm.wa.gov
$ in Millions
1In the 2005-07 biennium, $1.2 million in transfers were made to dedicated accounts to pay for health services, education, and pension funding stabilization.2In the 2013-15 biennium, expenditures for K-12 education increased in order to meet the state's obligation to fund basic education. Additionally human
36

General NaturalHuman Government Resources &
Biennium Total Education Services & Other Transportation Recreation
Operating Expenditures1991-931 26,303.1 11,821.8 9,409.4 2,993.1 1,279.9 798.91993-95 29,446.7 12,888.3 11,010.9 3,231.7 1,462.1 853.71995-97 32,605.1 14,083.3 12,286.2 3,860.8 1,525.5 849.31997-99 35,712.2 15,375.9 13,729.3 4,321.2 1,407.4 878.41999-01 40,463.7 17,076.1 16,101.7 4,773.9 1,510.6 1,001.42001-03 44,999.9 19,018.3 18,548.8 4,778.3 1,577.1 1,077.32003-05 48,371.9 20,349.7 19,862.7 5,334.5 1,733.2 1,091.82005-07 54,262.7 22,632.5 21,223.4 7,145.2 1,960.4 1,301.22007-09 60,827.4 26,100.7 24,242.4 6,801.9 2,252.8 1,429.62009-11 63,547.9 27,352.7 25,481.9 7,141.2 2,223.2 1,348.92011-13 63,817.1 28,096.2 24,977.1 7,049.2 2,271.6 1,423.02013-152 73,327.5 30,973.9 30,703.0 7,671.2 2,424.2 1,555.22015-17 83,451.6 35,615.6 34,813.7 8,563.4 2,678.7 1,780.2
Capital Expenditures1991-931 3,129.0 818.5 327.2 247.5 1,307.7 428.11993-95 3,406.7 855.5 155.6 289.6 1,712.2 393.81995-97 3,404.6 903.7 160.7 309.6 1,742.5 288.11997-99 3,681.9 895.4 240.3 393.9 1,710.4 441.91999-01 4,084.1 1,046.6 272.1 598.2 1,741.4 425.82001-03 4,472.5 1,093.5 199.1 588.2 2,068.6 523.22003-05 5,091.4 1,328.0 246.7 559.2 2,349.4 608.12005-07 6,254.5 1,596.4 343.0 593.9 3,019.2 702.02007-09 7,665.5 1,935.7 421.0 850.2 3,627.4 831.22009-11 7,188.6 1,574.2 177.0 738.3 3,902.5 796.62011-13 6,915.6 1,245.8 140.4 542.5 4,174.2 812.72013-15 7,147.9 1,390.6 138.3 721.1 3,818.3 1,079.62015-17 6,834.0 1,510.2 167.5 630.8 3,503.2 1,022.3
Table: GT07
Development and Growth Planning Hearings are included under General Government. The Department of Community
OPERATING AND CAPITAL EXPENDITURES BY FUNCTIONAL AREAALL BUDGETED AND HIGHER EDUCATION FUNDS
Office of Financial Management | 360-725-0198 | http://www.ofm.wa.gov
$ in Millions
1Beginning in the 1991-93 biennium, the Department of Community Development, Department of Trade and Economic
Development and the Department of Trade and Economic Development have since combined to form the Department of Commerce (formerly known as the Department of Community, Trade and Economic Development).2In the 2013-15 biennium, expenditures for K-12 education increased in order to meet the state's obligation to fund basic education. Additionally human services expenditures increased due to the state expansion of its Medicaidprogram under the Affordable Care Act.
37

General Private, Local &Biennium Total Fund State Other State Federal Nonappropriated
1995-97 9,862.1 4,535.3 304.8 4,730.9 291.11997-99 10,959.5 4,886.0 369.6 5,315.7 388.21999-01 12,894.9 5,364.0 654.7 6,541.7 334.52001-03 14,955.5 6,225.9 838.7 7,577.4 313.52003-05 16,071.6 6,689.8 832.5 8,158.0 391.32005-07 17,099.7 7,936.0 814.1 8,235.0 114.62007-09 19,397.3 8,365.4 931.1 9,925.3 175.52009-111 20,714.1 8,650.3 345.3 11,520.7 197.82011-132 10,772.5 5,330.6 134.0 5,131.7 176.22013-153 12,080.4 5,733.6 152.6 6,026.2 168.02015-174 14,012.2 6,321.0 217.7 7,312.2 161.3
Table: GT08
clients covered under the Affordable Care Act continued to increase.
DEPARTMENT OF SOCIAL AND HEALTH SERVICESOPERATING EXPENDITURES BY SOURCE OF FUNDS
Office of Financial Management | 360-725-0198 | http://www.ofm.wa.gov
$ in Millions
1In the 2009-11 biennium, federal expenditures included $1.7 billion of American Recovery and ReinvestmentAct (ARRA) grants.2In the 2011-13 biennium, the Medicaid program moved from DSHS to Health Care Authority. Additionally,federal expenditures decreased by $1.7 billion due to the phase out of ARRA grant funding.3In the 2013-15 biennium, federal expenditures increased due to the state expansion of its Medicaid programunder the Affordable Care Act.4In the 2015-17 biennium, the state made important investments in mental health services, and the number of
38

General Private, Local &Biennium Total Fund State Other State Federal Nonappropriated
1997-99 489.5 13.6 346.9 0.0 129.01999-01 594.7 13.2 434.3 4.5 142.72001-03 646.7 6.7 513.1 4.0 122.92003-05 547.8 0.0 426.5 3.6 117.72005-07 623.2 0.0 487.6 3.4 132.22007-09 754.2 1.3 592.0 4.3 156.62009-111 558.8 312.1 38.0 32.6 176.12011-132 10,157.2 4,100.2 524.5 5,283.6 248.92013-153 14,563.0 4,197.7 693.4 9,516.2 155.72015-174 16,396.2 3,975.1 825.4 11,143.5 452.2
Table: GT09
HEALTH CARE AUTHORITYOPERATING EXPENDITURES BY SOURCE OF FUNDS
Office of Financial Management | 360-725-0198 | http://www.ofm.wa.gov
$ in Millions
1In the 2009-11 biennium, the Health Services Account was consolidated into the General Fund.2In the 2011-13 biennium, the administration of the Medical Assistance Program transferred from the Department of Social and Health Services to Health Care Authority. 3In the 2013-15 biennium, federal expenditures increased due to the state expansion of its Medicaidprogram under the Affordable Care Act.4In the 2015-17 biennium, the state made important investments in mental health services, and thenumber of clients covered under the Affordable Care Act continued to increase.
39

Private, Local &Biennium Total State Federal Nonappropriated
1981-83 262.7 183.5 15.8 63.41983-851 423.2 239.7 15.2 168.31985-87 467.4 294.1 14.4 158.91987-892 433.5 412.2 16.1 5.21989-913 628.6 489.5 22.2 116.91991-93 736.0 592.4 25.0 118.61993-95 874.3 696.0 37.4 140.91995-97 869.3 663.5 64.3 141.51997-99 932.3 743.3 24.5 164.51999-01 984.3 829.5 31.2 123.62001-03 1,007.4 889.7 30.4 87.32003-05 1,129.2 986.6 37.3 105.32005-07 1,255.0 1,111.6 42.2 101.22007-09 1,473.1 1,297.4 61.5 114.22009-11 1,443.2 1,295.0 31.5 116.72011-13 1,475.1 1,323.6 32.7 118.82013-15 1,551.3 1,393.9 39.5 117.92015-17 1,700.4 1,531.4 46.9 122.1
Ferry System funds which were previously not budgeted.
DEPARTMENT OF TRANSPORTATIONOPERATING EXPENDITURES BY SOURCE OF FUNDS
Office of Financial Management | 360-725-0198 | http://www.ofm.wa.gov
$ in Millions
1The increase in Private, Local and Nonappropriated funds was due to budgeting of
Table: GT10
2The reduction in Private, Local and Nonappropriated funds was offset by a corresponding increase in State funds due to a change in budgeting of Ferry System funds which wasallotted previously but were appropriated in the 1987-89 biennium.3The increase in Private, Local and Nonappropriated Funds was due to budgeting of the Transportation Equipment Fund which was allotted in the 1989-91 biennium which had not previously been budgeted.
40

General Private, Local &Biennium Total Fund State Other State Federal Nonappropriated
1989-91 2,224.8 956.9 7.9 617.6 642.41991-932 2,602.4 938.5 115.1 756.0 792.81993-953 2,744.8 794.6 16.0 831.6 1,102.61995-97 3,061.0 837.1 17.3 843.0 1,363.61997-99 3,434.4 921.8 13.0 894.6 1,605.01999-01 4,102.4 1,032.9 27.7 1,032.4 2,009.42001-03 4,649.2 1,074.7 12.9 1,298.6 2,263.02003-05 5,293.4 1,014.2 12.0 1,547.2 2,720.02005-074 5,877.4 1,109.0 35.2 1,621.8 3,111.42007-09 6,590.2 1,187.9 92.3 1,653.8 3,656.22009-115 7,316.6 869.4 102.5 1,996.1 4,348.62011-136 7,936.8 671.1 66.6 2,051.8 5,147.32013-15 8,780.0 794.5 66.5 1,970.7 5,948.32015-17 10,009.4 985.3 81.5 2,016.1 6,926.5
5In the 2009-11 biennium, $264.3 million of the increase in federal expenditures were due to American Recovery
STATE RESEARCH UNIVERSITIES1
OPERATING EXPENDITURES BY SOURCE OF FUNDSALL BUDGETED AND HIGHER EDUCATION FUNDS
Office of Financial Management | 360-725-0198 | http://www.ofm.wa.gov
$ in Millions
1Composed of the University of Washington and Washington State University.2In the 1991-93 biennium tuition-based expenditures were transferred from the general fund to a special state fund. 3In the 1993-95 biennium tuition-based expenditures were moved to a local fund.4In the 2005-07 biennium the increase in other state revenues is attributable to a dedicated increase in cigarettetaxes and the stand-alone estate tax which is deposited into the Education Legacy Trust Account for the StudentAchievement Account for the purpose of expanding access to higher education.
and Reinvestment Act (ARRA) grants.6In the 2011-13 biennium, federal expenditures for all biennia were restated to reflect total federal expendituresas opposed to only federal expenditures in budgeted funds as previously reported. Additionally, federal expenditures decreased by $165.7 million due to the phase out of ARRA grant funding.
Table: GT11
41
General Private, Local &Biennium Total Fund State Other State Federal Nonappropriated
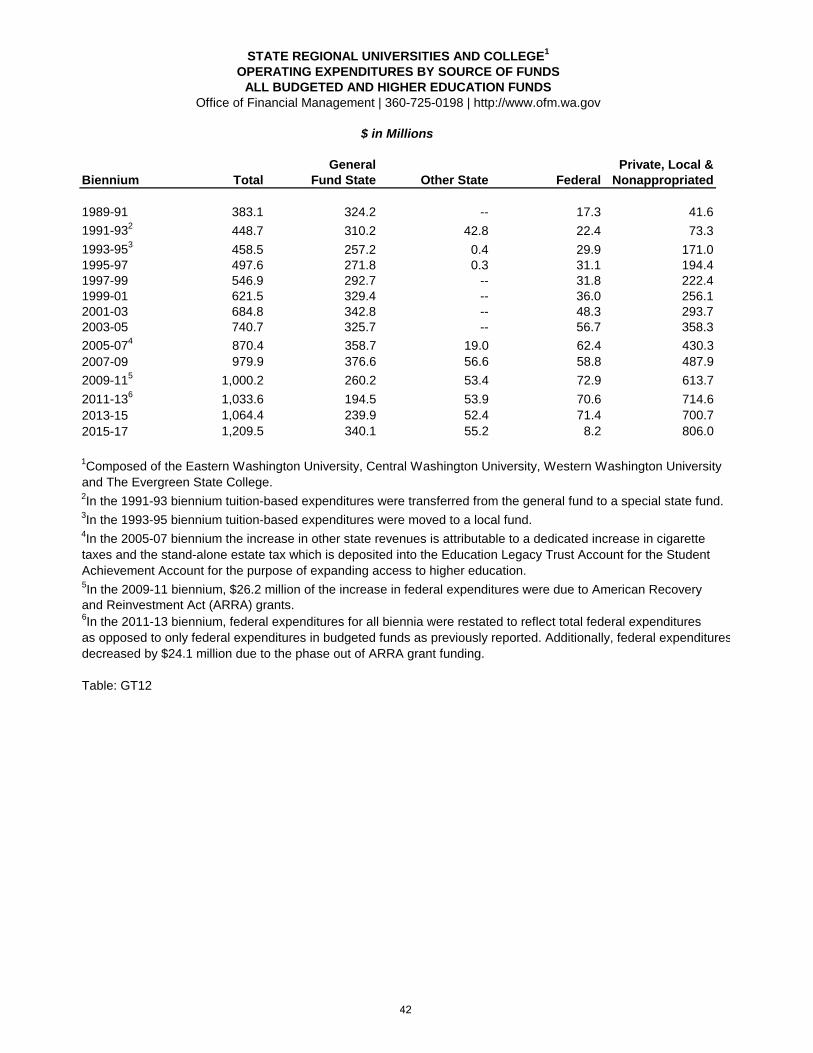
1989-91 383.1 324.2 -- 17.3 41.61991-932 448.7 310.2 42.8 22.4 73.31993-953 458.5 257.2 0.4 29.9 171.01995-97 497.6 271.8 0.3 31.1 194.41997-99 546.9 292.7 -- 31.8 222.41999-01 621.5 329.4 -- 36.0 256.12001-03 684.8 342.8 -- 48.3 293.72003-05 740.7 325.7 -- 56.7 358.32005-074 870.4 358.7 19.0 62.4 430.32007-09 979.9 376.6 56.6 58.8 487.92009-115 1,000.2 260.2 53.4 72.9 613.72011-136 1,033.6 194.5 53.9 70.6 714.62013-15 1,064.4 239.9 52.4 71.4 700.72015-17 1,209.5 340.1 55.2 8.2 806.0
1Composed of the Eastern Washington University, Central Washington University, Western Washington University
STATE REGIONAL UNIVERSITIES AND COLLEGE1
OPERATING EXPENDITURES BY SOURCE OF FUNDSALL BUDGETED AND HIGHER EDUCATION FUNDS
Office of Financial Management | 360-725-0198 | http://www.ofm.wa.gov
$ in Millions
Table: GT12
and The Evergreen State College.2In the 1991-93 biennium tuition-based expenditures were transferred from the general fund to a special state fund.3In the 1993-95 biennium tuition-based expenditures were moved to a local fund.4In the 2005-07 biennium the increase in other state revenues is attributable to a dedicated increase in cigarette taxes and the stand-alone estate tax which is deposited into the Education Legacy Trust Account for the Student Achievement Account for the purpose of expanding access to higher education.5In the 2009-11 biennium, $26.2 million of the increase in federal expenditures were due to American Recoveryand Reinvestment Act (ARRA) grants.6In the 2011-13 biennium, federal expenditures for all biennia were restated to reflect total federal expendituresas opposed to only federal expenditures in budgeted funds as previously reported. Additionally, federal expendituresdecreased by $24.1 million due to the phase out of ARRA grant funding.
42

General Private, Local &Biennium Total Fund State Other State Federal Nonappropriated
1989-91 6,359.4 5,946.3 27.2 333.0 52.91991-931 7,581.8 7,073.3 21.8 418.2 68.51993-95 8,291.6 7,706.1 19.2 488.3 78.01995-97 8,924.4 8,273.1 23.1 544.5 83.71997-99 9,559.5 8,770.8 61.3 649.0 78.41999-01 10,302.9 9,447.1 -- 772.1 83.72001-032 11,315.1 9,872.3 370.0 977.3 95.52003-05 11,921.8 10,170.0 409.6 1,242.9 99.32005-073 13,173.9 11,029.3 691.1 1,353.9 99.62007-09 15,158.1 12,237.0 1,047.5 1,764.3 109.32009-114 15,444.3 12,801.5 143.8 2,384.5 114.52011-135 15,405.9 13,523.4 26.1 1,740.9 115.52013-156 17,075.9 14,865.3 399.5 1,684.0 127.12015-17 19,919.5 17,958.0 164.3 1,665.2 132.0
grant funding.
taxes and the stand-alone estate tax which is deposited into the Education Legacy Trust Account for the Student
STATE SUPERINTENDENT OF PUBLIC INSTRUCTIONOPERATING EXPENDITURES BY SOURCE OF FUNDS
ALL BUDGETED FUNDSOffice of Financial Management | 360-725-0198 | http://www.ofm.wa.gov
$ in Millions
1Starting with the 1991-93 biennium, the five technical schools are administered through the State Board forCommunity and Technical Colleges instead of the OSPI.2Starting in the 2001-03 biennium, in accordance with the provisions of the Student Achievement Act, as requiredby Initiative 728, transfers from the State Lottery Account and a portion of the state property tax are deposited inthe Student Achievement Account for expenditure by the Superintendent of Public Instruction.3In the 2005-07 biennium the increase in other state revenues is attributable to a dedicated increase in cigarette
Table: GT13
Achievement Account for the purpose of expanding access to higher education.4In the 2009-11 biennium, federal expenditures included $699.8 million of American Recovery and Reinvestment Act (ARRA) grants.5In the 2011-13 biennium, federal expenditures decreased by $562.9 million due to the phase out of ARRA
6Starting in the 2013-15 biennium, expenditures increased for K-12 education in order to meet the state's obligation to fund basic education under the state Supreme Court's 2012 McCleary ruling.
43

General Private, Local &Biennium Total Fund State Other State Federal Nonappropriated
1989-91 750.8 636.0 -- 28.9 85.91991-931 1,013.0 737.9 61.8 36.4 176.91993-95 1,155.4 694.3 34.3 45.7 381.11995-97 1,271.2 707.0 57.3 47.5 459.41997-99 1,394.9 800.4 29.0 49.3 516.21999-01 1,622.8 945.2 0.9 63.4 613.32001-03 1,833.3 1,049.1 4.9 85.2 694.12003-05 1,939.9 1,033.5 6.7 104.9 794.82005-072 2,151.5 1,142.9 49.6 106.2 852.82007-09 2,419.9 1,247.9 156.4 110.2 905.42009-11 2,590.0 1,234.8 113.5 129.5 1,112.22011-133 2,572.6 1,047.3 107.1 149.5 1,268.72013-15 2,741.0 1,129.8 110.9 144.1 1,356.22015-17 3,026.8 1,291.4 119.7 155.2 1,460.5
1Composed of all Community and Technical Colleges; prior to the 1991-93 biennium, the technical colleges
COMMUNITY AND TECHNICAL COLLEGE SYSTEM1
OPERATING EXPENDITURES BY SOURCE OF FUNDSALL BUDGETED AND HIGHER EDUCATION FUNDS
Office of Financial Management | 360-725-0198 | http://www.ofm.wa.gov
$ in Millions
Table: GT14
were administered through the Office of Superintendent of Public Instruction.2In the 2005-07 biennium the increase in other state revenues is attributable to a dedicated increase incigarette taxes and the stand-alone estate tax which is deposited into the Education Legacy Trust Accountfor the Student Achievement Account for the purpose of expanding access to higher education.3In the 2011-13 biennium, federal expenditures for all biennia were restated to reflect total federal expendituresas opposed to only federal expenditures in budgeted funds as previously reported.
44

State Fiscal Total Daily Daily Lucky Mega-Year Revenue Scratch Game Lotto Quinto Keno for Life Millions Powerball Zip Hit 5 Raffle Match 4 Interest
1996 390.3 164.6 17.5 139.9 54.5 13.4 0.0 0.0 0.0 0.0 0.0 0.0 0.0 0.41997 408.6 206.4 17.5 121.9 49.7 12.8 0.0 0.0 0.0 0.0 0.0 0.0 0.0 0.31998 455.4 230.3 18.3 140.1 53.9 12.1 0.0 0.0 0.0 0.0 0.0 0.0 0.0 0.71999 474.0 236.6 18.0 140.0 44.1 10.5 24.2 0.0 0.0 0.0 0.0 0.0 0.0 0.62000 453.5 259.1 18.5 107.7 37.9 9.6 19.9 0.0 0.0 0.0 0.0 0.0 0.0 0.72001 484.8 243.0 18.2 155.2 40.9 8.9 17.8 0.0 0.0 0.0 0.0 0.0 0.0 0.92002 439.3 242.4 18.1 120.8 30.0 8.0 19.2 0.0 0.0 0.0 0.0 0.0 0.0 0.72003 460.4 241.9 18.2 105.0 26.3 7.3 15.8 45.9 0.0 0.0 0.0 0.0 0.0 0.62004 481.4 278.0 17.3 90.3 21.6 6.7 12.3 55.2 0.0 0.0 0.0 0.0 0.0 0.52005 458.1 294.7 17.2 58.6 21.6 6.5 9.3 50.2 0.0 0.0 0.0 0.0 0.0 1.12006 477.9 305.5 18.2 61.9 23.1 6.7 0.0 60.0 0.0 2.5 0.0 0.0 0.0 2.32007 492.6 325.2 19.0 57.1 16.7 6.7 0.0 57.2 0.0 0.0 10.7 0.0 0.0 2.82008 521.1 330.5 19.8 57.0 0.0 6.5 0.0 65.4 0.0 0.0 29.8 12.1 0.0 2.42009 487.7 307.0 18.3 58.3 0.0 5.5 0.0 59.6 0.0 0.0 24.4 0.0 14.6 0.82010 491.2 289.3 17.0 54.8 0.0 5.3 0.0 68.7 20.0 0.0 22.3 0.0 13.6 0.12011 513.7 309.0 16.7 54.6 0.0 5.5 0.0 55.0 35.6 0.0 20.6 2.1 11.2 0.12012 538.2 318.1 16.6 54.5 0.0 5.6 0.0 59.2 42.9 0.0 23.0 2.9 12.4 0.12013 572.5 356.0 16.7 43.8 0.0 5.6 0.0 35.5 75.9 0.0 22.8 1.3 11.9 0.12014 597.4 379.3 16.6 47.4 0.0 5.8 0.0 53.0 56.4 0.0 23.9 0.0 12.0 0.12015 603.2 404.1 16.9 44.8 0.0 5.8 0.0 44.8 47.6 0.0 23.4 0.0 12.9 0.02016 697.8 453.9 16.7 46.6 0.0 5.9 0.0 41.3 95.8 0.0 21.7 0.0 13.0 0.0
LOTTERY REVENUESWashington's Lottery | 360-664-4720 | http://www.walottery.com
$ in Millions
Sales by Type of Game
Table: GT15
45

State Total Cost of Retailer GeneralFiscal Expend- Goods Commis- Admin- Fund Problem Economic EducationYear itures Prizes Sold sions istration Deposits Education Mariners Seahawks Gambling Develop. Legacy
1997 408.2 258.3 20.7 24.9 9.7 91.5 0.0 3.1 0.0 0.0 0.0 0.01998 453.2 279.7 22.3 28.0 9.7 110.3 0.0 3.2 0.0 0.0 0.0 0.01999 480.0 296.1 25.1 29.2 10.0 108.5 0.0 3.3 7.8 0.0 0.0 0.02000 451.6 289.6 25.0 27.7 10.4 91.1 0.0 3.4 4.4 0.0 0.0 0.02001 483.9 288.5 23.9 30.2 10.9 120.3 0.0 3.6 6.5 0.0 0.0 0.02002 438.4 282.2 23.3 27.1 10.9 0.0 1 83.4 3.7 6.8 0.0 0.0 0.02003 462.0 298.0 25.2 28.9 11.4 0.8 2 86.8 3.9 7.0 0.0 0.0 0.02004 479.4 295.5 24.6 30.3 11.4 4.3 102.0 4.0 7.3 0.0 0.0 0.02005 459.1 280.8 22.5 28.7 11.4 1.9 102.0 4.2 7.6 0.0 0.0 0.02006 481.9 291.8 23.4 30.3 11.3 7.6 102.0 4.4 7.9 0.2 3.0 0.02007 496.2 304.8 30.5 31.2 11.9 0.0 101.9 4.5 8.2 0.2 3.0 0.02008 521.1 314.9 31.0 32.4 12.5 11.1 102.0 4.7 8.5 0.3 3.7 0.02009 496.0 301.3 31.2 30.8 12.3 2.0 102.0 4.9 8.9 0.2 2.4 0.02010 508.4 291.8 30.6 31.0 12.5 12.9 97.4 5.1 9.2 0.2 4.6 13.12011 522.5 295.1 33.0 31.9 12.5 7.0 112.3 5.3 9.6 0.2 3.7 11.92012 528.9 311.5 33.8 33.4 12.4 0.0 121.8 2.7 10.0 0.3 3.0 0.02013 576.0 350.1 38.4 35.5 12.8 9.3 115.6 0.0 10.4 0.3 3.6 0.02014 610.5 371.5 41.4 37.4 12.6 0.6 121.9 0.0 10.8 0.3 4.0 10.02015 599.1 365.9 41.9 37.3 12.8 0.0 119.0 0.0 11.2 0.3 4.7 6.02016 703.2 432.9 44.4 36.0 14.5 31.9 128.7 0.0 11.7 0.3 2.8 0.0
Note: Detail will not add to Total Expenditures. Delivery of goods to retailer and remittance of monies to Lottery often take place in differentfiscal years.
Table: GT16
LOTTERY EXPENDITURESWashington's Lottery | 360-664-4720 | http://www.walottery.com
$ in Millions
1Distribution shifted to education funds per change in state law.2Savings per Governor's Executive Order.
46

FTE EmployeesState FTE April 1 Per 1,000
Fiscal Year Employees1 Population2 Population1
1987 73,157.2 4,527,098 16.161988 75,084.9 4,616,886 16.261989 78,279.8 4,728,077 16.561990 81,033.8 4,866,692 16.651991 85,408.9 5,000,353 17.081992 88,764.1 5,091,138 17.441993 90,288.3 5,188,009 17.401994 89,639.5 5,291,577 16.941995 91,889.4 5,396,569 17.031996 91,826.8 5,483,103 16.751997 93,681.0 5,579,140 16.791998 95,028.5 5,685,459 16.711999 97,906.9 5,792,214 16.902000 99,929.2 5,894,143 16.952001 102,042.5 5,970,330 17.092002 103,818.3 6,059,316 17.132003 104,262.7 6,126,885 17.022004 105,077.5 6,208,500 16.922005 106,768.5 6,298,800 16.952006 106,641.0 6,420,300 16.612007 108,692.5 6,525,100 16.662008 111,419.5 6,608,300 16.862009 112,545.0 6,672,200 16.872010 109,972.8 6,724,500 16.352011 107,493.5 6,767,900 15.882012 105,920.0 6,817,800 15.542013 107,567.5 6,882,400 15.632014 108,893.2 6,968,200 15.632015 110,537.1 7,061,410 15.652016 111,204.0 7,183,700 15.482017 113,731.0 7,310,300 15.56
Table: GT17
FULL-TIME EQUIVALENT STATE EMPLOYEESALL BUDGETED AND HIGHER EDUCATION FUNDS
Office of Financial Management | 360-725-0198 | http://www.ofm.wa.gov
1Annual Average Full-Time Equivalent. Data adjusted from original series for the addition of technical colleges and higher education capital FTEs.2OFM April 1 Population Estimates Program.
47

Office of Financial Management | 360-902-0599 | http://www.ofm.wa.gov
Total Expenditures as aPersonal Total Percent of Total
Biennium Income1 Expenditures2 Personal Income
1989-91 196,636 24,690.8 12.56 1991-93 227,486 29,432.2 12.94 1993-95 252,793 32,853.5 13.00 1995-97 287,534 36,009.7 12.52 1997-99 337,137 39,394.2 11.68 1999-01 386,430 44,547.8 11.53 2001-03 405,498 49,472.4 12.20 2003-05 449,176 53,463.3 11.90 2005-07 514,008 60,517.2 11.77 2007-09 576,427 68,492.9 11.88 2009-11 572,451 70,736.5 12.36 2011-13 643,799 70,732.7 10.99 2013-15 714,893 80,475.3 11.26 2015-17 795,402 90,285.7 11.35
2Operating and capital.
Table: GT18
BUDGETED EXPENDITURES AS A PERCENTOF TOTAL PERSONAL INCOME
Economic and Revenue Forecast Council | 360-534-1560 | http://www.erfc.wa.gov
$ in Millions
1From September 2017 state personal income release by the U.S. Department of Commerce,Bureau of Economic Analysis.
48

Authorized/ Percent TotalBiennium Outstanding Unissued Amount Expense1
1977-79 1,245.4 1,116.5 227.0 2.81979-81 1,409.9 2,239.1 248.5 2.31981-83 2,008.3 1,655.7 396.8 3.21983-85 2,494.5 1,553.4 533.4 3.51985-87 3,073.0 1,368.9 598.1 3.31987-89 3,512.6 1,519.0 721.0 3.61989-91 3,983.3 946.1 810.3 3.31991-93 4,897.4 2,802.6 933.2 3.21993-95 5,650.7 1,562.1 1,073.3 3.31995-97 6,191.9 2,293.1 1,208.4 3.41997-99 6,883.8 4,441.7 1,354.3 3.41999-01 7,679.1 3,669.7 1,525.4 3.42001-03 8,547.8 3,548.3 1,662.2 3.42003-05 9,980.1 6,252.8 1,724.2 3.22005-07 11,673.3 10,803.9 1,953.2 3.22007-09 14,118.0 12,682.1 2,331.0 3.42009-11 16,768.5 9,376.7 2,726.2 3.92011-13 18,711.6 6,326.5 3,044.9 4.32013-15 19,747.7 5,429.6 3,479.5 4.32015-17 20,150.2 10,442.5 3,891.4 4.3
1Total Debt Service Expense as a percent of Operating and Capital Expenditures by Major Fund, All Budgeted and Higher Education Funds, Table GT01.
Table: GT19
TREASURY FUND BONDED INDEBTEDNESSALL SERIES, BIENNIAL SUMMARY
Office of the State Treasurer | 360-902-9000 | http://www.tre.wa.govOffice of Financial Management | 360-902-0599 | http://www.ofm.wa.gov
$ in Millions
Biennium End Status Debt Service Expense
49

Environment and Natural Resources
General Government Transportation Health and Human Services
Education Community and Economic Development
Agencies Led by Governor-Appointed Executives
Dept. of Agriculture
(commodity commissions)
Dept. of Ecology
Pollution Liability Insurance Program
Puget Sound Partnership
Recreation and Conservation Office
Board of Accountancy
Office of Administrative Hearings
Dept. of Archaeology and Historic Preservation
Consolidated Technology Services (WaTech)
- Technology Services Board
Dept. of Enterprise Services
- Building Code Council
Dept. of Financial Institutions
Office of Financial Management - Personnel Resources Board
- Sentencing Guidelines Comm.
- Washington Commission on National and Community Service
Governor’s Office of Indian Affairs
State Lottery
Military Department
Dept. of Retirement Systems
Dept. of Revenue
Dept. of Licensing (occupational regulatory
boards)
Washington State Patrol
Traffic Safety Commission
Dept. of Transportation
Dept. of Children, Youth and Families *
Dept. of Corrections - Indeterminate Sentence
Review Board
Employment Security Dept. - Governor’s Committee on Disability Issues and
Employment
Department of Health - Board of Health (occupational regulatory boards)
Health Care Authority
- Public Employees Benefits Bd.
- School Employees Benefits Bd.
Dept. of Labor and Industries
Dept. of Services for the Blind
Dept. of Social and Health Services
Dept. of Veterans Affairs
* operational on July 1, 2018
Center for Childhood Deafness and Hearing Loss - Board of Trustees
Dept. of Early Learning
School for the Blind
Workforce Training and Education Coordinating Board
Commission on African-American Affairs
Arts Commission
Commission on Asian Pacific American Affairs
Dept. of Commerce - Community Economic
Revitalization Board
- Developmental Disabilities Council
- Public Works Board
Commission on Hispanic Affairs
Office of Minority and Women’s Business Enterprises
Agencies Under Authority of a Board, Council, or Commission
Columbia River Gorge Commission
Conservation Commission
Environmental and Land Use Hearings Office
- Growth Management Hearings Board
- Pollution Control Hearings Board
- Shorelines Hearings Board
Dept. of Fish and Wildlife
- Fish and Wildlife Commission
Parks and Recreation Commission
Washington Materials Management and Financing Authority
Caseload Forecast Council
Citizens’ Commission on Salaries for Elected Officials
Economic and Revenue Forecast Council
Forensic Investigations Council
Gambling Commission
Horse Racing Commission
Investment Board
Law Enforcement Officers’ and Fire Fighters’ Plan 2 Retirement Board
Liquor and Cannabis Board
Public Disclosure Commission
Public Employment Relations Commission
Board of Tax Appeals
Utilities and Transportation Commission
- Energy Facility Site Evaluation Council
Board of Volunteer Firefighters and Reserve Officers
County Road Administration Board
Freight Mobility Strategic Investment Board
Board of Pilotage Commissioners
Transportation Improvement Board
Transportation Commission
Criminal Justice Training Commission
Health Care Facilities Authority
Human Rights Commission
Board of Industrial Insurance Appeals
Tobacco Settlement Authority
Charter School Commission
State Board for Community and Technical Colleges
- Boards of Trustees for 34 community and technical colleges
Governing Boards of Four- Year Institutions of Higher Education:
- Central Washington University
- Eastern Washington University
- The Evergreen State College
- University of Washington
- Washington State University
- Western Washington University
Washington Student Achievement Council
Eastern Washington State Historical Society
Washington State Historical Society
Higher Education Facilities Authority
Economic Development Finance Authority
Housing Finance Commission
Life Sciences Discovery Fund Authority
Prepared by
Office of Financial
Management
August 2017
2017 Organization Chart
Washington State Government
Judicial Branch Legislative Branch Executive Branch
Senate and House of Representatives Supreme Court
Joint Legislative Audit & Review Committee Joint Legislative Systems Committee Joint Transportation Committee Legislative Ethics Board Office of Legislative Support Services
Legislative Evaluation & Accountability Program (LEAP) Committee Office of the State Actuary Redistricting Commission (activated decennially)
Statute Law Committee (Code Reviser’s Office)
Administrative Office of the Courts Office of Civil Legal Aid Court of Appeals Commission on Judicial Conduct
Law Library Municipal Courts Office of Public Defense District and Superior Courts
Agencies Managed by Statewide Elected Officials
Commissioner of Public Lands
Insurance Commissioner
Treasurer
Lieutenant Governor
Governor
Attorney General
Superintendent of Public Instruction
Auditor Secretary
of State
Dept. of Natural Resources
- Board of Natural Resources
- Forest Practices Board
Public Deposit Protection Commission
State Finance Committee
Office of the
Governor
Executive Ethics Board
Board of Education
Professional Educator
Standards Board
State Library
Office for Regulatory Innovation & Assistance Results Washington
Office of the Education Ombuds Office of the Family & Children’s Ombuds
50


![TECHNICAL BULLETIN [ 1 / 50 ]...MARS TOHKEN SOLUTION CO.,LTD TLMS-3500RV Not necessary *5 GT01-C30R2-25P *1 THLS-6712 AD-6712 Included with a barcode reade r THLS-6800 An adapter …](https://img.pdfslide.us/doc/110x75/611bf7be902ee4188e0b11e3/technical-bulletin-1-50-mars-tohken-solution-coltd-tlms-3500rv-not-necessary.jpg)