Embed Size (px)
Citation preview

State Antitrust Activity’s Impact on Small Business Entry
by
Robert M. Feinberg Chevy Chase, MD
for
Under contract no. SBAHQ-11-Q-0029
Release Date: April 2012
The statements, findings, conclusions, and recommendations found in this study are those of the authors and do not necessarily reflect the views of the Office of Advocacy, the United
States Small Business Administration, or the United States government.
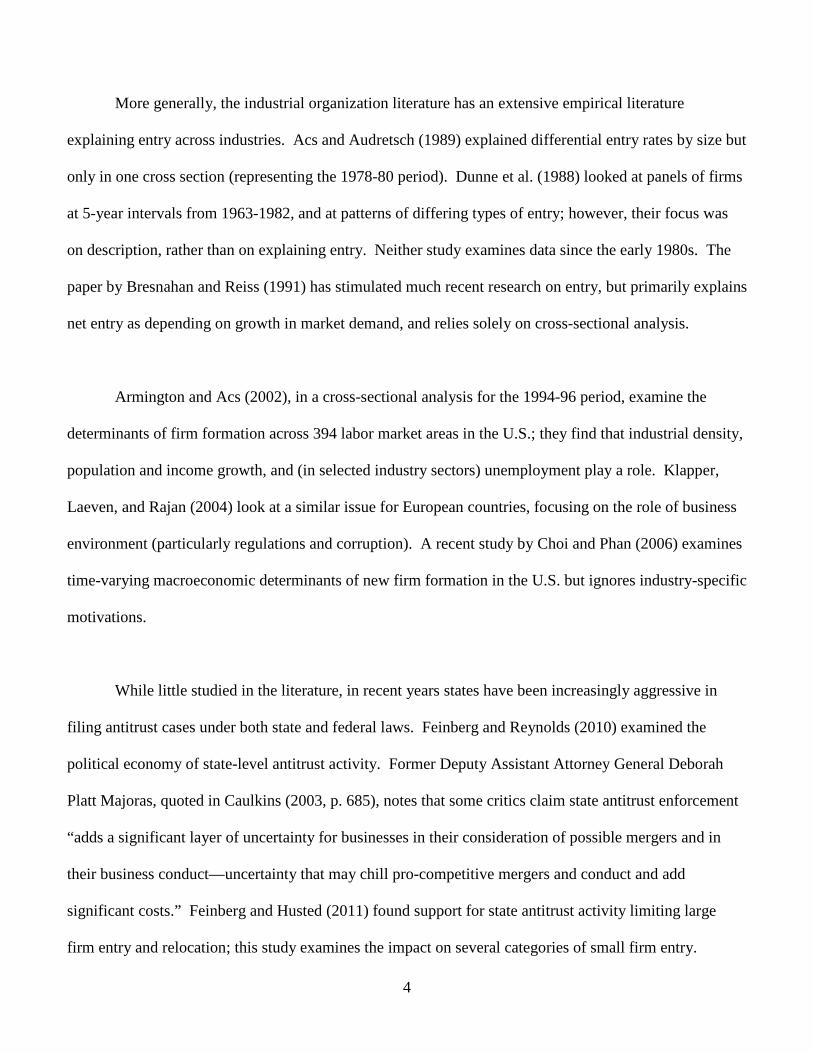
Executive Summary It seems plausible that firms contemplating either a new establishment entry or relocation would consider state antitrust enforcement, just as firms might pay attention to a state’s tax and regulatory framework. In recent years states have been increasingly aggressive in filing antitrust cases under both state and federal laws while the impact on entry is unknown and probably not fully considered by policymakers. This paper examines entry reactions to state antitrust enforcement by firms within three small-business categories: 1-19 employees; 20-99 employees; 100-499 employees. Differences in behavior by broad business sector are explored as well. State and local tax burdens seem to reduce entry as does growth in state gross state product. In terms of antitrust effects, there is a weak entry-encouraging impact of case filings. However, these results are only from horizontal case filings, actions among firms in the same industry who are attempting to collude or otherwise limit competition among themselves, not from other types of antitrust cases. This suggests that small firms view a vigorous anti-cartel policy as a desirable feature of a state’s law enforcement profile. It is important to note that the impacts are quite small in magnitude. The smallest retail and wholesale firms favor vigorous antitrust activity, especially enforcement targeted against cartel behavior by suppliers in regard to entry. The largest small-firm retailers and wholesalers (those with 100-499 employees) seem somewhat threatened by such activity. However, again, the effects on entry or relocation of small firms are quite small. Small non-manufacturing firms do respond to state antitrust enforcement, either for its own sake or as an indicator of general state-level attitudes towards intervention in business decision-making. With the economy becoming more and more trade and service related and less manufacturing related, some coordination of state policy may be called for, as well as federal involvement in state antitrust decisions.

2
I. Introduction
In two previous reports for the Small Business Administration (Feinberg (2008;2009)), I found
that the smallest manufacturing firms were those most vulnerable to international competition, as
measured by exchange rate fluctuations and import shares, that small wholesalers fared in a similar
manner to manufacturers, but that small retailers were relatively unaffected. In this study I will turn to the
neglected issue of the impact of state-level antitrust enforcement activity on entry and relocation behavior
by firms. Feinberg and Reynolds (2010) have discussed (and explained the determinants of) patterns of
state antitrust filings over the past two decades, while Feinberg and Husted (2011) has shown that this
enforcement, especially non-horizontal cases, 1 may be viewed by potential entrants as a negative aspect
of the state business climate. This type of antitrust enforcement is often seen as more discretionary, and
less clearly supported by economic fundamentals, than are cases pursuing cartel-type activities.
While Feinberg and Husted (2011) found different responses to state antitrust by firms with over
and under 500 employees, they did not pursue a more careful analysis of small firm entry behavior; nor
did they investigate different responses between manufacturing, wholesaling and retailing firms. This is
the focus of the current paper. I use state-level entry data from the Statistics of U.S. Business to examine
entry reactions to state antitrust enforcement by firms within three small-business categories: 1-19
employees, 20-99 employees, 100-499 employees. Differences in behavior by broad business sector are
explored as well.
1 By “horizontal” cases, I am referring to ones targeting actions among firms in the same industry who are attempting to collude or otherwise limit competition among themselves; economists generally agree that such efforts at collusion are welfare-reducing and support antitrust actions to limit them. Vertical cases involve firms interacting with others in a buyer or seller relationship (e.g., wholesalers dealing with retailers or manufacturers); these cases are less widely supported by economists as there may be both benefits (perhaps reduced transactions costs among firms) and costs (reduced competition from firms left out of the vertical arrangement) to the economy from vertical agreements.

3
II. Literature review and theoretical motivation
There is a vast literature on the determinants of regional variations in business relocation
decisions. As described in reviews by Armington and Acs (2002) and Sutaria and Hicks (2004), much of
this literature focuses on variations in demand and cost factors that are expected to affect firm location
decisions. The most important demand and cost factors in many of these studies include unemployment
rates, population density, labor costs (including the degree of unionization), and area income levels, as
well as expected future growth (generally measured by lagged actual growth in demand).
Wasylenko (1998), surveying the large literature to that point, concludes that −when there is a
relationship− state taxes generally have a small effect on firm location. Taxes have the largest impact on
economic development when tax levels are significantly different from the average tax levels of
economic-rival states. Bartik (1989), focusing specifically on small firms, also finds that both local taxes
and government services have statistically small impacts on location decisions.
Others have looked at broader notions of how the business climate affects entry decisions. For
example, Bartik (1988; 1989) found that state government environmental regulatory policies had small
and not always statistically significant impacts on plant location and small-business entry rates. In
contrast, Gray (1997) used plant-level data from the Census Bureau's Longitudinal Research Database
over the 1963-1987 period and found that states with the strongest environmental regulation did have
somewhat less entry of new manufacturing plants. However, no empirical studies prior to Feinberg and
Husted (2011) examined whether antitrust enforcement may – as part of a jurisdiction’s business climate
– play a role in entry and location decisions.2
2 A recent working paper by Costa and Barros (2010) does provide a theoretical framework for studying this issue, with somewhat ambiguous predictions.
4
More generally, the industrial organization literature has an extensive empirical literature
explaining entry across industries. Acs and Audretsch (1989) explained differential entry rates by size but
only in one cross section (representing the 1978-80 period). Dunne et al. (1988) looked at panels of firms
at 5-year intervals from 1963-1982, and at patterns of differing types of entry; however, their focus was
on description, rather than on explaining entry. Neither study examines data since the early 1980s. The
paper by Bresnahan and Reiss (1991) has stimulated much recent research on entry, but primarily explains
net entry as depending on growth in market demand, and relies solely on cross-sectional analysis.
Armington and Acs (2002), in a cross-sectional analysis for the 1994-96 period, examine the
determinants of firm formation across 394 labor market areas in the U.S.; they find that industrial density,
population and income growth, and (in selected industry sectors) unemployment play a role. Klapper,
Laeven, and Rajan (2004) look at a similar issue for European countries, focusing on the role of business
environment (particularly regulations and corruption). A recent study by Choi and Phan (2006) examines
time-varying macroeconomic determinants of new firm formation in the U.S. but ignores industry-specific
motivations.
While little studied in the literature, in recent years states have been increasingly aggressive in
filing antitrust cases under both state and federal laws. Feinberg and Reynolds (2010) examined the
political economy of state-level antitrust activity. Former Deputy Assistant Attorney General Deborah
Platt Majoras, quoted in Caulkins (2003, p. 685), notes that some critics claim state antitrust enforcement
“adds a significant layer of uncertainty for businesses in their consideration of possible mergers and in
their business conduct—uncertainty that may chill pro-competitive mergers and conduct and add
significant costs.” Feinberg and Husted (2011) found support for state antitrust activity limiting large
firm entry and relocation; this study examines the impact on several categories of small firm entry.

5
III. Methodology and Data
As my focus is on state-level differences, I analyze determinants of establishment entry across 50
states over 9 years (1998-2006). Entry data (on establishment births) come from the Statistics of U.S.
Business, a Census product produced for the U.S. Small Business Administration. The analysis is
performed for all firms with under 500 employees, as well as for 9 sub-categories: 1-19, 20-99, and 100-
499 employee firms in each of the manufacturing, wholesale and retail sectors.3 Following the previous
literature, business entry and relocation decisions are expected to depend on actual and anticipated
movements in local demand and costs, as well as proxies for local amenities and political factors. I will
include one-year lagged measures of state-level economic and population data (gross state product (GSP)
per capita, unemployment, unionization, and population), annual rates of growth in GSP as an indicator of
future demand growth prospects, political factors (political party of the governor and attorney general),
and state government tax and expenditure characteristics (the size of state and local income and corporate
taxes relative to state GSP and the relative size of government spending).
GSP is measured in millions of chained 2000 dollars, and sourced from the Bureau of Economic
Analysis of the U.S. Department of Commerce. Economic activity in the state is proxied by using the
annual average state unemployment rate from the Bureau of Labor Statistics. To investigate whether
firms look to the political affiliation of the state’s leader as a predictor of future policies which may
impact their future profits, a dummy variable will be included indicating whether the state’s governor was
a Republican during a particular year. States with larger state and local government spending relative to
the size of their economies may attract more entry if this is viewed as translating into more amenities or
3 The employment size of entry is determined by size of firm, not size of establishment; e.g., the opening of a new Starbucks in a state would be classified as large-firm entry. Only firms with at least one salaried employee are included in the analysis.
6
better infrastructure for firms or their workers;4 this variable is calculated by using data from the Census
Bureau’s State Government Finances annual survey.
The state’s income and corporate tax burden is obtained from the Census of Governments. The
percentage of a state’s private sector workers that are covered by union contracts (as described in Hirsch
and Macpherson (2003)) is included as a proxy for cost differences across states. To account for the
possibility that the current market structure in a state may create barriers to new entry, I incorporate a
(rough) proxy for the role of relatively large firms by including the percentage of a state’s workers
employed in firms with greater than 500 employees.
The primary contribution in this study, however, is to add to the analysis data on state-level
antitrust litigation that have been developed from a database provided by the National Association of
Attorneys General (NAAG, www.naag.org). All U.S. states have some form of antitrust statutes on their
books and the further ability to bring actions under the federal antitrust laws. I identify the number of
antitrust cases filed by states as a “lead plaintiff” as my measure of antitrust activity.5
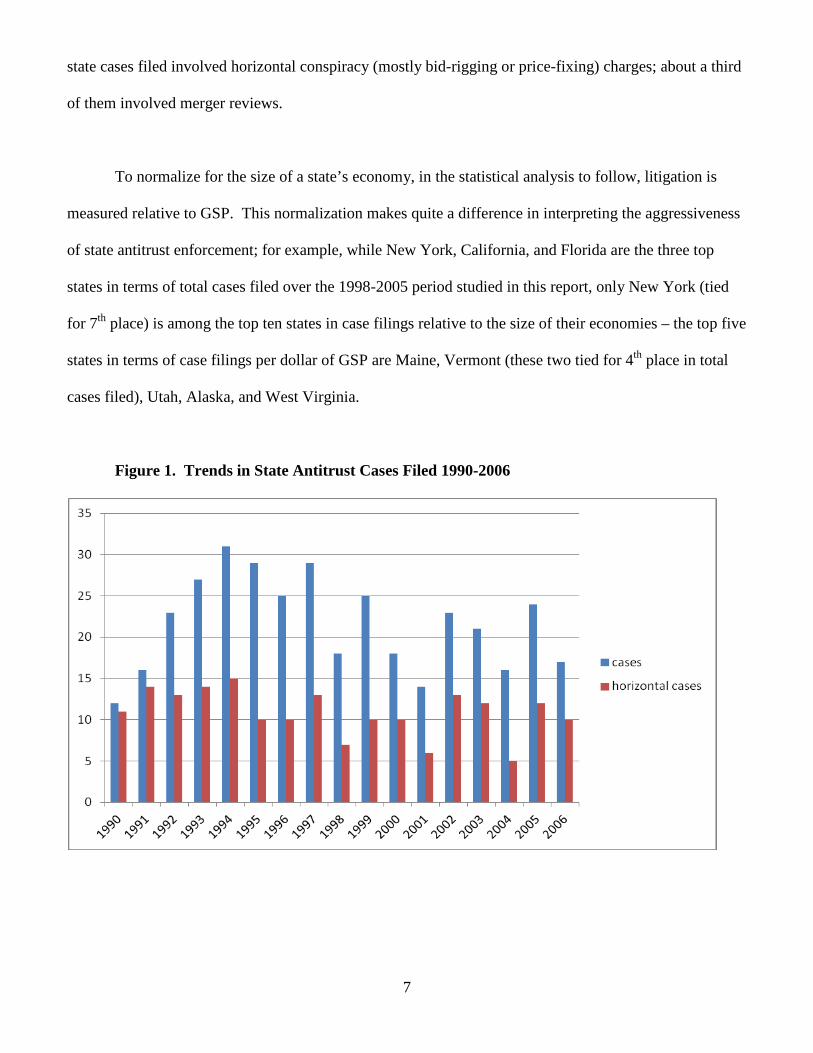
The number of antitrust cases that are filed per year by individual states has varied considerably,
both over time and across states. The total number of state antitrust cases filed over the full NAAG
database period ranged from as low as 12 cases in 1990 to as high as 31 cases in 1994, as seen in Figure 1
below. Over half of state antitrust enforcement was undertaken by four states: New York, Florida, Texas,
and California. In contrast, seven states filed zero antitrust cases during this time period. About half of
4 Of course, this may also relate to a higher tax burden but that is controlled for separately. 5 In about 15% of cases filed there are multiple “lead plaintiffs,” and in about 25% of the cases other states joined in at a later stage, including at the settlement stage. Cases consist of bid-rigging, merger reviews, price fixing, tying, resale price maintenance, etc.
7
state cases filed involved horizontal conspiracy (mostly bid-rigging or price-fixing) charges; about a third
of them involved merger reviews.
To normalize for the size of a state’s economy, in the statistical analysis to follow, litigation is
measured relative to GSP. This normalization makes quite a difference in interpreting the aggressiveness
of state antitrust enforcement; for example, while New York, California, and Florida are the three top
states in terms of total cases filed over the 1998-2005 period studied in this report, only New York (tied
for 7th place) is among the top ten states in case filings relative to the size of their economies – the top five
states in terms of case filings per dollar of GSP are Maine, Vermont (these two tied for 4th place in total
cases filed), Utah, Alaska, and West Virginia.
Figure 1. Trends in State Antitrust Cases Filed 1990-2006

8
I also distinguish antitrust effects by type of case; investigations against cartel-type activity are the
least controversial of government actions in the antitrust area, and aggressive enforcement activity of this
kind may not be viewed unfavorably by businesses that are considering expansion within a state or entry
into a state (they may in fact be viewed as a desirable element of the state’s law enforcement regime,
especially by smaller firms). A measure of antitrust cases excluding horizontal conspiracy cases (relative
to GSP) may thus have a somewhat stronger impact on entry. The estimation assumes that the current
perception of the strength of the state’s antitrust enforcement is a function of the most recent past case
filings (relative to the size of the state economy), the average of the previous four years’ cases filing
intensities, and the political party of the state’s attorney general.6
Not included in the regression analysis are measures of environmental (or other) regulatory efforts
at the state level, implicitly assuming that these did not vary over the (relatively short) time period
examined – allowing their impacts to be captured by state fixed effects.7
III. Hypotheses to be Tested
The following are the main questions addressed in this study:
1. Does state-level antitrust activity exert an influence on entry/relocation decisions by small businesses,
after controlling for macroeconomic, demand, and cost conditions?
It seems plausible that firms contemplating either a new establishment entry or relocation would take
account of antitrust enforcement in the state, just as the firms might pay attention to a state’s tax and
regulatory framework.
6 Given that most states elect governors and attorneys general separately, the correlation coefficient between dummy variables for each being a Republican is not especially high: +0.25. 7 While various indexes of state regulatory burden exist, these are not available annually for the time period considered in this study.
9
2. Does this effect, if any, vary depending on the type of antitrust cases pursued?
As noted above, horizontal (anti-cartel) cases are broadly supported by economists and – for the most part
– by the business community. While firms targeted by these enforcement actions naturally would not be
happy with them, other firms would either regard such cases as innocuous or even desirable in preventing
anticompetitively high prices by suppliers. More complicated issues, involving unilateral exercise of
monopoly power or vertical restrictions between firms, may get less support or be seen as limiting efforts
by firms to achieve efficiencies.
3. If such an impact is observed, do these effects vary by broad industry sector?
Firms at different levels of the distribution chain may be affected differently both by antitrust violations
and by enforcement actions against them; for example retailers or wholesalers may worry about price-
fixing by suppliers/manufacturers and applaud antitrust actions against these. Retailers and wholesalers,
especially small firms, are also more likely to operate within a single state, and focus on antitrust policy at
that state level; in contrast, manufacturers – even small ones – more often sell across state lines and may
be more concerned with federal antitrust enforcement than state-level activity.
4. Do these effects vary by small firm size category?
The very smallest firms are unlikely to be the subject of antitrust cases and may welcome enforcement
against others. On the other hand the largest of these categories (in the 100-499 employee range) may
focus more on federal antitrust enforcement and not worry about (or take account of in their entry
decisions) state actions.

10
IV. Estimating Equation
The basic econometric model is the following, estimated via a pooled (50 states X 9 years) Tobit
procedure:8
Entry = f(growth in real per-capita income, income growth, unemployment, unionization, state
population, government share of state economy, tax burden, employment concentration, political party of
governor and attorney general, and antitrust variables).
This statistical analysis is conducted first for all firms with less than 500 employees, both as a
function of total state antitrust enforcement and of “non-horizontal” antitrust enforcement. Following
this, the analysis is repeated for nine sub-categories, three employment size categories -- 1-19,20-99,100-
499 – for each of three broad industry sectors – manufacturing, wholesale, retail. This sub-analysis is
conducted both separately and via a “Seemingly Unrelated Regression” methodology, allowing for
correlated error terms (more intuitively, common influences) in explaining these various types of small-
firm entry.
V. Descriptive Statistics
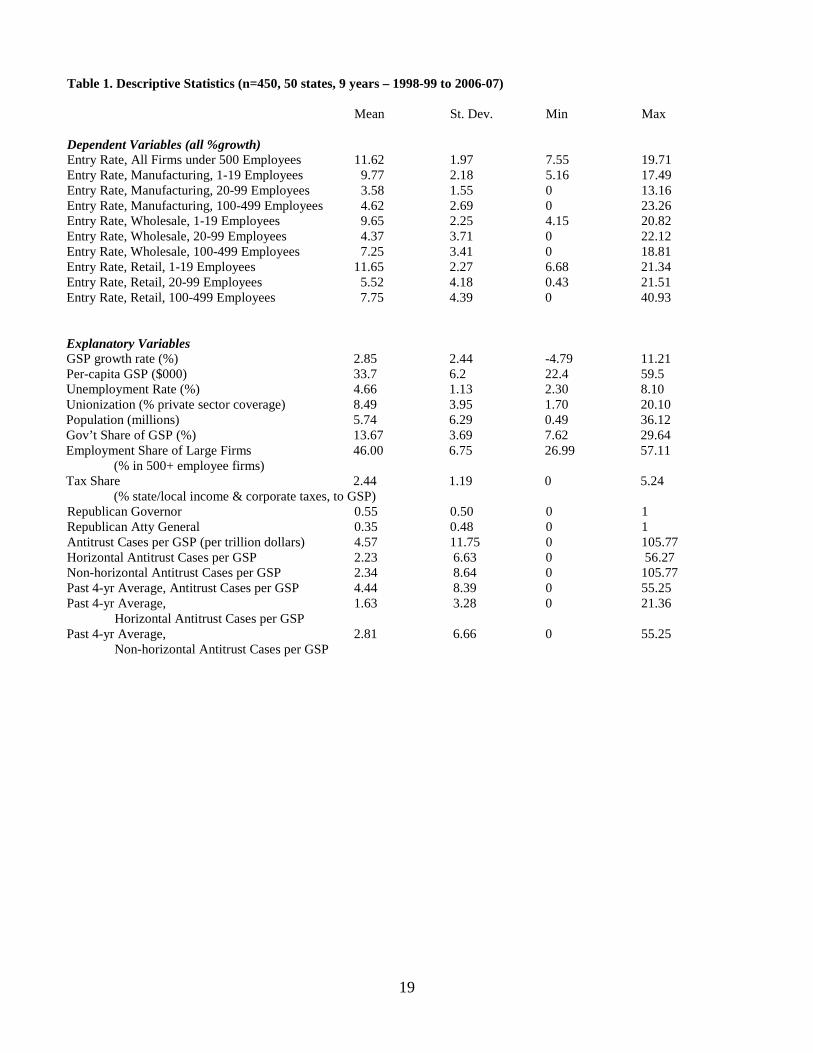
Descriptive statistics for the variables of interest are presented in Table 1. Entry rates vary quite a
bit across industry and firm size categories. The highest average annual rates of state-level gross entry (at
almost 12 percent annually) are by the smallest retail firms, while the lowest rates of gross entry (3.6
percent on average over the fifty states and sampled time period) are by small (20-99 employee)
manufacturing firms. Within these categories we see substantial variation as well – the most extreme
being in the 100-499 employee retail establishments with no gross entry in Montana during 2002-03, and
41% entry growth in Vermont in 1998-99.
8 The Tobit procedure is used when the dependent variable is limited within a certain range; in this case, the lower limit for gross entry rates is zero.

11
As for the explanatory variables, states grew at an average annual rate of 2.85 percent over the
1998-2006 period, with an average unemployment rate of 4.66 percent, and with 8.5% of their private
employees covered by union contracts. The state government budget share of Gross State Product
averaged 13.67 percent, but varied between 7.6 and 29.6 percent. Their income and corporate tax share
varied from zero to 5.24 percent, averaging 2.44 percent. The employment share of large firms varied
quite a bit, from 27 (Kansas in 1999) to 57 percent (South Carolina in 2001). Republicans served as
governors a little more than half the time, though as Attorney General only about one-third of the time.
Antitrust cases filed per trillion dollars of GSP varied from zero to 4.57, with horizontal (anti-cartel or
price-fixing) cases representing about half of these.

12
Figure 2. Number of Antitrust Litigations Where a State Was a Lead Plaintiff, 1990-2006
VI. Statistical Analysis
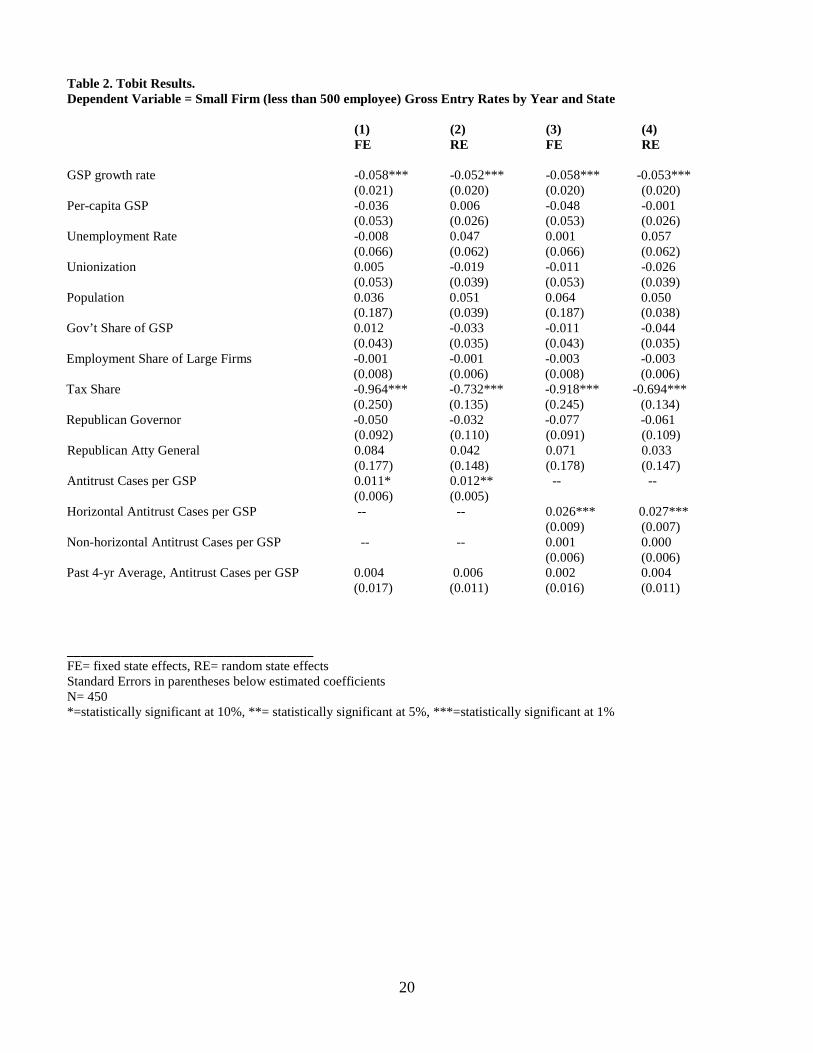
To start with, I report results explaining small firm entry, the rate of establishment births by all
firms with less than 500 employees regardless of industry sector. These results, presented in Table 2, are
largely consistent with the comparable findings in Feinberg and Husted (2011) – though not identical, as

13
one additional year of data is included here. Estimating Tobit models (a regression procedure which
account for the limited –at zero – nature of the dependent variable, gross entry rate), I find consistently
across both fixed and random state effects models,9 and regardless of the specification of the antitrust case
variables, that state and local tax burdens seem to reduce entry as does growth in state GSP.10 Other
measures of the state’s size, economic conditions, and politics do not have statistically significant effects.
In terms of antitrust effects, there is a weak entry-encouraging impact (significant at 10% with
fixed effects, 5% with random effects) of case filings (normalized by GSP) in columns (1) and (2).
However, when horizontal and other (merger, monopolization, vertical restrictions) antitrust case filings
are included separately (in columns (3) and (4)) what emerges is a strong entry-encouraging effect from
horizontal case filings (significant at 1%) but no impact of other antitrust cases. These findings suggest
that small firms in total view a vigorous anti-cartel policy as a desirable feature of the state’s law
enforcement profile, while seeing other, more controversial, aspects of antitrust enforcement as more
likely to be focused on large firms – so not of great concern to them. It is important, however, to realize
that these effects, while statistically different from zero, are quite small in magnitude. For example, a
doubling of horizontal case enforcement (on average) would lead to a less than one-tenth of one percent
increase in the annual rate of small-firm entry (from the average small-firm entry rate during the sample
period of 11.6%) – using 2007 figures as a base, this would imply approximately an additional 6,000 new
small-firm establishments nationally.
Whether these patterns continue to hold as the sample is disaggregated by size and industry group
categories of small firms is what is dealt with next. For each of the manufacturing, wholesale, and retail
9 Fixed effects models allow each state’s entry rate to differ by a constant amount compared to others, while random effect models incorporate more subtle differences across states in their unexplained variation (or error terms). For the variables of interest, the two types of models produce similar results in Table 2. 10 While this latter effect seems counterintuitive at first, it is consistent with a weaker economy leading to more entrepreneurial efforts by small firms.
14
sectors, I examined the determinants of entry rates in the three firm employment-size categories: 1-19, 20-
99, 100-499. Three statistical specifications were reported for each: (1) Tobit regression with fixed state
effects; (2) Tobit regression with random effects; (3) a “seemingly-unrelated regression”11 approach with
fixed state effects. Furthermore, each one of these specifications was examined for effects both of all
antitrust cases lumped together, and for horizontal and non-horizontal case enforcement treated
separately. Rather than report in full the 54 sets of statistical results,12 Table 3 shows the results of
primary interest (random and fixed effects results were similar --only fixed effects results are presented).
One result which seems quite clear is that manufacturers pay little to no attention to state-level
antitrust enforcement in their entry and relocation decisions. As these firms likely sell their products
across state lines, perhaps they worry more about federal antitrust enforcement than do wholesalers and
retailers who tend to service a narrower geographical area.
Turning to retailers, the response to state antitrust enforcement depends in an intuitively plausible
way on firm size. The smallest retailers, unlikely to see themselves as the targets of antitrust actions,
respond positively (though with a lag, responding to the average of the past four years of enforcement
activity) to increased antitrust case-filing, especially to horizontal (or cartel, price-fixing) investigations.
Those sorts of cases often target larger firms who may be conspiring to overcharge smaller retailers. The
largest “small-firm” retailers (those in the 100-499 employee range), have a more negative response to
antitrust, especially of the non-horizontal variety; these firms may see themselves as more likely to be
involved in state-level antitrust proceedings and view these as hostile to normal vertical business
transactions. The retailers in the 20-99 employee range have more mixed response – not robust to
econometric specification.
11 Essentially, this approach estimates all nine industry-sector/firm-size regressions simultaneously, allowing for common influences among these to be reflected in the statistical findings. 12 The full regression results are available on request from the author.

15
As for wholesalers, the patterns of responses are similar to those of retailers. The largest (100-499
employee) firms react negatively in their entry/relocation decisions to state-level antitrust. The smallest
firms respond favorably, though only to horizontal (anti-cartel) enforcement. The medium size category
(20-99 employees) has a more mixed response, varying with the exact statistical technique employed.
For some sense of the magnitude of these effects, consider Figure 3, where the impact of a
doubling of antitrust enforcement (of those types of cases which are statistically significant for each
industry sector/size category) at the state level would increase entry rates in the smallest (1-19 worker)
retail size category by just over 0.1 percent annually – taking 2007 figures for total retail establishments
of 661,469 this would imply an extra 690 establishment entering nationally per year (across all 50 states);
the comparable figure for the smallest wholesalers – where only horizontal cases appear to matter --
would be an extra 117 establishments nationally (and both of these most likely overstate the impact as
relocation from one state to another may account for some of the growth in establishments at the state
level). The adverse impact on the largest “small firm” wholesalers, while statistically significant, would
amount to just about 40 fewer establishments nationally per year. The adverse effect on retailers in the
100-499 employee category is somewhat more economically important, suggesting a bit under 500 fewer
retail establishments nationally created annually in response to a doubling of the lagged-four-year-average
antitrust case enforcement.

16
Figure 3. Estimated impact on annual numbers of new establishments (nationally) from a doubling of state antitrust enforcement, by size of firm
-600
-400
-200
0
200
400
600
800
Manufacturing Wholesale Retail
1-19 employees
100-499 employees
VII. Conclusions and Policy Relevance of the Study
In attempting to understand the forces influencing small firm growth and survival, the local
business climate is clearly important. However, in addition to tax and regulatory measures, state antitrust
enforcement may have effects worth consideration. To the extent that small firm entry is dependent on
this enforcement, some coordination of state policy may be called for, as well as federal involvement in
state antitrust decisions. The results of this paper suggest that small non-manufacturing firms do respond
to state antitrust enforcement, either for its own sake or as an indicator of general state-level attitudes
towards intervention in business decision-making.
Generally speaking the smallest retail and wholesale firms seem to favor vigorous antitrust
activity, especially enforcement targeted against cartel behavior by suppliers. The largest small-firm
retailers and wholesalers (those with 100-499 employees) seem somewhat threatened by such activity,
especially the more controversial non-horizontal enforcement. However, it must be acknowledged that
the effects on entry or relocation of small firms – both positive and negative – are quite small. And
whatever their magnitude, the merits of state-level antitrust enforcement should rest (as with federal
enforcement) on their effects on consumer welfare and benefits of competition more generally.
17
References Acs, Zoltan J. and David B. Audretsch, “Small Firm Entry in US Manufacturing,” Economica (1989), pp. 255-265. Armington, Catherine and Zoltan J. Acs, “The Determinants of Regional Variation in New Firm Formation,” Regional Studies, Vol. 36, No. 1, 2002, pp. 33-45. Bartik, Timothy J., “The Effects of Environmental Regulation on Business Location in the United States,” Growth and Change 19 (Summer 1988), pp. 22-44. Bartik, Timothy J., “Small Business Start-Ups in the United States: Estimates of the Effects of Characteristics of States,” Southern Economic Journal 55, (April 1989), pp. 1004-18. Bresnahan, Timothy F. and Peter C. Reiss, “Entry and Competition in Concentrated Markets,” Journal of Political Economy (1991), pp. 977-1009. Calkins, Stephen, “Perspectives on State and Federal Antitrust Enforcement,” Duke Law Journal 53 (2003), pp. 673-735. Choi, Young R. and Phillip H. Phan, “The Influences of Economic and Technology Policy on the Dynamics of New Firm Formation,” Small Business Economics (2006), Vol. 26, pp. 493-503. Costa, Afonso Almeida and Pedro Pita Barros, “Does a Tougher Competition Policy Reduce or Promote Investment?” Working Paper, Universidade Nova de Lisboa, January 2010. Dunne, Timothy; Mark Roberts; and Larry Samuelson, “Patterns of Firm Entry and Exit in U.S. Manufacturing Industries,” Rand Journal of Economics (1988), Vol. 19, pp. 495-515. Feinberg, Robert M., “The Impact of International Competition on Small-Firm Exit in U.S. Manufacturing,” U.S. Small Business Administration, Office of Advocacy Report, March 2008. Feinberg, Robert M., “The Impact of International Competition on Survival of Small Wholesalers and Retailers,” U.S. Small Business Administration, Office of Advocacy Report, 2009. Feinberg, Robert M. and Kara M. Reynolds, “The Determinants of State-Level Antitrust Activity,” Review of Industrial Organization, Vol. 37, No. 3, November 2010, pp. 179-196. Feinberg, Robert M. and Thomas A. Husted, “Patterns of Establishment Entry and State-Level Antitrust,” Journal of Competition Law and Economics, Vol. 7, No. 4, December 2011, pp. 813-825. Gray, Wayne B., “Manufacturing Plant Location: Does State Pollution Regulation Matter?” CES Working Paper 97-8, July 1997. Hirsch, Barry T. and David A. Macpherson, "Union Membership and Coverage Database from the Current Population Survey: Note," Industrial and Labor Relations Review, Vol. 56, No. 2, January 2003, pp. 349-54.

18
Klapper, Leora, Luc Laeven, and Raghuram Rajan, “Business Environment and Firm Entry,” NBER Working Paper 10380, March 2004. Sutaria, Vinod and Donald A. Hicks, “New Firm Formation: Dynamics and Determinants,” The Annals of Regional Science, 38 (2004), pp. 241-262. Wasylenko, Michael, “Taxation and Economic Development: The State of the Economic Literature,” in Hildreth and Richardson, eds., Handbook on Taxation (New York: Marcel Dekker, Inc., 1998), pp. 309-327.
19
Table 1. Descriptive Statistics (n=450, 50 states, 9 years – 1998-99 to 2006-07) Mean St. Dev. Min Max Dependent Variables (all %growth) Entry Rate, All Firms under 500 Employees 11.62 1.97 7.55 19.71 Entry Rate, Manufacturing, 1-19 Employees 9.77 2.18 5.16 17.49 Entry Rate, Manufacturing, 20-99 Employees 3.58 1.55 0 13.16 Entry Rate, Manufacturing, 100-499 Employees 4.62 2.69 0 23.26 Entry Rate, Wholesale, 1-19 Employees 9.65 2.25 4.15 20.82 Entry Rate, Wholesale, 20-99 Employees 4.37 3.71 0 22.12 Entry Rate, Wholesale, 100-499 Employees 7.25 3.41 0 18.81 Entry Rate, Retail, 1-19 Employees 11.65 2.27 6.68 21.34 Entry Rate, Retail, 20-99 Employees 5.52 4.18 0.43 21.51 Entry Rate, Retail, 100-499 Employees 7.75 4.39 0 40.93 Explanatory Variables GSP growth rate (%) 2.85 2.44 -4.79 11.21 Per-capita GSP ($000) 33.7 6.2 22.4 59.5 Unemployment Rate (%) 4.66 1.13 2.30 8.10 Unionization (% private sector coverage) 8.49 3.95 1.70 20.10 Population (millions) 5.74 6.29 0.49 36.12 Gov’t Share of GSP (%) 13.67 3.69 7.62 29.64 Employment Share of Large Firms 46.00 6.75 26.99 57.11
(% in 500+ employee firms) Tax Share 2.44 1.19 0 5.24 (% state/local income & corporate taxes, to GSP) Republican Governor 0.55 0.50 0 1 Republican Atty General 0.35 0.48 0 1 Antitrust Cases per GSP (per trillion dollars) 4.57 11.75 0 105.77 Horizontal Antitrust Cases per GSP 2.23 6.63 0 56.27 Non-horizontal Antitrust Cases per GSP 2.34 8.64 0 105.77 Past 4-yr Average, Antitrust Cases per GSP 4.44 8.39 0 55.25 Past 4-yr Average, 1.63 3.28 0 21.36
Horizontal Antitrust Cases per GSP Past 4-yr Average, 2.81 6.66 0 55.25
Non-horizontal Antitrust Cases per GSP
20
Table 2. Tobit Results. Dependent Variable = Small Firm (less than 500 employee) Gross Entry Rates by Year and State (1) (2) (3) (4) FE RE FE RE GSP growth rate -0.058*** -0.052*** -0.058*** -0.053*** (0.021) (0.020) (0.020) (0.020) Per-capita GSP -0.036 0.006 -0.048 -0.001 (0.053) (0.026) (0.053) (0.026) Unemployment Rate -0.008 0.047 0.001 0.057 (0.066) (0.062) (0.066) (0.062) Unionization 0.005 -0.019 -0.011 -0.026 (0.053) (0.039) (0.053) (0.039) Population 0.036 0.051 0.064 0.050 (0.187) (0.039) (0.187) (0.038) Gov’t Share of GSP 0.012 -0.033 -0.011 -0.044 (0.043) (0.035) (0.043) (0.035) Employment Share of Large Firms -0.001 -0.001 -0.003 -0.003 (0.008) (0.006) (0.008) (0.006) Tax Share -0.964*** -0.732*** -0.918*** -0.694*** (0.250) (0.135) (0.245) (0.134) Republican Governor -0.050 -0.032 -0.077 -0.061 (0.092) (0.110) (0.091) (0.109) Republican Atty General 0.084 0.042 0.071 0.033 (0.177) (0.148) (0.178) (0.147) Antitrust Cases per GSP 0.011* 0.012** -- -- (0.006) (0.005) Horizontal Antitrust Cases per GSP -- -- 0.026*** 0.027*** (0.009) (0.007) Non-horizontal Antitrust Cases per GSP -- -- 0.001 0.000 (0.006) (0.006) Past 4-yr Average, Antitrust Cases per GSP 0.004 0.006 0.002 0.004 (0.017) (0.011) (0.016) (0.011) _____________________________________ FE= fixed state effects, RE= random state effects Standard Errors in parentheses below estimated coefficients N= 450 *=statistically significant at 10%, **= statistically significant at 5%, ***=statistically significant at 1%

21
Table 3. Statistically Significant Coefficients of State Antitrust Variables in Explaining Small Firm Entry Rates (all estimating equations with fixed state effects)
Manufacturing Wholesale Retail
1-19 all cases NONE all cases, lagged SIGNIFICANT horizontal nonhorizontal all cases, lagged SUR—all cases SUR—all cases, lagged SUR—horizontal SUR—nonhorizontal SUR—all cases, lagged
all cases all cases, lagged horizontal 0.018* nonhorizontal all cases, lagged SUR—all cases SUR—all cases, lagged SUR—horizontal 0.018** SUR—nonhorizontal SUR—all cases, lagged
all cases all cases, lagged 0.023** horizontal nonhorizontal all cases, lagged 0.024** SUR—all cases SUR—all cases, lagged 0.023** SUR—horizontal SUR—nonhorizontal SUR—all cases, lagged 0.024**
20-99 all cases NONE all cases, lagged SIGNIFICANT horizontal nonhorizontal all cases, lagged SUR—all cases SUR—all cases, lagged SUR—horizontal SUR—nonhorizontal SUR—all cases, lagged
all cases all cases, lagged 0.084** horizontal -0.049** nonhorizontal all cases, lagged 0.092** SUR—all cases SUR—all cases, lagged SUR—horizontal -0.045* SUR—nonhorizontal SUR—all cases, lagged
all cases all cases, lagged horizontal -0.045** nonhorizontal all cases, lagged SUR—all cases SUR—all cases, lagged SUR—horizontal -0.045* SUR—nonhorizontal SUR—all cases, lagged 0.077*
100-499
all cases NONE all cases, lagged SIGNIFICANT horizontal nonhorizontal all cases, lagged SUR—all cases SUR—all cases, lagged SUR—horizontal SUR—nonhorizontal SUR—all cases, lagged
all cases -0.031* all cases, lagged horizontal nonhorizontal all cases, lagged SUR—all cases -0.031** SUR—all cases, lagged SUR—horizontal SUR—nonhorizontal SUR—all cases, lagged
all cases all cases, lagged horizontal nonhorizontal all cases, lagged SUR—all cases -0.042** SUR—all cases, lagged -0.204*** SUR—horizontal SUR—nonhorizontal -0.045* SUR—all cases, lagged -0.204***
*** Significant at 1%; ** Significant at 5%; * Significant at 10%