Embed Size (px)
Citation preview

State and Trends of the Namibian Bush Biomass Sector 2019 Based on an inclusive survey in line with the DAS indicator framework

State and Trends of the Namibian Bush Biomass Sector 2019 Page 2 of 51
Imprint
Published by:
De-bushing Advisory Service (DAS)
A division of the Namibia Biomass Industry Group (N-BiG)
T +264 61 242 022
I www.dasnamibia.org
Commissioned by:
Bush Control and Biomass Utilisation Project
Ministry of Environment, Forestry and Tourism (MEFT) / Deutsche Gesellschaft für
Internationale Zusammenarbeit (GIZ) GmbH
Windhoek, Namibia
Author:
Johannes Beck, D-One Consulting CC
Design and layout:
Martin Markstein, www.dermarkstein.de
Photo credits:
Cover page: Top left and right ©GIZ/Tim Brunauer
Bottom ©Forest Stewardship Council® (FSC® F000100)
Published:
November 2020
Disclaimer
This document is in the public domain. The publisher encourages the circulation of this report. Users are
welcome to download, save or distribute this publication electronically or in any other format including in the
foreign language translation without written permission, provided acknowledgement of the source is made. No
use of this publication may be made for resale or for any other commercial purpose.
The analysis, results and recommendations in this document represent the opinion of the author(s)and do not
necessarily reflect those of the publishers and sponsors.

State and Trends of the Namibian Bush Biomass Sector 2019 Page 3 of 51
Contents
List of Acronyms ..................................................................................................................................................... 4
List of Figures .......................................................................................................................................................... 5
Acknowledgements ................................................................................................................................................ 6
Executive Summary ................................................................................................................................................ 7
1 Introduction .................................................................................................................................................. 10
1.1 Document Background ........................................................................................................................ 10
1.2 Rationale ............................................................................................................................................. 10
2 Methodology ................................................................................................................................................ 12
2.1 Sector Stakeholders ............................................................................................................................ 13
2.2 Data Collection .................................................................................................................................... 16
2.3 Survey Database and Data Analysis .................................................................................................... 19
3 Results .......................................................................................................................................................... 20
3.1 Bush Control Activities ........................................................................................................................ 20
3.2 Market and Business Development .................................................................................................... 31
3.3 Employment Creation ......................................................................................................................... 41
3.4 Financial Products ............................................................................................................................... 43
3.5 Research and Development ................................................................................................................ 45
4 Sustainability and Consolidation of Sector M&E System .............................................................................. 47
5 Recommendations ........................................................................................................................................ 50
References ............................................................................................................................................................ 51

State and Trends of the Namibian Bush Biomass Sector 2019 Page 4 of 51
List of Acronyms
BCBU Bush Control and Biomass Utilisation
BIS Bush Information System
BMCC CSIR
Biodiversity Management and Climate Change Council of Scientific and Industrial Research
DAS De-bushing Advisory Service
DBN Development Bank of Namibia
DEA Department of Environmental Affairs
DoF Directorate of Forestry
ECC Environmental Clearance Certificate
EIA Environmental Impact Assessment
EMP Environmental Management Plan
FNB First National Bank Namibia
FSC Forest Stewardship Council
GIS Geographic Information System
GIZ Deutsche Gesellschaft für Internationale Zusammenarbeit (GIZ) GmbH
GRN Ha
Government of the Republic of Namibia Hectare
LaRRI Labour Resource and Research Institute
M&E Monitoring and Evaluation
MAWLR Ministry of Agriculture, Water and Land Reform (formerly MAWF)
MEFT Ministry of Environment, Forestry and Tourism (formerly MET)
MIT Ministry of Industrialization and Trade (formerly MITSME development)
MLIREC Ministry of Labour, Industrial Relations and Employment Creation
NAD NAU
Namibian Dollar Namibia Agricultural Union
N-BiG Namibia Biomass Industry Group
NCA Namibia Charcoal Association
NCRST National Commission on Research, Science and Technology
NECFU Namibia Emerging Commercial Farmers Union
NNFU Namibia National Farmers Union
NSA Namibia Statistics Agency
NUST Namibia University of Science and Technology
OPM SAIEA
Office of the Prime Minister Southern African Institute for Environmental Assessment
SASSCAL Southern African Science Service Centre for Climate Change and Adaptive Land Management
UNAM UHH
University of Namibia University of Hamburg

State and Trends of the Namibian Bush Biomass Sector 2019 Page 5 of 51
List of Figures
Figure 1: Distribution of commercial farm polygons linked to contacts in the survey database. The bush
encroached area is derived from the Bester map. ............................................................................................... 15
Figure 2: Survey responses by farm type. ............................................................................................................. 17
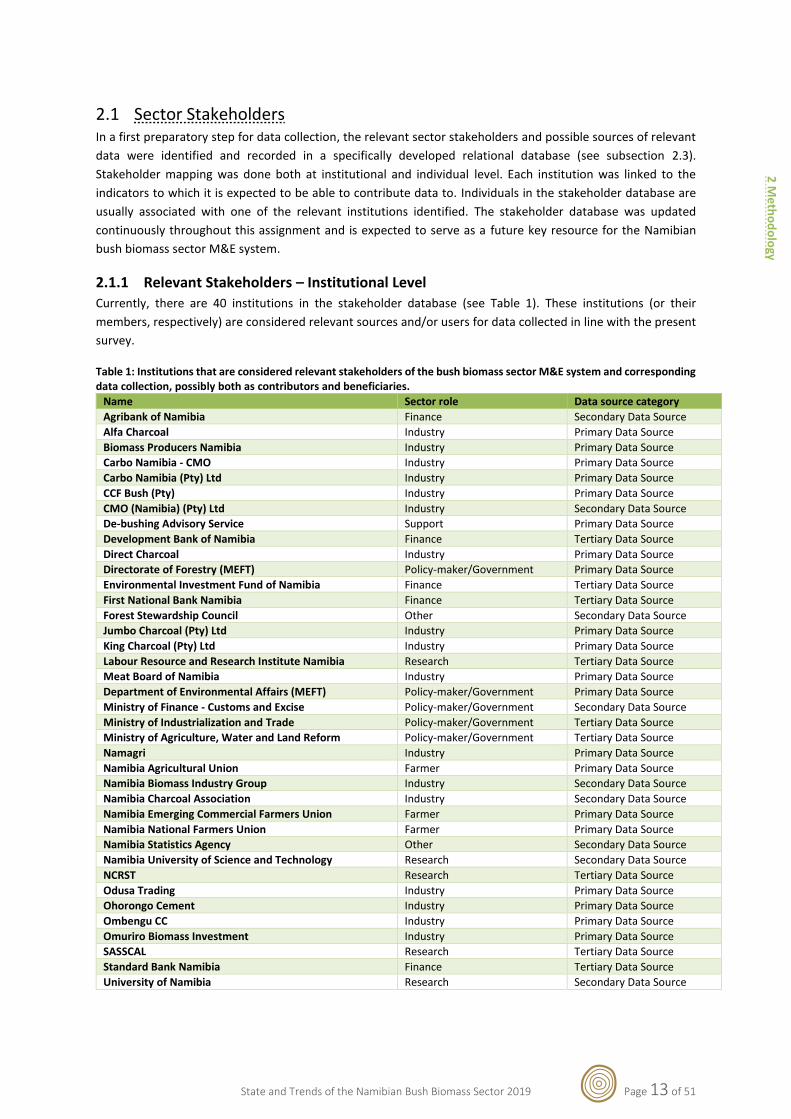
Figure 3: Distribution of farms participating in the survey. Note that the map does not depict the density of all
surveyed farms, since some survey records could not be unambiguously linked to a farm polygon. ................. 18
Figure 4: Survey responses by region. .................................................................................................................. 18
Figure 5: Estimated total area affected by bush encroachment over time as estimated by Bester (1998/1999), De
Klerk (2004) and SAIEA (2016). ............................................................................................................................. 21
Figure 6: Estimated annual area under manual/semi-mechanized bush control, derived from charcoal production
figures (Sources: NSA, NCA). ................................................................................................................................. 22
Figure 7: Estimated area under chemical bush control derived from primary data by service providers, 2015 –
2019. ..................................................................................................................................................................... 24
Figure 8: Estimated potential area under chemical treatment derived from NSA import statistics, 2007 – 2019.
.............................................................................................................................................................................. 25
Figure 9: Estimated annual area under mechanized bush control based on information provided by commercial
service providers................................................................................................................................................... 26
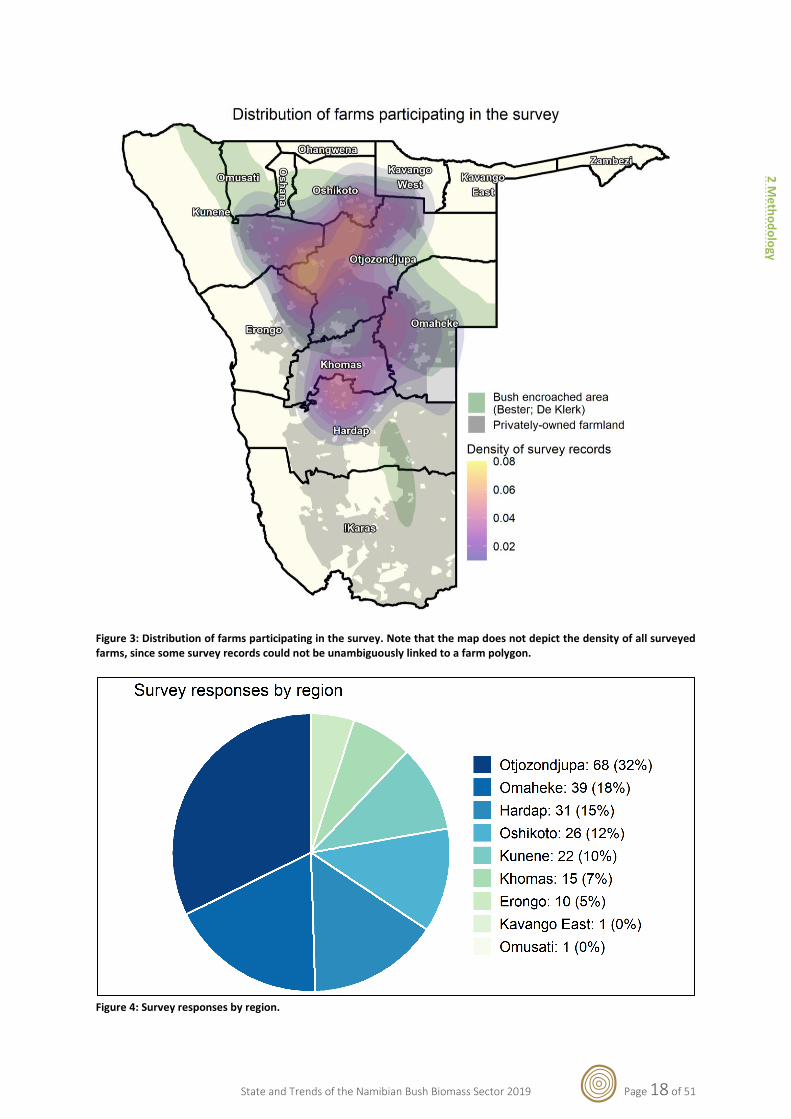
Figure 10: Estimated annual area under bush control by method, 2010 – 2019. ................................................ 29
Figure 11: Different estimates of the area under bush control in 2019 by bush control method. ...................... 30
Figure 12: Combinations of the respective minimum and maximum estimates of area under bush control per
bush control method for 2019.............................................................................................................................. 30
Figure 13: Annual volume of wood charcoal exports by destination 2004 - 2019. Source: NSA Trade Statistics. 31
Figure 14: Annual value of wood charcoal exports by destination 2004 - 2019. Source: NSA Trade Statistics. .. 31
Figure 15: Relative value and volume of charcoal exports by destination 2004 - 2019. Source: NSA Trade
Statistics. ............................................................................................................................................................... 32
Figure 16: Export value per ton of wood charcoal per destination 2004 – 2019. Source: NSA Trade Statistics. . 32
Figure 17: Total FSC-certified area in Namibia 2010 - 2020. Sources: FSC, FSC group schemes. ......................... 33
Figure 18: Annual estimated export volumes of FSC-certified vs. uncertified wood charcoal, 2014-2019. Sources:
NCA, NSA Trade Statistics. .................................................................................................................................... 33
Figure 19: Distribution of FSC-certified charcoal producers surveyed in 2020. Note that the map does not depict
all FSC-certified farms in Namibia, but only surveyed FSC-certified farms. ......................................................... 34
Figure 20: Number of individual NCA members, 2016 – 2020. Source: NCA, August 2020. ................................ 34
Figure 21: Distribution of NCA members surveyed in 2020. Note that the map does not depict all NCA members
in Namibia, but only surveyed NCA members. ..................................................................................................... 35
Figure 22: Estimated number of charcoal producers, 2016 - 2019. Sources: NCA, FSC, NSA Trade Statistics. .... 36
Figure 23: Number of charcoal processors between 2014 and 2020. Source: NCA. ............................................ 36
Figure 24: Annual trade volume (tons) for lucerne 2004 - 2019. Source: NSA Trade Statistics. .......................... 37
Figure 25: Estimated amount of woodchips produced and commercially traded, 2014-2019. Source: Private
sector. ................................................................................................................................................................... 39
Figure 26: Estimated number of employees in charcoal production and processing 2014 - 2019, disaggregated
by gender. ............................................................................................................................................................. 41
Figure 27: Estimated number of employees with BCBU-related service providers, 2010-2019. ......................... 43
Figure 28: Distribution of estimated employment in the BCBU sector in 2019 by subsector. ............................. 43

State and Trends of the Namibian Bush Biomass Sector 2019 Page 6 of 51
Acknowledgements
We would like to acknowledge the contributions by all sector stakeholders, public servants and experts who
responded to data requests, provided their advice and insights and made time for meetings and interviews. In
particular, we would like to acknowledge the contribution by all farmers who took the time to participate in the
farm-level survey and shared information about the operations on their farm. Thank you for your cooperation
and willingness to share data and information, which is crucial to capture the state and development of the
Namibian bush biomass sector.
We would also like to acknowledge the great work by the farm-level survey enumerator team, Mr. Uhangatenua
Kapi, Ms. Helvi Shindume and Mr. Peter Shikalepo.
We hope that this report can make a humble contribution to the regular monitoring and the further
development of the sector.

State and Trends of the Namibian Bush Biomass Sector 2019 Page 7 of 51
Executive Summary
The report summarizes the findings of a sector-wide survey of the Namibian bush biomass sector in line with a
sector M&E framework developed by the De-bushing Advisory Service (DAS) in order to estimate the current
state and extent of bush control and biomass utilization (BCBU) and related value chains, revenue streams and
employment figures at the national level.
The Namibian bush biomass sector is a growing sector and has the potential to significantly contribute to the
national economy through the establishment and strengthening of both domestic and international value chains
and corresponding employment creation. The availability of reliable sector data is essential to appreciate the
importance of the sector and its development over time and, importantly, to forecast and shape the future
sector development. Systematic sector data allows for evidence-based decision-making in order to tailor sector
support policies, interventions and instruments to maximize the benefits for Namibian land users on both
commercial and communal farmlands and the Namibian economy at large.
The primary aim of the survey was to determine the status of all sector indicators as defined by the DAS for the
year 2019. Where available and realistic, the survey further aimed to collect data for previous years. The current
approach to data collection combined a farm-level survey and targeted collection of existing datasets and
primary data from key stakeholders. This proved useful in that it provided two or more independent estimates
for numerous indicators, thus allowing for some degree of triangulation and consistency-checking of
assumptions:
• A phone-based farm-level survey was conducted in April and May 2020, focusing primarily on
(emerging) commercial farmers. Out of a total of 407 farmers who were contacted, 213 participated in
the farm-level survey. The corresponding data was used to derive bottom-up estimates of national-
level indicator values.
• Primary data was collected from sector stakeholders such as the Namibia Charcoal Association (NCA)
and private sector stakeholders such as BCBU-related service providers.
• Existing datasets were used to derive top-down estimates. For example, trade statistics from the
Namibia Statistics Agency (NSA) were used to estimate some relevant indicators.
The survey results show a clear trend of the Namibian bush biomass sector as a growing contributor to the
national economy through value creation and employment, as all indicators consistently show significant
growth.
The bush biomass value chain starts with the control and harvesting of encroacher bush. It is estimated that
slightly more than 300,000 ha were under a form of bush control in Namibia in 2019 (see Fig. A). Compared to
the 2010 estimate, this corresponds to an annual growth rate of more than 6%. Overall, the total area under
bush control over the last 10 years (2010 to 2019) is estimated at close to 2 million ha. For 2019, about 220,000
ha are attributed to manual/semi-mechanized bush control, close to 70,000 ha to chemical bush control and
roughly 20,000 ha to mechanized bush control.
Execu
tive su
mm
ary

State and Trends of the Namibian Bush Biomass Sector 2019 Page 8 of 51
Fig. A: Estimated annual area under bush control by method, 2010 – 2019.
In terms of market and business development, the charcoal industry is the largest and best developed subsector
of the Namibian bush biomass sector. Virtually all charcoal produced in Namibia is exported, making Namibia
one of the largest global exporters of wood charcoal, consistently ranging among the top ten exporters during
the past decade. Annual charcoal exports as recorded in official Namibian trade statistics have almost
quadrupled over the past 15 years and stood at 185,820 tons worth 662.5 million N$ in 2019 (see Fig. B). Note
that the Namibia Charcoal Association (NCA) estimates that the share of exports to Europe is even higher. The
NCA estimates that about 55-60% (i.e. at least 100,000 tons) of Namibian charcoal were exported directly to
Europe in 2019.
Fig. B: Annual volume of wood charcoal exports by destination 2004 - 2019. Source: NSA Trade Statistics.
The export value per ton of charcoal has increased consistently over the past 15 years. Significantly higher prices
can be achieved from exports to Europe than to South Africa. According to the 2019 NSA trade statistics, a ton
of charcoal exported to South Africa was on average worth 1,872 N$, whereas the value for export to Europe
was almost three times higher with 5,522 N$ per ton.
- 20,000 40,000 60,000 80,000
100,000 120,000 140,000 160,000 180,000 200,000 220,000 240,000 260,000 280,000 300,000 320,000
2010 2011 2012 2013 2014 2015 2016 2017 2018 2019
Are
a (h
a)Estimated annual area under bush control by method
Sources: NSA Trade Statistics, NCA, Private Sector
Manual/semi-mechanized(top-downestimate)
Mechanized(primary data)
Chemical(primary data)
20 000
40 000
60 000
80 000
100 000
120 000
140 000
160 000
180 000
200 000
2004 2005 2006 2007 2008 2009 2010 2011 2012 2013 2014 2015 2016 2017 2018 2019
Exp
ort
vo
lum
e (t
on
s)
Volume of wood charcoal exports by destination (tons)Source: NSA Trade Statistics
Other
South Africa
Europe
Execu
tive su
mm
ary

State and Trends of the Namibian Bush Biomass Sector 2019 Page 9 of 51
Bush-based animal feed, while being a promising way of utilizing encroacher bush, has not yet developed in an
organized subsector. In drought years, it seems relatively common that farmers add encroacher bush to their
livestock feed, albeit production happens predominantly for own use and hardly in a commercial way thus far.
Based on the farm-level survey, it is estimated that Namibian farmers produced more than 100,000 tons of bush
feed in 2019, predominantly for own use. It is further estimated that about 6,500 tons of bush feed with an
estimated value of 14 million NAD were sold in 2019. While this seems impressive, these figures are small
compared to the 2019 lucerne imports from South Africa, which amounted to almost 60,000 tons.
Further bush biomass products are wood fuels. We estimate that more than 120,000 tons of firewood were
produced from encroacher bush for own use in 2019. Furthermore, it is estimated that slightly more than 50,000
tons of firewood produced from encroacher bush were sold in 2019 at a total value of 70 million NAD. Produced
and commercially traded amounts of wood chips/pellets for industrial combustion and bushbloks in 2019 were
estimated at in 34,000 tons and 10,000 tons, respectively.
In terms of employment creation, it is estimated that the Namibian bush biomass sector employed about 11,300
people in 2019. Three quarters of these are estimated to be employed at the farm level in line with charcoal
production. Altogether, the charcoal subsector is estimated to account for 87% of the sector employment. (see
Fig. C). Employment in bush feed production was estimated at close to 1,000 jobs in 2019. However, this may
be an exception due to the extreme drought conditions in that year.
Fig. C: Estimated employment in the BCBU sector in 2019 by subsector.
Financial support instruments tailored to BCBU-related operations are scarce, but available. Both AgriBank and
FNB offer specific instruments. However, according to estimates derived from the farm-level survey, these were
hardly made use of in 2019, possibly because the priorities of most farmers lay elsewhere during the drought.
All relevant indicators show consistent growth over the last ten years, indicating significant growth and
expansion of the entire Namibian bush biomass sector and suggesting a potential for further and sustained
growth. While the charcoal subsector has become well-organized, other subsectors such as bush-based animal
feed still needs to be organized and formalized. Nationally, an expansion of bush biomass utilization activities
may allow communal farmers to capitalize on the bush biomass available in many areas. Internationally, the
possible establishment of value chains involving the export of woodchips for energy generation is currently being
assessed and may spark an additional subsector.
8488; 75%
1339; 12%
946; 9%
380; 3% 121; 1%
Distribution of estimated employment in the BCBU sector in 2019 by subsector
Charcoal production
Charcoal processing
Bushfeed production
Firewood production
BCBU service providers
Execu
tive su
mm
ary

State and Trends of the Namibian Bush Biomass Sector 2019 Page 10 of 51
1 Introduction
1.1 Document Background With the aim to establish and consolidate an M&E system for the Namibian bush biomass sector, the De-bushing
Advisory Service (DAS) contracted D-Once Consulting CC to carry out a consultancy titled “Conduct an inclusive
survey for implementation of the recently developed DAS Monitoring and Evaluation System”. The task was to
support the implementation of the DAS Monitoring and Evaluation (M&E) system for the Namibian bush biomass
sector by
i) conducting a sector-wide survey in line with the existing indicator framework in order to estimate
the current state and extent of bush control and biomass utilization (BCBU) and related value
chains, revenue streams and employment figures at the national level; and
ii) identifying challenges and opportunities with regards to the indicators, processes and tools
required to establish regular data capturing and reporting in future by relevant sector stakeholders
and formulating corresponding recommendations.
The present report summarizes the activities and findings of this assignment. It aims to depict the current state
of and trends in the Namibian bush biomass sector and describes the recommended approach for future data
collection campaigns. The availability of accurate and up-to-date national-level estimates is expected to benefit
all sector stakeholders as well as the Namibian economy as a whole as it will give both public and private
stakeholders a comprehensive overview of opportunities and challenges in the sector and enable corresponding
support policies, interventions and instruments to be tailored accordingly.
1.2 Rationale Woody encroachment by indigenous encroacher species is estimated to occur on more than half of Namibia’s
land area and is considered a form of severe land degradation in the Namibian context, having significant impacts
on the country’s economy and savannah ecosystems. These impacts include drastically reduced agricultural
productivity, changes in biodiversity, reduced groundwater recharge (De Klerk, 2004) as well as changes in soil
fertility and carbon storage potential of savannah ecosystems (Turpie, et al., 2019; Seebauer, Pinkwart, Schwarz,
& Hartz, 2019; GRN, 2019). While a more detailed quantification and characterization of these impacts (and the
impacts of bush control) in the Namibian context is a pending task, a study on the economics of bush
encroachment (Birch, Harper-Simmonds, Lindeque, & Middleton, 2016) estimated the economic benefits of
large-scale bush control operations (bush control on about 1 million hectares annually) in Namibia between 29
and 112 billion N$ over a period of 25 years as compared to a scenario with no bush control, assuming that the
problem of bush encroachment is reversible, and that sustainable rangeland restoration is possible on large
scale.
The encroacher bush biomass constitutes a natural resource and an opportunity for further value generation
and addition. Bush control per se is an expensive and demanding exercise and hardly affordable on a large scale
unless clear and tangible benefits materialize within a reasonable timeframe for the respective land user.
Therefore, large scale bush control is only an economically viable option if further value can be generated from
the encroacher bush biomass resource. Accordingly, a Namibian bush biomass industry sector has developed
over the years, with an increasing degree of organization and formalization. The De-bushing Advisory Service, in
cooperation with the MEFT/GIZ Bush Control and Biomass Utilization (BCBU) Project and the Namibia Biomass
Industry Group (N-BiG), is supporting the development of this bush biomass sector in Namibia, aiming to turn
encroacher bush into an economic opportunity.
The availability of reliable sector data is essential to appreciate the importance of the sector and its development
over time and, importantly, to forecast and shape the future sector development. Systematic sector data allows
1 In
trod
uctio
n
1 1
1

State and Trends of the Namibian Bush Biomass Sector 2019 Page 11 of 51
for evidence-based decision-making in order to tailor sector support policies, interventions and instruments to
maximize the benefits for Namibian land users on both commercial and communal farmlands and the Namibian
economy at large. It further allows the DAS to (non-causally) assess the sector development against its own
support activities and plan its own interventions accordingly. It is against this background that the DAS has
developed an indicator framework for the Namibian bush biomass sector, aiming to quantitatively capture both
the state of the sector and its own support activities. In line with this framework, a sector-wide survey was
conducted to determine the various indicator values for the year 2019 and previous years. This report
summarizes the findings of this survey and provides corresponding lessons learned in order to facilitate and
consolidate regular systematic data collection.
The Namibian bush biomass sector is a growing sector and has the potential to significantly contribute to the
national economy through the establishment and strengthening of both domestic and international value chains
and corresponding employment creation. The formal part of the sector is currently exclusively limited to
commercial and resettlement farms, i.e. private-owned land, and comprises numerous farms and a limited
number of commercial companies specialized in certain biomass products and/or service provision. Bush control
and biomass utilization operations on communal land are currently highly restricted in Namibia, mainly due to
concerns about uncontrolled over-utilization and unequal benefit distribution if such operations were allowed.
The present report and the underlying data collection campaign thus focused exclusively on the commercial
farmlands.
Note that the phenomenon of bush encroachment in Namibia as well as the various bush control methods and
bush biomass utilization opportunities have been described in detail elsewhere and are not subject of this report.
For further information on the above, the reader is referred to the DAS website at
https://www.dasnamibia.org/download/, which provides a comprehensive archive of relevant literature.
1 In
trod
uctio
n
1 1
1
1 In
trod
uctio
n
1 1
1

State and Trends of the Namibian Bush Biomass Sector 2019 Page 12 of 51
2 Methodology
The primary aim of the overall survey was to determine the status of all sector indicators for the year 2019.
Where available and realistic, the survey further aimed to collect data for previous years. The survey consisted
of various components, attempting to tap as many relevant sources as possible in order to obtain direct or proxy
data on a given indicator from various angles and allow checking for consistency and the derivation of best
estimates through triangulation of the data from these sources.
We distinguished between two general data source types: Bottom-up (primary and secondary data) and top-
down (secondary data).
• Bottom up data refers to initially disaggregated data from a sample (in this case down to the farm level),
which can be aggregated and extrapolated to arrive at regional and national level estimates for the
sector indicators, e.g. bush-thinned area by method. This dataset was collected through a structured
survey among commercial farmers.
• Top-down sectoral data is already available, normally in aggregated form. An example of top-down data
is the annual total volume of bush-based charcoal exported, which was cross-checked against charcoal
production and sale figures derived from farm and processing plant level data. Top-down data is mainly
secondary data collected from the mandated government authorities or primary data from the private
sector (e.g. bush control service providers).
Generally, it was attempted to derive indicator estimates from both the bottom up and top down datasets and
compare these estimates for consistency. The above data source types and estimates derived thereof were
complemented by quantitative and qualitative data from both key informant interviews and existing literature.
Data collection took place between April and August 2020. Due to the Covid-19 related lockdown phase, data
collection took place remotely. After the lockdown restrictions were lifted in May 2020, also in-person meetings
and interviews took place. A total of 38 relevant key stakeholders were consulted, 28 of these via phone or email
and 10 in personal meetings.
2 M
eth
od
olo
gy
State and Trends of the Namibian Bush Biomass Sector 2019 Page 13 of 51
2.1 Sector Stakeholders In a first preparatory step for data collection, the relevant sector stakeholders and possible sources of relevant
data were identified and recorded in a specifically developed relational database (see subsection 2.3).
Stakeholder mapping was done both at institutional and individual level. Each institution was linked to the
indicators to which it is expected to be able to contribute data to. Individuals in the stakeholder database are
usually associated with one of the relevant institutions identified. The stakeholder database was updated
continuously throughout this assignment and is expected to serve as a future key resource for the Namibian
bush biomass sector M&E system.
2.1.1 Relevant Stakeholders – Institutional Level Currently, there are 40 institutions in the stakeholder database (see Table 1). These institutions (or their
members, respectively) are considered relevant sources and/or users for data collected in line with the present
survey.
Table 1: Institutions that are considered relevant stakeholders of the bush biomass sector M&E system and corresponding data collection, possibly both as contributors and beneficiaries.
Name Sector role Data source category
Agribank of Namibia Finance Secondary Data Source
Alfa Charcoal Industry Primary Data Source
Biomass Producers Namibia Industry Primary Data Source
Carbo Namibia - CMO Industry Primary Data Source
Carbo Namibia (Pty) Ltd Industry Primary Data Source
CCF Bush (Pty) Industry Primary Data Source
CMO (Namibia) (Pty) Ltd Industry Secondary Data Source
De-bushing Advisory Service Support Primary Data Source
Development Bank of Namibia Finance Tertiary Data Source
Direct Charcoal Industry Primary Data Source
Directorate of Forestry (MEFT) Policy-maker/Government Primary Data Source
Environmental Investment Fund of Namibia Finance Tertiary Data Source
First National Bank Namibia Finance Tertiary Data Source
Forest Stewardship Council Other Secondary Data Source
Jumbo Charcoal (Pty) Ltd Industry Primary Data Source
King Charcoal (Pty) Ltd Industry Primary Data Source
Labour Resource and Research Institute Namibia Research Tertiary Data Source
Meat Board of Namibia Industry Primary Data Source
Department of Environmental Affairs (MEFT) Policy-maker/Government Primary Data Source
Ministry of Finance - Customs and Excise Policy-maker/Government Secondary Data Source
Ministry of Industrialization and Trade Policy-maker/Government Tertiary Data Source
Ministry of Agriculture, Water and Land Reform Policy-maker/Government Tertiary Data Source
Namagri Industry Primary Data Source
Namibia Agricultural Union Farmer Primary Data Source
Namibia Biomass Industry Group Industry Secondary Data Source
Namibia Charcoal Association Industry Secondary Data Source
Namibia Emerging Commercial Farmers Union Farmer Primary Data Source
Namibia National Farmers Union Farmer Primary Data Source
Namibia Statistics Agency Other Secondary Data Source
Namibia University of Science and Technology Research Secondary Data Source
NCRST Research Tertiary Data Source
Odusa Trading Industry Primary Data Source
Ohorongo Cement Industry Primary Data Source
Ombengu CC Industry Primary Data Source
Omuriro Biomass Investment Industry Primary Data Source
SASSCAL Research Tertiary Data Source
Standard Bank Namibia Finance Tertiary Data Source
University of Namibia Research Secondary Data Source
2 M
eth
od
olo
gy

State and Trends of the Namibian Bush Biomass Sector 2019 Page 14 of 51
2.1.2 Relevant Stakeholders – Individual Level
The stakeholder database further contains relevant individuals as well as their contact details. These individuals
include both potential key informants as well as farmers from the regions affected by bush encroachment. The
contacts for the latter are essential for the farm-level data collection component of the survey (see subsection
2.2.1).
In order to collect as many contacts as possible for the farm-level data collection campaign, the various farmers
unions were contacted. Target farmers were farmers from areas that are affected by bush encroachment, i.e.
Otjozondjupa, Omaheke and Oshikoto as well as parts of Kunene, Erongo, Khomas and Hardap Region.
Unfortunately, the management of institutions such as the Namibia Agricultural Union (NAU) and the Namibia
Charcoal Association (NCA) are not allowed to share their members lists, thus the following approaches were
pursued to obtain the contacts of their members:
• NAU: A call for participation in the baseline survey was placed in the weekly newsletter sent to all 2,000
NAU members on 03 April 2020. In addition, the call for participation was reiterated through a
contribution to the weekly radio programme “Landboumikrofoon” on the NBC Afrikaans service on
Saturday, 04 April 2020. Farmers willing to participate in the survey were requested to give their
consent by submitting their contact details. Unfortunately, the response rate to this initiative was
disappointingly low, with only 10 out of the more than 2,000 NAU farmers actively giving their consent.
• NECFU: Some 200 member contacts are publicly available on the NECFU website (https://necfu.org/).
The NECFU leadership was contacted and gave permission that their members be contacted for the
survey.
• NCA: A call to participate in the survey was sent to all NCA members through the NCA leadership.
Interested farmers would indicate their readiness to the NCA leadership, who would then compile and
share a corresponding contact list. However, according to the NCA management, the response rate was
very low.
• FSC-certified farmers: A workaround to the low response rate by the NCA members was found by
obtaining the contacts of the charcoal producers of FSC-certified group schemes (the major ones are
CMO Group, Jumbo Charcoal, Direct Charcoal and Carbo Namibia). Under FSC management standards,
members commit to sharing non-personal relevant data. According to the NCA, most of the members
of these FSC group schemes are also NCA members. The contacts of more than 200 FSC-certified farms
were identified.
• In addition, the DAS in-house contact database contained more than 300 contacts as of March 2020.
The latter contains a mix of contacts, including (emerging) commercial and communal farmers as well
as entrepreneurs.
Where farm name and number are known, the respective contact was linked spatially to the corresponding farm
GIS data. A GIS shapefile emanating from the former Ministry of Land Reform containing was the only available
spatial data for this exercise. While the corresponding data is somewhat outdated, particularly with regards to
resettlement farms and corresponding sub-portioning, it was still useful for a significant share of contacts in the
database, thus allowing to visualize the spatial distribution of contacts and survey data. Note that to protect
personal data, no identifiable farm polygons will be published in this report. Instead, farm-level data will be
visualized in form of density heatmaps. Figure 1 illustrates the distribution of commercial farms as in the current
survey database.
2 M
eth
od
olo
gy

State and Trends of the Namibian Bush Biomass Sector 2019 Page 15 of 51
The contact database currently contains 761 individual entries. Of these,
• 657 (86%) are individual farmers. Of these, 283 could be linked to one or more farms/farm portions
(visualized in Figure 1) 1. The total number of farm polygons which were linked to a farmer from the
contact database is 369. This number is higher than the number of corresponding contacts because
some farmers own several (often neighboring) farms or a given farm is stored in the GIS database as
more than one polygon (often corresponding to different farm portions).
• 104 are other relevant contacts, e.g. representatives of relevant companies/institutions or experts on
BCBU-related matters.
Figure 1: Distribution of commercial farm polygons linked to contacts in the survey database. The bush encroached area is derived from the Bester map.
1 Not all farmers in the database could be linked to a commercial farm polygon due to several reasons:
i. The GIS layer of farms that was used is outdated. Farms may have been subdivided and/or farm names may have changed since this layer was last updated. In such cases, no unambiguous links could be made.
ii. In the GIS layer used, farm polygons in communal areas (e.g. the Mangetti block in Oshikoto) are neither named nor numbered. Unambiguous links between corresponding farmers and these farm polygons could thus not be made.
iii. Some farmers in the database farm on communal land for which no distinct farm polygons are defined. iv. For some farmers in the database, the name, contact and affiliation were available, but no information on the farm name and/or
number. Therefore, if these farmers did not participate in the survey, they could not be linked to any farm polygon.
2 M
eth
od
olo
gy

State and Trends of the Namibian Bush Biomass Sector 2019 Page 16 of 51
2.2 Data Collection
2.2.1 Bottom-Up Data: Farm-Level Survey Farm-level data collection took place via a structured phone-based survey in April and May 2020. Where
possible, potential participants were informed in advance about the survey and encouraged to participate, e.g.
through their respective farmers union or FSC group scheme. Phone-based data collection was chosen because
i) on-site interviews were considered disproportionately resource-intense and impossible to implement during
the Covid-19-related lockdown at the time and ii) data collection via email or web-based questionnaires was
ruled out due to a commonly very low response rate.
The target number of farm-level datasets/farmers interviewed was 300 2. Three enumerators carried out the
phone-based interviews and concurrent digital data entry via EpiCollect 5 (https://five.epicollect.net/), a free
mobile data gathering platform initially developed for epidemiological data collection. A single interview took
about 20 min. The questionnaires aim to collect farm-level data on the extent and nature of farm-level BCBU
operations as well as corresponding farm employment and financial support services.
Note that the farmers with available contacts do not constitute a representative sample of all
commercial/resettlement farmers in Namibia. The latter would be ideal to determine representative statistics
with regards to BCBU at the national level but would require access to the contact data of all
commercial/resettlement farmers in the country. In the present case, the farmer contact database was compiled
based on opportunity sampling, i.e. identification of contacts as available/accessible and, among these contacts,
participation by everyone who would be available and willing to participate in the survey. Since this was the only
practical approach, it must be expected that there is a considerable sampling bias towards i) farmers who are
affected by bush encroachment and who do practice/are interested in BCBU; ii) FSC-certified charcoal producers,
since many contacts were identified via the FSC group schemes; and iii) commercial/resettlement farms located
in the areas presumably affected most by bush encroachment. Corresponding survey results, therefore, cannot
simply be extrapolated to the entire national commercial/resettlement farming population without major
assumptions which aim to account for that bias. For reproducibility of results, throughout the report we aim to
indicate all assumptions made during data analysis.
A total of 407 commercial/resettlement farmers were contacted in line with the phone-based survey. Of these,
212 participated in the farm-level survey 3, corresponding to a response rate of 52%. The remainder was either
not reachable or decided not to participate in the survey.
The surveyed sample of 212 respondents is linked to 213 farm-level records, since one respondent is owner of
two separate farms and accordingly provided two different farm-level records. The 213 farm-level records
consist of the following respondent categories:
• Ownership/farming system
o 138 (65%) are commercial farmers on free/-leasehold land.
o 35 (16%) are emerging commercial / resettlement farmers.
o 24 (11%) are communal farmers.
o 16 (8%) farm on government farms. In the present case, this essentially refers to the Mangetti
block in Oshikoto Region.
2 This was set based on calculations of minimum random sample sizes. For an assumed total population of 10,000 commercial/resettlement farmers, the minimum sample size for a confidence interval of ± 5% at 90% confidence would be 266. However, note that the sample used is not a representative random sample, so confidence levels could not be determined. 3 If these 212 farmers constituted a representative sample from an assumed total population of 10,000, this would be sufficient to derive representative statistics for a ± 5% confidence interval at 85% confidence. However, as the sample is not representative in the present case, the confidence level could not be determined.
2 M
eth
od
olo
gy

State and Trends of the Namibian Bush Biomass Sector 2019 Page 17 of 51
Figure 2: Survey responses by farm type.
• Bush Control and Biomass Utilization
o 132 (62%) reported that they did bush control activities in 2019.
o 26 (12%) indicated that they did aftercare/follow-up treatment in 2019 of areas previously
bush-thinned areas.
o 74 (35%) are FSC-certified charcoal producers.
o 51 (24%) indicated that they produced animal feed from encroacher bush in 2019,
predominantly for own use.
Table 2: Basic survey response figures disaggregated by farm type.
Farm
typ
e
# o
f re
cord
s
Ave
rage
farm
are
a
(ha)
# D
on
e
bu
sh
con
tro
l in
20
19
Ave
rage
ar
ea
bu
sh-
thin
ne
d
(ha)
*
# d
oin
g
afte
rcar
e in
20
19
# p
rod
uce
d
bu
sh f
ee
d
in 2
01
9
# FS
C-
cert
ifie
d
Commercial (free- or leasehold)
138 5,363 100 480 * 17 42 69
Resettlement farm
35 1,909 22 109 * 5 6 5
Communal farm
24 4,096 4 10 29 * 4 3 0
Government farm
16 547 0 NA 0 0 0
* Note that the average bush-thinned area only refers to farms where bush control took place.
• Spatial distribution
o Of the 213 farm-level records, two thirds (144 records; 68%) could be unambiguously linked
to one or more commercial farm polygon(s) 5, see Figure 3.
4 The communal farmers participating in the survey were mainly from the communal areas in Omaheke and Otjozondjupa. Accordingly, the reported farm areas (and the resulting average) are unlikely to refer to exclusive ownership/access and are thus associated with a high uncertainty. 5 Note that various commercial farmers own more than one farms. Often, these are adjacent, thus effectively forming one large farm unit. In total, 184 farm polygons were linked to 144 survey participants.
2 M
eth
od
olo
gy
State and Trends of the Namibian Bush Biomass Sector 2019 Page 18 of 51
Figure 3: Distribution of farms participating in the survey. Note that the map does not depict the density of all surveyed farms, since some survey records could not be unambiguously linked to a farm polygon.
Figure 4: Survey responses by region.
2 M
eth
od
olo
gy

State and Trends of the Namibian Bush Biomass Sector 2019 Page 19 of 51
2.2.2 Top-Down Data
Top-down data was collected by requesting corresponding datasets and through key informant interviews. The
following datasets were requested and where available and useful - used to determine/estimate indicator
values:
• NSA Trade Statistics, annual aggregation, all available from 2004 until 2019:
o Wood charcoal exports (commodity codes 440200 and 440290)
o Imports of chemicals (commodity code 380893: Herbicides, anti-sprouting products and plant-
growth regulators)
o Lucerne imports (commodity codes 12141000 and 12149000); i.e. animal feed ingredients
which could be (partially) replaced by suitable encroacher bush material harvested locally
• Statistics from MEFT DoF permit system
• Statistics from MEFT DEA environmental clearance certificate system
• NCA:
o Membership
o Charcoal production estimates
o Charcoal export figures as reported by NCA-associated processors
o Employment figures as reported by NCA-associated processors (2020 survey by NSA)
• FSC: Registered farms and their areas as reported by FSC group scheme managers
• Private sector:
o Data on area treated and biomass harvested from service providers for mechanized bush
control
o Data on area treated and chemicals sold by service providers for chemical bush control
• Financial service providers: Data on financial support products tailored to the bush biomass sector
• Research institutions: Data on past, ongoing and planned research activities with regards to BCBU
2.3 Survey Database and Data Analysis A local relational database was set up using PostgreSQL to systematically capture all contacts possibly relevant
in line with the DAS M&E System, their links to the respective sector indicator(s) and the contact/farm-level
records as well as the stakeholder engagement activities. The local database was accessed and manipulated
through a custom-developed interactive local frontend based on R Shiny.
All quantitative data collected was brought into tabular format using Excel or the R Software Environment for
Statistical Computing (“R”). R was used for statistical analysis of the farm-level survey data as well as production
of corresponding graphs and maps.
Excel was used to collate and analyze third-party/top-down data and to produce corresponding graphs. All
assumptions and formulas used for indicator value calculation are contained in this spreadsheet, which can be
used for further annual updates.
Considerations and assumptions made in line with analysis of data of individual indicators are discussed for each
indicator as applicable in section 3.
2 M
eth
od
olo
gy

State and Trends of the Namibian Bush Biomass Sector 2019 Page 20 of 51
3 Results
This section presents the survey results for the different indicators. Where applicable, the both the top-down
and bottom-up estimates for a given indicator are presented and compared. Where available, indicator values
are presented as timeseries for the period 2010 until 2019. Note that many indicator values are estimates based
on assumptions. Where applicable, all underlying assumptions are described to ensure reproducibility of results.
Some assumptions were used uniformly throughout the report. These refer to the number of farms by farming
system and were used in line with bottom-up estimates derived through the extrapolation of the farm-level
survey findings to the national level.
Commercial farmland is estimated to cover close to 40 million ha and includes freehold farms as well as
resettlement and government research farms. The Ministry of Land Reform had listed more than 12,000
commercial farm units between 2012 and 2017, of which about 7,500 are listed as farms and about 4,900 as
farm portions (Namibia Statistics Agency, 2018). For the purpose of this report, we assumed that there are 6,000
privately-owned commercial farms, since some (often adjacent) farms/farm portions are owned by the same
person. As the total estimated area of privately-owned commercial farms is about 34 million ha (Namibia
Statistics Agency, 2018), this corresponds to an average farm size of about 5,700 ha, which is in good agreement
with the average farm size as indicated by commercial farmers participating in the farm-level survey. We further
assumed that there are 2,000 resettlement farms. As the total estimated area of government resettlement farms
is about 3 million ha (Namibia Statistics Agency, 2018), this corresponds to an average farm size of resettlement
farms of 1,500 ha.
With regards to communal farms, only very rough assumptions were made since the corresponding sample size
is very low. Based on the average indication of farm sizes (assumed to refer to farming communities/villages),
we assumed the number of corresponding communal farming units as 10,000.
In general, for each farming system, we assumed that roughly half of the above farms are situated in areas
affected by bush encroachment.
The section is structured according to the DAS indicator framework output areas.
3.1 Bush Control Activities
3.1.1 Area Affected by Bush Encroachment The estimates of the total area affected by bush encroachment have changed significantly over time. Figure 5
depicts the commonly cited estimates, which suggest a rather steep linear increase over time. Note that the
major part of this increase is to be attributed to changes in estimation methodology and scope rather than to
the actual expansion of bush encroachment. The latter is generally assumed to occur at a growth rate on the
order of 3% per annum.
The first estimate of 17.5 million ha by Bester (1998/1999) refers to the commercial farming sector north of
Rehoboth. The second estimate by De Klerk (2004) of 26 million ha includes communal areas. The latest
systematic estimate by SAIEA (2016) includes the entire country and amounts to 45 million ha, i.e. slightly more
than half of Namibia’s land area.
Note that, at the national level, the term ‘bush encroachment’ refers to a wide variety of phenomena related to
woody encroachment by different encroacher species at varying intensities. Therefore, the actual total affected
area depends on the definition of bush encroachment applied in a given context. The most densely encroached
areas occur in the areas which on average receive between 350 and 500 mm of annual rainfall. For more detailed
information on bush encroachment, refer to De Klerk (2004).
3 R
esu
lts

State and Trends of the Namibian Bush Biomass Sector 2019 Page 21 of 51
Figure 5: Estimated total area affected by bush encroachment over time as estimated by Bester (1998/1999), De Klerk (2004) and SAIEA (2016).
In agreement with the most recent bush encroachment map developed by SAIEA in 2016, the survey results
suggest that bush encroachment actually affects more than the area originally depicted in the Bester map
(Bester, 1998/1999), including most of Khomas Region, the southern parts of Omaheke Region as well as the
northern parts of Hardap Region. Note, however, that it cannot be concluded from the survey results that areas
without survey points (all communal areas; !Karas Region) are not affected by bush encroachment, since the
surveyed sample is spatially limited and by no means representative for the entire country.
3.1.2 Area under Bush Control
A realistic estimate of the total area under bush control is an important indicator to obtain an idea of i) the
extent to which bush encroachment is combatted and where the annual bush control efforts stand in
comparison to the (assumed) annual bush growth; and ii) the overall magnitude of the environmental and
economic impacts of bush control. Since the intensity and impacts of bush control strongly depend on the
method applied, this indicator is being captured by bush control method (De-bushing Advisory Service, 2015).
Major bush control methods considered are manual/semi-mechanized harvesting, mechanized tree
felling/harvesting and chemical bush control. Bush control through biological means (e.g. deployment of large
herds of browsers) or fire are also possible but were found to be both scarce and hardly quantifiable, since no
corresponding commercial service providers exist.
3.1.2.1 MANUAL/SEMI-MECHANIZED BUSH CONTROL
Manual and semi-mechanized bush control methods refer to labor-intensive conventional harvesting methods
which do not aim to remove all bushes, but are applied rather selectively, most prominently in line with charcoal
production.
Manual/semi-mechanized bush control: Top-down estimate based on charcoal production figures
This estimate is derived from the national charcoal production figures. Since virtually all charcoal is exported,
these are assumed to be the same as the charcoal export figures recorded by customs and reported by the
Namibia Statistics Agency (NSA)6. Based on the assumption that all bush control in line with charcoal production
is based on either manual (majority) or semi-mechanized harvesting, the area de-bushed for charcoal production
can then be estimated based on an average yield factor per hectare.
6 Except for 2019, where some 20,000 tons of uncertified charcoal were estimated to be produced but not exported due to saturation of the South African market.
17.5
26.0
45.0
15
20
25
30
35
40
45
50
19
99
20
00
20
01
20
02
20
03
20
04
20
05
20
06
20
07
20
08
20
09
20
10
20
11
20
12
20
13
20
14
20
15
Mill
ion
hec
tare
s af
fect
edEstimates of the total area affected by bush encroachment over time
3 R
esu
lts

State and Trends of the Namibian Bush Biomass Sector 2019 Page 22 of 51
Table 3: Estimated wood biomass yields per area and species (De Klerk, 2004, p. 64) and corresponding charcoal production rates per hectare based on the above assumptions.
Area Species
Suitable wood biomass (t/ha)
Harvested biomass (t/ha)
Charcoal (t/ha)
Outjo Colophospermum mopane 17.952 9.0 1.80
Outjo Terminalia prunioides 8.214 4.1 0.82
Otjiwarongo Acacia mellifera 13.208 6.6 1.32
Tsumeb Terminalia prunioides 5.724 2.9 0.57 Average 1.13
The amount of suitable wood biomass for charcoal production per hectare for different species and areas was
compiled by De Klerk (2004), see Table 3. To estimate an average charcoal yield factor per hectare, we used the
arithmetic mean of these values, assuming an average harvesting rate of 50% and a conversion factor from wood
biomass to charcoal of 5:1 7 . The resulting assumed average charcoal yield amounts to 1.13 t/ha. This is
consistent with the results of the farm-level survey, for which the average charcoal yield was 1.07 t/ha (again
assuming that all charcoal was produced in line with manual/semi-mechanized harvesting).
To estimate the annual area under bush control for charcoal production, the annual charcoal production figures
were divided by this factor. In addition, another 20% were added to the resulting area to account for
manual/semi-mechanized bush-thinning in line with firewood, bushfeed and other manual small-scale clearing
(e.g. for fences, buildings, gardens or firebreaks). The resulting area estimates are provided in Table 4 and Figure
6.
Table 4: Annual estimates of area under bush control through manual/semi-mechanized harvesting based on charcoal production figures.
2010 2011 2012 2013 2014 2015 2016 2017 2018 2019 Charcoal produced (t)
114,447 83,172 84,910 100,492 109,527 119,297 117,682 124,599 139,327 208,320
Area Charcoal (ha)
101,510 73,770 75,311 89,132 97,145 105,811 104,379 110,514 123,577 184,771
Area Other (ha)
20,302 14,754 15,062 17,826 19,429 21,162 20,876 22,103 24,715 36,954
Area Total (ha) 122,382 89,094 90,944 107,529 117,144 127,544 125,824 133,187 148,863 222,295
Figure 6: Estimated annual area under manual/semi-mechanized bush control, derived from charcoal production figures (sources: NSA, NCA).
7 I.e. 5 t of woody biomass yield 1 t of charcoal. This is the generally assumed rate for traditional charcoal burning techniques as predominantly applied in Namibia.
-
20,000
40,000
60,000
80,000
100,000
120,000
140,000
160,000
180,000
200,000
220,000
240,000
2010 2011 2012 2013 2014 2015 2016 2017 2018 2019
Are
a (h
a)
Estimated annual area under manual/semi-mechanized bush control
Other purpose
Charcoal production
3 R
esu
lts

State and Trends of the Namibian Bush Biomass Sector 2019 Page 23 of 51
Manual/semi-mechanized bush control: Bottom-up estimate from farm-level survey
Out of the 213 farm-level records, 117 indicated that manual and/or semi-mechanized bush control was done
in 2019. Out of these 117, 86 were from commercial farms where an average area of 391 ha was treated; 21
from resettlement farms, where an average area of 99 ha was treated; and 10 from communal farms, where an
average of 29 ha was treated. In total, an area of 8,798 ha was reported as under manual or semi-mechanized
bush control in 2019 by the survey respondents.
Since the surveyed sample cannot be considered representative, extrapolation to the national level can only be
made based on rough assumptions as presented in Table 5. We estimated the total number of commercial farms
at 6,000, the total number of resettlement farms at 2,000 and the total number of communal farms at 10,000,
respectively. The extrapolation factor takes into account that i) bush encroachment affects roughly half of the
commercial farming areas (i.e. factor of 0.5) and ii) the sample is not representative in terms of interest/activity
in BCBU and the activities of the actual farming community are assumed to occur at 25% intensity (i.e. another
factor of 0.25, which yields a total of 0.5 x 0.25 = 0.125). The latter assumption is made because of the
overrepresentation of charcoal producers in the sample, who rely heavily on manual/semi-mechanized bush
control. The resulting estimate amounts to more than 240,000 ha under manual/semi-mechanized bush control
in 2019, which is in good agreement with the above top-down estimate of 220,000 ha. Translated into
commercial farm numbers, this estimate would mean that an average of 400 ha were bush-thinned
manually/semi-mechanized on about 450 commercial farms in 2019 and an average of 100 ha on about 300
resettlement farms.
Table 5: Bottom-up estimate of area under manual/semi-mechanized bush control in 2019 based on extrapolation of farm-level survey results.
Manual/semi-mechanized bush control bush control 2019 – Bottom-up survey estimate
Farm
typ
e
Tota
l # o
f
resp
on
-
den
ts
# o
f ac
tive
resp
on
-
den
ts
% o
f
resp
on
-
den
ts
Ave
rage
area
trea
ted
(ha)
Extr
a-
po
lati
on
fact
or
Ass
um
ed
tota
l po
p.
Ass
um
ed
tota
l are
a
(ha)
Commercial farms 138 86 62% 391 0.125
6,000
182,783
Resettlement farms 35 21 60% 99 0.25 2,00
0 29,800
Communal farms 24 10 42% 29 0.25 10,0
00 29,792
Total 242,37
4
3 R
esu
lts

State and Trends of the Namibian Bush Biomass Sector 2019 Page 24 of 51
3.1.2.2 CHEMICAL BUSH CONTROL
Chemical bush control refers to the application of root-, foliar- or stem-absorbent arboricides with the main
intent to destroy the encroacher bushes and not necessarily to harvest and utilize the bush biomass. There are
both solid and liquid arboricides available, which both can be applied selectively (i.e. to individual plants) or
rather indiscriminately (e.g. by aerial application from aircrafts).
While indiscriminate chemical bush control is generally discouraged, selective application of chemicals is
considered by many as inevitable, particularly in the context of aftercare, i.e. to control regrowth of encroacher
bush on already bush-thinned areas. Large-scale (on the order of 1,000 hectares and more) chemical bush
control constitutes a major investment and is considered hardly affordable to most full-time commercial farmers
who do not have additional income to their farming operations.
Chemical bush control: Top-down estimate based on primary data from service providers
There is a very small number of commercial service providers and outlets in Namibia who offer chemical bush
control services in form of aerial spraying or hand application and who further sell arboricides. Based on their
data, the potential area chemically de-bushed was estimated for the years 2015 until 2019. In addition to the
area chemically de-bushed by these service providers, we estimated the potential area chemically treated based
on their arboricides sales figures. For the latter, we assumed that half of the arboricides sold were used for
selective de-bushing and the other half for aftercare. Further, we assumed that liquid arboricides are applied at
2.5 l/ha 8 and solids at 8.3 kg/ha 9 in line with selective application and aftercare.
For 2019, these estimates yield a potential area under chemical bush control of about 67,000 ha and a potential
area under chemical follow-up treatment of slightly more than 20,000 ha.
Figure 7: Estimated area under chemical bush control derived from primary data by service providers, 2015 – 2019.
Importantly, note that, according to the chemical bush control service providers, the amount per hectare of
chemicals required for aerial application is lower than the amounts required for targeted ground application.
Chemical bush control: Top-down estimate based on chemicals imported and sold
Based on the amount of chemicals imported as recorded in the NSA Trade Statistics, we estimated the potential
area under chemical bush control. However, note that these estimates are based on several assumptions that
are hard to verify. First, there is no dedicated commodity code for arboricides in the trade statistics. The only
8 Direct communication from service provider. 9 Based on the average usage recommendations per individual bush for different solid substances, assuming average number of bush (ETTE units) to be removed per hectare at 6,900. The latter figure was determined based on average ETTE/ha as indicated in the 2015 biomass resource assessment (Smit, de Klerk, Schneider, & van Eck, 2015), assuming an average retention of 4,000 ETTE/ha.
-
10 000
20 000
30 000
40 000
50 000
60 000
70 000
80 000
90 000
100 000
2015 2016 2017 2018 2019
Are
a tr
eate
d (
ha)
Estimated area treated chemically derived from primary data by service providers
Chemical aftercare
Chemical ground
Chemical aerial
3 R
esu
lts

State and Trends of the Namibian Bush Biomass Sector 2019 Page 25 of 51
likely relevant commodity category is “380893: Herbicides, anti-sprouting products and plant-growth
regulators”. Most of the corresponding imports come from South Africa or China, other sources are virtually
insignificant. We assumed that 50% of the imports under this category are arboricides and that, of these, 75%
are solid and 25% are liquid. The resulting amounts are consistent with the reported amounts of arboricides sold
by the corresponding service providers in the country. We further assumed that, on average, 50% of the solid
arboricides are used for indiscriminate de-bushing (i.e. aerial application) and, of the overall remainder, 50% for
selective bush thinning and 50% for selective aftercare. Finally, as above, we calculated the potentially treated
area for each of these categories based on the assumption that liquid arboricides are applied at 2.5 l/ha and
solids at 8.3 kg/ha in line with selective application and aftercare. The resulting estimates are visualized in Figure
8.
For 2019, these estimates yield a potential area under chemical bush control of close to 50,000 ha and a potential
area under chemical follow-up treatment of slightly more than 20,000 ha.
Rothauge (2014) estimated that, in 2014, the arboricides sold in that year equated to an area of 84,000 hectares
if applied selectively. The present estimate for 2014 yields a potential area of only 38,000 hectares for a mix of
selective and indiscriminate application. However, note that the amounts needed per hectare assumed here are
much higher (by a factor 2.5 for liquids and a factor 5 for solids) than the ones assumed by Rothauge.
Figure 8: Estimated potential area under chemical treatment derived from NSA import statistics, 2007 – 2019.
Chemical bush control: Bottom-up estimate from farm-level survey
Out of the 213 farm-level records, 21 indicated that chemical bush control was done in 2019. Out of these 21,
17 were from commercial farms where an average area of 500 ha was chemically treated and 4 from
resettlement farms, where an average area of 75 ha was chemically treated. In total, an area of 8,798 ha was
reported as chemically bush-thinned in 2019 by the survey respondents.
Since the surveyed sample cannot be considered representative, extrapolation to the national level can only be
made based on rough assumptions as presented in Table 6. We estimated the total number of commercial farms
at 6,000 and the total number of resettlement farms at 2,000, respectively. The extrapolation factor takes into
account that i) bush encroachment affects roughly half of the commercial farming areas (i.e. factor of 0.5) and
ii) the sample is not representative in terms of interest/activity in BCBU and the activities of the actual farming
community are assumed to occur at 50% intensity (i.e. another factor of 0.5, which yields a total of 0.5 x 0.5 =
0.25). The resulting estimate amounts to close to 100,000 ha under chemical bush control in 2019, which is in
significantly higher than the above estimates of about 67,000 ha and 50,000 ha, respectively. Translated into
farm numbers, this bottom up estimate would mean that an average of 500 ha were chemically treated on about
180 commercial farms in 2019 and an average of 76 ha on about 60 resettlement farms.
0
10 000
20 000
30 000
40 000
50 000
60 000
70 000
80 000
2007 2008 2009 2010 2011 2012 2013 2014 2015 2016 2017 2018 2019
Are
a (h
a)
Estimated area treated chemically derived from NSA import statistics
Aftercareselective (ha)
Bush thinningselective (ha)
De-bushinginsdiscriminate(ha)
3 R
esu
lts

State and Trends of the Namibian Bush Biomass Sector 2019 Page 26 of 51
Table 6: Bottom-up estimate of area under chemical bush control in 2019 based on extrapolation of farm-level survey results.
Chemical bush control 2019 – Bottom-up survey estimate
Farm
typ
e
Tota
l # o
f
resp
on
-
den
ts
# o
f ac
tive
resp
on
-
den
ts
% o
f
resp
on
-
den
ts
Ave
rage
area
trea
ted
(h
a)
Extr
a-
po
lati
on
fact
or
Ass
um
ed
tota
l po
p.
Ass
um
ed
tota
l are
a
(ha)
Commercial farms 138 17 12 500 0.25 6,000 92,337
Resettlement farms 35 4 11 76 0.25 2,000 4,329
Total 96,666
3.1.2.3 MECHANIZED BUSH CONTROL
Mechanized bush control refers to the utilization of large-scale machinery such as excavators, bulldozers and
tractors equipped with special equipment for destroying and possibly harvesting encroacher bush.
Mechanized bush control: Top-down estimate based on figures from service providers
As for chemical bush control services, there is a small number of commercial service providers who offer
mechanized bush control services in Namibia. The annual estimates presented in Figure 9 are based on figures
provided by these service providers for the last 10 years. In addition, an annual 5,000 hectares were assumed to
be under mechanized bush control by individual farmers, e.g. through chain-based techniques. For 2019, it is
estimated that roughly 17,000 hectares were under mechanized bush control.
Figure 9: Estimated annual area under mechanized bush control based on information provided by commercial service providers.
Mechanized bush control: Bottom-up estimate from farm-level survey
Out of the 213 farm-level records, 14 indicated that mechanized bush control was done in 2019. All of these
were commercial farmers, with an average area of 389 ha mechanically bush-thinned. In total, an area of 5,446
ha was reported as mechanically bush-thinned in 2019 by the survey respondents.
Since the surveyed sample cannot be considered representative, extrapolation to the national level can only be
made based on rough assumptions as presented in Table 7. We estimated the total number of commercial farms
at 6,000. The extrapolation factor of 0.25 takes into account that i) bush encroachment affects roughly half of
the commercial farming areas (i.e. factor of 0.5) and ii) the sample is not representative in terms of
interest/activity in BCBU and the activities of the actual farming community are assumed to occur at 50%
intensity (i.e. another factor of 0.5, which yields a total of 0.5 x 0.5 = 0.25). The resulting estimate amounts to
close to 60,000 ha under mechanized bush control in 2019. Translated into farm numbers, this estimate would
mean that an average of 390 ha were under mechanized bush control on about 150 commercial farms in 2019.
-
2,000
4,000
6,000
8,000
10,000
12,000
14,000
16,000
18,000
2010 2011 2012 2013 2014 2015 2016 2017 2018 2019
Are
a (h
a)
Estimated annual area under mechanized bush control
3 R
esu
lts

State and Trends of the Namibian Bush Biomass Sector 2019 Page 27 of 51
Table 7: Bottom-up estimate of area under mechanized bush control in 2019 based on extrapolation of farm-level survey results.
Mechanized bush control 2019 – Bottom-up survey estimate
Farm
typ
e
Tota
l # o
f
resp
on
-
den
ts
# o
f ac
tive
resp
on
-
den
ts
% o
f
resp
on
-
den
ts
Ave
rage
area
trea
ted
(h
a)
Extr
a-
po
lati
on
fact
or
Ass
um
ed
tota
l po
p.
Ass
um
ed
tota
l are
a
(ha)
Commercial farms 138 14 10% 389.29 0.25 6,000 59,239
This is significantly higher than the estimate based on activity figures from service providers, suggesting that
either i) the data from service providers is incomplete; ii) mechanical de-bushing activities by individual farmers
based on relatively low-tech approaches (e.g. chain-based) are actually more widespread than assumed; or iii)
the surveyed sample has a strong bias towards farmers applying mechanized bush control techniques.
3.1.3 Bush Control Follow-Up Treatment/Aftercare
Aftercare, i.e. the follow-up treatment of already bush-controlled areas, is considered a crucial requirement for
sustained success of bush control operations. Based on trade statistics on chemicals imported, we estimated the
potential area under chemical aftercare at about 20,000 ha in 2019 (see subsection 3.1.2.2 above). Here, we
derive an additional estimate from the farm-level survey data.
Out of the 213 farm-level records, 26 indicated that aftercare of previously bush-thinned areas was done in
2019. Out of these 26, 17 were from commercial farms where an average area of 425 ha was treated; 5 from
resettlement farms, where an average area of 10 ha was treated; and 4 from communal farms, where an average
of 5 ha was treated. In total, an area of close to 7,300 ha was reported as follow-up treated in 2019 by the survey
respondents.
Since the surveyed sample cannot be considered representative, extrapolation to the national level can only be
made based on rough assumptions as presented in Table 7. We estimated the total number of commercial farms
at 6,000. The extrapolation factor of 0.25 takes into account that i) bush encroachment affects roughly half of
the commercial farming areas (i.e. factor of 0.5) and ii) the sample is not representative in terms of
interest/activity in BCBU and the activities of the actual farming community are assumed to occur at 50%
intensity (i.e. another factor of 0.5, which yields a total of 0.5 x 0.5 = 0.25). The resulting estimate amounts to
slightly more than 80,000 ha under aftercare in 2019. Of these, an estimated 21,000 ha are treated chemically
(see section 0).
Table 8: Bottom-up estimate of area after-treated in 2019 based on extrapolation of farm-level survey results.
Aftercare 2019 – Bottom-up survey estimate
Farm
typ
e
Tota
l # o
f
resp
on
-
den
ts
# o
f ac
tive
resp
on
-
den
ts
% o
f
resp
on
-
den
ts
Ave
rage
area
trea
ted
(h
a)
Extr
a-
po
lati
on
fact
or
Ass
um
ed
tota
l po
p.
Ass
um
ed
tota
l are
a
(ha)
Commercial farms 138 17 12% 425 0.25 6,000 78,587
Resettlement farms 35 5 14% 10 0.25 2,000 700
Communal farms 24 4 17% 5 0.25 10,000 1,944
Total 197 26 81,231
3.1.4 Permits and Environmental Clearance Certificates
3.1.4.1 HARVESTING PERMITS ISSUED BY DOF
A harvesting permit from the Directorate of Forestry (DoF) is required by law for any tree cutting and/or
harvesting of wood in an area greater than 15 hectares per annum (MAWF/MET, 2016). Accordingly, statistics
derived from harvesting permits issued by DoF could provide an additional estimate on the area under bush
3 R
esu
lts

State and Trends of the Namibian Bush Biomass Sector 2019 Page 28 of 51
control as well as the amounts of bush biomass harvested 10. Such statistics were requested for the reference
year 2019 from DoF. However, such statistics were not readily available for the following reasons:
• DoF permits are paper-based and archived only locally in permit books. DoF officials compile quarterly
statistics for their respective office/area by hand.
• There is no standardized reporting format used by all DoF offices. Some offices submit the statistics in
text form along with their narrative quarterly reports, whereas others submit them in form of (more
easily usable) Excel spreadsheets.
• Levels of disaggregation differ between different DoF offices. Some offices only report bare numbers
of permits issued by permit category (e.g. harvesting, transport, marketing, etc.), whereas others also
disaggregate by the product category harvested. The latter is of crucial importance to be able to extract
meaningful figures with regards to bush control and biomass utilization operations.
• Individual DoF offices submit quarterly permit statistics to the subdivisional level, where they are
supposed to be aggregated by hand and then submitted onward to divisional/national level for further
aggregation. This process is vulnerable to major reporting gaps and inaccuracies. As a result, the
national-level figures are considered patchy and incomplete.
• There is no systematic central archiving of quarterly reports and statistics at DoF head office level in
Windhoek. This means that any request for statistics dating back in time (e.g. as for calendar year 2019
in the present case) needs to be directed to all the relevant local DoF offices.
Given the above, it was not possible to obtain meaningful statistics on bush control and biomass utilization from
the DoF permit system. We consider this a major shortcoming, since the forestry permit system constitutes the
main mechanism to enforce and monitor the implementation of the Forest Act, i.e. to ensure the sustainable
utilization of Namibia’s forestry resources. Possible solutions to strengthen the capturing and reporting on
permit data were discussed with DoF management and corresponding tools were developed.
3.1.4.2 ENVIRONMENTAL CLEARANCE CERTIFICATES
Medium-sized (150 – 5,000 ha) bush harvesting operations require an environmental clearance certificate (ECC)
from the Department of Environmental Affairs (DEA). Large-scale (> 5,000 ha) bush harvesting operations in
addition require a full environmental impact assessment (EIA) as well as an environmental management plan
(EMP). Accordingly, statistics derived from environmental clearance certificates could provide an additional
estimate on the area under bush control as well as the amounts of bush biomass harvested in line with medium-
to large-scale operations. Such statistics were requested for the reference year 2019 from DEA and were not
readily available.
The DEA introduced a digital web-based ECC system in August 2019 (accessible via http://eia.met.gov.na/). Until
then, the ECC process was paper-based and only basic statistics were captured in an Excel spreadsheet. The
latter did not capture the category (e.g. “bush clearing” for the present case) and the related area of each
corresponding project/activity. The only way to extract such statistics retrospectively for 2019 would thus be for
MEFT officials to go through the list of projects certified in 2019, identify the relevant ones via their title and
then extract the areas from each respective report. There are thus currently no ECC statistics related to bush
control available for 2019 and previous years. Fortunately, going forward, this situation can be expected to
change. The new digital system is promising and ECC statistics for the year 2020 and onward will likely be
available relatively easily.
10 Such statistics would likely constitute an upper boundary estimate, since a permit issued for a given area/amount does not mean that the corresponding amount is actually harvested.
3 R
esu
lts
State and Trends of the Namibian Bush Biomass Sector 2019 Page 29 of 51
3.1.5 Bush Control Summary
Summarizing the section on bush control, based on the given assumptions, we estimate that an area of slightly
more than 300,000 ha was under a form of bush control in Namibia in 2019 (see Figure 10). Compared to the
2010 estimate, this corresponds to an annual growth rate of more than 6%. Overall, the area under bush control
over the last 10 years is estimated at close to 2 million ha (550,000 ha chemical, 110,000 ha mechanized,
1,280,000 ha manual/semi-mechanized).
Our estimate is slightly larger than previous estimates. For example, in 2014, Rothauge estimated that 128,000
ha are being treated annually (Rothauge, 2014). The present estimate for 2014 amounts to about 178,000 ha.
Figure 10: Estimated annual area under bush control by method, 2010 – 2019.
Note that we consider this our best estimate based on a combination of primary data from sector stakeholders
and top down estimates as well as a range of rough assumptions. For 2019, the minimum estimates combined
for the different bush control methods amount to about 290,000 ha in total, whereas the maximum estimates
amount to close to 400,000 ha in total (see Figure 12).
Figure 11 below visualizes the different estimates for each major bush control method based on the different
estimation approaches applied. The bottom-up estimate based on farm-level survey data consistently
constitutes the highest estimate, possibly suggesting that the sampling bias is even slightly stronger than
assumed. Overall, however, there are no major outliers, suggesting that the different estimation methods yield
consistent and plausible results.
It is important to note that the bush control intensity (i.e. the amount of bush biomass removed) can vary
significantly between the different bush control methods and purposes. For example, for many farmers
producing charcoal the primary aim is biomass utilization whereas bush control is only a secondary target. While
for manual/semi-mechanized bush control, a harvesting rate of 50% of the harvestable biomass was assumed,
this rate is assumed to be much higher for mechanized and chemical bush control. In case of the latter, in turn,
the bush biomass is not necessarily being harvested and further utilized. For thorough interpretation, the
indicator “are under bush control” thus would need to be considered in conjunction with figures on the bush
biomass destroyed/harvested.
- 20,000 40,000 60,000 80,000
100,000 120,000 140,000 160,000 180,000 200,000 220,000 240,000 260,000 280,000 300,000 320,000
2010 2011 2012 2013 2014 2015 2016 2017 2018 2019
Are
a (h
a)
Estimated annual area under bush control by methodSources: NSA Trade Statistics, NCA, Private Sector
Manual/semi-mechanized(top-downestimate)
Mechanized(primary data)
Chemical(primary data)
3 R
esu
lts

State and Trends of the Namibian Bush Biomass Sector 2019 Page 30 of 51
Figure 11: Different estimates of the area under bush control in 2019 by bush control method.
-
25 000.00
50 000.00
75 000.00
100 000.00
125 000.00
150 000.00
175 000.00
200 000.00
225 000.00
250 000.00
Chemical Mechanized Manual/Semi-Mechanized
Estimated area under bush control in 2019 by bush control and estimation method
Primary
Bottom-Up
Top-Down
Figure 12: Combinations of the respective minimum and maximum estimates of area under bush control per bush control method for 2019.
48 613
96 66617 153
59 239
222 295
242 374
-
50 000
100 000
150 000
200 000
250 000
300 000
350 000
400 000
Min Max
2019 minimum and maximum estimates
Manual/Semi-Mechanized
Mechanized
Chemical
3 R
esu
lts

State and Trends of the Namibian Bush Biomass Sector 2019 Page 31 of 51
3.2 Market and Business Development
3.2.1 Charcoal
3.2.1.1 CHARCOAL EXPORTS
The charcoal industry is the largest and best developed subsector of the Namibian bush biomass sector. Virtually
all charcoal produced in Namibia is exported, making Namibia one of the largest global exporters of wood
charcoal, consistently ranging among the top ten exporters during the past decade. Annual charcoal exports as
recorded in official Namibian trade statistics have almost quadrupled over the past 15 years and stood at
185,820 tons worth 662.5 million N$ in 2019 (see Figure 13 and Figure 14).
Figure 13: Annual volume of wood charcoal exports by destination 2004 - 2019. Source: NSA Trade Statistics.
Figure 14: Annual value of wood charcoal exports by destination 2004 - 2019. Source: NSA Trade Statistics.
The major export destinations for Namibian charcoal are South Africa and Europe. Interestingly, the 2019 wood
charcoal exports to Europe accounted for two thirds (66%) of the total export value (left side of Figure 15), but
only for 43% of the total export volume. Conversely, the value of the 2019 wood charcoal exports to South Africa
is about 28% of the total, whereas the volume is about 53% (see Figure 15). However, note that these figures
are not fully consistent with estimates by the Namibia Charcoal Association (NCA), which estimates that a larger
20 000
40 000
60 000
80 000
100 000
120 000
140 000
160 000
180 000
200 000
2004 2005 2006 2007 2008 2009 2010 2011 2012 2013 2014 2015 2016 2017 2018 2019
Exp
ort
vo
lum
e (t
on
s)
Volume of wood charcoal exports by destination (tons)Source: NSA Trade Statistics
Other
South Africa
Europe
100
200
300
400
500
600
700
2004 2005 2006 2007 2008 2009 2010 2011 2012 2013 2014 2015 2016 2017 2018 2019
Exp
ort
val
ue
(mill
ion
NA
D)
Value of wood charcoal exports by destination (million NAD)Source: NSA Trade Statistics
Other
South Africa
Europe
3 R
esu
lts

State and Trends of the Namibian Bush Biomass Sector 2019 Page 32 of 51
share of about 55-60% (i.e. at least 100,000 tons) of Namibian charcoal were exported directly to Europe in
2019.
Figure 15: Relative value and volume of charcoal exports by destination 2004 – 2019. Source: NSA Trade Statistics.
This inverse relationship between volume and value suggests that significantly higher prices can be achieved
from exports to Europe than to South Africa and/or that the quality of wood charcoal exported to Europe is
higher than the one exported to South Africa. According to the 2019 NSA trade statistics, a ton of charcoal
exported to South Africa was on average worth 1,872 N$, whereas the value for export to Europe was almost
three times higher with 5,522 N$ per ton. The reason is that i) mainly the raw product is exported to South
Africa, where further value addition takes place and ii) most of the FSC-certified wood charcoal is directly
exported to Europe and elsewhere, whereas the major recipient of non-certified wood charcoal is South Africa.
Figure 16: Export value per ton of wood charcoal per destination 2004 – 2019. Source: NSA Trade Statistics.
Going forward, all the above figures suggest that there is potential for further growth in the charcoal subsector.
In his 2014 baseline assessment of the Namibian bush biomass sector, Rothauge (2014) stated that “the demand
for charcoal, internationally, far exceeds the supply”, suggesting that there is no threat of saturation in the global
market. It seems, however, that this situation is about to change. According to various charcoal processors, 2020
has been a year of oversupply and they could not buy all the charcoal which had been produced on farms. The
next sector indicator update for 2020 may thus show a stagnation/plunge in charcoal export figures. An
0%
10%
20%
30%
40%
50%
60%
70%
80%
90%
100%
20
04
20
05
20
06
20
07
20
08
20
09
20
10
20
11
20
12
20
13
20
14
20
15
20
16
20
17
20
18
20
19
Value of charcoal exports by destination
Europe South Africa Other
-
1 000
2 000
3 000
4 000
5 000
6 000
2004 2005 2006 2007 2008 2009 2010 2011 2012 2013 2014 2015 2016 2017 2018 2019
NA
D
Export value per ton of wood charcoal by destination (NAD)Source: NSA Trade Statistics
Other
South Africa
Europe
0%
10%
20%
30%
40%
50%
60%
70%
80%
90%
100%
20
04
20
05
20
06
20
07
20
08
20
09
20
10
20
11
20
12
20
13
20
14
20
15
20
16
20
17
20
18
20
19
Volume of charcoal exports by destination
Europe South Africa Other
3 R
esu
lts

State and Trends of the Namibian Bush Biomass Sector 2019 Page 33 of 51
important question is whether this is a longer-term development or rather a short-lived exception related to the
Covid-19 pandemic and related global uncertainties.
3.2.1.2 FSC CERTIFICATION
The total FSC-certified area was determined based on the sizes and entry dates of individual farms and farms
that are part of FSC group schemes. All these farms are commercial farms which were certified for bush biomass
production (mainly charcoal, but also products such as bushbloks). As of mid-2020, the certified area amounted
to almost 1.6 million ha, corresponding to 270 farms. Note that, given the recent rapid increase in certifications,
the actual number by the end of 2020 is likely to be still higher than that.
Figure 17: Total FSC-certified area in Namibia 2010 - 2020. Sources: FSC, FSC group schemes.
Figure 18: Annual estimated export volumes of FSC-certified vs. uncertified wood charcoal, 2014-2019. Sources: NCA, NSA Trade Statistics.
The estimated amount of FSC-certified charcoal vs. uncertified charcoal is provided in Figure 18. The
development between 2014 and 2019 shows a clear trend towards more FSC-certified charcoal. In 2019, FSC-
certified charcoal made up about two thirds (65%) of charcoal exports, whereas about one third (35%) was
uncertified.
Figure 19 visualizes the spatial distribution of FSC-certified farms in Namibia. However, note that the farms
depicted only include the ones which participated in the farm-level survey (69 out of the 270+ FSC-certified
farms in Namibia as of 2020).
-
200,000
400,000
600,000
800,000
1000,000
1200,000
1400,000
1600,000
2010 2011 2012 2013 2014 2015 2016 2017 2018 2019 2020
FSC
-cer
tifi
ed a
rea
(ha)
Total FSC-certified area in NamibiaSource: FSC, FSC group schemes
-
20,000
40,000
60,000
80,000
100,000
120,000
140,000
160,000
180,000
200,000
2014 2015 2016 2017 2018 2019
Exp
ort
vo
lum
e (t
on
s)
Volume of certified vs. non-certified wood charcoal exported, 2014 - 2019Sources: NCA, NSA
non-certified
FSC
3 R
esu
lts

State and Trends of the Namibian Bush Biomass Sector 2019 Page 34 of 51
Figure 19: Distribution of FSC-certified charcoal producers surveyed in 2020. Note that the map does not depict all FSC-certified farms in Namibia, but only surveyed FSC-certified farms.
3.2.1.3 NAMIBIA CHARCOAL ASSOCIATION
The charcoal subsector is largely organized under the Namibia Charcoal Association (NCA; formerly known as
Namibia Charcoal Producers Association). Since 2016, its membership (mainly individual farmers/charcoal
producers) has grown steadily (see Figure 20).
Figure 20: Number of individual NCA members, 2016 – 2020. Source: NCA, August 2020.
282
587
768
954
1 167
0
200
400
600
800
1 000
1 200
2016 2017 2018 2019 2020
NCA Membership, 2016 - 2020Source: NCA
3 R
esu
lts

State and Trends of the Namibian Bush Biomass Sector 2019 Page 35 of 51
Most of the 270 (mid-2020 figure) FSC-certified charcoal producers (i.e. farmers certified for FSC-compliant
charcoal production) are also NCA members.
Figure 21 below visualizes the spatial distribution of the surveyed farms with NCA membership. Out of 76
farmers who are NCA member, 70 (92%) indicated that they produced charcoal in 2019 and 69 are also FSC-
certified charcoal producers. In turn, among the 137 survey participants who are not NCA members, 12 (9%)
indicated that they produced charcoal in 2019 and 5 are FSC-certified charcoal producers.
Figure 21: Distribution of NCA members surveyed in 2020. Note that the map does not depict all NCA members in Namibia, but only surveyed NCA members.
Based on the NCA membership figures and the average production figures for FSC-certified and uncertified
charcoal, the number of uncertified charcoal producers was estimated at more than 800 in 2019 (see Figure 22).
Most of the latter (more than 700) are NCA members. While these figures seem high, note that not every farmer
produces charcoal on an annual basis, i.e. the number of farmers producing charcoal in a given year is likely to
be significantly lower, particular in case of uncertified charcoal producers.
3 R
esu
lts

State and Trends of the Namibian Bush Biomass Sector 2019 Page 36 of 51
Figure 22: Estimated number of charcoal producers, 2016 - 2019. Sources: NCA, FSC, NSA Trade Statistics.
Concurrently, the number of charcoal processors has also increased steadily (see Figure 23).
Figure 23: Number of charcoal processors between 2014 and 2020. Source: NCA.
0
100
200
300
400
500
600
700
800
900
1000
1100
1200
2016 2017 2018 2019
Estimated number of charcoal producers by certification and membership statusSource: NCA, FSC, NSA Trade Statistics
uncertified; non-NCA
uncertified; NCA
FSC-certified; non-NCA
FSC-certified; NCA
9 911 11
13
26
31
0
5
10
15
20
25
30
35
2014 2015 2016 2017 2018 2019 2020
Number of charcoal processors, 2014 - 2020
3 R
esu
lts

State and Trends of the Namibian Bush Biomass Sector 2019 Page 37 of 51
3.2.2 Bush-based Animal Feed
Bush-based animal feed is a promising way of utilizing encroacher bush. In drought years, it seems relatively
common that farmers add encroacher bush to their livestock feed, albeit production happens predominantly for
own use and hardly in a commercial way thus far.
The need for animal feed in drought years is illustrated by the lucerne imports, which peak in years following
poor rainy seasons and saw a sharp increase in the drought year 2019. The average lucerne imports for the years
2013 to 2018 were 7,700 tons worth 22 million per annum and skyrocketed to 60,000 tons worth more than 150
million NAD in 2019. Virtually all lucerne imports originate from South Africa. These figures illustrate that, at
least in drought years, bush-based animal feed has a significant commercial potential.
Figure 24: Annual trade volume (tons) for lucerne 2004 - 2019. Source: NSA Trade Statistics.
Bush-based animal feed production: Bottom-up estimate from farm-level survey
Out of the 213 farm-level records, 51 indicated that they produced bush feed in 2019 (see Table 9). In total, an
amount of about 7,700 tons of bush feed was produced in 2019 by the survey respondents. Since the surveyed
sample cannot be considered representative, extrapolation to the national level can only be made based on
rough assumptions as presented in Table 9. We estimated the total number of commercial farms at 6,000, the
total number of resettlement farms at 2,000 and the total number of communal farms at 10,000, respectively.
The extrapolation factor takes into account that i) bush encroachment affects roughly half of the commercial
farming areas (i.e. factor of 0.5) and ii) the sample is not representative in terms of interest/activity in BCBU and
the activities of the actual farming community are assumed to occur at 50% intensity (i.e. another factor of 0.5,
which yields a total of 0.5 x 0.5 = 0.25). The resulting estimate amounts to slightly more than 100,000 tons of
bush feed produced in 2019, predominantly for own use. This seems quite high, but not impossible, given the
extreme drought condition in 2019. However, note that particularly the estimates for the resettlement and
communal farms are associated with a high uncertainty as the respective sample sizes are very low. Translated
into commercial farm numbers, this estimate would mean that an average of 180 tons of bush feed were
produced on about 450 commercial farms in 2019.
10 000
20 000
30 000
40 000
50 000
60 000
2004 2005 2006 2007 2008 2009 2010 2011 2012 2013 2014 2015 2016 2017 2018 2019
Trad
e vo
lum
e (t
on
s)
Lucerne imports and exports - Trade volume (tons)Source: NSA Trade Statistics
Import
Export
3 R
esu
lts

State and Trends of the Namibian Bush Biomass Sector 2019 Page 38 of 51
Table 9: Bottom-up estimate of bush-based animal feed produced in 2019 based on extrapolation of farm-level survey results.
Bush feed production 2019
Farm
typ
e
Nu
mb
er
of
resp
on
de
nts
Nu
mb
er
of
acti
ve
resp
on
de
nts
Pe
rce
nta
ge
amo
ng
resp
on
de
nts
Ave
rage
pro
du
ctio
n
(t)
Extr
apo
lati
on
fact
or
Ass
um
ed
tota
l p
op
ula
tio
n
Ass
um
ed
tota
l am
ou
nt
(t)
Commercial farms 138 42 30% 176 0.25 6,000 80,348
Resettlement farms 35 6 17% 19 0.25 2,000 1,629
Communal farms 24 3 13% 67 0.25 10,000 20,938
Total 102,914
Based on the assumption that a cattle was fed about 6 kg of bush feed daily over a period of 9 months (March
to December) in the drought year 2019, the estimated amount of bush feed produced could in theory have
sustained between 64,000 (estimate referring to readily-mixed bush feed with 50% bush fibre) and 127,000
(estimate referring to bush fibre only, before mixing 50:50 with other supplements) heads of cattle.
Seven respondents (6 commercial farmers and 1 resettlement farmer) further indicated that they also sold bush
feed at prices between 2,000 and 2,200 NAD per ton. In total, about 580 tons of bush feed worth almost 1.3
million NAD were reported as sold by these 7 farmers 11. Based on the same assumptions as above, extrapolation
of these values yields a total estimate of almost 6,500 tons of bush feed being sold in 2019, corresponding to an
estimated value of 14 million NAD. Again, given the small sample, these estimated need to be taken with care
and are associated with high uncertainties. However, while seeming high, these figures are small compared to
the 2019 lucerne import figures (see Figure 24).
Table 10: Bottom-up estimate of bush-based animal feed sold in 2019 based on extrapolation of farm-level survey results.
Bushfeed sales 2019
Farm
typ
e
# o
f
resp
on
de
nts
# o
f ac
tive
resp
on
de
nts
Pe
rce
nta
ge
amo
ng
resp
on
de
nts
Ave
rage
so
ld
(t)
Extr
apo
lati
on
fact
or
Ass
um
ed
to
tal
po
pu
lati
on
Esti
mat
ed
tota
l am
ou
nt
(t)
Commercial farms 138 6 4% 91 0.25 6,000 5,902
Resettlement farms 35 1 3% 38 0.25 2,000 543
Total 6,445
Note that the above estimates can be assumed to be exceptionally high due to the extreme drought conditions
in 2019. A 2020 update based on a farm-level survey would thus be expected to yield significantly lower
estimates and could serve to consolidate the present estimates and underlying assumptions.
This would be in line with a recent survey in 2020 by Ideal-X Consultants among 86 respondents involved in bush
feed production. While most respondents produced bush feed in 2019, most of them discontinued production
in 2020. They indicated that the primary aim of bush feed production in 2019 was survival of their livestock
rather than income generation.
11 While the survey respondents were not asked about whether they are registered commercial bushfeed producers, most of the seven farmers who indicated that they sold bushfeed are assumed not to be registered. According to experts in the field of bushfeed, there were only 6 registered bushfeed producers in Namibia in 2019.
3 R
esu
lts

State and Trends of the Namibian Bush Biomass Sector 2019 Page 39 of 51
3.2.3 Other Bush Biomass Products and Value Chains
Wood chips/pellets for industrial combustion
Wood chips can be used for industrial combustion. Currently, there are only two major users of woodchips in
Namibia: Ohorongo Cement and NamBreweries. The annual amount of woodchips produced was estimated
based on data provided by their suppliers. For 2019, the estimate of woodchips produced and commercially
traded amounts to 34,000 tons.
Figure 25: Estimated amount of woodchips produced and commercially traded, 2014-2019. Source: Private sector.
None of the respondents of the farm-level survey reported that they produced or sold any woodchips or -pellets
in 2019. Therefore, no estimate on this commodity can be derived from the farm-level survey.
Firewood
Out of the 213 farm-level records, 39 indicated that they produced firewood for own use in 2019 (see Table 11).
Since the surveyed sample cannot be considered representative, extrapolation to the national level can only be
made based on rough assumptions as presented in Table 11. We estimated the total number of commercial
farms at 6,000, the total number of resettlement farms at 2,000 and the total number of communal farms at
10,000, respectively. The extrapolation factor considers that bush encroachment affects roughly half of the
farming areas (i.e. factor of 0.5). Other than that, we see no apparent reason why the survey sample should be
biased towards the production of firewood from encroacher bush. The resulting overall estimate amounts to
slightly more than 120,000 tons of firewood produced from encroacher bush for own use in 2019. This is much
lower than the estimate of 440,000 tons of firewood harvested for own consumption cited by Rothauge (2014).
However, the latter refers not only to firewood from encroacher bush, but any firewood.
Table 11: Bottom-up estimate of firewood produced from encroacher bush for own use in 2019 based on extrapolation of farm-level survey results.
Firewood production 2019 - own use
Farm
typ
e
# o
f
resp
on
den
ts
# o
f ac
tive
re
spo
nd
ents
Per
cen
tage
amo
ng
resp
on
den
ts
Ave
rage
pro
du
ctio
n (
t)
Extr
apo
lati
on
fact
or
Ass
um
ed
tota
l
po
pu
lati
on
Ass
um
ed
tota
l am
ou
nt
(t)
Commercial farms 138 20 14% 8 0.50 6,000 3,552
Resettlement farms 35 10 29% 18 0.50 2,000 5,115
-
5 000
10 000
15 000
20 000
25 000
30 000
35 000
40 000
45 000
50 000
2014 2015 2016 2017 2018 2019
Wo
od
chip
s p
rod
uce
d (
ton
s)
Estimated amount of woodchips produced (tons)Source: Private sector
3 R
esu
lts

State and Trends of the Namibian Bush Biomass Sector 2019 Page 40 of 51
Communal farms 24 9 38% 60 0.50 10,000 113,116
Total 121,783
In terms of firewood sales, out of the 213 farm-level records, 33 indicated that they produced firewood for sale
in 2019 (see Table 12). The resulting overall estimate is based on the same assumptions as above and amounts
to slightly more than 50,000 tons of firewood produced from encroacher bush sold in 2019. This is more than
the estimate of 45,000 tons of firewood sold formally per year as cited by Rothauge (2014). Note that the
estimates for resettlement and communal farms are associated with high uncertainties due to very low sample
sizes.
Table 12: Bottom-up estimate of firewood produced from encroacher bush sold in 2019 based on extrapolation of farm-level survey results.
Firewood production 2019 - sale
Farm
typ
e
# o
f
resp
on
den
ts
# o
f ac
tive
re
spo
nd
ents
Per
cen
tage
amo
ng
resp
on
den
ts
Ave
rage
pro
du
ctio
n (
t)
Extr
apo
lati
on
fact
or
Ass
um
ed
tota
l
po
pu
lati
on
Ass
um
ed
tota
l am
ou
nt
(t)
Commercial farms 138 28 20% 71 0.50 6,000 43,109
Resettlement farms 35 3 9% 69 0.50 2,000 5,914
Communal farms 24 2 8% 7 0.50 10,000 2,917
Total 51,940
According to the farm-level survey, average firewood prices per ton range between 900 NAD on resettlement
farms (the same value was assumed for communal farms, since no meaningful value was indicated by the
corresponding respondents) and 1,400 NAD. Based on these prices, the total value of the bush-based firewood
sold in 2019 is estimated at 70 million NAD.
3 R
esu
lts
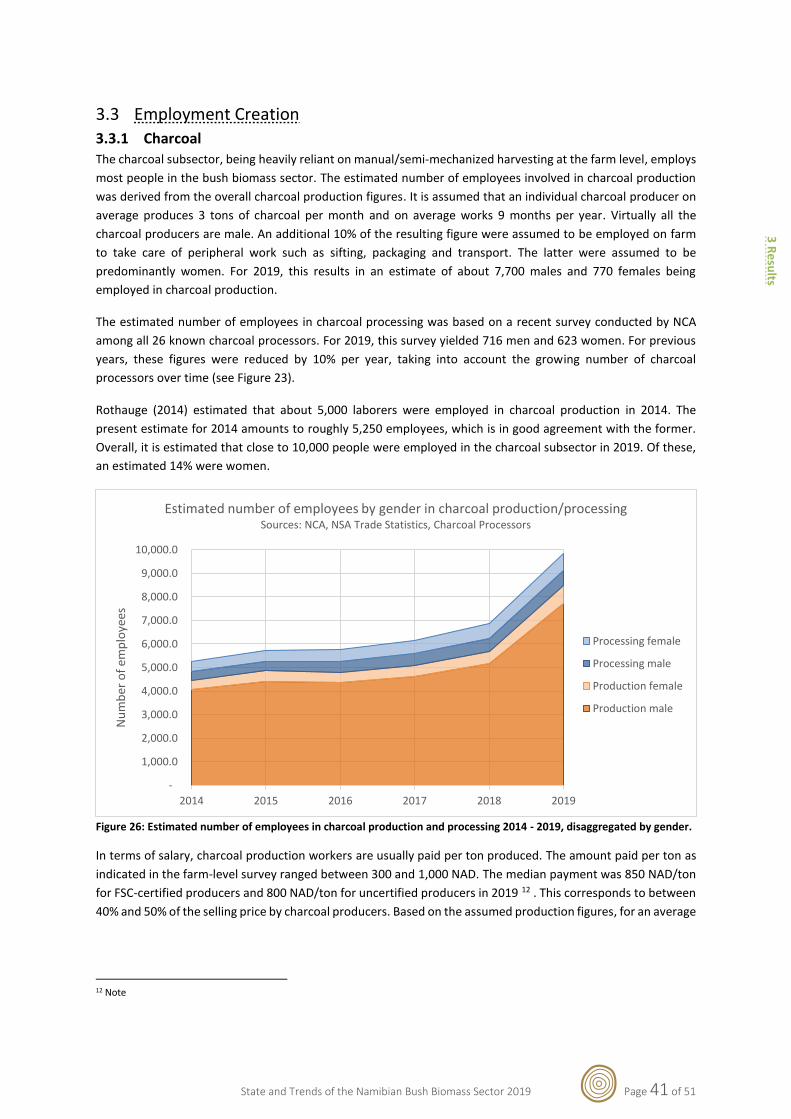
State and Trends of the Namibian Bush Biomass Sector 2019 Page 41 of 51
3.3 Employment Creation
3.3.1 Charcoal The charcoal subsector, being heavily reliant on manual/semi-mechanized harvesting at the farm level, employs
most people in the bush biomass sector. The estimated number of employees involved in charcoal production
was derived from the overall charcoal production figures. It is assumed that an individual charcoal producer on
average produces 3 tons of charcoal per month and on average works 9 months per year. Virtually all the
charcoal producers are male. An additional 10% of the resulting figure were assumed to be employed on farm
to take care of peripheral work such as sifting, packaging and transport. The latter were assumed to be
predominantly women. For 2019, this results in an estimate of about 7,700 males and 770 females being
employed in charcoal production.
The estimated number of employees in charcoal processing was based on a recent survey conducted by NCA
among all 26 known charcoal processors. For 2019, this survey yielded 716 men and 623 women. For previous
years, these figures were reduced by 10% per year, taking into account the growing number of charcoal
processors over time (see Figure 23).
Rothauge (2014) estimated that about 5,000 laborers were employed in charcoal production in 2014. The
present estimate for 2014 amounts to roughly 5,250 employees, which is in good agreement with the former.
Overall, it is estimated that close to 10,000 people were employed in the charcoal subsector in 2019. Of these,
an estimated 14% were women.
Figure 26: Estimated number of employees in charcoal production and processing 2014 - 2019, disaggregated by gender.
In terms of salary, charcoal production workers are usually paid per ton produced. The amount paid per ton as
indicated in the farm-level survey ranged between 300 and 1,000 NAD. The median payment was 850 NAD/ton
for FSC-certified producers and 800 NAD/ton for uncertified producers in 2019 12 . This corresponds to between
40% and 50% of the selling price by charcoal producers. Based on the assumed production figures, for an average
12 Note
-
1,000.0
2,000.0
3,000.0
4,000.0
5,000.0
6,000.0
7,000.0
8,000.0
9,000.0
10,000.0
2014 2015 2016 2017 2018 2019
Nu
mb
er o
f em
plo
yees
Estimated number of employees by gender in charcoal production/processingSources: NCA, NSA Trade Statistics, Charcoal Processors
Processing female
Processing male
Production female
Production male
3 R
esu
lts

State and Trends of the Namibian Bush Biomass Sector 2019 Page 42 of 51
charcoal production worker this equates to an average monthly salary of 2,550 NAD and an annual salary of
about 23,000 NAD in 2019.
3.3.2 Other
Bush feed
According to a recent survey on bush feed, farmers who produced bush feed in 2019 on average employed two
additional laborers for this work, virtually all of them male. Based on the estimates on bush feed produced in
2019 (see section 3.2.2), roughly 450 commercial farmers engaged in production in 2019. This results in an
estimated 900 additional farm-level jobs in 2019 for bush feed production, predominantly for own use. Note
that resettlement and communal farms are omitted here, since the reported quantities produced on these farms
are much lower than on commercial farms.
According to a recent survey on bush feed, there were 6 registered bush-feed producers in 2019. On average,
each of these employs 6 people, resulting in 36 employees with registered bush feed producers in 2019.
In total, this bring the estimate of people employed in bush feed production in 2019 to close to 1,000. However,
note that 2019 was an exceptional year in terms of bush feed production. It is thus unlikely that the same number
of people will be employed in bush feed production in 2020.
Firewood
It is assumed that most of the cutting of bush-based firewood is done by manual/semi-mechanized means and
that a worker can produce on average 15 tons of firewood per month (in line with the previous assumption that
a charcoal worker has to cut 15 tons of wood to produce 3 tons of charcoal per month at a commonly applied
wood: charcoal conversion rate of 5:1). Assuming that he works on average 9 months per year, this means a
production of 135 tons per year. For the 2019 estimate of more than 50,000 tons of bush-based firewood sold,
this equates to roughly 380 employees for commercial firewood production in 2019. It is assumed that virtually
all of these are male.
BCBU-related service providers
There is a limited number of companies providing commercial BCBU-related services such as bush-thinning or
biomass harvesting. Their number of employees over time was derived from estimates on the respective number
of employees and the year of inception. For 2019, the estimated total number of employees is 121.
3 R
esu
lts

State and Trends of the Namibian Bush Biomass Sector 2019 Page 43 of 51
Figure 27: Estimated number of employees with BCBU-related service providers, 2010-2019.
Summarizing the above, it is estimated that the Namibian bush biomass sector employed about 11,300 people
in 2019. Three quarters of these are estimated to be employed at the farm level in line with charcoal production.
Altogether, the charcoal subsector is estimated to account for 87% of the sector employment.
Figure 28: Distribution of estimated employment in the BCBU sector in 2019 by subsector.
3.4 Financial Products Table 13 provides an overview of financial service providers in Namibia and their respective offerings specific to
agricultural and/or BCBU operations. The only two identified financial service providers with tailored products
for BCBU-related financing are AgriBank and FNB.
0
50
100
150
200
250
300
2010 2011 2012 2013 2014 2015 2016 2017 2018 2019
# o
f em
plo
yees
Estimate of number of employees with BCBU service providers
Employees Others
Employees N-BiGmembers
8488; 75%
1339; 12%
946; 9%
380; 3% 121; 1%
Distribution of estimated employment in the BCBU sector in 2019 by subsector
Charcoal production
Charcoal processing
Bushfeed production
Firewood production
BCBU service providers
3 R
esu
lts
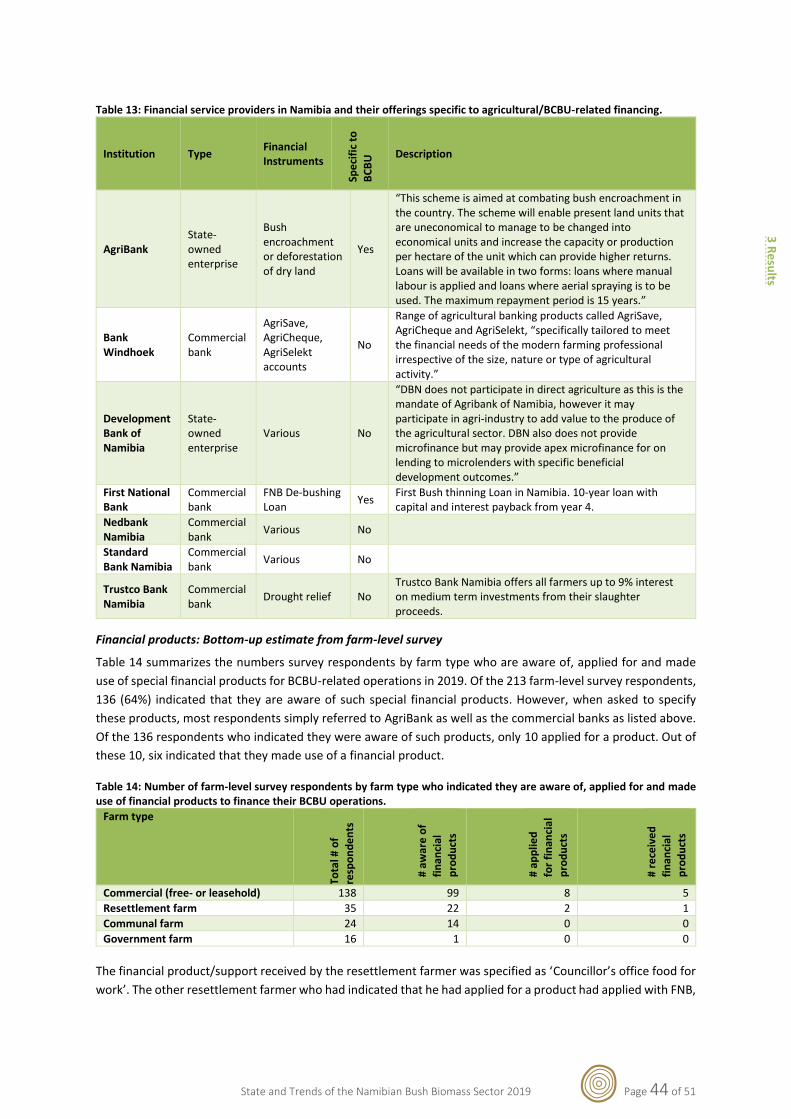
State and Trends of the Namibian Bush Biomass Sector 2019 Page 44 of 51
Table 13: Financial service providers in Namibia and their offerings specific to agricultural/BCBU-related financing.
Institution Type Financial Instruments
Spe
cifi
c to
BC
BU
Description
AgriBank State-owned enterprise
Bush encroachment or deforestation of dry land
Yes
“This scheme is aimed at combating bush encroachment in the country. The scheme will enable present land units that are uneconomical to manage to be changed into economical units and increase the capacity or production per hectare of the unit which can provide higher returns. Loans will be available in two forms: loans where manual labour is applied and loans where aerial spraying is to be used. The maximum repayment period is 15 years.”
Bank Windhoek
Commercial bank
AgriSave, AgriCheque, AgriSelekt accounts
No
Range of agricultural banking products called AgriSave, AgriCheque and AgriSelekt, “specifically tailored to meet the financial needs of the modern farming professional irrespective of the size, nature or type of agricultural activity.”
Development Bank of Namibia
State-owned enterprise
Various No
“DBN does not participate in direct agriculture as this is the mandate of Agribank of Namibia, however it may participate in agri-industry to add value to the produce of the agricultural sector. DBN also does not provide microfinance but may provide apex microfinance for on lending to microlenders with specific beneficial development outcomes.”
First National Bank
Commercial bank
FNB De-bushing Loan
Yes First Bush thinning Loan in Namibia. 10-year loan with capital and interest payback from year 4.
Nedbank Namibia
Commercial bank
Various No
Standard Bank Namibia
Commercial bank
Various No
Trustco Bank Namibia
Commercial bank
Drought relief No Trustco Bank Namibia offers all farmers up to 9% interest on medium term investments from their slaughter proceeds.
Financial products: Bottom-up estimate from farm-level survey
Table 14 summarizes the numbers survey respondents by farm type who are aware of, applied for and made
use of special financial products for BCBU-related operations in 2019. Of the 213 farm-level survey respondents,
136 (64%) indicated that they are aware of such special financial products. However, when asked to specify
these products, most respondents simply referred to AgriBank as well as the commercial banks as listed above.
Of the 136 respondents who indicated they were aware of such products, only 10 applied for a product. Out of
these 10, six indicated that they made use of a financial product.
Table 14: Number of farm-level survey respondents by farm type who indicated they are aware of, applied for and made use of financial products to finance their BCBU operations.
Farm type
Tota
l # o
f
resp
on
de
nts
# aw
are
of
fin
anci
al
pro
du
cts
# ap
plie
d
for
fin
anci
al
pro
du
cts
# re
ceiv
ed
fin
anci
al
pro
du
cts
Commercial (free- or leasehold) 138 99 8 5
Resettlement farm 35 22 2 1
Communal farm 24 14 0 0
Government farm 16 1 0 0
The financial product/support received by the resettlement farmer was specified as ‘Councillor’s office food for
work’. The other resettlement farmer who had indicated that he had applied for a product had applied with FNB,
3 R
esu
lts

State and Trends of the Namibian Bush Biomass Sector 2019 Page 45 of 51
but not received/made use of the financial product. Of the remaining five products, which were all received by
commercial farmers, one was linked to FNB and one to Bank Windhoek. For the remaining three, the financial
institution was not specified.
Extrapolation of the figures for the commercial farmers to the national level was done based on rough
assumptions: We estimated the total number of commercial farms at 6,000. The extrapolation factor of 0.25
takes into account that i) bush encroachment affects roughly half of the commercial farming areas (i.e. factor of
0.5) and ii) the sample is not representative in terms of interest/activity in BCBU and the activities of the actual
farming community are assumed to occur at 50% intensity (i.e. another factor of 0.5, which yields a total of 0.5
x 0.5 = 0.25). The resulting estimate amounts to about 90 commercial farmers having applied for financial
products to finance their BCBU-related operations and between 50 and 60 eventually having made use of a
financial products from a formal financial institution in 2019. No corresponding figures could be derived for
resettlement farmers.
The above figures suggest that the financial instruments in place for BCBU-related operations are still hardly
accepted/made use of.
3.5 Research and Development While the scale and impact of bush encroachment and BCBU are large and not only relevant for Namibia,
dedicated research to address the numerous open questions is scarce. Within Namibia, NUST and UNAM are
active in conducting corresponding research. A range of relevant research projects was funded under the first
SASSCAL research portfolio between 2013 and 2018, with these two institutions being the main funding
recipients in Namibia. The second SASSCAL research portfolio is slated to begin in 2021 and will likely include
research projects of relevance for BCBU.
Currently ongoing projects include
• Biomass Utilization through Sustainable Harvest (BUSH) project. The current project phase is running
from 2018 until 2021 and is co-financed by the MEFT/GIZ BCBU project and NUST. The project focuses
on applied research towards technology and capacity development for sustainable BCBU in Namibia
through various sub-projects. The long-term vision is to establish a center of excellence with regards to
BCBU-related knowledge and research at NUST.
• Options for Sustainable Land Use Adaptations in Savannah Systems (ORYCS). The project is running
from 2018 until 2022 and is funded by the German Federal Ministry of Education and Research. The
project aims to scientifically assess wildlife-based land use options in Namibia based on a combination
of field-based, experimental, remote sensing and modelling approaches.
Table 15: Past and ongoing research projects relevant for BCBU in Namibia.
Title PI Institution Year Start
Year End
Weblink
The impacts of fire on biodiversity and ecosystem processes in woodland savannah
Dave Joubert/ Ben Strohbach
NUST 2013 2018 http://www.sasscal.org/tasks
Development of a national forest monitoring programme
Nichola Knox NUST 2013 2018 http://www.sasscal.org/tasks
Forest regeneration, growth rates, threads, and trends in different forest types
Vera de Cauwer NUST 2013 2018 http://www.sasscal.org/tasks
Landscape literacy Ibo Zimmermann NUST 2013 2018 http://www.sasscal.org/tasks
3 R
esu
lts

State and Trends of the Namibian Bush Biomass Sector 2019 Page 46 of 51
Title PI Institution Year Start
Year End
Weblink
Impact of bush encroachment on ground water resources
Dave Joubert UHH 2013 2018 http://www.sasscal.org/tasks
Vegetation survey of Namibia
Ben Strohbach NUST 2013 2018 http://www.sasscal.org/tasks
Adaptation to climate change impacts in mixed crop-livestock production systems in southern Africa
Moses Cho CSIR 2013 2018 http://www.sasscal.org/tasks
OPTIMASS Florian Jeltsch, Niels Blaum
Uni Potsdam
2014 2018 http://www.optimass.org/fileadmin/projects/optimass/OPTIMASS_broschure_final_low.pdf
ORYCS Blaum/ Hauptfleisch
Uni Postdam/ NUST
2018 2022 https://www.orycs.org/
BUSH Evert Strydom NUST 2018 2021 http://bush.nust.na/
SASSCAL Research Portfolio 2
2021 2024 http://www.sasscal.org/
There are still many open questions with regards to the drivers, dynamics and impacts of bush encroachment
and BCBU in the Namibian context. In particular, the various environmental impacts of bush encroachment and
BCBU have not yet been thoroughly quantified in Namibia. For some impacts, such as changes in ecosystem-
level carbon sinks, not only the magnitude but even the direction of the change is uncertain and subject of
controversy. This makes consistent policy-making difficult, particularly with regards to the establishment of
international value chains. Therefore, there is urgent need for further research to answer these questions and
accurately quantify the impacts of bush encroachment and BCBU in Namibia.
3 R
esu
lts

State and Trends of the Namibian Bush Biomass Sector 2019 Page 47 of 51
4 Sustainability and Consolidation of Sector M&E System
4.1.1 Future Sector Monitoring
In order to continuously capture the temporal development and trends of the Namibian bush biomass sector, it
is recommended that the status of all indicators be updated once per year for the respective previous year.
Shorter update intervals are not recommended since this would add little additional value and would have a
high cost: benefit ratio. For the near future (at least the next five years), it is recommended that these updates,
i.e. data collection, entry, analysis, and dissemination, be coordinated by the DAS. Most indicators related to the
charcoal subsector are monitored by the NCA and can be shared in annually aggregated form.
4.1.1.1 DATA COLLECTION
The current approach to data collection combined a farm-level survey for bottom-up data and targeted
collection of top-down and primary data from key stakeholders. This proved useful in that it provided various
independent estimates for numerous indicators, thus allowing for some degree of triangulation and consistency-
checking of assumptions.
Table 16 lists the main sources for each indicator. Corresponding contacts are stored in the survey database
which was handed over to the DAS. Note that the status of most of the indicators could be estimated/derived
from top-down and primary data from key stakeholders only but would then not provide the current level of
redundancy in terms of different estimates. Also, for some subsectors which are not (yet) organized and/or
formalized (e.g. bush-based animal feed), there is currently no other source than farm-level surveys.
For future farm-level surveys, the survey database established in line with the present assignment is expected
to serve as a key resource. It is recommended that the database be updated continuously to increase the
sampling frame and possibly its representativeness. The phone-based approach to the farm-level survey
achieved a response rate of 52% and is considered more efficient and effective than either physically visiting
farms or deploying the survey via email. As the participants in the current farm-level were asked about their
willingness to participate in this kind of survey on an annual basis and also indicated their preferred survey
medium (phone or email), there is already a core sample in place, which can be enhanced with time.
Most stakeholders will require and appreciate human interaction and repeated follow-ups, even in case of a
rigidly structured survey. Therefore, we consider the current potential for automated routine data collection
through web-based tools as very low. Furthermore, the analysis, interpretation and aggregation of the data
collected requires significant amount of time and can hardly be automated.
Yet, there is potential for streamlining some of the data collection processes by some of the major sector
stakeholders. These are briefly discussed in the following sections.
Table 16: Sector indicators and the main sources for corresponding data/estimates.
# Indicator Main Sources Data collection tool(s)
BC1 Area under bush control by method p.a. (ha)
• Directorate of Forestry
• Forest Stewardship Council (group schemes)
• Ministry of Environment, Forestry and Tourism
• Private sector
• Farm-level survey
• DoF permit system
• FSC group scheme spreadsheets
• MEFT ECC system
• Individual data request/key informant interview Farm-level survey
BC2 Individual/company applications for environmental clearance certificates on BCBU from MEFT
• Ministry of Environment, Forestry and Tourism
• MEFT ECC system
BC3 Commercial/own use applications for permits on BCBU from DoF
• Directorate of Forestry • DoF permit system
4 Su
stainab
ility and
Co
nso
lidatio
n o
f Secto
r M&
E System

State and Trends of the Namibian Bush Biomass Sector 2019 Page 48 of 51
# Indicator Main Sources Data collection tool(s)
BC4 Number of permits issued by DoF p.a
• Directorate of Forestry • DoF permit system
BC5 Area under bush control on government research farms (ha)
• Directorate of Forestry • Individual data request/key
informant interview
BC6 Amount of chemicals imported and sold p.a (tons)
• Namibia Statistics Agency
• Private sector
• Individual data request/key informant interview
DA1 Number of DAS in house contacts maintained.
• De-bushing Advisory Service • Internal DAS activity records
DA2 Number of Farmers Union (NAU, NECFU, NNFU) trained in BCBU p.a.
• De-bushing Advisory Service • Internal DAS activity records
DA3
Number of government extension officers (DOF, DAPEES, DARD, MEFT) trained in BCBU p.a.
• De-bushing Advisory Service • Internal DAS activity records
DA4 Number of participants at DAS Workshops / Trade shows p.a.
• De-bushing Advisory Service • Internal DAS activity records
DA5 Number of participants at farmer information days p.a.
• De-bushing Advisory Service • Internal DAS activity records
DA6
Number of private extension officers (Agra ProVision, CCF, Komeho, Agribank), trained in BCBU p.a.
• De-bushing Advisory Service • Internal DAS activity records
DA7 Percentage (%) of farmers satisfied with DAS/N-BiG services.
• De-bushing Advisory Service
• Farm-level survey
• Internal DAS activity records
• Farm-level survey
EM1 Number of other employees outside the employment of NCA and N-BiG members in BCBU
• Private sector
• Farm-level survey
• Individual data request/key informant interview
• Farm-level survey
EM2 Number of people employed by N-BiG members who are active in BCBU
• Namibia Biomass Industry Group • N-BiG internal survey/reporting
EM3 Number of people employed by NCA charcoal processors by gender
• Namibia Charcoal Association • NCA internal survey/reporting
EM4 Number of people employed by NCA charcoal producers by gender p.a.
• Namibia Charcoal Association • NCA internal survey/reporting
EM5 Number of people employed in the bush-based animal feed value chain
• Namibia Biomass Industry Group
• Namibia Statistics Agency
• Farm-level survey
• Individual data request/key informant interview
• Farm-level survey
EM6 Number of N-BiG members. • Namibia Biomass Industry Group • N-BiG internal survey/reporting
EM7 Number of NCA members • Namibia Charcoal Association • NCA internal survey/reporting
FI1 Number of end-users making use of financial products and services for BCBU p.a.
• Financial Institutions
• Farm-level survey
• Individual data request/key informant interview
• Farm-level survey
FI2 Number of all applicants for loans for BCBU activities (both successful and unsuccessful) p.a.
• Financial Institutions
• Farm-level survey
• Individual data request/key informant interview
• Farm-level survey
MB1 Number of enterprises in charcoal production
• Namibia Charcoal Association
• Namibia Statistics Agency
• Forest Stewardship Council
• NCA internal survey/reporting
• FSC group scheme spreadsheets
• Individual data request/key informant interview
MB10 Number of active enterprises under DoF bush control tender programmes p.a.
• Directorate of Forestry • NA
MB2 Number of enterprises/farmers active in bush-based animal feed production
• MAWLR
• Farm-level survey
• Individual data request/key informant interview
• Farm-level survey

State and Trends of the Namibian Bush Biomass Sector 2019 Page 49 of 51
# Indicator Main Sources Data collection tool(s)
MB3 Amount of charcoal produced p.a. (tons)
• Namibia Charcoal Association
• Namibia Statistics Agency
• Forest Stewardship Council
• Farm-level survey
• NCA internal survey/reporting
• Individual data request/key informant interview
• Farm-level survey
MB4 Amount of charcoal exported per continent p.a (tons)
• Namibia Charcoal Association
• Namibia Statistics Agency
• NCA internal survey/reporting
• Individual data request/key informant interview
MB5 Amount of bush-based animal feed produced p.a. (tons)
• Namibia Statistics Agency
• Farm-level survey
• Individual data request/key informant interview
• Farm-level survey
MB6 Amount of biomass products other than charcoal commercially traded (tons)
• Namibia Biomass Industry Group
• Namibia Statistics Agency
• Private sector
• Farm-level survey
• N-BiG internal survey/reporting
• Individual data request/key informant interview
• Farm-level survey
MB7 Number of active enterprises in the sector other than charcoal producers and processors.
• De-bushing Advisory Service
• Namibia Biomass Industry Group
• MIT
• N-BiG internal survey/reporting
• Individual data request/key informant interview
MB8 Number of enterprises in charcoal processing
• Namibia Charcoal Association • NCA internal survey/reporting
MB9 Number of SMEs trained and certified in BCBU p.a.
• De-bushing Advisory Service
• Namibia Biomass Industry Group
• Namibia Charcoal Association
• Internal DAS activity records
• N-BiG internal survey/reporting
• NCA internal survey/reporting
OC1 Number of non-DAS-organized BCBU-related events by category
• Namibia Biomass Industry Group
• Namibia Charcoal Association
• N-BiG internal survey/reporting
• NCA internal survey/reporting
OC2 Number of exhibitors at the annual Biomass Technology Expo
• De-bushing Advisory Service
• Namibia Biomass Industry Group
• Internal DAS activity records
• N-BiG internal survey/reporting
OC3 Number of mentors in the sector trained through mentorship programmes p.a.
• De-bushing Advisory Service • Internal DAS activity records
OC4 Number of participants at the annual Biomass Technology Expo
• De-bushing Advisory Service
• Namibia Biomass Industry Group
• Internal DAS activity records
• N-BiG internal survey/reporting
RD1 Number of research projects on bush-based topics or linked to BCBU
• NUST
• UNAM
• NCRST
• SASSCAL
• Individual data request/key informant interview
4.1.1.2 DATA DISSEMINATION
Since the success of data collection and accuracy of the monitoring data to a large degree depends on the
voluntary participation of sector stakeholders, above all farmers and the private sector service providers, it is
important that mechanisms are in place to report back to these contributing stakeholders. At the same time, it
is crucial that personal or business data be protected and be prevented from being disseminated in the public
domain unless the respective data providers explicitly authorize that their names can be mentioned.
It is recommended that each annual indicator update be complemented by a brief update report containing
aggregate sector figures and which can be made available via the DAS website.
Optionally, a web-based dashboard featuring basic visualization and reporting tools for the collected indicator
data and could thus serve as a digital platform for public access to the (aggregated) sectoral data.
4 Su
stainab
ility and
Co
nso
lidatio
n o
f Secto
r M&
E System

State and Trends of the Namibian Bush Biomass Sector 2019 Page 50 of 51
5 Recommendations
Future Data Collection
• Given the heterogeneity and nature of data sources spanning the entire bush biomass sector, we
consider it unlikely that data collection and analysis can be automated to a significant degree. We
therefore recommend that
o Annual updates of the indicator framework be done through regular data collection campaigns
conducted by a core team under the coordination of the DAS
o Data collection be done largely manually, i.e. through direct (phone, email, in-person)
engagement between data collectors and data providers
o Data interpretation, analysis and aggregation be done largely manually, based on transparent
assumptions and formulas which are to be reviewed regularly to account for dynamics in the
sector
• Annual updates of the indicator framework are expected to be feasible within 4 months by an in-house
core team of 1-2 persons plus a small team of external enumerators (could be students in line with an
internship).
Contributions by Key Sector Stakeholders
• Namibia Charcoal Association: The NCA has its own internal M&E system and is not allowed to share
member-specific data externally. Therefore, only aggregated data can be provided by the NCA. With
regards to future sector indicator updates, we recommend that the NCA routinely integrate the
following data requests from their members:
o Amount of charcoal produced
o Area under bush control, disaggregated by method
o Number of employees, disaggregated by gender
• MEFT Directorate of Forestry: The current DoF permit system is paper-based and (meta-)data on permit
applications and permits issued is not captured systematically and uniformly in digital form. The current
system does thus not yield the data required to determine the status of the indicators BC3 and BC4.
We recommend that
o In the short-term, the DoF adopt a basic system to systematically digitize and centrally archive
the permit data from the year 2019
o In the mid-term, the DoF adopt a fully digitized permit system. This will require building
considerable capacities in-house for operating and maintaining the system. In line with this
development, the DoF permit system and the MEFT ECC system could be harmonized or even
fully integrated.
• MEFT Department of Environmental Affairs:
o The current database of the digital ECC system cannot be queried specifically according to
BCBU-related categories. We recommend that the categories are revised, or corresponding
keywords be added to enable corresponding database queries.
o We recommend that the affected area in line with an ECC be captured consistently, ideally by
capturing spatial polygons in the system.
Data Dissemination
• The web-based M&E platform in its current form provides limited functionality to appropriately present
sector data to the public. We recommend that
o Either, the current web-based platform be enhanced to increase flexibility, user-friendliness,
and attractiveness, or
o Annual sector updates be presented to the public via annual update reports, which can be
provided via the DAS website along with a spreadsheet containing all indicator data.
5 R
eco
mm
en
datio
ns

State and Trends of the Namibian Bush Biomass Sector 2019 Page 51 of 51
References
Bester, F. (1998/1999). Major problem - Bush species and densities in Namibia. Agricola.
Birch, C., Harper-Simmonds, L., Lindeque, P., & Middleton, A. (2016). Benefits of bush control in Namibia. A national
economic study for Namibia and a case for the Otjozondjupa Region. Report for the Economics of Land
Degradation Initiative. Bonn: Economics of Land Degradation (ELD) Initiative.
De Klerk, J. (2004). Bush Encroachment in Namibia. Windhoek: Ministry of Environment and Tourism, Government
of the Republic of Namibia.
De Wet, M. (2015). Harvesting Namibian Encroacher Bush: Compendium of harvesting technologies for encroacher
bush in Namibia. Windhoek: Prepared by NRGen Advisors / WML Consulting Engineers, for MAWF/GIZ
Support to De-bushing Project.
GRN. (2019). National GHG Inventory Report, NC4, 1991 - 2015. Windhoek: Government of the Republic of Namibia.
MAWF/MET. (2016). Forestry and Environmental Authorisations Process for Bush Harvesting Projects in Namibia.
Windhoek.
Namibia Statistics Agency. (2018). Namibia Land Statistics Booklet. Windhoek: NSA.
Outeku. (2019). Baseline Report for the Biomass Sector Indicators. Windhoek, Prepared for De-bushing Advisory
Service.
Rothauge, A. (2014). Baseline Assessment for the De-bushing Programme in Namibia. Windhoek: De-bushing
Programme in Namibia.
SAIEA. (2016). Strategic environmental assessment of large-scale bush thinning and value-addition activities in
Namibia. Main Report. Windhoek: Prepared by Southern African Institute for Environmental Assessment,
for MAWF/GIZ Support to De-bushing Project.
Seebauer, M., Pinkwart, A., Schwarz, B., & Hartz, C. (2019). Greenhouse Gas Assessment of Bush Control and Biomass
Utilization in Namibia. Windhoek: Prepared by Unique Forest & NNF, for MAWF/GIZ Bush Control and
Biomass Utilisation Project.
Smit, G. N., de Klerk, J. N., Schneider, M. B., & van Eck, J. (2015). Detailed Assessment of the Biomass Resource and
Potential Yield in a Selected Bush Encroached Area of Namibia. Windhoek: Prepared for Support to De-
bushing Project.
Turpie, J., Botha, P., Coldrey, K., Forsythe, K., Knowles, T., Letley, G., & De Wet, R. (2019). Towards a policy on
indigenous bush encroachment in South Africa. Pretoria: Department of Environmental Affairs.
Re
fere
nce
s