Embed Size (px)
Citation preview
STARTUP CITYThe Urban Shift in Venture Capital
and High Technology
Cities
The Cities Project at the Martin Prosperity Institute focuses on the role of cities as the key economic and social organizing unit of global capitalism. It explores both the opportunities and challenges facing cities as they take on this heightened new role.
The Martin Prosperity Institute, housed at the University of Toronto’s Rotman School of Management, explores the requisite underpinnings of a democratic capitalist economy that generate prosperity that is both robustly growing and broadly experienced.
STARTUP CITYThe Urban Shift in Venture Capital
and High Technology
Richard Florida
4 Startup City
Table of Contents
1. Executive Summary 7
2. Introduction 9
3. Venture Capital and Startup Activity across Metros 12 3.1 Venture Capital and Startup Activity Per Capita 15
4. Key Factors in the Geography of Venture Capital Investment 20
5. Venture Capital and Startup Activity by Area Code 26
6. Venture Capital and Startup Activity by Zip Code 31 6.1 San Francisco Bay Area 32
6.2 Boston and Cambridge 34
6.3 New York 35
6.4 Los Angeles and Orange County 36
6.5 Washington, DC and Baltimore 39
6.6 San Diego 40
6.7 Chicago 42
6.8 Austin 43
6.9 Seattle 43
6.10 Philadelphia 46
6.11 Dallas 47
7. Conclusion 49
8. Appendix 52
9. Methodology Appendix: Variable Definitions 64
10. Endnotes 65
5 Table of Exhibits
Table of Exhibits
Exhibit 1 Top 20 metros for venture capital deals 14
Exhibit 2 Top 20 metros for venture capital investment 15
Exhibit 3 Top 20 metros for venture capital deals per capita 18
Exhibit 4 Top 20 metros for venture capital investment per capita 19
Exhibit 5 Venture capital investment correlation — High tech and innovation 20
Exhibit 6 Venture capital investment correlation — Wages and income per capita 21
Exhibit 7 Venture capital investment correlation — College grads and Creative Class 21
Exhibit 8 Venture capital investment correlation — Specific occupations 23
Exhibit 9 Venture capital investment correlation — Foreign-born and gay 23
Exhibit 10 Venture capital investment correlation — Liberal versus Conservative 24
Exhibit 11 Venture capital investment correlation — Density 24
Exhibit 12 Venture capital investment correlation — Commuting 25
Exhibit 13 Leading area codes for venture capital deals 27
Exhibit 14 Leading area codes for venture capital investment 29
Exhibit 15 Leading cities for venture capital investment in the Bay Area 32
Exhibit 16 Top 10 zip codes for venture capital investment in the Bay Area 34
Exhibit 17 Top 10 zip codes for venture capital investment in Greater Boston 36
Exhibit 18 Top 10 zip codes for venture capital investment in Greater New York 37
Exhibit 19 Top 10 zip codes for venture capital investment in Los Angeles and Orange County 38
Exhibit 20 Top 10 zip codes for venture capital investment in Greater Washington, DC 40
Exhibit 21 Top 10 zip codes for venture capital investment in San Diego 41
Exhibit 22 Top 10 zip codes for venture capital investment in Chicago 43
Exhibit 23 Top 10 zip codes for venture capital investment in Austin 44
Exhibit 24 Top 10 zip codes for venture capital investment in Seattle 45
Exhibit 25 Top 5 zip codes for venture capital investment in Philadelphia 47
Exhibit 26 Top 5 zip codes for venture capital investment in Dallas 48
Exhibit 27 Share of venture capital investment going to center cities, walkable suburbs, and other places 49
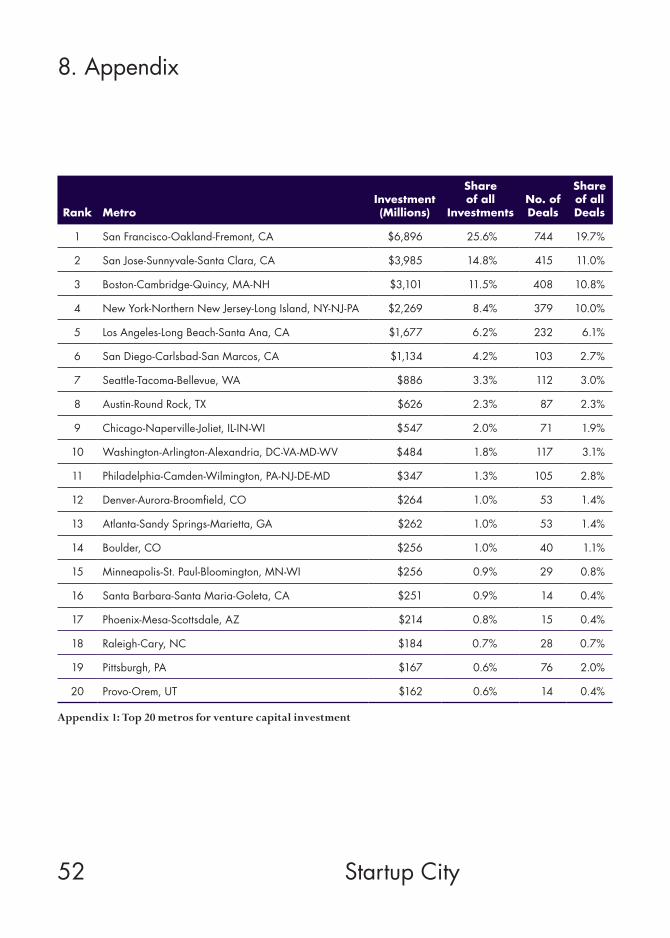
Appendix 1 Top 20 metros for venture capital investment 52
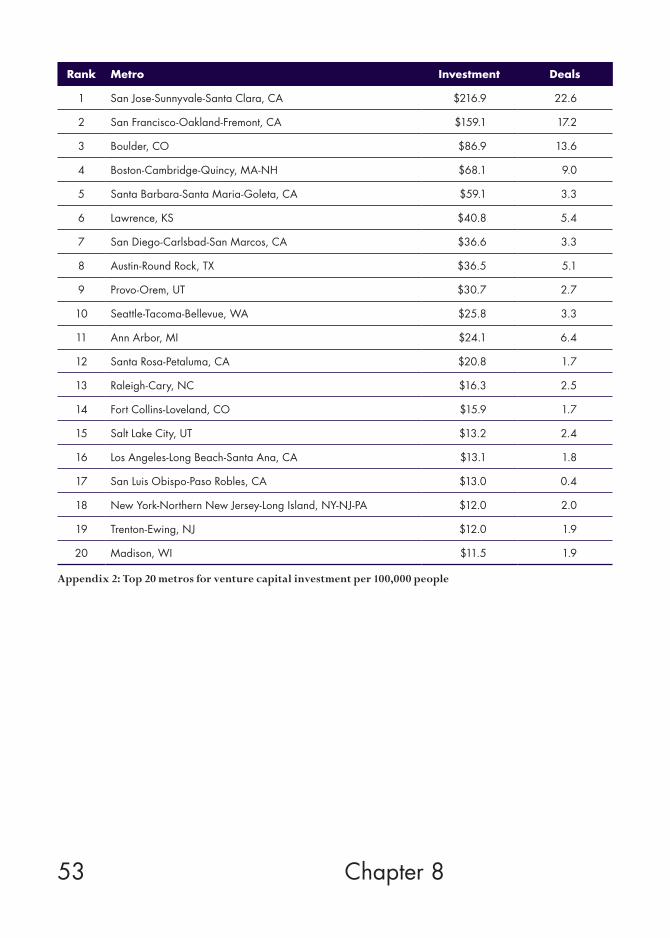
Appendix 2 Top 20 metros for venture capital investment per 100,000 people 53
Appendix 3 Correlation analysis results 54
Appendix 4 Leading area codes for venture capital deals 55
Appendix 5 Leading area codes for venture capital investment 56
Appendix 6 Venture capital investment by primary city and suburb 57
Appendix 7 Share of venture capital investment going to center cities, walkable suburbs, and other places 63
6 Startup City
Table of Maps
Map 1 Venture capital deals by metro 12
Map 2 Venture capital investment by metro 13
Map 3 Venture capital deals per 100,000 people 16
Map 4 Venture capital investment per 100,000 people 17
Map 5 Venture capital deals by area code 26
Map 6 Venture capital investment by area code 28
Map 7 Bay Area venture capital investments 33
Map 8 Boston area venture capital investments 35
Map 9 New York area venture capital investments 37
Map 10 Los Angeles area venture capital investments 38
Map 11 Washington, DC area venture capital investments 39
Map 12 San Diego area venture capital investments 41
Map 13 Chicago area venture capital investments 42
Map 14 Austin area venture capital investments 44
Map 15 Seattle area venture capital investments 45
Map 16 Philadelphia area venture capital investments 46
Map 17 Dallas area venture capital investments 47
7
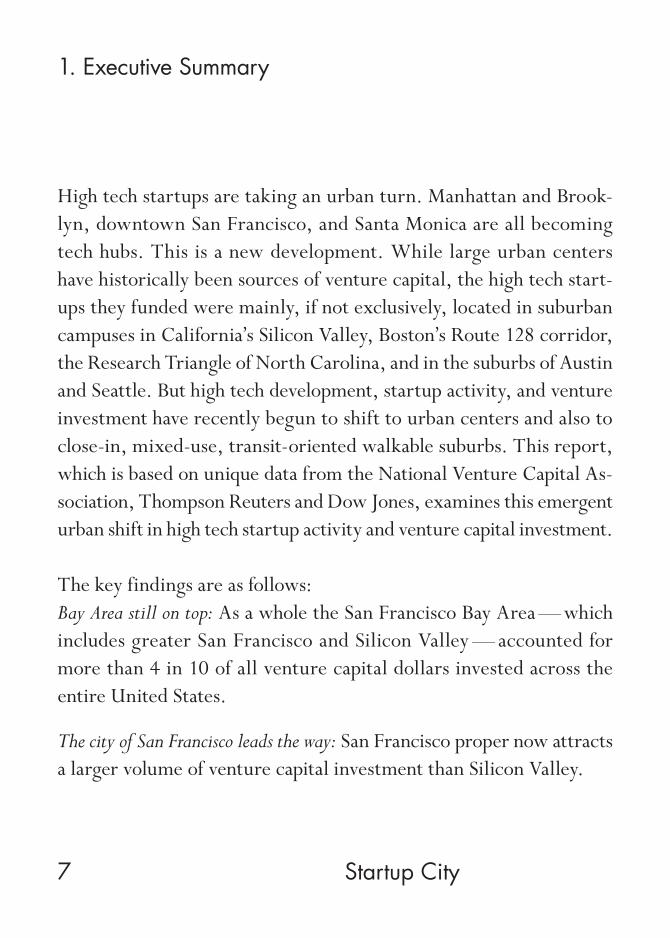
1. Executive Summary
High tech startups are taking an urban turn. Manhattan and Brook-lyn, downtown San Francisco, and Santa Monica are all becoming tech hubs. This is a new development. While large urban centers have historically been sources of venture capital, the high tech start-ups they funded were mainly, if not exclusively, located in suburban campuses in California’s Silicon Valley, Boston’s Route 128 corridor, the Research Triangle of North Carolina, and in the suburbs of Austin and Seattle. But high tech development, startup activity, and venture investment have recently begun to shift to urban centers and also to close-in, mixed-use, transit-oriented walkable suburbs. This report, which is based on unique data from the National Venture Capital As-sociation, Thompson Reuters and Dow Jones, examines this emergent urban shift in high tech startup activity and venture capital investment.
The key findings are as follows:Bay Area still on top: As a whole the San Francisco Bay Area — which includes greater San Francisco and Silicon Valley — accounted for more than 4 in 10 of all venture capital dollars invested across the entire United States.
The city of San Francisco leads the way: San Francisco proper now attracts a larger volume of venture capital investment than Silicon Valley.
Startup City
8
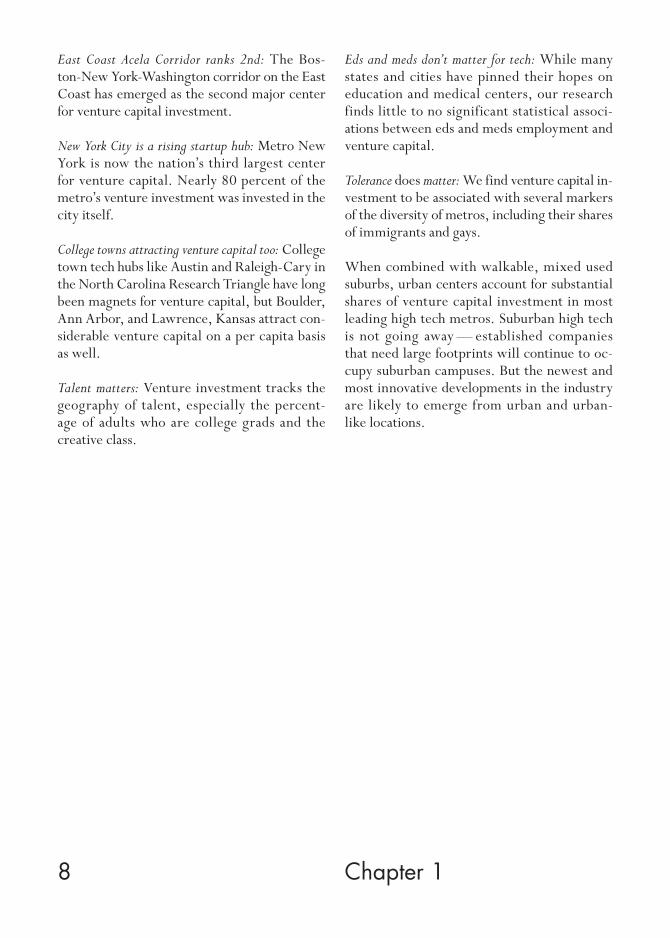
East Coast Acela Corridor ranks 2nd: The Bos-ton-New York-Washington corridor on the East Coast has emerged as the second major center for venture capital investment.
New York City is a rising startup hub: Metro New York is now the nation’s third largest center for venture capital. Nearly 80 percent of the metro’s venture investment was invested in the city itself.
College towns attracting venture capital too: College town tech hubs like Austin and Raleigh-Cary in the North Carolina Research Triangle have long been magnets for venture capital, but Boulder, Ann Arbor, and Lawrence, Kansas attract con-siderable venture capital on a per capita basis as well.
Talent matters: Venture investment tracks the geography of talent, especially the percent-age of adults who are college grads and the creative class.
Eds and meds don’t matter for tech: While many states and cities have pinned their hopes on education and medical centers, our research finds little to no significant statistical associ-ations between eds and meds employment and venture capital.
Tolerance does matter: We find venture capital in-vestment to be associated with several markers of the diversity of metros, including their shares of immigrants and gays.
When combined with walkable, mixed used suburbs, urban centers account for substantial shares of venture capital investment in most leading high tech metros. Suburban high tech is not going away — established companies that need large footprints will continue to oc-cupy suburban campuses. But the newest and most innovative developments in the industry are likely to emerge from urban and urban- like locations.
Chapter 1
9 Startup City
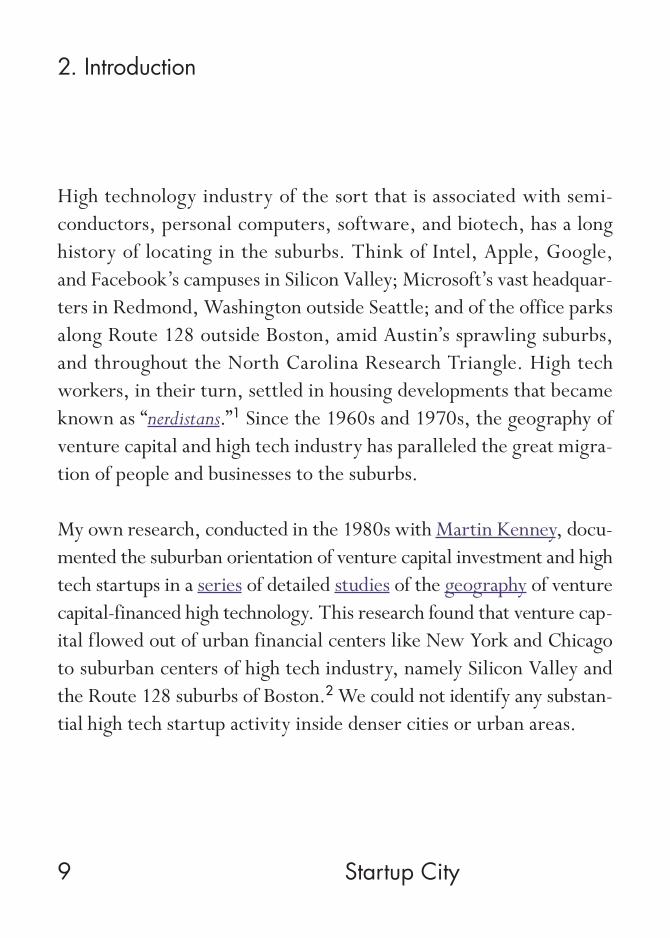
2. Introduction
High technology industry of the sort that is associated with semi-conductors, personal computers, software, and biotech, has a long history of locating in the suburbs. Think of Intel, Apple, Google, and Facebook’s campuses in Silicon Valley; Microsoft’s vast headquar-ters in Redmond, Washington outside Seattle; and of the office parks along Route 128 outside Boston, amid Austin’s sprawling suburbs, and throughout the North Carolina Research Triangle. High tech workers, in their turn, settled in housing developments that became known as “nerdistans.”1 Since the 1960s and 1970s, the geography of venture capital and high tech industry has paralleled the great migra-tion of people and businesses to the suburbs.
My own research, conducted in the 1980s with Martin Kenney, docu-mented the suburban orientation of venture capital investment and high tech startups in a series of detailed studies of the geography of venture capital-financed high technology. This research found that venture cap-ital flowed out of urban financial centers like New York and Chicago to suburban centers of high tech industry, namely Silicon Valley and the Route 128 suburbs of Boston.2 We could not identify any substan-tial high tech startup activity inside denser cities or urban areas.
10 Chapter 2
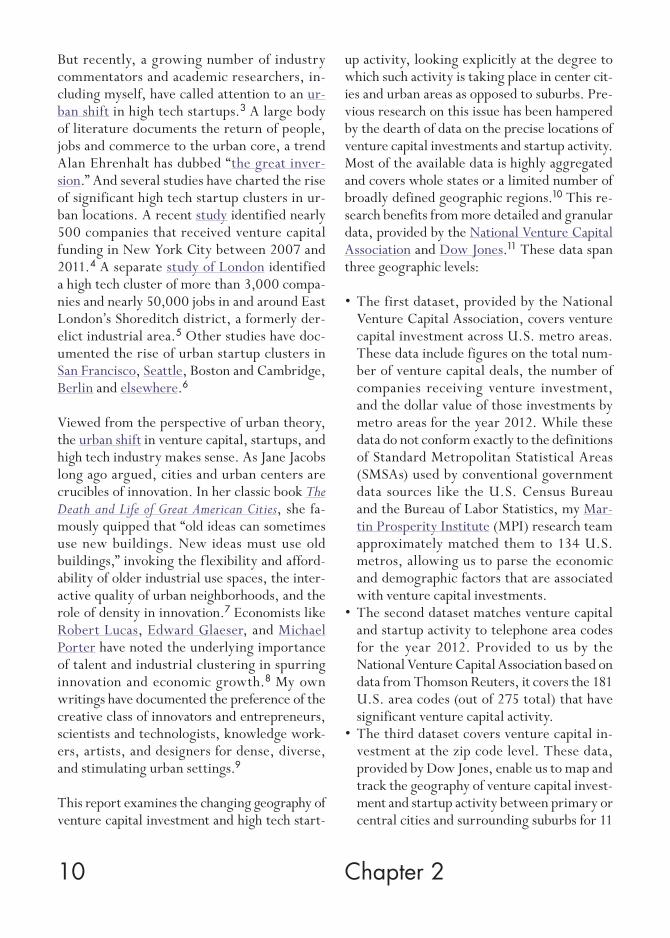
But recently, a growing number of industry commentators and academic researchers, in-cluding myself, have called attention to an ur-ban shift in high tech startups.3 A large body of literature documents the return of people, jobs and commerce to the urban core, a trend Alan Ehrenhalt has dubbed “the great inver-sion.” And several studies have charted the rise of significant high tech startup clusters in ur-ban locations. A recent study identified nearly 500 companies that received venture capital funding in New York City between 2007 and 2011.4 A separate study of London identified a high tech cluster of more than 3,000 compa-nies and nearly 50,000 jobs in and around East London’s Shoreditch district, a formerly der-elict industrial area.5 Other studies have doc-umented the rise of urban startup clusters in San Francisco, Seattle, Boston and Cambridge, Berlin and elsewhere.6
Viewed from the perspective of urban theory, the urban shift in venture capital, startups, and high tech industry makes sense. As Jane Jacobs long ago argued, cities and urban centers are crucibles of innovation. In her classic book The Death and Life of Great American Cities, she fa-mously quipped that “old ideas can sometimes use new buildings. New ideas must use old buildings,” invoking the flexibility and afford-ability of older industrial use spaces, the inter-active quality of urban neighborhoods, and the role of density in innovation.7 Economists like Robert Lucas, Edward Glaeser, and Michael Porter have noted the underlying importance of talent and industrial clustering in spurring innovation and economic growth.8 My own writings have documented the preference of the creative class of innovators and entrepreneurs, scientists and technologists, knowledge work-ers, artists, and designers for dense, diverse, and stimulating urban settings.9
This report examines the changing geography of venture capital investment and high tech start-
up activity, looking explicitly at the degree to which such activity is taking place in center cit-ies and urban areas as opposed to suburbs. Pre-vious research on this issue has been hampered by the dearth of data on the precise locations of venture capital investments and startup activity. Most of the available data is highly aggregated and covers whole states or a limited number of broadly defined geographic regions.10 This re-search benefits from more detailed and granular data, provided by the National Venture Capital Association and Dow Jones.11 These data span three geographic levels:
• The first dataset, provided by the National Venture Capital Association, covers venture capital investment across U.S. metro areas. These data include figures on the total num-ber of venture capital deals, the number of companies receiving venture investment, and the dollar value of those investments by metro areas for the year 2012. While these data do not conform exactly to the definitions of Standard Metropolitan Statistical Areas (SMSAs) used by conventional government data sources like the U.S. Census Bureau and the Bureau of Labor Statistics, my Mar-tin Prosperity Institute (MPI) research team approximately matched them to 134 U.S. metros, allowing us to parse the economic and demographic factors that are associated with venture capital investments.
• The second dataset matches venture capital and startup activity to telephone area codes for the year 2012. Provided to us by the National Venture Capital Association based on data from Thomson Reuters, it covers the 181 U.S. area codes (out of 275 total) that have significant venture capital activity.
• The third dataset covers venture capital in- vestment at the zip code level. These data, provided by Dow Jones, enable us to map and track the geography of venture capital invest-ment and startup activity between primary or central cities and surrounding suburbs for 11
metros — San Francisco, Boston-Cambridge, New York, Los Angeles, San Diego, Seattle, Austin, Chicago, Washington, DC, Dallas, and Philadelphia and two combined regions: the San Francisco Bay Area (San Francisco and San Jose) and Washington, DC-Bal-timore. These metros account for almost three quarters of U.S. venture capital activ-ity. These data are for 2011 (and thus differ from the metro and area code data above that cover 2012).
The report is organized as follows:
The first section presents the results of an analysis of venture capital investment across U.S. metros.
The second section summarizes a statistical analysis of the demographic and economic factors that are associated with the levels of venture capital investment across metropol-itan regions.
The third section charts venture capital in-vestment across telephone area codes.
The fourth section maps the geography of venture capital investment and startup ac-tivity at the zip code level for eleven leading regions, providing a more precise gauge of the geography of venture capital and startup activity between center cities and suburban areas.
The conclusion summarizes the key findings and trends identified in the analysis and out-lines future research.
This report is the first installment of a larger and ongoing Martin Prosperity Institute research project examining the changing and increasing-ly urban geography of venture capital and high tech startups. It provides an overview of broad trends in venture capital and startup activity at the metro level, while zeroing in more closely on venture investment and startup activity at the zip code level for eleven leading metros and cities in the United States. Future reports will use even more detailed data at the zip code level for a much broader number of cities and metro areas over a substantial time series.
11 Startup City
12 Startup City
3. Venture Capital and Startup Activity across Metros
We begin by mapping the geography of venture capital at the metro level. (We abbreviate met-ro names in the text for readability. The Appen-dix tables provide full metro names and greater detail for these metros.)
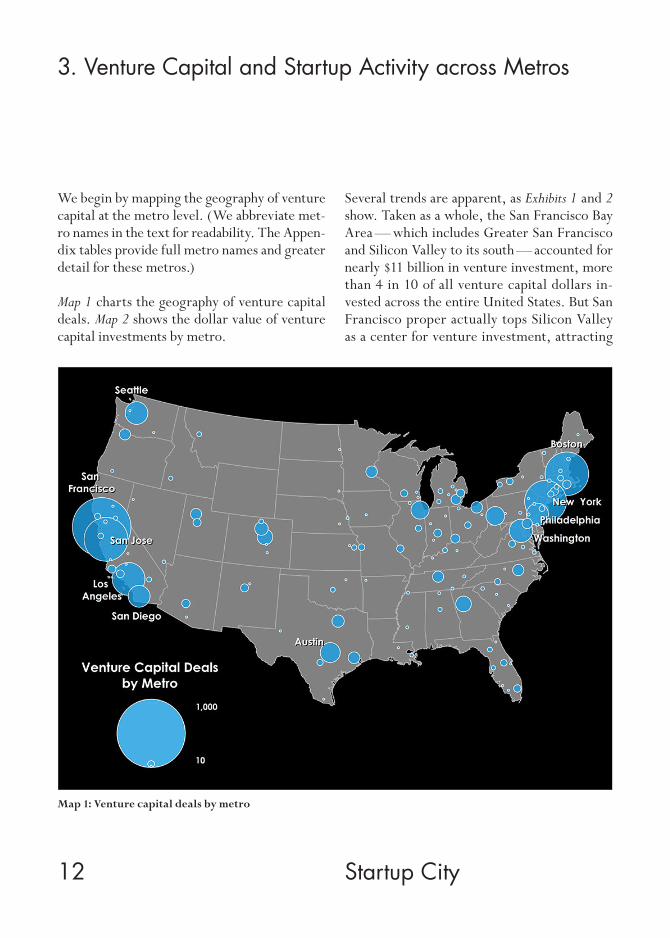
Map 1 charts the geography of venture capital deals. Map 2 shows the dollar value of venture capital investments by metro.
Several trends are apparent, as Exhibits 1 and 2 show. Taken as a whole, the San Francisco Bay Area — which includes Greater San Francisco and Silicon Valley to its south — accounted for nearly $11 billion in venture investment, more than 4 in 10 of all venture capital dollars in-vested across the entire United States. But San Francisco proper actually tops Silicon Valley as a center for venture investment, attracting
Map 1: Venture capital deals by metro
13 Chapter 3
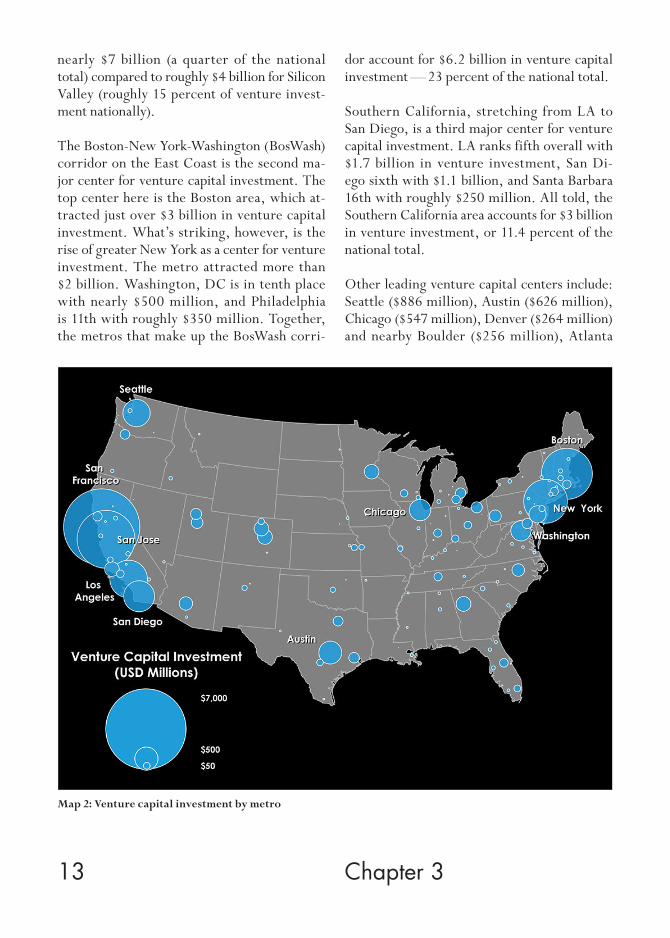
nearly $7 billion (a quarter of the national total) compared to roughly $4 billion for Silicon Valley (roughly 15 percent of venture invest-ment nationally).
The Boston-New York-Washington (BosWash) corridor on the East Coast is the second ma-jor center for venture capital investment. The top center here is the Boston area, which at-tracted just over $3 billion in venture capital investment. What’s striking, however, is the rise of greater New York as a center for venture investment. The metro attracted more than $2 billion. Washington, DC is in tenth place with nearly $500 million, and Philadelphia is 11th with roughly $350 million. Together, the metros that make up the BosWash corri-
dor account for $6.2 billion in venture capital investment — 23 percent of the national total.
Southern California, stretching from LA to San Diego, is a third major center for venture capital investment. LA ranks fifth overall with $1.7 billion in venture investment, San Di-ego sixth with $1.1 billion, and Santa Barbara 16th with roughly $250 million. All told, the Southern California area accounts for $3 billion in venture investment, or 11.4 percent of the national total.
Other leading venture capital centers include: Seattle ($886 million), Austin ($626 million), Chicago ($547 million), Denver ($264 million) and nearby Boulder ($256 million), Atlanta
Map 2: Venture capital investment by metro
14 Startup City
($262 million), Minneapolis-St. Paul ($256 million), and Phoenix ($214 million).
Eleven additional metros account for more than $100 million in venture capital investment: Ra-leigh-Cary, Pittsburgh, Provo and its neighbor Salt Lake City, Cleveland, Houston, Detroit, Baltimore, Dallas, Portland, and Santa Rosa.
The main takeaways: The Bay Area (including Silicon Valley and Greater San Francisco) re-mains the dominant center of venture capital-
funded high technology, attracting more than 40 percent of venture capital dollars, but its center of gravity has shifted from suburban Silicon Valley to urban San Francisco. Greater New York has clearly risen as a venture capital center as well.
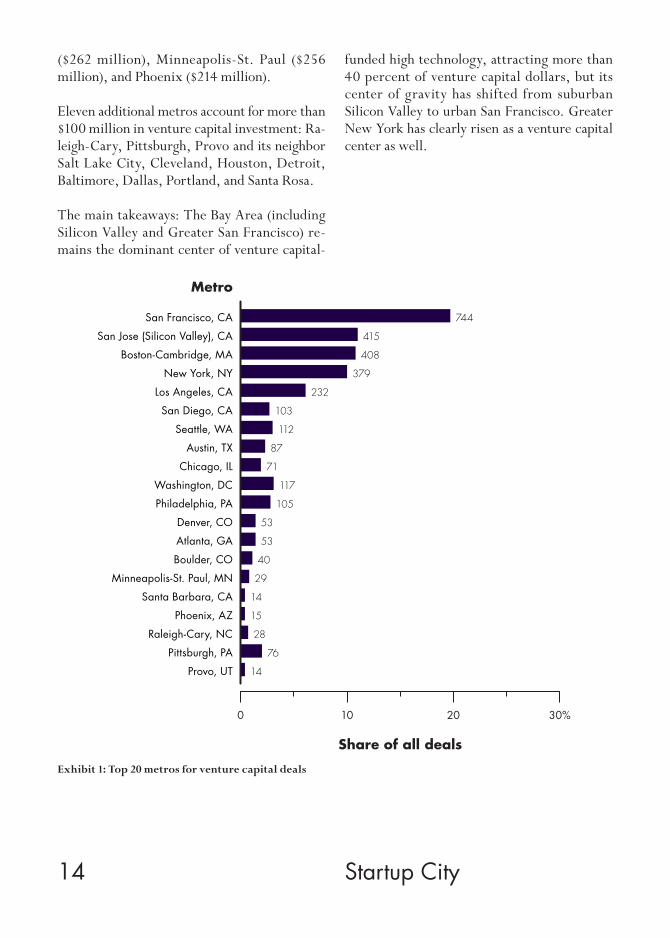
Exhibit 1: Top 20 metros for venture capital deals
Share of all deals
Metro
0 10 20 30%
San Francisco, CA
San Jose (Silicon Valley), CA
Boston-Cambridge, MA
New York, NY
Los Angeles, CA
San Diego, CA
Seattle, WA
Austin, TX
Chicago, IL
Washington, DC
Philadelphia, PA
Denver, CO
Atlanta, GA
Boulder, CO
Minneapolis-St. Paul, MN
Santa Barbara, CA
Phoenix, AZ
Raleigh-Cary, NC
Pittsburgh, PA
Provo, UT
744
415
408
379
232
103
112
87
71
117
105
53
53
40
29
14
15
28
76
14
15 Chapter 3
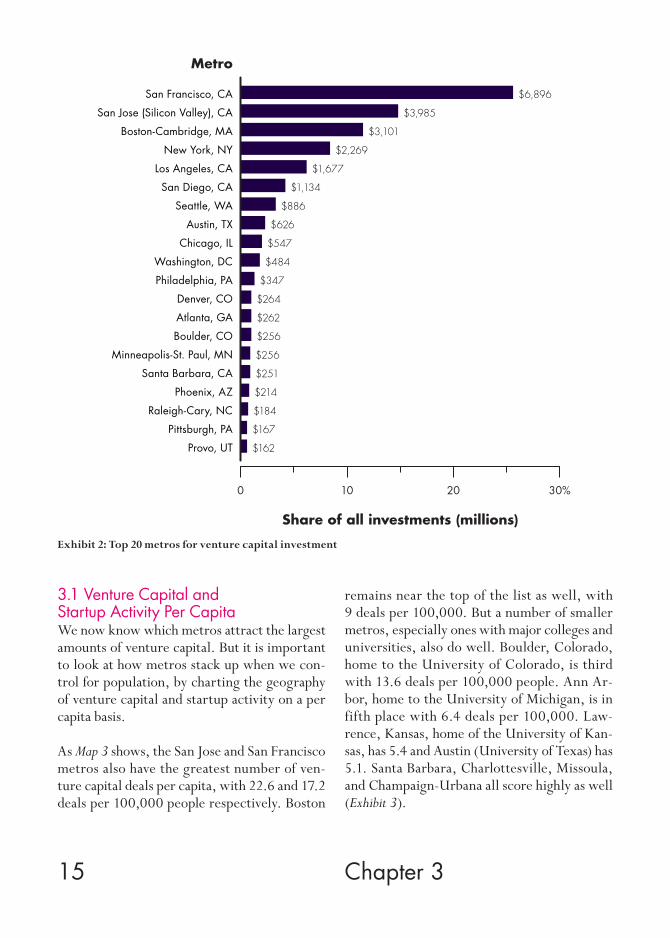
Exhibit 2: Top 20 metros for venture capital investment
Share of all investments (millions)
0 10 20 30%
Metro
$6,896
$3,985
$3,101
$2,269
$1,677
$1,134
$886
$626
$547
$484
$347
$264
$262
$256
$256
$251
$214
$184
$167
$162
San Francisco, CA
San Jose (Silicon Valley), CA
Boston-Cambridge, MA
New York, NY
Los Angeles, CA
San Diego, CA
Seattle, WA
Austin, TX
Chicago, IL
Washington, DC
Philadelphia, PA
Denver, CO
Atlanta, GA
Boulder, CO
Minneapolis-St. Paul, MN
Santa Barbara, CA
Phoenix, AZ
Raleigh-Cary, NC
Pittsburgh, PA
Provo, UT
3.1 Venture Capital and Startup Activity Per CapitaWe now know which metros attract the largest amounts of venture capital. But it is important to look at how metros stack up when we con-trol for population, by charting the geography of venture capital and startup activity on a per capita basis.
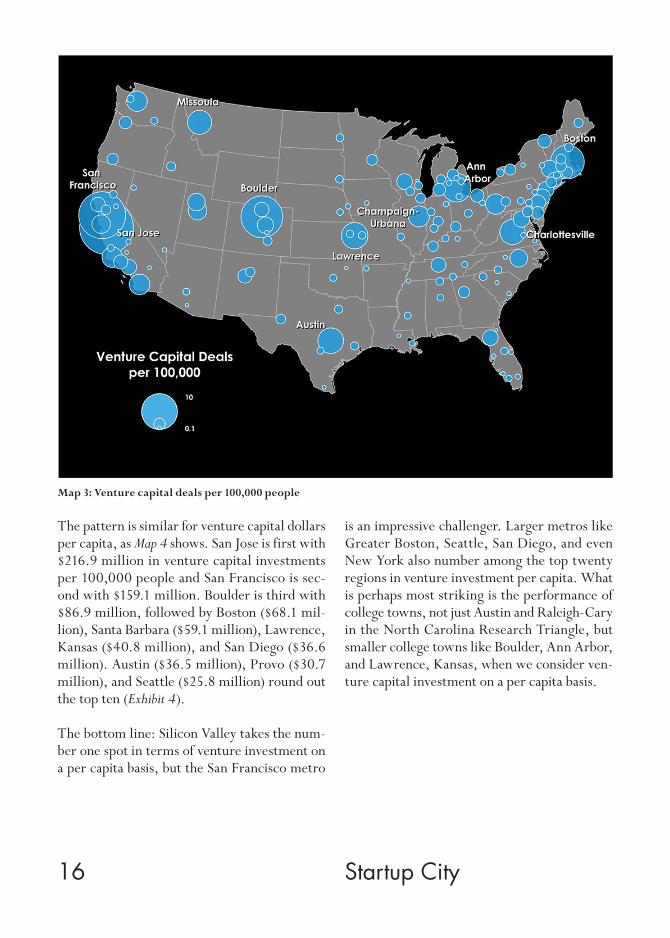
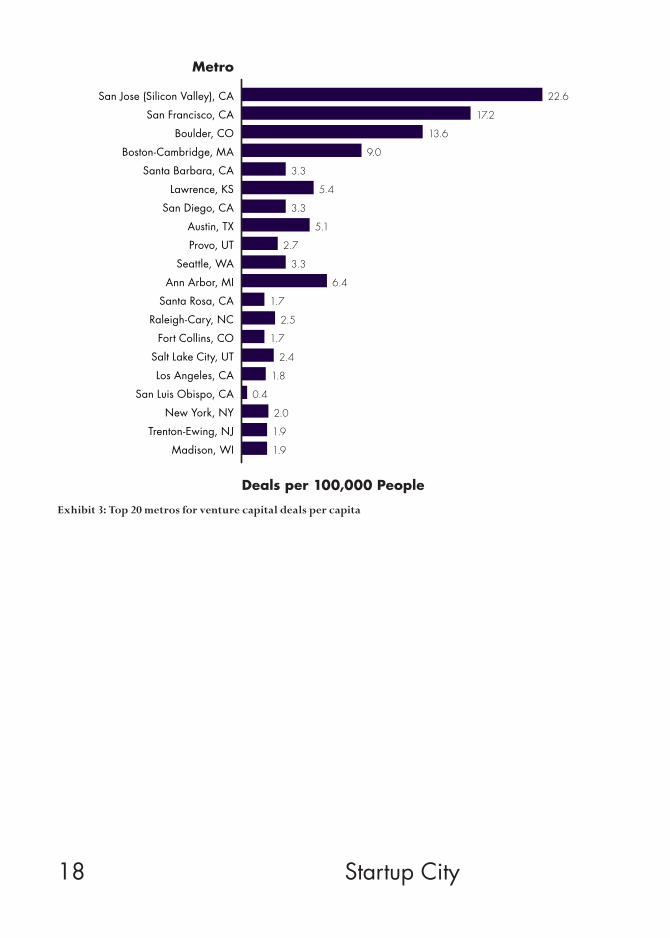
As Map 3 shows, the San Jose and San Francisco metros also have the greatest number of ven-ture capital deals per capita, with 22.6 and 17.2 deals per 100,000 people respectively. Boston
remains near the top of the list as well, with 9 deals per 100,000. But a number of smaller metros, especially ones with major colleges and universities, also do well. Boulder, Colorado, home to the University of Colorado, is third with 13.6 deals per 100,000 people. Ann Ar-bor, home to the University of Michigan, is in fifth place with 6.4 deals per 100,000. Law-rence, Kansas, home of the University of Kan-sas, has 5.4 and Austin (University of Texas) has 5.1. Santa Barbara, Charlottesville, Missoula, and Champaign-Urbana all score highly as well (Exhibit 3).
16 Startup City
Map 3: Venture capital deals per 100,000 people
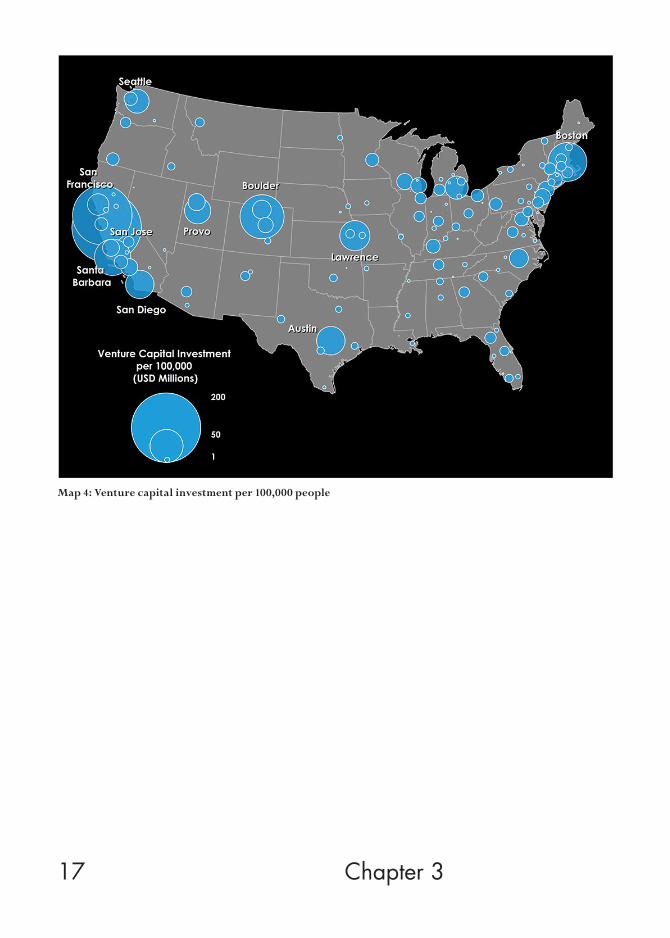
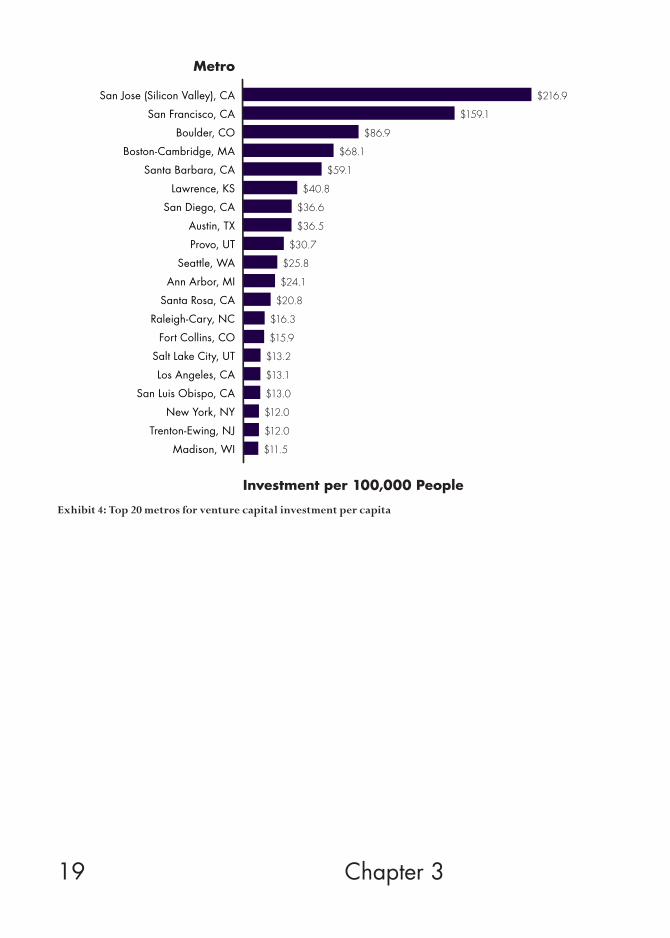
The pattern is similar for venture capital dollars per capita, as Map 4 shows. San Jose is first with $216.9 million in venture capital investments per 100,000 people and San Francisco is sec-ond with $159.1 million. Boulder is third with $86.9 million, followed by Boston ($68.1 mil-lion), Santa Barbara ($59.1 million), Lawrence, Kansas ($40.8 million), and San Diego ($36.6 million). Austin ($36.5 million), Provo ($30.7 million), and Seattle ($25.8 million) round out the top ten (Exhibit 4).
The bottom line: Silicon Valley takes the num-ber one spot in terms of venture investment on a per capita basis, but the San Francisco metro
is an impressive challenger. Larger metros like Greater Boston, Seattle, San Diego, and even New York also number among the top twenty regions in venture investment per capita. What is perhaps most striking is the performance of college towns, not just Austin and Raleigh-Cary in the North Carolina Research Triangle, but smaller college towns like Boulder, Ann Arbor, and Lawrence, Kansas, when we consider ven-ture capital investment on a per capita basis.
17 Chapter 3
Map 4: Venture capital investment per 100,000 people
18 Startup City
Exhibit 3: Top 20 metros for venture capital deals per capita
Deals per 100,000 People
Metro
San Jose (Silicon Valley), CA
San Francisco, CA
Boulder, CO
Boston-Cambridge, MA
Santa Barbara, CA
Lawrence, KS
San Diego, CA
Austin, TX
Provo, UT
Seattle, WA
Ann Arbor, MI
Santa Rosa, CA
Raleigh-Cary, NC
Fort Collins, CO
Salt Lake City, UT
Los Angeles, CA
San Luis Obispo, CA
New York, NY
Trenton-Ewing, NJ
Madison, WI
22.6
17.2
13.6
9.0
3.3
5.4
3.3
5.1
2.7
3.3
6.4
1.7
2.5
1.7
2.4
1.8
0.4
2.0
1.9
1.9
19 Chapter 3
Exhibit 4: Top 20 metros for venture capital investment per capita
Metro
San Jose (Silicon Valley), CA
San Francisco, CA
Boulder, CO
Boston-Cambridge, MA
Santa Barbara, CA
Lawrence, KS
San Diego, CA
Austin, TX
Provo, UT
Seattle, WA
Ann Arbor, MI
Santa Rosa, CA
Raleigh-Cary, NC
Fort Collins, CO
Salt Lake City, UT
Los Angeles, CA
San Luis Obispo, CA
New York, NY
Trenton-Ewing, NJ
Madison, WI
$216.9
$159.1
$86.9
$68.1
$59.1
$40.8
$36.6
$36.5
$30.7
$25.8
$24.1
$20.8
$16.3
$15.9
$13.2
$13.1
$13.0
$12.0
$12.0
$11.5
Investment per 100,000 People
20 Startup City
4. Key Factors in the Geography of Venture Capital Investment
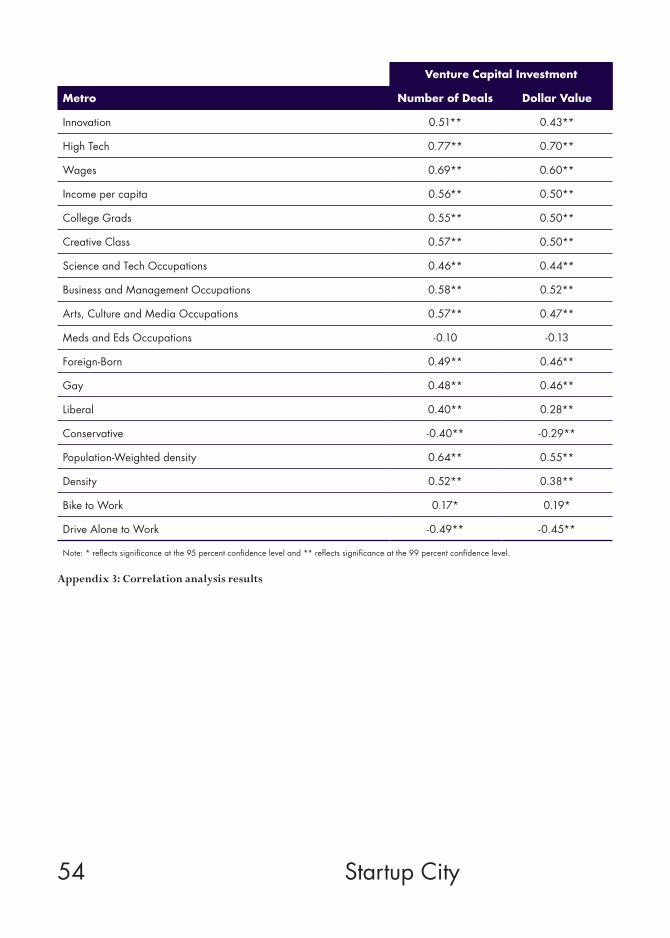
This section turns to the factors that help shape the geography of startup activity and venture capital investment. To probe this, my colleague Charlotta Mellander ran a correlation analysis of the economic, demographic, and social fac-tors that are associated with venture capital investment across metros. The analysis covers the 130 metros that received venture capital in-vestment, including all 51 metros with over one million people, 35 with between 500,000 and one million people; 25 with between 250,000 and 500,000 people; and just 19 with less than 50,000 people. Since bigger metros will attract more venture capital on balance, Mellander ran a partial correlation analysis that controls for metro population. The correlations cover both the number of venture capital investments as well as the dollar amount of these venture
capital investments. As usual, I emphasize that correlation does not equal causation. The ex-hibits below summarize the results. Full detail is provided in the Appendix Table 4.
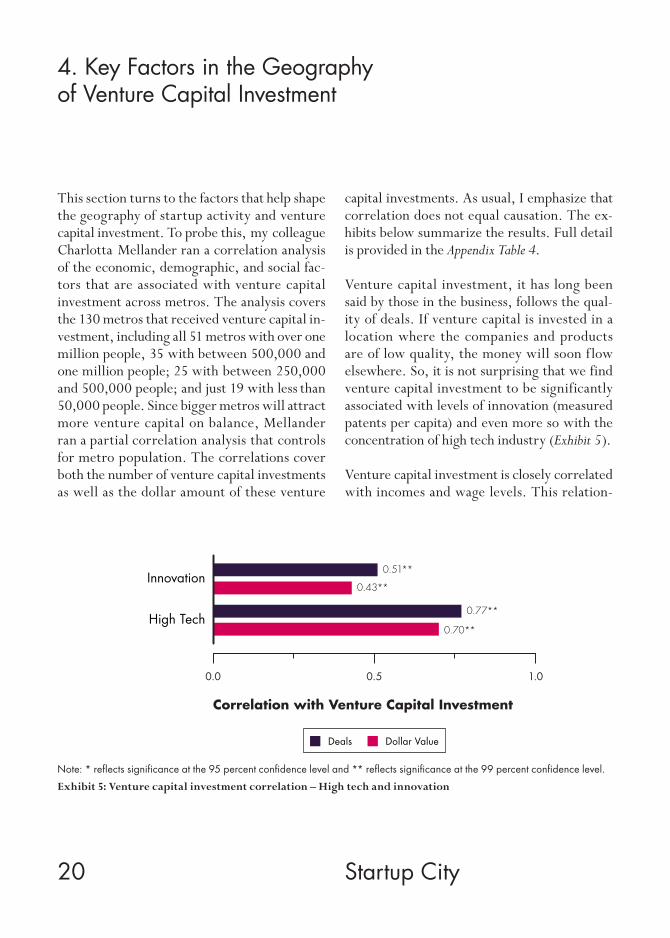
Venture capital investment, it has long been said by those in the business, follows the qual-ity of deals. If venture capital is invested in a location where the companies and products are of low quality, the money will soon flow elsewhere. So, it is not surprising that we find venture capital investment to be significantly associated with levels of innovation (measured patents per capita) and even more so with the concentration of high tech industry (Exhibit 5).
Venture capital investment is closely correlated with incomes and wage levels. This relation-
Exhibit 5: Venture capital investment correlation – High tech and innovationNote: * reflects significance at the 95 percent confidence level and ** reflects significance at the 99 percent confidence level.
Correlation with Venture Capital Investment
0.0 0.5 1.0
Innovation0.51**
0.43**
High Tech0.77**
0.70**
Deals Dollar Value
21
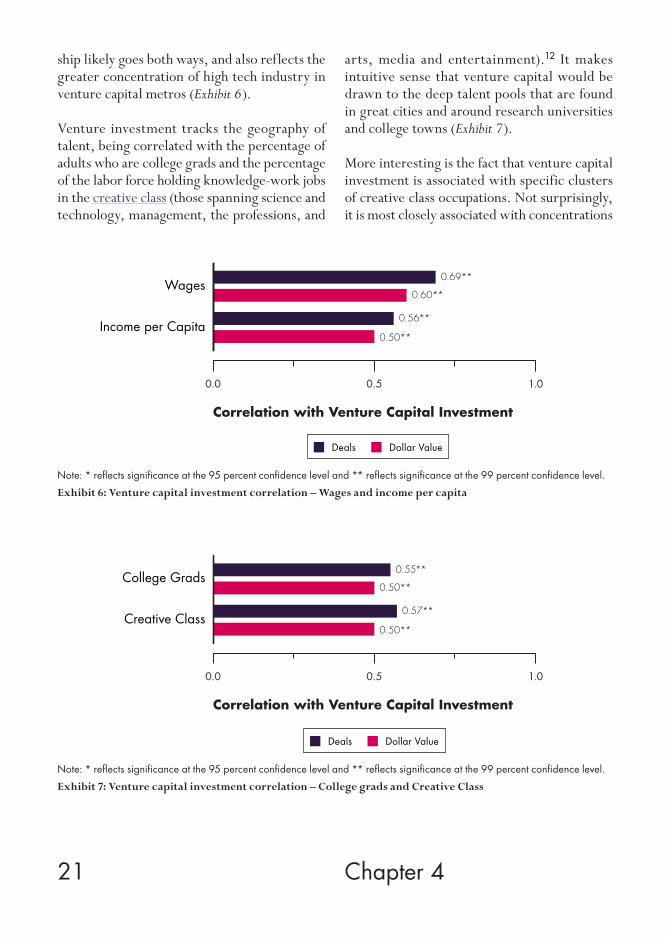
ship likely goes both ways, and also reflects the greater concentration of high tech industry in venture capital metros (Exhibit 6).
Venture investment tracks the geography of talent, being correlated with the percentage of adults who are college grads and the percentage of the labor force holding knowledge-work jobs in the creative class (those spanning science and technology, management, the professions, and
arts, media and entertainment).12 It makes intuitive sense that venture capital would be drawn to the deep talent pools that are found in great cities and around research universities and college towns (Exhibit 7).
More interesting is the fact that venture capital investment is associated with specific clusters of creative class occupations. Not surprisingly, it is most closely associated with concentrations
Chapter 4
Wages
Income per Capita
Correlation with Venture Capital Investment
0.50.0 1.0
0.69**
0.60**
0.56**
0.50**
Deals Dollar Value
Exhibit 6: Venture capital investment correlation – Wages and income per capitaNote: * reflects significance at the 95 percent confidence level and ** reflects significance at the 99 percent confidence level.
College Grads
Creative Class
0.0
0.55**
0.50**
0.57**
0.50**
Correlation with Venture Capital Investment
0.5 1.0
Deals Dollar Value
Exhibit 7: Venture capital investment correlation – College grads and Creative ClassNote: * reflects significance at the 95 percent confidence level and ** reflects significance at the 99 percent confidence level.
22 Startup City
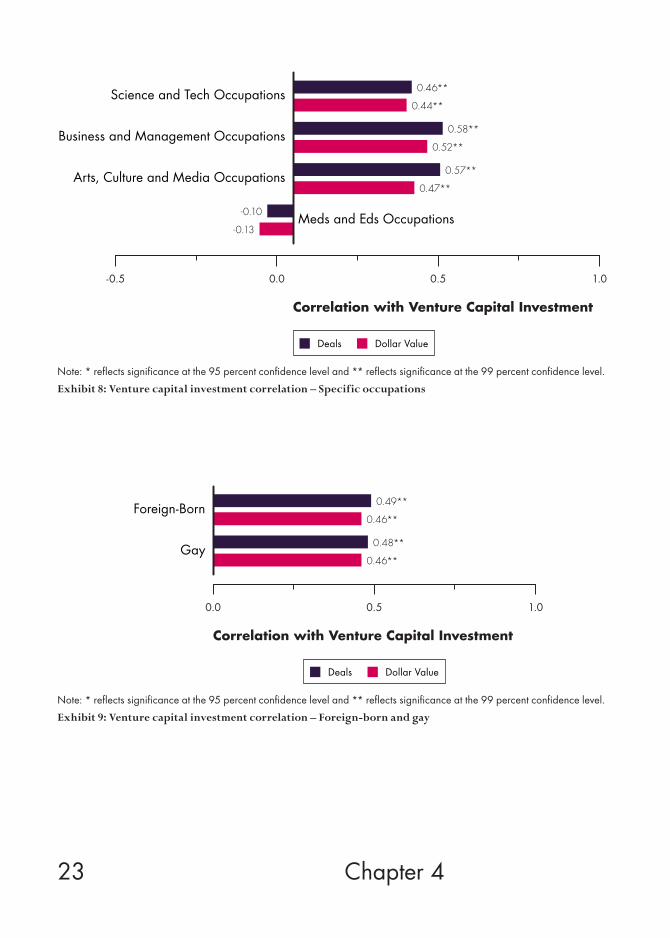
of science and technology workers. But venture investment is also closely associated with busi-ness and management occupations and also with arts, media and entertainment occupations. This is likely a reflection of the increasingly multifaceted nature of startups. Venture capi-talists have pointed out time and time again that having a solid management team in place is as important to a startup’s business success, if not more so, than having a cutting-edge technolo-gy. Plus, a growing number of high tech fields demand not just great technology but innova-tive, user-friendly designs. Steve Jobs credited his arts and design background and training as the key to his success in creating market-defin-ing products from the Macintosh to the iPhone and iPad. Apple’s continuing success reflects the synergies that come from the integration of scientific and technological, arts and design, and business management and marketing cre-ativity and skill. As the venture capitalist Fred Wilson told me recently,13 a new generation of tech talent see themselves as creative artists as much as engineers or entrepreneurs; as such, they are drawn to the cultural environment of big cities.
While many economic development experts and mayors, especially in older industrial com-munities, have pinned their hopes on the role that “eds and meds” (higher education and med-ical institutions) supposedly play in stimulating high tech development, our analysis finds little to no significant statistical associations between eds and meds employment and venture capi-tal investment (Exhibit 8). This is in line with other research, which finds that eds and meds do not play a direct role in urban and regional development.14
Venture capital investment and startup activ-ity are also associated with the diversity and
openness of metros. Numerous studies have documented the large share of foreign-born en-gineers in high technology fields; indeed, im-migrants make up a considerable share of the founders of high tech startups.15 We find ven-ture capital to be positively correlated with the share of adults who are foreign-born (Exhibit 9).
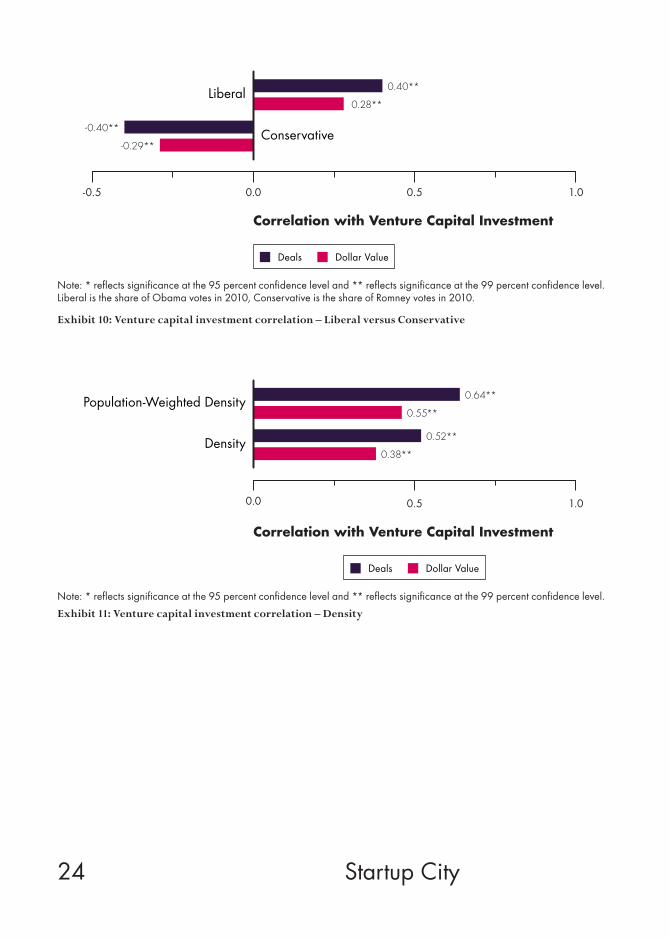
The association between venture capital and the gay and lesbian share of the population is posi-tive as well. The reason for this is not that gays and lesbians launch more high tech enterprises than straight people, but that high tech startups are more likely to be conceived and created in places that are open to new ideas and accepting of different kinds of people. As Gary Gates and I have documented, locations that welcome gays are also likely to have an underlying openness to innovation and risk that is attractive to en-trepreneurs.16
Perhaps more surprisingly, venture capital re-flects the much-documented liberal and con-servative or red-blue divide between Amer-ican states.17 It is positively associated with a more liberal political orientation, measured as a metro’s share of Obama votes, and negatively correlated with a more conservative orienta-tion, measured as its share of Romney votes (Exhibit 10).
Ever since Jane Jacobs, urbanists and econo-mists have argued that dense urban areas pro-mote physical proximity and hence the kinds of serendipitous encounters that encourage in-formation sharing, spurring innovation and the formation of new business enterprises.18 Our analysis suggests that venture capital and start-up activity are associated with these character-istics of urban form and structure. We find a positive association between density (measured as people per square mile) and venture capital.
23 Chapter 4
0.0-0.5 0.5 1.0
Arts, Culture and Media Occupations
Business and Management Occupations
Science and Tech Occupations
Meds and Eds Occupations
0.57**
0.47**
-0.10
-0.13
0.46**
0.44**
0.58**
0.52**
Correlation with Venture Capital Investment
Deals Dollar Value
Exhibit 8: Venture capital investment correlation – Specific occupationsNote: * reflects significance at the 95 percent confidence level and ** reflects significance at the 99 percent confidence level.
Correlation with Venture Capital Investment
0.0 0.5 1.0
Foreign-Born 0.49**
0.46**
Gay 0.48**
0.46**
Deals Dollar Value
Exhibit 9: Venture capital investment correlation – Foreign-born and gayNote: * reflects significance at the 95 percent confidence level and ** reflects significance at the 99 percent confidence level.
24 Startup City
0.40**
0.28**Liberal
Conservative-0.40**
-0.29**
1.00.50.0-0.5
Correlation with Venture Capital Investment
Deals Dollar Value
Note: * reflects significance at the 95 percent confidence level and ** reflects significance at the 99 percent confidence level.Liberal is the share of Obama votes in 2010, Conservative is the share of Romney votes in 2010.
Exhibit 10: Venture capital investment correlation – Liberal versus Conservative
Population-Weighted Density 0.64**
0.55**
Density 0.52**
0.38**
0.0
Correlation with Venture Capital Investment
0.5 1.0
Deals Dollar Value
Note: * reflects significance at the 95 percent confidence level and ** reflects significance at the 99 percent confidence level.
Exhibit 11: Venture capital investment correlation – Density
25 Chapter 4
We find an even closer association between ven-ture capital and an improved measure of pop-ulation-weighted density that more accurately reflects density in and around the urban core.19 (Exhibit 11)
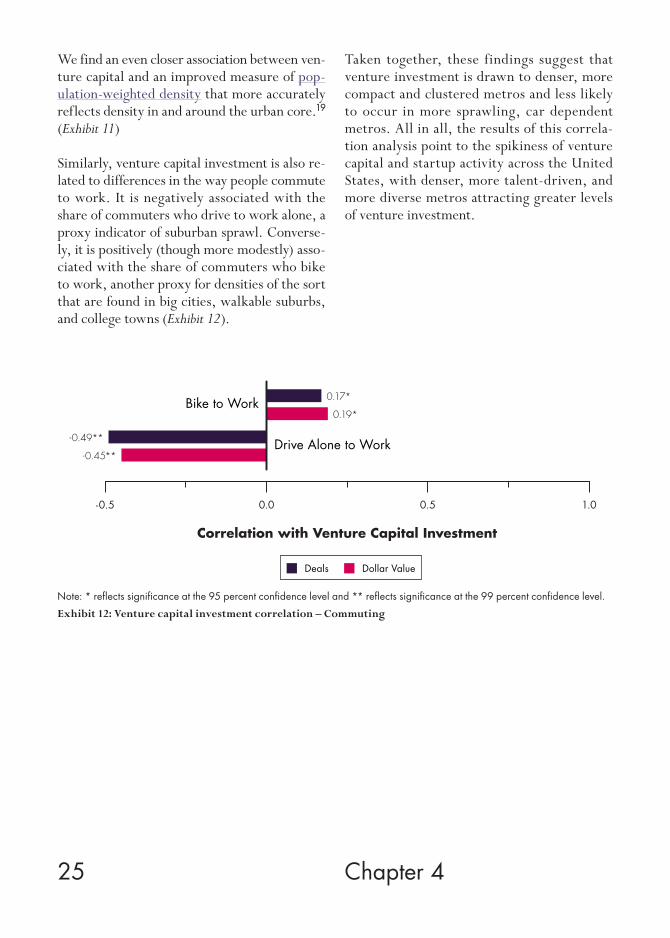
Similarly, venture capital investment is also re-lated to differences in the way people commute to work. It is negatively associated with the share of commuters who drive to work alone, a proxy indicator of suburban sprawl. Converse-ly, it is positively (though more modestly) asso-ciated with the share of commuters who bike to work, another proxy for densities of the sort that are found in big cities, walkable suburbs, and college towns (Exhibit 12).
Taken together, these findings suggest that venture investment is drawn to denser, more compact and clustered metros and less likely to occur in more sprawling, car dependent metros. All in all, the results of this correla-tion analysis point to the spikiness of venture capital and startup activity across the United States, with denser, more talent-driven, and more diverse metros attracting greater levels of venture investment.
0.17*
0.19*Bike to Work
Drive Alone to Work-0.49**
-0.45**
1.00.50.0-0.5
Correlation with Venture Capital Investment
Deals Dollar Value
Exhibit 12: Venture capital investment correlation – CommutingNote: * reflects significance at the 95 percent confidence level and ** reflects significance at the 99 percent confidence level.
26 Startup City
5. Venture Capital and Startup Activity by Area Code
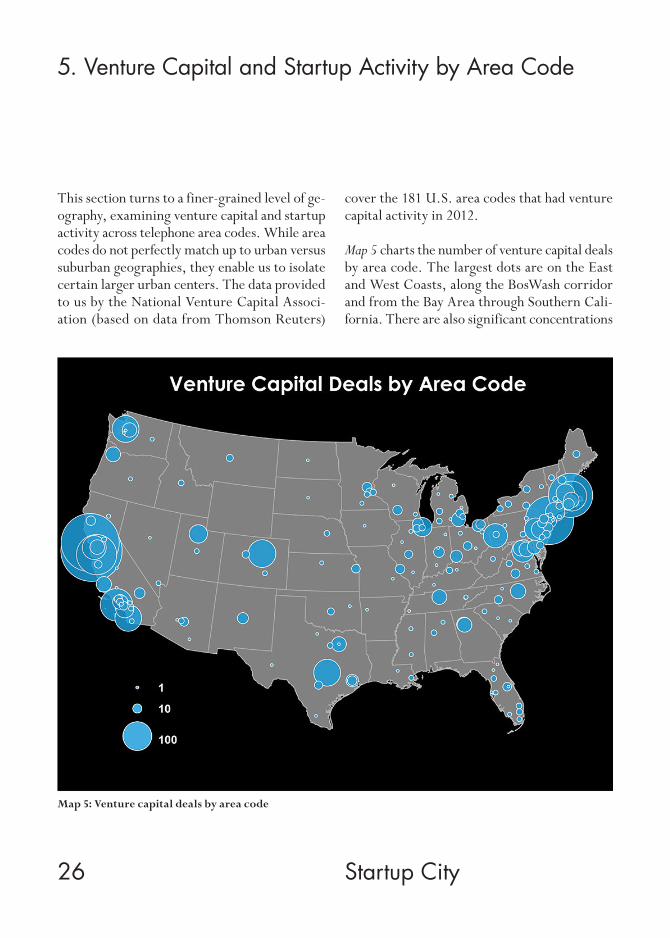
This section turns to a finer-grained level of ge-ography, examining venture capital and startup activity across telephone area codes. While area codes do not perfectly match up to urban versus suburban geographies, they enable us to isolate certain larger urban centers. The data provided to us by the National Venture Capital Associ-ation (based on data from Thomson Reuters)
cover the 181 U.S. area codes that had venture capital activity in 2012.
Map 5 charts the number of venture capital deals by area code. The largest dots are on the East and West Coasts, along the BosWash corridor and from the Bay Area through Southern Cali-fornia. There are also significant concentrations
Map 5: Venture capital deals by area code
27 Chapter 5
Exhibit 13: Leading area codes for venture capital deals
Venture Capital Deals
(Area Code) Places
(650) Silicon Valley, CA
(415) San Francisco and Marin, CA
(212) Manhattan, NY
(617) Boston-Cambridge, MA
(408) Silicon Valley, CA
(310) West LA to Malibu, CA
(781) Route 128 outside Boston, MA
(303) Denver-Boulder, CO
(512) Austin and surrounding area, TX
(206) Seattle, Mercer Island, WA
(858) San Diego, La Jolla, andsurrounding area, CA
(412) Pittsburgh and surrounding area
(510) Berkeley, Oakland, Emeryville, CA
(703) Northern Virginia suburbs
(610) Philadelphia Main Line suburbs, PA
(203) Bridgeport-Stamford-Norwalk, CT
(312) Downtown Chicago, IL
(978) Lowell, Lawrence, Northeast Massachusetts
(949) Orange County, CA
(801) Salt Lake City, Provo andsurrounding area, UT
457
410
284
237
196
128
109
93
87
87
86
71
70
60
60
46
45
42
41
41
(215) Philadelphia and close by suburbs, PA 38
(508) Southeastern Massachusetts, Cape Cod,Martha’s Vineyard and Nantucket 29
(805) Santa Barbara and Ventura, CA 28
(919) Research Triangle, NC 28
(301) Maryland suburbs of Washington DC 28
28 Startup City
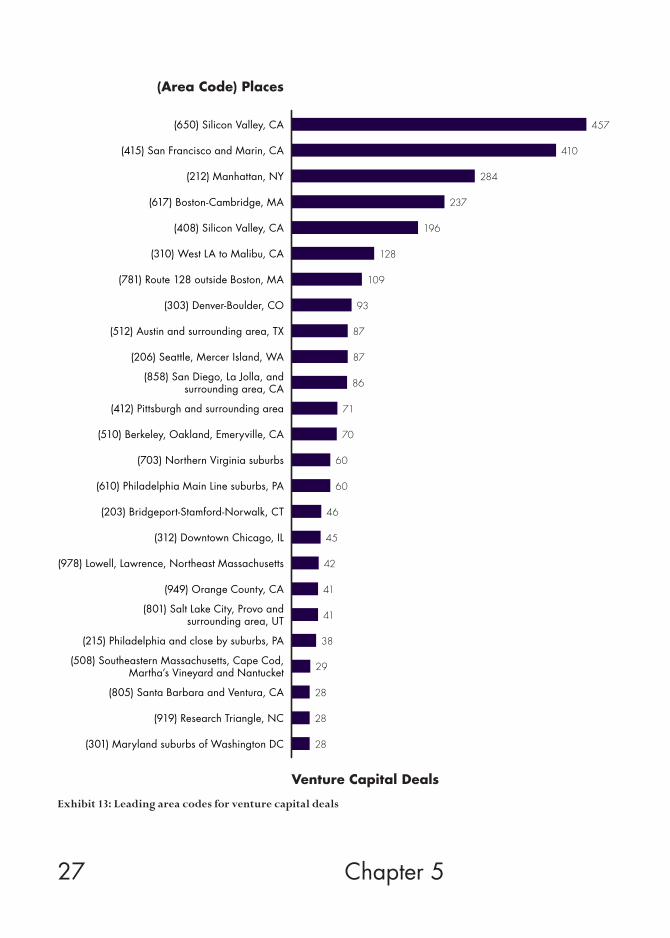
in Texas, Seattle, Portland, the North Carolina Research Triangle, Denver and Boulder, Salt Lake City and Provo, Chicago, Pittsburgh, and several other locations. Exhibit 13 lists the top 25 area codes for venture capital deals (see the Appendix for greater detail).
The top ranked area code is Silicon Valley’s 650, which includes Palo Alto, Mountain View, Sun-ny Vale and Los Altos. But right behind it is the 415 area code that covers the city of San Francis-co. The 212 area code of Manhattan is third and the 617 area code for the Boston-Cambridge area is fourth. Another Silicon Valley area code, 408, is fifth. West LA’s 301 area code — includ-ing Brentwood, Bel Air, Beverly Hills and es-pecially Venice and Malibu — is in sixth place;
Denver-Boulder, Seattle and Austin round out the top 10. The rest of the top 25 include urban areas like Berkeley-Oakland-Emeryville and downtown Chicago and Philadelphia, as well as such classic suburban nerdistans as Northern Virginia, Bellevue-Redmond outside Seattle, and the North Carolina Research Triangle.
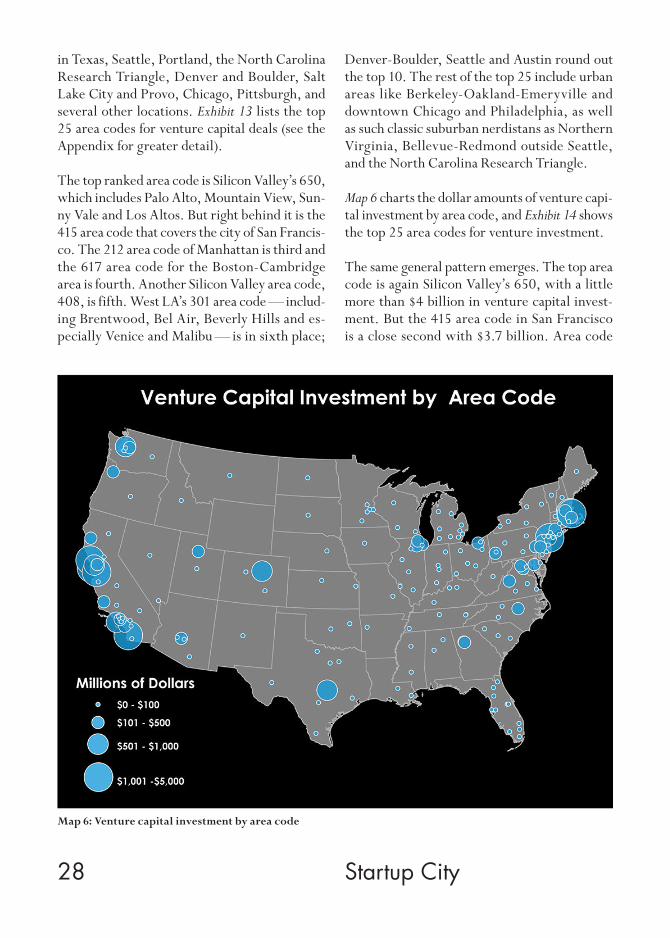
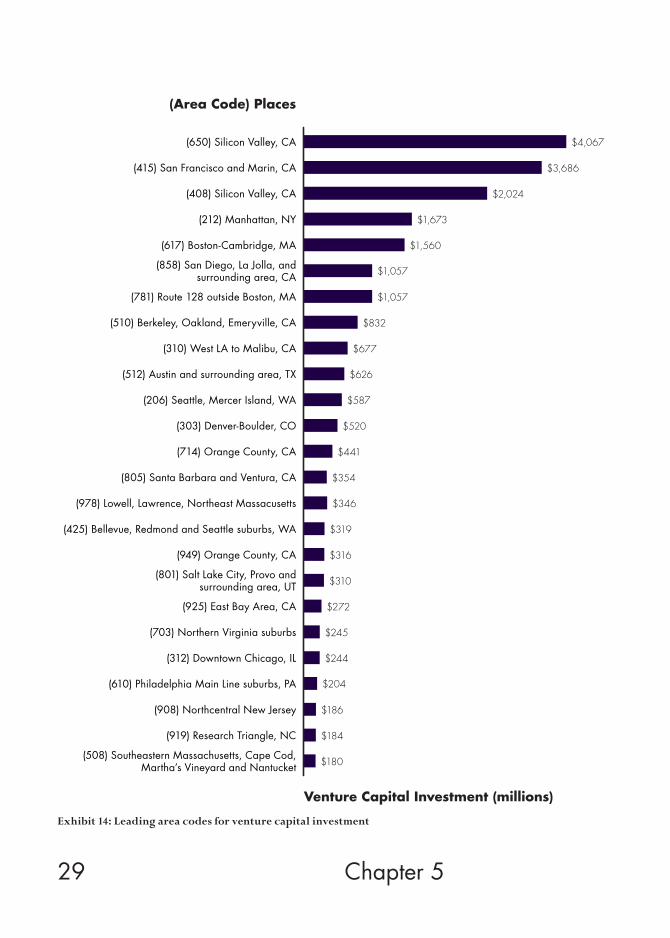
Map 6 charts the dollar amounts of venture capi-tal investment by area code, and Exhibit 14 shows the top 25 area codes for venture investment.
The same general pattern emerges. The top area code is again Silicon Valley’s 650, with a little more than $4 billion in venture capital invest-ment. But the 415 area code in San Francisco is a close second with $3.7 billion. Area code
Map 6: Venture capital investment by area code
29 Chapter 5
Exhibit 14: Leading area codes for venture capital investment
Venture Capital Investment (millions)
(Area Code) Places
(650) Silicon Valley, CA
(415) San Francisco and Marin, CA
(408) Silicon Valley, CA
(212) Manhattan, NY
(617) Boston-Cambridge, MA
(858) San Diego, La Jolla, andsurrounding area, CA
(781) Route 128 outside Boston, MA
(510) Berkeley, Oakland, Emeryville, CA
(310) West LA to Malibu, CA
(512) Austin and surrounding area, TX
(206) Seattle, Mercer Island, WA
(303) Denver-Boulder, CO
(714) Orange County, CA
(805) Santa Barbara and Ventura, CA
(978) Lowell, Lawrence, Northeast Massacusetts
(425) Bellevue, Redmond and Seattle suburbs, WA
(949) Orange County, CA
(801) Salt Lake City, Provo andsurrounding area, UT
(925) East Bay Area, CA
(703) Northern Virginia suburbs
$4,067
$3,686
$2,024
$1,673
$1,560
$1,057
$1,057
$832
$677
$626
$587
$520
$441
$354
$346
$319
$316
$310
$272
$245
(312) Downtown Chicago, IL $244
(610) Philadelphia Main Line suburbs, PA $204
(908) Northcentral New Jersey $186
(919) Research Triangle, NC $184
(508) Southeastern Massachusetts, Cape Cod,Martha’s Vineyard and Nantucket $180
30 Startup City
408, also in Silicon Valley, is now third with roughly $2 billion. Manhattan’s 212 area code is fourth with $1.7 billion; and the 617 area code for Boston-Cambridge is fifth with $1.6 billion. The rest of the top 25 include a number of urban areas — like Berkeley-Oakland-Em-eryville, West LA, downtown Chicago, and Philadelphia — as well as suburban areas in Northern Virginia, the Route 128 suburbs of Boston, the Research Triangle, and others.
The main takeaway: Our analysis of venture capital investment by area code provides ad-ditional evidence of the urban shift in venture capital and startup activity. While Silicon Val-ley retains the top and third ranked area codes, urban area codes for San Francisco, Manhattan, Boston and Cambridge, Berkeley, and even downtown Chicago also rank among the na-tion’s leading centers of venture investment and startup activity.
31 Startup City
6. Venture Capital and Startup Activity by Zip Code
This section examines the micro-geography of venture capital invest-ment and startup activity at the zip code level. It is based on detailed data provided by Dow Jones for eleven leading centers for venture capital activity for 11 metros — San Francisco, Boston-Cambridge, New York, Los Angeles, San Diego, Seattle, Austin, Chicago, Wash-ington, DC, Dallas, and Philadelphia and two combined regions: the San Francisco Bay Area (San Francisco and San Jose) and Washing-ton, DC-Baltimore. Taken together, these metros account for almost three-quarters of U.S. venture capital activity. These data enable us to distinguish venture capital investment and startup activity that takes place in center cities versus suburbs.20 The data are for 2011 and thus differ from the metro and area code data above that cover 2012.
32 Chapter 6
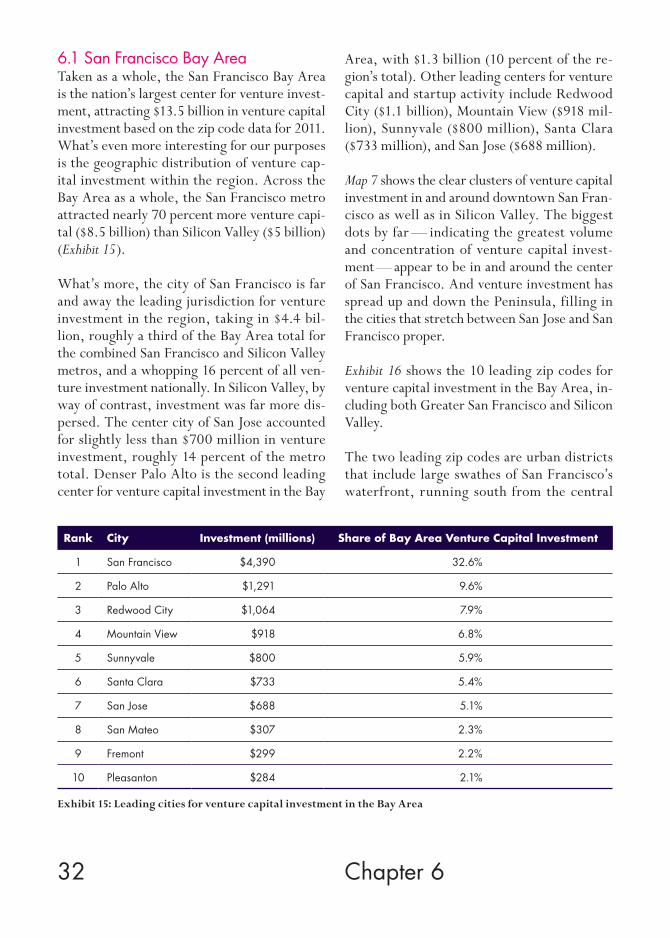
6.1 San Francisco Bay AreaTaken as a whole, the San Francisco Bay Area is the nation’s largest center for venture invest-ment, attracting $13.5 billion in venture capital investment based on the zip code data for 2011. What’s even more interesting for our purposes is the geographic distribution of venture cap-ital investment within the region. Across the Bay Area as a whole, the San Francisco metro attracted nearly 70 percent more venture capi-tal ($8.5 billion) than Silicon Valley ($5 billion) (Exhibit 15).
What’s more, the city of San Francisco is far and away the leading jurisdiction for venture investment in the region, taking in $4.4 bil-lion, roughly a third of the Bay Area total for the combined San Francisco and Silicon Valley metros, and a whopping 16 percent of all ven-ture investment nationally. In Silicon Valley, by way of contrast, investment was far more dis-persed. The center city of San Jose accounted for slightly less than $700 million in venture investment, roughly 14 percent of the metro total. Denser Palo Alto is the second leading center for venture capital investment in the Bay
Area, with $1.3 billion (10 percent of the re-gion’s total). Other leading centers for venture capital and startup activity include Redwood City ($1.1 billion), Mountain View ($918 mil-lion), Sunnyvale ($800 million), Santa Clara ($733 million), and San Jose ($688 million).
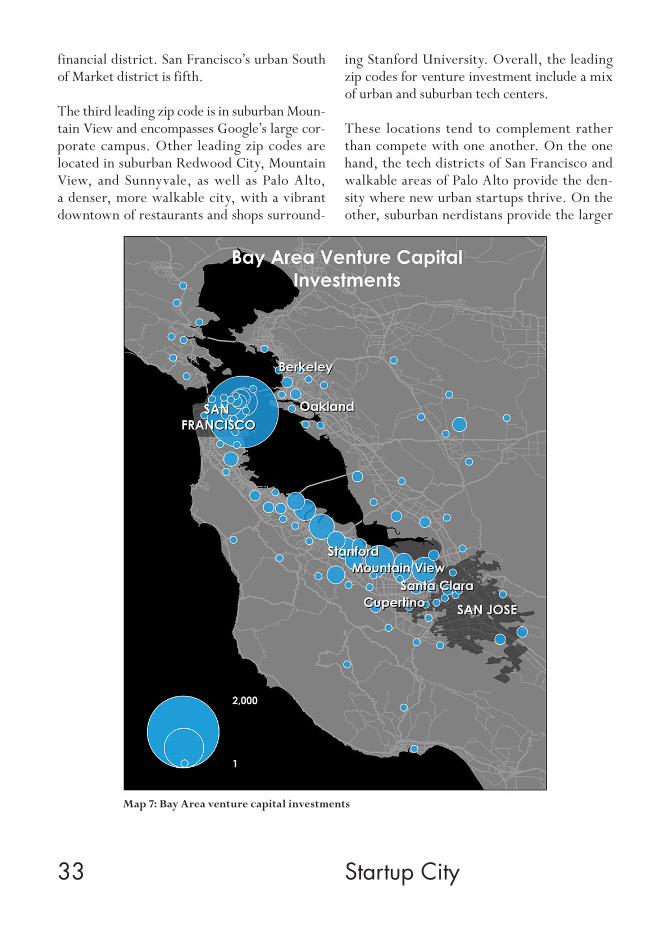
Map 7 shows the clear clusters of venture capital investment in and around downtown San Fran-cisco as well as in Silicon Valley. The biggest dots by far — indicating the greatest volume and concentration of venture capital invest-ment — appear to be in and around the center of San Francisco. And venture investment has spread up and down the Peninsula, filling in the cities that stretch between San Jose and San Francisco proper.
Exhibit 16 shows the 10 leading zip codes for venture capital investment in the Bay Area, in-cluding both Greater San Francisco and Silicon Valley.
The two leading zip codes are urban districts that include large swathes of San Francisco’s waterfront, running south from the central
Exhibit 15: Leading cities for venture capital investment in the Bay Area
Rank City Investment (millions) Share of Bay Area Venture Capital Investment
1 San Francisco $4,390 32.6%
2 Palo Alto $1,291 9.6%
3 Redwood City $1,064 7.9%
4 Mountain View $918 6.8%
5 Sunnyvale $800 5.9%
6 Santa Clara $733 5.4%
7 San Jose $688 5.1%
8 San Mateo $307 2.3%
9 Fremont $299 2.2%
10 Pleasanton $284 2.1%
33 Startup City
financial district. San Francisco’s urban South of Market district is fifth.
The third leading zip code is in suburban Moun-tain View and encompasses Google’s large cor-porate campus. Other leading zip codes are located in suburban Redwood City, Mountain View, and Sunnyvale, as well as Palo Alto, a denser, more walkable city, with a vibrant downtown of restaurants and shops surround-
ing Stanford University. Overall, the leading zip codes for venture investment include a mix of urban and suburban tech centers.
These locations tend to complement rather than compete with one another. On the one hand, the tech districts of San Francisco and walkable areas of Palo Alto provide the den-sity where new urban startups thrive. On the other, suburban nerdistans provide the larger
Map 7: Bay Area venture capital investments
34 Chapter 6
footprints that established companies like Ap-ple, Facebook, Google and others require. The close connection between urban and suburban tech is reflected in the shuttle buses these com-panies have long run between their suburban campuses and downtown San Francisco, where many tech workers prefer to live. Overall, the region has shown an ability to adapt to geo-graphic shifts that in some ways mirrors its long-standing ability to adapt to technological shifts. Instead of being challenged by the urban tech shift, the Bay Area as whole has benefitted from it, consolidating its position as the world’s leading center for venture capital investment and startup activity.21
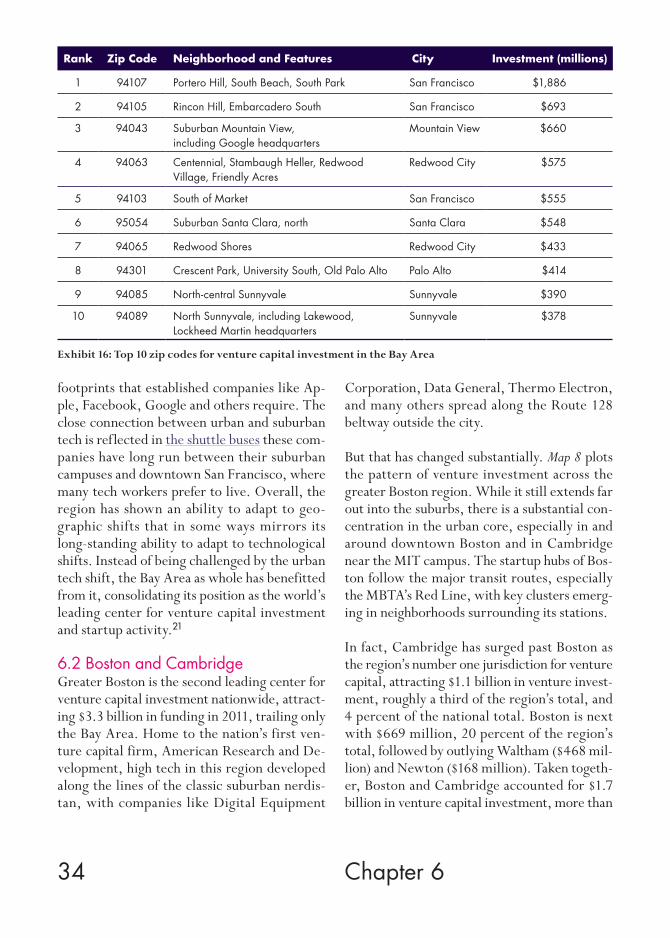
6.2 Boston and CambridgeGreater Boston is the second leading center for venture capital investment nationwide, attract-ing $3.3 billion in funding in 2011, trailing only the Bay Area. Home to the nation’s first ven-ture capital firm, American Research and De-velopment, high tech in this region developed along the lines of the classic suburban nerdis-tan, with companies like Digital Equipment
Corporation, Data General, Thermo Electron, and many others spread along the Route 128 beltway outside the city.
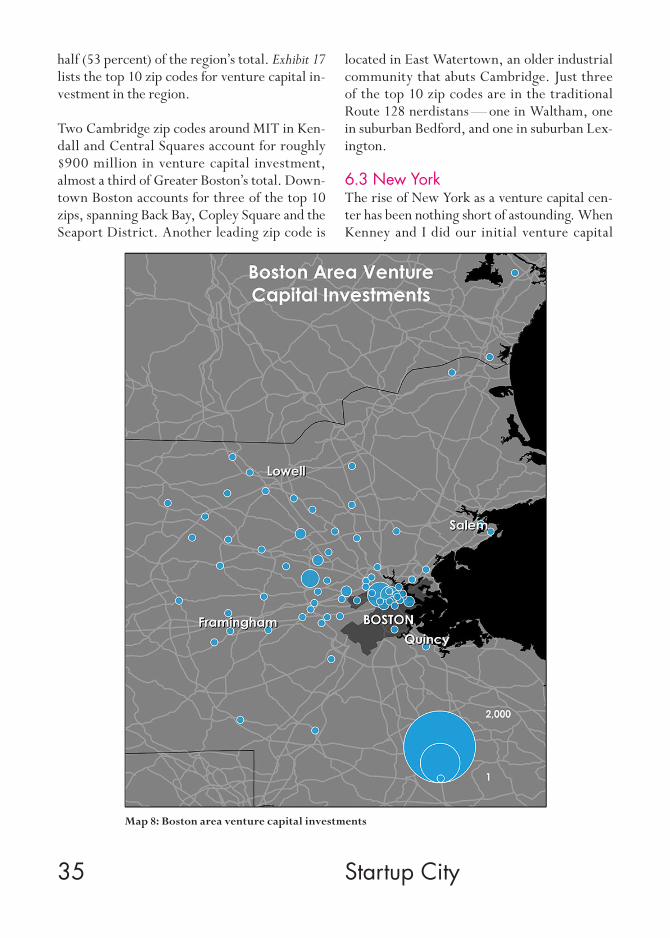
But that has changed substantially. Map 8 plots the pattern of venture investment across the greater Boston region. While it still extends far out into the suburbs, there is a substantial con-centration in the urban core, especially in and around downtown Boston and in Cambridge near the MIT campus. The startup hubs of Bos-ton follow the major transit routes, especially the MBTA’s Red Line, with key clusters emerg-ing in neighborhoods surrounding its stations.
In fact, Cambridge has surged past Boston as the region’s number one jurisdiction for venture capital, attracting $1.1 billion in venture invest-ment, roughly a third of the region’s total, and 4 percent of the national total. Boston is next with $669 million, 20 percent of the region’s total, followed by outlying Waltham ($468 mil-lion) and Newton ($168 million). Taken togeth-er, Boston and Cambridge accounted for $1.7 billion in venture capital investment, more than
Exhibit 16: Top 10 zip codes for venture capital investment in the Bay Area
Rank Zip Code Neighborhood and Features City Investment (millions)
1 94107 Portero Hill, South Beach, South Park San Francisco $1,886
2 94105 Rincon Hill, Embarcadero South San Francisco $693
3 94043 Suburban Mountain View, including Google headquarters
Mountain View $660
4 94063 Centennial, Stambaugh Heller, Redwood Village, Friendly Acres
Redwood City $575
5 94103 South of Market San Francisco $555
6 95054 Suburban Santa Clara, north Santa Clara $548
7 94065 Redwood Shores Redwood City $433
8 94301 Crescent Park, University South, Old Palo Alto Palo Alto $414
9 94085 North-central Sunnyvale Sunnyvale $390
10 94089 North Sunnyvale, including Lakewood, Lockheed Martin headquarters
Sunnyvale $378
35 Startup City
half (53 percent) of the region’s total. Exhibit 17 lists the top 10 zip codes for venture capital in-vestment in the region.
Two Cambridge zip codes around MIT in Ken-dall and Central Squares account for roughly $900 million in venture capital investment, almost a third of Greater Boston’s total. Down-town Boston accounts for three of the top 10 zips, spanning Back Bay, Copley Square and the Seaport District. Another leading zip code is
located in East Watertown, an older industrial community that abuts Cambridge. Just three of the top 10 zip codes are in the traditional Route 128 nerdistans — one in Waltham, one in suburban Bedford, and one in suburban Lex-ington.
6.3 New YorkThe rise of New York as a venture capital cen-ter has been nothing short of astounding. When Kenney and I did our initial venture capital
Map 8: Boston area venture capital investments
36 Chapter 6
Exhibit 17: Top 10 zip codes for venture capital investment in Greater Boston
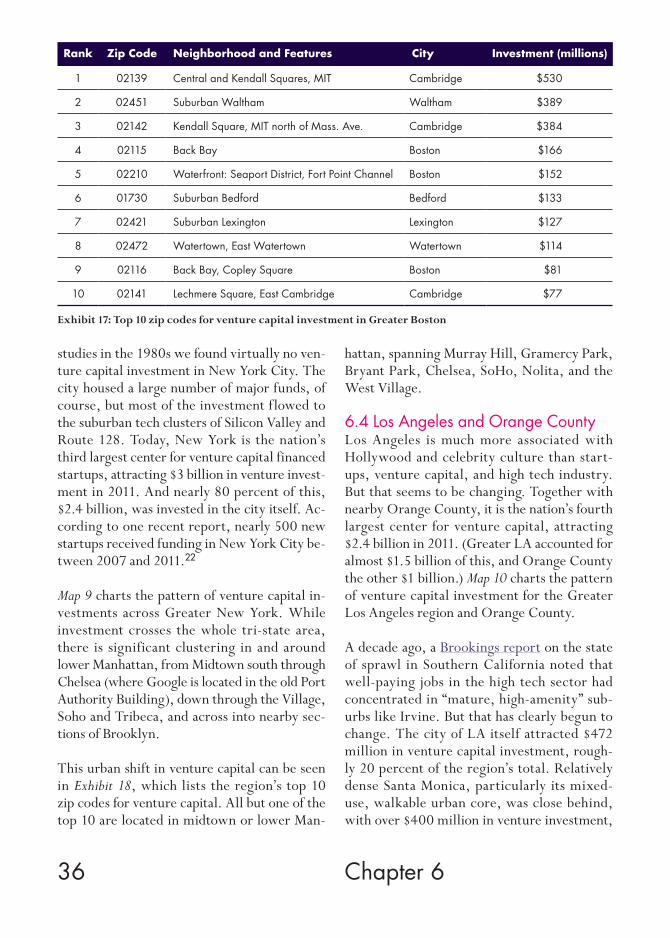
studies in the 1980s we found virtually no ven-ture capital investment in New York City. The city housed a large number of major funds, of course, but most of the investment flowed to the suburban tech clusters of Silicon Valley and Route 128. Today, New York is the nation’s third largest center for venture capital financed startups, attracting $3 billion in venture invest-ment in 2011. And nearly 80 percent of this, $2.4 billion, was invested in the city itself. Ac-cording to one recent report, nearly 500 new startups received funding in New York City be-tween 2007 and 2011.22
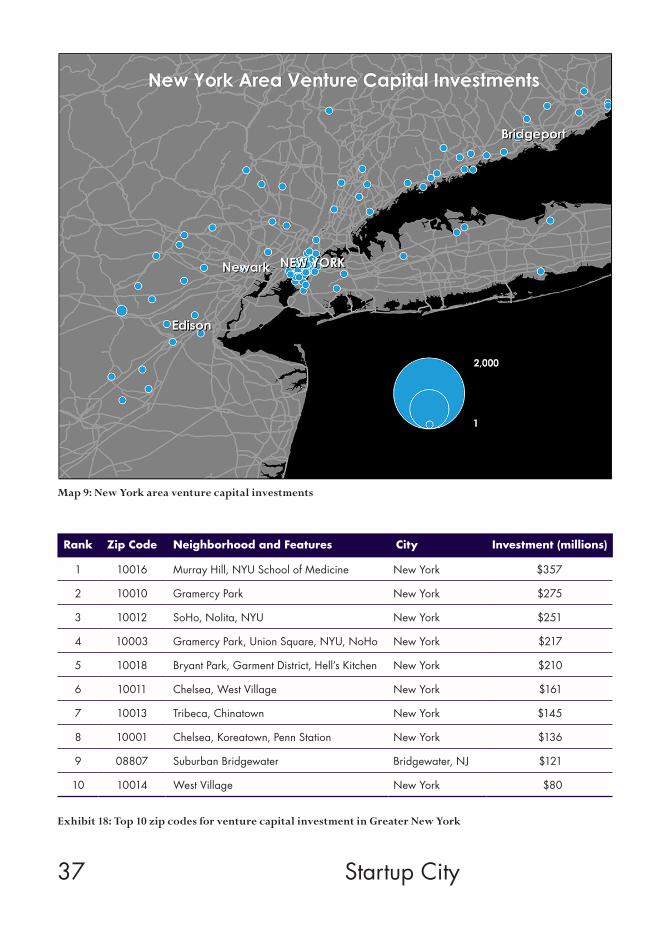
Map 9 charts the pattern of venture capital in-vestments across Greater New York. While investment crosses the whole tri-state area, there is significant clustering in and around lower Manhattan, from Midtown south through Chelsea (where Google is located in the old Port Authority Building), down through the Village, Soho and Tribeca, and across into nearby sec-tions of Brooklyn.
This urban shift in venture capital can be seen in Exhibit 18, which lists the region’s top 10 zip codes for venture capital. All but one of the top 10 are located in midtown or lower Man-
hattan, spanning Murray Hill, Gramercy Park, Bryant Park, Chelsea, SoHo, Nolita, and the West Village.
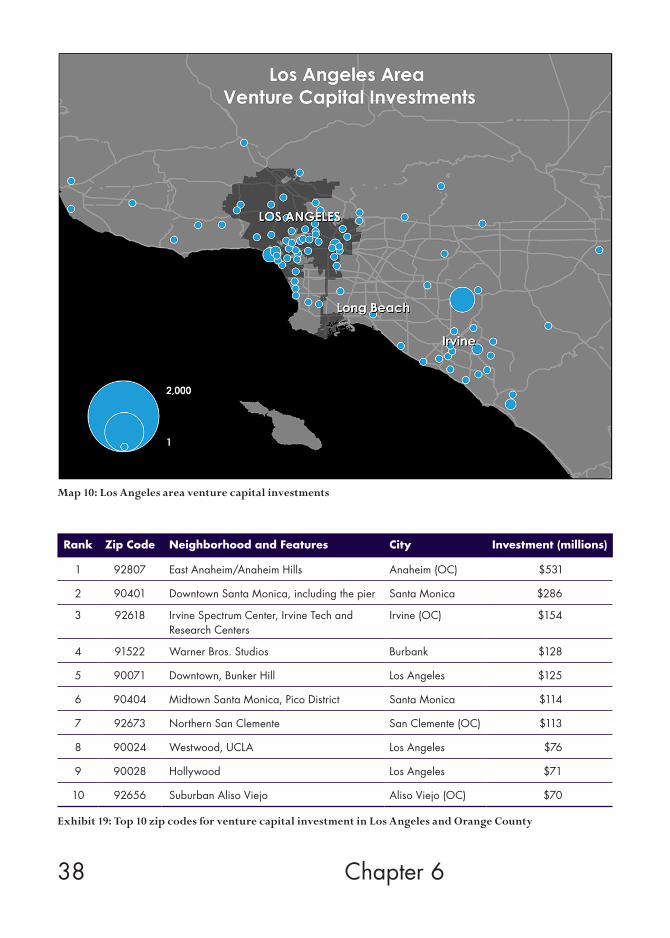
6.4 Los Angeles and Orange CountyLos Angeles is much more associated with Hollywood and celebrity culture than start-ups, venture capital, and high tech industry. But that seems to be changing. Together with nearby Orange County, it is the nation’s fourth largest center for venture capital, attracting $2.4 billion in 2011. (Greater LA accounted for almost $1.5 billion of this, and Orange County the other $1 billion.) Map 10 charts the pattern of venture capital investment for the Greater Los Angeles region and Orange County.
A decade ago, a Brookings report on the state of sprawl in Southern California noted that well-paying jobs in the high tech sector had concentrated in “mature, high-amenity” sub-urbs like Irvine. But that has clearly begun to change. The city of LA itself attracted $472 million in venture capital investment, rough-ly 20 percent of the region’s total. Relatively dense Santa Monica, particularly its mixed-use, walkable urban core, was close behind, with over $400 million in venture investment,
Rank Zip Code Neighborhood and Features City Investment (millions)
1 02139 Central and Kendall Squares, MIT Cambridge $530
2 02451 Suburban Waltham Waltham $389
3 02142 Kendall Square, MIT north of Mass. Ave. Cambridge $384
4 02115 Back Bay Boston $166
5 02210 Waterfront: Seaport District, Fort Point Channel Boston $152
6 01730 Suburban Bedford Bedford $133
7 02421 Suburban Lexington Lexington $127
8 02472 Watertown, East Watertown Watertown $114
9 02116 Back Bay, Copley Square Boston $81
10 02141 Lechmere Square, East Cambridge Cambridge $77
37 Startup City
Map 9: New York area venture capital investments
Exhibit 18: Top 10 zip codes for venture capital investment in Greater New York
Rank Zip Code Neighborhood and Features City Investment (millions)
1 10016 Murray Hill, NYU School of Medicine New York $357
2 10010 Gramercy Park New York $275
3 10012 SoHo, Nolita, NYU New York $251
4 10003 Gramercy Park, Union Square, NYU, NoHo New York $217
5 10018 Bryant Park, Garment District, Hell’s Kitchen New York $210
6 10011 Chelsea, West Village New York $161
7 10013 Tribeca, Chinatown New York $145
8 10001 Chelsea, Koreatown, Penn Station New York $136
9 08807 Suburban Bridgewater Bridgewater, NJ $121
10 10014 West Village New York $80
38 Chapter 6
Map 10: Los Angeles area venture capital investments
Exhibit 19: Top 10 zip codes for venture capital investment in Los Angeles and Orange County
Rank Zip Code Neighborhood and Features City Investment (millions)
1 92807 East Anaheim/Anaheim Hills Anaheim (OC) $531
2 90401 Downtown Santa Monica, including the pier Santa Monica $286
3 92618 Irvine Spectrum Center, Irvine Tech and Research Centers
Irvine (OC) $154
4 91522 Warner Bros. Studios Burbank $128
5 90071 Downtown, Bunker Hill Los Angeles $125
6 90404 Midtown Santa Monica, Pico District Santa Monica $114
7 92673 Northern San Clemente San Clemente (OC) $113
8 90024 Westwood, UCLA Los Angeles $76
9 90028 Hollywood Los Angeles $71
10 92656 Suburban Aliso Viejo Aliso Viejo (OC) $70
39 Startup City
or 16.9 percent of the regional total. Togeth-er, these two places accounted for nearly $900 million in venture investment, 36.7 percent of the region’s total.
Exhibit 19 shows the top 10 zip codes for ven-ture capital investment in Greater LA includ-ing Orange County. The top-ranked zip code is East Anaheim in northern Orange County. An office-park heavy area of Irvine is third on the list. But several far more urban zips also rank highly. Two downtown Santa Monica zip codes, which include the iconic Santa Monica Pier and the Pico District, rank second and sixth, attracting $400 million in combined venture investment. Downtown LA and Bunker Hill rank fifth, drawing in $125 million in venture capital. Zip codes in the Westwood area around UCLA and Hollywood are eighth and ninth,
taking in a combined $147 million in venture capital.
Venture capitalist Mark Suster explains the ur-ban shift in startup activity and venture capital in the region this way. “In LA, companies used to be concentrated near Pasadena or in the San Fernando Valley,” he wrote on his blog. “These days it’s Santa Monica and Venice. Not exactly ‘urban’ in the way you think of SF or NY but certainly relative to the suburban communities of LA and at a minimum it’s where young peo-ple want to live/hang out.”23
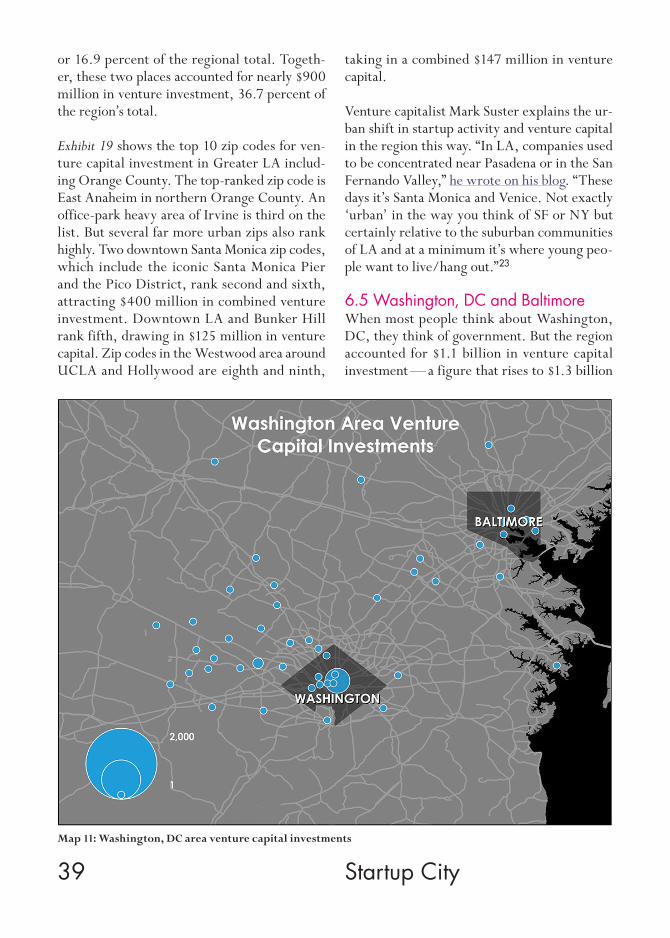
6.5 Washington, DC and BaltimoreWhen most people think about Washington, DC, they think of government. But the region accounted for $1.1 billion in venture capital investment — a figure that rises to $1.3 billion
Map 11: Washington, DC area venture capital investments
40 Chapter 6
Rank Zip Code Neighborhood and Features City Investment (millions)
1 20005 Downtown, Logan Circle Washington, DC $548
2 22314 Downtown Alexandria Alexandria $74
3 21224 Eastern Downtown, Patterson Park, Canton Baltimore $37
4 21218 Johns Hopkins University, Coldstream-Homestead-Montebello
Baltimore $35
5 20814 Downtown Bethesda Bethesda $33
6 20037 Downtown, George Washington University Washington, DC $26
7 20850 Rockville Rockville $26
8 20007 Georgetown, Burleith-Hillandale, Foxhall Village
Washington, DC $21
9 20190 Downtown Reston Reston $18
10 20191 Suburban Reston Reston $12
Exhibit 20: Top 10 zip codes for venture capital investment in Greater Washington, DC
when combined with neighboring Baltimore (Map 11).
The Greater Washington, DC region has long been seen as the paradigmatic example of what Joel Garreau dubbed the “Edge City” model of development, in which suburban office parks and shopping malls replicate and replace many of the functions of the center city.24 High tech development in the region followed the nerdis-tan model, with major centers clustered around AOL in northern Virginia and surrounding the National Institute of Health in suburban Maryland.
But venture capital investment and startup ac-tivity in the region now reflects the urban shift. Nearly half of the region’s total (47.5 percent), or $600 million, went to the District of Colum- bia proper, the bulk of it flowing to a single zip code that spans McPherson Square, Thomas Circle, and Logan Circle (note the large dot near the center of the city).
The urban shift is also reflected in significant venture capital investments in mixed-used,
transit-oriented, walkable suburbs like Alex-andria, Virginia, which attracted nearly $75 million in venture investment and Bethesda, Maryland, which pulled in $33 million (Ex-hibit 20). The city of Baltimore attracted $80 million in venture investment, 6.3 percent of the region’s total. Added together, DC, Balti-more, and the close in, denser suburbs of Ar-lington, Alexandria, and Bethesda account for more than 60 percent of venture investment in the region.
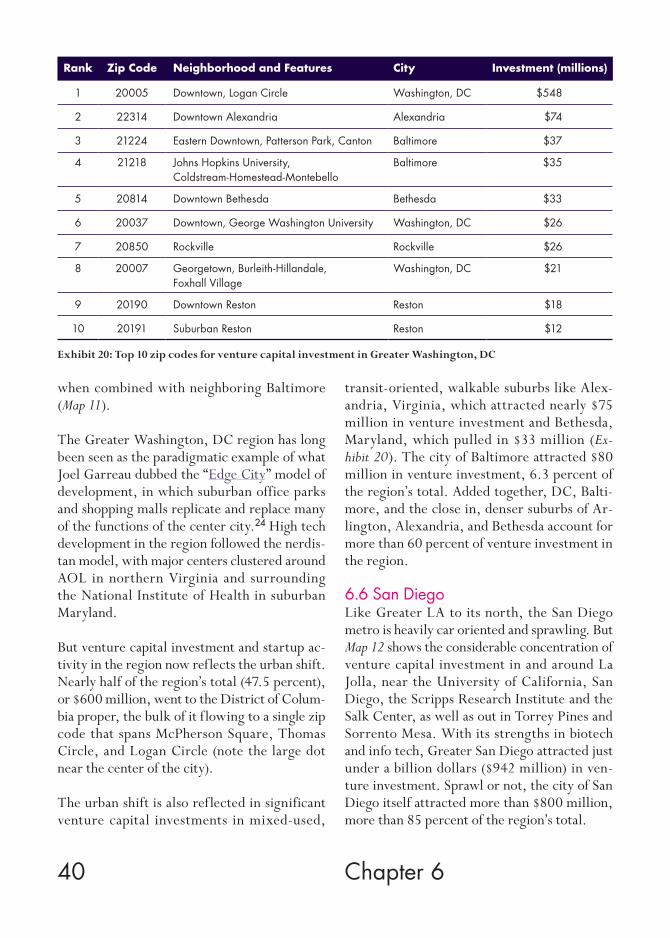
6.6 San DiegoLike Greater LA to its north, the San Diego metro is heavily car oriented and sprawling. But Map 12 shows the considerable concentration of venture capital investment in and around La Jolla, near the University of California, San Diego, the Scripps Research Institute and the Salk Center, as well as out in Torrey Pines and Sorrento Mesa. With its strengths in biotech and info tech, Greater San Diego attracted just under a billion dollars ($942 million) in ven-ture investment. Sprawl or not, the city of San Diego itself attracted more than $800 million, more than 85 percent of the region’s total.
41 Startup City
Map 12: San Diego area venture capital investments
Exhibit 21: Top 10 zip codes for venture capital investment in San Diego
Rank Zip Code Neighborhood and Features City Investment (millions)
1 92121 Torrey Pines, Sorrento Mesa San Diego $440
2 92130 Carmel Valley San Diego $108
3 92123 Serra Mesa San Diego $85
4 92011 Southern Carlsbad Carlsbad $50
5 92101 Downtown — Gaslamp Quarter, Harborview, Airport
San Diego $49
6 92128 Rancho Bernado San Diego $45
7 92037 La Jolla — Salk Institute, Scripps Research Institute
La Jolla $40
8 92075 Suburban Solana Beach Solana Beach $30
9 92127 Rancho Bernardo San Diego $23
10 92131 Scripps Ranch, Rancho Encantada San Diego $17
42 Chapter 6
Much of the venture capital investment in San Diego is centered in the northern part of the city. The areas around Torrey Pines, the Carm-el Valley, and Serra Mesa topped the list of zip codes for venture investment (Exhibit 21). One zip code, 92121, which includes Torrey Pines and Sorrento Mesa and abuts the campus of the University of California, San Diego, attracted four times as much investment as the second most productive zip code. That said, more
quintessentially urban districts have begun to see considerable venture investment. A major downtown zip code, which includes the Gas-lamp Quarter, Harborview, and parts of Balboa Park, was the fifth leading zip code for venture investment.
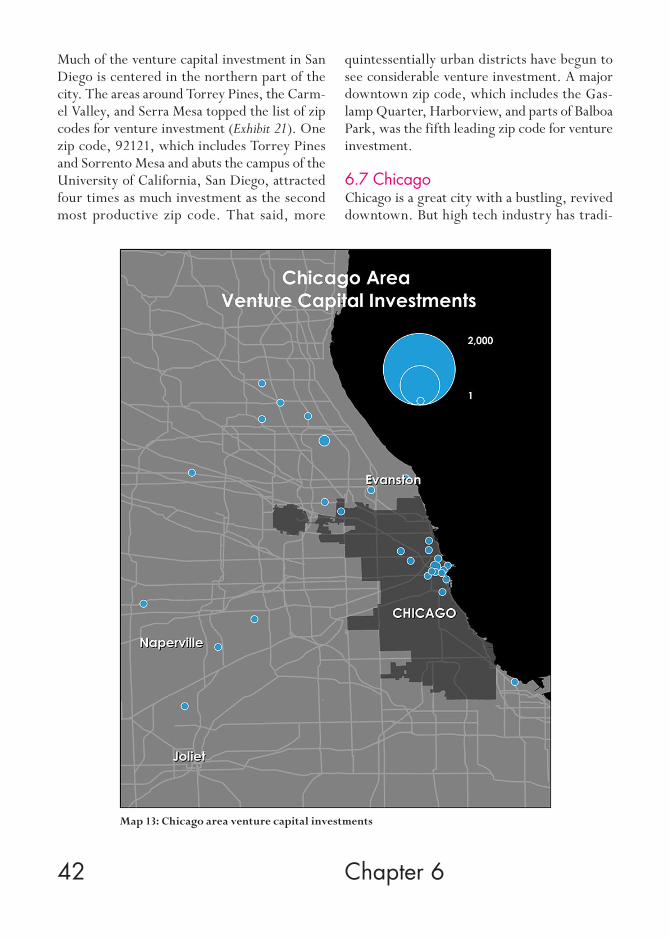
6.7 ChicagoChicago is a great city with a bustling, revived downtown. But high tech industry has tradi-
Map 13: Chicago area venture capital investments
43 Startup City
Exhibit 22: Top 10 zip codes for venture capital investment in Chicago
Rank Zip Code Neighborhood and Features City Investment (millions)
1 60062 Suburban Northbrook Northbrook $134
2 60654 River North Chicago $105
3 60614 Lincoln Park, Sheffield, DePaul University Chicago $71
4 46394 Downtown Whiting, Robertsdale Whiting, IN $54
5 60517 Suburban Woodridge Woodridge $50
6 60607 Near West Side, United Center, University Village/Little Italy
Chicago $37
7 60201 Evanston Evanston $25
8 60068 Park Ridge Park Ridge $25
9 60555 Warrenville Warrenville $20
10 60606 Downtown Chicago, Loop Chicago $16
tionally preferred its suburbs, where Motorola and other companies have long had their head-quarters. Even so, venture capital investment in Chicago has also begun to reflect the urban shift. The metro attracted $668 million in ven-ture capital in 2011. Just under half of this to-tal, $313 million, was invested in the city itself.
Map 13 shows the major locations of venture capital investment in region. Note the cluster of dots in and around the urban core.
Exhibit 22 lists the top 10 zip codes for venture investment in Greater Chicago. Four are in the city itself — in River North, Lincoln Park, the Near West Side including Little Italy, and the downtown core. Together these four zip codes accounted for $229 million in venture capital investment, more than a third of the total for the region.
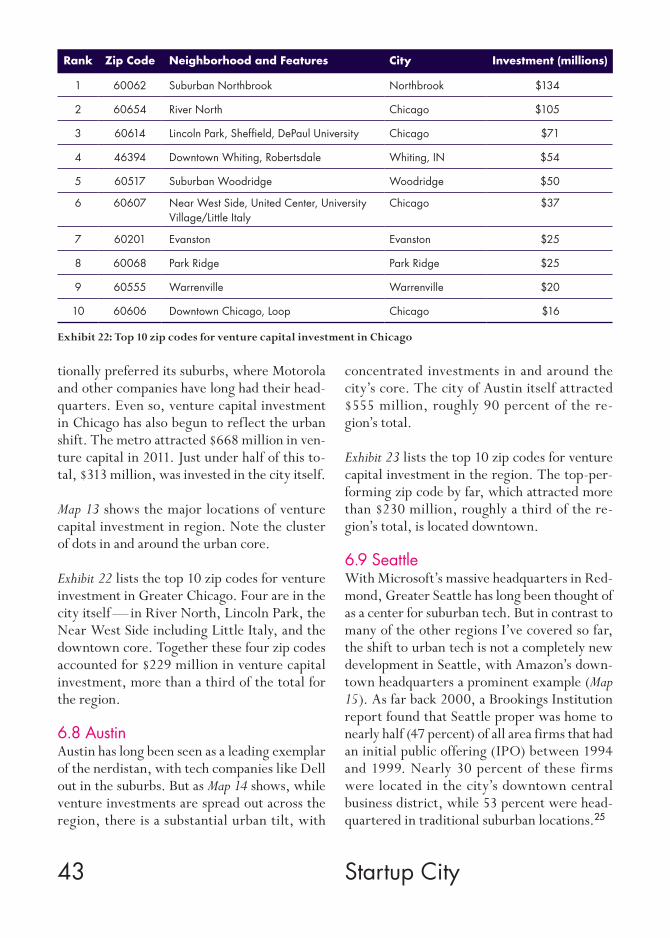
6.8 AustinAustin has long been seen as a leading exemplar of the nerdistan, with tech companies like Dell out in the suburbs. But as Map 14 shows, while venture investments are spread out across the region, there is a substantial urban tilt, with
concentrated investments in and around the city’s core. The city of Austin itself attracted $555 million, roughly 90 percent of the re-gion’s total.
Exhibit 23 lists the top 10 zip codes for venture capital investment in the region. The top-per-forming zip code by far, which attracted more than $230 million, roughly a third of the re-gion’s total, is located downtown.
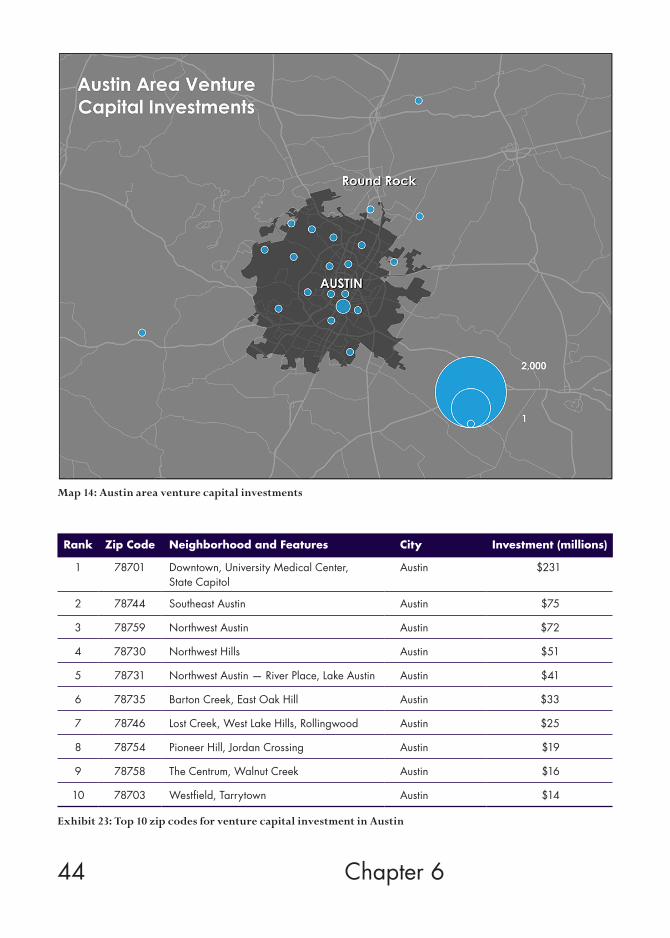
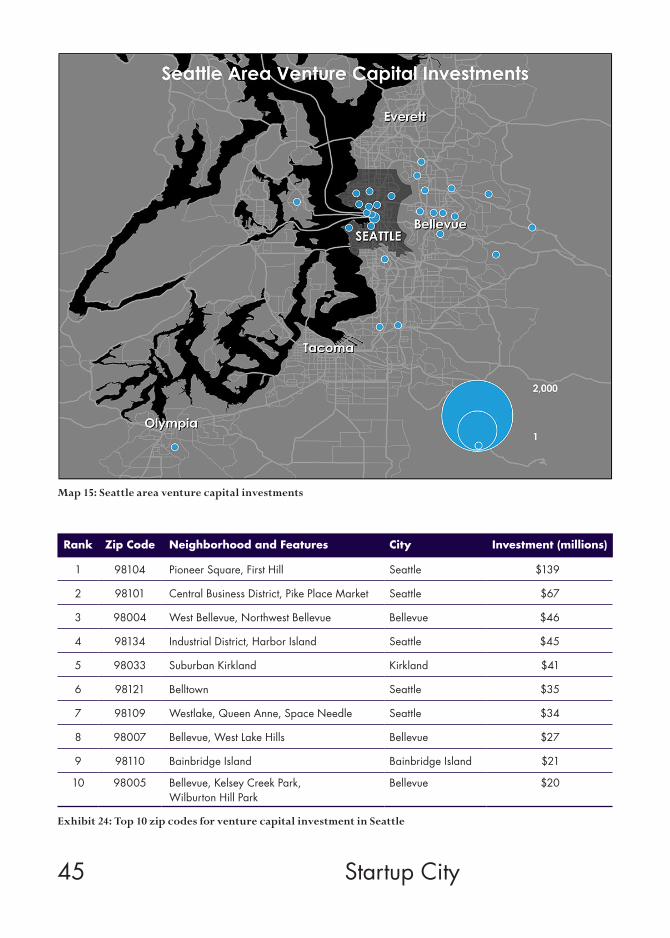
6.9 SeattleWith Microsoft’s massive headquarters in Red-mond, Greater Seattle has long been thought of as a center for suburban tech. But in contrast to many of the other regions I’ve covered so far, the shift to urban tech is not a completely new development in Seattle, with Amazon’s down-town headquarters a prominent example (Map 15). As far back 2000, a Brookings Institution report found that Seattle proper was home to nearly half (47 percent) of all area firms that had an initial public offering (IPO) between 1994 and 1999. Nearly 30 percent of these firms were located in the city’s downtown central business district, while 53 percent were head-quartered in traditional suburban locations.25
44 Chapter 6
Map 14: Austin area venture capital investments
Exhibit 23: Top 10 zip codes for venture capital investment in Austin
Rank Zip Code Neighborhood and Features City Investment (millions)
1 78701 Downtown, University Medical Center, State Capitol
Austin $231
2 78744 Southeast Austin Austin $75
3 78759 Northwest Austin Austin $72
4 78730 Northwest Hills Austin $51
5 78731 Northwest Austin — River Place, Lake Austin Austin $41
6 78735 Barton Creek, East Oak Hill Austin $33
7 78746 Lost Creek, West Lake Hills, Rollingwood Austin $25
8 78754 Pioneer Hill, Jordan Crossing Austin $19
9 78758 The Centrum, Walnut Creek Austin $16
10 78703 Westfield, Tarrytown Austin $14
45 Startup City
Map 15: Seattle area venture capital investments
Exhibit 24: Top 10 zip codes for venture capital investment in Seattle
Rank Zip Code Neighborhood and Features City Investment (millions)
1 98104 Pioneer Square, First Hill Seattle $139
2 98101 Central Business District, Pike Place Market Seattle $67
3 98004 West Bellevue, Northwest Bellevue Bellevue $46
4 98134 Industrial District, Harbor Island Seattle $45
5 98033 Suburban Kirkland Kirkland $41
6 98121 Belltown Seattle $35
7 98109 Westlake, Queen Anne, Space Needle Seattle $34
8 98007 Bellevue, West Lake Hills Bellevue $27
9 98110 Bainbridge Island Bainbridge Island $21
10 98005 Bellevue, Kelsey Creek Park, Wilburton Hill Park
Bellevue $20
46 Chapter 6
Map 16: Philadelphia area venture capital investments
Exhibit 24 shows the top 10 zip codes for ven-ture capital investment in Greater Seattle. The city is home to the leading zip code, three of the top 5 and five of the top 10. The top ranked zip code, which includes Pioneer Square, attracted nearly $140 million in venture investment, 24 percent of the region’s total. The adjacent downtown neighborhood brought in another $67 million in venture investment with sub-stantial clusters in the old industrial districts near Harbor Island and in Belltown as well. All told, the city of Seattle itself attracted $377 million in investment, more than 60 percent of the total of $570 million for the metro as a whole. Nearby Bellevue, a dense, mixed-use, walkable suburb, attracted an additional $118 million in venture capital investment, far out-pacing outlying suburban areas.
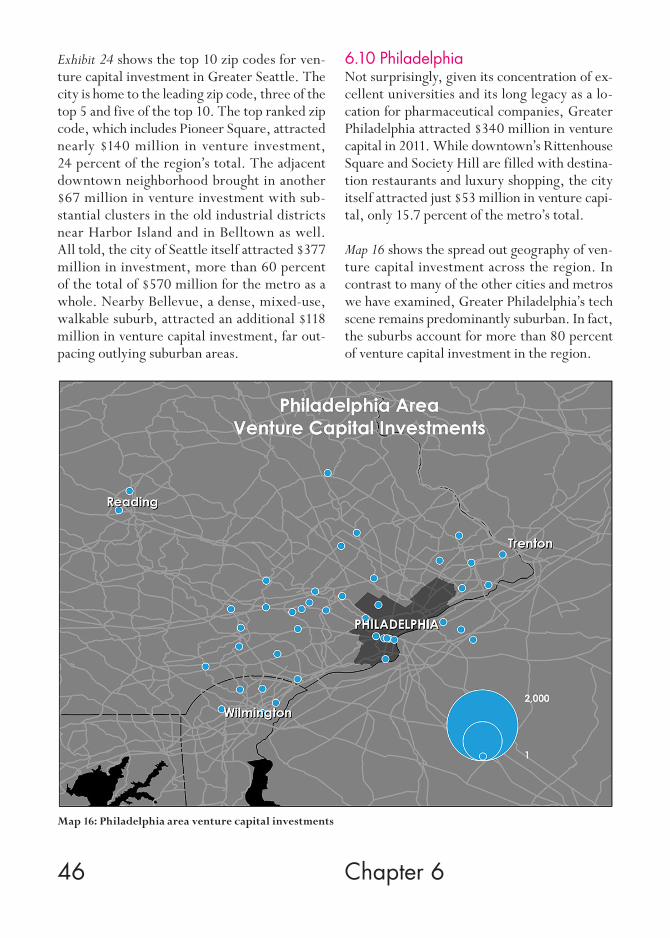
6.10 PhiladelphiaNot surprisingly, given its concentration of ex-cellent universities and its long legacy as a lo-cation for pharmaceutical companies, Greater Philadelphia attracted $340 million in venture capital in 2011. While downtown’s Rittenhouse Square and Society Hill are filled with destina-tion restaurants and luxury shopping, the city itself attracted just $53 million in venture capi-tal, only 15.7 percent of the metro’s total.
Map 16 shows the spread out geography of ven-ture capital investment across the region. In contrast to many of the other cities and metros we have examined, Greater Philadelphia’s tech scene remains predominantly suburban. In fact, the suburbs account for more than 80 percent of venture capital investment in the region.
47 Startup City
Exhibit 25: Top 5 zip codes for venture capital investment in Philadelphia
Rank Zip Code Neighborhood and Features City Investment (millions)
1 19406 King of Prussia King of Prussia $90
2 19355 Malvern Malvern $44
3 19103 Downtown Philadelphia, Logan Square Philadelphia $38
4 19047 Langhorne, Cairn University Langhorne $26
5 19428 Conshohocken Conshohocken $22
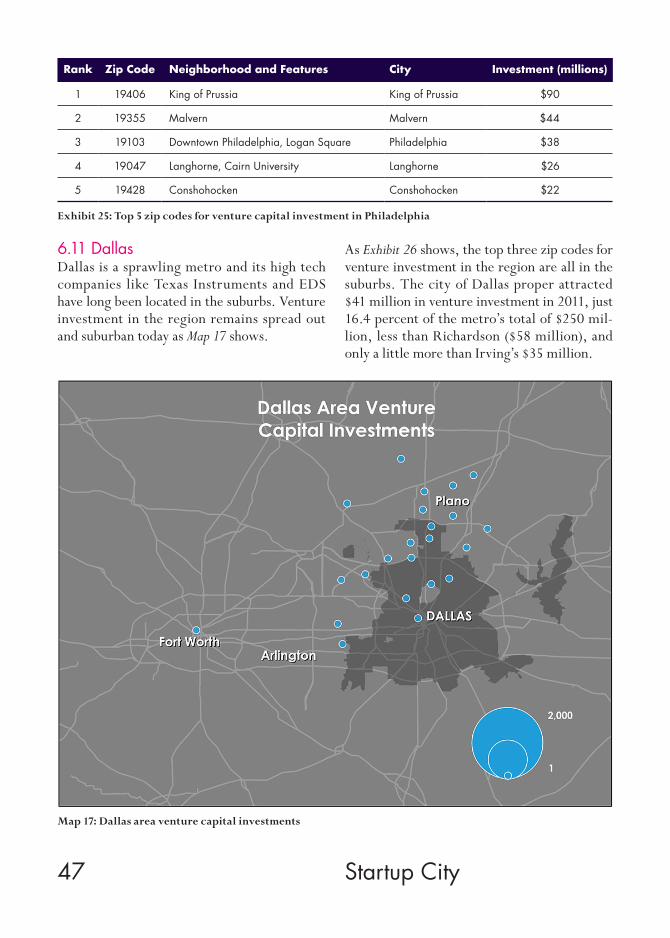
6.11 DallasDallas is a sprawling metro and its high tech companies like Texas Instruments and EDS have long been located in the suburbs. Venture investment in the region remains spread out and suburban today as Map 17 shows.
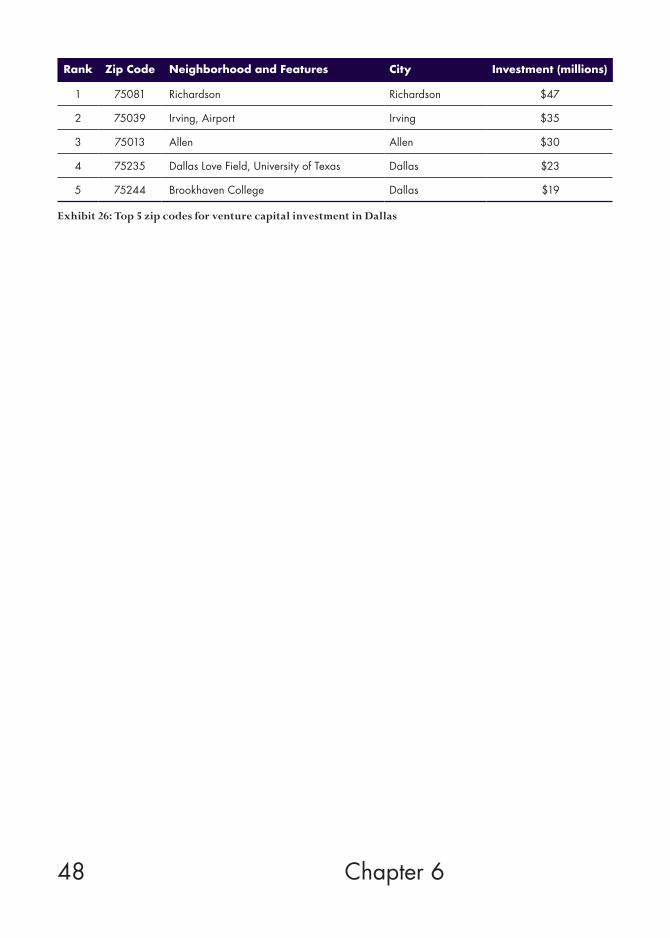
As Exhibit 26 shows, the top three zip codes for venture investment in the region are all in the suburbs. The city of Dallas proper attracted $41 million in venture investment in 2011, just 16.4 percent of the metro’s total of $250 mil-lion, less than Richardson ($58 million), and only a little more than Irving’s $35 million.
Map 17: Dallas area venture capital investments
48 Chapter 6
Exhibit 26: Top 5 zip codes for venture capital investment in Dallas
Rank Zip Code Neighborhood and Features City Investment (millions)
1 75081 Richardson Richardson $47
2 75039 Irving, Airport Irving $35
3 75013 Allen Allen $30
4 75235 Dallas Love Field, University of Texas Dallas $23
5 75244 Brookhaven College Dallas $19
49 Startup City
7. Conclusion
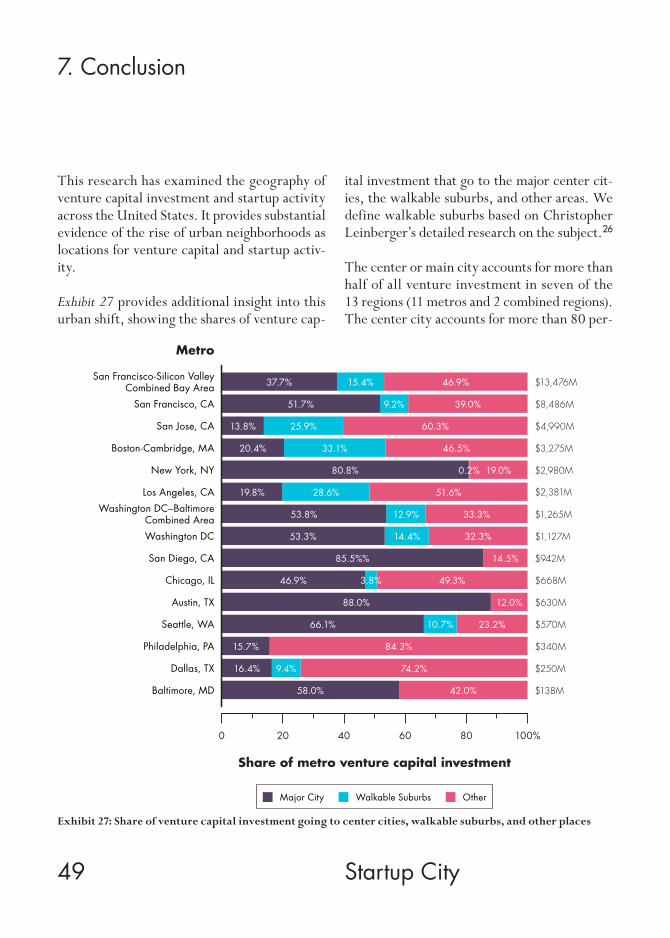
This research has examined the geography of venture capital investment and startup activity across the United States. It provides substantial evidence of the rise of urban neighborhoods as locations for venture capital and startup activ-ity.
Exhibit 27 provides additional insight into this urban shift, showing the shares of venture cap-
ital investment that go to the major center cit-ies, the walkable suburbs, and other areas. We define walkable suburbs based on Christopher Leinberger’s detailed research on the subject.26
The center or main city accounts for more than half of all venture investment in seven of the 13 regions (11 metros and 2 combined regions). The center city accounts for more than 80 per-
Exhibit 27: Share of venture capital investment going to center cities, walkable suburbs, and other places
Metro
San Francisco-Silicon ValleyCombined Bay Area
Washington DC–BaltimoreCombined Area
46.9%15.4%37.7% $13,476M
San Francisco, CA 39.0%9.2%51.7% $8,486M
San Jose, CA 60.3%25.9%13.8% $4,990M
Boston-Cambridge, MA 46.5%33.1%20.4% $3,275M
New York, NY 19.0%0.2%80.8% $2,980M
Los Angeles, CA 51.6%28.6%19.8% $2,381M
33.3%12.9%53.8% $1,265M
Washington DC 32.3%14.4%53.3% $1,127M
San Diego, CA 14.5%85.5%% $942M
Chicago, IL 49.3%3.8%46.9% $668M
Austin, TX 88.0% 12.0% $630M
Seattle, WA 23.2%10.7%66.1% $570M
Philadelphia, PA 84.3%15.7% $340M
Dallas, TX 74.2%9.4%16.4% $250M
Baltimore, MD 42.0%58.0% $138M
200 6040 100%80
Share of metro venture capital investment
Major City Walkable Suburbs Other
50
cent of venture investment in three, New York, Austin and San Diego. It accounts for two-thirds in Seattle. It makes up roughly half in Greater Washington, DC, and Baltimore. It accounts for nearly half (46.5 percent) in Chica-go. Conversely, the center city accounts for 20 percent or less of venture capital investment in five regions — Greater Boston (20.4 percent), Greater LA (19.8 percent), Dallas (16.4 per-cent), Philadelphia (15.7 percent) and San Jose (13.8 percent).
Adding walkable suburbs changes the picture considerably. When Cambridge is added to Bos-ton, the two cities account for more than half (53.5 percent) of venture investment in the re-gion. Adding the walkable, mixed-use suburbs of Arlington, Alexandria, and Bethesda to the combined region of greater Washington, DC and Baltimore brings the total to more than 60 percent of all venture capital investment. Palo Alto and San Jose combine for nearly 40 per-cent of all venture capital investment in Silicon Valley. And Santa Monica and LA combined account for 37 percent of the region’s total ven-ture investment.
Still, not all regions of the country have wit-nessed the urban shift in venture capital and startup activity. Suburban venture capital con-tinues to predominate in two metros: Philadel-phia and Dallas.
It’s important to point out several caveats to our data, analysis, and findings. The data are for a single point in time. Data that cover a longer time series would help us better understand the full extent of the urban shift in venture capi-tal and startup activity. The zip code level data cover just 13 leading venture capital regions (11 metros and 2 combined regions). Although these are the largest and most significant loca-tions for venture capital investments, data on a larger number of zip codes covering more metros and over a significant time series would
shed additional light on the trends and patterns identified here. Future research will address these issues in greater detail, using even more fine-grained data for more cities and metro ar-eas over long time periods.
That said, the rise of urban areas as centers for startup activity and venture capital investment appears to be the result of several broad trends.
Access to Talent: First and foremost is access to talent. More and more venture capitalists, en-trepreneurs, and high tech workers are choos-ing to live in denser, livelier, and less car-de-pendent urban locations. As venture capitalist Mark Suster notes,27 “Young people want to live where the action is. They want to live amongst other young people. They want night-ly restaurants, bars, dance clubs, karaoke, or whatever other late night activities are available to those with fewer encumbrances.” He sus-pects that this “shift from the burbs to urban environments” is a trend that won’t go away any time soon. They are doing so even if it requires them to make a reverse commute. Large num-bers of Silicon Valley tech workers commute from their residences in the urban districts of San Francisco on private buses.
Density and Efficiency: Denser cities are more efficient, especially for startups. Older build-ings in urban locations are much more af-fordable for small startups. Many of the most promising young tech companies coming out of the Bay Area — like Pinterest, Zynga, Yelp, Square, and Salesforce — have chosen to lo-cate in San Francisco, in some cases moving from the Valley to the city. “I love the idea of an urban corporate campus with all the energy and variety that provides,” Twitter co-founder Jack Dorsey tweeted last February, after open-ing his company’s new headquarters in a newly renovated Art Deco building in San Francisco’s downtown.
Chapter 7
51 Startup City
As Silicon Valley entrepreneur and investor Paul Graham has noted: “For all its power, Silicon Valley has a great weakness: the paradise Shock-ley found in 1956 is now one giant parking lot. San Francisco and Berkeley are great, but they’re forty miles away. Silicon Valley proper is soul-crushing suburban sprawl. It has fabu-lous weather, which makes it significantly bet-ter than the soul-crushing sprawl of most other American cities. But a competitor that managed to avoid sprawl would have real leverage.” 28
The Changing Nature of Technology: The chang-ing nature of technology has a bearing on this as well. High tech industry has become less fo-cused on hardware, which requires factory-sized settings; cloud computing allows companies to shrink their footprints even more. Many tech startups are developing marketing or social media applications or work with multi-media (games, music, and so on). Talent pools in cit-ies have more designers, composers, scenarists, marketers, copywriters, and the like, who are just as important to those newer enterprises as engineers. “Technology innovation doesn’t oc-cur in a vacuum. It happens in a dialog with so-ciety,” the venture capitalist Fred Wilson wrote in the summer of 2012. “[T]hat’s one of the reasons that many of the most interesting Bay Area startups are choosing to locate themselves in the city. And it is one of the reasons that NYC is developing a vibrant technology community. Society is at its most dense in rich urban envi-ronments where society and technology can in-spire each other on a daily basis.”29
Inequality and Backlash: It’s also important to point out that the urban shift in venture capital and startup activity has become so pronounced that it is generating political tensions in several regions. This is perhaps most noticeable in San Francisco, where the influx of startups, high tech companies and tech workers has provoked a substantial backlash over rising rents and the
growing economic gap between tech workers and everyone else. The private bus services that Google and other companies use to shut-tle tech workers from their residences in San Francisco to their offices in Silicon Valley have become lightning rods for protests.30 In New York, Scott Stringer, the current city-wide Comptroller and former Manhattan Borough President, has proposed a series of initiatives to spread the benefits of urban tech clustering and concentration to a broader range of com-munities and economic groups.31 Our ongoing research and future reports will also focus on this crucial set of issues.
Of course the shift to urban tech does not mean the end of suburban high tech and of the nerd-istan per se. What appears to be emerging is a new spatial division of labor for high tech indus-try, in which smaller startups, especially those which draw on talent pools that are thickest in urban centers, are incubated in cities while es-tablished companies that require bigger floor plates and larger campuses remain in the sub-urbs, where land is cheaper and more available. Google perhaps exemplifies this, retaining its principle campus in Silicon Valley, but opening significant urban outposts in New York, Lon-don, and other cities. Many of these suburban campuses artificially emulate the features of density, proximity, and amenities that occur naturally in cities.
A new, more urban geography of venture cap-ital and high tech startups is clearly emerging. It may well turn out that the widespread move-ment of industry and people to the suburbs in the middle of the last century and the rise of the high tech nerdistans that went along with them were historical aberrations and not the perma-nent new paradigm that many took them to be. Today, the locus of innovation and entrepre-neurship is shifting back to the great urban cen-ters that have been their true catalysts all along.
52 Startup City
8. Appendix
Appendix 1: Top 20 metros for venture capital investment
Rank MetroInvestment (Millions)
Share of all
InvestmentsNo. of Deals
Share of all Deals
1 San Francisco-Oakland-Fremont, CA $6,896 25.6% 744 19.7%
2 San Jose-Sunnyvale-Santa Clara, CA $3,985 14.8% 415 11.0%
3 Boston-Cambridge-Quincy, MA-NH $3,101 11.5% 408 10.8%
4 New York-Northern New Jersey-Long Island, NY-NJ-PA $2,269 8.4% 379 10.0%
5 Los Angeles-Long Beach-Santa Ana, CA $1,677 6.2% 232 6.1%
6 San Diego-Carlsbad-San Marcos, CA $1,134 4.2% 103 2.7%
7 Seattle-Tacoma-Bellevue, WA $886 3.3% 112 3.0%
8 Austin-Round Rock, TX $626 2.3% 87 2.3%
9 Chicago-Naperville-Joliet, IL-IN-WI $547 2.0% 71 1.9%
10 Washington-Arlington-Alexandria, DC-VA-MD-WV $484 1.8% 117 3.1%
11 Philadelphia-Camden-Wilmington, PA-NJ-DE-MD $347 1.3% 105 2.8%
12 Denver-Aurora-Broomfield, CO $264 1.0% 53 1.4%
13 Atlanta-Sandy Springs-Marietta, GA $262 1.0% 53 1.4%
14 Boulder, CO $256 1.0% 40 1.1%
15 Minneapolis-St. Paul-Bloomington, MN-WI $256 0.9% 29 0.8%
16 Santa Barbara-Santa Maria-Goleta, CA $251 0.9% 14 0.4%
17 Phoenix-Mesa-Scottsdale, AZ $214 0.8% 15 0.4%
18 Raleigh-Cary, NC $184 0.7% 28 0.7%
19 Pittsburgh, PA $167 0.6% 76 2.0%
20 Provo-Orem, UT $162 0.6% 14 0.4%
53 Chapter 8
Appendix 2: Top 20 metros for venture capital investment per 100,000 people
Rank Metro Investment Deals
1 San Jose-Sunnyvale-Santa Clara, CA $216.9 22.6
2 San Francisco-Oakland-Fremont, CA $159.1 17.2
3 Boulder, CO $86.9 13.6
4 Boston-Cambridge-Quincy, MA-NH $68.1 9.0
5 Santa Barbara-Santa Maria-Goleta, CA $59.1 3.3
6 Lawrence, KS $40.8 5.4
7 San Diego-Carlsbad-San Marcos, CA $36.6 3.3
8 Austin-Round Rock, TX $36.5 5.1
9 Provo-Orem, UT $30.7 2.7
10 Seattle-Tacoma-Bellevue, WA $25.8 3.3
11 Ann Arbor, MI $24.1 6.4
12 Santa Rosa-Petaluma, CA $20.8 1.7
13 Raleigh-Cary, NC $16.3 2.5
14 Fort Collins-Loveland, CO $15.9 1.7
15 Salt Lake City, UT $13.2 2.4
16 Los Angeles-Long Beach-Santa Ana, CA $13.1 1.8
17 San Luis Obispo-Paso Robles, CA $13.0 0.4
18 New York-Northern New Jersey-Long Island, NY-NJ-PA $12.0 2.0
19 Trenton-Ewing, NJ $12.0 1.9
20 Madison, WI $11.5 1.9
54 Startup City
Appendix 3: Correlation analysis results
Venture Capital Investment
Metro Number of Deals Dollar Value
Innovation 0.51** 0.43**
High Tech 0.77** 0.70**
Wages 0.69** 0.60**
Income per capita 0.56** 0.50**
College Grads 0.55** 0.50**
Creative Class 0.57** 0.50**
Science and Tech Occupations 0.46** 0.44**
Business and Management Occupations 0.58** 0.52**
Arts, Culture and Media Occupations 0.57** 0.47**
Meds and Eds Occupations -0.10 -0.13
Foreign-Born 0.49** 0.46**
Gay 0.48** 0.46**
Liberal 0.40** 0.28**
Conservative -0.40** -0.29**
Population-Weighted density 0.64** 0.55**
Density 0.52** 0.38**
Bike to Work 0.17* 0.19*
Drive Alone to Work -0.49** -0.45**
Note: * reflects significance at the 95 percent confidence level and ** reflects significance at the 99 percent confidence level.
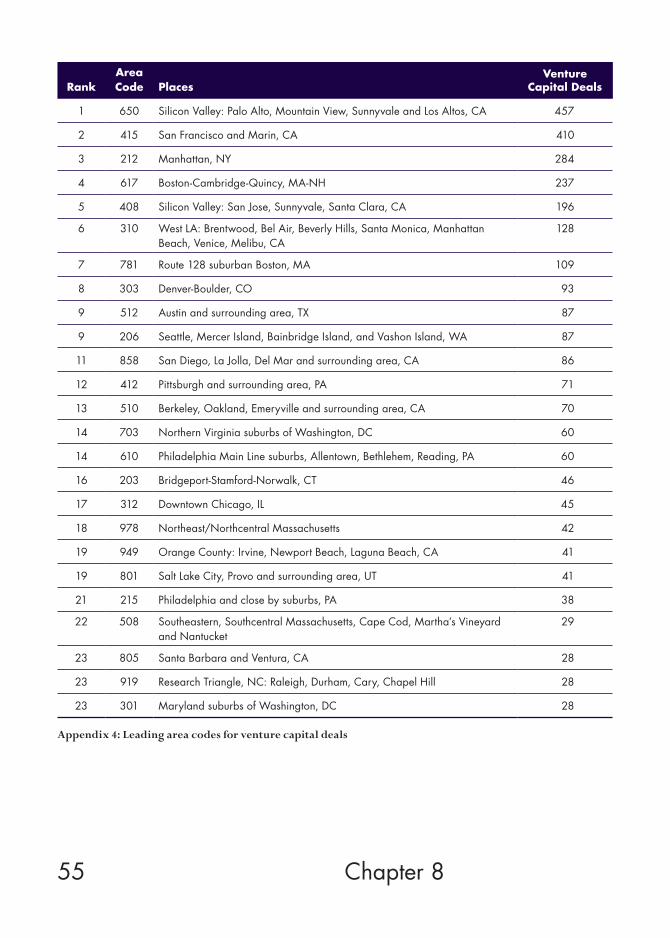
55
Appendix 4: Leading area codes for venture capital deals
RankArea Code Places
Venture Capital Deals
1 650 Silicon Valley: Palo Alto, Mountain View, Sunnyvale and Los Altos, CA 457
2 415 San Francisco and Marin, CA 410
3 212 Manhattan, NY 284
4 617 Boston-Cambridge-Quincy, MA-NH 237
5 408 Silicon Valley: San Jose, Sunnyvale, Santa Clara, CA 196
6 310 West LA: Brentwood, Bel Air, Beverly Hills, Santa Monica, Manhattan Beach, Venice, Melibu, CA
128
7 781 Route 128 suburban Boston, MA 109
8 303 Denver-Boulder, CO 93
9 512 Austin and surrounding area, TX 87
9 206 Seattle, Mercer Island, Bainbridge Island, and Vashon Island, WA 87
11 858 San Diego, La Jolla, Del Mar and surrounding area, CA 86
12 412 Pittsburgh and surrounding area, PA 71
13 510 Berkeley, Oakland, Emeryville and surrounding area, CA 70
14 703 Northern Virginia suburbs of Washington, DC 60
14 610 Philadelphia Main Line suburbs, Allentown, Bethlehem, Reading, PA 60
16 203 Bridgeport-Stamford-Norwalk, CT 46
17 312 Downtown Chicago, IL 45
18 978 Northeast/Northcentral Massachusetts 42
19 949 Orange County: Irvine, Newport Beach, Laguna Beach, CA 41
19 801 Salt Lake City, Provo and surrounding area, UT 41
21 215 Philadelphia and close by suburbs, PA 38
22 508 Southeastern, Southcentral Massachusetts, Cape Cod, Martha’s Vineyard and Nantucket
29
23 805 Santa Barbara and Ventura, CA 28
23 919 Research Triangle, NC: Raleigh, Durham, Cary, Chapel Hill 28
23 301 Maryland suburbs of Washington, DC 28
Chapter 8
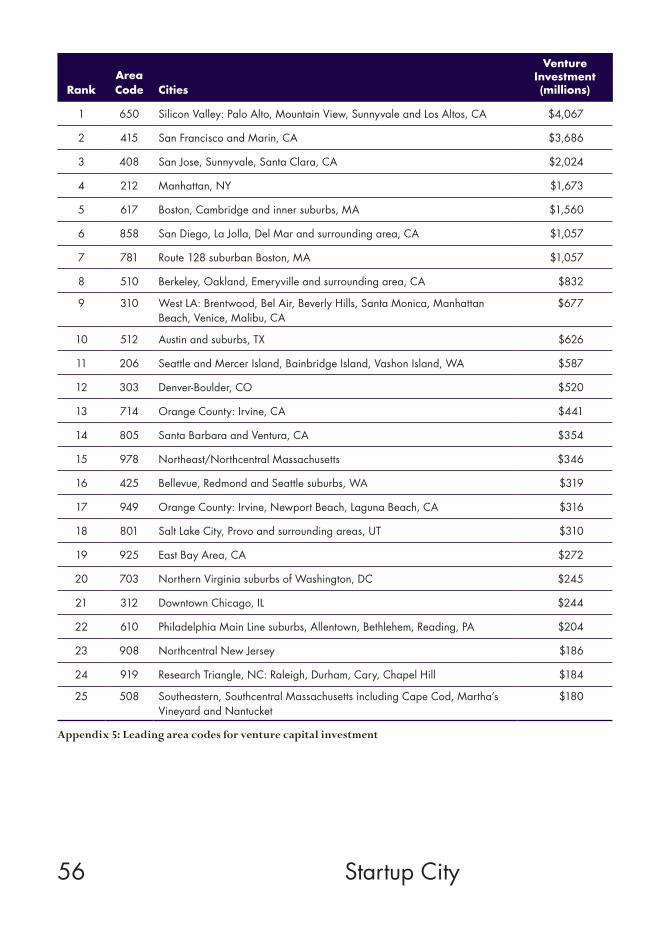
56 Startup City
Appendix 5: Leading area codes for venture capital investment
RankArea Code Cities
Venture Investment (millions)
1 650 Silicon Valley: Palo Alto, Mountain View, Sunnyvale and Los Altos, CA $4,067
2 415 San Francisco and Marin, CA $3,686
3 408 San Jose, Sunnyvale, Santa Clara, CA $2,024
4 212 Manhattan, NY $1,673
5 617 Boston, Cambridge and inner suburbs, MA $1,560
6 858 San Diego, La Jolla, Del Mar and surrounding area, CA $1,057
7 781 Route 128 suburban Boston, MA $1,057
8 510 Berkeley, Oakland, Emeryville and surrounding area, CA $832
9 310 West LA: Brentwood, Bel Air, Beverly Hills, Santa Monica, Manhattan Beach, Venice, Malibu, CA
$677
10 512 Austin and suburbs, TX $626
11 206 Seattle and Mercer Island, Bainbridge Island, Vashon Island, WA $587
12 303 Denver-Boulder, CO $520
13 714 Orange County: Irvine, CA $441
14 805 Santa Barbara and Ventura, CA $354
15 978 Northeast/Northcentral Massachusetts $346
16 425 Bellevue, Redmond and Seattle suburbs, WA $319
17 949 Orange County: Irvine, Newport Beach, Laguna Beach, CA $316
18 801 Salt Lake City, Provo and surrounding areas, UT $310
19 925 East Bay Area, CA $272
20 703 Northern Virginia suburbs of Washington, DC $245
21 312 Downtown Chicago, IL $244
22 610 Philadelphia Main Line suburbs, Allentown, Bethlehem, Reading, PA $204
23 908 Northcentral New Jersey $186
24 919 Research Triangle, NC: Raleigh, Durham, Cary, Chapel Hill $184
25 508 Southeastern, Southcentral Massachusetts including Cape Cod, Martha’s Vineyard and Nantucket
$180
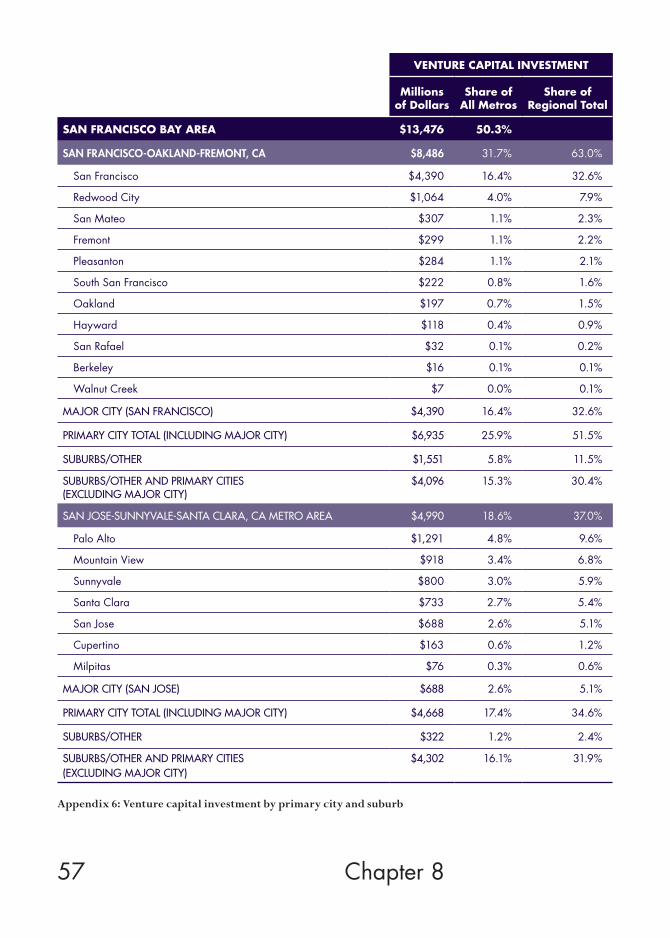
57
Appendix 6: Venture capital investment by primary city and suburb
VENTURE CAPITAL INVESTMENT
Millions of Dollars
Share of All Metros
Share of Regional Total
SAN FRANCISCO BAY AREA $13,476 50.3%
SAN FRANCISCO-OAKLAND-FREMONT, CA $8,486 31.7% 63.0%
San Francisco $4,390 16.4% 32.6%
Redwood City $1,064 4.0% 7.9%
San Mateo $307 1.1% 2.3%
Fremont $299 1.1% 2.2%
Pleasanton $284 1.1% 2.1%
South San Francisco $222 0.8% 1.6%
Oakland $197 0.7% 1.5%
Hayward $118 0.4% 0.9%
San Rafael $32 0.1% 0.2%
Berkeley $16 0.1% 0.1%
Walnut Creek $7 0.0% 0.1%
MAJOR CITY (SAN FRANCISCO) $4,390 16.4% 32.6%
PRIMARY CITY TOTAL (INCLUDING MAJOR CITY) $6,935 25.9% 51.5%
SUBURBS/OTHER $1,551 5.8% 11.5%
SUBURBS/OTHER AND PRIMARY CITIES (EXCLUDING MAJOR CITY)
$4,096 15.3% 30.4%
SAN JOSE-SUNNYVALE-SANTA CLARA, CA METRO AREA $4,990 18.6% 37.0%
Palo Alto $1,291 4.8% 9.6%
Mountain View $918 3.4% 6.8%
Sunnyvale $800 3.0% 5.9%
Santa Clara $733 2.7% 5.4%
San Jose $688 2.6% 5.1%
Cupertino $163 0.6% 1.2%
Milpitas $76 0.3% 0.6%
MAJOR CITY (SAN JOSE) $688 2.6% 5.1%
PRIMARY CITY TOTAL (INCLUDING MAJOR CITY) $4,668 17.4% 34.6%
SUBURBS/OTHER $322 1.2% 2.4%
SUBURBS/OTHER AND PRIMARY CITIES (EXCLUDING MAJOR CITY)
$4,302 16.1% 31.9%
Chapter 8
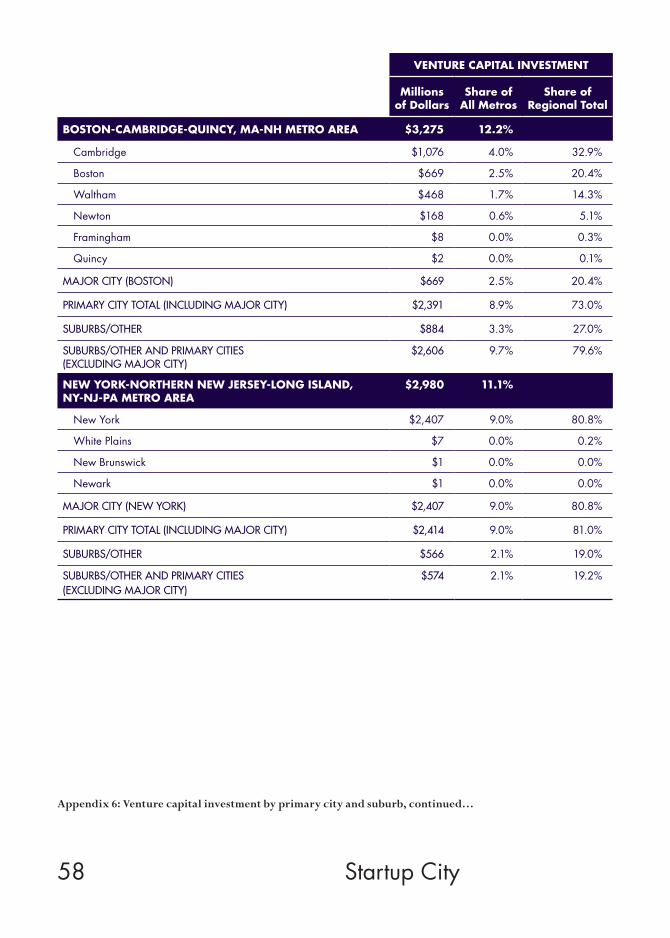
58 Startup City
Appendix 6: Venture capital investment by primary city and suburb, continued…
VENTURE CAPITAL INVESTMENT
Millions of Dollars
Share of All Metros
Share of Regional Total
BOSTON-CAMBRIDGE-QUINCY, MA-NH METRO AREA $3,275 12.2%
Cambridge $1,076 4.0% 32.9%
Boston $669 2.5% 20.4%
Waltham $468 1.7% 14.3%
Newton $168 0.6% 5.1%
Framingham $8 0.0% 0.3%
Quincy $2 0.0% 0.1%
MAJOR CITY (BOSTON) $669 2.5% 20.4%
PRIMARY CITY TOTAL (INCLUDING MAJOR CITY) $2,391 8.9% 73.0%
SUBURBS/OTHER $884 3.3% 27.0%
SUBURBS/OTHER AND PRIMARY CITIES (EXCLUDING MAJOR CITY)
$2,606 9.7% 79.6%
NEW YORK-NORTHERN NEW JERSEY-LONG ISLAND, NY-NJ-PA METRO AREA
$2,980 11.1%
New York $2,407 9.0% 80.8%
White Plains $7 0.0% 0.2%
New Brunswick $1 0.0% 0.0%
Newark $1 0.0% 0.0%
MAJOR CITY (NEW YORK) $2,407 9.0% 80.8%
PRIMARY CITY TOTAL (INCLUDING MAJOR CITY) $2,414 9.0% 81.0%
SUBURBS/OTHER $566 2.1% 19.0%
SUBURBS/OTHER AND PRIMARY CITIES (EXCLUDING MAJOR CITY)
$574 2.1% 19.2%
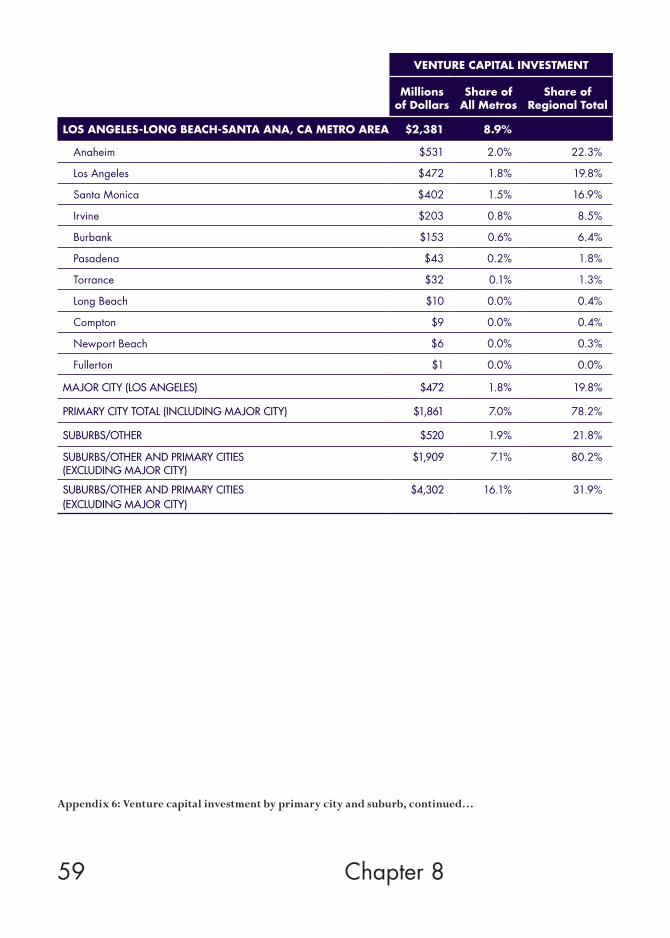
59
Appendix 6: Venture capital investment by primary city and suburb, continued…
VENTURE CAPITAL INVESTMENT
Millions of Dollars
Share of All Metros
Share of Regional Total
LOS ANGELES-LONG BEACH-SANTA ANA, CA METRO AREA $2,381 8.9%
Anaheim $531 2.0% 22.3%
Los Angeles $472 1.8% 19.8%
Santa Monica $402 1.5% 16.9%
Irvine $203 0.8% 8.5%
Burbank $153 0.6% 6.4%
Pasadena $43 0.2% 1.8%
Torrance $32 0.1% 1.3%
Long Beach $10 0.0% 0.4%
Compton $9 0.0% 0.4%
Newport Beach $6 0.0% 0.3%
Fullerton $1 0.0% 0.0%
MAJOR CITY (LOS ANGELES) $472 1.8% 19.8%
PRIMARY CITY TOTAL (INCLUDING MAJOR CITY) $1,861 7.0% 78.2%
SUBURBS/OTHER $520 1.9% 21.8%
SUBURBS/OTHER AND PRIMARY CITIES (EXCLUDING MAJOR CITY)
$1,909 7.1% 80.2%
SUBURBS/OTHER AND PRIMARY CITIES (EXCLUDING MAJOR CITY)
$4,302 16.1% 31.9%
Chapter 8
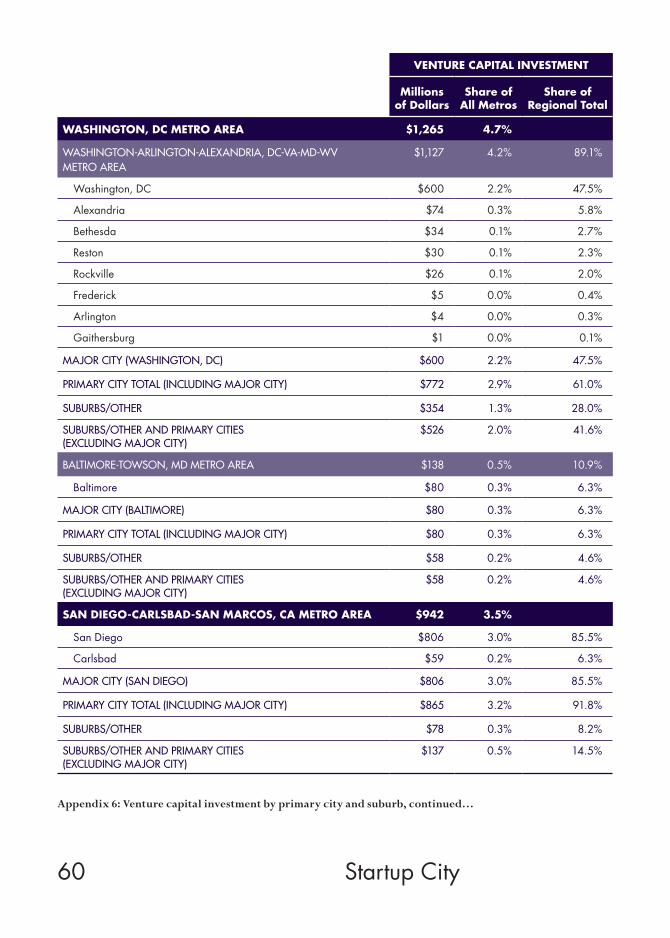
60 Startup City
Appendix 6: Venture capital investment by primary city and suburb, continued…
VENTURE CAPITAL INVESTMENT
Millions of Dollars
Share of All Metros
Share of Regional Total
WASHINGTON, DC METRO AREA $1,265 4.7%
WASHINGTON-ARLINGTON-ALEXANDRIA, DC-VA-MD-WV METRO AREA
$1,127 4.2% 89.1%
Washington, DC $600 2.2% 47.5%
Alexandria $74 0.3% 5.8%
Bethesda $34 0.1% 2.7%
Reston $30 0.1% 2.3%
Rockville $26 0.1% 2.0%
Frederick $5 0.0% 0.4%
Arlington $4 0.0% 0.3%
Gaithersburg $1 0.0% 0.1%
MAJOR CITY (WASHINGTON, DC) $600 2.2% 47.5%
PRIMARY CITY TOTAL (INCLUDING MAJOR CITY) $772 2.9% 61.0%
SUBURBS/OTHER $354 1.3% 28.0%
SUBURBS/OTHER AND PRIMARY CITIES (EXCLUDING MAJOR CITY)
$526 2.0% 41.6%
BALTIMORE-TOWSON, MD METRO AREA $138 0.5% 10.9%
Baltimore $80 0.3% 6.3%
MAJOR CITY (BALTIMORE) $80 0.3% 6.3%
PRIMARY CITY TOTAL (INCLUDING MAJOR CITY) $80 0.3% 6.3%
SUBURBS/OTHER $58 0.2% 4.6%
SUBURBS/OTHER AND PRIMARY CITIES (EXCLUDING MAJOR CITY)
$58 0.2% 4.6%
SAN DIEGO-CARLSBAD-SAN MARCOS, CA METRO AREA $942 3.5%
San Diego $806 3.0% 85.5%
Carlsbad $59 0.2% 6.3%
MAJOR CITY (SAN DIEGO) $806 3.0% 85.5%
PRIMARY CITY TOTAL (INCLUDING MAJOR CITY) $865 3.2% 91.8%
SUBURBS/OTHER $78 0.3% 8.2%
SUBURBS/OTHER AND PRIMARY CITIES (EXCLUDING MAJOR CITY)
$137 0.5% 14.5%
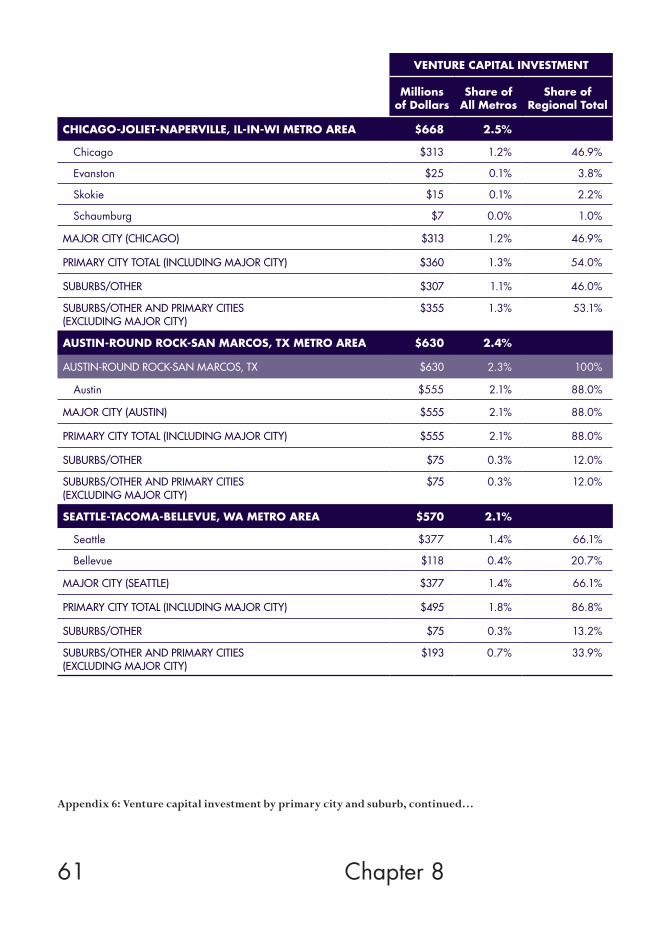
61
Appendix 6: Venture capital investment by primary city and suburb, continued…
VENTURE CAPITAL INVESTMENT
Millions of Dollars
Share of All Metros
Share of Regional Total
CHICAGO-JOLIET-NAPERVILLE, IL-IN-WI METRO AREA $668 2.5%
Chicago $313 1.2% 46.9%
Evanston $25 0.1% 3.8%
Skokie $15 0.1% 2.2%
Schaumburg $7 0.0% 1.0%
MAJOR CITY (CHICAGO) $313 1.2% 46.9%
PRIMARY CITY TOTAL (INCLUDING MAJOR CITY) $360 1.3% 54.0%
SUBURBS/OTHER $307 1.1% 46.0%
SUBURBS/OTHER AND PRIMARY CITIES (EXCLUDING MAJOR CITY)
$355 1.3% 53.1%
AUSTIN-ROUND ROCK-SAN MARCOS, TX METRO AREA $630 2.4%
AUSTIN-ROUND ROCK-SAN MARCOS, TX $630 2.3% 100%
Austin $555 2.1% 88.0%
MAJOR CITY (AUSTIN) $555 2.1% 88.0%
PRIMARY CITY TOTAL (INCLUDING MAJOR CITY) $555 2.1% 88.0%
SUBURBS/OTHER $75 0.3% 12.0%
SUBURBS/OTHER AND PRIMARY CITIES (EXCLUDING MAJOR CITY)
$75 0.3% 12.0%
SEATTLE-TACOMA-BELLEVUE, WA METRO AREA $570 2.1%
Seattle $377 1.4% 66.1%
Bellevue $118 0.4% 20.7%
MAJOR CITY (SEATTLE) $377 1.4% 66.1%
PRIMARY CITY TOTAL (INCLUDING MAJOR CITY) $495 1.8% 86.8%
SUBURBS/OTHER $75 0.3% 13.2%
SUBURBS/OTHER AND PRIMARY CITIES (EXCLUDING MAJOR CITY)
$193 0.7% 33.9%
Chapter 8
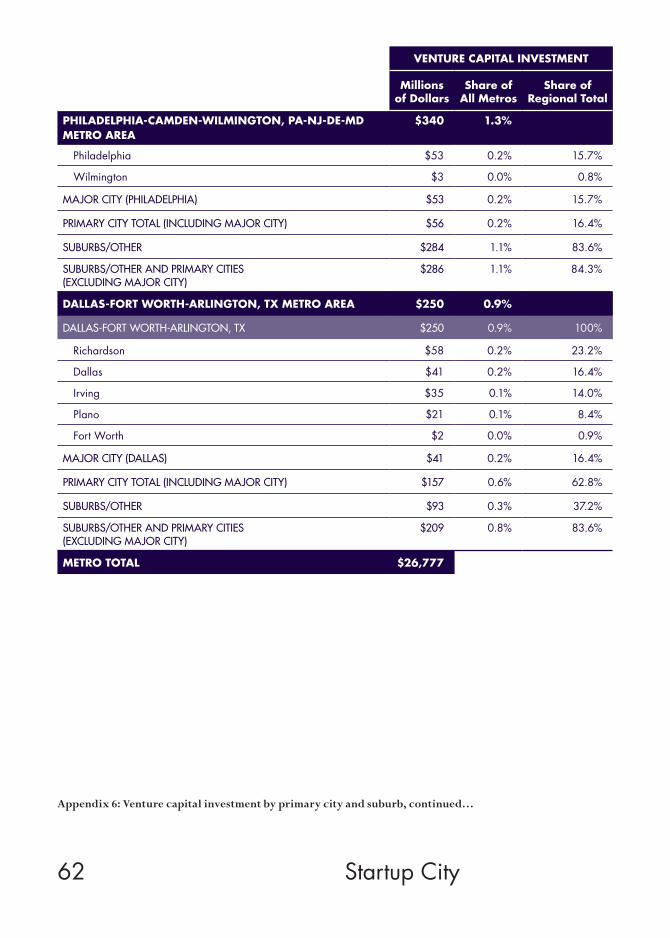
62 Startup City
Appendix 6: Venture capital investment by primary city and suburb, continued…
VENTURE CAPITAL INVESTMENT
Millions of Dollars
Share of All Metros
Share of Regional Total
PHILADELPHIA-CAMDEN-WILMINGTON, PA-NJ-DE-MD METRO AREA
$340 1.3%
Philadelphia $53 0.2% 15.7%
Wilmington $3 0.0% 0.8%
MAJOR CITY (PHILADELPHIA) $53 0.2% 15.7%
PRIMARY CITY TOTAL (INCLUDING MAJOR CITY) $56 0.2% 16.4%
SUBURBS/OTHER $284 1.1% 83.6%
SUBURBS/OTHER AND PRIMARY CITIES (EXCLUDING MAJOR CITY)
$286 1.1% 84.3%
DALLAS-FORT WORTH-ARLINGTON, TX METRO AREA $250 0.9%
DALLAS-FORT WORTH-ARLINGTON, TX $250 0.9% 100%
Richardson $58 0.2% 23.2%
Dallas $41 0.2% 16.4%
Irving $35 0.1% 14.0%
Plano $21 0.1% 8.4%
Fort Worth $2 0.0% 0.9%
MAJOR CITY (DALLAS) $41 0.2% 16.4%
PRIMARY CITY TOTAL (INCLUDING MAJOR CITY) $157 0.6% 62.8%
SUBURBS/OTHER $93 0.3% 37.2%
SUBURBS/OTHER AND PRIMARY CITIES (EXCLUDING MAJOR CITY)
$209 0.8% 83.6%
METRO TOTAL $26,777
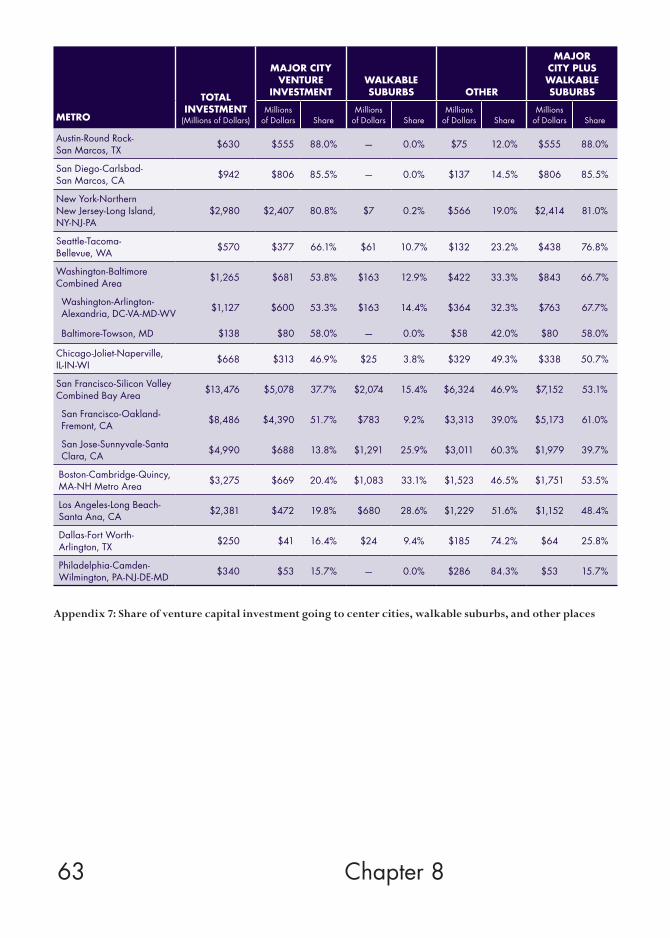
63
Appendix 7: Share of venture capital investment going to center cities, walkable suburbs, and other places
METRO
TOTAL INVESTMENT
(Millions of Dollars)
MAJOR CITY VENTURE
INVESTMENTWALKABLE SUBURBS OTHER
MAJOR CITY PLUS WALKABLE SUBURBS
Millions of Dollars Share
Millions of Dollars Share
Millions of Dollars Share
Millions of Dollars Share
Austin-Round Rock- San Marcos, TX $630 $555 88.0% — 0.0% $75 12.0% $555 88.0%
San Diego-Carlsbad- San Marcos, CA $942 $806 85.5% — 0.0% $137 14.5% $806 85.5%
New York-Northern New Jersey-Long Island, NY-NJ-PA
$2,980 $2,407 80.8% $7 0.2% $566 19.0% $2,414 81.0%
Seattle-Tacoma- Bellevue, WA $570 $377 66.1% $61 10.7% $132 23.2% $438 76.8%
Washington-Baltimore Combined Area $1,265 $681 53.8% $163 12.9% $422 33.3% $843 66.7%
Washington-Arlington- Alexandria, DC-VA-MD-WV $1,127 $600 53.3% $163 14.4% $364 32.3% $763 67.7%
Baltimore-Towson, MD $138 $80 58.0% — 0.0% $58 42.0% $80 58.0%
Chicago-Joliet-Naperville, IL-IN-WI $668 $313 46.9% $25 3.8% $329 49.3% $338 50.7%
San Francisco-Silicon Valley Combined Bay Area $13,476 $5,078 37.7% $2,074 15.4% $6,324 46.9% $7,152 53.1%
San Francisco-Oakland- Fremont, CA $8,486 $4,390 51.7% $783 9.2% $3,313 39.0% $5,173 61.0%
San Jose-Sunnyvale-Santa Clara, CA $4,990 $688 13.8% $1,291 25.9% $3,011 60.3% $1,979 39.7%
Boston-Cambridge-Quincy, MA-NH Metro Area $3,275 $669 20.4% $1,083 33.1% $1,523 46.5% $1,751 53.5%
Los Angeles-Long Beach- Santa Ana, CA $2,381 $472 19.8% $680 28.6% $1,229 51.6% $1,152 48.4%
Dallas-Fort Worth- Arlington, TX $250 $41 16.4% $24 9.4% $185 74.2% $64 25.8%
Philadelphia-Camden- Wilmington, PA-NJ-DE-MD $340 $53 15.7% — 0.0% $286 84.3% $53 15.7%
Chapter 8
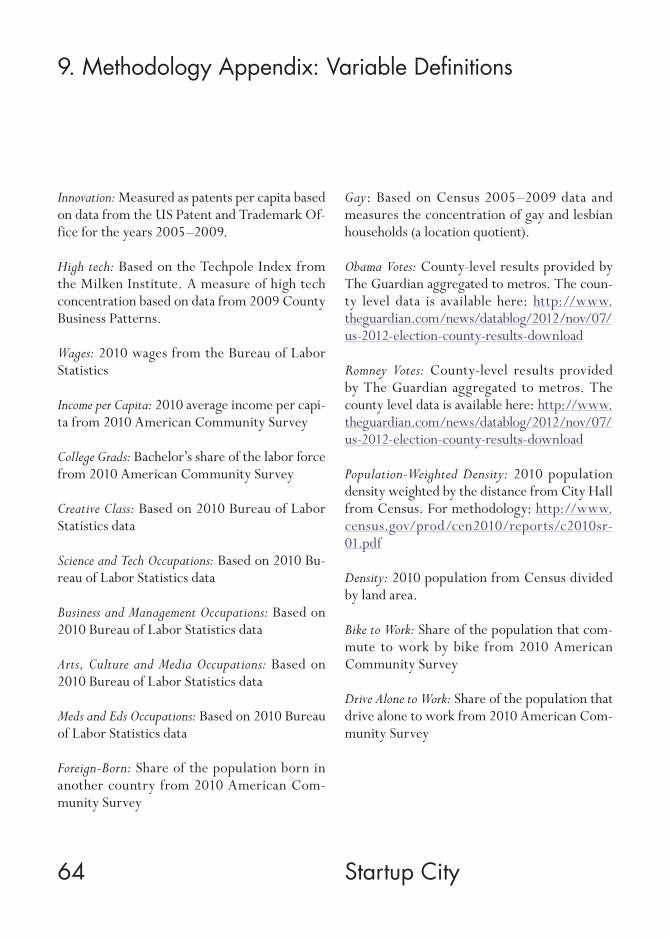
64 Startup City
9. Methodology Appendix: Variable Definitions
Innovation: Measured as patents per capita based on data from the US Patent and Trademark Of-fice for the years 2005–2009.
High tech: Based on the Techpole Index from the Milken Institute. A measure of high tech concentration based on data from 2009 County Business Patterns.
Wages: 2010 wages from the Bureau of Labor Statistics
Income per Capita: 2010 average income per capi-ta from 2010 American Community Survey
College Grads: Bachelor’s share of the labor force from 2010 American Community Survey
Creative Class: Based on 2010 Bureau of Labor Statistics data
Science and Tech Occupations: Based on 2010 Bu-reau of Labor Statistics data
Business and Management Occupations: Based on 2010 Bureau of Labor Statistics data
Arts, Culture and Media Occupations: Based on 2010 Bureau of Labor Statistics data
Meds and Eds Occupations: Based on 2010 Bureau of Labor Statistics data
Foreign-Born: Share of the population born in another country from 2010 American Com-munity Survey
Gay: Based on Census 2005–2009 data and measures the concentration of gay and lesbian households (a location quotient).
Obama Votes: County-level results provided by The Guardian aggregated to metros. The coun-ty level data is available here: http://www.theguardian.com/news/datablog/2012/nov/07/us-2012-election-county-results-download
Romney Votes: County-level results provided by The Guardian aggregated to metros. The county level data is available here: http://www.theguardian.com/news/datablog/2012/nov/07/us-2012-election-county-results-download
Population-Weighted Density: 2010 population density weighted by the distance from City Hall from Census. For methodology: http://www.census.gov/prod/cen2010/reports/c2010sr- 01.pdf
Density: 2010 population from Census divided by land area.
Bike to Work: Share of the population that com-mute to work by bike from 2010 American Community Survey
Drive Alone to Work: Share of the population that drive alone to work from 2010 American Com-munity Survey
65 Startup City
10. Endnotes
1 The term “nerdistan” originates with Joel Kotkin. See “Escape from Nerdistan,” Washington Post, September 12, 1997. Also see Kotkin, The New Geography: How the Digital Revolution Is Reshaping the Ameri-can Landscape, New York: Random House, 2000.
2 See, Richard Florida and Martin Kenney, “Venture Capital, High Tech-nology and Regional Development,” Regional Studies 22, 1, 1988, pp. 33–48; Richard Florida and Martin Kenney, “Venture Capital-Financed Innovation and Technological Change in the USA,” Research Policy 17, 3, 1988, pp. 119–37; Richard Florida and Donald F. Smith, “Venture Capital Formation, Investment, and Regional Industrialization,” Annals of the Asso-ciation of American Geographers 83, 3, 1993, pp. 434–51.
3 See, Richard Florida, ‘The Joys of Urban Tech,” Wall Street Journal, August 31, 2012, http://online.wsj.com/article/SB10000872396390444914904577619441778073340.html. Also, Richard Florida, “San Francisco’s Urban Tech Boom,” San Francisco Chronicle, September 8, 2012, http://www.sfgate.com/opin-ion/article/San-Francisco-s-urban-tech-boom-3850039.php.
4 Jonathan Bowles and David Giles, New Tech City, New York: Center for an Urban Future, May 2012, http://nycfuture.org/images_pdfs/pdfs/NewTechCity.pdf.
5 Max Nathan, Emma Vandore and Rob Whitehead, A Tale of Tech City: The Future of Inner East London’s
Digital Economy, London: Centre for London, 2012, http://www.demos.co.uk/files/A_Tale_of_Tech_City_web.pdf?1340965124.
6 Richard Florida, “The Secret to Seattle’s Booming Downtown,” The Atlantic Cities, March 23, 2012, http://www.theatlanticcities.com/jobs-and-economy/2012/03/secret-seattles-booming-down-town/1532/; Richard Florida, “Why Twitter Chose Berlin,” The Atlantic Cities, March 28, 2012, http://www.theatlanticcities.com/jobs-and-economy/2012/03/why-twitter-chose-berlin/1609/; Richard Florida, “New York City: The Nation’s Second Leading Tech Hub,” The Atlantic Cities, May 9, 2012, http://www.theatlanticcities.com/technolo-gy/2012/05/new-york-city-nations-second-leading-tech-hub/1969/.
7 Jane Jacobs, The Death and Life of American Cities, New York: Random House, 1961, p. 188; Jacobs, The Economy of Cities, New York: Vintage, 1970; Jacobs, Cities and the Wealth of Nations: Principles of Economic Life, New York: Vintage, 1985.
8 Robert E. Lucas Jr., “On the Me-chanics of Economic Development,” Journal of Monetary Economics, 22, 1, July 1988, pp. 3–42; Edward Glaeser, Triumph of the City: How Our Greatest Invention Makes Us Richer, Smarter, Greener, Healthier, and Happier, New York: Penguin Press, 2011; Michael Porter, “Loca-tion, Competition, and Economic De-velopment: Local Clusters in a Global Economy,” Economic Development
Quarterly, 14, 1, February 2000, pp.15–34; Michael Porter, “New Strategies for Inner-City Economic Development,” Economic Develop-ment Quarterly, 11, 1, February 1997, pp. 11–27; Michael Porter, “Clusters and the New Economics of Competition,” Harvard Business Review, November 1998.
9 See, Richard Florida, The Rise of the Creative Class, New York: Basic Books, 2002; The Flight of the Creative Class, New York: Harper Collins, 2005; and Florida, The Rise of the Creative Class, Revisited, New York: Basic Books, 2012.
10 See, National Venture Capital Association, 2013, http://www.nvca.org/; and PricewaterhouseCoopers, Money Tree Report, 2013, https://www.pwcmoneytree.com/MTPublic/ns/index.jsp.
11 National Venture Capital Asso-ciation, 2013, http://www.nvca.org/; Dow Jones, Venture Source, 2013, http://www.dowjones.com/private-equityventurecapital/venturesource.asp.
12 Florida, 2012.
13 Interview with Fred Wilson con-ducted by Richard Florida on October 9, 2013, http://www.stern.nyu.edu/experience-stern/news-events/conver-sation-florida-wilson.
14 See, Aaron Renn, “The End of the Road for Eds and Meds,” New Geography, September 12, 2012, http://www.newgeography.com/content/003076-the-end-road-eds-
66 Chapter 10
and-meds; Richard Florida, “Eds and Meds Alone Can’t Revitalize Cities, The Atlantic Cities, September 18, 2012, http://www.theatlanticcities.com/jobs-and-economy/2012/09/eds-and-meds-alone-cant-revitalize-cities/3292/.
15 See, AnnaLee Saxenian, The New Argonauts: Regional Advantage in a Global Economy, Cambridge, MA: Harvard University Press, 2007; Saxenian, “Silicon Valley’s New Immigrant Entrepreneurs,“ San Francisco: Public Policy Institute of California, 1999, http://www.ppic.org/content/pubs/report/R_699ASR.pdf; Also Vivek Wadwha, AnnaLee Saxenian, Ben Rissing and Gary Gereffi, “America’s New Immigrant Entrepreneurs: Part I,” Duke Science, Technology and Innovation Paper No. 23, Durham, North Carolina, January 4, 2007, http://people.ischool.berkeley.edu/~anno/ Papers/Americas_new_immigrant_ entrepreneurs_I.pdf.
16 Richard Florida and Gary Gates, “Technology and Tolerance: The Importance of Diversity to High tech Growth,” Washington, DC: Brookings Institution, June 2001, http://www.brookings.edu/~/media/research/files/reports/2001/6/tech-nology%20florida/techtol.pdf.
17 Andrew Gelman, Red State, Blue State, Rich State, Poor State: Why Americans Vote the Way They Do, Princeton: Princeton University Press, 2008.
18 See, Jacobs, 1961; Jacobs, 1970; Jacobs, 1985. Also, Lucas, 1988; Glaeser, 2011; Porter, 1998; Florida, 2002; Florida, Who’s Your City? How the Creative Economy is
Making Where You Live the Most Important Decision of Your Life, New York: Harper Collins, 2008.
19 Richard Florida, “America’s Truly Densest Metros,” The Atlantic Cities, October 15, 2012, http://www.theat-lanticcities.com/housing/2012/10/americas-truly-densest-metros/3450/.
20 More precisely, we analyzed these zip code data according to three geographic scales identified by the U.S. Census Bureau: (1) major or central city, such as New York City, San Francisco or Boston; (2) other primary cities (as defined by the Census Bureau) such as Newark in the New York metro, Oakland in the San Francisco metro or Cambridge in the Boston metro; and (3) suburban areas (see the Appendix for full details).
21 In her influential book Regional Advantage: Culture and Competition in Silicon Valley and Route 128, AnnaLee Saxenian of the University of California, Berkeley, explained how Silicon Valley’s decentralized, cooperative ecosystem allowed it to adapt to new technologies, besting Boston’s more rigid corporate model. The locational shift of urban tech in San Francisco reflects a similar type of locational adaptation. AnnaLee Saxenian, Regional Advantage: Cul-ture and Competition in Silicon Valley and Route 128, Cambridge, MA: Harvard University Press, 1994.
22 See, Bowles and Giles, 2012, http://nycfuture.org/images_pdfs/pdfs/NewTechCity.pdf.
23 Mark Suster, “Why Technology is Driving More Urban Renewal” Both Sides of the Table (blog), July 10 2012, http://www.bothsidesofthetable.
com/2012/07/10/why-technolo-gy-is-driving-more-urban-renewal/.24 Joel Garreau, Edge City: Life on the New Frontier, New York: Anchor Books, 1992.
25 Paul Sommers and Daniel Carlson, “Ten Steps to a High Tech Future: The New Economy in Metro-politan Seattle,” Washington, DC: The Brookings Institution, December 2000, http://www.brookings.edu/research/reports/2000/12/labormarkets- sommers.
26 http://www.chrisleinberger.com http://www.creativeclass.com/rfcgdb/articles/Suburban%20Renewal.pdf
27 Suster, 2012.
28 Paul Graham, “How to Be Sili-con Valley,” paulgraham.com, May 2006, http://www.paulgraham.com/siliconvalley.html.
29 Fred Wilson, “Cause and Effect,” AVC: Musings of a VC in NYC (blog), July 7, 2012, http://www.avc.com/a_vc/2012/07/cause-effect.html.30 Brad Wieners, “Are the Techno Riche Really Ruining San Francis-co? Yes, Says Rebecca Solnit,” BloombergBusinessweek, December 31, 2013, http://www.businessweek.com/articles/2013-12-31/are-the-tech-no-riche-really-ruining-san-francisco-yes-says-rebecca-solnit.
31 Richard Florida, “Strategies for Increasing Diversity in Urban Tech Scenes,” The Atlantic Cities, December 14, 2012, http://www.theatlanticcities.com/jobs-and-econo-my/2012/12/strategies-increasing-di-versity-urban-tech-scenes/4151/.

Martin Prosperity InstituteRotman School of ManagementUniversity of Toronto105 St. George St., Ste. 9000Toronto, ON M5S 3E6
w martinprosperity.orge [email protected] 416.946.7300f 416.946.7606
© March 2014Reissued May 2015ISBN 978-0-9811974-9-4