Embed Size (px)
Citation preview
© 2016 ALL RIGHTS RESERVED ● MATTERMARK.COM ● (415) 366-6587
US Venture Capital & Startup Traction Report
2015
© 2016 ALL RIGHTS RESERVED ● MATTERMARK.COM ● (415) 366-65872
IntroductionThis report analyzes venture funding trends for US startups from 2006 to present. At Mattermark we pride ourselves on providing the startup ecosystem with information on how businesses grow, raise funding, and evolve. We believe utilization of these resources should be combined with your special knowledge of your industry, region and role. Startup investments and business decisions hold a level of risk on the part of investors, founders, employees, services providers, and anyone who stands to benefit from these transactions.
We hope that this report both informs your future conversations and helps you head into 2016 fundraising and deal making with better data for your upcoming business decisions.
Sincerely,
Danielle Morrill, CEO & Cofounder of Mattermark
Data Sources
Mattermark uses a broad range of sources to present the most complete picture possible of the startup ecosystem. In addition to extensive primary source research sourced specifically for this report, Mattermark uses publicly-available data from AngelList (www.angel.co), Crunchbase (www.crunchbase.com), NASDAQ, (www.nasdaq.com), the United States Securities and Exchange Commission (www.sec.gov), and source relationships with thousands of investors, community leaders, and startup founders.
Please send any questions, comments, or corrections for the editor to [email protected].
MATTERMARK 2015 US STARTUP FUNDING REPORT
© 2016 ALL RIGHTS RESERVED ● MATTERMARK.COM ● (415) 366-65873
Table of ContentsDisclaimer
This information has been prepared by Mattermark, Inc. solely for informational purposes. It is not, and should not be regarded as, investment advice, as a recommendation regarding any particular security, or as a course of action. Opinions expressed herein are current opinions as of the date appearing in this material only and are subject to change without notice.
No part of this document may be reproduced in any manner, in whole or in part, without the prior written permission of Mattermark, Inc. This information is provided with the understanding that, with respect to the material provided herein, you will make your own independent decision with respect to any course of action based on your own judgment, and that you are capable of understanding and assessing the merits of a course of action.
Neither the information, nor any opinion contained herein, constitute a solicitation or offer by Mattermark, Inc. to buy or sell any securities, futures, options, or other financial instruments or provide any investment advice or service. Mattermark, Inc. does not purport to, and does not, in any fashion, provide broker/dealer, consulting, or any related services. Mattermark, Inc. shall not have any liability for any damages of any kind whatsoever relating to this material. By accepting this material, you acknowledge, understand, and accept the foregoing.
4 10 Year Market Overview
13 Pre Series A
18 Series A
23 Series B
29 Series C
34 Late Stage
40 Methodology Notes
MATTERMARK 2015 US STARTUP FUNDING REPORT
© 2016 ALL RIGHTS RESERVED ● MATTERMARK.COM ● (415) 366-6587 5
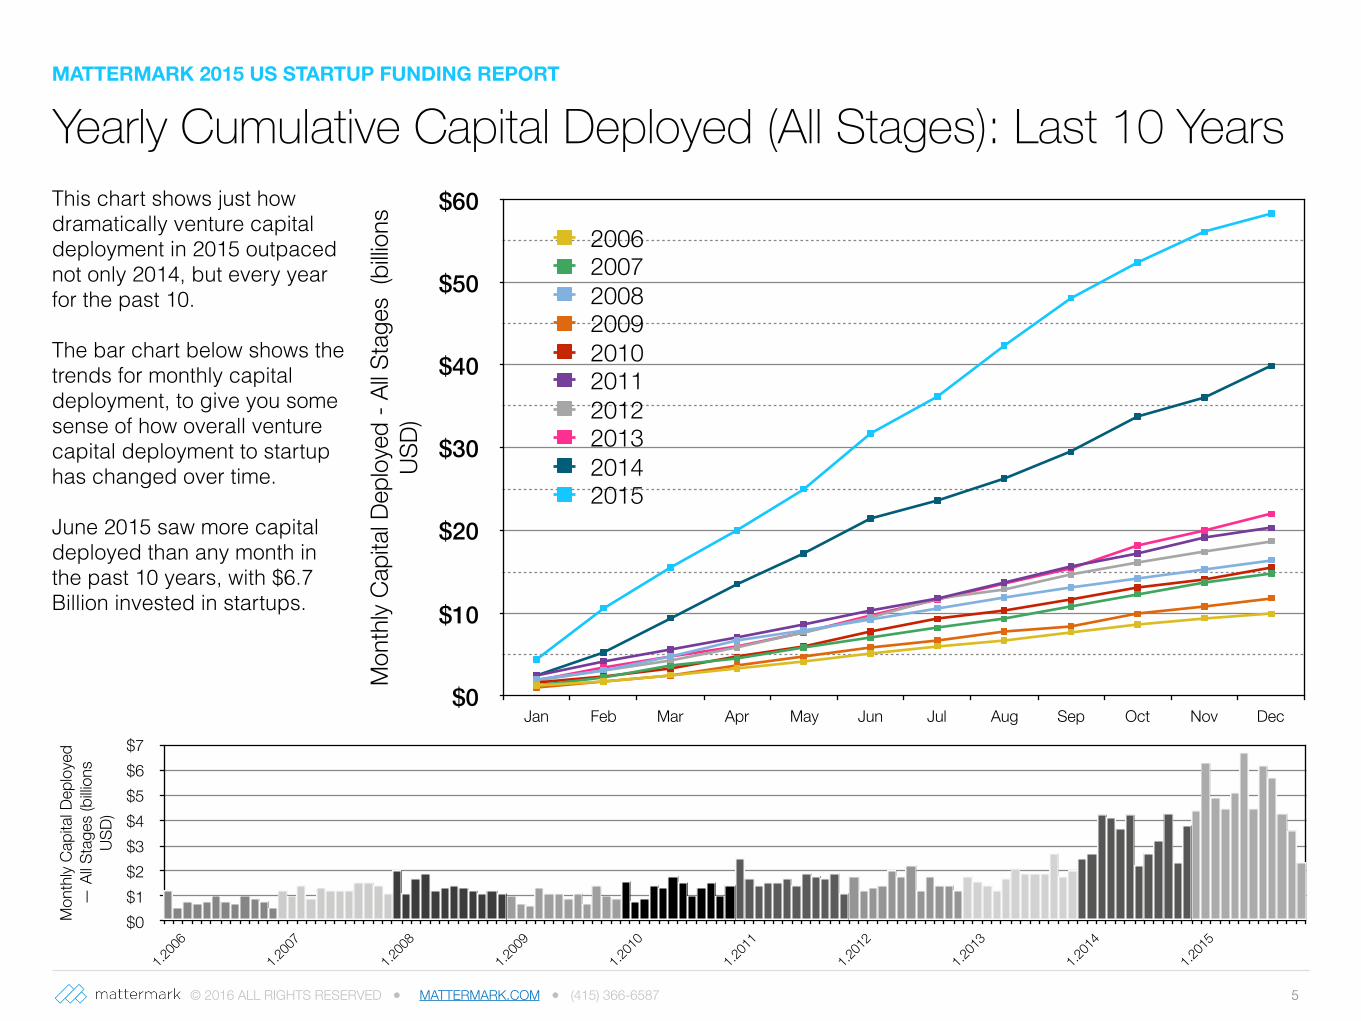
Yearly Cumulative Capital Deployed (All Stages): Last 10 YearsThis chart shows just how dramatically venture capital deployment in 2015 outpaced not only 2014, but every year for the past 10.
The bar chart below shows the trends for monthly capital deployment, to give you some sense of how overall venture capital deployment to startup has changed over time.
June 2015 saw more capital deployed than any month in the past 10 years, with $6.7 Billion invested in startups.
Mon
thly
Capi
tal D
eplo
yed
- All S
tage
s (b
illion
s US
D)
$0
$10
$20
$30
$40
$50
$60
Jan Feb Mar Apr May Jun Jul Aug Sep Oct Nov Dec
2006200720082009201020112012201320142015
MATTERMARK 2015 US STARTUP FUNDING REPORTM
onth
ly Ca
pita
l Dep
loye
d —
All S
tage
s (b
illion
s US
D)
$0$1$2$3$4$5$6$7
1.200
61.2
007
1.200
81.2
009
1.201
01.2
011
1.201
21.2
013
1.201
41.2
015
© 2016 ALL RIGHTS RESERVED ● MATTERMARK.COM ● (415) 366-6587 6
Annu
al De
al Vo
lume
by S
tage
0
200
400
600
800
1,000
1,200
2006 2007 2008 2009 2010 2011 2012 2013 2014 2015
Seed/Angel Series A Series B Series C Late Stage
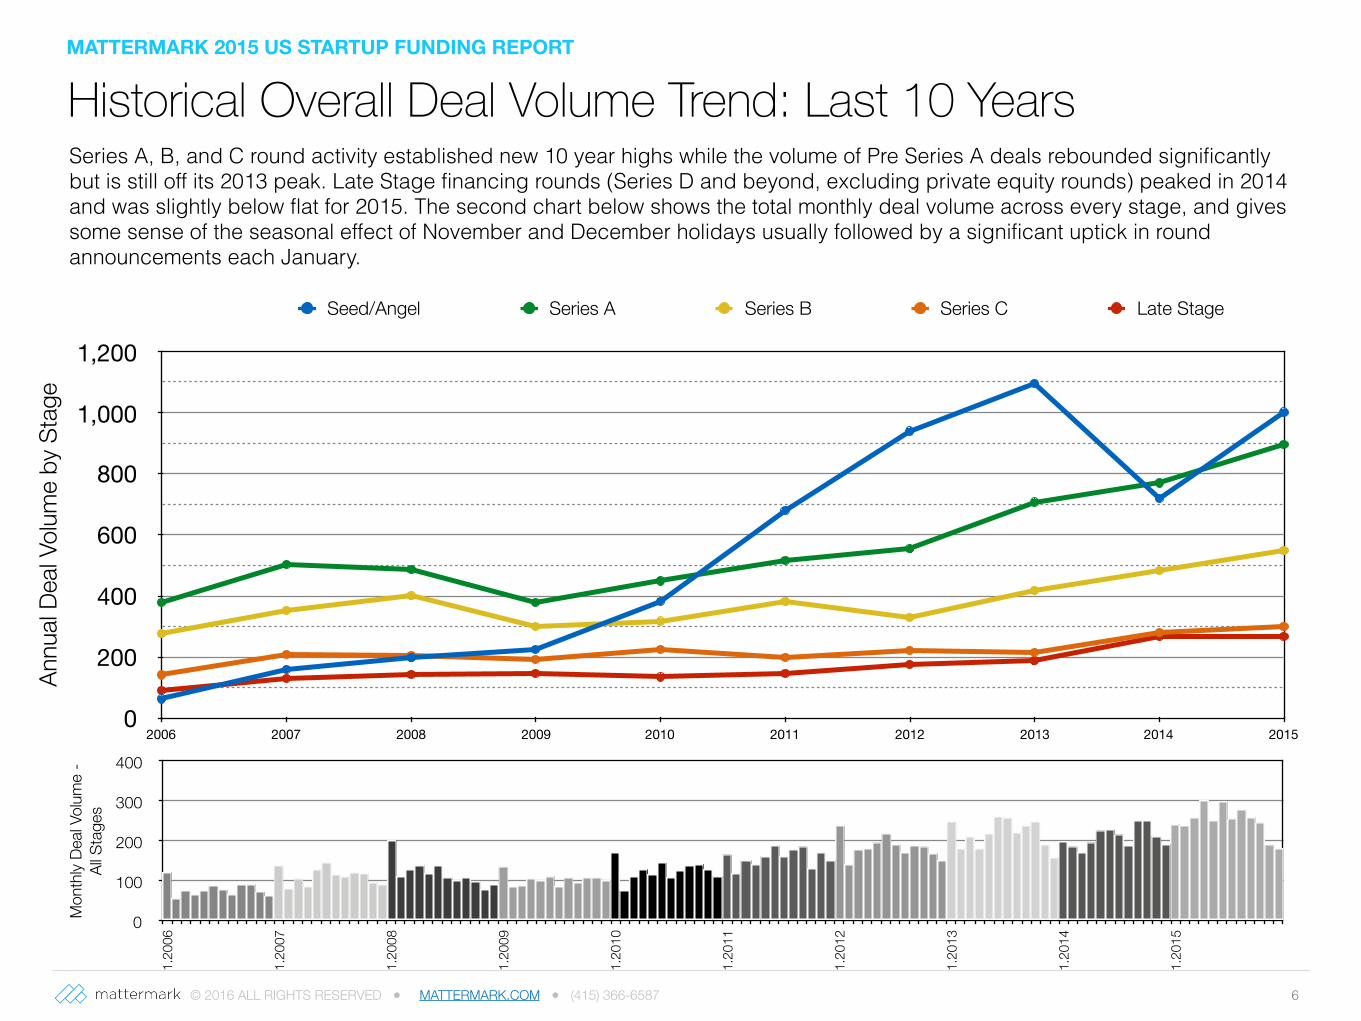
Historical Overall Deal Volume Trend: Last 10 YearsSeries A, B, and C round activity established new 10 year highs while the volume of Pre Series A deals rebounded significantly but is still off its 2013 peak. Late Stage financing rounds (Series D and beyond, excluding private equity rounds) peaked in 2014 and was slightly below flat for 2015. The second chart below shows the total monthly deal volume across every stage, and gives some sense of the seasonal effect of November and December holidays usually followed by a significant uptick in round announcements each January.
Mon
thly
Deal
Volum
e -
All S
tage
s
0
100
200
300
400
1.20
06
1.20
07
1.20
08
1.20
09
1.20
10
1.20
11
1.20
12
1.20
13
1.20
14
1.20
15
MATTERMARK 2015 US STARTUP FUNDING REPORT
© 2016 ALL RIGHTS RESERVED ● MATTERMARK.COM ● (415) 366-6587 7
S&P
500
Inde
x (^
SPX
)
0
500
1,000
1,500
2,000
2,500
Capi
tal D
eplo
yed
(billi
ons U
SD)
$0
$5
$10
$15
$20
$25
Q1
'06
Q2
'06
Q3
'06
Q4
'06
Q1
'07
Q2
'07
Q3
'07
Q4
'07
Q1
'08
Q2
'08
Q3
'08
Q4
'08
Q1
'09
Q2
'09
Q3
'09
Q4
'09
Q1
'10
Q2
'10
Q3
'10
Q4
'10
Q1
'11
Q2
'11
Q3
'11
Q4
'11
Q1
'12
Q2
'12
Q3
'12
Q4
'12
Q1
'13
Q2
'13
Q3
'13
Q4
'13
Q1
'14
Q2
'14
Q3
'14
Q4
'14
Q1
'15
Q2
'15
Q3
'15
Q4
'15
Quarterly Startup Investment Startup Investment 10 Year Trend Quarter-End S&P 500 S&P 500 10 Year Trend
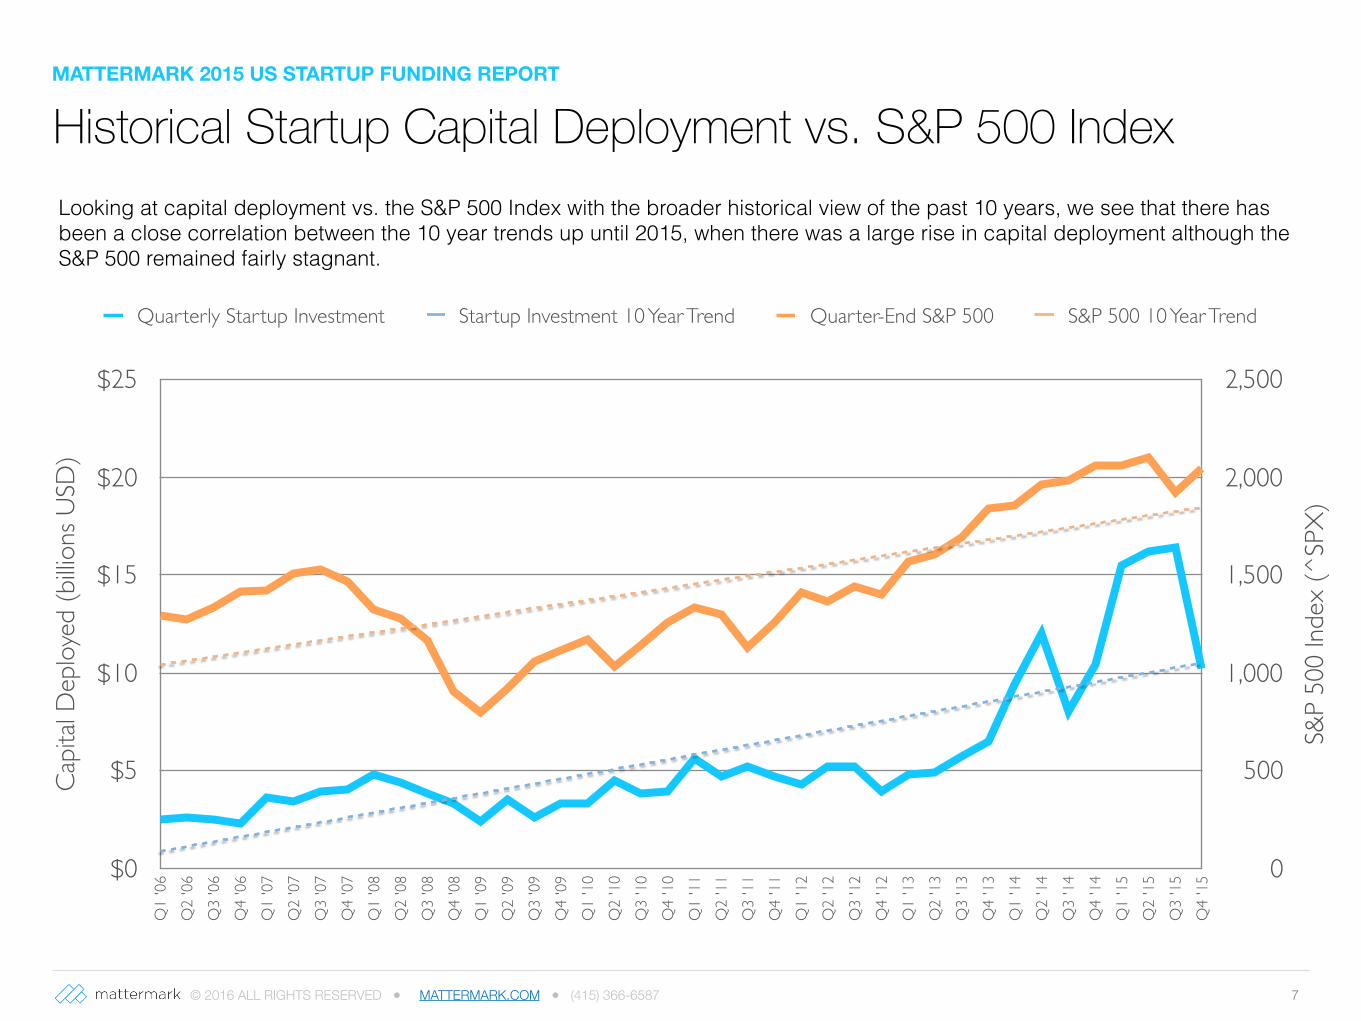
Historical Startup Capital Deployment vs. S&P 500 IndexLooking at capital deployment vs. the S&P 500 Index with the broader historical view of the past 10 years, we see that there has been a close correlation between the 10 year trends up until 2015, when there was a large rise in capital deployment although the S&P 500 remained fairly stagnant.
MATTERMARK 2015 US STARTUP FUNDING REPORT
© 2016 ALL RIGHTS RESERVED ● MATTERMARK.COM ● (415) 366-65879
Overall Deal Volume Up 20% Year-over-Year
Monthly Deal Volume (2015 vs. 2014)
Mon
thly
Deal
Volum
e - A
ll Sta
ges
0
50
100
150
200
250
300
350
Jan
Feb
Mar Apr
May Jun Jul
Aug
Sept Oct
Nov
Dec
2014 2015
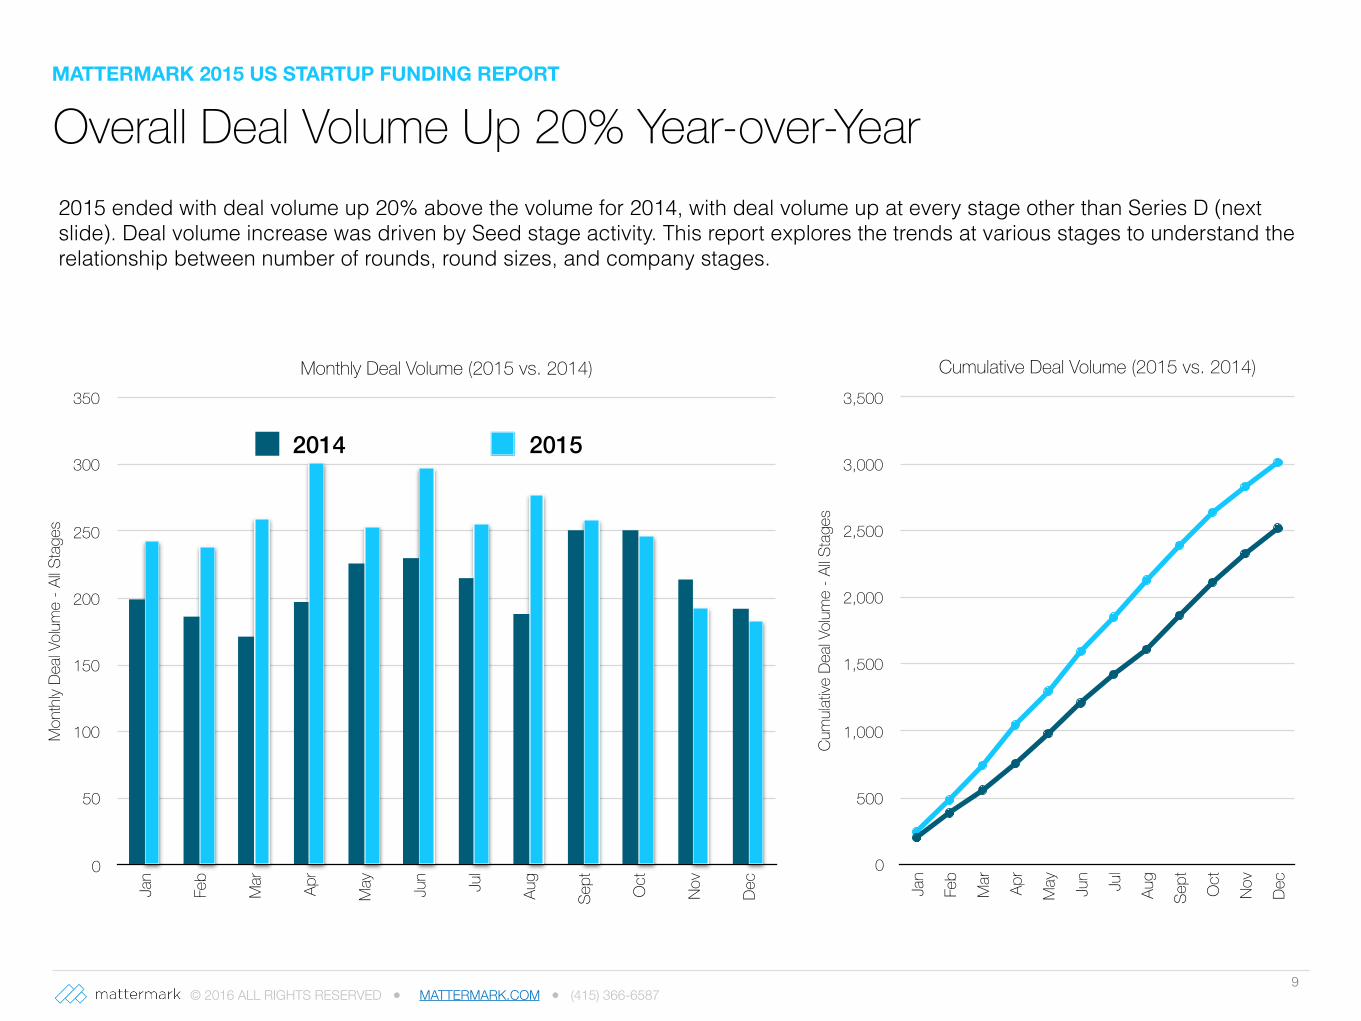
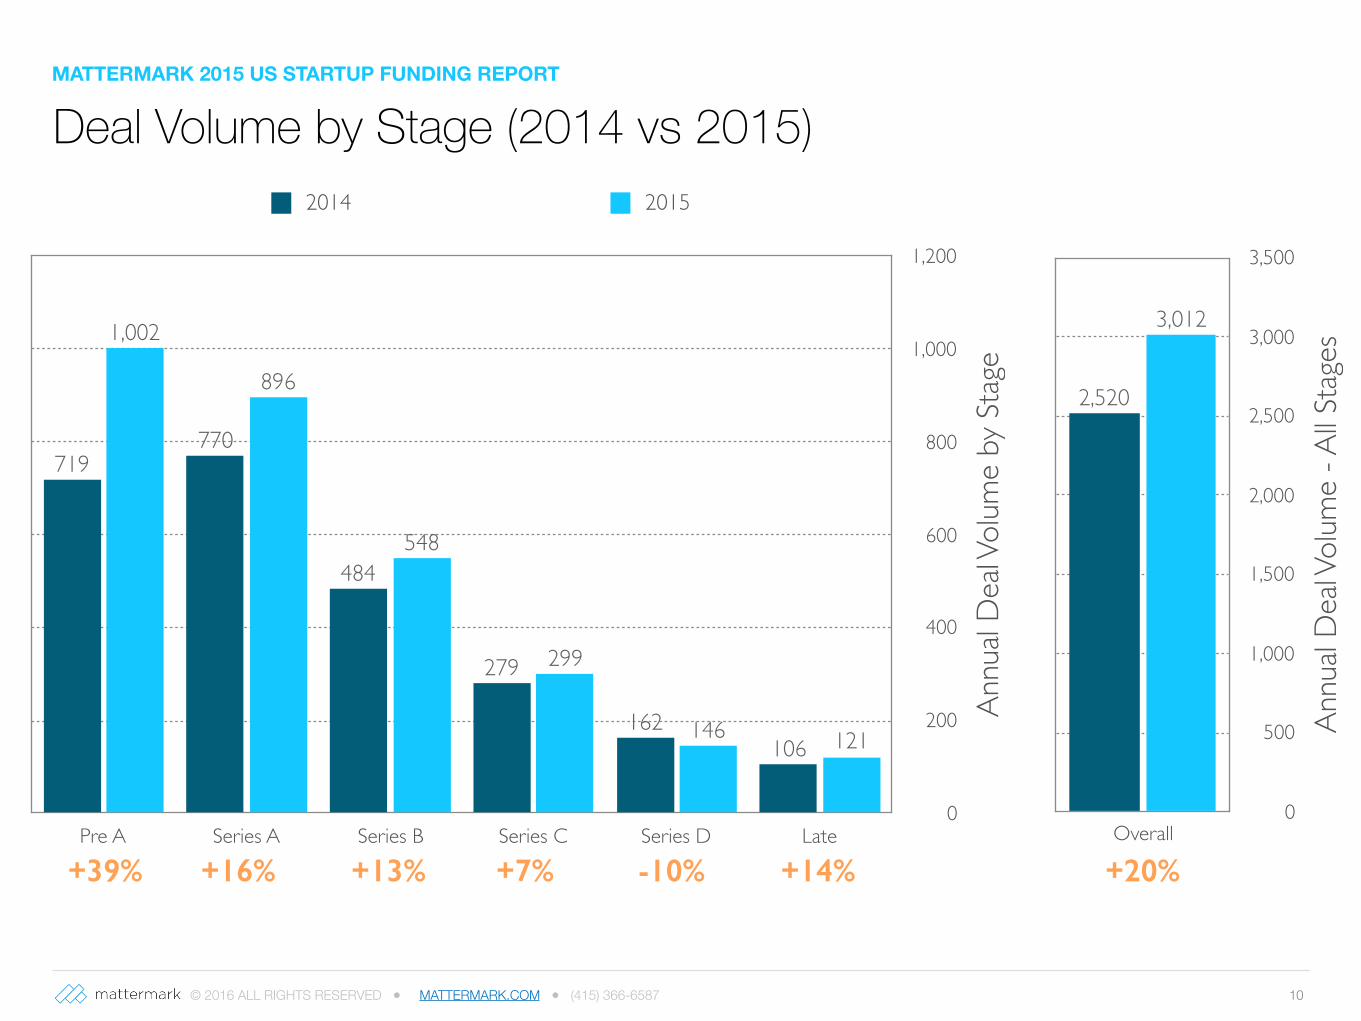
2015 ended with deal volume up 20% above the volume for 2014, with deal volume up at every stage other than Series D (next slide). Deal volume increase was driven by Seed stage activity. This report explores the trends at various stages to understand the relationship between number of rounds, round sizes, and company stages.
Cumulative Deal Volume (2015 vs. 2014)
Cum
ulativ
e De
al Vo
lume
- All S
tage
s
0
500
1,000
1,500
2,000
2,500
3,000
3,500
Jan
Feb
Mar Apr
May Jun Jul
Aug
Sept Oct
Nov
Dec
MATTERMARK 2015 US STARTUP FUNDING REPORT
© 2016 ALL RIGHTS RESERVED ● MATTERMARK.COM ● (415) 366-6587 10An
nual
Dea
l Vol
ume
by S
tage
0
200
400
600
800
1,000
1,200
Pre A Series A Series B Series C Series D Late
2014 2015
121146
299
548
896
1,002
106162
279
484
770719
+39% +16% +13% +7% -10% +14%
Annu
al D
eal V
olum
e - A
ll Sta
ges
0
500
1,000
1,500
2,000
2,500
3,000
3,500
Overall
3,012
2,520
+20%
Deal Volume by Stage (2014 vs 2015)MATTERMARK 2015 US STARTUP FUNDING REPORT
© 2016 ALL RIGHTS RESERVED ● MATTERMARK.COM ● (415) 366-658711
Capital Deployment by Month (2015 vs. 2014)
Mon
thly
Capi
tal D
eploy
ed -
All S
tage
s (b
illions
USD
)
$0
$1
$2
$3
$4
$5
$6
$7
$8
Jan
Feb
Mar Apr
May Jun
July
Aug
Sept Oct
Nov
Dec
2014 2015
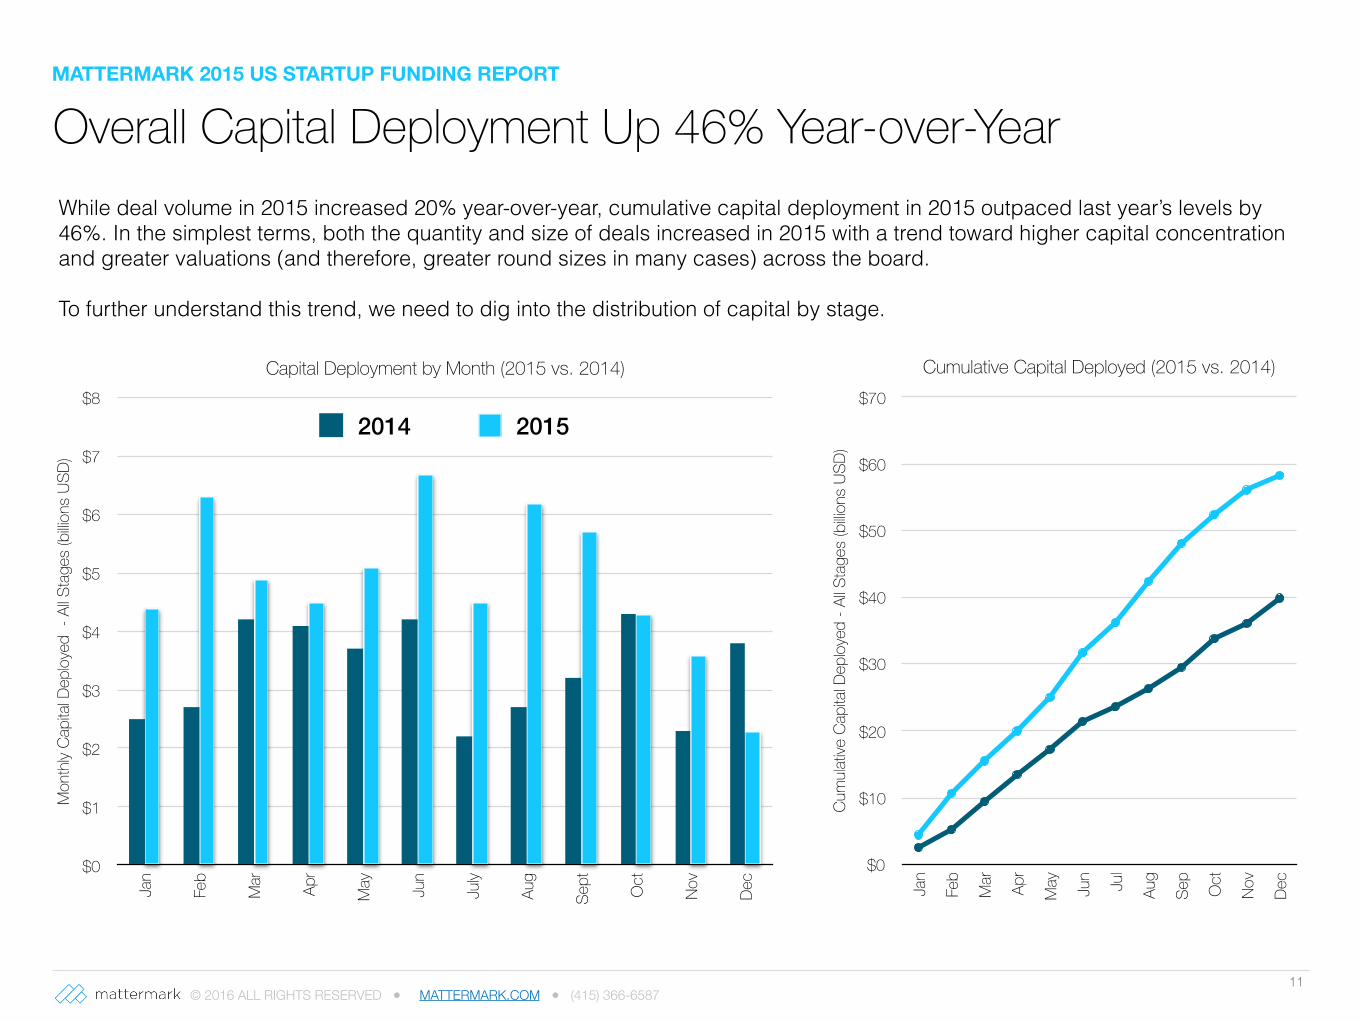
While deal volume in 2015 increased 20% year-over-year, cumulative capital deployment in 2015 outpaced last year’s levels by 46%. In the simplest terms, both the quantity and size of deals increased in 2015 with a trend toward higher capital concentration and greater valuations (and therefore, greater round sizes in many cases) across the board.
To further understand this trend, we need to dig into the distribution of capital by stage.
Cumulative Capital Deployed (2015 vs. 2014)
Cum
ulativ
e Ca
pita
l Dep
loyed
- Al
l Sta
ges
(billio
ns U
SD)
$0
$10
$20
$30
$40
$50
$60
$70
Jan
Feb
Mar Apr
May Jun Jul
Aug
Sep
Oct
Nov
Dec
Overall Capital Deployment Up 46% Year-over-YearMATTERMARK 2015 US STARTUP FUNDING REPORT
© 2016 ALL RIGHTS RESERVED ● MATTERMARK.COM ● (415) 366-6587 12An
nual
Capi
tal D
eplo
yed
by S
tage
(billi
ons
USD
)
$0
$5
$10
$15
$20
$25
Pre A Series A Series B Series C Series D Late
2014 2015
$17.4
$7.0
$10.1
$12.9
$9.3
$1.6
$5.9
$8.7$7.8
$9.8
$6.5
$1.2
+32% +43% +32% +29% -19% +193%
Annu
al Ca
pita
l Dep
loye
d - A
ll Sta
ges
(billi
ons U
SD)
$0
$10
$20
$30
$40
$50
$60
$70
Overall
$58.3
$39.9
+46%
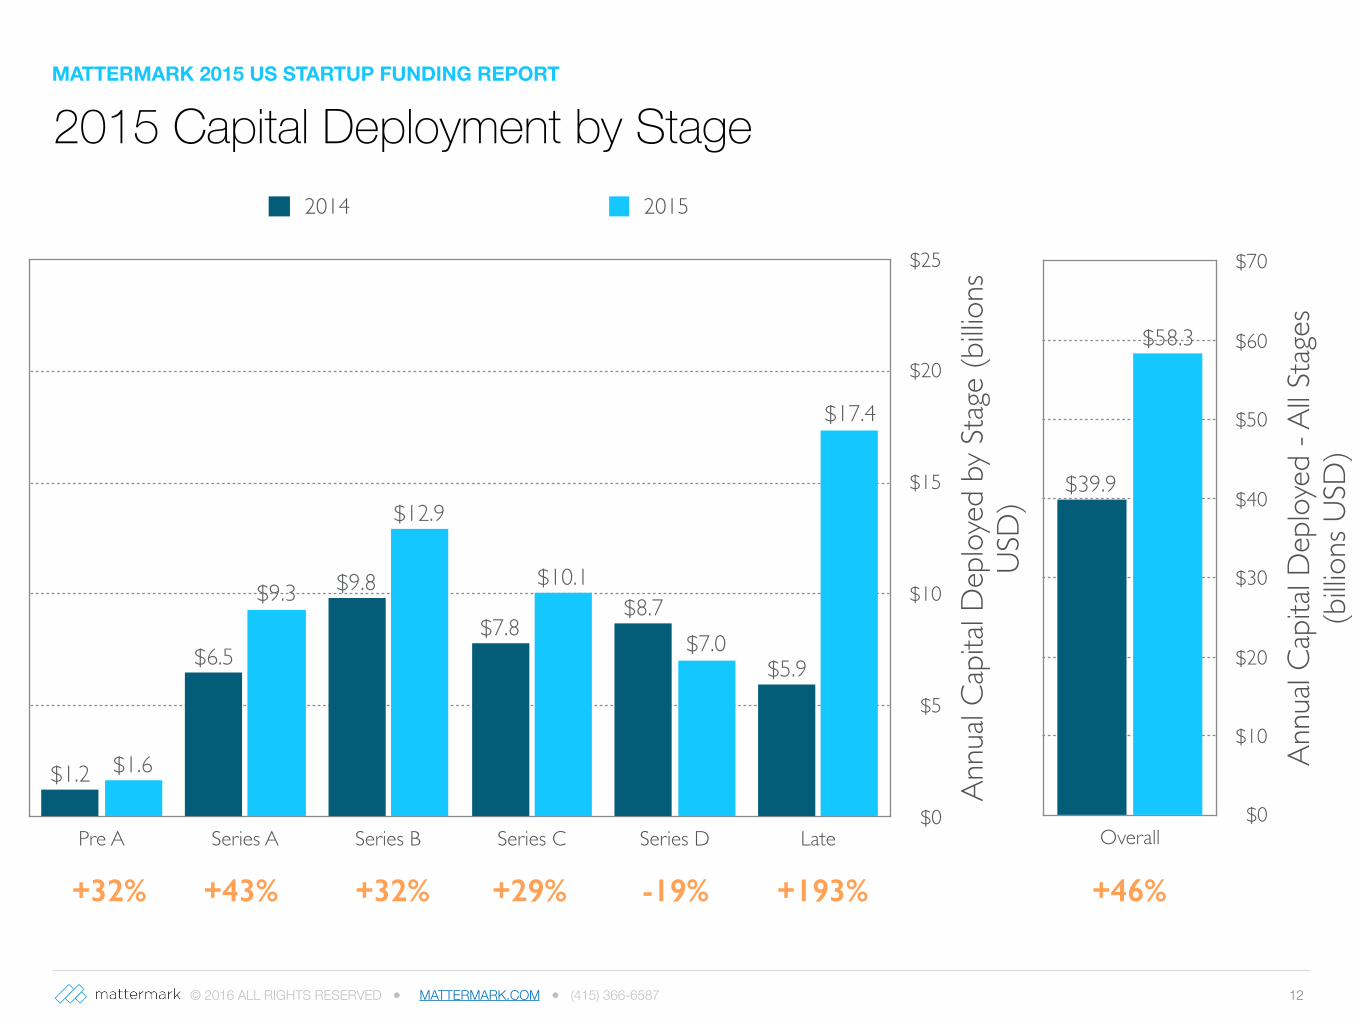
2015 Capital Deployment by StageMATTERMARK 2015 US STARTUP FUNDING REPORT
© 2016 ALL RIGHTS RESERVED ● MATTERMARK.COM ● (415) 366-6587 14
10 Year Trends in Pre Series A Capital DeploymentMATTERMARK 2015 US STARTUP FUNDING REPORT
Cum
ulativ
e Ca
pita
l Dep
loye
d (b
illion
s US
D)
$0.0
$0.4
$0.8
$1.2
$1.6
$2.0
Jan Feb
Mar Apr May Jun Ju
lAug Sep Oct Nov Dec
2006 2007 2008 2009 2010 2011 2012 2013 2014 2015
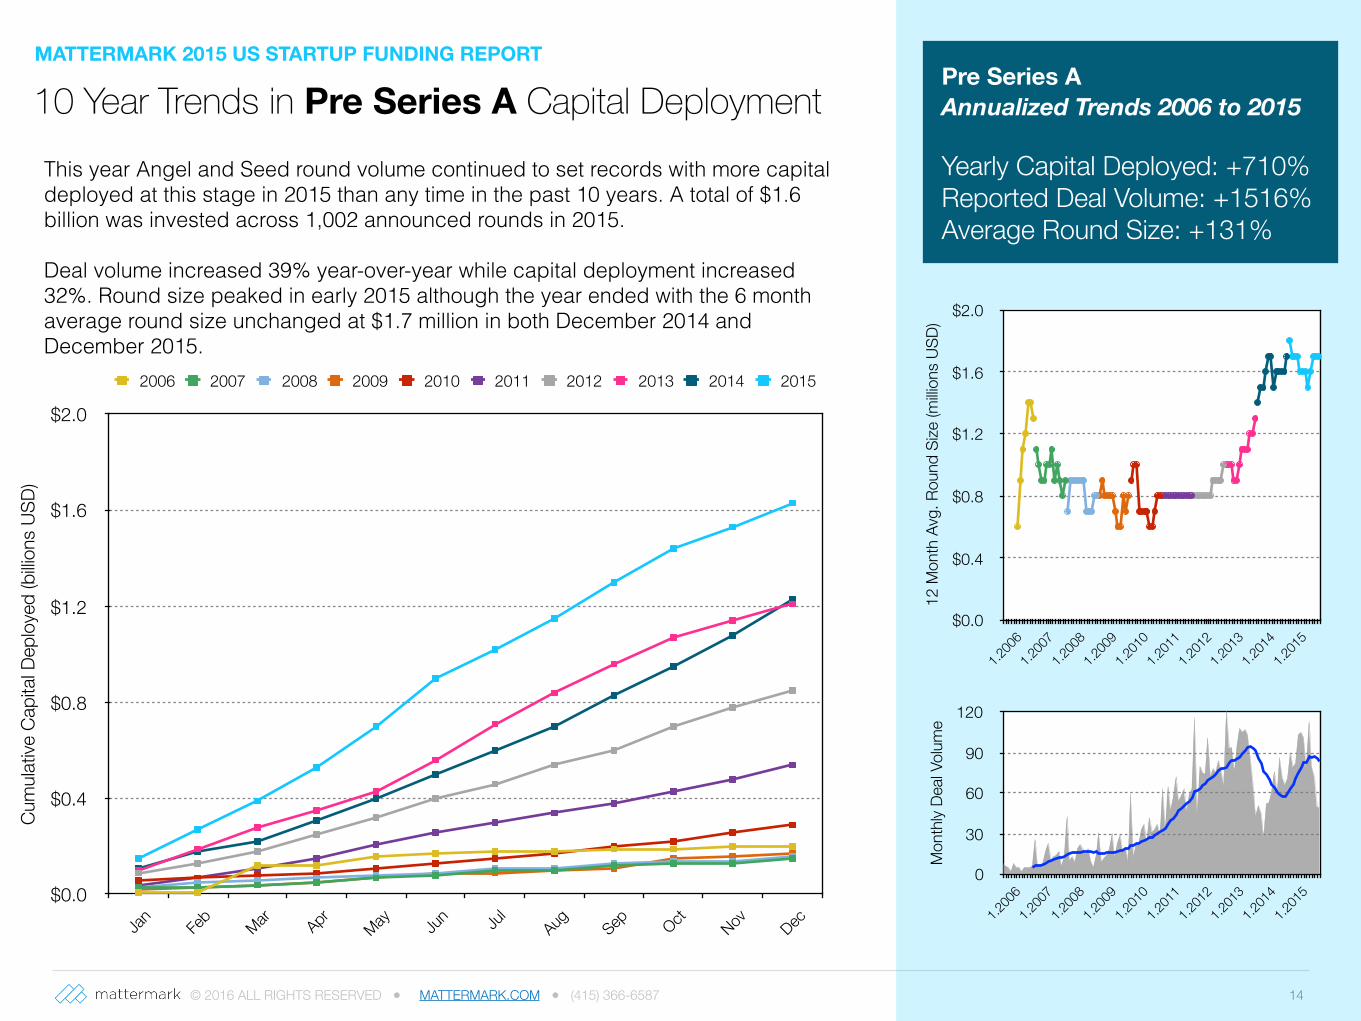
Pre Series A Annualized Trends 2006 to 2015
Yearly Capital Deployed: +710% Reported Deal Volume: +1516% Average Round Size: +131%
12 M
onth
Avg
. Rou
nd S
ize (m
illion
s US
D)
$0.0
$0.4
$0.8
$1.2
$1.6
$2.0
1.200
61.2
007
1.200
81.2
009
1.201
01.2
011
1.201
21.2
013
1.201
41.2
015
Mon
thly
Deal
Volum
e
0
30
60
90
120
1.200
61.2
007
1.200
81.2
009
1.201
01.2
011
1.201
21.2
013
1.201
41.2
015
This year Angel and Seed round volume continued to set records with more capital deployed at this stage in 2015 than any time in the past 10 years. A total of $1.6 billion was invested across 1,002 announced rounds in 2015.
Deal volume increased 39% year-over-year while capital deployment increased 32%. Round size peaked in early 2015 although the year ended with the 6 month average round size unchanged at $1.7 million in both December 2014 and December 2015.
© 2016 ALL RIGHTS RESERVED ● MATTERMARK.COM ● (415) 366-658715
Mon
thly
Capi
tal D
eploy
ed (m
illions
USD
)
$0
$40
$80
$120
$160
$200Ja
n
Feb
Mar Apr
May Jun Jul
Aug
Sept Oct
Nov
Dec Cu
mula
tive
Capi
tal D
eploy
ed (m
illions
USD
)
$0
$400
$800
$1,200
$1,600
$2,000
Jan
Feb
Mar Apr
May Jun Jul
Aug
Sept Oct
Nov
Dec
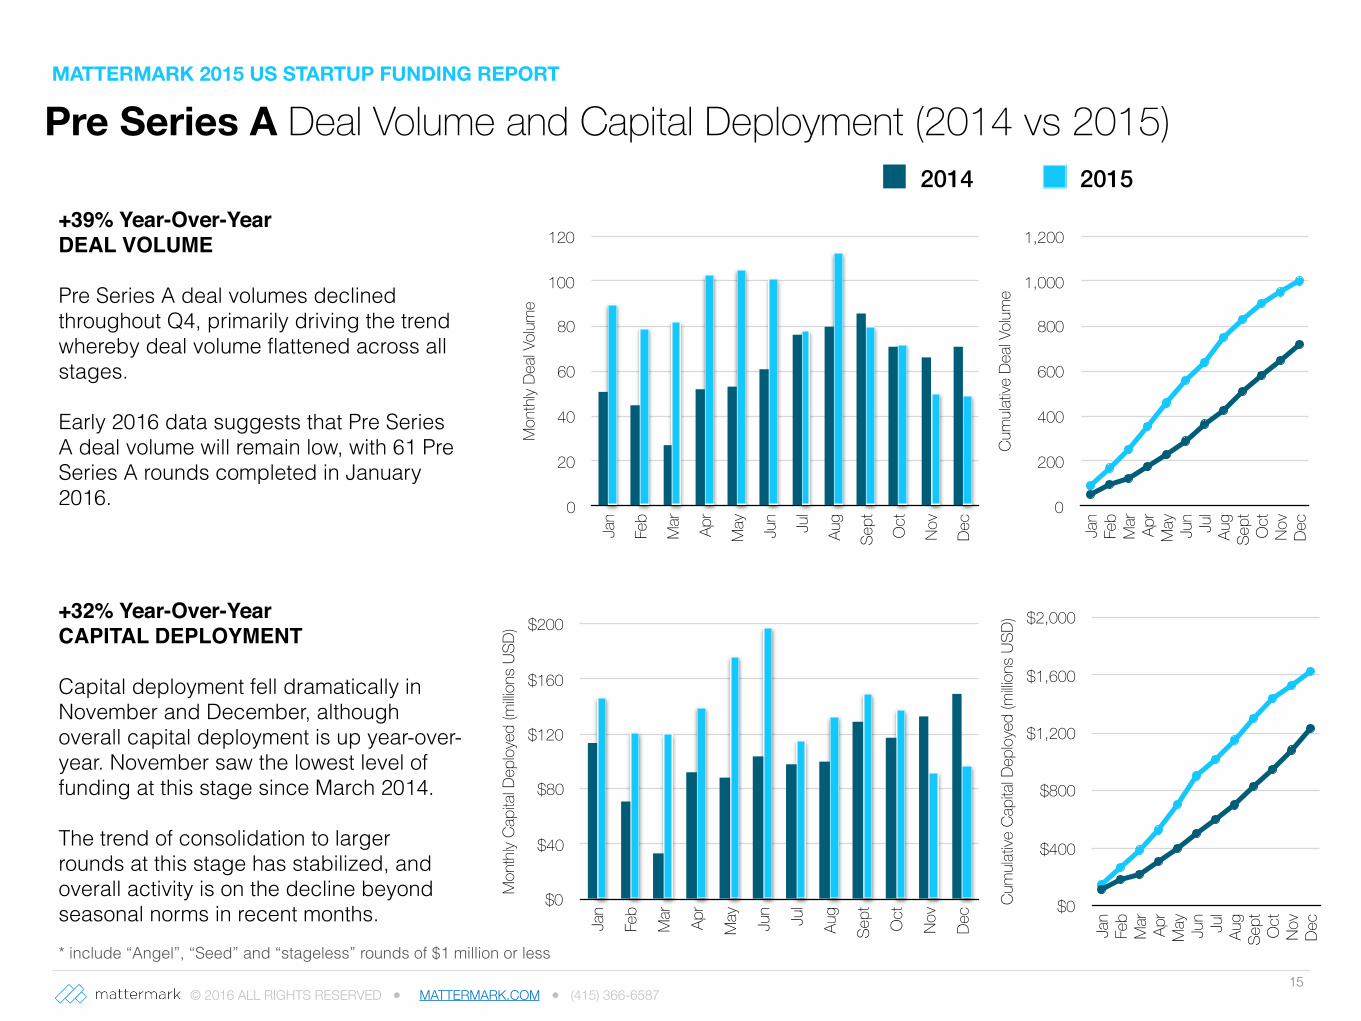
Pre Series A Deal Volume and Capital Deployment (2014 vs 2015)
Mon
thly
Deal
Volum
e0
20
40
60
80
100
120
Jan
Feb
Mar Apr
May Jun Jul
Aug
Sept Oct
Nov
Dec
2014 2015
Cum
ulativ
e De
al Vo
lume
0
200
400
600
800
1,000
1,200
Jan
Feb
Mar Apr
May Jun Jul
Aug
Sept Oct
Nov
Dec
+39% Year-Over-YearDEAL VOLUME
Pre Series A deal volumes declined throughout Q4, primarily driving the trend whereby deal volume flattened across all stages.
Early 2016 data suggests that Pre Series A deal volume will remain low, with 61 Pre Series A rounds completed in January 2016.
+32% Year-Over-YearCAPITAL DEPLOYMENT
Capital deployment fell dramatically in November and December, although overall capital deployment is up year-over-year. November saw the lowest level of funding at this stage since March 2014.
The trend of consolidation to larger rounds at this stage has stabilized, and overall activity is on the decline beyond seasonal norms in recent months.* include “Angel”, “Seed” and “stageless” rounds of $1 million or less
MATTERMARK 2015 US STARTUP FUNDING REPORT
© 2016 ALL RIGHTS RESERVED ● MATTERMARK.COM ● (415) 366-658716
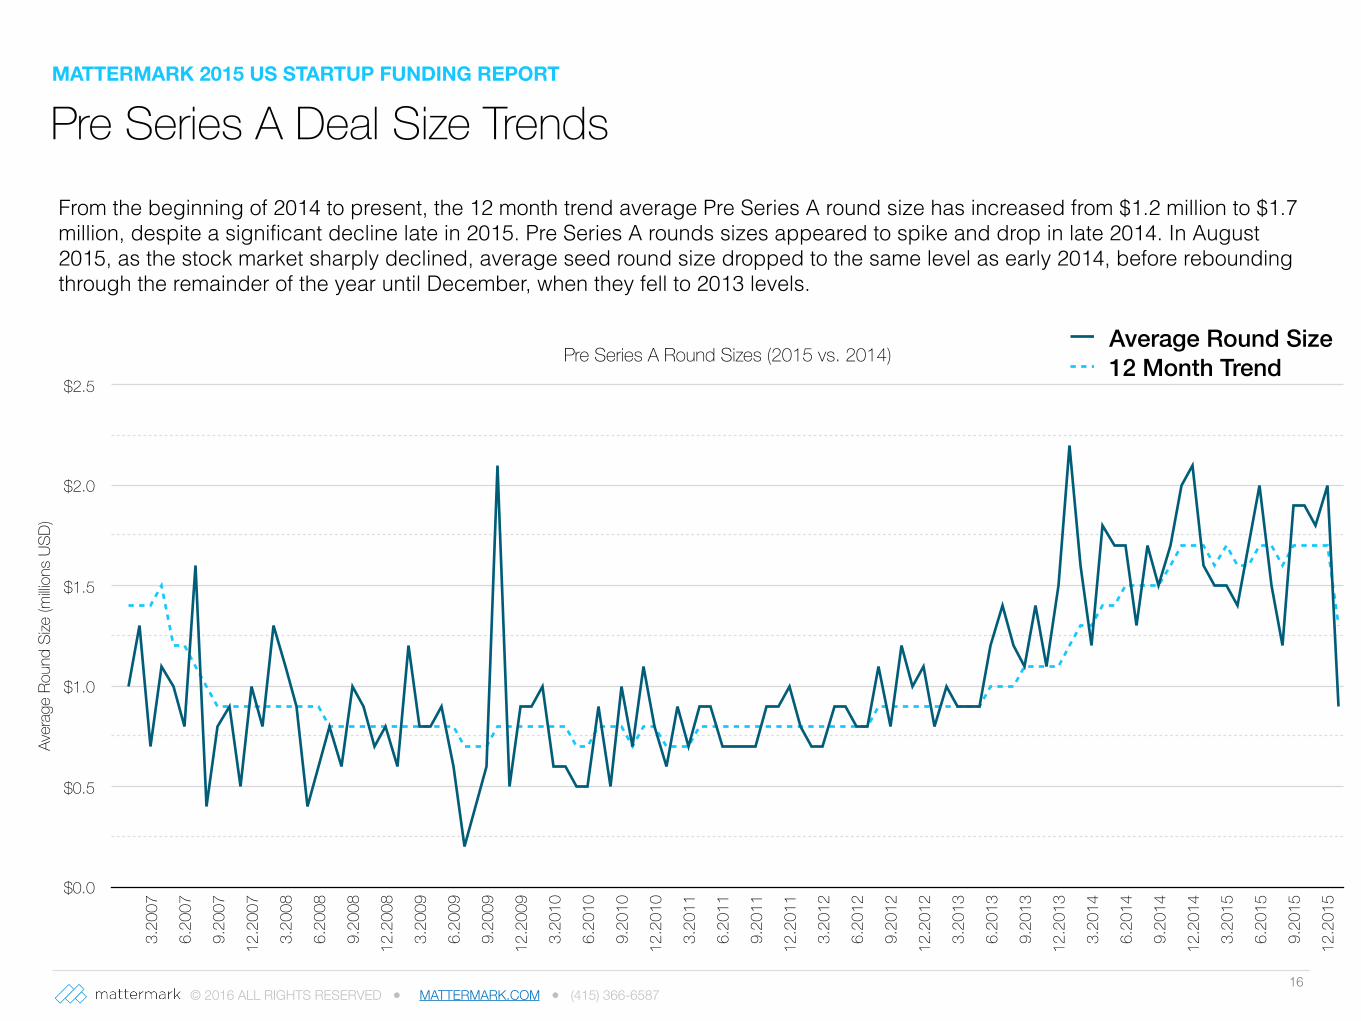
From the beginning of 2014 to present, the 12 month trend average Pre Series A round size has increased from $1.2 million to $1.7 million, despite a significant decline late in 2015. Pre Series A rounds sizes appeared to spike and drop in late 2014. In August 2015, as the stock market sharply declined, average seed round size dropped to the same level as early 2014, before rebounding through the remainder of the year until December, when they fell to 2013 levels.
Pre Series A Round Sizes (2015 vs. 2014)
Aver
age
Roun
d Si
ze (m
illions
USD
)
$0.0
$0.5
$1.0
$1.5
$2.0
$2.5
3.20
07
6.20
07
9.20
07
12.2
007
3.20
08
6.20
08
9.20
08
12.2
008
3.20
09
6.20
09
9.20
09
12.2
009
3.20
10
6.20
10
9.20
10
12.2
010
3.20
11
6.20
11
9.20
11
12.2
011
3.20
12
6.20
12
9.20
12
12.2
012
3.20
13
6.20
13
9.20
13
12.2
013
3.20
14
6.20
14
9.20
14
12.2
014
3.20
15
6.20
15
9.20
15
12.2
015
Average Round Size12 Month Trend
Pre Series A Deal Size TrendsMATTERMARK 2015 US STARTUP FUNDING REPORT
© 2016 ALL RIGHTS RESERVED ● MATTERMARK.COM ● (415) 366-658717
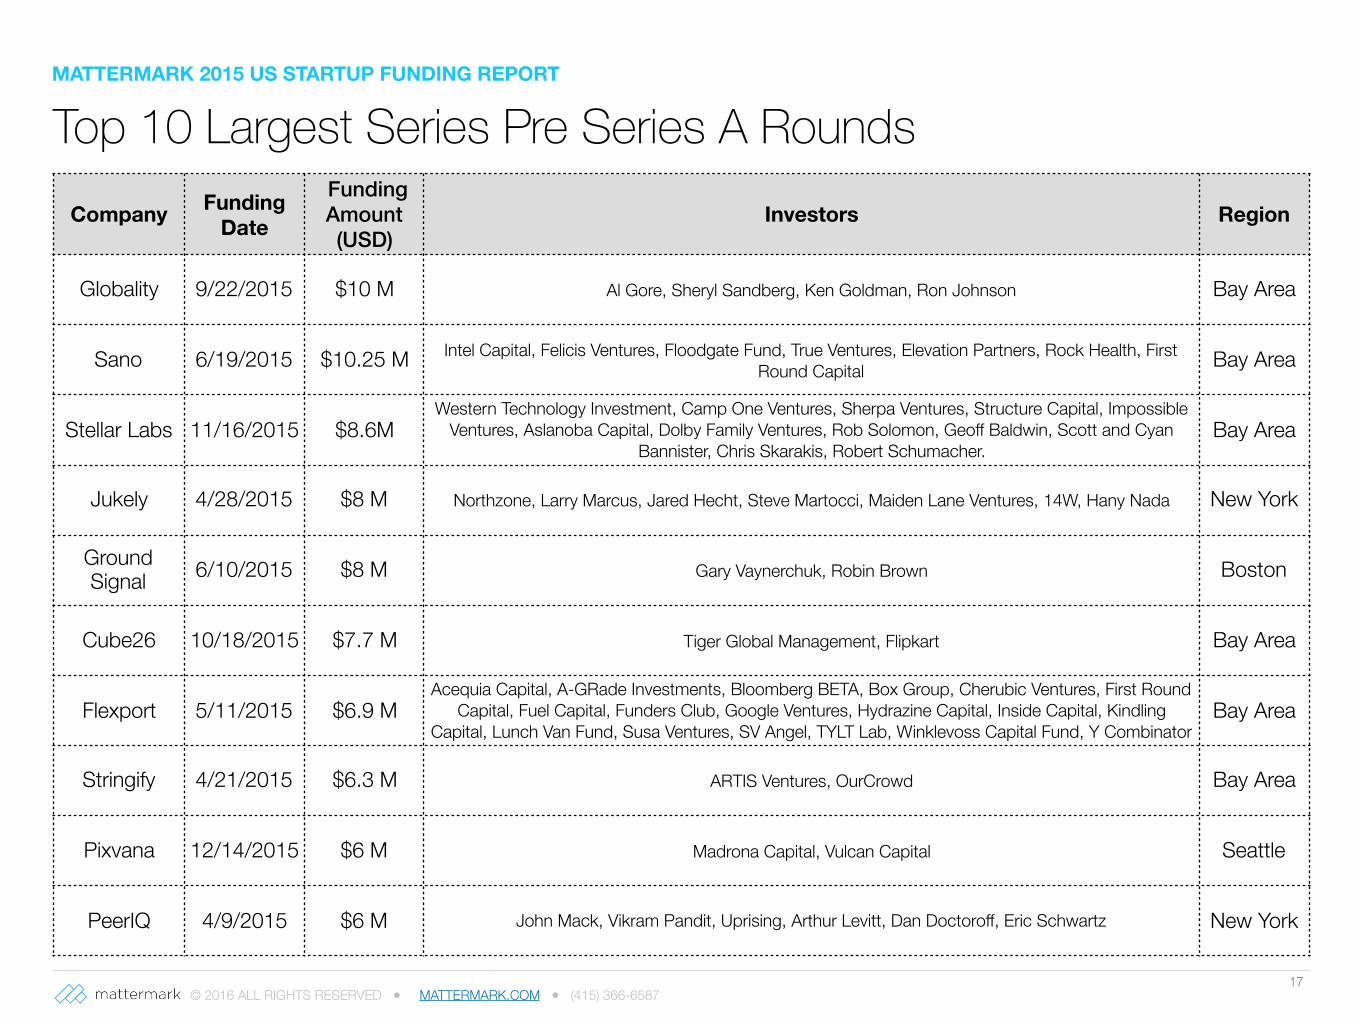
Top 10 Largest Series Pre Series A RoundsCompany Funding
Date
Funding Amount (USD)
Investors Region
Globality 9/22/2015 $10 M Al Gore, Sheryl Sandberg, Ken Goldman, Ron Johnson Bay Area
Sano 6/19/2015 $10.25 M Intel Capital, Felicis Ventures, Floodgate Fund, True Ventures, Elevation Partners, Rock Health, First Round Capital Bay Area
Stellar Labs 11/16/2015 $8.6MWestern Technology Investment, Camp One Ventures, Sherpa Ventures, Structure Capital, Impossible
Ventures, Aslanoba Capital, Dolby Family Ventures, Rob Solomon, Geoff Baldwin, Scott and Cyan Bannister, Chris Skarakis, Robert Schumacher.
Bay Area
Jukely 4/28/2015 $8 M Northzone, Larry Marcus, Jared Hecht, Steve Martocci, Maiden Lane Ventures, 14W, Hany Nada New York
Ground Signal 6/10/2015 $8 M Gary Vaynerchuk, Robin Brown Boston
Cube26 10/18/2015 $7.7 M Tiger Global Management, Flipkart Bay Area
Flexport 5/11/2015 $6.9 MAcequia Capital, A-GRade Investments, Bloomberg BETA, Box Group, Cherubic Ventures, First Round
Capital, Fuel Capital, Funders Club, Google Ventures, Hydrazine Capital, Inside Capital, Kindling Capital, Lunch Van Fund, Susa Ventures, SV Angel, TYLT Lab, Winklevoss Capital Fund, Y Combinator
Bay Area
Stringify 4/21/2015 $6.3 M ARTIS Ventures, OurCrowd Bay Area
Pixvana 12/14/2015 $6 M Madrona Capital, Vulcan Capital Seattle
PeerIQ 4/9/2015 $6 M John Mack, Vikram Pandit, Uprising, Arthur Levitt, Dan Doctoroff, Eric Schwartz New York
MATTERMARK 2015 US STARTUP FUNDING REPORT
© 2016 ALL RIGHTS RESERVED ● MATTERMARK.COM ● (415) 366-6587 19
10 Year Trends in Series A Capital DeploymentMATTERMARK 2015 US STARTUP FUNDING REPORT
Cum
ulativ
e Ca
pita
l Dep
loye
d (b
illion
s US
D)
$0
$1
$2
$3
$4
$5
$6
$7
$8
$9
$10
Jan Feb
Mar Apr May Jun Ju
lAug Sep Oct Nov Dec
2006 2007 2008 2009 2010 2011 2012 2013 2014 2015
Series A Annualized Trends 2006 to 2015
Capital Deployed: +272% Reported Deal Volume: +137% Average Round Size: +62%
12 M
onth
Avg
. Rou
nd S
ize (m
illion
s US
D)
$5
$6
$7
$9
$10
$11
$12
1.200
61.2
007
1.200
81.2
009
1.201
01.2
011
1.201
21.2
013
1.201
41.2
015
Mon
thly
Deal
Volum
e
0
30
60
90
120
1.200
61.2
007
1.200
81.2
009
1.201
01.2
011
1.201
21.2
013
1.201
41.2
015
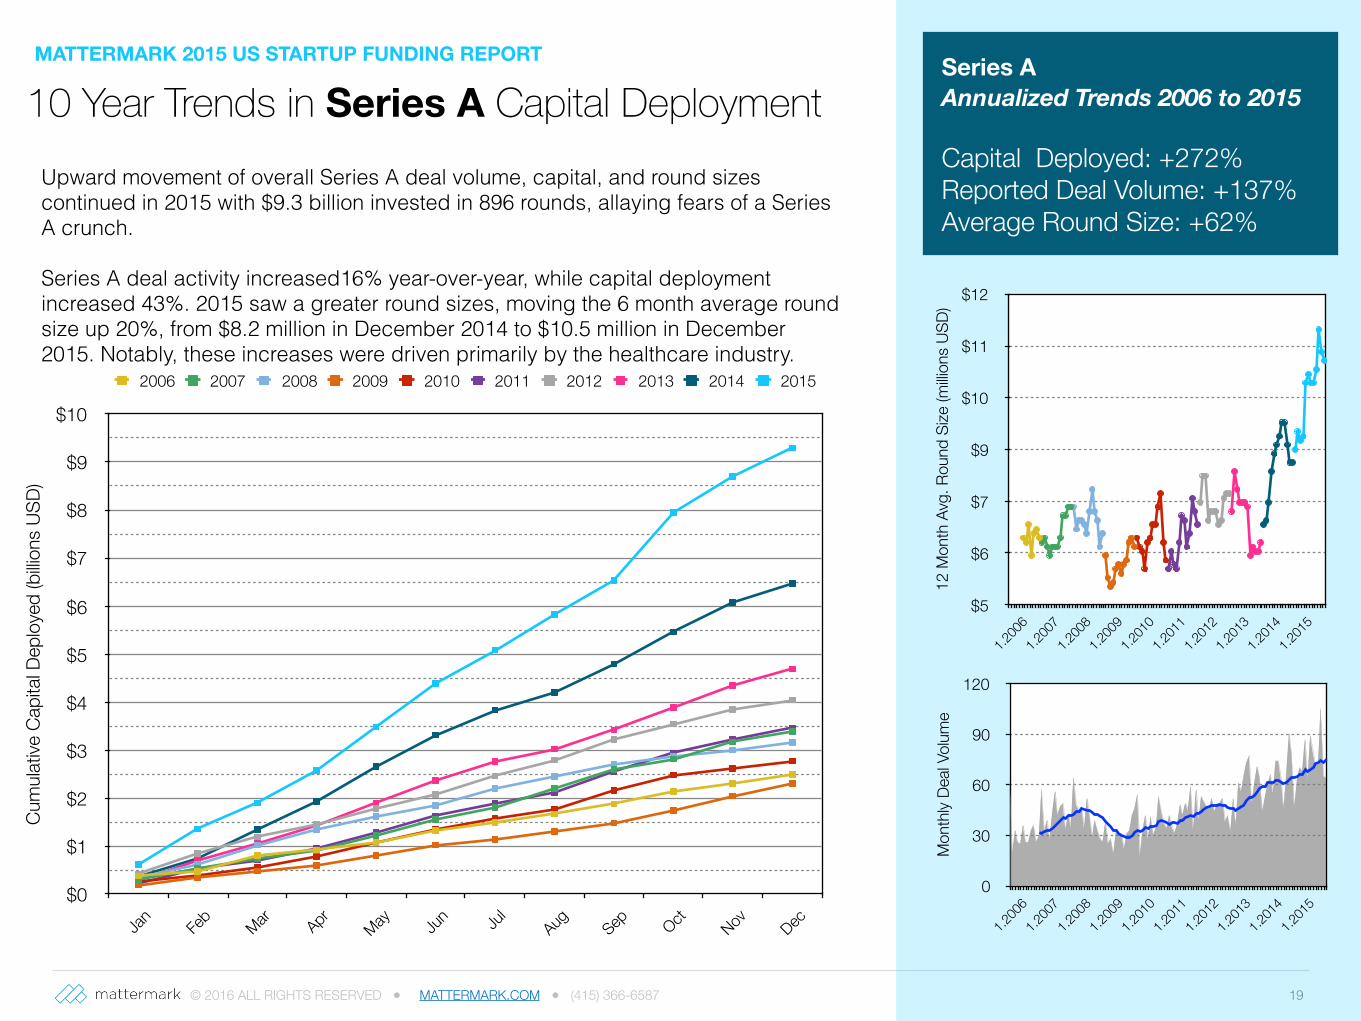
Upward movement of overall Series A deal volume, capital, and round sizes continued in 2015 with $9.3 billion invested in 896 rounds, allaying fears of a Series A crunch.
Series A deal activity increased16% year-over-year, while capital deployment increased 43%. 2015 saw a greater round sizes, moving the 6 month average round size up 20%, from $8.2 million in December 2014 to $10.5 million in December 2015. Notably, these increases were driven primarily by the healthcare industry.
© 2016 ALL RIGHTS RESERVED ● MATTERMARK.COM ● (415) 366-658720
Mon
thly
Capi
tal D
eploy
ed (b
illions
USD
)
$0.0
$0.4
$0.8
$1.2
$1.6
$2.0
Jan
Feb
Mar Apr
May Jun Jul
Aug
Sep
Oct
Nov
Dec
Cumulative Capital Deployed
Cum
ulativ
e Ca
pita
l Dep
loyed
(billio
ns U
SD)
$0
$2
$4
$6
$8
$10
Jan
Feb
Mar Apr
May Jun Jul
Aug
Sep
Oct
Nov
Dec
Mon
thly
Deal
Volum
e0
20
40
60
80
100
120
Jan
Feb
Mar Apr
May Jun Jul
Aug
Sep
Oct
Nov
Dec
2014 2015
Cum
ulativ
e De
al Vo
lume
0
200
400
600
800
1,000
Jan
Feb
Mar Apr
May Jun Jul
Aug
Sep
Oct
Nov
Dec
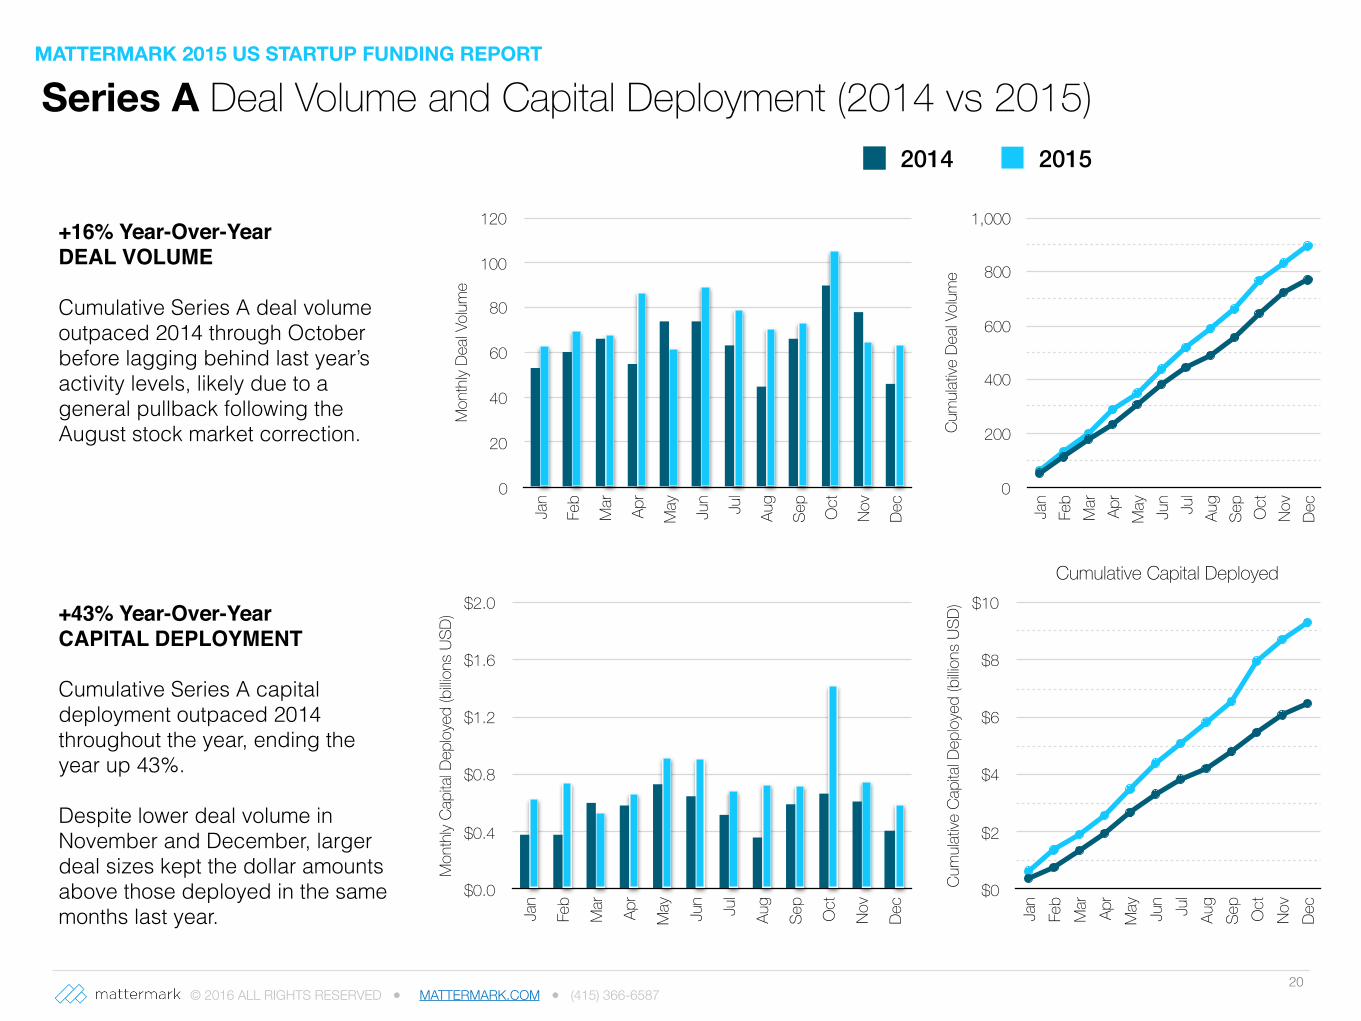
+16% Year-Over-YearDEAL VOLUME
Cumulative Series A deal volume outpaced 2014 through October before lagging behind last year’s activity levels, likely due to a general pullback following the August stock market correction.
+43% Year-Over-YearCAPITAL DEPLOYMENT
Cumulative Series A capital deployment outpaced 2014 throughout the year, ending the year up 43%.
Despite lower deal volume in November and December, larger deal sizes kept the dollar amounts above those deployed in the same months last year.
MATTERMARK 2015 US STARTUP FUNDING REPORT
Series A Deal Volume and Capital Deployment (2014 vs 2015)
© 2016 ALL RIGHTS RESERVED ● MATTERMARK.COM ● (415) 366-658721
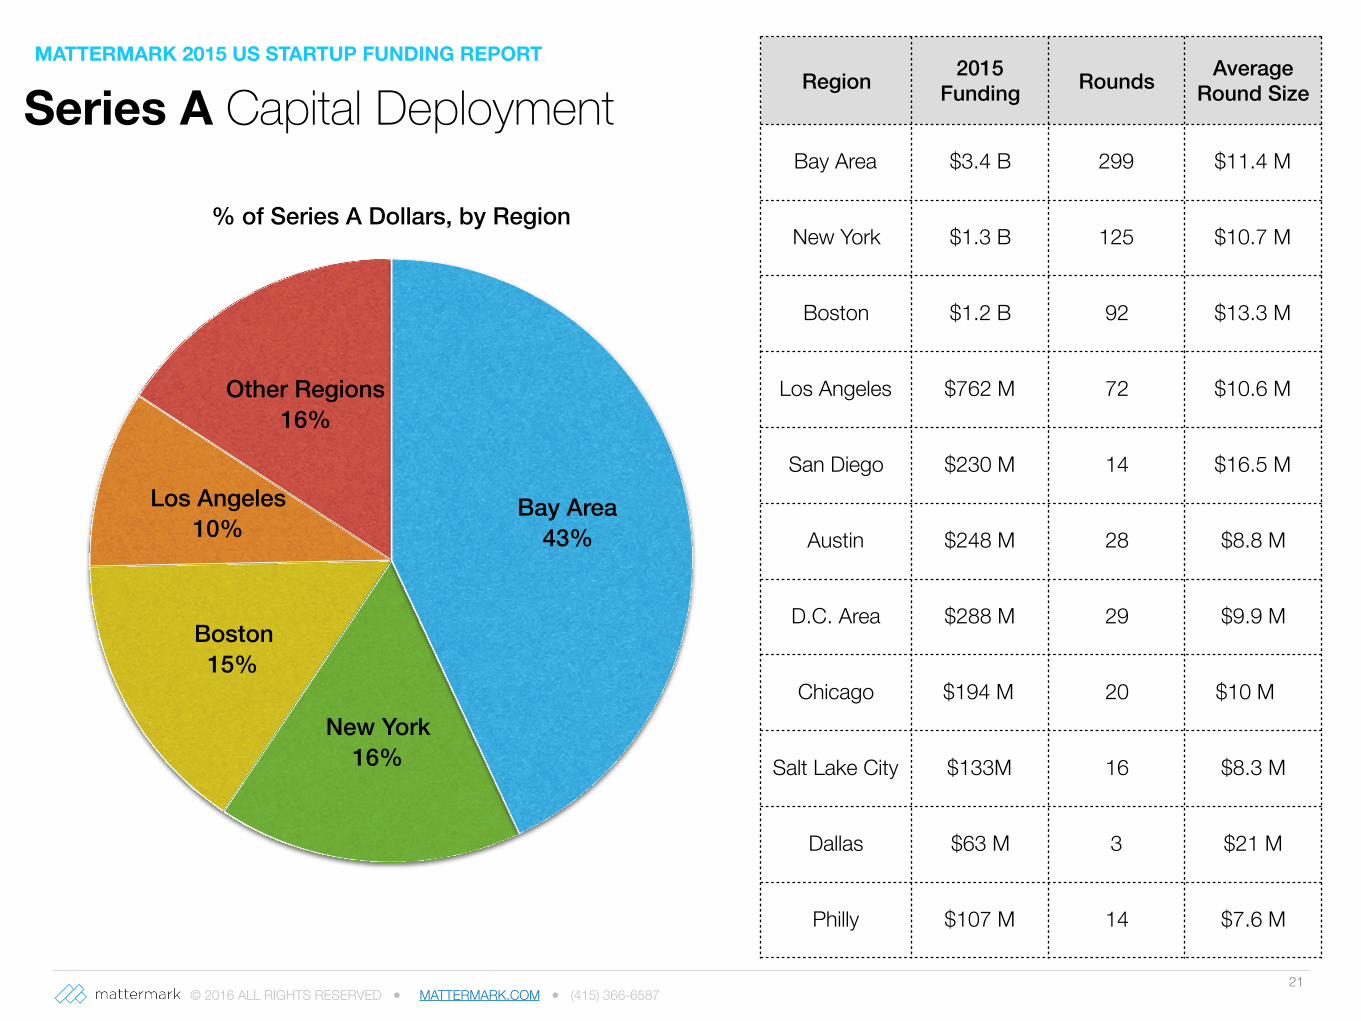
% of Series A Dollars, by Region
Other Regions 16%
Los Angeles 10%
Boston 15%
New York 16%
Bay Area 43%
Series A Capital DeploymentMATTERMARK 2015 US STARTUP FUNDING REPORT
Region 2015 Funding Rounds Average
Round Size
Bay Area $3.4 B 299 $11.4 M
New York $1.3 B 125 $10.7 M
Boston $1.2 B 92 $13.3 M
Los Angeles $762 M 72 $10.6 M
San Diego $230 M 14 $16.5 M
Austin $248 M 28 $8.8 M
D.C. Area $288 M 29 $9.9 M
Chicago $194 M 20 $10 M
Salt Lake City $133M 16 $8.3 M
Dallas $63 M 3 $21 M
Philly $107 M 14 $7.6 M
© 2016 ALL RIGHTS RESERVED ● MATTERMARK.COM ● (415) 366-658722
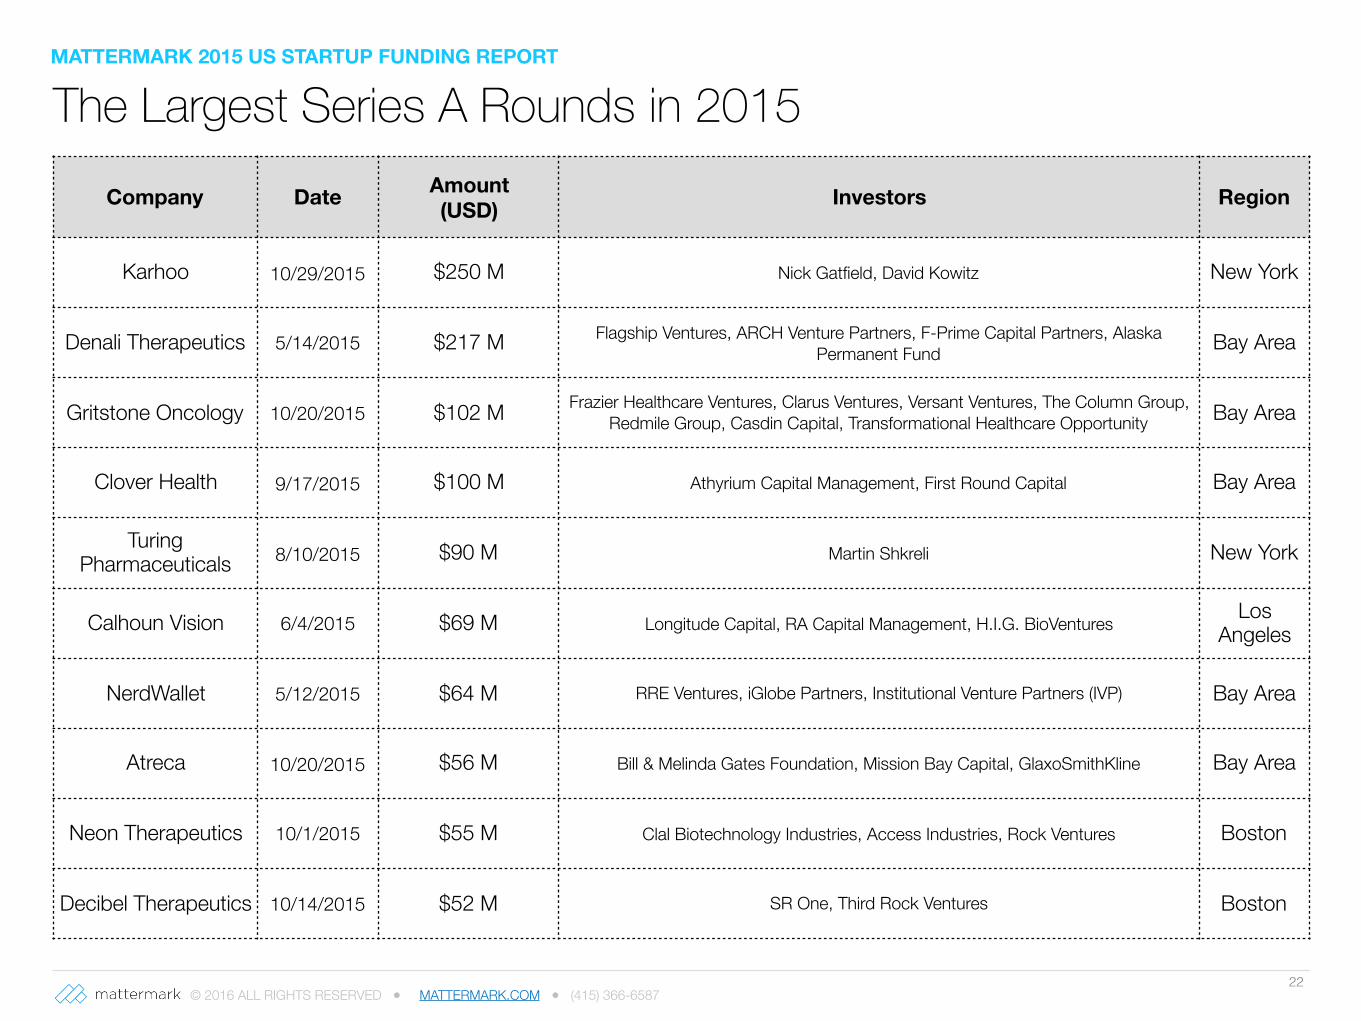
The Largest Series A Rounds in 2015Company Date Amount
(USD) Investors Region
Karhoo 10/29/2015 $250 M Nick Gatfield, David Kowitz New York
Denali Therapeutics 5/14/2015 $217 M Flagship Ventures, ARCH Venture Partners, F-Prime Capital Partners, Alaska Permanent Fund Bay Area
Gritstone Oncology 10/20/2015 $102 M Frazier Healthcare Ventures, Clarus Ventures, Versant Ventures, The Column Group, Redmile Group, Casdin Capital, Transformational Healthcare Opportunity Bay Area
Clover Health 9/17/2015 $100 M Athyrium Capital Management, First Round Capital Bay Area
Turing Pharmaceuticals 8/10/2015 $90 M Martin Shkreli New York
Calhoun Vision 6/4/2015 $69 M Longitude Capital, RA Capital Management, H.I.G. BioVentures Los Angeles
NerdWallet 5/12/2015 $64 M RRE Ventures, iGlobe Partners, Institutional Venture Partners (IVP) Bay Area
Atreca 10/20/2015 $56 M Bill & Melinda Gates Foundation, Mission Bay Capital, GlaxoSmithKline Bay Area
Neon Therapeutics 10/1/2015 $55 M Clal Biotechnology Industries, Access Industries, Rock Ventures Boston
Decibel Therapeutics 10/14/2015 $52 M SR One, Third Rock Ventures Boston
MATTERMARK 2015 US STARTUP FUNDING REPORT
© 2016 ALL RIGHTS RESERVED ● MATTERMARK.COM ● (415) 366-6587 24
10 Year Trends in Series B Capital DeploymentMATTERMARK 2015 US STARTUP FUNDING REPORT
Cum
ulativ
e Ca
pita
l Dep
loye
d (b
illion
s US
D)
$0
$2
$4
$6
$8
$10
$12
$14
Jan Feb
Mar Apr May Jun Ju
lAug Sep Oct Nov Dec
2006 2007 2008 2009 2010 2011 2012 2013 2014 2015
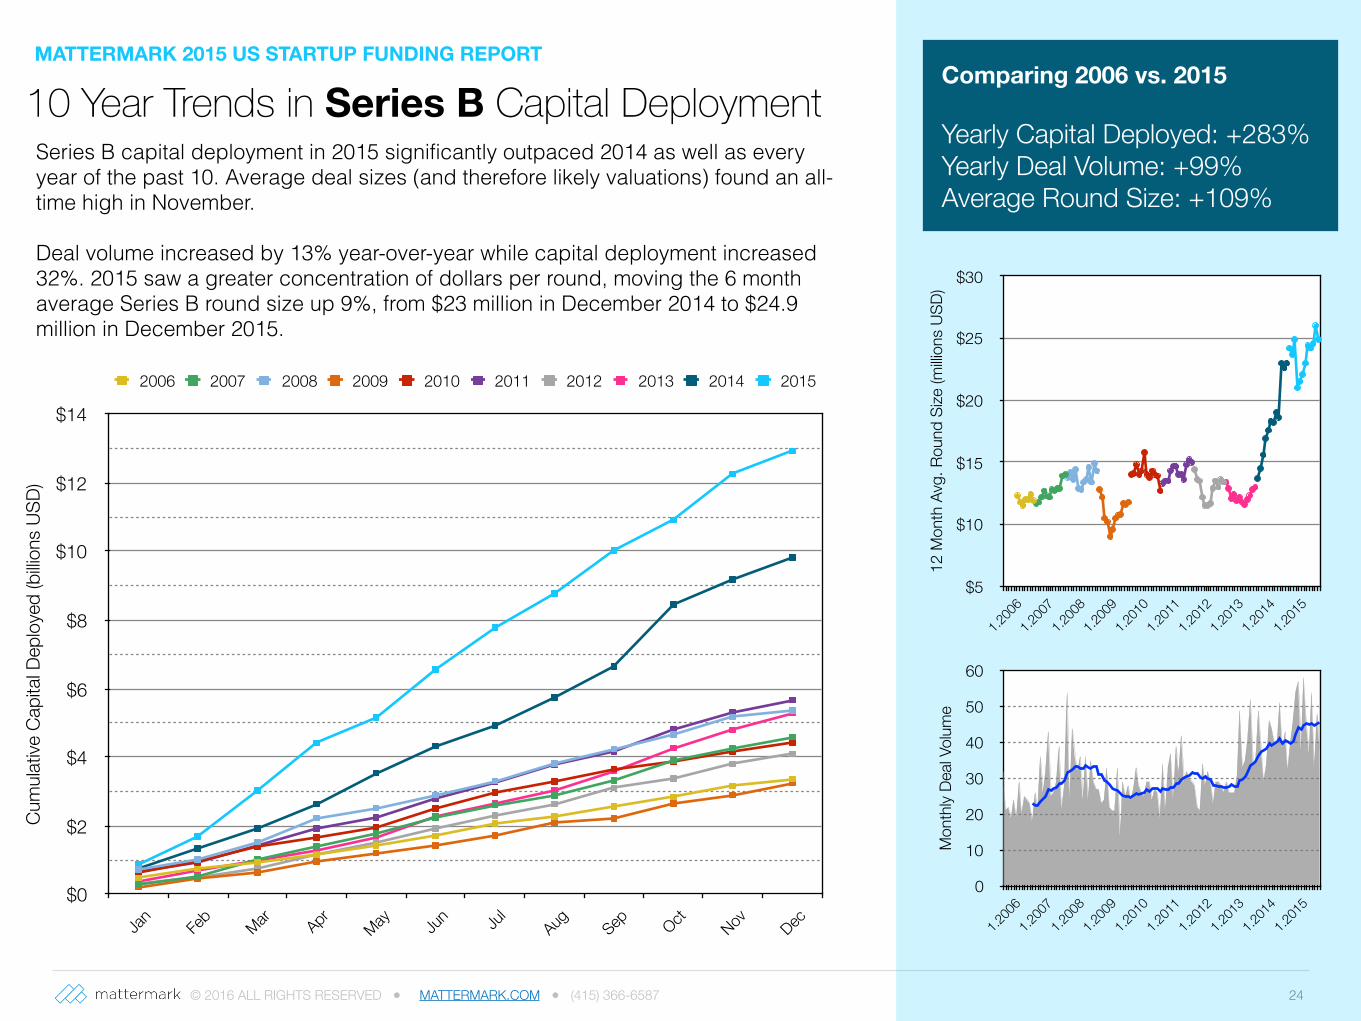
Comparing 2006 vs. 2015
Yearly Capital Deployed: +283% Yearly Deal Volume: +99% Average Round Size: +109%
12 M
onth
Avg
. Rou
nd S
ize (m
illion
s US
D)
$5
$10
$15
$20
$25
$30
1.200
61.2
007
1.200
81.2
009
1.201
01.2
011
1.201
21.2
013
1.201
41.2
015
Mon
thly
Deal
Volum
e
0
10
20
30
40
50
60
1.200
61.2
007
1.200
81.2
009
1.201
01.2
011
1.201
21.2
013
1.201
41.2
015
Series B capital deployment in 2015 significantly outpaced 2014 as well as every year of the past 10. Average deal sizes (and therefore likely valuations) found an all-time high in November.
Deal volume increased by 13% year-over-year while capital deployment increased 32%. 2015 saw a greater concentration of dollars per round, moving the 6 month average Series B round size up 9%, from $23 million in December 2014 to $24.9 million in December 2015.
© 2016 ALL RIGHTS RESERVED ● MATTERMARK.COM ● (415) 366-6587
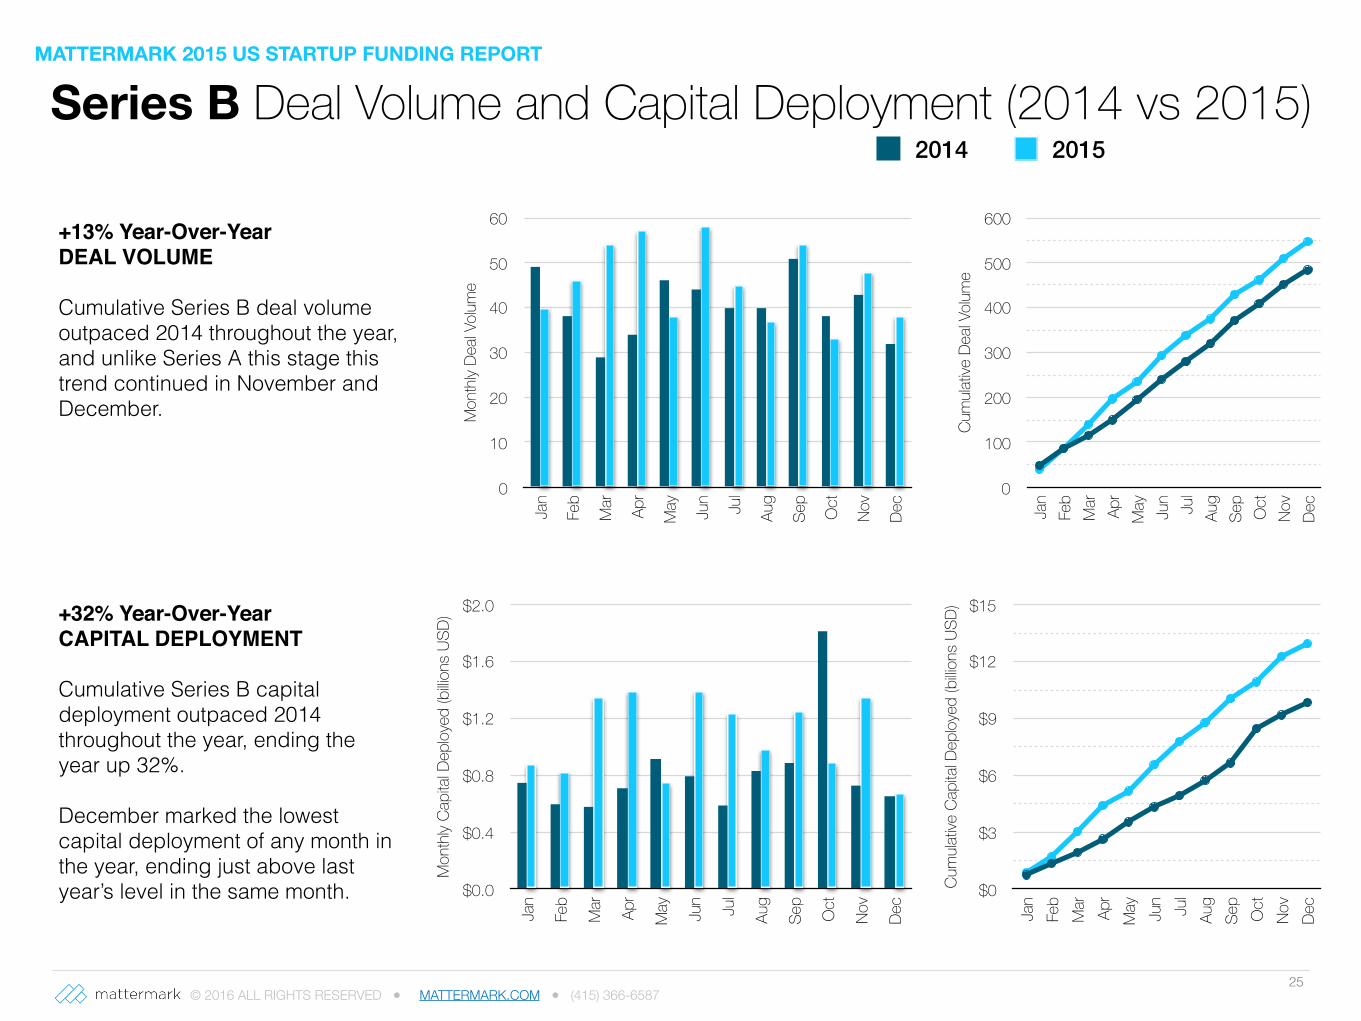
Series B Deal Volume and Capital Deployment (2014 vs 2015)
25
Mon
thly
Capi
tal D
eploy
ed (b
illions
USD
)
$0.0
$0.4
$0.8
$1.2
$1.6
$2.0
Jan
Feb
Mar Apr
May Jun Jul
Aug
Sep
Oct
Nov
Dec
Cum
ulativ
e Ca
pita
l Dep
loyed
(billio
ns U
SD)
$0
$3
$6
$9
$12
$15
Jan
Feb
Mar Apr
May Jun Jul
Aug
Sep
Oct
Nov
Dec
Mon
thly
Deal
Volum
e0
10
20
30
40
50
60
Jan
Feb
Mar Apr
May Jun Jul
Aug
Sep
Oct
Nov
Dec
2014 2015
Cum
ulativ
e De
al Vo
lume
0
100
200
300
400
500
600
Jan
Feb
Mar Apr
May Jun Jul
Aug
Sep
Oct
Nov
Dec
+13% Year-Over-YearDEAL VOLUME
Cumulative Series B deal volume outpaced 2014 throughout the year, and unlike Series A this stage this trend continued in November and December.
+32% Year-Over-YearCAPITAL DEPLOYMENT
Cumulative Series B capital deployment outpaced 2014 throughout the year, ending the year up 32%.
December marked the lowest capital deployment of any month in the year, ending just above last year’s level in the same month.
MATTERMARK 2015 US STARTUP FUNDING REPORT
© 2016 ALL RIGHTS RESERVED ● MATTERMARK.COM ● (415) 366-658726
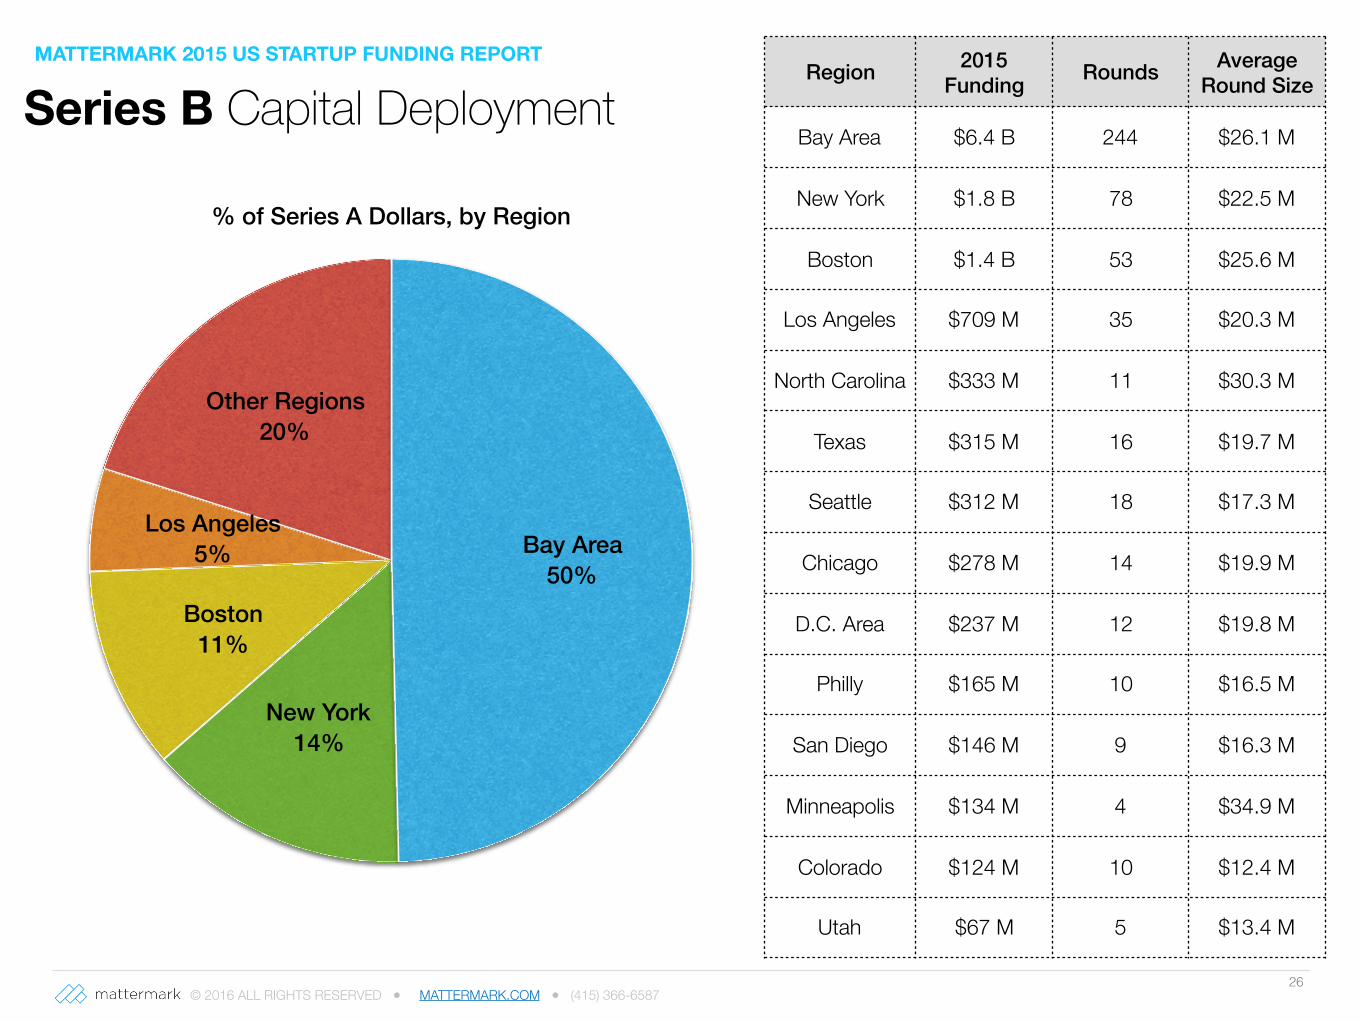
% of Series A Dollars, by Region
Other Regions 20%
Los Angeles 5%
Boston 11%
New York 14%
Bay Area 50%
Series B Capital DeploymentMATTERMARK 2015 US STARTUP FUNDING REPORT
Region 2015 Funding Rounds Average
Round Size
Bay Area $6.4 B 244 $26.1 M
New York $1.8 B 78 $22.5 M
Boston $1.4 B 53 $25.6 M
Los Angeles $709 M 35 $20.3 M
North Carolina $333 M 11 $30.3 M
Texas $315 M 16 $19.7 M
Seattle $312 M 18 $17.3 M
Chicago $278 M 14 $19.9 M
D.C. Area $237 M 12 $19.8 M
Philly $165 M 10 $16.5 M
San Diego $146 M 9 $16.3 M
Minneapolis $134 M 4 $34.9 M
Colorado $124 M 10 $12.4 M
Utah $67 M 5 $13.4 M
© 2016 ALL RIGHTS RESERVED ● MATTERMARK.COM ● (415) 366-658727
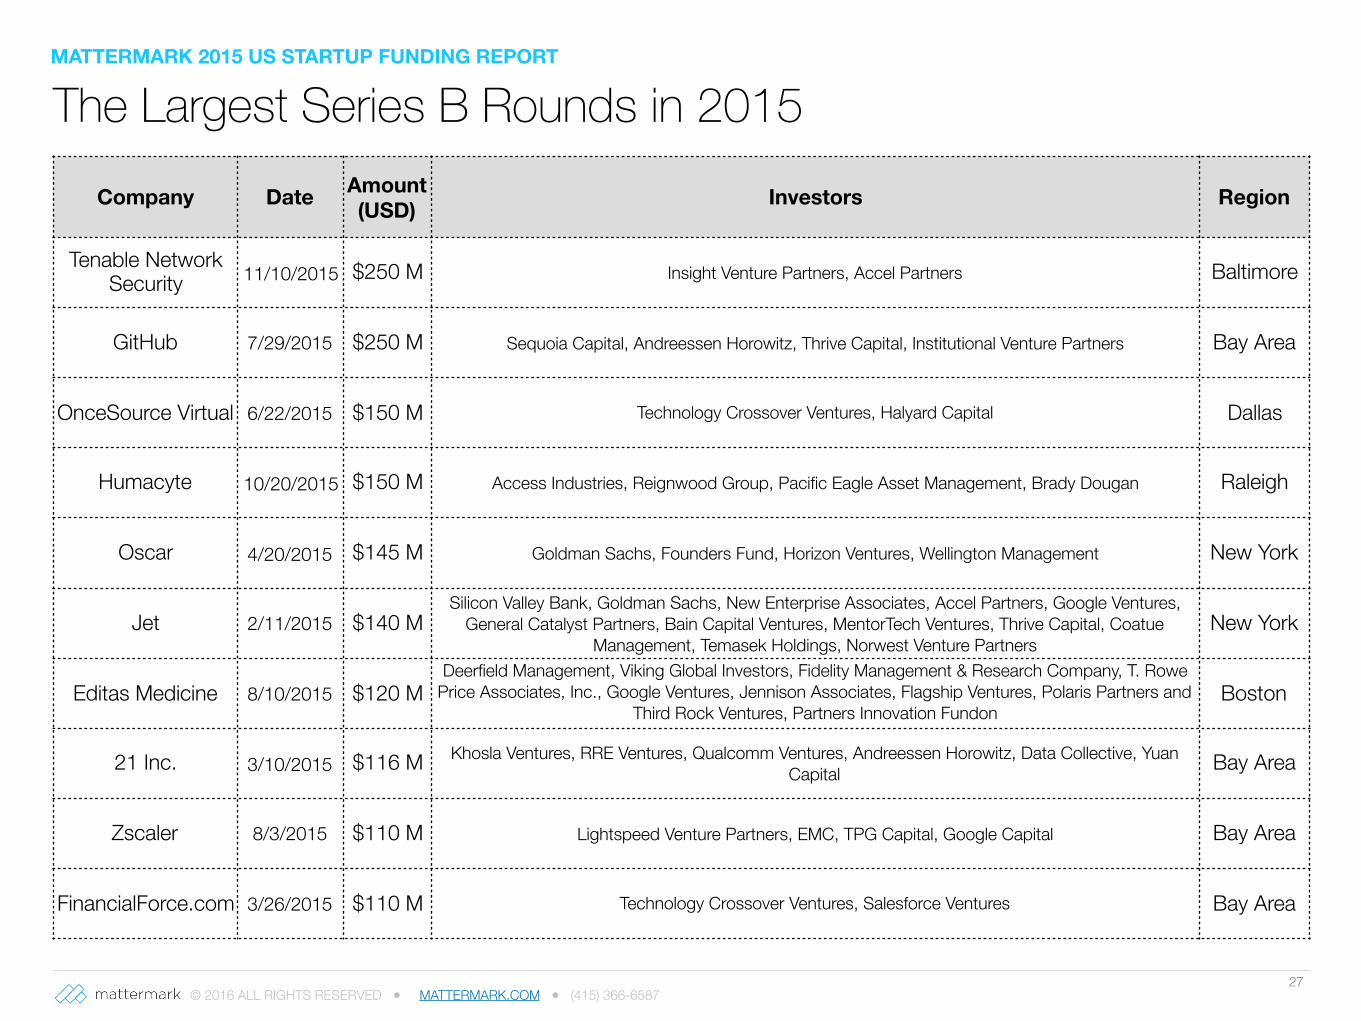
The Largest Series B Rounds in 2015Company Date Amount
(USD) Investors Region
Tenable Network Security 11/10/2015 $250 M Insight Venture Partners, Accel Partners Baltimore
GitHub 7/29/2015 $250 M Sequoia Capital, Andreessen Horowitz, Thrive Capital, Institutional Venture Partners Bay Area
OnceSource Virtual 6/22/2015 $150 M Technology Crossover Ventures, Halyard Capital Dallas
Humacyte 10/20/2015 $150 M Access Industries, Reignwood Group, Pacific Eagle Asset Management, Brady Dougan Raleigh
Oscar 4/20/2015 $145 M Goldman Sachs, Founders Fund, Horizon Ventures, Wellington Management New York
Jet 2/11/2015 $140 MSilicon Valley Bank, Goldman Sachs, New Enterprise Associates, Accel Partners, Google Ventures,
General Catalyst Partners, Bain Capital Ventures, MentorTech Ventures, Thrive Capital, Coatue Management, Temasek Holdings, Norwest Venture Partners
New York
Editas Medicine 8/10/2015 $120 MDeerfield Management, Viking Global Investors, Fidelity Management & Research Company, T. Rowe
Price Associates, Inc., Google Ventures, Jennison Associates, Flagship Ventures, Polaris Partners and Third Rock Ventures, Partners Innovation Fundon
behalf of certain clients, Khosla Ventures, EcoR1 Capital, Casdin Capital, Omega Funds,
Boston
21 Inc. 3/10/2015 $116 M Khosla Ventures, RRE Ventures, Qualcomm Ventures, Andreessen Horowitz, Data Collective, Yuan Capital Bay Area
Zscaler 8/3/2015 $110 M Lightspeed Venture Partners, EMC, TPG Capital, Google Capital Bay Area
FinancialForce.com 3/26/2015 $110 M Technology Crossover Ventures, Salesforce Ventures Bay Area
MATTERMARK 2015 US STARTUP FUNDING REPORT
© 2016 ALL RIGHTS RESERVED ● MATTERMARK.COM ● (415) 366-6587 29
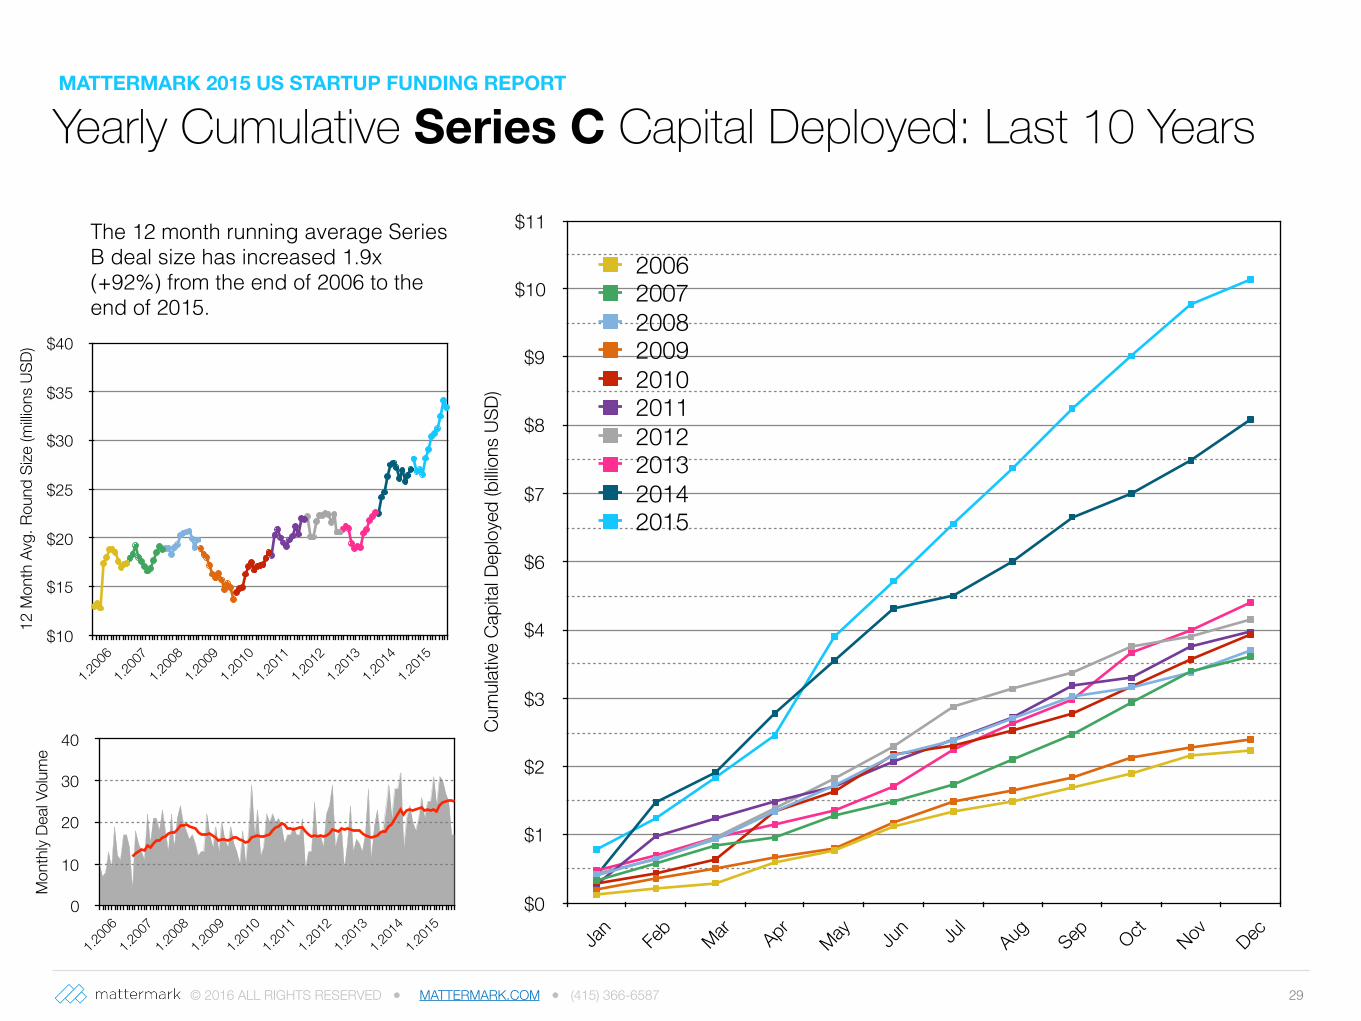
Yearly Cumulative Series C Capital Deployed: Last 10 Years
The 12 month running average Series B deal size has increased 1.9x (+92%) from the end of 2006 to the end of 2015.
Cum
ulativ
e Ca
pita
l Dep
loye
d (b
illion
s US
D)
$0
$1
$2
$3
$4
$6
$7
$8
$9
$10
$11
Jan Feb
Mar Apr May Jun Ju
lAug Sep Oct Nov Dec
2006200720082009201020112012201320142015
12 M
onth
Avg
. Rou
nd S
ize (m
illion
s US
D)
$10
$15
$20
$25
$30
$35
$40
1.200
61.2
007
1.200
81.2
009
1.201
01.2
011
1.201
21.2
013
1.201
41.2
015
Mon
thly
Deal
Volum
e
0
10
20
30
40
1.200
61.2
007
1.200
81.2
009
1.201
01.2
011
1.201
21.2
013
1.201
41.2
015
MATTERMARK 2015 US STARTUP FUNDING REPORT
© 2016 ALL RIGHTS RESERVED ● MATTERMARK.COM ● (415) 366-6587
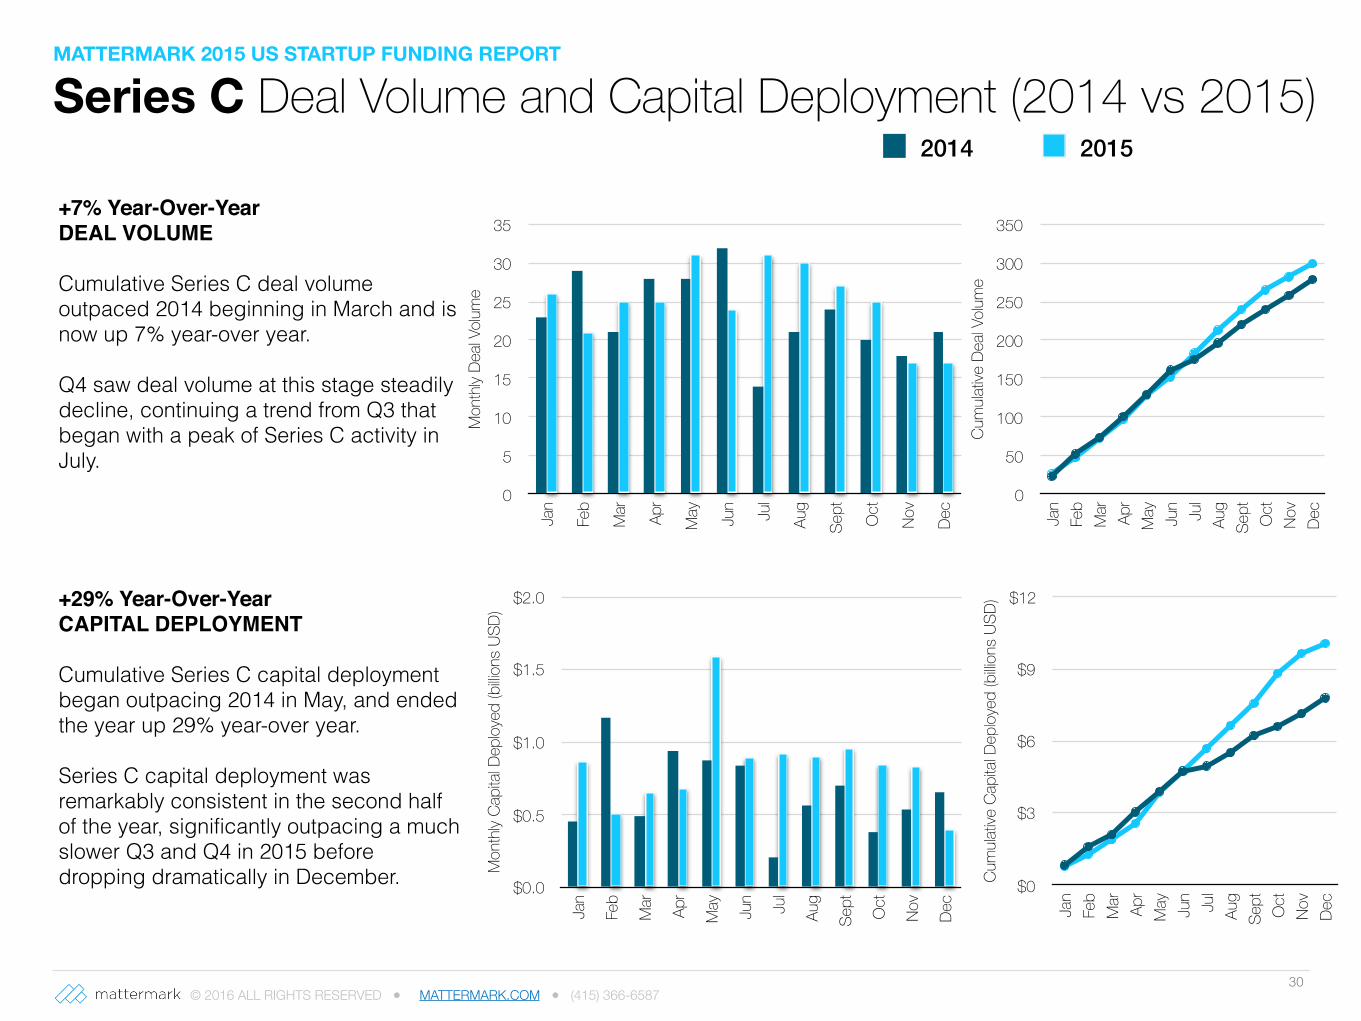
Series C Deal Volume and Capital Deployment (2014 vs 2015)
30
Mon
thly
Capi
tal D
eploy
ed (b
illions
USD
)
$0.0
$0.5
$1.0
$1.5
$2.0Ja
n
Feb
Mar Apr
May Jun Jul
Aug
Sept Oct
Nov
Dec
Cum
ulativ
e Ca
pita
l Dep
loyed
(billio
ns U
SD)
$0
$3
$6
$9
$12
Jan
Feb
Mar Apr
May Jun Jul
Aug
Sept Oct
Nov
Dec
Mon
thly
Deal
Volum
e0
5
10
15
20
25
30
35
Jan
Feb
Mar Apr
May Jun Jul
Aug
Sept Oct
Nov
Dec
2014 2015
Cum
ulativ
e De
al Vo
lume
0
50
100
150
200
250
300
350
Jan
Feb
Mar Apr
May Jun Jul
Aug
Sept Oct
Nov
Dec
+7% Year-Over-YearDEAL VOLUME
Cumulative Series C deal volume outpaced 2014 beginning in March and is now up 7% year-over year.
Q4 saw deal volume at this stage steadily decline, continuing a trend from Q3 that began with a peak of Series C activity in July.
+29% Year-Over-YearCAPITAL DEPLOYMENT
Cumulative Series C capital deployment began outpacing 2014 in May, and ended the year up 29% year-over year.
Series C capital deployment was remarkably consistent in the second half of the year, significantly outpacing a much slower Q3 and Q4 in 2015 before dropping dramatically in December.
MATTERMARK 2015 US STARTUP FUNDING REPORT
© 2016 ALL RIGHTS RESERVED ● MATTERMARK.COM ● (415) 366-658731
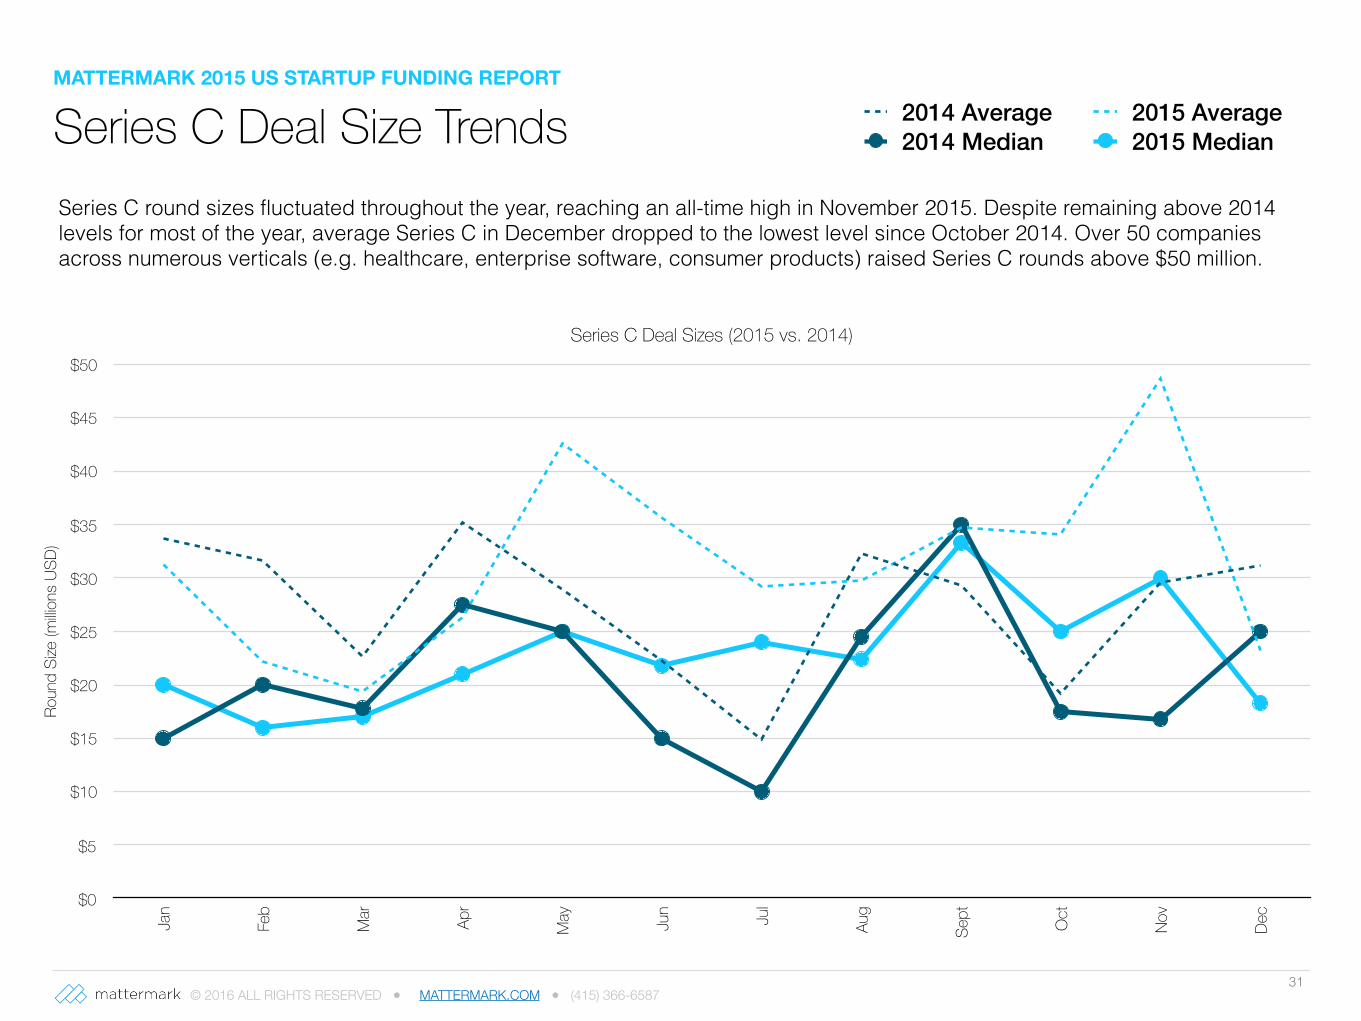
Series C round sizes fluctuated throughout the year, reaching an all-time high in November 2015. Despite remaining above 2014 levels for most of the year, average Series C in December dropped to the lowest level since October 2014. Over 50 companies across numerous verticals (e.g. healthcare, enterprise software, consumer products) raised Series C rounds above $50 million.
Series C Deal Sizes (2015 vs. 2014)
Roun
d Si
ze (m
illions
USD
)
$0
$5
$10
$15
$20
$25
$30
$35
$40
$45
$50
Jan
Feb
Mar Apr
May Jun Jul
Aug
Sept Oct
Nov
Dec
2014 Average 2015 Average2014 Median 2015 Median Series C Deal Size Trends
MATTERMARK 2015 US STARTUP FUNDING REPORT
© 2016 ALL RIGHTS RESERVED ● MATTERMARK.COM ● (415) 366-658732
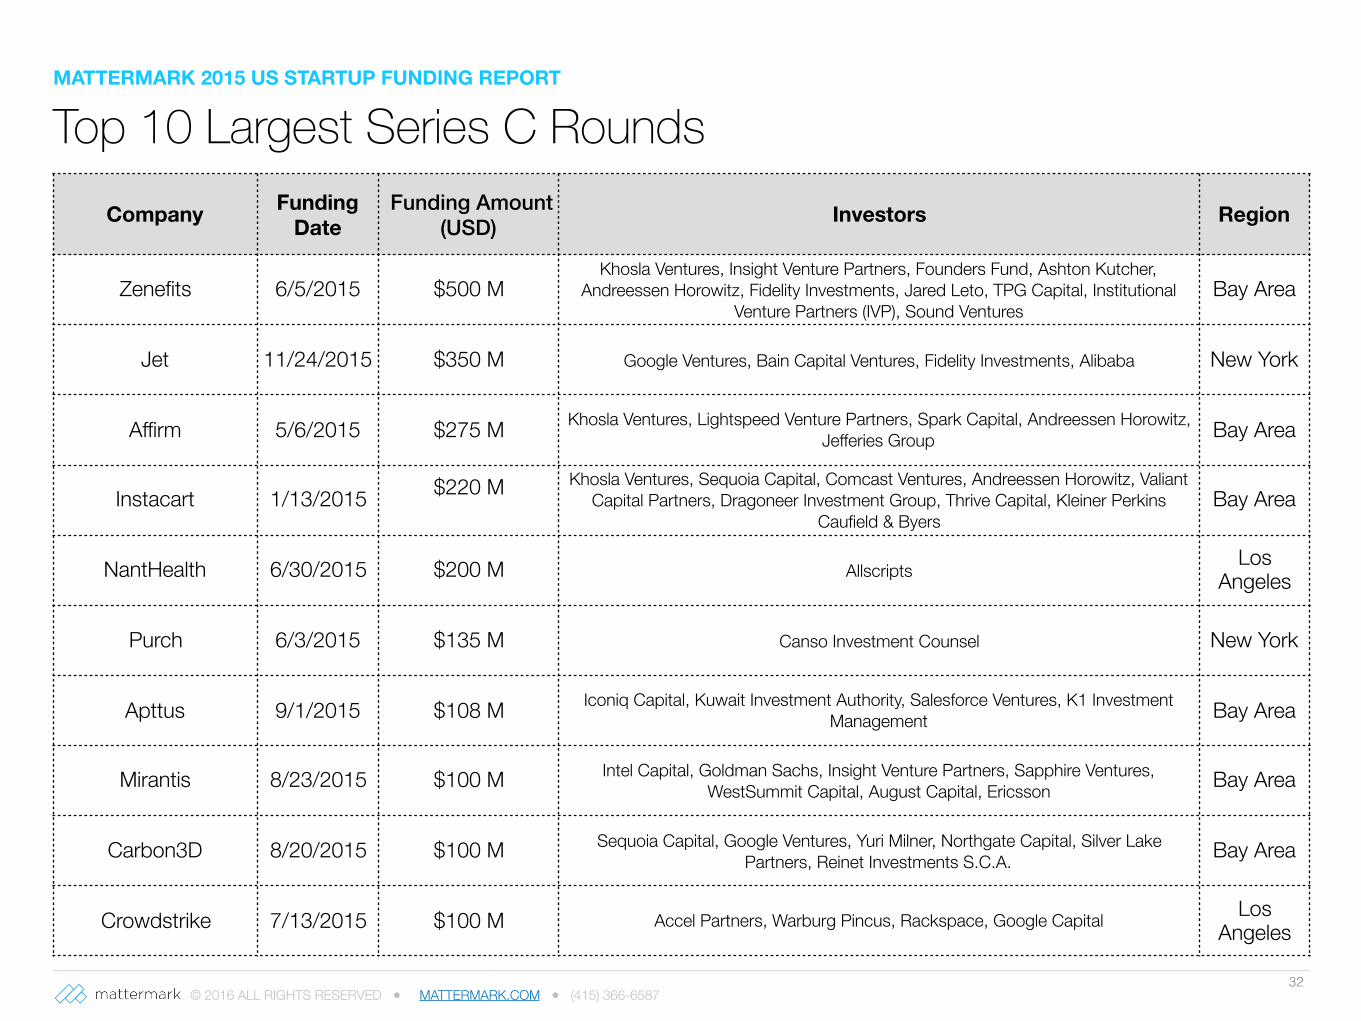
Top 10 Largest Series C RoundsCompany Funding
Date Funding Amount
(USD) Investors Region
Zenefits 6/5/2015 $500 MKhosla Ventures, Insight Venture Partners, Founders Fund, Ashton Kutcher,
Andreessen Horowitz, Fidelity Investments, Jared Leto, TPG Capital, Institutional Venture Partners (IVP), Sound Ventures
Bay Area
Jet 11/24/2015 $350 M Google Ventures, Bain Capital Ventures, Fidelity Investments, Alibaba New York
Affirm 5/6/2015 $275 M Khosla Ventures, Lightspeed Venture Partners, Spark Capital, Andreessen Horowitz, Jefferies Group Bay Area
Instacart 1/13/2015 $220 M Khosla Ventures, Sequoia Capital, Comcast Ventures, Andreessen Horowitz, Valiant Capital Partners, Dragoneer Investment Group, Thrive Capital, Kleiner Perkins
Caufield & ByersBay Area
NantHealth 6/30/2015 $200 M Allscripts Los Angeles
Purch 6/3/2015 $135 M Canso Investment Counsel New York
Apttus 9/1/2015 $108 M Iconiq Capital, Kuwait Investment Authority, Salesforce Ventures, K1 Investment Management Bay Area
Mirantis 8/23/2015 $100 M Intel Capital, Goldman Sachs, Insight Venture Partners, Sapphire Ventures, WestSummit Capital, August Capital, Ericsson Bay Area
Carbon3D 8/20/2015 $100 M Sequoia Capital, Google Ventures, Yuri Milner, Northgate Capital, Silver Lake Partners, Reinet Investments S.C.A. Bay Area
Crowdstrike 7/13/2015 $100 M Accel Partners, Warburg Pincus, Rackspace, Google Capital Los Angeles
MATTERMARK 2015 US STARTUP FUNDING REPORT
© 2016 ALL RIGHTS RESERVED ● MATTERMARK.COM ● (415) 366-6587 34
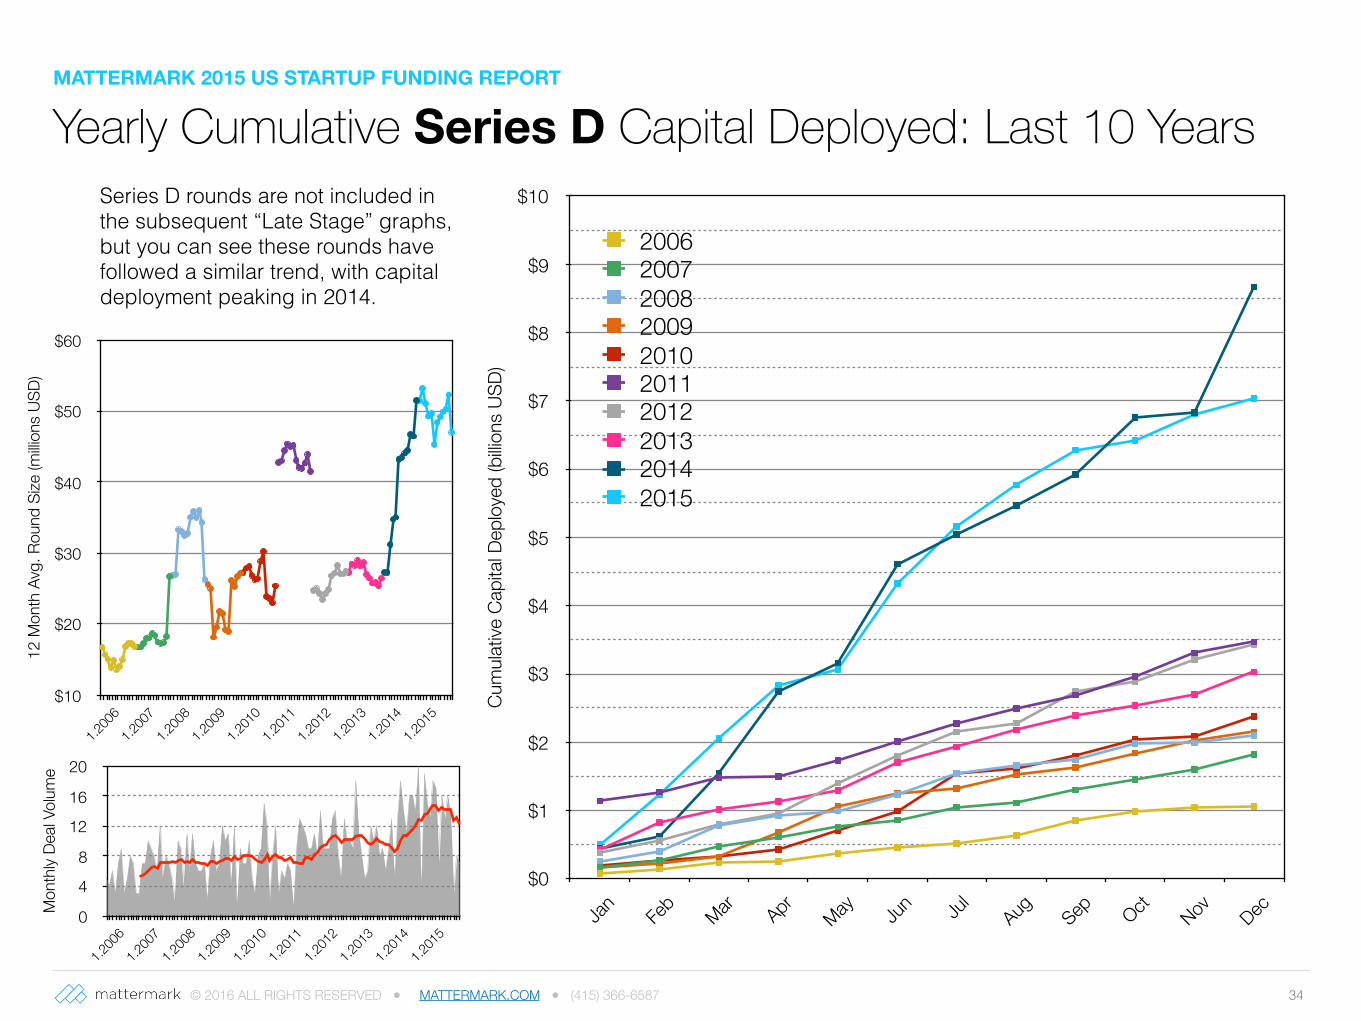
Yearly Cumulative Series D Capital Deployed: Last 10 YearsSeries D rounds are not included in the subsequent “Late Stage” graphs, but you can see these rounds have followed a similar trend, with capital deployment peaking in 2014.
Cum
ulativ
e Ca
pita
l Dep
loye
d (b
illion
s US
D)
$0
$1
$2
$3
$4
$5
$6
$7
$8
$9
$10
Jan Feb
Mar Apr May Jun Ju
lAug Sep Oct Nov Dec
2006200720082009201020112012201320142015
12 M
onth
Avg
. Rou
nd S
ize (m
illion
s US
D)
$10
$20
$30
$40
$50
$60
1.200
61.2
007
1.200
81.2
009
1.201
01.2
011
1.201
21.2
013
1.201
41.2
015
Mon
thly
Deal
Volum
e
0
4
8
12
16
20
1.200
61.2
007
1.200
81.2
009
1.201
01.2
011
1.201
21.2
013
1.201
41.2
015
MATTERMARK 2015 US STARTUP FUNDING REPORT
© 2016 ALL RIGHTS RESERVED ● MATTERMARK.COM ● (415) 366-6587 35
Yearly Cumulative Late Stage Capital Deployed: Last 10 Years
12 M
onth
Avg
. Rou
nd S
ize (m
illion
s US
D)
$10
$30
$50
$70
$90
$110
$130
$150
1.200
61.2
007
1.200
81.2
009
1.201
01.2
011
1.201
21.2
013
1.201
41.2
015
Cum
ulativ
e Ca
pita
l Dep
loye
d (b
illion
s US
D)
$0
$4
$8
$12
$16
$20
Jan Feb
Mar Apr May Jun Ju
lAug Sep Oct Nov Dec
2006200720082009201020112012201320142015
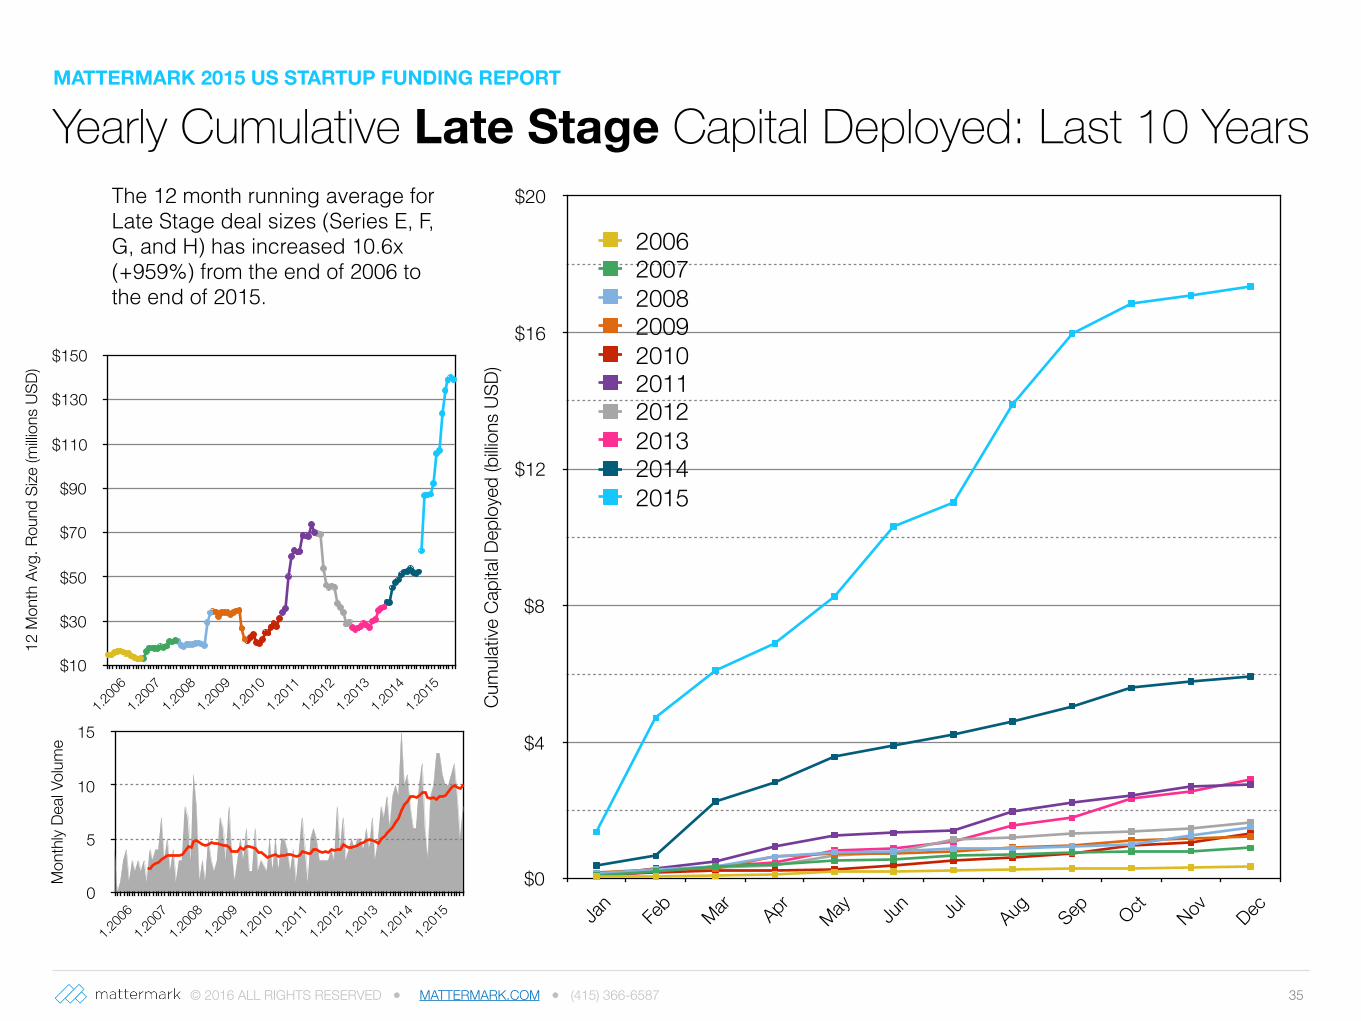
The 12 month running average for Late Stage deal sizes (Series E, F, G, and H) has increased 10.6x (+959%) from the end of 2006 to the end of 2015.
Mon
thly
Deal
Volum
e
0
5
10
15
1.200
61.2
007
1.200
81.2
009
1.201
01.2
011
1.201
21.2
013
1.201
41.2
015
MATTERMARK 2015 US STARTUP FUNDING REPORT
© 2016 ALL RIGHTS RESERVED ● MATTERMARK.COM ● (415) 366-6587
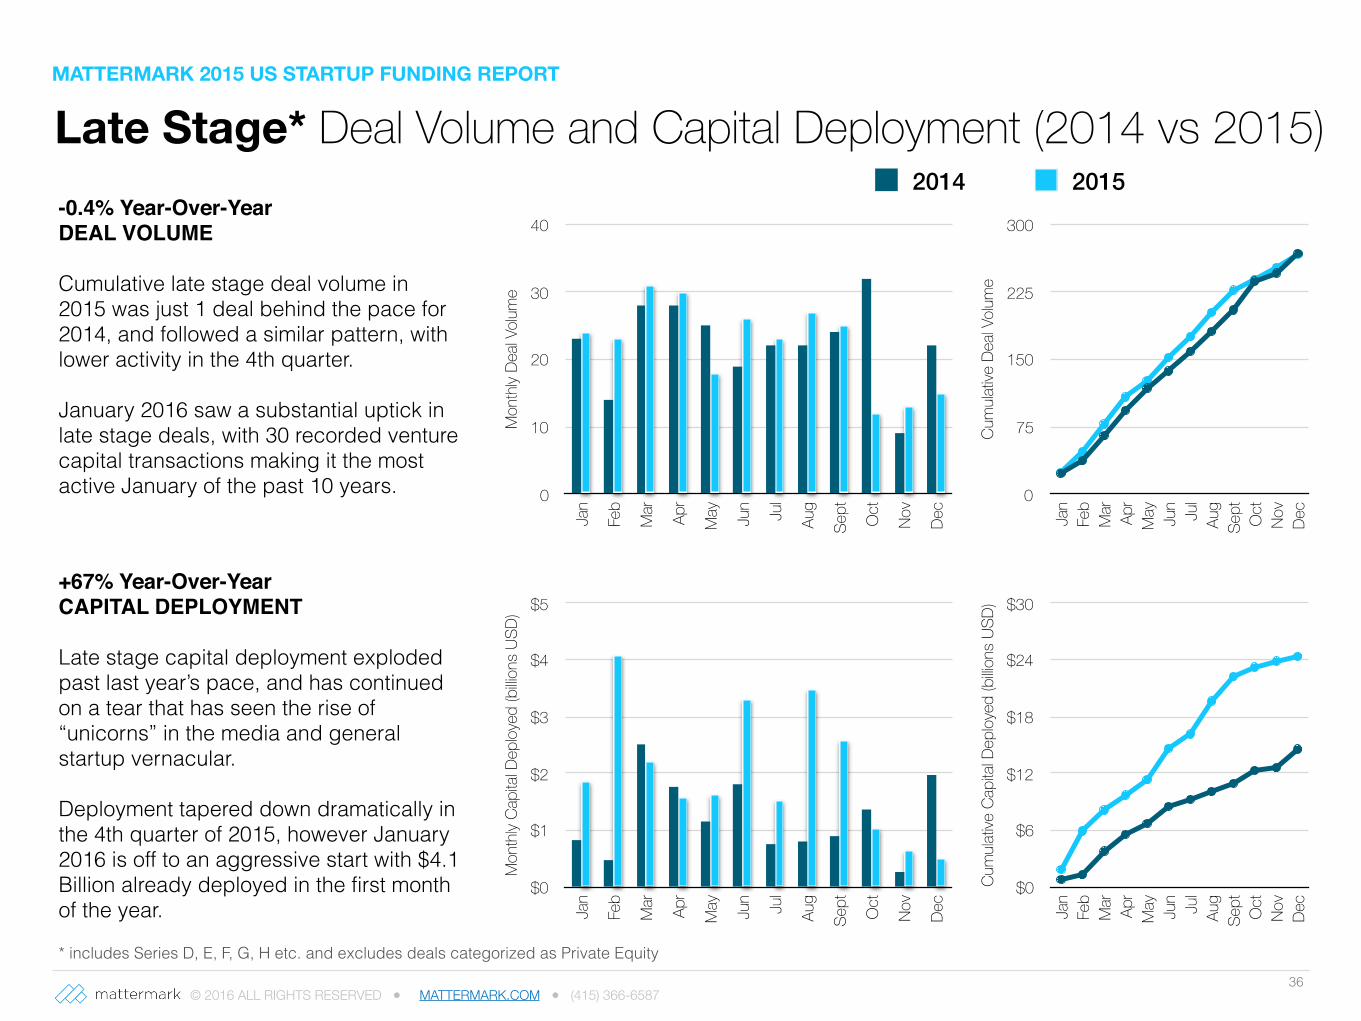
Late Stage* Deal Volume and Capital Deployment (2014 vs 2015)
36
Mon
thly
Capi
tal D
eploy
ed (b
illions
USD
)
$0
$1
$2
$3
$4
$5Ja
n
Feb
Mar Apr
May Jun Jul
Aug
Sept Oct
Nov
Dec
Cum
ulativ
e Ca
pita
l Dep
loyed
(billio
ns U
SD)
$0
$6
$12
$18
$24
$30
Jan
Feb
Mar Apr
May Jun Jul
Aug
Sept Oct
Nov
Dec
Mon
thly
Deal
Volum
e0
10
20
30
40
Jan
Feb
Mar Apr
May Jun Jul
Aug
Sept Oct
Nov
Dec
2014 2015
Cum
ulativ
e De
al Vo
lume
0
75
150
225
300
Jan
Feb
Mar Apr
May Jun Jul
Aug
Sept Oct
Nov
Dec
-0.4% Year-Over-YearDEAL VOLUME
Cumulative late stage deal volume in 2015 was just 1 deal behind the pace for 2014, and followed a similar pattern, with lower activity in the 4th quarter.
January 2016 saw a substantial uptick in late stage deals, with 30 recorded venture capital transactions making it the most active January of the past 10 years.
+67% Year-Over-YearCAPITAL DEPLOYMENT
Late stage capital deployment exploded past last year’s pace, and has continued on a tear that has seen the rise of “unicorns” in the media and general startup vernacular.
Deployment tapered down dramatically in the 4th quarter of 2015, however January 2016 is off to an aggressive start with $4.1 Billion already deployed in the first month of the year.
* includes Series D, E, F, G, H etc. and excludes deals categorized as Private Equity
MATTERMARK 2015 US STARTUP FUNDING REPORT
© 2016 ALL RIGHTS RESERVED ● MATTERMARK.COM ● (415) 366-658737
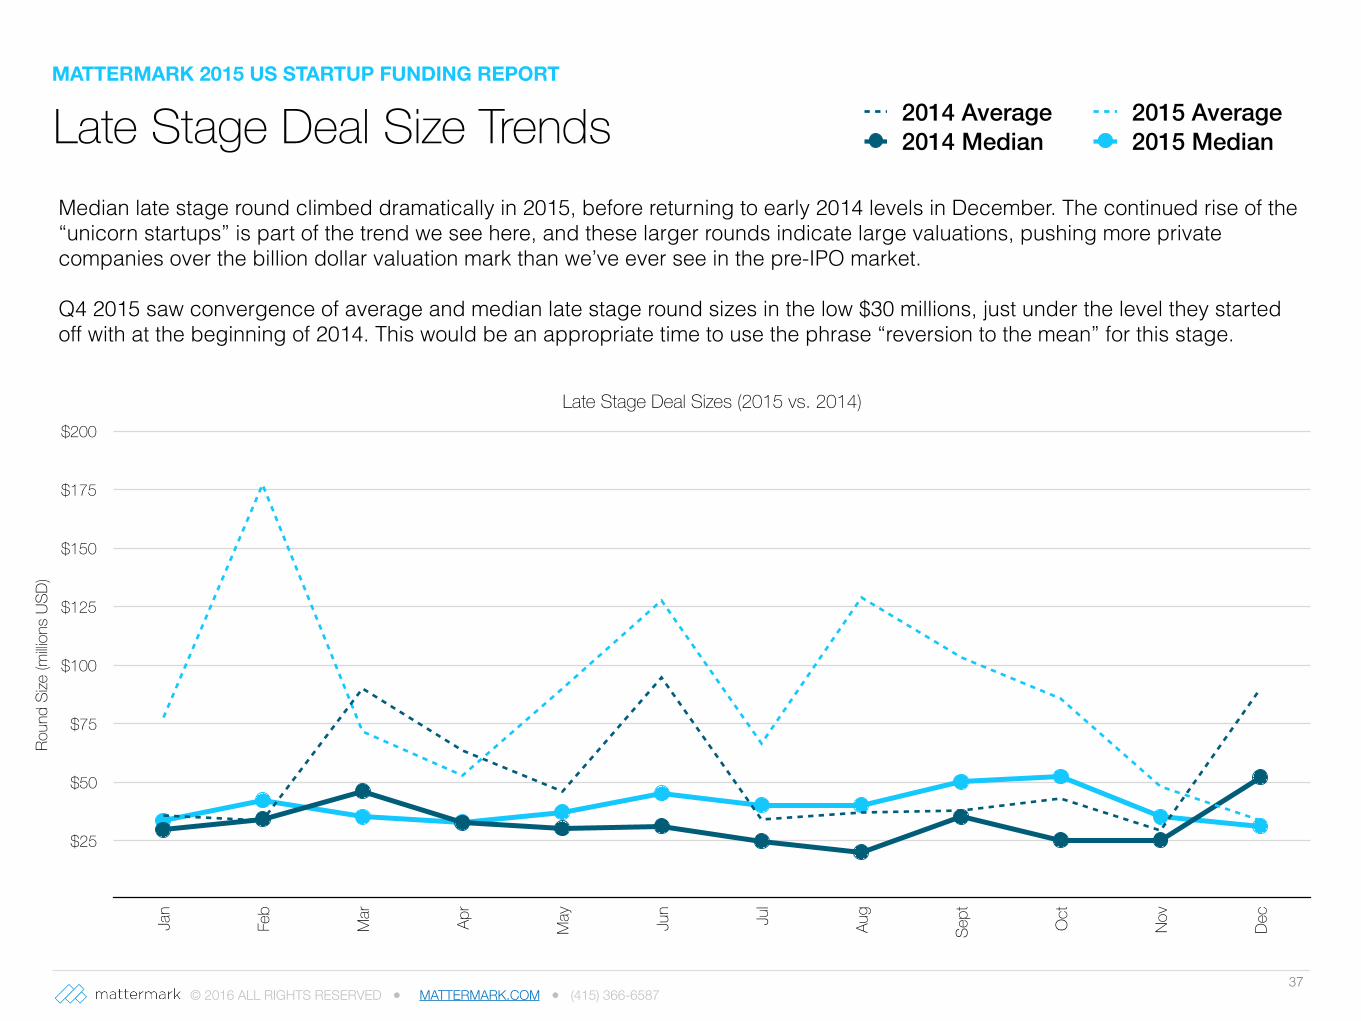
Median late stage round climbed dramatically in 2015, before returning to early 2014 levels in December. The continued rise of the “unicorn startups” is part of the trend we see here, and these larger rounds indicate large valuations, pushing more private companies over the billion dollar valuation mark than we’ve ever see in the pre-IPO market.
Q4 2015 saw convergence of average and median late stage round sizes in the low $30 millions, just under the level they started off with at the beginning of 2014. This would be an appropriate time to use the phrase “reversion to the mean” for this stage.
Late Stage Deal Sizes (2015 vs. 2014)
Roun
d Si
ze (m
illions
USD
)
$25
$50
$75
$100
$125
$150
$175
$200
Jan
Feb
Mar Apr
May Jun Jul
Aug
Sept Oct
Nov
Dec
2014 Average 2015 Average2014 Median 2015 Median Late Stage Deal Size Trends
MATTERMARK 2015 US STARTUP FUNDING REPORT
© 2016 ALL RIGHTS RESERVED ● MATTERMARK.COM ● (415) 366-658738
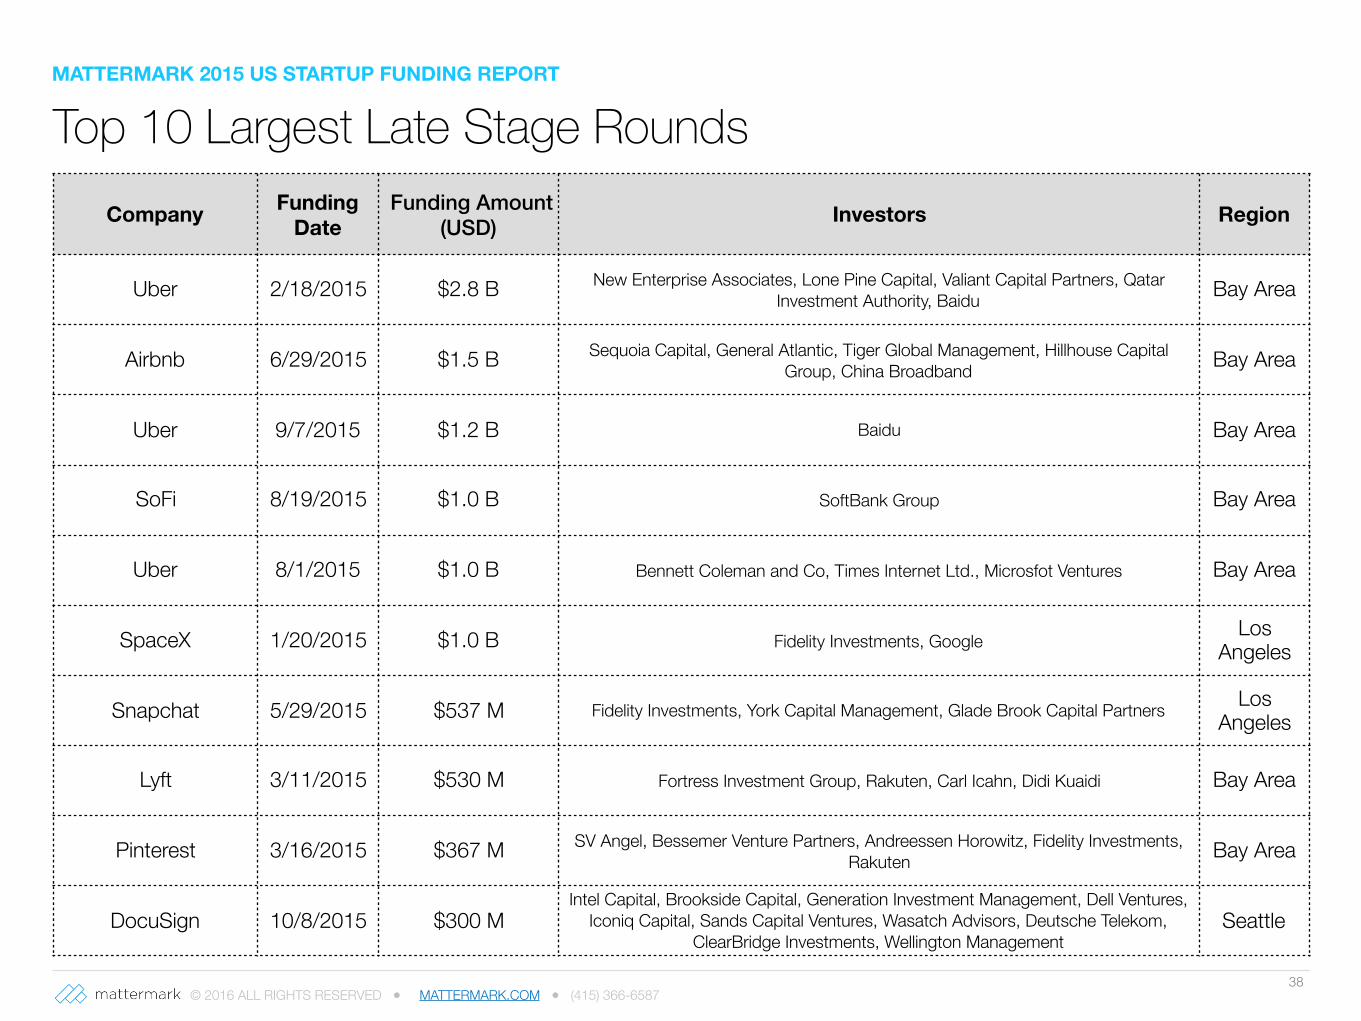
Top 10 Largest Late Stage RoundsCompany Funding
Date Funding Amount
(USD) Investors Region
Uber 2/18/2015 $2.8 B New Enterprise Associates, Lone Pine Capital, Valiant Capital Partners, Qatar Investment Authority, Baidu Bay Area
Airbnb 6/29/2015 $1.5 B Sequoia Capital, General Atlantic, Tiger Global Management, Hillhouse Capital Group, China Broadband Bay Area
Uber 9/7/2015 $1.2 B Baidu Bay Area
SoFi 8/19/2015 $1.0 B SoftBank Group Bay Area
Uber 8/1/2015 $1.0 B Bennett Coleman and Co, Times Internet Ltd., Microsfot Ventures Bay Area
SpaceX 1/20/2015 $1.0 B Fidelity Investments, Google Los Angeles
Snapchat 5/29/2015 $537 M Fidelity Investments, York Capital Management, Glade Brook Capital Partners Los Angeles
Lyft 3/11/2015 $530 M Fortress Investment Group, Rakuten, Carl Icahn, Didi Kuaidi Bay Area
Pinterest 3/16/2015 $367 M SV Angel, Bessemer Venture Partners, Andreessen Horowitz, Fidelity Investments, Rakuten Bay Area
DocuSign 10/8/2015 $300 MIntel Capital, Brookside Capital, Generation Investment Management, Dell Ventures,
Iconiq Capital, Sands Capital Ventures, Wasatch Advisors, Deutsche Telekom, ClearBridge Investments, Wellington Management
Seattle
MATTERMARK 2015 US STARTUP FUNDING REPORT
© 2016 ALL RIGHTS RESERVED ● MATTERMARK.COM ● (415) 366-658739
MethodologyTime Period
For this report we examined Q1-4 2015 Venture activity and funding trends in the year prior, as well at 5 and 10 year historical benchmarks.
Funding Rounds
For population statistics referencing “Venture-Backed” startups, inclusion for analysis was restricted to deals that disclosed the amount of funding raised.
Criteria
All analyses include USA companies. Metropolitan regions reflect Combined Statistical Areas as defined by the United States Office of Management and Budget.
Data Sources
Mattermark uses a broad range of sources to present the most complete picture possible of the startup ecosystem. In addition to extensive primary source research sourced specifically for this report, Mattermark uses publicly-available data from AngelList (www.angel.co), Crunchbase (www.crunchbase.com), NASDAQ, (www.nasdaq.com), the United States Securities and Exchange Commission (www.sec.gov), and source relationships with thousands of investors, community leaders, and startup founders.
Please send any questions, comments, or corrections for the editor to [email protected].
MATTERMARK 2015 US STARTUP FUNDING REPORT
© 2016 ALL RIGHTS RESERVED ● MATTERMARK.COM ● (415) 366-6587
Mattermark is where big data and machine learning bring science to the art of deal making. Our groundbreaking analytics are helping thousands of professionals research, prospect, track, qualify, and benchmark signals of growth and news coverage for 1M+
private and public technology companies from around the world.
Join the leading venture capital firms, angel investors, corporate and business development professionals, commercial real estate brokers, venture banks, private equity
firms, hedge funds, top tier consulting firms, and sales and marketing professionals.
Get Access to Mattermark Data