Embed Size (px)
Citation preview
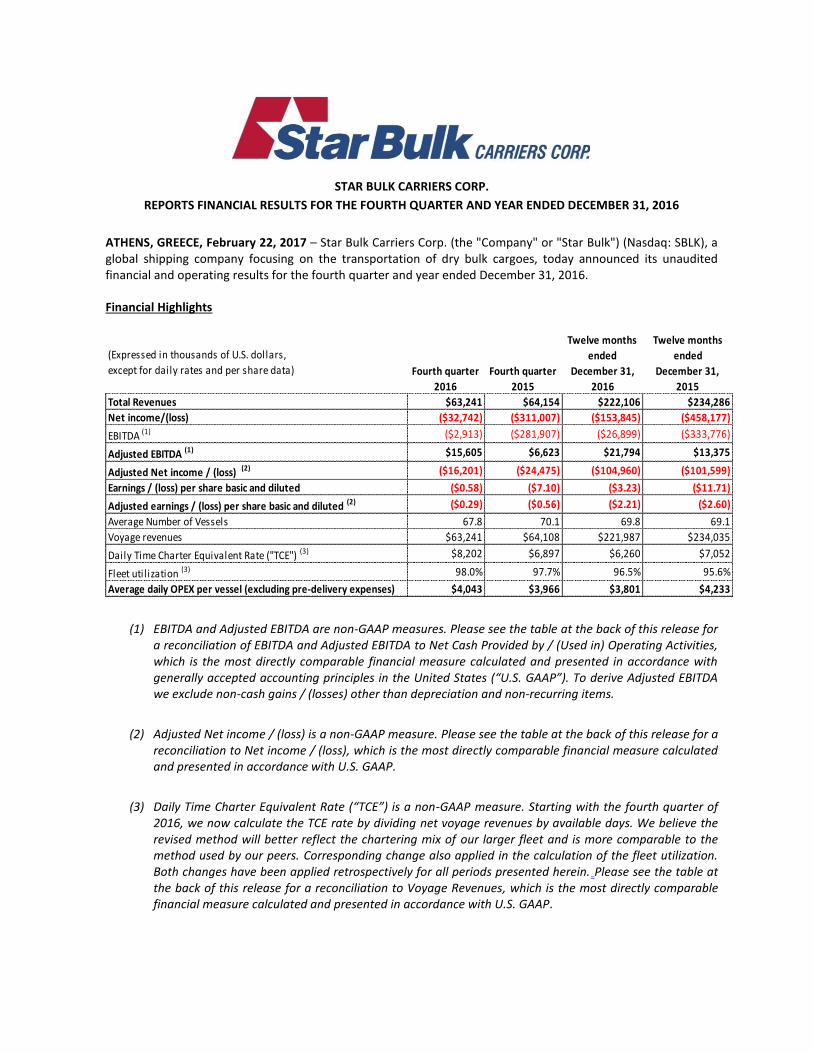
STAR BULK CARRIERS CORP.
REPORTS FINANCIAL RESULTS FOR THE FOURTH QUARTER AND YEAR ENDED DECEMBER 31, 2016
ATHENS, GREECE, February 22, 2017 – Star Bulk Carriers Corp. (the "Company" or "Star Bulk") (Nasdaq: SBLK), a global shipping company focusing on the transportation of dry bulk cargoes, today announced its unaudited financial and operating results for the fourth quarter and year ended December 31, 2016.
Financial Highlights
Twelve months
ended
Twelve months
ended
Fourth quarter
2016
Fourth quarter
2015
December 31,
2016
December 31,
2015
Total Revenues $63,241 $64,154 $222,106 $234,286
Net income/(loss) ($32,742) ($311,007) ($153,845) ($458,177)
EBITDA (1) ($2,913) ($281,907) ($26,899) ($333,776)
Adjusted EBITDA (1) $15,605 $6,623 $21,794 $13,375
Adjusted Net income / (loss) (2) ($16,201) ($24,475) ($104,960) ($101,599)
Earnings / (loss) per share basic and diluted ($0.58) ($7.10) ($3.23) ($11.71)
Adjusted earnings / (loss) per share basic and diluted (2) ($0.29) ($0.56) ($2.21) ($2.60)
Average Number of Vessels 67.8 70.1 69.8 69.1
Voyage revenues $63,241 $64,108 $221,987 $234,035
Daily Time Charter Equivalent Rate ("TCE") (3) $8,202 $6,897 $6,260 $7,052
Fleet util ization (3) 98.0% 97.7% 96.5% 95.6%
Average daily OPEX per vessel (excluding pre-delivery expenses) $4,043 $3,966 $3,801 $4,233
(Expressed in thousands of U.S. dollars,
except for daily rates and per share data)
(1) EBITDA and Adjusted EBITDA are non-GAAP measures. Please see the table at the back of this release for a reconciliation of EBITDA and Adjusted EBITDA to Net Cash Provided by / (Used in) Operating Activities, which is the most directly comparable financial measure calculated and presented in accordance with generally accepted accounting principles in the United States (“U.S. GAAP”). To derive Adjusted EBITDA we exclude non-cash gains / (losses) other than depreciation and non-recurring items.
(2) Adjusted Net income / (loss) is a non-GAAP measure. Please see the table at the back of this release for a reconciliation to Net income / (loss), which is the most directly comparable financial measure calculated and presented in accordance with U.S. GAAP.
(3) Daily Time Charter Equivalent Rate (“TCE”) is a non-GAAP measure. Starting with the fourth quarter of 2016, we now calculate the TCE rate by dividing net voyage revenues by available days. We believe the revised method will better reflect the chartering mix of our larger fleet and is more comparable to the method used by our peers. Corresponding change also applied in the calculation of the fleet utilization. Both changes have been applied retrospectively for all periods presented herein. Please see the table at the back of this release for a reconciliation to Voyage Revenues, which is the most directly comparable financial measure calculated and presented in accordance with U.S. GAAP.
2
Petros Pappas, Chief Executive Officer of Star Bulk, commented:
“Star Bulk announced today its fourth quarter and year end 2016 financial results, reporting $50.9 million in Net TCE Revenues and $15.6 million in Adjusted EBITDA during the fourth quarter of 2016, implying a free cash flow of $6.1 million from our operating fleet.
The cash flow - positive performance of our fleet resulted from an improved freight market in the last quarter of 2016 relative to the previous quarter and zero bank debt principal repayments following the restructuring agreement with our lenders announced in September 2016.
For the fourth quarter of 2016, our average TCE per vessel was $8,202/day, increased by 18.9% y-o-y while our average utilization was 98.0%. For the fourth quarter our average OPEX and average net cash G&A expenses per vessel were $4,043/day and $1,005/day respectively. Our full year 2016 average OPEX per vessel was $3,801/day, while we rank among the top 3 dry bulk operators in Rightship vessel condition ratings. One of our main objectives for 2017 is to maintain such low break-even levels without compromising the level of maintenance on our vessels.
Amidst the weakest dry bulk market of the last 3 decades, we have taken all appropriate measures to ensure our company’s liquidity through this cycle. The proceeds from the recent $51.5 million private placement of common shares bring our total cash to approximately $250 million.”
3
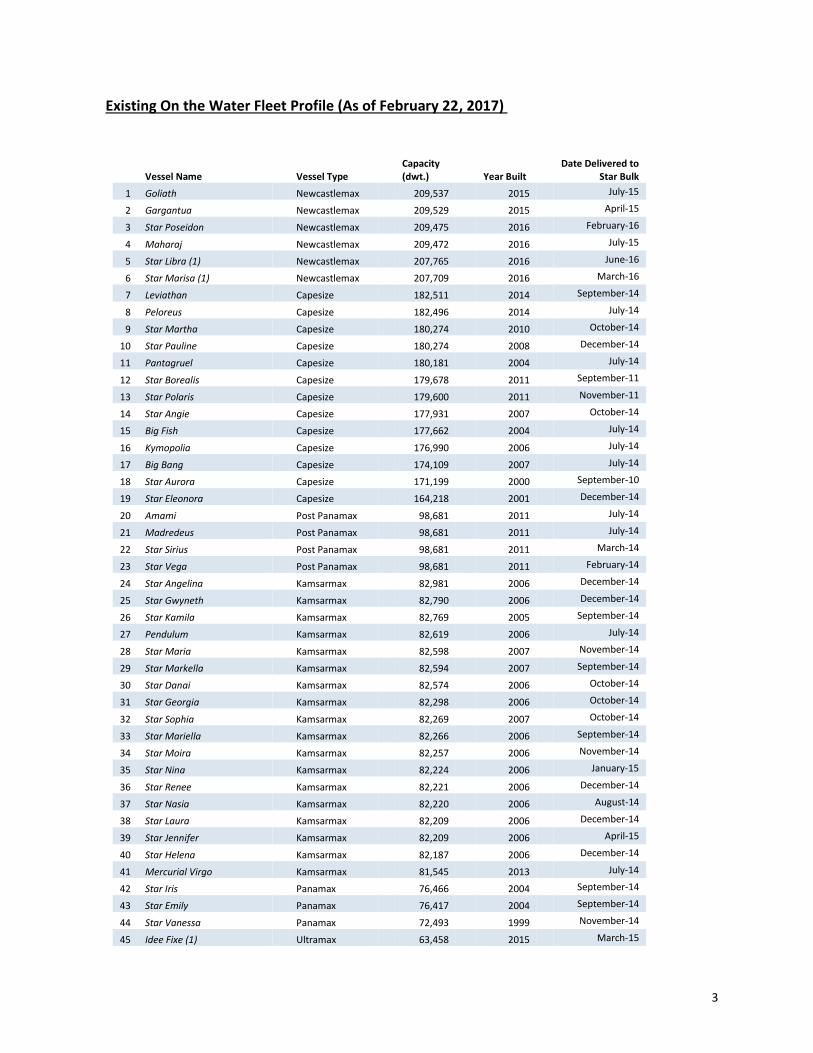
Existing On the Water Fleet Profile (As of February 22, 2017)
Vessel Name Vessel Type Capacity (dwt.) Year Built
Date Delivered to Star Bulk
1 Goliath Newcastlemax 209,537 2015 July-15
2 Gargantua Newcastlemax 209,529 2015 April-15
3 Star Poseidon Newcastlemax 209,475 2016 February-16
4 Maharaj Newcastlemax 209,472 2016 July-15
5 Star Libra (1) Newcastlemax 207,765 2016 June-16
6 Star Marisa (1) Newcastlemax 207,709 2016 March-16
7 Leviathan Capesize 182,511 2014 September-14
8 Peloreus Capesize 182,496 2014 July-14
9 Star Martha Capesize 180,274 2010 October-14
10 Star Pauline Capesize 180,274 2008 December-14
11 Pantagruel Capesize 180,181 2004 July-14
12 Star Borealis Capesize 179,678 2011 September-11
13 Star Polaris Capesize 179,600 2011 November-11
14 Star Angie Capesize 177,931 2007 October-14
15 Big Fish Capesize 177,662 2004 July-14
16 Kymopolia Capesize 176,990 2006 July-14
17 Big Bang Capesize 174,109 2007 July-14
18 Star Aurora Capesize 171,199 2000 September-10
19 Star Eleonora Capesize 164,218 2001 December-14
20 Amami Post Panamax 98,681 2011 July-14
21 Madredeus Post Panamax 98,681 2011 July-14
22 Star Sirius Post Panamax 98,681 2011 March-14
23 Star Vega Post Panamax 98,681 2011 February-14
24 Star Angelina Kamsarmax 82,981 2006 December-14
25 Star Gwyneth Kamsarmax 82,790 2006 December-14
26 Star Kamila Kamsarmax 82,769 2005 September-14
27 Pendulum Kamsarmax 82,619 2006 July-14
28 Star Maria Kamsarmax 82,598 2007 November-14
29 Star Markella Kamsarmax 82,594 2007 September-14
30 Star Danai Kamsarmax 82,574 2006 October-14
31 Star Georgia Kamsarmax 82,298 2006 October-14
32 Star Sophia Kamsarmax 82,269 2007 October-14
33 Star Mariella Kamsarmax 82,266 2006 September-14
34 Star Moira Kamsarmax 82,257 2006 November-14
35 Star Nina Kamsarmax 82,224 2006 January-15
36 Star Renee Kamsarmax 82,221 2006 December-14
37 Star Nasia Kamsarmax 82,220 2006 August-14
38 Star Laura Kamsarmax 82,209 2006 December-14
39 Star Jennifer Kamsarmax 82,209 2006 April-15
40 Star Helena Kamsarmax 82,187 2006 December-14
41 Mercurial Virgo Kamsarmax 81,545 2013 July-14
42 Star Iris Panamax 76,466 2004 September-14
43 Star Emily Panamax 76,417 2004 September-14
44 Star Vanessa Panamax 72,493 1999 November-14
45 Idee Fixe (1) Ultramax 63,458 2015 March-15
4
46 Roberta (1) Ultramax 63,426 2015 March-15
47 Laura (1) Ultramax 63,399 2015 April-15
48 Kaley (1) Ultramax 63,283 2015 June-15
49 Kennadi Ultramax 63,262 2016 January-16
50 Mackenzie Ultramax 63,226 2016 March-16
51 Star Challenger Ultramax 61,462 2012 December-13
52 Star Fighter Ultramax 61,455 2013 December-13
53 Star Lutas Ultramax 61,347 2016 January-16
54 Honey Badger Ultramax 61,320 2015 February-15
55 Wolverine Ultramax 61,292 2015 February-15
56 Star Antares Ultramax 61,258 2015 October-15
57 Star Acquarius Ultramax 60,916 2015 July-15
58 Star Pisces Ultramax 60,916 2015 August-15
59 Strange Attractor Supramax 55,742 2006 July-14
60 Star Omicron Supramax 53,489 2005 April-08
61 Star Gamma Supramax 53,098 2002 January-08
62 Star Zeta Supramax 52,994 2003 January-08
63 Star Delta Supramax 52,434 2000 January-08
64 Star Theta Supramax 52,425 2003 December-07
65 Star Epsilon Supramax 52,402 2001 December-07
66 Star Cosmo Supramax 52,247 2005 July-08
67 Star Kappa Supramax 52,055 2001 December-07
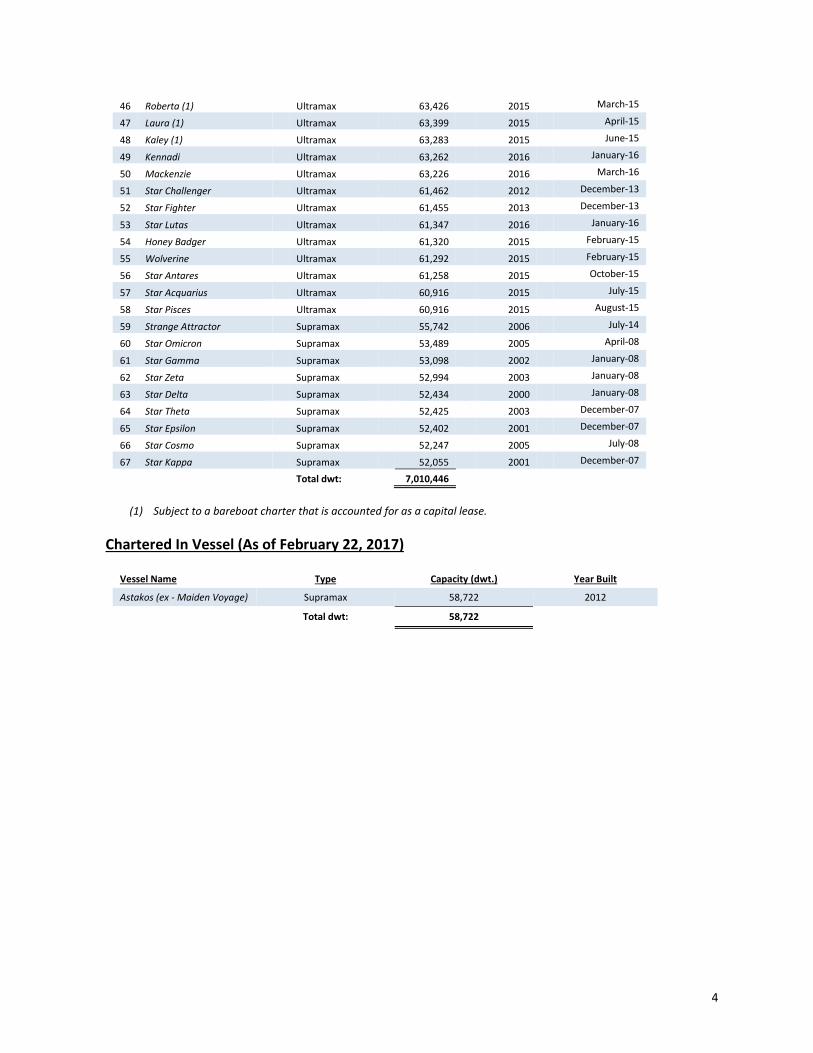
Total dwt: 7,010,446
(1) Subject to a bareboat charter that is accounted for as a capital lease.
Chartered In Vessel (As of February 22, 2017)
Vessel Name Type Capacity (dwt.) Year Built
Astakos (ex - Maiden Voyage) Supramax 58,722 2012
Total dwt: 58,722
5
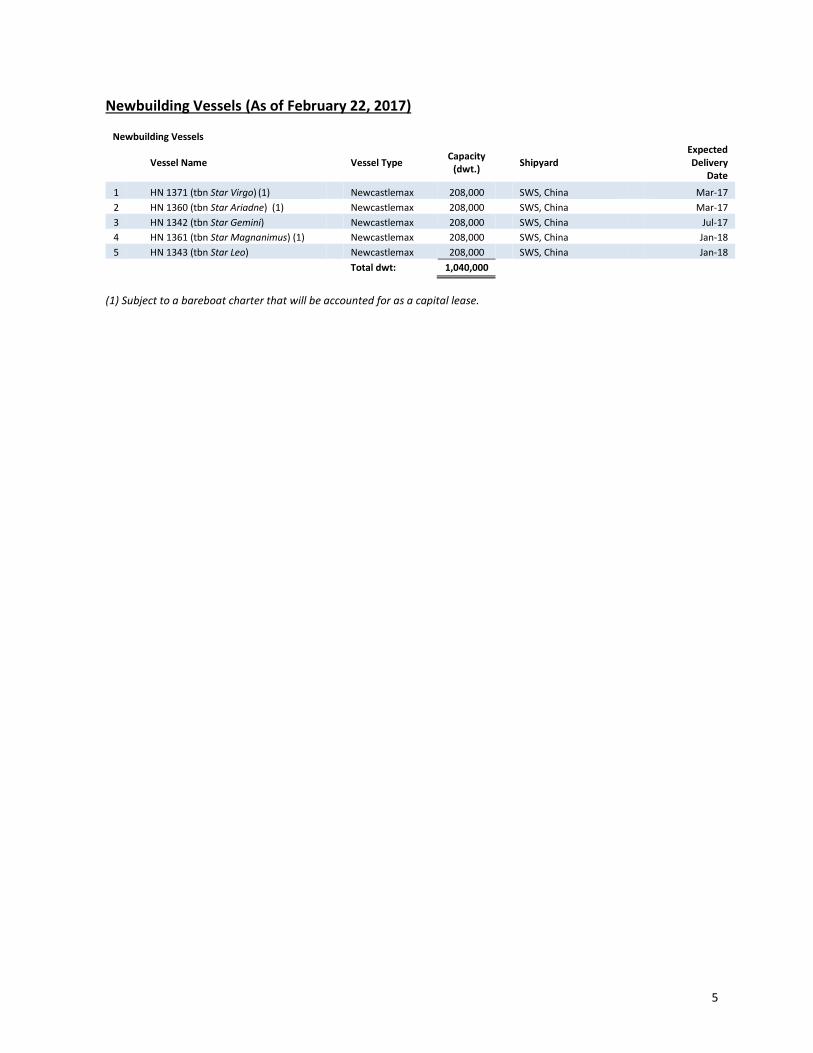
Newbuilding Vessels (As of February 22, 2017)
Newbuilding Vessels
Vessel Name Vessel Type
Capacity (dwt.)
Shipyard Expected Delivery
Date
1 HN 1371 (tbn Star Virgo) (1) Newcastlemax 208,000 SWS, China Mar-17
2 HN 1360 (tbn Star Ariadne) (1) Newcastlemax 208,000 SWS, China Mar-17
3 HN 1342 (tbn Star Gemini) Newcastlemax 208,000 SWS, China Jul-17
4 HN 1361 (tbn Star Magnanimus) (1) Newcastlemax 208,000 SWS, China Jan-18
5 HN 1343 (tbn Star Leo) Newcastlemax 208,000 SWS, China Jan-18
Total dwt: 1,040,000
(1) Subject to a bareboat charter that will be accounted for as a capital lease.

6
Recent Developments
Private Placement of $51.5 million
On February 2, 2017, we sold, in a private placement, an aggregate of 6,310,272 of our common shares, at a purchase price of $8.154 per share to affiliates of Oaktree Capital Management, L.P. (“Oaktree”) and Senator Investment Group LP (“Senator”) for an aggregate of approximately $51.5 million in gross proceeds. Following the completion of this transaction and as of February 22, 2017, we had 63,071,629 common shares outstanding. We intend to use the proceeds of the private placement for general corporate purposes.
Employment update
During the fourth quarter of 2016 and January 2017, we concluded the following 16 medium to long term fixtures:
Leviathan, a 182,511 dwt Capesize vessel at $12,000/day for a period of approximately 15 to 17 months
Peloreus, a 182,496 dwt Capesize vessel at $12,000/day for a period of approximately 13 to 15 months
Big Fish, a 177,662 dwt Capesize vessel at $9,125/day for a period of approximately 13 to 15 months
Madredeus, a 98,681 dwt] Post-Panamax vessel at $8,250/day for a period of approximately 4 to 7 months
Star Angelina, a 82,981 dwt Kamsarmax vessel at $7,500/day for a period of approximately 4 to 7 months
Star Gwyneth, a 82,790 dwt Kamsarmax vessel at $8,750/day for a period of approximately 9 to 11 months
Star Mariella , a 82,266 dwt Kamsarmax vessel at $9,150/day for a period of approximately 5 to 7 months
Star Moira, a 82,257 dwt Kamsarmax vessel at $8,000/day for a period of approximately 9 to 11 months
Star Laura, a 82,209 dwt Kamsarmax vessel at $7,450/day for a period of approximately 5 to 8 months
Star Helena, a 82,187 dwt Kamsarmax vessel at $8,500/day for a period of approximately 4 to 6 months
Mercurial Virgo, a 81,545 dwt Capesize vessel at $8,750/day for a period of approximately 9 to 11 months
Laura, a 63,399 dwt Ultramax vessel at $8,250/day for a period of approximately 6 to 9 months
Star Fighter, a 61,455 dwt Ultramax vessel at $11,650/day for a period of approximately 4 to 6 months
Wolverine, a 61,292 dwt Ultramax vessel at $7,500/day for a period of approximately 5 to 7 months
Star Pisces, a 60,916 dwt Ultramax vessel at $8,800/day for a period of approximately 6 to 8 months
Strange Attractor, a 55,742 dwt Supramax vessel at $7,000/day for a period of approximately 4 to 6 months

7
Fourth Quarter 2016 and 2015 Results (*) (*) Amounts relating to variations in period – on – period comparisons shown in this section are derived from the actual numbers in our books and records. In addition, all share and per share amounts disclosed in this report give effect to our company’s 5 for 1 reverse stock split effective June 20, 2016, retroactively, for all periods presented. We refer to the presentation of all share and per share amounts as the “reverse split‐adjusted basis”.
For the fourth quarter of 2016, total net voyage revenues were $50.9 million compared to $43.5 million for the fourth quarter of 2015. The increase is mainly attributable to the increase in TCE rates by 19%, to $8,202 for the fourth quarter of 2016 from $6,897 for the fourth quarter of 2015, offset by slightly lower average number of vessels in our fleet during the fourth quarter of 2016 of 67.8, compared to 70.1 during the fourth quarter of 2015.
For the fourth quarter of 2016, operating loss was $23.2 million, which includes non-cash impairment loss of $10.7 million, depreciation of $20.3 million and a net loss on sale of vessels of $6.9 million. Operating loss of $304.2 million for the fourth quarter of 2015 includes a non-cash impairment loss of $287.7 million, depreciation of $21.8 million and a net loss on sale of vessels of $0.1 million.
Net loss for the fourth quarter of 2016 was $32.7 million, or $0.58 loss per basic and diluted share, calculated based on 56,721,385 weighted average number of basic and diluted shares. Net loss for the fourth quarter of 2015 was $311.0 million, or $7.10 loss per basic and diluted share, calculated based on 43,824,122 weighted average number of basic and diluted shares.
Net loss for the fourth quarter of 2016, mainly included the following non-cash items, other than depreciation expense:
Expenses of $0.8 million, or $0.01 per basic and diluted share, relating to stock based compensation recognized in connection with common shares that were granted to our directors and employees;
Impairment loss of $10.7 million or $0.19 per basic and diluted share, recognized based on our impairment analysis performed for the year ended December 31, 2016.
An aggregate net loss on sale of vessels of $6.9 million, or $0.12 per basic and diluted share, relating to the sale of the Star Aline and the Star Despoina, completed during the fourth quarter of 2016; and
Unrealized gain on derivative instruments of $2.1 million, or $0.04 per basic and diluted share.
Net loss for the fourth quarter of 2015, mainly included the following non-cash items, other than depreciation expense:
Impairment loss of $287.7 million or $6.56 per basic and diluted share, in connection with (i) the agreements signed to sell certain operating vessels and newbuilding vessels upon their delivery from the shipyards, and (ii) our impairment analysis performed for the year ended December 31, 2015. The impairment loss includes $106.1 million representing the write-off of the fair value adjustment recognized upon our merger with Oceanbulk in July 2014;
Amortization of fair value of above market acquired time charters of $0.5 million, or $0.01 per basic and diluted share, associated with time charters attached to three acquired vessels (Amami, Madredeus and Star Martha). These above market time charters were amortized over the duration of each charter as a decrease to voyage revenues;
Expenses of $0.6 million, or $0.01 per basic and diluted share, relating to stock-based compensation recognized in connection with the shares that were granted to our directors and employees; and
Unrealized gain on derivative instruments not designated as accounting hedges of $2.5 million, or $0.06 per basic and diluted share.
Adjusted net loss for the fourth quarter of 2016, which excludes all non-cash items, other than depreciation expense, amounted to $16.2 million, or $0.29 loss, per basic and diluted share, compared to $24.5 million, or $0.56, loss per basic and diluted share for the fourth quarter of 2015. A reconciliation of Net income / (loss) to Adjusted Net income/ (loss) is set forth below in the financial tables contained in this release.

8
Adjusted EBITDA for the fourth quarter of 2016 and 2015, which excludes all non-cash items, other than depreciation expense, was $15.6 million and $6.6 million, respectively. A reconciliation of EBITDA and Adjusted EBITDA to net cash provided by/(used in) cash flows from operating activities is set forth below in the financial tables contained in this release.
During the fourth quarter of 2016 and 2015, the average number of vessels in our operating fleet was 67.8 and 70.1, respectively, which earned an average Time Charter Equivalent, or “TCE” of $8,202 and $6,897 per day, respectively. We refer you to footnote 8 under the heading "Summary of Selected Data” set forth below for information regarding our calculation of TCE rates.
For the fourth quarter of 2016 and 2015, charter in hire expense was $0.9 million, respectively, representing the expense for leasing back the vessel Astakos (ex-Maiden Voyage), which we sold in September 2015.
For the fourth quarter of 2016 and 2015, vessel operating expenses totalled $25.3 million and $26.5 million, respectively and our average daily operating expenses per vessel for the fourth quarter of 2016 and 2015 were $4,047 and $4,104, respectively. During the fourth quarter of 2016, the decline in our average operating expense per vessel continued which is attributable to our management’s focus on cost efficiencies, the addition to our fleet of newly built vessels with lower maintenance requirements and synergies and economies of scale from operating a large fleet.
Dry docking expenses for the fourth quarter of 2016 and 2015 were $3.0 million and $1.8 million, respectively. During the fourth quarter of 2016, three of our vessels underwent their periodic dry docking surveys (two Capesize vessels and one Supramax vessels), compared to four smaller vessels in the fourth quarter of 2015 (three Supramax vessels and one Kamsarmax vessel).
Management fees for the fourth quarter of 2016 and 2015 were $1.8 million and $2.0 million, respectively. During the fourth quarter of 2016 and 2015, management fees included a daily fee of $295 per vessel to Ship Procurement Services S.A. The decrease is mainly attributable to the lower average number of vessels during the fourth quarter 2016 compared to the respective period in 2015. In addition, management fees for the fourth quarter of 2015 also included a monthly fee of $17,500 to Maryville Maritime Inc., for the management of the Star Martha, Star Pauline and Star Despoina, until the expiration of their then existing time charter agreements (the last of which expired in November 2015). Management fees included in our average daily net cash general and administrative expenses per vessel stated below
During the fourth quarter of 2016 and 2015, general and administrative expenses were $5.2 million and $6.9 million, respectively. Excluding the stock based compensation of $0.8 million and $0.6 million for the relevant periods, the decrease in general and administrative expenses was $1.8 million. Part of the decrease relates to $0.9 million for professional services that we incurred in the fourth quarter of 2015, which we did not incur in 2016. Excluding the above mentioned costs of professional services and stock-based compensation, our average daily net cash general and administrative expenses per vessel (including all management fees) for the fourth quarter of 2016 were $1,005, compared to $1,140 representing a 11.8% decrease.
During the fourth quarter of 2016, we recognized an impairment loss of $10.7 million based on our impairment analysis performed for the year ended December 31, 2016. During the fourth quarter of 2015 we recorded an impairment loss of an aggregate of $287.7 million in connection with (i) the agreements to sell certain operating vessels and newbuilding vessels upon their delivery from the shipyards, and (ii) our impairment analysis performed for the year ended December 31, 2015. This impairment loss includes $106.1 million related to the write-off of the fair value adjustment recognized upon the merger with Oceanbulk in July 2014 in connection with acquired operating and newbuilding vessels.
9
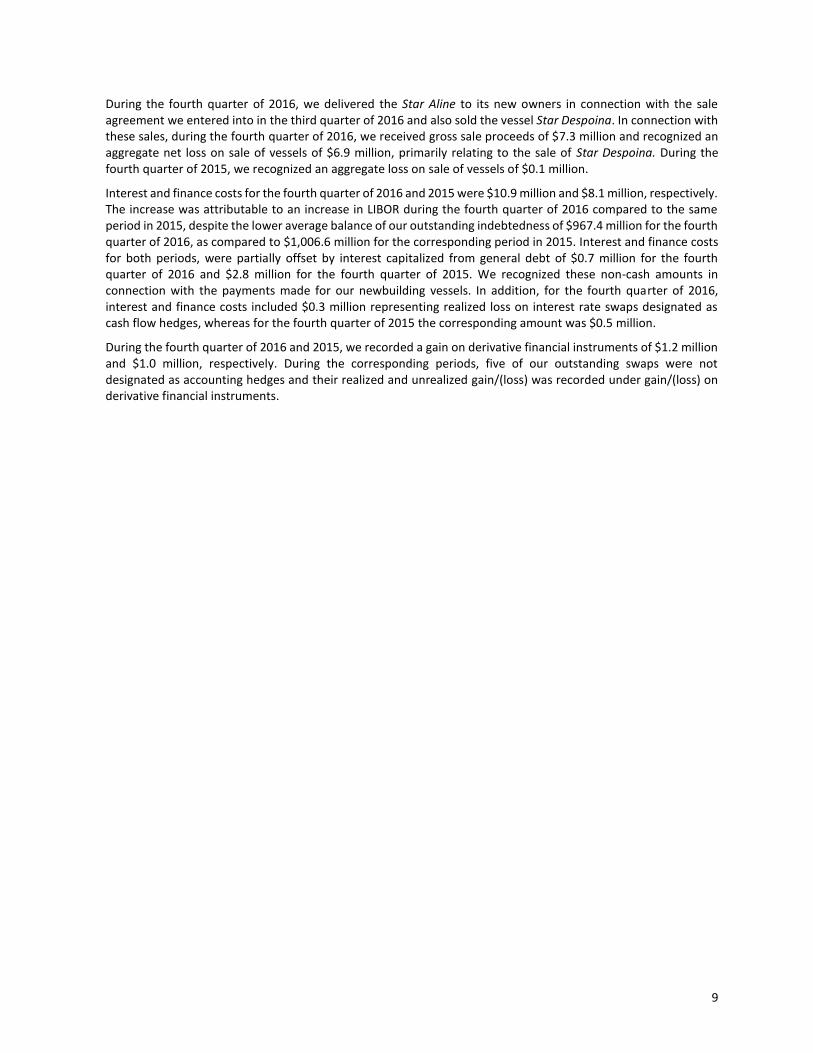
During the fourth quarter of 2016, we delivered the Star Aline to its new owners in connection with the sale agreement we entered into in the third quarter of 2016 and also sold the vessel Star Despoina. In connection with these sales, during the fourth quarter of 2016, we received gross sale proceeds of $7.3 million and recognized an aggregate net loss on sale of vessels of $6.9 million, primarily relating to the sale of Star Despoina. During the fourth quarter of 2015, we recognized an aggregate loss on sale of vessels of $0.1 million.
Interest and finance costs for the fourth quarter of 2016 and 2015 were $10.9 million and $8.1 million, respectively. The increase was attributable to an increase in LIBOR during the fourth quarter of 2016 compared to the same period in 2015, despite the lower average balance of our outstanding indebtedness of $967.4 million for the fourth quarter of 2016, as compared to $1,006.6 million for the corresponding period in 2015. Interest and finance costs for both periods, were partially offset by interest capitalized from general debt of $0.7 million for the fourth quarter of 2016 and $2.8 million for the fourth quarter of 2015. We recognized these non-cash amounts in connection with the payments made for our newbuilding vessels. In addition, for the fourth quarter of 2016, interest and finance costs included $0.3 million representing realized loss on interest rate swaps designated as cash flow hedges, whereas for the fourth quarter of 2015 the corresponding amount was $0.5 million.
During the fourth quarter of 2016 and 2015, we recorded a gain on derivative financial instruments of $1.2 million and $1.0 million, respectively. During the corresponding periods, five of our outstanding swaps were not designated as accounting hedges and their realized and unrealized gain/(loss) was recorded under gain/(loss) on derivative financial instruments.
10
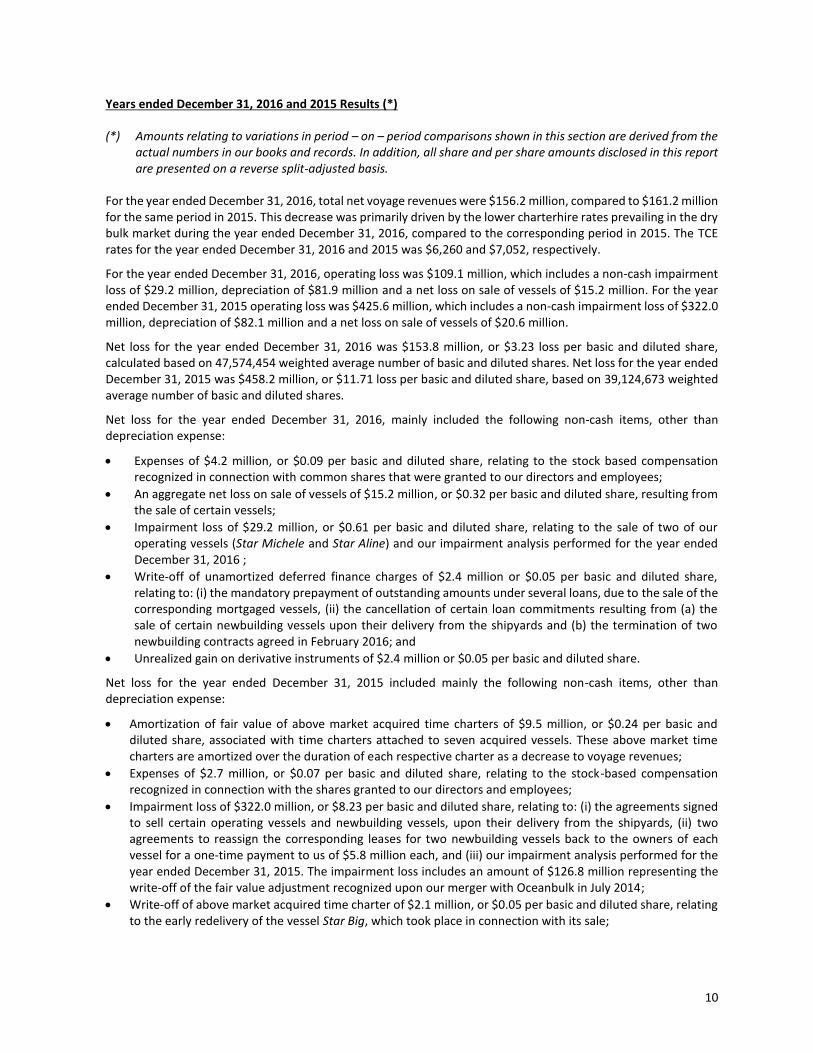
Years ended December 31, 2016 and 2015 Results (*)
(*) Amounts relating to variations in period – on – period comparisons shown in this section are derived from the actual numbers in our books and records. In addition, all share and per share amounts disclosed in this report are presented on a reverse split-adjusted basis.
For the year ended December 31, 2016, total net voyage revenues were $156.2 million, compared to $161.2 million for the same period in 2015. This decrease was primarily driven by the lower charterhire rates prevailing in the dry bulk market during the year ended December 31, 2016, compared to the corresponding period in 2015. The TCE rates for the year ended December 31, 2016 and 2015 was $6,260 and $7,052, respectively.
For the year ended December 31, 2016, operating loss was $109.1 million, which includes a non-cash impairment loss of $29.2 million, depreciation of $81.9 million and a net loss on sale of vessels of $15.2 million. For the year ended December 31, 2015 operating loss was $425.6 million, which includes a non-cash impairment loss of $322.0 million, depreciation of $82.1 million and a net loss on sale of vessels of $20.6 million.
Net loss for the year ended December 31, 2016 was $153.8 million, or $3.23 loss per basic and diluted share, calculated based on 47,574,454 weighted average number of basic and diluted shares. Net loss for the year ended December 31, 2015 was $458.2 million, or $11.71 loss per basic and diluted share, based on 39,124,673 weighted average number of basic and diluted shares.
Net loss for the year ended December 31, 2016, mainly included the following non-cash items, other than depreciation expense:
Expenses of $4.2 million, or $0.09 per basic and diluted share, relating to the stock based compensation recognized in connection with common shares that were granted to our directors and employees;
An aggregate net loss on sale of vessels of $15.2 million, or $0.32 per basic and diluted share, resulting from the sale of certain vessels;
Impairment loss of $29.2 million, or $0.61 per basic and diluted share, relating to the sale of two of our operating vessels (Star Michele and Star Aline) and our impairment analysis performed for the year ended December 31, 2016 ;
Write-off of unamortized deferred finance charges of $2.4 million or $0.05 per basic and diluted share, relating to: (i) the mandatory prepayment of outstanding amounts under several loans, due to the sale of the corresponding mortgaged vessels, (ii) the cancellation of certain loan commitments resulting from (a) the sale of certain newbuilding vessels upon their delivery from the shipyards and (b) the termination of two newbuilding contracts agreed in February 2016; and
Unrealized gain on derivative instruments of $2.4 million or $0.05 per basic and diluted share.
Net loss for the year ended December 31, 2015 included mainly the following non-cash items, other than depreciation expense:
Amortization of fair value of above market acquired time charters of $9.5 million, or $0.24 per basic and diluted share, associated with time charters attached to seven acquired vessels. These above market time charters are amortized over the duration of each respective charter as a decrease to voyage revenues;
Expenses of $2.7 million, or $0.07 per basic and diluted share, relating to the stock-based compensation recognized in connection with the shares granted to our directors and employees;
Impairment loss of $322.0 million, or $8.23 per basic and diluted share, relating to: (i) the agreements signed to sell certain operating vessels and newbuilding vessels, upon their delivery from the shipyards, (ii) two agreements to reassign the corresponding leases for two newbuilding vessels back to the owners of each vessel for a one-time payment to us of $5.8 million each, and (iii) our impairment analysis performed for the year ended December 31, 2015. The impairment loss includes an amount of $126.8 million representing the write-off of the fair value adjustment recognized upon our merger with Oceanbulk in July 2014;
Write-off of above market acquired time charter of $2.1 million, or $0.05 per basic and diluted share, relating to the early redelivery of the vessel Star Big, which took place in connection with its sale;

11
Loss on sale of vessel of $20.6 million, or $0.53 per basic and diluted share, relating to the sale of certain operating vessels; and
Unrealized gain on derivative instruments of $1.1 million or $0.03 per basic and diluted share.
Adjusted net loss for the year ended December 31, 2016, which excludes all non-cash items, other than depreciation expense, amounted to $105.0 million, or $2.21 loss, per basic and diluted share, compared to $101.6 million, or $2.60 loss per basic and diluted share for the year ended December 31, 2015. A reconciliation of Net income / (loss) to Adjusted Net income/ (loss) is set forth below in the financial tables contained in this release.
Adjusted EBITDA for the years ended December 31, 2016 and 2015, excluding the above items, was $21.8 million and $13.4 million, respectively. A reconciliation of EBITDA and Adjusted EBITDA to net cash provided by/(used in) cash flows from operating activities is set forth below in the financial tables contained in this release.
During the years ended December 31, 2016 and 2015, we owned and operated an average of 69.8 and 69.1 vessels, respectively, which earned an average TCE rate of $6,260 and $7,052 per day, respectively. We refer you to footnote 8 under the heading “Summary of Selected Data” set forth below for information regarding our calculation of TCE rates.
For the year ended December 31, 2016, charter hire expense was $3.6 million, representing the expense for the lease back of the vessel Astakos (ex-Maiden Voyage), which we sold in September 2015. The corresponding expense for the year ended December 31, 2015 was $1.0 million.
For the years ended December 31, 2016 and 2015, vessel operating expenses were $98.8 million and $112.8 million, respectively which included $1.8 million and $6.1 million of pre-delivery and pre-joining expenses, incurred in connection with the delivery of the new vessels in our fleet during each period. Pre-joining and pre-delivery expenses relate to the expenses for the initial crew manning, as well as the initial supply of stores for our vessels upon delivery. Excluding these amounts, our average daily operating expenses per vessel for the year ended December 31, 2016 and 2015 would have been $3,801 and $4,233, respectively, representing a 10.2% decrease. The decrease is attributable to our management’s continued focus on cost efficiencies, the addition to our fleet of newly built vessels with lower maintenance requirements and further realization of synergies and economies of scale from operating a large fleet.
Dry docking expenses for the years ended December 31, 2016 and 2015 were $6.0 million and $15.0 million, respectively. During the year ended December 31, 2016, nine of our vessels underwent their periodic dry docking surveys, compared to 23 vessels in the same period in 2015.
Management fees for the years ended December 31, 2016 and 2015 were $7.6 million and $8.4 million, respectively and included a daily fee of $295 per vessel to Ship Procurement Services S.A. The decrease, despite the slight increase in the average number of vessels, was due to the fact that for the year ended December 31, 2015, management fees included also a monthly fee of $17,500 paid to Maryville Maritime Inc. for the management of the Star Martha, the Star Pauline and the Star Despoina, from their delivery to us until the expiration of their then existing time charter agreements (the last expired in November 2015). Management fees included in our average daily net cash general and administrative expenses per vessel stated below.
During the year ended December 31, 2016, we had $24.5 million of general and administrative expenses, compared to $23.6 million during the year ended December 31, 2015. Excluding the stock based compensation of $4.2 million for the year ended December 31, 2016 and $2.7 million for the year ended December 31, 2015 and non-recurring expenses for the relevant periods, relating to professional advisory and legal services provided to us, our average daily net cash general and administrative expenses per vessel (including all management fees) for the year ended December 31, 2016 were $1,089, compared to $1,134 during the same period in 2015.
During the year ended December 31, 2016, we recorded an impairment loss of $29.2 million in connection with the sale of two operating vessels and the termination of two newbuilding contracts and based also on our impairment analysis performed for the year ended December 31, 2016. During the year ended December 31, 2015, we recorded an impairment loss of an aggregate of $322.0 million relating to: (i) the agreements signed to sell
12
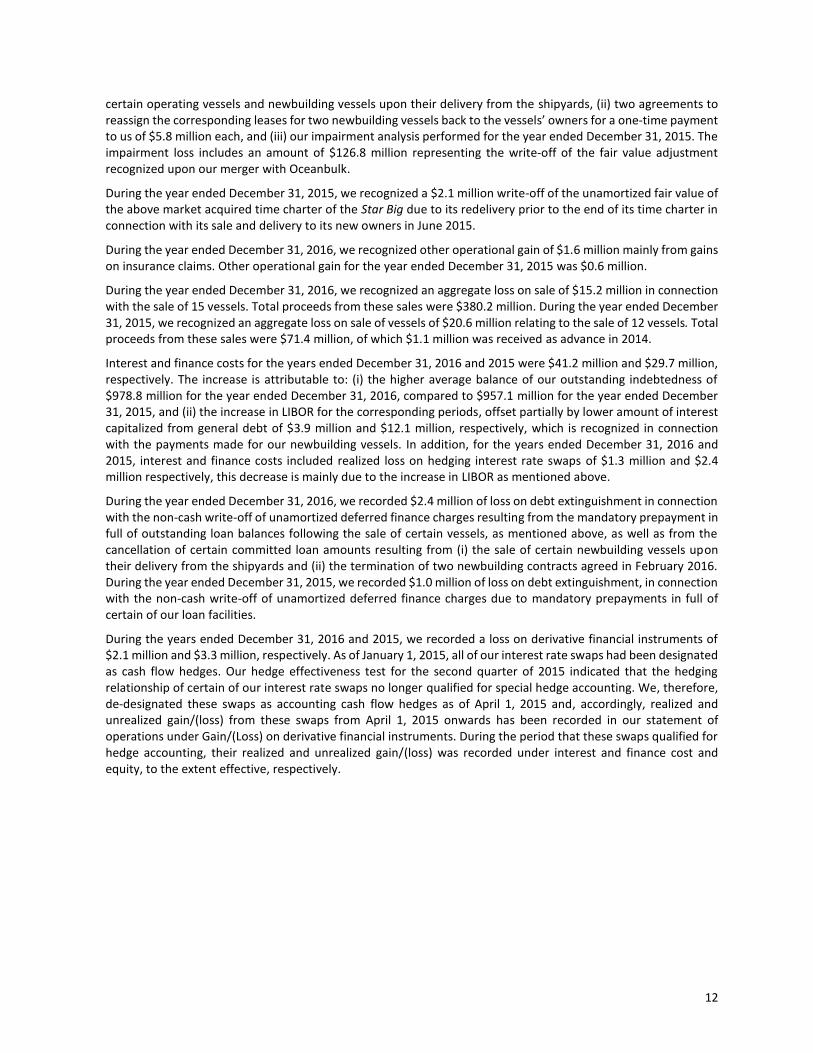
certain operating vessels and newbuilding vessels upon their delivery from the shipyards, (ii) two agreements to reassign the corresponding leases for two newbuilding vessels back to the vessels’ owners for a one-time payment to us of $5.8 million each, and (iii) our impairment analysis performed for the year ended December 31, 2015. The impairment loss includes an amount of $126.8 million representing the write-off of the fair value adjustment recognized upon our merger with Oceanbulk.
During the year ended December 31, 2015, we recognized a $2.1 million write-off of the unamortized fair value of the above market acquired time charter of the Star Big due to its redelivery prior to the end of its time charter in connection with its sale and delivery to its new owners in June 2015.
During the year ended December 31, 2016, we recognized other operational gain of $1.6 million mainly from gains on insurance claims. Other operational gain for the year ended December 31, 2015 was $0.6 million.
During the year ended December 31, 2016, we recognized an aggregate loss on sale of $15.2 million in connection with the sale of 15 vessels. Total proceeds from these sales were $380.2 million. During the year ended December 31, 2015, we recognized an aggregate loss on sale of vessels of $20.6 million relating to the sale of 12 vessels. Total proceeds from these sales were $71.4 million, of which $1.1 million was received as advance in 2014.
Interest and finance costs for the years ended December 31, 2016 and 2015 were $41.2 million and $29.7 million, respectively. The increase is attributable to: (i) the higher average balance of our outstanding indebtedness of $978.8 million for the year ended December 31, 2016, compared to $957.1 million for the year ended December 31, 2015, and (ii) the increase in LIBOR for the corresponding periods, offset partially by lower amount of interest capitalized from general debt of $3.9 million and $12.1 million, respectively, which is recognized in connection with the payments made for our newbuilding vessels. In addition, for the years ended December 31, 2016 and 2015, interest and finance costs included realized loss on hedging interest rate swaps of $1.3 million and $2.4 million respectively, this decrease is mainly due to the increase in LIBOR as mentioned above.
During the year ended December 31, 2016, we recorded $2.4 million of loss on debt extinguishment in connection with the non-cash write-off of unamortized deferred finance charges resulting from the mandatory prepayment in full of outstanding loan balances following the sale of certain vessels, as mentioned above, as well as from the cancellation of certain committed loan amounts resulting from (i) the sale of certain newbuilding vessels upon their delivery from the shipyards and (ii) the termination of two newbuilding contracts agreed in February 2016. During the year ended December 31, 2015, we recorded $1.0 million of loss on debt extinguishment, in connection with the non-cash write-off of unamortized deferred finance charges due to mandatory prepayments in full of certain of our loan facilities.
During the years ended December 31, 2016 and 2015, we recorded a loss on derivative financial instruments of $2.1 million and $3.3 million, respectively. As of January 1, 2015, all of our interest rate swaps had been designated as cash flow hedges. Our hedge effectiveness test for the second quarter of 2015 indicated that the hedging relationship of certain of our interest rate swaps no longer qualified for special hedge accounting. We, therefore, de-designated these swaps as accounting cash flow hedges as of April 1, 2015 and, accordingly, realized and unrealized gain/(loss) from these swaps from April 1, 2015 onwards has been recorded in our statement of operations under Gain/(Loss) on derivative financial instruments. During the period that these swaps qualified for hedge accounting, their realized and unrealized gain/(loss) was recorded under interest and finance cost and equity, to the extent effective, respectively.

13
Liquidity and Capital Resources
Cash Flows Net cash used in operating activities for the years ended December 31, 2016 and 2015 was $33.4 million and $14.6 million, respectively. The increase is due to: (i) a working capital outflow of $10.1 million mainly attributable to payments to our suppliers, for the year ended December 31, 2016, compared to a working capital inflow of $1.2 million for the corresponding period of 2015, (ii) higher net interest expense and (iii) higher Adjusted EBITDA.
Net cash used in investing activities for the years ended December 31, 2016 and 2015, was $13.2 million and $397.5 million, respectively.
For the year ended December 31, 2016, net cash used in investing activities consisted of:
$396.2 million paid for advances and other capitalized expenses for our newbuilding and newly delivered vessels;
offset by:
$159.9 million of proceeds from the sale of operating vessels;
$220.3 million of proceeds from the sale of certain newbuilding vessels, which were sold upon their delivery from the shipyard;
$2.5 million of hull and machinery insurance proceeds; and
a net increase of $0.2 million in restricted cash required under our loan facilities.
For the year ended December 31, 2015, net cash used in investing activities consisted of:
$434.3 million paid for advances and other capitalized expenses for our newbuilding vessels and newly delivered vessels;
$39.5 million paid for the acquisition of secondhand vessels;
$0.1 million for the acquisition of other fixed assets;
offset partially by:
$70.3 million of proceeds from the sale of operating vessels;
a one-time payment of $5.8 million received in connection with our agreement to reassign a lease for a newbuilding vessel back to the vessel’s owner; and
$0.3 million of hull and machinery insurance proceeds.
Net cash provided by financing activities for the years ended December 31, 2016 and 2015 was $20.4 million and $534.2 million, respectively.
For the year ended December 31, 2016, net cash provided by financing activities consisted of:
proceeds from bank loans for an aggregate of $65.4 million for the financing of delivery installments for four delivered newbuilding vessels, and an increase in capital lease obligations of $86.4 million, relating to two delivered newbuilding vessels, under bareboat charters; and
$50.3 million of proceeds from a public offering of our common shares, which was completed in September 2016, which is net of underwriting discounts and commissions of $0.9 million and offering expenses of $0.3 million,
offset partially by:
an aggregate of $181.2 million paid in connection with the regular amortization of outstanding vessel financings, capital lease installments and the mandatory prepayment of several loan facilities due to the sale of corresponding mortgaged vessels mentioned above; and
financing fees paid of $0.5 million in connection with the restructuring of our indebtedness.

14
For the year ended December 31, 2015, net cash provided by financing activities consisted of:
proceeds from loan facilities for an aggregate of $291.3 million for (i) the financing of delivery installments for nine delivered newbuilding vessels, (ii) cash consideration for the acquisition of the last six Excel Vessels; and (iii) the repayment in full of the Excel Vessel Bridge Facility;
increase in capital lease obligations of $82.7 million, relating to four delivered newbuilding vessels under bareboat charters; and
$417.7 million of proceeds from two public offerings of our common shares, which is net of underwriting discounts and commissions of $6.2 million and offering expenses of $1.0 million;
offset by:
financing fees paid of $13.1 million; and
an aggregate of $244.5 million paid in connection with the regular amortization of outstanding vessel financings, capital lease installments and prepayments of certain of our loan facilities.
15
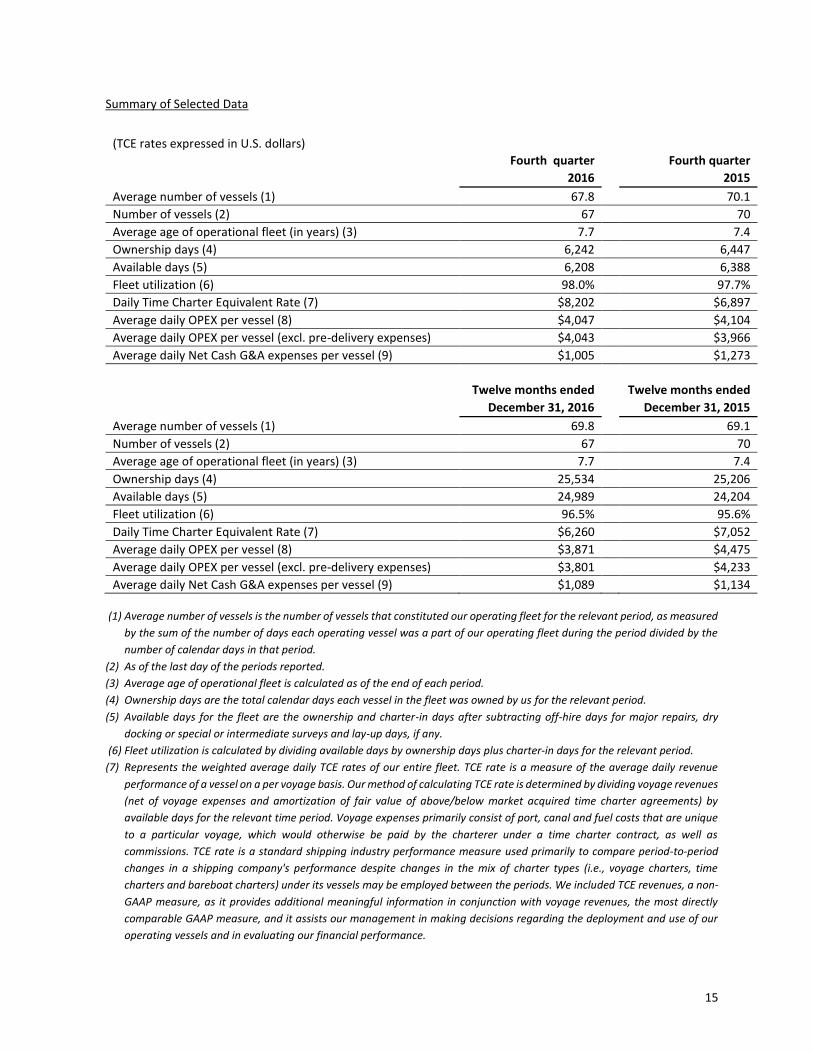
Summary of Selected Data
(TCE rates expressed in U.S. dollars)
Fourth quarter Fourth quarter
2016 2015
Average number of vessels (1) 67.8 70.1
Number of vessels (2) 67 70
Average age of operational fleet (in years) (3) 7.7 7.4
Ownership days (4) 6,242 6,447
Available days (5) 6,208 6,388
Fleet utilization (6) 98.0% 97.7%
Daily Time Charter Equivalent Rate (7) $8,202 $6,897
Average daily OPEX per vessel (8) $4,047 $4,104
Average daily OPEX per vessel (excl. pre-delivery expenses) $4,043 $3,966
Average daily Net Cash G&A expenses per vessel (9) $1,005 $1,273
Twelve months ended Twelve months ended December 31, 2016 December 31, 2015
Average number of vessels (1) 69.8 69.1
Number of vessels (2) 67 70
Average age of operational fleet (in years) (3) 7.7 7.4
Ownership days (4) 25,534 25,206
Available days (5) 24,989 24,204
Fleet utilization (6) 96.5% 95.6%
Daily Time Charter Equivalent Rate (7) $6,260 $7,052
Average daily OPEX per vessel (8) $3,871 $4,475
Average daily OPEX per vessel (excl. pre-delivery expenses) $3,801 $4,233
Average daily Net Cash G&A expenses per vessel (9) $1,089 $1,134
(1) Average number of vessels is the number of vessels that constituted our operating fleet for the relevant period, as measured
by the sum of the number of days each operating vessel was a part of our operating fleet during the period divided by the
number of calendar days in that period.
(2) As of the last day of the periods reported.
(3) Average age of operational fleet is calculated as of the end of each period.
(4) Ownership days are the total calendar days each vessel in the fleet was owned by us for the relevant period.
(5) Available days for the fleet are the ownership and charter-in days after subtracting off-hire days for major repairs, dry
docking or special or intermediate surveys and lay-up days, if any.
(6) Fleet utilization is calculated by dividing available days by ownership days plus charter-in days for the relevant period.
(7) Represents the weighted average daily TCE rates of our entire fleet. TCE rate is a measure of the average daily revenue
performance of a vessel on a per voyage basis. Our method of calculating TCE rate is determined by dividing voyage revenues
(net of voyage expenses and amortization of fair value of above/below market acquired time charter agreements) by
available days for the relevant time period. Voyage expenses primarily consist of port, canal and fuel costs that are unique
to a particular voyage, which would otherwise be paid by the charterer under a time charter contract, as well as
commissions. TCE rate is a standard shipping industry performance measure used primarily to compare period-to-period
changes in a shipping company's performance despite changes in the mix of charter types (i.e., voyage charters, time
charters and bareboat charters) under its vessels may be employed between the periods. We included TCE revenues, a non-
GAAP measure, as it provides additional meaningful information in conjunction with voyage revenues, the most directly
comparable GAAP measure, and it assists our management in making decisions regarding the deployment and use of our
operating vessels and in evaluating our financial performance.

16
(8) Average daily OPEX per vessel is calculated by dividing vessel operating expenses by ownership days.
(9) Average daily Net Cash G&A expenses per vessel is calculated by (1) deducting the Management fee Income from, and (2) adding
the Management fee expense (excluding termination charges in relation to vessels sold) to, the General and Administrative
expenses (net of stock based compensation expense) and (3) then dividing with the ownership days.
17
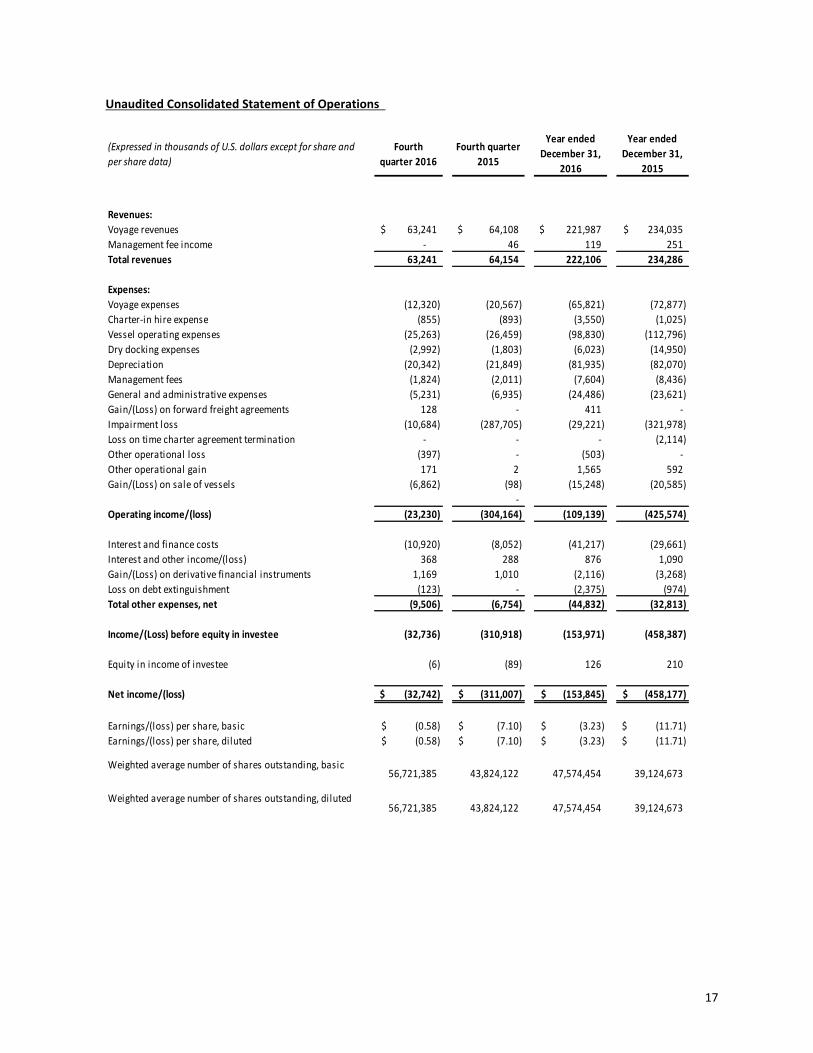
Unaudited Consolidated Statement of Operations
(Expressed in thousands of U.S. dollars except for share and
per share data)
Fourth
quarter 2016
Fourth quarter
2015
Year ended
December 31,
2016
Year ended
December 31,
2015
Revenues:
Voyage revenues 63,241$ 64,108$ 221,987$ 234,035$
Management fee income - 46 119 251
Total revenues 63,241 64,154 222,106 234,286
Expenses:
Voyage expenses (12,320) (20,567) (65,821) (72,877)
Charter-in hire expense (855) (893) (3,550) (1,025)
Vessel operating expenses (25,263) (26,459) (98,830) (112,796)
Dry docking expenses (2,992) (1,803) (6,023) (14,950)
Depreciation (20,342) (21,849) (81,935) (82,070)
Management fees (1,824) (2,011) (7,604) (8,436)
General and administrative expenses (5,231) (6,935) (24,486) (23,621)
Gain/(Loss) on forward freight agreements 128 - 411 -
Impairment loss (10,684) (287,705) (29,221) (321,978)
Loss on time charter agreement termination - - - (2,114)
Other operational loss (397) - (503) -
Other operational gain 171 2 1,565 592
Gain/(Loss) on sale of vessels (6,862) (98) (15,248) (20,585)
-
Operating income/(loss) (23,230) (304,164) (109,139) (425,574)
Interest and finance costs (10,920) (8,052) (41,217) (29,661)
Interest and other income/(loss) 368 288 876 1,090
Gain/(Loss) on derivative financial instruments 1,169 1,010 (2,116) (3,268)
Loss on debt extinguishment (123) - (2,375) (974)
Total other expenses, net (9,506) (6,754) (44,832) (32,813)
Income/(Loss) before equity in investee (32,736) (310,918) (153,971) (458,387)
Equity in income of investee (6) (89) 126 210
Net income/(loss) (32,742)$ (311,007)$ (153,845)$ (458,177)$
Earnings/(loss) per share, basic (0.58)$ (7.10)$ (3.23)$ (11.71)$
Earnings/(loss) per share, diluted (0.58)$ (7.10)$ (3.23)$ (11.71)$
Weighted average number of shares outstanding, basic56,721,385 43,824,122 47,574,454 39,124,673
Weighted average number of shares outstanding, diluted 56,721,385 43,824,122 47,574,454 39,124,673

18
Unaudited Consolidated Condensed Balance Sheets
ASSETS December 31, 2016 December 31, 2015
Cash and cash equivalents $ 181,758 $ 208,056
Other current assets (including restricted cash) 47,314 44,002
TOTAL CURRENT ASSETS 229,072 252,058
Advances for vessels under construction and acquisition of
vessels and other assets64,570 127,910
Vessels and other fixed assets, net 1,707,209 1,757,552
Other non-current assets (including restricted cash) 11,457 11,326
TOTAL ASSETS $ 2,012,308 $ 2,148,846
Current portion of long-term debt - $ 127,141
Lease commitments current 6,235 4,490
Other current l iabilities 22,107 35,318
TOTAL CURRENT LIABILITIES 28,342 166,949
Long-term debt (net of unamortized deferred finance fees of
$9,214 and $14,360, respectively)
743,719 720,237
8% 2019 Senior Notes (net of unamortized deferred finance fees
of $1,243 and $1,677, respectively)
48,757 48,323
Lease commitments non-current (net of unamortized deferred
finance fees of $39 and $nil, respectively)
152,613 75,030
Other non-current l iabilities 1,264 2,949
TOTAL LIABILITIES 974,695 1,013,488
STOCKHOLDERS' EQUITY 1,037,613 1,135,358
TOTAL LIABILITIES AND STOCKHOLDERS' EQUITY $ 2,012,308 $ 2,148,846
(Expressed in thousands of U.S. dollars)

19
Unaudited Cash Flow Data
$ (33,448) (14,578)$
(13,216) (397,533)
20,366 534,167
Year ended
December 31, 2015
Net cash provided by / (used in) operating activities
Net cash provided by / (used in) investing activities
Net cash provided by / (used in) financing activities
Year ended
December 31, 2016(Expressed in thousands of U.S. dollars)

20
EBITDA and Adjusted EBITDA Reconciliation
We consider EBITDA to represent net income before interest, income taxes, depreciation and amortization. EBITDA
does not represent and should not be considered as an alternative to net income or cash flow from operations, as
determined by United States generally accepted accounting principles, or U.S. GAAP, and our calculation of EBITDA
may not be comparable to that reported by other companies. EBITDA is included herein because it is a basis upon
which we assess our liquidity position, because it is a measure used by our lenders as a measure of our compliance
with certain loan covenants and because we believe that it presents useful information to investors regarding our
ability to service and/or incur indebtedness.
We excluded certain gains/losses such as those related to sale of vessels, stock-based compensation expense, the
write off of the unamortized fair value of above-market acquired time charters, impairment losses, change in fair
value of forward freight agreements and the equity in income of investee, to derive Adjusted EBITDA from EBITDA
and Adjusted Net income/(loss) from Net income/(loss). We excluded the items described above when deriving
Adjusted EBITDA and Adjusted Net income/(loss) because we believe that these items do not reflect the ongoing
operational cash inflows and outflows of our fleet.
21
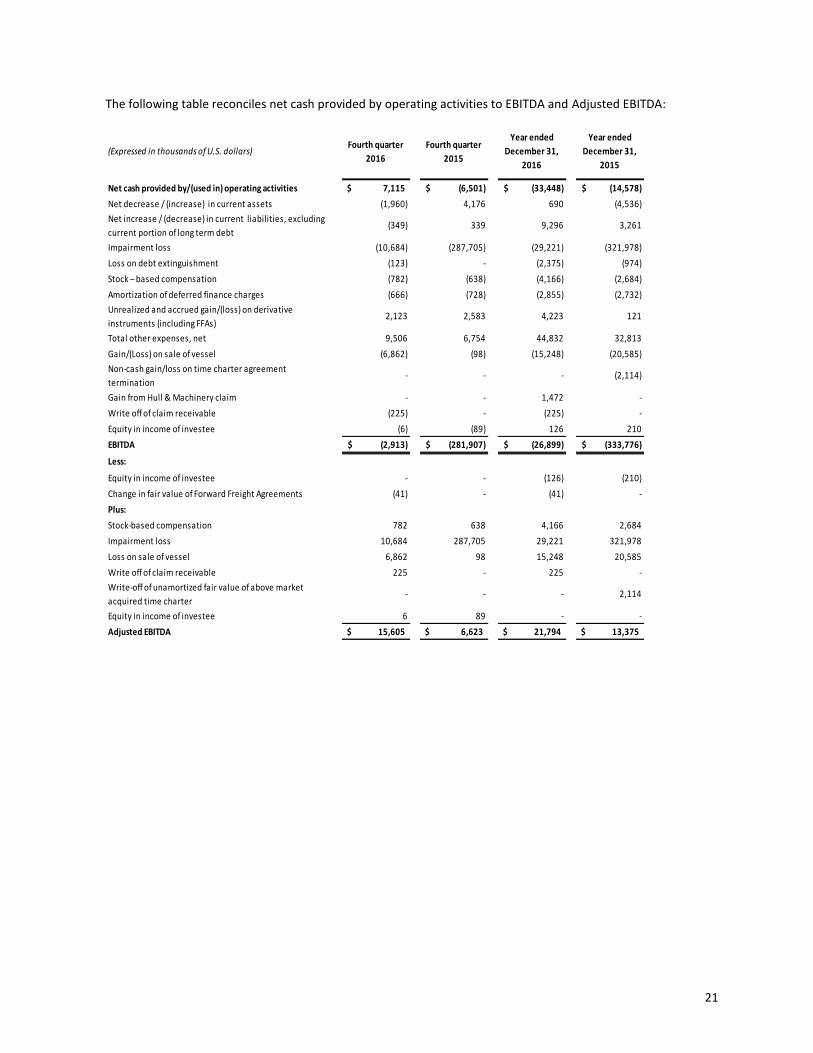
The following table reconciles net cash provided by operating activities to EBITDA and Adjusted EBITDA:
(Expressed in thousands of U.S. dollars)Fourth quarter
2016
Fourth quarter
2015
Year ended
December 31,
2016
Year ended
December 31,
2015
Net cash provided by/(used in) operating activities 7,115$ (6,501)$ (33,448)$ (14,578)$
Net decrease / (increase) in current assets (1,960) 4,176 690 (4,536)
Net increase / (decrease) in current liabilities, excluding
current portion of long term debt(349) 339 9,296 3,261
Impairment loss (10,684) (287,705) (29,221) (321,978)
Loss on debt extinguishment (123) - (2,375) (974)
Stock – based compensation (782) (638) (4,166) (2,684)
Amortization of deferred finance charges (666) (728) (2,855) (2,732)
Unrealized and accrued gain/(loss) on derivative
instruments (including FFAs)2,123 2,583 4,223 121
Total other expenses, net 9,506 6,754 44,832 32,813
Gain/(Loss) on sale of vessel (6,862) (98) (15,248) (20,585)
Non-cash gain/loss on time charter agreement
termination - - - (2,114)
Gain from Hull & Machinery claim - - 1,472 -
Write off of claim receivable (225) - (225) -
Equity in income of investee (6) (89) 126 210
EBITDA (2,913)$ (281,907)$ (26,899)$ (333,776)$
Less:
Equity in income of investee - - (126) (210)
Change in fair value of Forward Freight Agreements (41) - (41) -
Plus:
Stock-based compensation 782 638 4,166 2,684
Impairment loss 10,684 287,705 29,221 321,978
Loss on sale of vessel 6,862 98 15,248 20,585
Write off of claim receivable 225 - 225 -
Write-off of unamortized fair value of above market
acquired time charter - - - 2,114
Equity in income of investee 6 89 - -
Adjusted EBITDA 15,605$ 6,623$ 21,794$ 13,375$

22
Net income / (loss) and Adjusted Net income / (loss) Reconciliation
(Expressed in thousands of U.S. dollars)Fourth quarter
2016
Fourth quarter
2015
Year ended
December 31,
2016
Year ended
December 31,
2015
Net income / (loss) (32,742) (311,007) (153,845) (458,177)
Amortization of fair value of above market acquired
time charter agreements - 516 254 9,540
Write-off of unamortized fair value of above market
acquired time charter - - - 2,114
Write off of claim receivable 225 - 225 -
Stock – based compensation 782 638 4,166 2,684
Unrealized (gain)/loss on derivative instruments
(including FFAs)(2,122) (2,495) (2,403) (1,065)
Loss on sale of vessel 6,862 98 15,248 20,585
Vessel impairment loss 10,684 287,705 29,221 321,978
Amortization of deferred gain (19) (19) (75) (22)
Loss on debt extinguishment 123 - 2,375 974
Equity in income of investee 6 89 (126) (210)
Adjusted Net Income / (loss) (16,201)$ (24,475)$ (104,960)$ (101,599)$
Weighted average number of shares outstanding,
basic and diluted56,721,385 43,824,122 47,574,454 39,124,673
Adjusted Basic and Diluted Earnings / (Loss) Per
Share($0.29) ($0.56) ($2.21) ($2.60)
Voyage Revenues to Daily Time Charter Equivalent (“TCE”) Reconciliation
Fourth quarter
2016
Fourth quarter
2015
Year ended
December 31,
2016
Year ended
December 31,
2015
Voyage revenues 63,241 64,108 221,987 234,035
Less:
Voyage expenses (12,320) (20,567) (65,821) (72,877)
Amortization of fair value of
below/above market acquired time
charter agreements
- 516 254 9,540
Time Charter equivalent revenues 50,921 44,057 156,420 170,698
Available days for fleet 6,208 6,388 24,989 24,204
Daily Time Charter Equivalent Rate
("TCE") 8,202 6,897 6,260 7,052
(In thousands of U.S. Dollars, except as
otherwise stated)
23
Conference Call details:
Our management team will host a conference call to discuss our financial results on Thursday, February 23rd at 11 a.m., Eastern Time (ET).
Participants should dial into the call 10 minutes before the scheduled time using the following numbers: 1(866) 819-7111 (from the US), 0(800) 953-0329 (from the UK) or + (44) (0) 1452 542 301 (from outside the US). Please quote "Star Bulk."
A replay of the conference call will be available until March 2, 2017. The United States replay number is 1(866) 247-4222; from the UK 0(800) 953-1533; the standard international replay number is (+44) (0) 1452 550 000 and the access code required for the replay is: 3128607#.
Slides and audio webcast:
There will also be a simultaneous live webcast over the Internet, through the Star Bulk website (www.starbulk.com). Participants to the live webcast should register on the website approximately 10 minutes prior to the start of the webcast.
About Star Bulk
Star Bulk is a global shipping company providing worldwide seaborne transportation solutions in the dry bulk sector. Star Bulk's vessels transport major bulks, which include iron ore, coal and grain and minor bulks which include bauxite, fertilizers and steel products. Star Bulk was incorporated in the Marshall Islands on December 13, 2006 and maintains executive offices in Athens, Greece. Its common stock trades on the Nasdaq Global Select Market under the symbol “SBLK”. On a fully delivered basis, Star Bulk will have a fleet of 72 vessels, with an aggregate capacity of 8.1 million dwt, consisting of Newcastlemax, Capesize, Post Panamax, Kamsarmax, Panamax, Ultramax and Supramax vessels with carrying capacities between 52,055 dwt and 209,537 dwt. Our fleet currently includes 67 operating vessels and 5 newbuilding vessels under construction at a shipyard in China. All of the newbuilding vessels are expected to be delivered during 2017 and 2018. Additionally, the Company has one chartered-in Supramax vessel, under a time charter expiring in September 2017.
Forward-Looking Statements
Matters discussed in this press release may constitute forward-looking statements. The Private Securities Litigation Reform Act of 1995 provides safe harbor protections for forward-looking statements in order to encourage companies to provide prospective information about their business. Forward-looking statements include statements concerning plans, objectives, goals, strategies, future events or performance, and underlying assumptions and other statements, which are other than statements of historical facts.
The Company desires to take advantage of the safe harbor provisions of the Private Securities Litigation Reform Act of 1995 and is including this cautionary statement in connection with this safe harbor legislation. The words “believe,” “anticipate,” “intends,” “estimate,” “forecast,” “project,” “plan,” “potential,” “may,” “should,” “expect,” “pending” and similar expressions identify forward-looking statements.
The forward-looking statements in this press release are based upon various assumptions, many of which are based, in turn, upon further assumptions, including without limitation, examination by the Company’s management of historical operating trends, data contained in its records and other data available from third parties. Although the Company believes that these assumptions were reasonable when made, because these assumptions are inherently subject to significant uncertainties and contingencies which are difficult or impossible to predict and are beyond the Company’s control, the Company cannot assure you that it will achieve or accomplish these expectations, beliefs or projections.
In addition to these important factors, other important factors that, in the Company’s view, could cause actual results to differ materially from those discussed in the forward-looking statements include general dry bulk
24
shipping market conditions, including fluctuations in charterhire rates and vessel values, the strength of world economies the stability of Europe and the Euro, fluctuations in interest rates and foreign exchange rates, changes in demand in the dry bulk shipping industry, including the market for our vessels, changes in our operating expenses, including bunker prices, dry docking and insurance costs, changes in governmental rules and regulations or actions taken by regulatory authorities, potential liability from pending or future litigation, general domestic and international political conditions, potential disruption of shipping routes due to accidents or political events, the availability of financing and refinancing, our ability to meet requirements for additional capital and financing to complete our newbuilding program and grow our business, vessel breakdowns and instances of off‐hire, risks associated with vessel construction, potential exposure or loss from investment in derivative instruments, potential conflicts of interest involving our Chief Executive Officer, his family and other members of our senior management, and our ability to complete acquisition transactions as planned. Please see our filings with the Securities and Exchange Commission for a more complete discussion of these and other risks and uncertainties. The information set forth herein speaks only as of the date hereof, and the Company disclaims any intention or obligation to update any forward‐looking statements as a result of developments occurring after the date of this communication.
Contacts
Company:
Simos Spyrou, Christos Begleris
Co ‐ Chief Financial Officers
Star Bulk Carriers Corp.
c/o Star Bulk Management Inc.
40 Ag. Konstantinou Av.
Maroussi 15124
Athens, Greece
Email: [email protected]
www.starbulk.com
Investor Relations / Financial Media:
Nicolas Bornozis
President
Capital Link, Inc.
230 Park Avenue, Suite 1536
New York, NY 10169
Tel. (212) 661‐7566
E‐mail: [email protected]
www.capitallink.com