Embed Size (px)
Citation preview

0
STANDARDIZED EXPANDED NUTRITION SURVEY (SENS)
FINAL REPORT
Gorom Refugee Camp
South Sudan
Surveys conducted: 16-20 September 2019
1
TABLE OF CONTENTS ACRONYMS AND ABBREVIATIONS ............................................................................................................... 2
ACKNOWLEDGMENTS ...................................................................................................................................... 3
EXECUTIVE SUMMARY ...................................................................................................................................... 4
INTRODUCTION .................................................................................................................................................. 9
BACKGROUND ..................................................................................................................................................... 9
Food Security.................................................................................................................................................... 10
Health situation ............................................................................................................................................... 10
Nutrition Situation .......................................................................................................................................... 11
WASH Situation………………………………………………………………………………………………………………………12 SURVEY OBJECTIVES ...................................................................................................................................... 12
METHODOLOGY ............................................................................................................................................... 13
Survey population ............................................................................................................................................ 13
Sampling procedure for household questionnaire administration ............................................................ 13
Questionnaires ................................................................................................................................................. 13
Measurement methods ................................................................................................................................... 14
Case definitions and calculations .................................................................................................................. 15
Classification of public health problems and targets .................................................................................. 17
Training, coordination and supervision ........................................................................................................ 18
Data collection,entry and analysis ................................................................................................................ 18
RESULTS FROM GOROM ................................................................................................................................ 20
LIMITATIONS ..................................................................................................................................................... 30
DISCUSSION ....................................................................................................................................................... 31
RECOMMENDATIONS .................................................................................................................................... 34
APPENDIX 1 - NAMES OF CONTRIBUTORS ............................................................................................. 35
APPENDIX 2 - SUMMARY OF OVERALL QUALITY OF ANTHROPOMETRIC DATA ...................... 36
APPENDIX 3 – SURVEY QUESTIONNAIRES .............................................................................................. 37
APPENDIX 4 – EVENTS CALENDER ............................................................................................................. 47
APPENDIX 5 – MAP OF GOROM CENTRAL EQUITORIA CAMP ........................................................ 49
APPENDIX 6 - GOROM REFUGEE CAMP LOCATION IN SOUTH SUDAN………………………………..50

2
ACRONYMS AND ABBREVIATIONS
ACROSS Association of Christian Resource Organization Serving South Sudan ANC Ante Natal Care AWD Acute Watery Diarrhoea BSFP Blanket Supplementary Feeding Programme CDR Crude Death Rate CI Confidence Interval CMAM Community Management of Acute Malnutrition CRA Commission for Refugee Affairs CSB++ Corn-Soya Blend Plus Plus ENA Emergency Nutrition Assessment EPI Expanded Programme on Immunization Epi Info Name of CDC software for epidemiological investigations GAM Global Acute Malnutrition GFR General Food Ration GFD General Food Distribution HAZ Height-for-Age z-score Hb Haemoglobin HH Household HIS Health Information System IYCF Infant and Young Child Feeding KCAL Kilocalorie MAM Moderate Acute Malnutrition MOH Ministry of Health MUAC Middle Upper Arm circumference OTP Out-patient Therapeutic Programme ProGres UNHCR registration database for refugees SAM Severe Acute Malnutrition SC Stabilization Centre SD Standard Deviation SENS Standardised Expanded Nutrition Survey SFP Supplementary Feeding Programme SMART Standardized Monitoring & Assessment of Relief & Transitions TSFP Targeted Supplementary Feeding Program TFP Therapeutic Feeding Programme UNHCR United Nations High Commissioner for Refugees UNICEF United Nations Children’s Fund WASH Water, Sanitation, and Hygiene Promotion WAZ Weight-for-Age z-score WFH Weight-for-height WHZ Weight-for-Height z-score WFP World Food Programme WHO World Health Organization

3
ACKNOWLEDGMENTS
UNHCR and ACROSS commissioned and coordinated the survey. We gratefully acknowledge the important contributions made by so many thus making this survey possible.
Firstly, we would like to acknowledge the UNHCR Representation Office in Juba office for the operational support, the UNHCR Public Health Unit for leading and coordinating the planning, training and field work, the UNHCR Senior Management for general guidance and oversight.
Secondly, we would like to acknowledge the ACROSS team who were involved directly and indirectly in planning and executing the survey. WFP for co-facilitating the training and the data collection support supervision. CRA for facilitating access to the refugee camp. Special thanks go to Terry Theuri (UNHCR Nutrition and Food security officer) who coordinated the survey; to ACROSS health and nutrition team including Dr Robert Napoleon, Diana Wesley Anyango and Michael Olweny who ensured the survey teams, training and data collection logistics were in place and survey execution was up to standard; to Merlyn Chapfunga (WFP nutritionist) who assisted with training, survey supervision and data quality check; to Sebit Mustafa Sebit ( UNHCR Senior Public Health Associate ( irHIS) for working on the health data; to Dr Gebrewold Petros Yohannes for guidance and review of the report; and to Naser Mohmand ( UNHCR Senior Regional Nutrition and Food security Officer) for technical review of the SENS terms of references and report.
Finally, we sincerely thank the refugee population in Gorom camp who gave their time to participate and allowed us to measure their children and, most importantly, to the children themselves. A complete list of key individuals involved can be found at Appendix 1.
4
EXECUTIVE SUMMARY
UNHCR and ACROSS carried out the nutrition survey in Gorom refugee camp from 16 to 20 September 2019. The overall aim of this survey was to assess the general nutrition and health status of refugee population and formulate workable recommendations for appropriate nutritional and public health interventions. The survey was based on the UNHCR Standardized Expanded Nutrition Survey (SENS) guidelines for refugee populations (version 2, 2013) http://sens.unhcr.org/. Following four modules of SENS were used (1. anthropometric and health, 2. Anaemia, 3. IYCF, and 4. Food Security). Modules 5. Water Sanitation and Hygiene and 6. Mosquito net coverage were not carried out as access limitations required for module prioritization. The camp has a WASH monitoring system in place and no blanket mosquito net distribution was carried out within the year.
UNHCR population figures from ProGres were used to determine the total population and that of children 6-59 months for survey planning purposes. At the end of August 2019, the Gorom refugee population was 2347 individuals. 395 (16.8%) of these were children under five years.
An exhaustive survey was conducted in relation to children as the total population size of Gorom camp was below 2,500 people rendering sampling unnecessary following UNHCR SENS guideline. All children aged 6-59 months in the camp were surveyed.
A total of six survey teams composed of four members each (one team leader, one haemoglobin measurer, one anthropometric measurer/translator and one anthropometric/haemoglobin measurement assistant were included in each survey. A standardized training lasting five days, which included a standardization test was provided. Data collection lasted five days. The survey teams were supported by a team of 2 supervisors and 1 coordinator who roved between the teams duration the data collection.
Mobile phone questionnaires using Open Data Kit (ODK) android software was used for data collection for all the modules. Data validation was carried out daily by the survey coordinator, which allowed for daily feedback to the survey teams. Data analysis was carried out using ENA for SMART July 9th, 2015 version for anthropometric indices and Epi info version 7 for all the other data. Under the various forms of malnutrition, the survey results showed a prevalence of Global Acute Malnutrition (GAM) of 6.5% which is poor. In 2018 the GAM prevalence was 4% among children 6-59 months. The increase to 6.5% from the 4.0% in 2018 was not statistically significant (p>0.05) but indicates that the global acute malnutrition situation is on an upward trend. This was also the case for severe acute malnutrition. The prevalence of global stunting among children aged 6-59 months was 6.9% which is low. Total anaemia prevalence among children aged 6 to 59 months was 70.7% and among women of reproductive aged between 15-49 years (non-pregnant) was 58.5%. The prevalence of anaemia among both categories is very high as it is above the 40% level of public health significance (WHO classification). Analysis by age categories indicated that the prevalence of anaemia was higher among children aged 6-23 months. Under infant and young child feeding practices, the proportion of children aged 0-23 months that had timely initiation of breastfeeding within the first hour of delivery was 89.6%. The rate of exclusive breast feeding for the first six months of life was 84.6%. The proportion of children aged 6 to 8 months that were introduced to solid and semi-solid foods on time was 25%. 3.5% of the surveyed children aged 0-23 months were bottle fed and 4.4% received infant formula. The results above indicate continued positive gains in terms of breastfeeding practices. Appropriated practices around complementary feeding remain sub optimal indicating the need to continue strengthening the IYCF program to improve feeding practices. The household diet diversity score (HDDS) reported 4.8 out of 12 food groups. Over half of the refugees (56.7%) in Gorom refugee camp reported to have used negative coping strategies within the last month pre the survey to fill the food assistance gap. 17.9% of children had diarrhoea during the last two weeks prior to the SENS survey.

5
Maintenance of a comprehensive nutrition program, strengthening of preventative activities including the provision of adequate household food intake, appropriate caring practices with support and promotion of optimal IYCF practices, health and sanitation at household level are recommended to facilitate optimal nutrition. This to be accomplished through adequate food assistance, support, promotion and protection of infant and young child feeding practices, improved health services, adequate water and sanitation and the expansion of livelihood activities in addition to the treatment of malnourished persons.
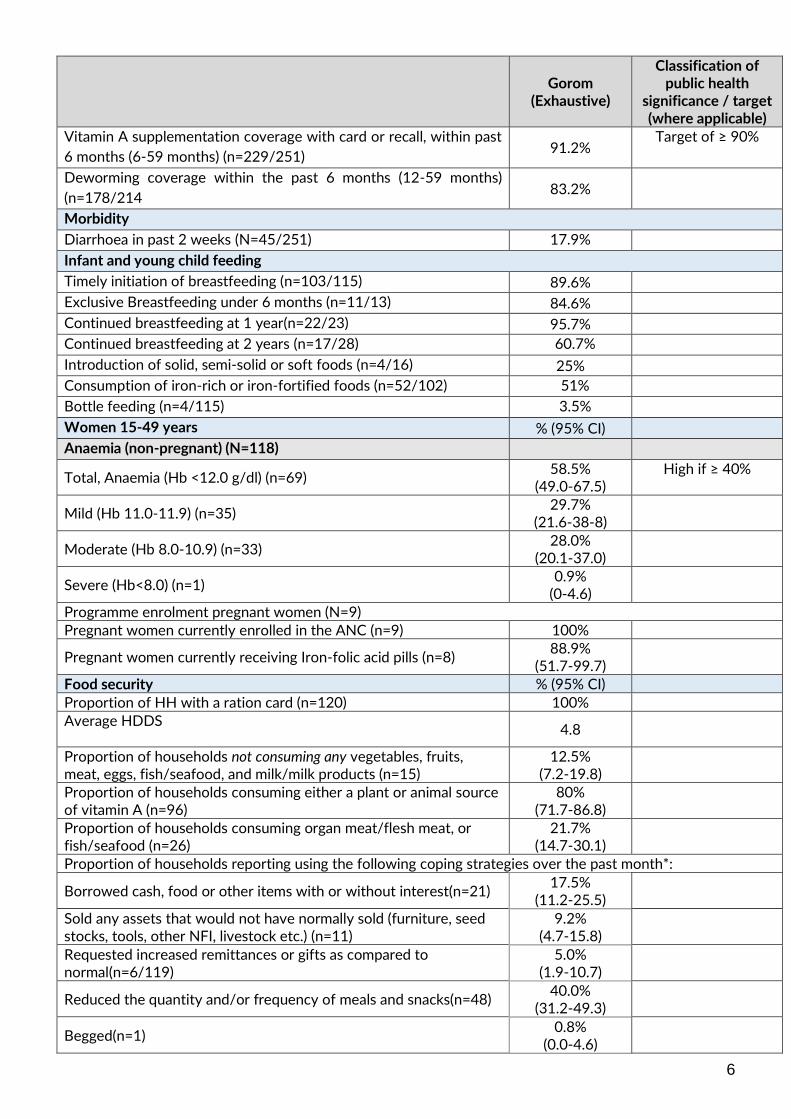
The summary results are as below Table 1: Summary of results
Gorom
(Exhaustive)
Classification of public health
significance / target (where applicable)
Children (6-59 months)
%
No. of children surveyed 251
Acute Malnutrition (N=248)
Global Acute Malnutrition (GAM) (n=16) 6.5 Critical if ≥ 15%
Moderate Acute Malnutrition (MAM) (n=12) 4.8
Severe Acute Malnutrition (SAM) (n=4) 1.6
Oedema 0
Stunting (N=246)
Total Stunting (n=17) 6.9 Critical if ≥ 40%
Severe Stunting (n=5) 2.0
Mid Upper Arm Circumference (MUAC) (N=249)
Prevalence of MUAC <125mm or oedema (n=1) 2.8
Prevalence of MUAC < 125 mm and >= 115 mm, no oedema (n=0) 1.6
Prevalence of MUAC < 115mm and/or oedema (n=1) 1.2
Anaemia (6-59 months) (N=249)
Total Anaemia (Hb <11 g/dl) (n=176) 70.7 High if ≥ 40%
Mild (Hb 10-10.9) (n=89) 35.7
Moderate (Hb 7-9.9) (n=83) 33.3
Severe (Hb<7.0) (n=4) 1.6
Anaemia (6-23 months) (N=101)
Total Anaemia (Hb <11 g/dl) (n=83) 82.2
Mild (Hb 10-10.9) (n=39) 38.6
Moderate (Hb 7-9.9) (n=43) 42.6
Severe (Hb<7.0) (n=1) 1.0
Programme coverage (6-59 months)
Outpatient Therapeutic Care (based on all admission criteria WHZ
and MUAC) (n=0/6)
0%
Target of ≥ 90%
Targeted Supplementary Feeding Program (TSFP) (based on all
admission criteria WHZ and MUAC) (n=3/13)
23.1%
Target of ≥ 90%
Currently receiving CSB++ (6-23 months) (n=21/102) 20.6%
Measles vaccination with card (9-59 months) (n=149/235) 63.4%
Measles vaccination with card or recall (9-59 months) (n=226/235) 96.2% Target of ≥ 95%
Vitamin A supplementation coverage with card, within past 6 months
(6-59 months) (n=39/251)
15.5%
6
Gorom
(Exhaustive)
Classification of public health
significance / target (where applicable)
Vitamin A supplementation coverage with card or recall, within past
6 months (6-59 months) (n=229/251) 91.2%
Target of ≥ 90%
Deworming coverage within the past 6 months (12-59 months)
(n=178/214 83.2%
Morbidity
Diarrhoea in past 2 weeks (N=45/251) 17.9%
Infant and young child feeding
Timely initiation of breastfeeding (n=103/115) 89.6%
Exclusive Breastfeeding under 6 months (n=11/13) 84.6%
Continued breastfeeding at 1 year(n=22/23) 95.7%
Continued breastfeeding at 2 years (n=17/28) 60.7%
Introduction of solid, semi-solid or soft foods (n=4/16) 25%
Consumption of iron-rich or iron-fortified foods (n=52/102) 51%
Bottle feeding (n=4/115) 3.5%
Women 15-49 years % (95% CI)
Anaemia (non-pregnant) (N=118)
Total, Anaemia (Hb <12.0 g/dl) (n=69) 58.5%
(49.0-67.5) High if ≥ 40%
Mild (Hb 11.0-11.9) (n=35) 29.7%
(21.6-38-8)
Moderate (Hb 8.0-10.9) (n=33) 28.0%
(20.1-37.0)
Severe (Hb<8.0) (n=1) 0.9%
(0-4.6)
Programme enrolment pregnant women (N=9) Pregnant women currently enrolled in the ANC (n=9) 100%
Pregnant women currently receiving Iron-folic acid pills (n=8) 88.9%
(51.7-99.7)
Food security % (95% CI)
Proportion of HH with a ration card (n=120) 100% Average HDDS
4.8
Proportion of households not consuming any vegetables, fruits, meat, eggs, fish/seafood, and milk/milk products (n=15)
12.5% (7.2-19.8)
Proportion of households consuming either a plant or animal source of vitamin A (n=96)
80% (71.7-86.8)
Proportion of households consuming organ meat/flesh meat, or fish/seafood (n=26)
21.7% (14.7-30.1)
Proportion of households reporting using the following coping strategies over the past month*:
Borrowed cash, food or other items with or without interest(n=21) 17.5%
(11.2-25.5)
Sold any assets that would not have normally sold (furniture, seed stocks, tools, other NFI, livestock etc.) (n=11)
9.2% (4.7-15.8)
Requested increased remittances or gifts as compared to normal(n=6/119)
5.0% (1.9-10.7)
Reduced the quantity and/or frequency of meals and snacks(n=48) 40.0%
(31.2-49.3)
Begged(n=1) 0.8%
(0.0-4.6)

7
Gorom
(Exhaustive)
Classification of public health
significance / target (where applicable)
Engaged in potentially risky or harmful activities (n=5) 4.2%
(1.4-9.5)
Proportion of households reporting using none of the coping strategies over the past month (n=52)
43.3% (34.3-53.0)
* The total is over 100% as households used several negative coping strategies.
Interpretation of results: Table 2: WHO prevalence thresholds for wasting in children aged 6-59 months (low weight-for- height)
Previous prevalence ranges
Label New prevalence ranges 2018
Label
- - <2.5 Very low <5% Acceptable 2.5 - < 5 Low 5 – 9% Poor 5 - <10 Medium
10 – 14% Serious 10 - <15 High >15% Critical ≥ 15 Very high
Table 3: WHO prevalence thresholds for stunting in children aged 6-59 months (low height-for-age)
Previous prevalence ranges
Label New prevalence ranges 2018
Label
- - <2.5 Very low <20% Acceptable 2.5 - < 10 Low
20 – 30% Poor 10 - < 20 Medium 30 – 39% Serious 20 - < 30 High >40% Critical ≥ 30 Very high
Table 4: WHO classification of public health significance for the prevalence of Anamia (children 6- 59month-old and non-pregnant Women 15-49 years old)2
Prevalence %
High Medium Low
Anaemia ≥40 20-39 5-19 Source: WHO (2000)
• The overall nutrition situation is classified as poor as the GAM prevalence is 6.5%. In 2018 the GAM prevalence was 4% among children 6-59 months classified as acceptable/low. The increase to 6.5% from the 4.0% in 2018 was not statistically significant (p>0.05) but indicates that the global acute malnutrition situation is on an upward trend. The prevalence of severe acute malnutrition increased from 0% in 2018 to 1.6% in 2019 which is a concern and need to be address.
• The 6.9% prevalence of global stunting is low according to WHO standard but should be interpreted with caution due to the age estimation limitation. 20% of the children 6-59 months had no reliable age documentation. Stunting prevalence improved compared to 2018. In 2018 stunting among children 6-59 months was 17.1%.
• The enrolment coverage for OTP and TSFP was below expected standard using both the MUAC and WHZ scores criterion. Most of the cases identified with acute malnutrition based on the WHZ scores (81.2%) did not meet the MUAC cut off <125mm. This indicates the need to strengthen case finding at all points on contact at the community and facility levels. The later to identify cases that are acutely malnourished based on WHZ scores.
• The coverage of measles vaccination and vitamin A supplementation met the target coverage of

8
≥95% and ≥90% respectively. This improved compared to 2018. Deworming coverage was 83.2%
• 17.9% of children 6-59 months were reported to have had diarrhoea in the last two weeks prior to the survey indicating a morbidity caseload requiring continued health, water and sanitation services provision. In 2018 SENS around 19.7% of children were reported to have had diarrhoea in the last two weeks of survey.
• Total anaemia prevalence in children 6 to 59 months was 70.7% (with 1.6% being severe anaemia). The prevalence among women aged 15-49 years (non-pregnant) was 58.5% (with 0.9% being severe anaemia). The prevalence of anaemia among both categories is very high as it is above the 40% level of public health significance (WHO classification)2. Analysis by age categories indicated that the prevalence of anaemia was higher among children aged 6-23 months. The high prevalence of anaemia among children aged 6-59 months and non-pregnant women aged 15-49 years remains a key concern in the camps. It requires to be addressed through multi-sectoral preventive and curative interventions.
• The rate of exclusive breastfeeding was 84.6%, introduction of solid, semi-solid or soft foods only 25%, and consumption of iron-rich or iron-fortified foods 51%. The introduction of solid, semi-solid or soft foods and consumption of iron-rich or iron-fortified foods of remain sub optimal indicating the need for continued IYCF program strengthening to improve feeding practices.
• Under food security: 100% of the HHs had a ration card; the household diet diversity score was 4.8
out of 12 food groups; over half of the households reported using one or more of the negative coping strategies (borrowed cash or food 17.5%, sold assets 9.2%, reduced quantity or frequency of meals 40%, begged 0.8%, and engaged in potential risky or harmful activities 4.2%. Only 43.3% of the refugees in Gorom reported not using any of the negative coping strategies to fill the food assistance gap (a 70% of the recommended 2100 kcal general food ration is provided per person per day). This group is likely to be benefiting from the complementary livelihood interventions in place. This however needs to be scaled up to increase the proportion to cover majority of the population.
Recommendations Nutrition related
• Continue the implementation of the comprehensive CMAM program providing both therapeutic and
supplementary feeding programs to facilitate the rehabilitation of identified acute malnourished
children, pregnant and lactating women, people living with HIV/AIDS and TB patients on treatment.
This to include active case finding and community mobilization. (UNHCR, UNICEF, WFP and ACROSS).
• Ensure all community screened and referred 6-59 months children identified with a MUAC less than
125mm get enrolled into the community-based management of acute malnutrition programs through
community outreach follow up at household level (ACROSS)
• Ensure monthly blanket supplementary feeding programme for children 6-23 months, pregnant and
lactating women using a fortified blended food or lipid-based supplement to prevent malnutrition and
to cover the nutrient gap these vulnerable groups have considering a predominant grain based general
food diet (UNHCR, WFP and ACROSS)
• Conduct the two step MUAC and WHZ scores (for children with MUAC at risk) screening at all the
contact points in the health facility including the EPI, triage and the BSFP sites established to ensure
both high MUAC and WHZ score coverage (ACROSS)
• Continue strengthening the capacity of established nutrition facility in terms of staff training to facilitate
quality provision of both curative and preventative components of nutrition (UNHCR, WFP, UNICEF
and ACROSS)
• Expand and strengthen preventative nutrition components including Infant and Young Child Feeding
(IYCF)-using the IYCF multisectoral framework for action approach and promote optimal maternal
nutrition to stop malnutrition from occurring in the first place. (UNHCR, WFP, UNICEF and ACROSS)

9
• Continue implementing the micronutrient reduction strategy to curb the high anaemia prevalence.
(UNHCR, WFP, UNICEF and ACROSS)
• Conduct follow up quarterly mass MUAC screening targeting children 6-59 months and pregnant and
lactating women to monitor the evolution of the nutrition situation at the community level. (ACROSS)
• Ensure regular supervision and monitoring, quarterly joint monitoring and yearly program performance
evaluations in all camps to assess performance progress and formulate recommendations for any
identified gaps. (UNHCR, WFP, UNICEF and ACROSS).
• Undertake a follow up annual joint nutrition survey to analyse trends and facilitate program impact
evaluation in 2020. (UNHCR, ACROSS, WFP and UNICEF).
Food security related
• Provision of food assistance providing the minimum recommended food basket including fortified foods
(2100kcal/person/day). (UNHCR, ACROSS and WFP).
• Continue the routine joint monthly food basket monitoring on site and ensure the inclusion of the
refugee camp in the post distribution monitoring at the household level to ensure that refugees receive
their entitlement (UNHCR, ACROSS and WFP).
• Expand the coverage of sustainable food security and livelihood solutions to allow diet diversity and to
complement the general food distribution (UNHCR, WFP and ACROSS).
Health related
• Maintain and strengthen the provision of comprehensive primary health programme for refugee and
host populations. (UNHCR and ACROSS)
• UNICEF, ACROSS and UNHCR to ensure the EPI program, Vitamin A supplementation, and de-worming
campaigns and routine program is maintained to ensure coverage is kept at acceptable standards.
• Adequate potable water provision to be maintained in 2020. In addition to this ensure hygiene promotion continues and improve latrine coverage to reduce infections and morbidities like diarrhea. (UNHCR and ACROSS)
INTRODUCTION This report presents the results of nutrition survey conducted in Gorom refugee camp from 16 to 20 September 2019. This report is divided into the following sections:
• Background: This section sets out background information related to the health, nutrition and food security and WASH situation for Gorom camp;
• Methodology; • Results: presents the findings following four modules of SENS were used (1. anthropometric and
health, 2. Anaemia, 3. IYCF, and 4. Food Security). Modules 5. Water Sanitation and Hygiene and 6. Mosquito net coverage were not carried out as access limitations required for module prioritization;
• Discussion; and
• Recommendations. BACKGROUND
Gorom Refugee camp is located 24 km from Juba city. It has an estimated refugee population of 23471
who are mainly of Ethiopian nationality. The Anyuak refugees from Ethiopia have been in Gorom
settlement since 2011.
Several humanitarian organisations work in Gorom refugee camp to ensure delivery of essential services
and supplies to the refugees. Key partners in terms of the provision of the health, nutrition and food
1 UNHCR ProGres August 2019 population

10
assistance services include UNHCR, WFP, UNICEF and ACROSS. UNHCR is mainly involved in providing
funding for implementation of various services, coordinating, technical support, monitoring and evaluation
of the services offered to the refugees through the partners. WFP’s main role is to ensure that the refugee’s
food security is adequately addressed through the provision of the general food ration (GFR) once per
month. UNICEF in collaboration with UNHCR provides support to the nutrition programme. ACROSS
implements the health, nutrition and food assistance programme.
Results from the first rapid nutrition survey carried out at the end of the 2016 showed the prevalence of global acute malnutrition (GAM) prevalence of 6.6%. This indicated a poor nutrition situation based on the WHO classification (acute malnutrition between 5-9% is considered poor). Recommendations from the survey highlighted the need to set up a comprehensive nutrition program to prevent malnutrition and rehabilitate all identified malnourished cases. In 2017 and 2018 the GAM prevalence was 5% and 4% respectively indicating reduction in wasting trend. Stunting remained the same in 2017 and 2018 at approximately 17%. Despite the acceptable wasting and stunting levels anaemia levels remained critical in both 2017 and 2018. The need to build on the nutrition efforts from 2017 was highlighted. A follow up survey was also noted as necessary to evaluate the impact of initiated and on-going interventions to ensure provision of optimal health and nutritional care for the refugee population. Food security Refugees in the Gorom camp continue to mainly depend on the WFP provided (GFR) with limited access to additional sources of food/income. The 30% reduced General Food Distribution (GFD) with removal of fortified food (CSB+) provided to all registered refugees remained the same from January to September 2019. It consisted of 350g sorghum, 33g of beans, 20ml of vegetable oil and 3.3g salt. This cumulates to approximately 406 grams/person/day providing 1475 kilocalories/person/day. This provided 70.2% of the recommended food ration of 2100 kcal/person/day). From the NutVal analysis, the reduced ration has an inadequate micronutrient profile. The ration does not provide a fortified flour option like CSB+. It provided only 54% of the daily iron requirements. Sorghum, which contributed the bulk of the iron (non-heme iron form) in the food is high in phytates, anti-nutrients that inhibit iron absorption in the body. Vitamin C, a nutrient that plays a key role in the facilitating iron absorption was also barely available from the GFD ration. The ration provided only 3% of vitamin C. In addition, vitamin C is very easily destroyed when cooking at high temperatures. Other key micronutrients including Vitamin A, folate and Vitamin B12 were also insufficient as the ration provided 33%, 60% and 0% of these respectively. Ways to fill the nutrient gap should thus continue to be explored to avert the consequences. See breakdown below showing the monthly ration provision Table 5: General food ration provision by month – Gorom refugee camp, Central Equatoria, 2019
Ration provided in g/p/d Recommended Jan Feb Mar Apr May Jun Jul Aug Sep
Cereal 500g 350 350 350 350 350 350 350 350 350
Pulses 50g 33.3 33.3 33.3 33.3 33.3 33.3 33.3 33.3 33.3
Vegetable oil 30g 20 20 20 20 20 20 20 20 20
Salt 5g 3.3 3.3 3.3 3.3 3.3 3.3 3.3 3.3 3.3
CSB+ 50g 0
0 0 0 0 0 0 0
Kcal 2100 1475 1475 1475 1475 1475 1475 1475 1475 1475
% of
recommended
met
70.2 70.2 70.2 70.2 70.2 70.2 70.2 70.2 70.2
The use of the Global Distribution Tool (GDT) for food distribution was rolled out in May 2019 allowing for better accountability. Following this cash for milling was rolled out in July 2019. SSP 305 and SSP 399 per person per month was provided to assist with milling in July and August 2019 respectively.

11
Health situation Gorom refugee camp has one Primary Health Care Centre. The overall crude mortality rate for Gorom camp from the UNHCR health information system (January to September 2019) was 0.19/10000/day while under-five mortality rate was 0.47/10000/day, which was below the emergency threshold of <1 and <2 respectively.2 This indicates a stable population. The main causes of illness in 2019 were malaria, respiratory tract infections, skin diseases, eye diseases, intestinal worms and diarrhoea. Figure 1: Under-five proportional morbidity from January-September 2019; Gorom, Central Equatoria camps (UNHCR iRHIS)
Nutrition Situation Nutrition services and activities in the camp at the time of the survey included:
• Targeted Supplementary Feeding Programmes (TSFP) for moderately acute malnourished 6-59 months using PlumpySup.
• Outpatient therapeutic feeding programmes (OTP) for severely acute malnourished children. • Blanket Supplementary Feeding Program (BSFP) using CSB++ targeting children 6 to 23 months
and Pregnant and Lactating Women (PLW). Both children and PLW receive 200g/person/day of CSB++.
• Infant and young child feeding support and promotion programme. At the facility level this is integrated into the primary health care components i.e. Outpatient Department (OPD); Expanded Programme for Immunisation (EPI); Ante Natal Care (ANC), Post-Natal Care (PNC) Maternity and Nutrition. At the community level, community structures are used and include Community Health Promoters (CHPs), Care Groups (CG) and Mothers Support Group (MSGs).
• MUAC screening of children 6-59 months at the triage area of the PHCC. MUAC screening of children aged 6-59 months and Pregnant and Lactating Women (PLW) at health care facilities triage, nutrition centres. At the community level this includes active case finding on daily basis by CHPs and quarterly mass MUAC screening.
Any severe acute malnourished children with medical complications requiring stabilisation care in Gorom would be referred to Juba Al-sabah hospital. From January to September 2019 there were 49 children 6-59 admissions of which 6 were admitted to the Outpatient Therapeutic Program (OTP) and 43 in the Targeted Supplementary Feeding Program (TSFP).
2 UNHCR irHIS
48%
22%
7%
2%4%
3%
14%
Malaria
RTI
Skin disease
Intestinal worms
Diarhoea
Eye disease
Others

12
There were no SC cases reported within the reporting period. At the end of September 2019 there were 19 children 6-59 months enrolled in both the OTP and TSFP program. PLW admitted to the TSFP program from January to September 2019 were 21. There were an additional 49 acute malnourished children and 17 PLW from the host community. The number of admissions (children) in 2019 increased compared to 2018 by 19.5%. There was no pipeline break for ready to use therapeutic and supplementary foods. BSFP was provided in January to May and July. The average coverage for these months was 92.8% for the children (6-23months) and 72% for the PLWs. There were pipeline breaks in June, August and September 2019. Figure 2: Admissions to the selective feeding program (OTP & TSFP) January- September 2019 (Health Information System)
WASH situation
Access to water in Gorom in 2019 was maintained through 9 boreholes; 6 within the refugee camp and 3 in the surrounding host community. Of the 6 pumps in the refugee camp, 2 are solarized and 4 are India Mark II hand pumps. The camp has a 53,000 liters storage PVC tanks capacity. Routine water quality management (testing and chlorination of boreholes) and maintenance was carried out regularly during the year. Gorom has 14 trained pump mechanics and 6 water user management committees that facilitate the maintenance at the community level. An average of 20 litres per person per day was available in 20193 which meets the minimum SPHERE standard but is lower than the UNHCR standard of ≥20 liters per person per day. The population in Gorom will continue to require the water to be maintained within the minimum standards. As of end of September 2019, Gorom had 160 household functional latrines and 7 public communal institutional latrines serving a population of 2368 individuals (837 households). There are 4 hygiene promoters. The overall average number of persons/hygiene promoter ratio was 592 in Gorom. Soap is distributed on a monthly basis at 250g per person per month. This does not meet the 500g per person per month standard. SURVEY OBJECTIVES Specific primary objectives of the survey
a. To measure the prevalence of acute malnutrition among children 6-59 months.
b. To measure the prevalence of stunting among children 6-59 months.
c. To determine the coverage of measles vaccination among children 9-59 months.
d. To determine the coverage of vitamin A supplementation in the last six months among
children 6-59 months.
3 Water monitoring report_ACROSS WASH report
13
e. To determine the coverage of de-worming in the last six months among children 12-59
months
f. To determine the two-week period prevalence of diarrhoea among children 6-59 months.
g. To measure the prevalence of anaemia among children 6-59 months and women of
reproductive aged 15-49 years (non-pregnant).
h. To investigate IYCF practices among children 0-23 months.
i. To determine the coverage of ration cards and the duration the GFD ration lasts for recipient
households.
j. To determine the extent to which negative coping strategies are used by households.
k. To assess household dietary diversity.
l. To establish workable recommendations on actions to be taken to address the situation.
Secondary objectives:
a. To determine the coverage of of targeted supplementary and therapeutic feeding
programmes for children 6-59 months.
b. To determine enrolment into Antenatal Care clinic and coverage of iron-folic acid
supplementation in pregnant women.
METHODOLOGY Survey population
The refugee population in Gorom at the end of August 2019 was 2,347 individuals (832 households). 395 (16.8%) of these were children under five years.4
Sampling procedure: household questionnaire administration An exhaustive survey was conducted as the total refugee population size of Gorom camp was below 2,500 people rendering sampling unnecessary. All children 6-59 months/ (0-23 months for IYCF) in the camp were surveyed. All the households were included for the anthropometry, anaemia and IYCF modules. For the women questionnaire and the food security modules, half of the households were sampled. See Table 6 below with the details.
Household target for Anthropometry and Health module (ENA for SMART)
832 (All)
Household targeted for children Anaemia module (UNHCR SENS guidelines)
832 (All)
Households target for IYCF module (UNHCR SENS Guidelines) 832 (All) Household target for women Anaemia module (UNHCR SENS guidelines)
416 (half)
Household target for Food Security module (UNHCR SENS Guidelines)
416 (half)
The surveys were undertaken by six teams composed of four members each (one team leader, one haemoglobin measurer, one anthropometric measurer/translator and one anthropometric/haemoglobin measurement assistant). Each team was allocated the villages to survey. Village locations and boundaries was discussed during the training to ensure all teams knew where to go. If an individual or an entire household was absent the teams were instructed to return to the household or
4 UNHCR ProGres August 2019

14
revisit the absent individual on the same or the next survey day. If they were unsuccessful after this, the individual or the household was recorded as absent and they were not replaced with another individual. If the individual or an entire household refused to participate then it was considered a refusal and the individual or the household were not replaced with another. If a selected child was living with a disability or a physical deformity preventing certain anthropometric measurements the child was still included in the assessment of the other indicators If it was determined that a selected household did not have any eligible children, the other relevant questionnaires were administered to the household (anaemia measurement for women and food security) Questionnaires The paper version of the questionnaires is attached under Appendix 3 The questionnaires were prepared in English language and administered in the local language with the help of the enumerators that spoke the local language (Anyuak). The questionnaires were pre-tested before the survey. Four module questionnaires from SENS were designed to provide information on the relevant indicators of the different target groups as indicated in the survey objectives. The four-module questionnaire covered the following areas and the following measurements: Children 6-59 months- This included questions and measurements of children aged 6-59 months. Information was collected on anthropometric status, oedema, and enrolment in selective feeding programmes, immunisation (measles), vitamin A supplementation and morbidity from diarrhoea in past two weeks before the survey and haemoglobin status. Infant 0-23 months- This included question on infant and young child feeding for children aged 0- 23 months. Women 15-49 years- This included questions and measurements of women aged 15 – 49 years. Information was collected on women’s pregnancy status, coverage of iron-folic acid pills and ANC attendance for pregnant women, and haemoglobin status for non-pregnant women. Food Security- This included questions on access and use of the GFD ration, negative coping mechanisms used by household members and household dietary diversity.
Measurement methods
Household-level indicators Food security: The questionnaire used was from UNHCR’s Standardized Expanded Nutrition Survey (SENS) Guidelines for Refugee Populations Version 2 (2013). Individual-level indicators Sex of children: gender was recorded as male or female. Birth date or age in months for children 0-59 months: the exact date of birth (day, month, and year) was recorded from either an EPI card, child health card or birth notification if available. If no reliable proof of age was available, age was estimated in months using a local event calendar and recorded in months on the questionnaire/Phone. If the child’s age could not be determined by using a local events calendar or by probing, the child’s length/height was used for inclusion; the child had to measure between 65 cm and 110 cm. Age of women 15-49 years: Reported age was recorded in years. Weight of children 6-59 months: measurements were taken to the closest 100 grams using an electronic scale

15
(SECA scale). All children were weighed without clothes. The double-weighing technique was used to weigh young children unable to stand on their own or unable to understand instructions not to move while on the scale. Height/Length of children 6-59 months: children’s height or length was taken to the closest millimetre using a wooden height board (Shorr Productions). Height was used to decide on whether a child should be measured lying down (length) or standing up (height). Children less than 87cm were measured lying down, while those greater than or equal to 87cm were measured standing up. Oedema in children 6-59 months: bilateral oedema was assessed by applying gentle thumb pressure on to the tops of both feet of the child for a period of three seconds and thereafter observing for the presence or absence of an indent. MUAC of children 6-59 months: MUAC was measured at the mid-point of the left upper arm between the elbow and the shoulder and taken to the closest millimetre using a standard tape. MUAC was recorded in millimetres. Child enrolment in selective feeding programme for children 6-59 months: selective feeding programme coverage was assessed for the outpatient therapeutic programme and for the supplementary feeding programme. This was verified by card or by showing images of the products given at the different programs Measles vaccination in children 6-59 months: measles vaccination was assessed by checking for the measles vaccine on the EPI card if available or by asking the caregiver to recall if no EPI card was available. For ease of data collection, results were recorded on all children but were only analysed for children aged 9-59 months
Vitamin A supplementation in last 6 months in children 6-59 months: whether the child received a vitamin A capsule over the past six months was recorded from the EPI card or health card if available or by asking the caregiver to recall if no card is available. A vitamin A capsule image was shown to the caregiver when asked to recall. Deworming in last 6 months in children 12-59 months: whether the child received a deworming tablet over the past six months was recorded by asking the caregiver to recall if information was not available on the EPI card. A deworming tablet sample was shown to the caregiver when asked to recall. Haemoglobin concentration in children 6-59 months and women 15-49 years: Hb concentration was taken from a capillary blood sample from the fingertip and recorded to the closest gram per decilitre by using the portable HemoCue Hb 301 Analyser (HemoCue, Sweden). If severe anaemia was detected, the child or the woman was referred for treatment immediately. Diarrhoea in last 2 weeks in children 6-59 months: an episode of diarrhoea is defined as three loose stools or more in 24 hours. Caregivers were asked if their child had suffered episodes of diarrhoea in the past two weeks prior to the survey. ANC enrolment and iron and folic acid pills coverage: if the surveyed woman was pregnant, it was assessed whether she was enrolled in the ANC programme and was receiving iron-folic acid pills. An iron-folic acid pill image was shown to the pregnant woman when asked to recall. Infant and young child feeding practices in children 0-23 months: infant and young child feeding practices was assessed based on UNHCR Standardized Expanded Nutrition Survey (SENS) Guidelines for Refugee Populations version 2 (2013). Referrals: Children aged 6-59 months were referred to health centre/post for treatment when MUAC was < 12.5 cm, WHZ <-2 or oedema was present.
Case definitions and calculations

16
Malnutrition in children 6-59 months: Acute malnutrition was defined using weight-for-height index values or the presence of oedema and classified as show in the table below. Main results are reported after analysis using the WHO 2006 Growth Standards. Table 7: Definitions of acute malnutrition using weight-for-height and/or oedema in children 6–59 months
Categories of acute malnutrition Z-scores (WHO Growth Standards 2006)
Bilateral oedema
Global acute malnutrition < -2 z-scores Yes/No
Moderate acute malnutrition < -2 z-scores and ≥ -3 z-scores No
Severe acute malnutrition > -3 z-scores Yes
< -3 z-scores Yes/No
Stunting, also known as chronic malnutrition, was defined using height-for-age index values and was classified as severe or moderate based on the cut-offs shown below. Main results are reported according to the WHO Growth Standards 2006. Table 8: Definitions of stunting using height-for-age in children 6–59 months
Categories of stunting Z-scores (WHO Growth Standards 2006)
Stunting <-2 z-scores
Moderate stunting <-2 z-score and >=-3 z-score
Severe stunting <-3 z-scores
Underweight was defined using the weight-for-age index values and was classified as severe or moderate based on the following cut-offs. Main results are reported according to the WHO Growth Standards 2006. Table 9: Definitions of underweight using weight-for-age in children 6–59 months
Categories of underweight Z-scores (WHO Growth Standards 2006)
Underweight <-2 z-scores
Moderate underweight <-2 z-scores and >=-3 z-scores
Severe underweight <-3 z-scores
Mid Upper Arm Circumference (MUAC) values were used to define malnutrition according to the following cut-offs in children 6-59 months:
Table 10: MUAC malnutrition cut-offs in children 6-59 months
Categories of MUAC values
<125 mm
≥ 115 mm and <125 mm
< 115 mm
Child enrolment in selective feeding programme for children 6-59 months: Feeding programme coverage is estimated during the nutrition survey using the direct method as follows (reference: Emergency Nutrition Assessment: Guidelines for field workers. (Save the Children 2004): Coverage of SFP programme (%) =
100 x No. of surveyed children with MAM according to SFP criteria who reported being registered in SFP
No. of surveyed children with MAM according to SFP admission criteria
Coverage of TFP programme (%) = 100 x
No. of surveyed children with SAM according to TFP criteria who reported being registered in TFP No. of surveyed children with SAM according to TFP admission criteria

17
Infant and young child feeding practices in children 0-23 months: Infant and young child feeding practices were assessed based on the UNHCR SENS IYCF module (Version 2 (2013) that is based on WHO recommendations (WHO, 2007 as follows): Timely initiation of breastfeeding in children aged 0-23 months: Proportion of children 0-23 months who were put to the breast within one hour of birth Children 0-23 months who were put to the breast within one hour of birth Children 0-23 months of age Exclusive breastfeeding under 6 months: Proportion of infants 0–5 months of age who are fed exclusively with breast milk: (including expressed breast milk or from a wet nurse, ORS, drops or syrups (vitamins, breastfeeding minerals, medicines) Infants 0–5 months of age who received only breast milk during the previous day Infants 0–5 months of age Continued breastfeeding at 1 year: Proportion of children 12–15 months of age who are fed breast milk Children 12–15 months of age who received breast milk during the previous day Children 12–15 months of age Introduction of solid, semi-solid or soft foods: Proportion of infants 6–8 months of age who receive solid, semi-solid or soft foods Infants 6–8 months of age who received solid, semi-solid or soft foods during the previous day Infants 6–8 months of age Children ever breastfed: Proportion of children born in the last 24 months who were ever breastfed Children born in the last 24 months who were ever breastfed Children born in the last 24 months Continued breastfeeding at 2 years:
Proportion of children 20–23 months of age who are fed breast milk Children 20–23 months of age who received breast milk during the previous day Children 20–23 months of age Consumption of iron rich or iron fortified foods in children aged 6-23 months Proportion of children 6–23 months of age who receive an iron-rich or iron-fortified food that is specially designed for infants and young children, or that is fortified in the home.
Children 6–23 months of age who received an iron-rich food or a food that was specially designed for infants and young children and was fortified with iron, or a food that was
fortified in the home with a product that included iron during the previous day Children 6–23 months of age
Bottle feeding: Proportion of children 0-23 months of age who are fed with a bottle Children 0–23 months of age who were fed with a bottle during the previous day Children 0–23 months of age Anaemia in children 6-59 months and women of reproductive age: Anaemia is classified according to the following cut-offs in children 6-59 months and non-pregnant women of reproductive age. Anaemia cut-offs for pregnant women should be adjusted depending on the stage of pregnancy (gestational age). Pregnant women are not included in routine UNHCR nutrition surveys for the assessment of anaemia due sample

18
size issues (usually a small number of pregnant women is found) as well as the difficulties in assessing gestational age in pregnant women. Table 11: Definition of anaemia (WHO 2000)
Age/Sex groups Categories of Anaemia (Hb g/dL)
Total Mild Moderate Severe
Children 6 - 59 months <11.0 10.9 - 10.0 9.9 - 7.0 < 7.0
Non-pregnant adult females 15-49 years
<12.0 11.9 - 11.0 10.9 - 8.0 < 8.0
Classification of public health problems and targets
Anthropometric data: UNHCR’s target for the prevalence of global acute malnutrition (GAM) for children 6-59 months of age by camp, country and region is < 10% and the target for the prevalence of severe acute malnutrition (SAM) is <2%. The table below shows the classification of public health significance of the anthropometric results for children under-5 years of age according to WHO: Table 12: Classification of public health significance for children under 5 years of age 5
Prevalence % Very High High Medium Low Very low
Low weight-for-
height
≥15 10-<15 5-10 2.5-<5 <2.5
Low height-for-age6 ≥30 20-<30 10-<20 2.5-<10 <2.5
Label Critical Serious Poor Acceptable
Low weight-for-age7 ≥30 20-29 10-19 <10
Selective feeding programmes:
UNHCR Strategic Plan for Nutrition and Food Security 2008-2012 includes the following indicators. The table below shows the targeted performance indicators for malnutrition treatment programmes according to UNHCR Strategic Plan for Nutrition and Food Security 2008-2012 (same as Sphere Standards). Table 13: Performance indicators for selective feeding programmes (UNHCR Strategic Plan for Nutrition and Food Security 2008-2012) *
Recovery Case fatality
Defaulter rate
Coverage
Rural areas Urban areas Camps
SFP >75% <3% <15% >50% >70% >90%
TFP >75% <10% <15% >50% >70% >90%
* Also meet SPHERE standards for performance
Measles vaccination coverage: UNHCR recommends target coverage of >95% (same as Sphere Standards). Vitamin A supplementation coverage: UNHCR Strategic Plan for Nutrition and Food Security (2008-2012) states that the target for vitamin A supplementation coverage for children aged 6-59 months by camp, country and region should be >90%.
Anaemia data: UNHCR Global Strategy for Public Health (2017-2019) states that the targets for the prevalence of anaemia in children 6-59 months of age and in women 15-49 years of age should be <20%. The severity of the public health situation should be classified according to WHO criteria as shown in the table below.
5 WHO (1995) Physical Status: The Use and Interpretation of Anthropometry and WHO (2000) The Management of Nutrition in Major Emergencies 6 WHO/UNICEF categorization, prevention of malnutrition threshold-children under 5 years of age, December 2018 7 WHO (1995) Physical Status: The Use and Interpretation of Anthropometry and WHO (2000) The Management of Nutrition in Major Emergencies

19
Table 14: Classification of public health significance (WHO 2000)
Prevalence % High Medium Low
Anaemia ≥40 20-39 5-19
Training, coordination and supervision
The survey was coordinated by Terry Theuri (UNHCR Nutrition and Food security officer) in collaboration with the ACROSS health and nutrition team including Dr Robert Napoleon, Diana Wesley Anyango and Michael Olweny. Merlyn Chapfunga (WFP nutritionist) assisted with training, survey supervision and data quality check.
The surveys were undertaken by six teams composed of four members each (one team leader, one haemoglobin measurer, one anthropometric measurer/translator and one anthropometric/haemoglobin measurement assistant). The team leaders/enumerators were qualified staff, while the anthropometric measurers were home health promoters.
The teams were supervised daily.
A five-day training was carried out from 9-13 September 2019. The training focused on: the purpose and objectives of the survey, roles and responsibilities of each team member, familiarization with the questionnaires by reviewing the purpose of each question; interviewing skills and recording of data; interpretation of calendar of events and age determination; how to take anthropometric measurements, common errors and data recording. A practical session on anthropometric measurements was also carried out for practice as well as a standardisation test. Post the training the data collection tools were then reviewed based on the feedback from the team.
Data collection, entry and analysis
Data collection lasted for 5 days from 16-20 September 2019. Each survey team explained the purpose of the survey and issues of confidentiality and obtained verbal consent before proceeding with the survey in the selected households. The informed consent form is shown in Appendix 3.
The UNHCR Nutrition and Food Security Officer (survey coordinator) and WFP nutritionist supported the data collection supervision during the first two days. Post this the ACROSS nutrition officer continued the support until the end of data collection. Data was collected using the ODK for Android platform using six Samsung phones. An addition six phones were also provided as back up. Each team thus had two phones. At the end of each day’s data collection, the survey coordinator checked each questionnaire for completeness and then finalised the questionnaires on the phones. Once the questionnaires were finalised, they were sent to the server for synchronisation and exporting. After exporting the data, the anthropometric data plausibility check was conducted to identify areas and teams that need more supervision or to be strengthened. Practical feedback to ensure accuracy and thoroughness in gaps identified was provided each morning. The final SMART plausibility report with a summary of the key quality criteria is shown in Appendix 2. The ODK exports data in csv format, for cleaning and analysis the data was saved in Microsoft Excel 2007 format. The nutritional indices were cleaned using flexible cleaning criteria from the observed mean (also known as SMART flags in the ENA for SMART software), rather than the reference mean (also known as WHO flags in the ENA for SMART software). This flexible cleaning approach is recommended in the UNHCR SENS Guidelines (Version 2, 2013) in accordance with SMART recommendations. For the weight-for-height index, a cleaning window of +/- 3 SD value contained in the SMART for ENA software was used.
Anthropometry indices were analysed using the ENA for SMART July 9, 2015 version. Epi Info version 7 was used to analyse all the other data.

20
RESULTS FROM GOROM
CHILDREN 6-59 MONTHS INDICATORS, GOROM CAMP, CENTRAL EQUITORIA (SEPTEMBER 2019)
Table 15 shows actual number of children captured during the survey versus the UNHCR ProGres population target
Table 15: Actual number of children captured during the survey in Gorom versus the UNHCR ProGres population target, (September 2019)
Target group
Subjects measured/interviewed during the survey
All children 6-59 months in Gorom 251
All children aged 6-59 months that were found in Gorom refugee camps during the survey period were surveyed.
Anthropometric results (based on WHO Growth Standards 2006)
The coverage of age documentation was 80% (children having an exact birth date).
Table 16: Distribution of age and sex of sample-Gorom camp, Central Equatoria (September 2019)
Boys Girls Total Ratio
AGE (mo) no. % no. % no. % Boy: girl 6-17 36 52.9 32 47.1 68 27.2 1.1 18-29 33 49.3 34 50.7 67 26.8 1.0 30-41 27 51.9 25 48.1 52 20.8 1.1 42-53 26 53.1 23 46.9 49 19.6 1.1 54-59 3 21.4 11 78.6 14 5.6 0.3 Total 125 50.0 125 50.0 250 100.0 1.0
The overall sex ratio was 1.0 (sex ratio should be between 0.8-1.2) confirming that both sexes were equally distributed.
Table 17: Prevalence of acute malnutrition based on weight-for-height z-scores (and/or oedema) and by sex- Gorom camp, Central Equatoria (September 2019)
All n = 248
Boys n = 124
Girls n = 124
Prevalence of global malnutrition (<-2 z-score and/or oedema)
(16) 6.5 %
(8) 6.5 %
(8) 6.5 %
Prevalence of moderate malnutrition (<-2 z-score and >=-3 z-score, no oedema)
(12) 4.8 %
(6) 4.8 %
(6) 4.8 %
Prevalence of severe malnutrition (<-3 z-score and/or oedema)
(4) 1.6 %
(2) 1.6 %
(2) 1.6 %
The prevalence of oedema is 0.0%. Data excludes SMART flags
21
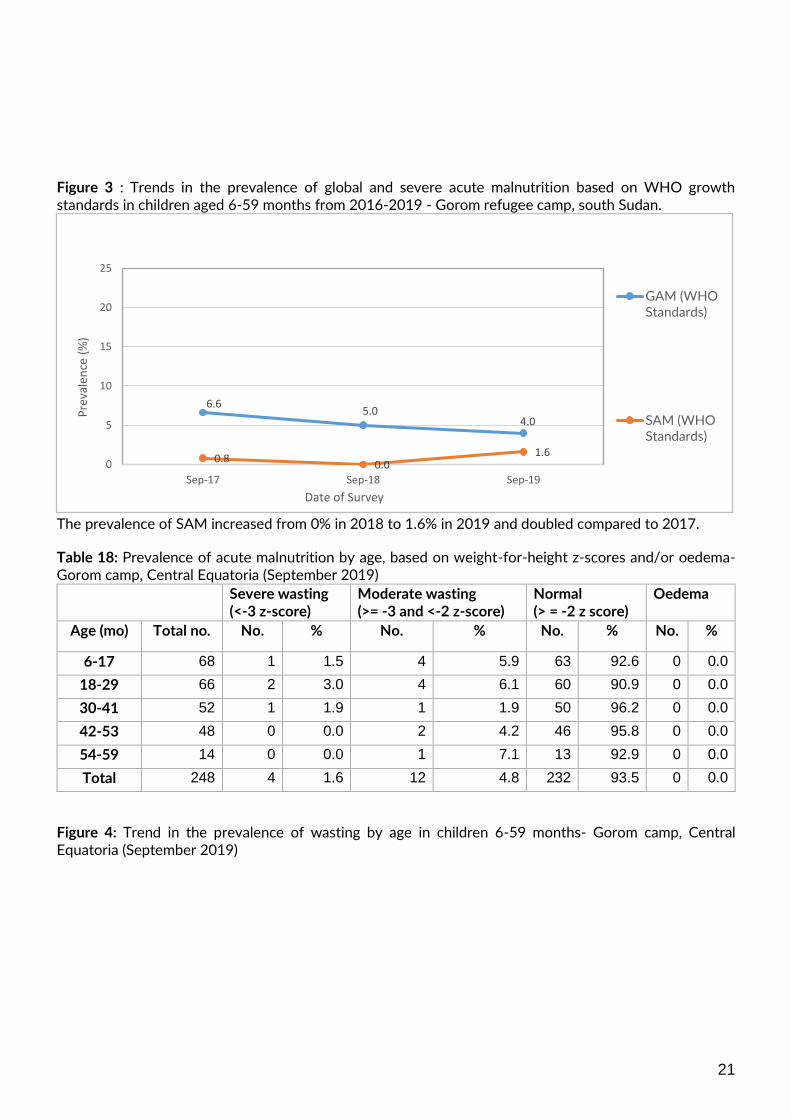
Figure 3 : Trends in the prevalence of global and severe acute malnutrition based on WHO growth standards in children aged 6-59 months from 2016-2019 - Gorom refugee camp, south Sudan.
The prevalence of SAM increased from 0% in 2018 to 1.6% in 2019 and doubled compared to 2017.
Table 18: Prevalence of acute malnutrition by age, based on weight-for-height z-scores and/or oedema- Gorom camp, Central Equatoria (September 2019)
Severe wasting (<-3 z-score)
Moderate wasting (>= -3 and <-2 z-score)
Normal (> = -2 z score)
Oedema
Age (mo) Total no. No. % No. % No. % No. %
6-17 68 1 1.5 4 5.9 63 92.6 0 0.0
18-29 66 2 3.0 4 6.1 60 90.9 0 0.0
30-41 52 1 1.9 1 1.9 50 96.2 0 0.0
42-53 48 0 0.0 2 4.2 46 95.8 0 0.0
54-59 14 0 0.0 1 7.1 13 92.9 0 0.0
Total 248 4 1.6 12 4.8 232 93.5 0 0.0
Figure 4: Trend in the prevalence of wasting by age in children 6-59 months- Gorom camp, Central Equatoria (September 2019)
6.65.0
4.0
0.80.0
1.60
5
10
15
20
25
Sep-17 Sep-18 Sep-19
Pre
vale
nce
(%
)
Date of Survey
GAM (WHOStandards)
SAM (WHOStandards)

22
Table 19: Distribution of severe acute malnutrition and oedema based on weight-for-height z-scores- Gorom camp, Central Equatoria (September 2019)
<-3 z-score* >=-3 z-score
Oedema present Marasmic kwashiorkor No. 0
(0.0 %)
Kwashiorkor No. 0
(0.0 %)
Oedema absent Marasmic No. 1 (1.6%)
Not severely malnourished No. 227 (98.4 %)
*Includes Flags
The figure below shows that the weight-for-height z-score distribution is shifted to the left, illustrating a poorer status than the international WHO Standard population of children aged 6-59 months.
Figure 5: Distribution of weight-for-height z-scores (based on WHO Growth Standards; the reference population is shown in green) of survey population compared to reference population-Gorom camp, Central Equatoria (September 2019)
Table 20: Prevalence of acute malnutrition based on MUAC cut off's (and/or oedema) and by sex -Gorom camp, Central Equatoria (September 2019)
All Boys Girls
4.4 6.41.9
5.40.0
0.00.0
0.0
0.0
0.00
5
10
15
20
25
6-17m 18-29m 30-41m 42-53m 54-59m
Pre
vale
nce
(%
)
Age group (months)
Severewasting
Moderatewasting

23
n = 249 n = 124 n = 125
Prevalence of MUAC (< 125 mm and/or oedema)
(6) 2.4 % (3) 2.4 % (3) 2.4 %
Prevalence of MUAC (< 125 mm and >= 115 mm, no oedema)
(4) 1.6 % (2) 1.6 % (2) 1.6 %
Prevalence of MUAC (< 115 mm and/or oedema)
(2) 0.8 % (1) 0.8 % (1) 0.8 %
Table 21: Prevalence of acute malnutrition by age, based on MUAC cut off's and/or oedema sex -Gorom camp, Central Equatoria (September 2019)
MUAC (< 115 mm)
MUAC (>= 115 mm and <
125 mm)
MUAC (> = 125 mm)
Oedema
Age (mo)
Total no.
No. % No. % No. % No. %
6-17 68 0 0.0 2 2.9 66 97.1 0 0.0
18-29 66 1 1.5 2 3.0 63 95.5 0 0.0
30-41 52 1 1.9 0 0.0 51 98.1 0 0.0
42-53 49 0 0.0 0 0.0 49 100.0 0 0.0
54-59 14 0 0.0 0 0.0 14 100.0 0 0.0
Total 249 2 0.8 4 1.6 243 97.6 0 0.0
Table 22: Prevalence of underweight based on weight-for-age z-scores by sex- Gorom camp, Central Equatoria (September 2019)
All n = 247
Boys n = 124
Girls n = 123
Prevalence of underweight (<-2 z-score)
(24) 9.7 %
(15) 12.1 %
(9) 7.3 %
Prevalence of moderate underweight (<-2 z-score and >=-3 z-score)
(22) 8.9 %
(13) 10.5 %
(9) 7.3 %
Prevalence of severe underweight (<-3 z-score)
(2) 0.8 %
(2) 1.6 %
(0) 0.0 %
Although not statistically significant (p>0.05) more boys were underweight compared to the girls
Table 23: Prevalence of stunting based on height-for-age z-scores and by sex- Gorom camp, Central Equatoria (September 2019)
All n = 246
Boys n = 123
Girls n = 123
Prevalence of stunting (<-2 z-score)
(17) 6.9 %
(13) 10.6 %
(4) 3.3 %
Prevalence of moderate stunting (<-2 z-score and >=-3 z-score)
(12) 4.9 %
(9) 7.3 %
(3) 2.4 %
Prevalence of severe stunting (<-3 z-score)
(5) 2.0 %
(4) 3.3 %
(1) 0.8 %
The stunting prevalence was significantly higher among the boys compared to girls (p<0.05) Figure 6 : Trends in the prevalence of global and severe stunting based on WHO growth standards in children 6-59 months from 2016-2019, - Gorom refugee camp, south Sudan

24
Stunting prevalence in Ajoung Thok largely remained the same in 2018 and 2017. In 2019 a downward trend was realised. Table 24: Prevalence of stunting by age based on height-for-age z-scores- Gorom camp, Central Equatoria (September 2019)
Severe stunting
(<-3 z-score)
Moderate stunting
(>= -3 and <-2 z-score)
Normal
(> = -2 z score)
Age (mo) Total no. No. % No. % No. % 6-17 67 0 0.0 2 3.0 65 97.0
18-29 66 2 3.0 5 7.6 59 89.4
30-41 51 2 3.9 2 3.9 47 92.2
42-53 48 0 0.0 3 6.3 45 93.8
54-59 14 1 7.1 0 0.0 13 92.9
Total 246 5 2.0 12 4.9 229 93.1
Figure 7: Trends in the prevalence of stunting by age in children 6-59 months- Gorom camp, Central Equatoria (September 2019)
Children aged 18-29months tend to be more stunted
Figure 8 : Distribution of height-for-age z-scores (based on WHO growth standards ; the reference population is shown in green and the surveyed population is shown in red) of survey population compared to reference population Gorom camp, Central Equatoria (September 2019)
0
10
20
30
40
50
60
Sep-17 Sep-18 Sep-19
Pre
vale
nce
(%
)
Date of Survey
GlobalStunting(WHOStandards)
3.0
7.6
3.96.3
0.0
0.0
3.0
3.9 0.0
7.1
0
5
10
15
6-17m 18-29m 30-41m 42-53m 54-59m
Pre
vale
nce
(%
)
Age group (months)
Severe stunting
Moderate stunting

25
Table 25: Prevalence of overweight based on weight for height cut off's and by sex (no oedema)
All n = 248
Boys n = 124
Girls n = 124
Prevalence of overweight (WHZ > 2) (2) 0.8 % (0.2 - 2.9 95%
C.I.)
(1) 0.8 % (0.1 - 4.4 95%
C.I.)
(1) 0.8 % (0.1 - 4.4 95%
C.I.)
Prevalence of severe overweight (WHZ > 3) (0) 0.0 % (0.0 - 1.5 95%
C.I.)
(0) 0.0 % (0.0 - 3.0 95%
C.I.)
(0) 0.0 % (0.0 - 3.0 95%
C.I.)
Table 26: Mean z-scores and excluded subjects - Gorom camp, Central Equatoria (September 2019)
Indicator n Mean z-scores ± SD z-scores not available*
z-scores out of range
Weight-for-Height 248 -0.51±1.04 2 0
Weight-for-Age 247 -0.66±0.96 1 2
Height-for-Age 246 -0.57±1.09 2 2
Feeding programme enrolment coverage
The OTP and TSFP enrolment coverage based on both all admission criteria and using MUAC and Oedema only did not meet the recommended standard of >90%.
Selective feeding programme
Table 27: Nutrition treatment programme coverage based on all admission criteria (weight-for-height, MUAC, oedema) – Gorom camp, Central Equatoria (September 2019)
Number/total %
Proportion of children aged 6-59 months with severe acute malnutrition currently enrolled in therapeutic feeding programme*
0/6 0%
Proportion of children aged 6-59 months with moderate acute malnutrition currently enrolled in supplementary feeding programme*
3/13 23.1%
*WHZ flags excluded from analysis
Table 28: Nutrition treatment programme coverage based on MUAC and oedema only- Gorom camp, Central Equatoria (September 2019)
26
Number/total % (95% CI)
Proportion of children aged 6-59 months with severe acute malnutrition currently enrolled in therapeutic feeding programme
0/2 0%
Proportion of children aged 6-59 months with moderate acute malnutrition currently enrolled in therapeutic feeding programme
1/4 25%
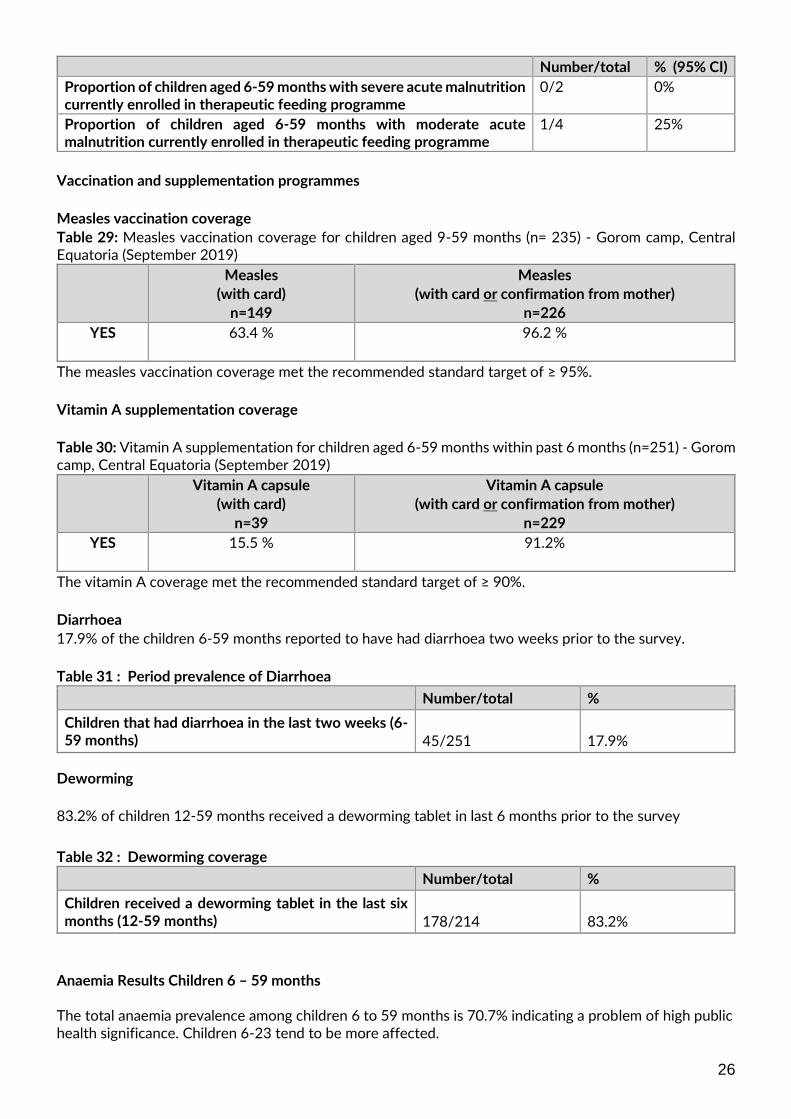
Vaccination and supplementation programmes
Measles vaccination coverage
Table 29: Measles vaccination coverage for children aged 9-59 months (n= 235) - Gorom camp, Central Equatoria (September 2019)
Measles
(with card)
n=149
Measles
(with card or confirmation from mother)
n=226
YES 63.4 % 96.2 %
The measles vaccination coverage met the recommended standard target of ≥ 95%.
Vitamin A supplementation coverage
Table 30: Vitamin A supplementation for children aged 6-59 months within past 6 months (n=251) - Gorom camp, Central Equatoria (September 2019)
Vitamin A capsule
(with card)
n=39
Vitamin A capsule
(with card or confirmation from mother)
n=229
YES 15.5 %
91.2%
The vitamin A coverage met the recommended standard target of ≥ 90%.
Diarrhoea
17.9% of the children 6-59 months reported to have had diarrhoea two weeks prior to the survey.
Table 31 : Period prevalence of Diarrhoea
Number/total %
Children that had diarrhoea in the last two weeks (6-59 months)
45/251
17.9%
Deworming
83.2% of children 12-59 months received a deworming tablet in last 6 months prior to the survey
Table 32 : Deworming coverage
Number/total %
Children received a deworming tablet in the last six months (12-59 months)
178/214
83.2%
Anaemia Results Children 6 – 59 months The total anaemia prevalence among children 6 to 59 months is 70.7% indicating a problem of high public health significance. Children 6-23 tend to be more affected.

27
Table 33 : Prevalence of Total Anaemia, Anaemia Categories, and Mean Haemoglobin Concentration in Children 6-59 Months of Age and By Age Group
6-59 months n = 249
6-23 months n=101
24-59 months n=149
Total Anaemia (Hb<11.0 g/dL) (176) 70.7%
(83) 82.2%
(93) 62.8%
Mild Anaemia (Hb 10.0-10.9 g/dL) (89) 35.7%
(39) 38.6%
(50) 33.8%
Moderate Anaemia (7.0-9.9 g/dL) (83) 33.3%
(43) 42.6%
(40) 27.0%
Severe Anaemia (<7.0 g/dL) (4) 1.6% (1) 1.0%
(3) 2.0%
Mean Hb, g/dL (95% CI) [range]
10.2 g/dL
9.9g/dL
10.4 g/dL
Table 34 : Prevalence of Moderate and Severe Anaemia in Children 6-59 Months of Age and By Age Group
6-59 months n = 249
6-23 months n=102
24-59 months n=148
Moderate and Severe Anaemia (Hb<10.0 g/dL)
(87) 34.9 %
(44) 43.6%
(43) 29.1 %
IYCF: Children 0-23 months
Table 35 : Prevalence of Infant and Young Child Feeding Practices Indicators
Indicator Age range Number/ total
Prevalence (%)
Timely initiation of breastfeeding 0-23 months 103/115 89.6
Exclusive breastfeeding under 6 months 0-5 months 11/13 84.6
Continued breastfeeding at 1 year 12-15 months 22/23 95.7
Continued breastfeeding at 2 years 20-23 months 17/28 60.7
Introduction of solid, semi-solid or soft foods 6-8 months 4/16 25
Consumption of iron-rich or iron-fortified foods 6-23 months 52/102 51.0
Bottle feeding 0-23 months 4/115 3.5
Prevalence of intake Infant formula Table 36 : Infant Formula Intake in Children Aged 0-23 Months
Number/total % (95% CI)
Proportion of children aged 0-23 months who receive infant formula (fortified or non-fortified)
5/115 4.4

28
Fortified blended foods
There was no BSFP distribution in August and September 2019. WOMEN 15-49 YEAR INDICATORS
Anaemia Women 15-49 years
Table 37 : Women Physiological Status and Age
Physiological status Number/total % of sample
Non-pregnant 118 92.9
Pregnant 9 7.1
Mean age (range) 30 (15-49)
Table 38 : Prevalence of Anaemia and Haemoglobin Concentration in Non-Pregnant Women of Reproductive Age (15-49 Years)
Anaemia - Women of reproductive age 15-49 years (non-pregnant)
All n = 118
Total Anaemia (<12.0 g/dL) (69) 58.5% (49.0– 67.5 95% CI)
Mild Anaemia (11.0-11.9 g/dL) (35) 29.7% (21.6 – 38.8 95% CI)
Moderate Anaemia (8.0-10.9 g/dL) (33) 28.0% (20.1 – 37.0 95% CI)
Severe Anaemia (<8.0 g/dL) (1) 0.9 (0– 4.6 95% CI)
Mean Hb, g/dL (SD) [range]
11.6 g/dL 1.5
[7.9-14.8]
Table 39 : ANC Enrolment and Iron-Folic Acid Pills Coverage among Pregnant Women (15-49 Years)
Number /total
% (95% CI)
Currently enrolled in ANC programme 9/9 100
Currently receiving iron-folic acid pills 8/9 88.9 (51.7-99.7)

29
FOOD SECURITY INDICATORS
Access to food assistance Table 40: Ration card coverage
Number/total
% (95% CI)
Proportion of households with a ration card 120/120 100%
All the households surveyed had a ration card Negative household coping strategies The refugees in Gorom refugee camp, like the rest of camps in South Sudan, receive a reduced food ration at a 70% scale. Table 41: Coping strategies used by the surveyed population over the past month
Number/total % (95% CI)
Proportion of households reporting using the following coping strategies over the past month*:
Borrowed cash, food or other items with or without interest 21/120 17.5 (11.2-25.5)
Sold any assets that would not have normally sold (furniture, seed stocks, tools, other NFI, livestock etc.)
11/120 9.2 (4.7-15.8)
Requested increased remittances or gifts as compared to normal
6/119 5.0 (1.9-10.7)
Reduced the quantity and/or frequency of meals and snacks 48/120 40.0 (31.2-49.3)
Begged 1/120 0.8 (0.0-4.6)
Engaged in potentially risky or harmful activities 5/120 4.2 (1.4-9.5)
Proportion of households reporting using none of the coping strategies over the past month
52/120 43.3 (34.3-52.7)
* The total was over 100% as households used several negative coping strategies.

30
Only 43.3% of households were not under significant stress to meet their needs as indicated by the proportion of household using none of the negative coping strategies over the past month prior to the survey. Household dietary diversity The last general food distribution ended 21 days prior to the start of the survey data collection. The survey was carried out during the beginning of the harvest season. This is thus the likely best scenario. Table 42: AVERAGE HDDS*
Mean
(Standard deviation or 95% CI)
Average HDDS
4.8 (2.1)
Figure 9: Proportion of households consuming different food groups within last 24 hours
Table 43: Consumption of micronutrient rich foods by households
Number/total
% (95% CI)
Proportion of households not consuming any vegetables, fruits, meat, eggs, fish/seafood, and milk/milk products
15/120 12.5 (7.2-19.8)
Proportion of households consuming either a plant or animal source of vitamin A
96/120 80.0 (71.7-86.8)
Proportion of households consuming organ meat/flesh meat, or fish/seafood (food sources of haem iron)
26/120 21.7 (14.7-30.1)
The low proportions of households consuming food groups containing iron above is indicative of an inadequate diet that is likely to be contributing to the micronutrient deficiencies
93.3
1.7
86.7
3.3 50.8
17.5
55.0
10.8
67.5
50.8
85.0
0102030405060708090
100
Pro
po
rtio
n o
f h
ou
seh
old
s (%
)
Food groups

31
LIMITATIONS
• The age documentation coverage was 80%. Although an event calendar was used by the surveyors to ascertain age, stunting results need to be interpreted with caution because height-for-age z-scores require accurate ages to within two weeks8.
8 (CDC/WFP: A manual: Measuring and Interpreting Mortality and Malnutrition, 2005).

32
DISCUSSION
Nutritional status of young children and mortality The prevalence of global acute malnutrition in Gorom camp (6.5%) is of medium concern based on the WHO/UNICEF 2018 classification. This indicates a poor nutrition situation. The prevalence of severe acute malnutrition was 1.6%. The GAM and SAM prevalence in 2018 was 4.0% (WHZ) and 0.4% (MUAC) respectively. The increase to 6.5% from 4.0% in 2018 was not statistically significant (p>0.05) but indicates that the global acute malnutrition situation is on an upward trend requiring attention. The prevalence of severe acute malnutrition increased from 0% in 2018 to 1.6% in 2019, while doubled compared to 2017. A comprehensive CMAM program was set up in 2018 and continued in 2019. Appropriate ready to use therapeutic and supplementary foods for the management of acute malnutrition were in place. No pipeline break was experienced in 2019 for therapeutic nutrition supplies. Supplementary feeding Plumpy’Sup had a one-month pipeline gap within which CSB++ was used as a replacement. In addition to the CMAM program preventive blanket supplementary feeding continued for children 6-23 months and pregnant and lactating women. BSFP supplies faced pipeline breaks for 3 out of 9 months between January and September 2019. Availability and timely prepositioning of supplies in the camp will be required in 2020 to allow the rehabilitation of the malnourished children and to support the nutrition needs of the 6-23 months age group a key window of opportunity for growth. Stunting refers to a deficit in height relative to age due to a long-term process of linear growth retardation. ‘Stunting is a well-established risk marker of poor child development. Stunting before the age of 2 years predicts poorer cognitive and educational outcomes in later childhood and adolescence. Factors that contribute to stunted growth and development include poor maternal health and nutrition, inadequate infant and young child feeding practices, and recurrent infections.’9 The prevalence of global stunting among children 6-59 months was 6.9% which is low. Of note though is that 20% of the population had no age documentation thus stunting results need to be interpreted with caution. The stunting prevalence reduced in 2019 compared to 2018 (17.1%). Action across multiple areas will be required to maintain efforts gained. This to include promotion of infant and young child feeding practices, ensuring adequate water and sanitation, infection control and maternal health and nutrition support.10 Morbidity The interaction of nutrition and infection are cyclic with each exacerbating the other. 17.9 % of children 6-59 months were reported to have had diarrhoea in the last two weeks prior to the survey indicating a morbidity burden needing attention. Interventions to prevent diarrhoea, including safe drinking-water, use of improved sanitation and hand washing with soap, and community hygiene promotion and awareness need to be strengthened and maintained. To reduce the morbidity caseload there is need to maintain the current health service provision. Top morbidities (malaria, respiratory tract infections, skin and eye disease and intestinal worms) should also be given special attention. Furthermore, there are currently 119 people living with HIV in Gorom camp, the second highest in SSD refugee operation next to Makpandu settlement. Programme coverage children 6 – 59 months
Selective feeding programme
The enrolment coverage for OTP and TSFP was below standard using both the MUAC and WHZ scores criterion indicating the need for better identification of malnourished cases at the community level in the case of MUAC. Of concern is that most of the cases identified with acute malnutrition based on the WHZ scores (81.2%) did not meet the MUAC cut off <125mm. This indicates the need to also ensure case finding at the various points on contact at the facility level in addition to the community efforts. Based on the survey data analysis the facility level screening to include an expanded screening criterion where the MUAC at risk category goes through a second stage WHZ screening. The range for children aged 6-23months
9 WHA Global Nutrition Targets 2025: Stunting policy brief
10 Allen LH. Nutritional influences on linear growth: a general review, Eur J Clin Nutr 1994; 48: S75-S89.

33
recommended for 2020 is MUAC 125-145mm and for 24-59 months 125-155mm. Any child found to meet the admission criteria using the WHZ scores to be enrolled into the appropriate program.
Measles vaccination and vitamin A supplementation The coverage for measles vaccination and vitamin A supplementation in the last 6 months met the recommended standard target of ≥ 95% and ≥90% respectively. This indicates that routine and campaign immunisation and supplementation strategies are on track and should be maintained in 2020. The coverage of the use of EPI cards remained low. Improvement on this should also be ensured.
Anaemia in Young Children and Women
The survey results showed that total anaemia prevalence among children 6 to 59 months was 70.7%. This is very high as it is above 40%.11 The anaemia problem was more severe among children 6 to 23 months than in older children. Although anaemia prevalence was high, approximately 35.7% of the children were mildly anaemic. The prevalence of moderate and severe anaemia among children 6 to 59 was 34.9%. If only moderate and severe anaemia is considered, the anaemia prevalence is of medium public health concern. Total anaemia prevalence among non-pregnant women 15-49 years was 58.5 % (49.0–67.5 95% CI). According to the WHO classification the women anaemia prevalence is of high public health significance. The anaemia prevalence deteriorated among children deteriorated and remained the same among non-pregnant women 15-49 years compared that in 2018 (55.2% and 56.9% respectively). Anaemia impairs the development and learning of children and impairs the health and quality of life in adults, especially women in the reproductive age group. It also increases the risk of adverse maternal and neonatal outcomes12 and worsens clinical outcomes especially when it occurs as a comorbidity13 The anaemia prevalence is likely to be attributed to several factors. This include a i) diet with insufficient micronutrients; ii) diet that lacks diversity especially in terms of animal protein a good source of bioavailable iron; iii) disease burden requiring continuous attention; iv) increased demand for iron among infants, women or reproductive age; v) inappropriate feeding practices among others. A 70% ration was provided on a monthly basis in Gorom comprising of sorghum, pulses, oil and salt. The GFD basket provided only 54% of the daily iron requirements. Sorghum, which contributed the bulk of this iron is high in phytates, anti-nutrients that inhibit iron absorption in the body. In addition to this the GFD only provided 3% of the recommended daily intake of vitamin C, a nutrient that plays a pivotal role in iron absorption. The HDDS indicated that only 21.7% of the households consumed food sources rich in iron. 51% of children 6-23 months reported to have not consumed iron rich foods the day before the survey. Malaria and intestinal worms’ infection were among the top five morbidities among the refugee population. Introduction of appropriate complementary feeds at 6 months remained low at 25%. A multisectoral approach to anaemia prevention and control will continue to be required in 2020. This to address nutritional, health and other underlying causes. The health and nutrition facility-based capacity for anaemia prevention and treatment, community screening and referral, scaling up of livelihood options that complement the existing food assistance options and information, education and communication of diet diversity and appropriate utilisation to be prioritised in 2020 and beyond.
IYCF Indicators
Infant and young child feeding practices directly affect the nutritional status of children under two years of age and, ultimately, impact child survival. Protecting, and improving on, appropriate infant and young child feeding practices in children aged 0-23 months is therefore critical to improved nutrition, health and development of children14.
From the survey results the proportion of children 0-23 months that had timely initiation of breast milk within the first hour of delivery was 89.6%. Early initiation (within one hour of birth) of exclusive breastfeeding significantly reduces the risk of neonatal mortality. Infants for whom initiation of
11 WHO classification of public health significance
12 WHO anaemia global targets brief 13 Iron deficiency revisted, M.D Capellini, K.M.Musallam and A.T.Taher 2019; https://doi.org/10.1111/joim.13004 14 WHO, Indicators for Assessing Infant and Young Child Feeding Practices, WHO 2010

34
breastfeeding is delayed to more than 24 hours after birth are 2.4 times more likely to die during their first month of life. Efforts to ensure all delivered children receive timely initiation of breast milk should thus be continued. The rate of exclusive breast feeding for the first six months of life was 84.6%. The risk of neonatal death is increased approximately fourfold if milk-based fluids or solids are provided to breastfed neonates. Breastmilk alone (exclusive) satisfies the nutritional and fluid requirements of an infant for the first complete six months of life in all settings and climates.15 Continued breastfeeding at 1 year was 95.7% and up to two years was 60.7%. The relatively good proportion of positive breastfeeding practices attained in Gorom refugee camp so far can be attributed to the use of the IYCF multisectoral framework for action lens where appropriate breast feeding practices are intergrated in the various health facility contact points (maternity, antenatal and postnatal clinics visits, EPI clinic, ART clinic etc.) In addition to this community support groups were maintained in 2019. The proportion of children that continue to breastfeed up to two years should be improved by exploring mitigation measure to the barriers in place. The rest of the appropriate practices should be maintained. The proportion of children 6 to 8 months that were introduced to solid and semi-solid foods in a timely fashion was only 25%. This remained the same as in 2018 with the change being statistically insiginificant. After six months, adequate and appropriate infant complementary foods become necessary to complement breastmilk in order to meet the energy and other nutrient requirements of the infant (timely complementary feeding). There is need to ensure that IYCF messaging that addresses this important component of complementary feeding are coupled with viable camp level solutions. The message dissemination to be coupled by livelihood options that support diet diversity. 3.5% of the surveyed children aged 0-23 months were bottle fed. 4.4% received infant formula. Bottle-feeding decreased in 2019 compared to 2018 indicating a positive outcome following continuous dissemination of key messages discouraging the practice. Infant formula is a nonhuman milk product formulated from animal milk or vegetable protein (soy) and adapted to the physiological characteristics of infants. The risks of infection or malnutrition from using breastmilk substitutes are likely to be greater than the risk of HIV transmission through breastfeeding. In addition to this bottle feeding is associated with increased diarrhoeal disease due to the contamination likelihood of the bottle and nipple. It is therefore necessary to support all women to achieve early initiation and exclusive breastfeeding for the first six completed months and the continuation of breastfeeding into the second year of life to provide the best chance of survival for infants and young children16 Some of the IYCF results should be interpreted with caution as the sample is small to draw meaningful conclusions. These findings, however, give an idea of the status of infant and young feeding practices among the surveyed population. Food security indicators Food insecurity is one of the causes of undernutrition as it directly affects the nutritional status of an individual. It is a direct cause of malnutrition in terms of dietary intake and an underlying cause in terms of access to and utilisation of food. Improving overall food security remains critical to improved nutrition, health and long-term development of children and other household members. Majority of the refugees in Gorom refugee camp had access to food assistance as indicated by the coverage of ration cards (100%). The general food ration continued to be provided at a 70% ration scale which provides 1475kcal/p/d. In 2019 milling assistance was introduced to facilitate better grain utilisation. All the 12 GFD cycles were provided in 2019 thus no pipeline break. Timeliness of the supply deliveries faced some challenges on some months. The general food assistance does not meet all the food need required. Complementary livelihood options remain limited. To fill the gap in food assistance over half of the refugee households reported using negative coping strategies (56.7%). Only 43.3% reported to have used none of the survey listed coping strategies
15 UNHCR SENS guidelines for refugee populations, Version 2 (2013)
16 Operation Guidance on IFE, section 5.2.8, v2.1, Feb 2007

35
indicating the proportion likely to have benefited from livelihood programs’ support. Advocacy to fill the food assistance gap to be continued. RECOMMENDATIONS AND PRIORITIES Nutrition related
Continue the implementation of the comprehensive CMAM program providing both therapeutic and
supplementary feeding programs to facilitate the rehabilitation of identified acute malnourished children,
pregnant and lactating women, people living with HIV/AIDS and TB patients on treatment. This to include
active case finding and community mobilization. (UNHCR, UNICEF, WFP and ACROSS).
Ensure all community screened and referred 6-59 months children identified with a MUAC less than
125mm get enrolled into the management of acute malnutrition programs through community outreach
follow up at household level (ACROSS)
Ensure monthly blanket supplementary feeding programme for children 6-23 months, pregnant and
lactating women using a fortified blended food or lipid-based supplement to prevent malnutrition and to
cover the nutrient gap these vulnerable groups have in light of a predominant grain based general food diet
(UNHCR, WFP and ACROSS)
Conduct the two step MUAC and WHZ scores (for children with MUAC at risk) screening at all the contact
points in the health facility including the EPI, triage and the BSFP sites established to ensure both high
MUAC and WHZ score coverage (ACROSS)
Continue strengthening the capacity of established nutrition facility in terms of staff training to facilitate
quality provision of both curative and preventative components of nutrition (UNHCR, WFP, UNICEF and
ACROSS)
Expand and strengthen preventative nutrition components including Infant and Young Child Feeding
(IYCF)-using the IYCF multisectoral framework for action approach and promote optimal maternal nutrition
to stop malnutrition from occurring in the first place. (UNHCR, WFP, UNICEF and ACROSS)
Continue implementing the micronutrient reduction strategy to curb the high anaemia prevalence
Conduct follow up quarterly mass MUAC screening targeting children 6-59 months and pregnant and
lactating women to monitor the evolution of the nutrition situation at the community level. (ACROSS)
Ensure regular monitoring, quarterly joint monitoring and yearly program performance evaluations in all
camps to assess performance progress and formulate recommendations for any identified gaps. (UNHCR,
WFP, UNICEF and ACROSS).
Undertake a follow up annual joint nutrition survey to analyse trends and facilitate program impact
evaluation in 2020. (UNHCR, ACROSS, WFP and UNICEF).
Food security related
Provision of food assistance providing the minimum dietary requirements (2100kcal/person/day). (UNHCR,
ACROSS and WFP).
Continue the routine joint monthly food basket monitoring on site and ensure the inclusion of the refugee
camp in the post distribution monitoring at the household level to ensure that refugees receive their
entitlement (UNHCR, ACROSS and WFP).

36
Expand the coverage of sustainable food security and livelihood solutions to allow diet diversity and to
complement the general food distribution (UNHCR, WFP and ACROSS).
Health related
Maintain and strengthen the provision of comprehensive primary health programme for refugee and host
populations in Central Equitoria. (UNHCR and ACROSS)
UNICEF, ACROSS and UNHCR to ensure the EPI program and Vitamin A supplementation campaigns and
routine program is maintained to ensure coverage is kept at acceptable standards.
Adequate clean water provision to be maintained in 2020. In addition to this ensure hygiene promotion continues, and latrine coverage to reduce infections and morbidities like diarrhoea. (UNHCR and ACROSS) APPENDICES
Appendix 1: Names of contributors
Name Role Organisation
1 Lero Ochalla Omot Enumerator ACROSS
2 Akune Odhieng Ochalla Enumerator ACROSS
3 Dor Comboni Enumerator ACROSS
4 Ojullu Okwier Gwoy Enumerator ACROSS
5 Anthony Ngor Maluil Enumerator ACROSS
6 Kochan Owar Okello Enumerator ACROSS
7 Gilo Okuny Abwola Enumerator ACROSS
8 Kwarkuch Ojullu Dingech Enumerator ACROSS
9 Anga Achudo Opul Enumerator ACROSS
10 Oduyi Simon Okano Enumerator ACROSS
11 Omot Omot Nyigwo Enumerator ACROSS
12 Taban Moris Eliloma Enumerator ACROSS
13 Adeng Bak Makuach Enumerator- Hb measurement Juba
14 Adong Stella Bily Enumerator- Hb measurement Juba
15 Nancy Emmanuel Mundara Enumerator- Hb measurement Juba
16 Lona Mandera Enumerator- Hb measurement Juba
17 Odong Kene Paul Enumerator- Hb measurement Juba
18 Poni Josephine Diliga Enumerator- Hb measurement Juba
19 Olweny Michael Wilson Team leader/Supervisor Juba
20 Kenyi Martin Team leader Juba
21 Nyuma Robert Ben Team leader ACROSS
22 Lui Alex Mula Team leader ACROSS
24 Ajwang Doreen Team leader ACROSS
25 Peter Kenyi Supervisor ACROSS
26 Diana Chicago Wesley Supervisor ACROSS
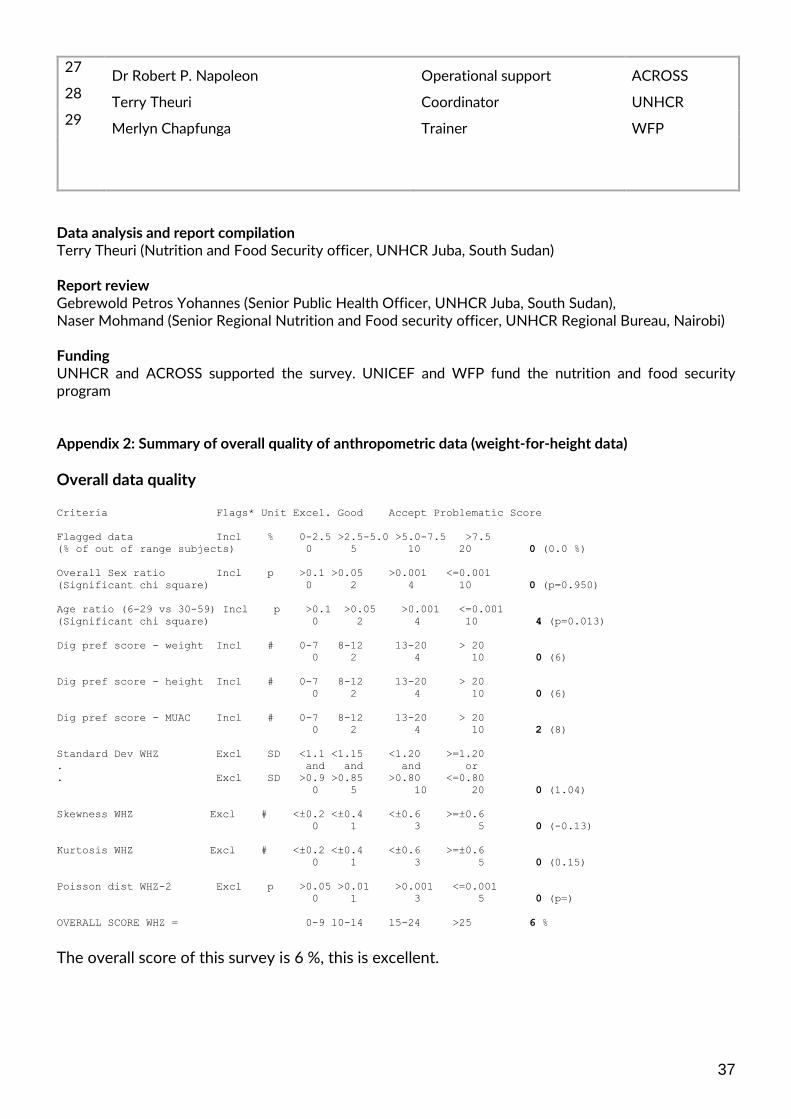
37
27 Dr Robert P. Napoleon Operational support ACROSS
28 Terry Theuri Coordinator UNHCR
29 Merlyn Chapfunga Trainer WFP
Data analysis and report compilation Terry Theuri (Nutrition and Food Security officer, UNHCR Juba, South Sudan) Report review Gebrewold Petros Yohannes (Senior Public Health Officer, UNHCR Juba, South Sudan), Naser Mohmand (Senior Regional Nutrition and Food security officer, UNHCR Regional Bureau, Nairobi) Funding UNHCR and ACROSS supported the survey. UNICEF and WFP fund the nutrition and food security program Appendix 2: Summary of overall quality of anthropometric data (weight-for-height data)
Overall data quality Criteria Flags* Unit Excel. Good Accept Problematic Score
Flagged data Incl % 0-2.5 >2.5-5.0 >5.0-7.5 >7.5
(% of out of range subjects) 0 5 10 20 0 (0.0 %)
Overall Sex ratio Incl p >0.1 >0.05 >0.001 <=0.001
(Significant chi square) 0 2 4 10 0 (p=0.950)
Age ratio (6-29 vs 30-59) Incl p >0.1 >0.05 >0.001 <=0.001
(Significant chi square) 0 2 4 10 4 (p=0.013)
Dig pref score - weight Incl # 0-7 8-12 13-20 > 20
0 2 4 10 0 (6)
Dig pref score - height Incl # 0-7 8-12 13-20 > 20
0 2 4 10 0 (6)
Dig pref score - MUAC Incl # 0-7 8-12 13-20 > 20
0 2 4 10 2 (8)
Standard Dev WHZ Excl SD <1.1 <1.15 <1.20 >=1.20
. and and and or
. Excl SD >0.9 >0.85 >0.80 <=0.80
0 5 10 20 0 (1.04)
Skewness WHZ Excl # <±0.2 <±0.4 <±0.6 >=±0.6
0 1 3 5 0 (-0.13)
Kurtosis WHZ Excl # <±0.2 <±0.4 <±0.6 >=±0.6
0 1 3 5 0 (0.15)
Poisson dist WHZ-2 Excl p >0.05 >0.01 >0.001 <=0.001
0 1 3 5 0 (p=)
OVERALL SCORE WHZ = 0-9 10-14 15-24 >25 6 %
The overall score of this survey is 6 %, this is excellent.

38
Appendix 3 : Nutrition Surveys Questionnaires 2019 Greeting and Reading of Rights THIS STATEMENT IS TO BE READ TO THE HEAD OF THE HOUSEHOLD OR, IF THEY ARE ABSENT, ANOTHER ADULT MEMBER OF THE HOUSE BEFORE THE INTERVIEW. DEFINE A HOUSEHOLD AS A GROUP OF PEOPLE WHO LIVE TOGETHER AND ROUTINELY EAT OUT OF SAME POT. DEFINE HEAD OF HOUSEHOLD AS MEMBER OF THE FAMILY WHO MANAGES THE FAMILY RESOURCES AND IS THE FINAL DECISION MAKER IN THE HOUSE.
Hello, my name is _____________ and I work with [organization/institution]. We would like to invite your household to participate in a survey that is looking at the nutrition and health status of people living in this camp. UNHCR and ACROSS are working in the nutrition and health sectors are sponsoring this nutrition survey Taking part in this survey is totally your choice. You can decide to not participate or stop taking part at any time and for any reason. If you stop being in this survey it will not have any negative effects on how you or your household is treated or what aid you receive. If you agree to participate, I will ask you some questions about your family. We will then measure the arm circumference, weight and height of children who are older than 6 months up to 5 years. In addition to these assessments we will also test a small amount of blood from the finger of the children and women to see if they have anaemia. Before we start to ask you, any questions or take any measurements, we will ask you to give your verbal consent. Be assured that any information that you will provide will be kept strictly confidential. You can ask me any questions that you have about this survey before you decide whether to participate. Thank you

Questionnaire for Children 6-59 months (every HH)
THIS QUESTIONNAIRE IS TO BE ADMINISTERED TO ALL CARETAKERS OF A CHILD THAT LIVES WITH THEM AND IS BETWEEN 6-59 MONTHS OF AGE
Date (dd/mm/yyyy) Team Number Village Block
|___|___|/|___|___|/|___|___||___|___| |___| |___|___| |___|___|
CH1 CH2 CH3 CH4 CH5 CH6 CH7*** CH8*** CH9 CH10 CH11 CH12 CH13 CH14 CH15 C16 CH17
ID HH Consent
given
1=yes
2=no
3=absent
Sex
(m/f)
Birthdate*
dd/mm/yyyy
Age**
cwiri
(months)
Dwodi
Oedema
(y/n)
MUAC
(mm)
Weight
(kg)
100g
Height
)cm)
0.1cm
If Child
enrolled in
the below
nutrition
program
1=SFP
2=OTP/SC
3=None
Is Child
enrolled in
BSFP
1Yes
2No
Measles
Nyilaal ocwobo
ajwa kijaath
1=yes card
2=yes recall
3=no or don’t
know
Vit. A in
past 6
months
Nyilaal
amadho Vit
A koot
(show
capsule)
1=yes card
2=yes
recall
3=no or
don’t know
Diarrhoea in
past 2
weeks#
Nyilaal omak
leth ec ki
koot juu
ariew?
1=yes
2=no
8=DK
Deworming
in the last
six months
1=Yes
2=No
8=DK
HB
(g/dl)
01 / /
02 / /
03 / /
04
05
06
07
08
09
10
11
*Record from EPI/health card/age documentation if available. Leave blank if no valid age documentation. **Estimate using event calendar and recall if age documentation not available. #Diarrhoea: 3 or more loose stools within 24hrs
***C9 & C10: REFER TO CLINIC FOR MALNUTRITION IF NOT ALREADY ENROLED IN TSFP / OTP IF OEDEMA=Y OR MUAC < 12.5CM; C15: REFER IF HB IS<7 G/DL

Questionnaire for WOMEN 15-49 YEARS (every other HH) This questionnaire is to be administered to all women aged between 15 and 49 years IN THE SELECTED HH
Date (dd/mm/yyyy) Camp Team Number Village Number Block
Number
|___|___|/|___|___|/|___|___||___|___| |___|___| |___|___| |___|___|
W1 W2 W3 W4 W5 W6 W7 W8* W9
Woman ID
HH
Consent given
1=yes
2=no
3=absent
Age (years)
cwiri
Are you pregnant?
Ngeeti inamaai
1=yes
2=no (GO to WM 8)
8=DK (GO WM 8)
Are you currently enrolled in the ANC?
Ino cobo ki mar jo jey?
1=yes
2=no (If no, STOP)
Are you currently receiving iron-folate tablets? (SHOW PILL)
Ino moo kiin?
1=yes (STOP NOW)
2= no (STOP NOW)
8=DK (STOP NOW)
Bung gin ngääc
Hb
(g/dL)
(Only for non-pregnant women)
Kipper maan moa nak ngeet ge ba in maal keerge
Woman referred for anaemia
Mn mo kwa kipper tar kääc
1=yes
2=no
1
2
3
4
5
6
7
8
9
10
11
*W8: Refer to the clinic for anaemia if HB is <8.0 g/dl
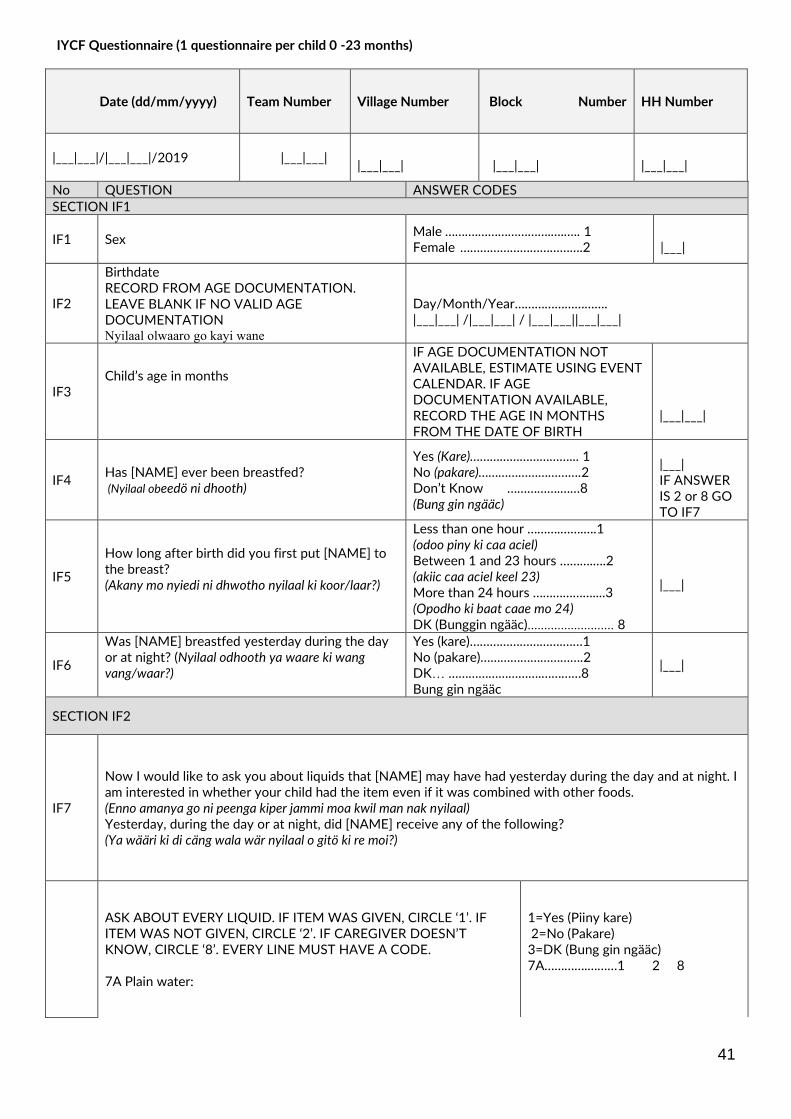
41
IYCF Questionnaire (1 questionnaire per child 0 -23 months)
Date (dd/mm/yyyy) Team Number Village Number Block Number
HH Number
|___|___|/|___|___|/2019 |___|___| |___|___|
|___|___|
|___|___|
No QUESTION ANSWER CODES
SECTION IF1
IF1 Sex Male ……….………………….….….. 1 Female ……………………………….2
|___|
IF2
Birthdate RECORD FROM AGE DOCUMENTATION. LEAVE BLANK IF NO VALID AGE DOCUMENTATION
Nyilaal olwaaro go kayi wane
Day/Month/Year………………………. |___|___| /|___|___| / |___|___||___|___|
IF3 Child’s age in months
IF AGE DOCUMENTATION NOT AVAILABLE, ESTIMATE USING EVENT CALENDAR. IF AGE DOCUMENTATION AVAILABLE, RECORD THE AGE IN MONTHS FROM THE DATE OF BIRTH
|___|___|
IF4 Has [NAME] ever been breastfed?
(Nyilaal obeedö ni dhooth)
Yes (Kare)…………………………... 1 No (pakare)………………………….2 Don’t Know …………….……8 (Bung gin ngääc)
|___| IF ANSWER IS 2 or 8 GO TO IF7
IF5
How long after birth did you first put [NAME] to the breast? (Akany mo nyiedi ni dhwotho nyilaal ki koor/laar?)
Less than one hour ……….…….….1 (odoo piny ki caa aciel) Between 1 and 23 hours ……….….2 (akiic caa aciel keel 23) More than 24 hours ………………....3 (Opodho ki baat caae mo 24) DK (Bunggin ngääc) .......................... 8
|___|
IF6
Was [NAME] breastfed yesterday during the day or at night? (Nyilaal odhooth ya waare ki wang vang/waar?)
Yes (kare)……………………….……1 No (pakare)………………………….2 DK … ……………………….…………8 Bung gin ngääc
|___|
SECTION IF2
IF7
Now I would like to ask you about liquids that [NAME] may have had yesterday during the day and at night. I am interested in whether your child had the item even if it was combined with other foods. (Enno amanya go ni peenga kiper jammi moa kwil man nak nyilaal) Yesterday, during the day or at night, did [NAME] receive any of the following? (Ya wääri ki di cäng wala wär nyilaal o gitö ki re moi?)
ASK ABOUT EVERY LIQUID. IF ITEM WAS GIVEN, CIRCLE ‘1’. IF ITEM WAS NOT GIVEN, CIRCLE ‘2’. IF CAREGIVER DOESN’T KNOW, CIRCLE ‘8’. EVERY LINE MUST HAVE A CODE. 7A Plain water:
1=Yes (Piiny kare) 2=No (Pakare) 3=DK (Bung gin ngääc) 7A………….………1 2 8

42
7B. Infant formula: for example, Nan 1, nan 2, s26. (Ya waare ki waar wala dicang nyilaal amadho ki :(Caak mo cuk?)
7B……………….…1 2 8
7C. Milk such as tinned, powdered, or fresh animal milk: for example (Nido, cow milk, goat milk). (Ya waare ki waar wala dicang nyilaal amadho ki: (Coak wala caak jur moa näk mo läny)
7C……………………1 2 8
7D. Juice or juice drinks e.g mango, apple juice bought in shops. (Ya waare ki waar wala dicang nyilaal amadho ki: (Pii nyijäth mwØa ngweeth teeng manga, apple ki mØØk)
7D……………….….1 2 8
7E. Clear broth (Ya waare ki waar wala dicang nyilaal amadho ki: (Cwige)
7E………………….…1 2 8
7F. Sour milk or yogurt for example: (Ya waare ki waar wala dicang nyilaal amadho ki:) Caak mwØa wac)
7F…………….……….1 2 8
7G. Thin porridge for example: (Ya waare ki waar wala dicang nyilaal amadho ki: )Pimor)
7G………………….…1 2 8
7H. Tea or coffee with milk (Ya waare ki waar wala dicang nyilaal amadho ki: (cääye wala caak, Buna wala caak)
7H………………….…1 2 8
7I. Any other water-based: for example, sodas, other sweet drinks, herbal infusion, gripe water, clear tea with no milk, black coffee, ritual drinks (Ya waare ki waar wala dicang nyilaal amadho ki: (soda, Kerekede, caay/buna mo caak ree?)
7I……………………….1 2 8
IF8 Yesterday, during the day or at night, did [NAME] eat solid or semi-solid (soft, mushy) food?
(Yaa waare ki wäar, dicang nyilaal acamo ki cam mo joom-mo guuro?)
Yes (kare)…….…1 No (pakare) .......2 DK (Bung gin ngääc) ………….8
|___|
SECTION IF3
IF9
Did [NAME] drink anything from a bottle with a nipple yesterday during the day or at night? (Nyilaal amadho kigiir piny, yi willi mo dhee da thootho ya waare ka dicang wala waar?)
Yes (kare)………1 No (pakare)…….2 DK (Bung gin ngääc)…………….8
|___|
SECTION IF4
IF10 Is child aged 6-23 months?
REFER TO QF2 Nyilaal cwiiye ena ri dwadw abiciel keel piera ariew kadak?
Yes (kare)……….1 No (pakare)…….2
|___| IF ANSWER IS 2 STOP NOW
IF11
Now I would like to ask you about some particular foods [NAME] might have eaten. I am interested in whether your child had the item even if it was combined with other foods. Yesterday, during the day or at night, did [NAME] consume any of the following? (Enno amanya go ni peenya kipper cam mano cam nyilaali. Yiea omino wal nyilaal mari ogitokeeldee naa ojaabo ki cammi mook ( ASK ABOUT EVERY ITEM. IF ITEM WAS GIVEN, CIRCLE ‘1’. IF ITEM WAS NOT GIVEN, CIRCLE ‘2’. IF CAREGIVER DOESN’T KNOW, CIRCLE ‘8’. EVERY LINE MUST HAVE A CODE. Yes, No DK
IF12
11A. Flesh foods for example: beef, goat, lamb, mutton, pork, rabbit, chicken, duck, liver, kidney, heart. (Nyilaal acamo ya waare ki ringo teengi: (Riingo, Reo, Caap riing teeng, rieng dhieng, ring diel, ring roomo, ring othur, ring apwoo ring, gwieno, badho cwiny, rogi ki winyo?
11A……………….1 2 8
11C. FBF++: for example CSB++ (Ya waare nyilaal acamo ki mo mana ngeeth ka dicang/waar? )
11C………………1 2 8
11D. RUTF: for example, Plumpy’Nut® (SHOW SACHET) (Ya waare ki dicang waar nyilaal acamo ka apulli wala athiloomi?)
11D………………1 2 8
11E. RUSF: for example, Plumpy’Sup® (SHOW SACHET) (Ya waare ki dicang, waar nyillal acamo ka apuuli wala athiloomi?)
11E………………1 2 8
11G. Infant formula: for example, NAN 1, nan 2, s26). (Ya waare ki waar, dicang nyilaal amadho ki caak teeng Nan 1, Nan 2?
11G……...………1 2 8

43
11H. List any iron fortified solid, semi-solid or soft foods designed specifically for infants and young children available in the local setting that are different than distributed commodities (Ya waare ki waar dicang nyilaal acamo ki cam mo jappo ka teeng: piimo mo jaabo ka athiloomi)
11H……………….1 2 8
Food Security questionnaire (1 questionnaire per every other household)
Date (dd/mm/yyyy) Camp Team Number
|___|___|/|___|___|/2019
|___|___|
Village Number Block Number Household
|___|___|
|___|___|
|___|___|___|
No QUESTION ANSWER CODES
SECTION 1
1. Does your household have a ration card? (Paari
da kaat mar cam?)
Yes ................................................ 1
No ............................................... 2
|___|
IF
ANSWER
IS 1 GO TO
Q3
2. Why do you not have a ration? (Aper ngø ni
bunge kaat mar cam jiri?)
Not given one at registration, even
if eligible ....................................... 1
Lost card ...................................... 2
Traded/Sold card ......................... 3
New arrival who is eligible but not
yet registered ............................... 4
Not eligible (not in targeting
criteria) ........................................ 5
Other ........................................... 6
|___|
3. Does your household receive full or reduced food
ration?
Full (10kg Sorghum) ……………….1
Reduced……………………………2
Other……………………………….3
4. How many days did the food from the general
food aid ration from the cycle of [August] month
last?
(A nïnë Adïï ni thum cammi mari mar dwaa
abara wala dwaana pöödhö?)
Number of Days ________________
IF ANSWER IS > or =30 days GO
TO Q5
|___|___|

44
5. In the last month, have you or anyone in your
household borrowed cash, food or other items
with or without interest?
(Yi dwääy mana pöödhö da dhaanhø mo kado
ki girpiny. paari kimet ec mari wala ki teek mo
dwogi ni omeetö wala dwogi ni kare?)
Yes (Piiny kare) …………………….1
No (pakare)……………………….2
DK … ………………………………8
(Bung gin ngääc)
|___|
6. In the last month, have you or anyone in your
household sold any assets that you would not
have normally sold (furniture, seed stocks, tools,
other NFI, livestock etc.)?
(Yi dwaay mana pöödhö ïni wala dhaanhø mo
ena paari ogadho ki jammi mwoa nak kiri manyo
ne gadhe, teeng koodhi, koomi, lay kimøøk?
Yes (kare)………………………...1
No (pakare)………………………2
DK .................................................... 8
(Bung gin ngääc)
|___|
7. In the last month, have you or anyone in your
household been requested increased remittances
or gifts as compared to normal?
(Yi dwaay mana pöödhö, ïni wala dhaanho mo
ena paari dogo mo peo ki kony, teeng muo, mo
cire omeedo ki go?)
Yes
(kare)…………………………....1
No
(pakare)…………………………2
DK .................................................... 8
(Bung gin ngääc)
|___|
8. In the last month, have you or anyone in your
household reduced the quantity and/or
frequency of meals and snacks?
(Yi dwaay mana pöödhö da dhaanho wala ino
kan wak rikwaan cam mono cami?)
Yes (kare)…………………………...1
No
(pakare)…………………………2
DK .................................................... 8
(Bung gin ngääc)
|___|
9. In the last month, have you or anyone in your
household begged?
(Yi ndwaay mana pöödhö. Da dhaanhÖ mo
kwayø?)
Yes (kare)……………….…….…...1
No
(pakare)…………………………2
DK .................................................... 8
(Bung gin ngääc)
|___|
10. In the last month, have you or anyone in your
household engaged in killing of wild animals,
cutting of big trees and selling, stealing, cross
boarder smuggling, charcoal burning or any other
risky or harmful activities
(Yi dwääy mana pöödhö ïni nago ki laac paap,
ïna ngudo ki jeni moa dongo, ogathige, ïna
kwatto, nyibobel, tiie moriyyo?)
Yes (kare)………………………….1
No
(pakare)…………………………2
DK .................................................... 8
(Bung gin ngääc)
|___|
SECTION 2

45
11. Now I would like to ask you about the types of
foods that you or anyone else in your household
ate yesterday during the day and at night.
(Enno amanya go ni peenya ki with caami,
mocami/ Mocam dhaanho moena paari ya
waare ka dicany / waar?)
I am interested in whether you or anyone else in
your household had the item even if it was
combined with other foods. I am interested in
knowing about meals, beverages and snacks
eaten or drank inside or outside the home.
(Yiea omiino wala ini, dhaanho mo ena paari
jire da jami, keel dee naa ojaabo ki caami mook
amanya go nee ngaa teengig gion math, caami,
soda yi paari, wok?)
READ THE LIST OF FOODS AND DO NOT
PROBE. RECORD (1) IN THE BOX IF ANYONE
IN THE HOUSEHOLD ATE THE FOOD IN
QUESTION, OR (0) IN THE BOX IF NO ONE
IN THE HOUSEHOLD ATE THE FOOD.
1. Cereals: e.g. Sorghum, maize, wheat, rice
Ya waare ki waar, dicang nyillaal acamo ki
kwon teeni:(cindi, ruuc, abay, beel?)
1…….………………………………………|___|
2. White roots and tubers: e.g. White potatoes,
white yam, white cassava, white sweet potato
or other foods made from roots (lweet jenni
mwØa tar teeng, bäälë mwØa mar, Ajwaale
mwØa tar, opeelemwØa tar ki mØØk?)
2………………………………………………|___|
3A. Vitamin A rich vegetables and tubers: e.g.
pumpkin, orange sweet potato, tomato + other
locally available vitamin A rich vegetables
Nyilaal ocamo ki with a marmoi teeng: (okono,
Ajuala mana ngweeth, tim tim?)
3A……………………………………………|___|
3B. Dark green leafy vegetables: Any dark green
leafy vegetables, including wild forms + locally
available vitamin A rich leaves such as cassava
leaves, pumpkin leaves, bean leaves kale, spinach
Nyilaal omwo ki caami ya waare/dicangi wala
ocamo ki caami moi teeng : (Bøøng Babura,
Bøøng Okonno, Boo, Nyiwacwie, kale?)
3B……………………………………………|___|
3C. Other vegetables: Any other vegetables (e.g.
cabbage, green pepper, onion, eggplant) + other
locally available vegetables Nyilaal ocamo ka
amar moi ya waare/dicangi teeng: (cabbage,
Amar mook teeng, amulle, Adamedi mana mar,
abacali, ocook?)
3C….….……………………………………|___|

46
4A. Vitamin A rich fruits: Any mango (ripe, fresh
and dried), ripe papaya, and 100% fruit juice
made from these + other locally available vitamin
A rich fruits. Nyilaal ocamo ki nyi jenni mo cipi ki
Vitamin A decani /ya waare teeng (olilu, manga,
papaya?)
4A……………………………………………|___|
4B. Other fruits: Any other fruits such as banana,
lemon, avocado including wild fruits and 100%
fruit juice made from these. Nyilaal omadho ki pi
nyi jeni teeng: (bala, leemun, abö kadö, thö?)
4B……………………………………………|___|
5A. Organ meat: Nyilaal mari ya waare/dicangi
ocamo ki: (Riing cwïny, Rogi, Wenyo obaw?)
5A………….…………………………………|___|
5B. Flesh meats: Nyilaal ya waare /dicangi acamo
ki: (Riingo?)
5B…………………………………………….|___|
6. Eggs: Nyilaal ya waare /dicangi acamo ki
(Tong gwieni, tong badho, tong akuuru?)
6………………………………………………|___|
7. Fish and seafood: Ya waare/dicangi nyilaal
acamo ki: (Rëö, caap yi naam)
7……………………….………………………|___|
8. Legumes, nuts and seeds e.g beans, yellow
split peas, groundnuts and sim sim Nyilaal
acamo y aware / dicangi ki lweet jenni, nyijeni
teeng:(Apuli, koodhi, nyimi, ngoori?)
8………………………………………………|___|
9. Milk and milk products: Any milk, infant
formula, cheese, yogurt or other milk products
Ya waare / di cangi nyilaal mari amatho ki
:(caak, dile, caack mowac)
9………………………………………………|___|
11. Oils and fats: (mäu, maar dhieng, bwob) 10……………………………………………|___|
12. Sweets: sugar, honey, sweetened soda or
sweetened juice drinks, sugary foods such as
chocolates, candies, cookies, sweet biscuits
and cakes Ya wääre. ki dicängi nyilaal mari
amdh acamö ki jame moa gweeth:(sukar,
11……………………………………………|___|

47
soda, Achir, cake, maar kïc, alaawa,
backuuth mana ngweeth)
13. Spices, condiments, beverages: (Any spices
(black pepper, salt), condiments (soy sauce,
hot sauce), coffee, tea, alcoholic beverages.
Ya waare nyilaal acamo amadho ki jammi
teeng: (Ademiti, ocoojur, acäwö, chay,
araki, buna, kwong)
12……………………….…………………|___|

48
Appendix 4: Event calendar for Gorom refugee camp, 2019
Seasons Religious Holidays Other Events Months / Years Age (M) Height Range
Harvest of groundnuts & Beans Ethiopian new year (Sept) September 2019 0
August 2019 1
Crop Weeding continues July 2019 2
Weeding of crops World refugee day (20 June) June 2019 3
May 2019 4
Planting season April 2019 5
Land preparation March 2019 6 65-70 cm February 2019 7
Renovation/Building of houses CPA & New year celebrations January 2019 8
71-76 cm Christmas (25 Dec) Gambella genocide remembrance December 2018 9
Watte sorghum harvest November 2018 10
Harvest of Sorghum October 2018 11
Harvest of groundnuts & beans Ethiopian new year (Sept) September 2018 12
August 2018 13
77-80 cm
Crop Weeding continues July 2018 14
Weeding of crops World refugee day (20 June) June 2018 15
May 2018 16
Planting season April 2018 17
Land preparation March 2018 18
February 2018 19
Renovation/Building of houses CPA & New year celebrations January 2018 20
81-86 cm Christmas (25 Dec) Gambella genocide remembrance December 2017 21
Post harvest November 2017 22
Harvest of Sorghum October 2017 23
Harvest of groundnuts & beans Ethiopian new year (Sept) September 2017 24
August 2017 25
87-90 cm
Crop Weeding continues July 2017 26
Weeding of crops World refugee day (20 June) June 2017 27
May 2017 28
Planting season April 2017 29
Land preparation March 2017 30
February 2017 31
Renovation/Building of houses CPA & New year celebrations January 2017 32
Christmas (25 Dec) Gambella genocide remembrance December 2016 33
Post harvest November 2016 34
Harvest of Sorghum October 2016 35
Harvest of groundnuts & beans Ethiopian new year (Sept) September 2016 36
August 2016 37
91-99 cm
Crop Weeding continues July 2016 38
Weeding of crops World refugee day (20 June) June 2016 39
May 2016 40
Planting season April 2016 41
Land preparation March 2016 42
February 2016 43
Renovation/Building of houses CPA & New year celebrations January 2016 44
Christmas (25 Dec) Gambella genocide remembrance December 2015 45
Post harvest November 2015 46
Harvest of Sorghum October 2015 47
Harvest of groundnuts & beans Ethiopian new year (Sept) September 2015 48
August 2015 49 100-110
cm Crop Weeding continues July 2015 50
Weeding of crops World refugee day (20 June) June 2015 51
May 2015 52
Planting season April 2015 53
Land preparation March 2015 54
February 2015 55
Renovation/Building of houses CPA & New year celebrations January 2015 56
Christmas (25 Dec) Gambella genocide remembrance December 2014 57
Post harvest November 2014 58
Harvest of Sorghum October 2014 59

49
Dark grey areas are for children not eligible for 6-59 months surveys.
How to Use a Local Events Calendar
Harvest of groundnuts & beans Ethiopian new year (Sept) September 2014 60
Survey inclusion and exclusion criteria
Survey inclusion criteria: these are the cut-off birth dates for children to be eligible to participate in the 6-59 months sample. • Included in the survey are all children born between October 2013 and September 2019.
Survey exclusion criteria: all children born as of these dates are excluded from the sample (i.e. they are over 59 months or under 6): • Excluded from the survey are all children born before October 2013 or after March 2019.
When to use the events calendar?
• The events calendar is a tool that helps determine the approximate age of children who have no reliable administrative documents (birth certificate, child’s health notebook, etc.)
• It includes all different events that occurred during the 60 months that preceded the survey and serves as a reference and checklist for surveyors and surveyed populations.
How to use the events calendar
• Use a line of questions phrased as follows: “<name> was he/she born before or after <event>?” • Choose the events in the most appropriate column of the calendar to reduce the range at each question. • The child’s mother usually knows either the age of the child in years, or the birth date (but without any official
corroboration. In both cases, it is necessary to refine the age estimation by using the events calendar. 1. When the mother knows the age in years, convert the age in months using the calendar and ask her questions relating
to the events that occurred around the child’s birth. Specify with the mother: • On the calendar, whether a particular even occurred about the time the child was born (e.g. end of Ramadan); ask the
mother whether the birth occurred before or after this event; • Ask her the season in which the child was born rain, warm or cold season, etc.; • This information will allow you to estimate the child’s age in a more reliable and accurate way. 2. When the mother knows the child’s birth date, but has no official document to prove it: • Locate the birth date on the calendar; • Ask the mother questions on events that occurred around the child’s birth (religious holiday, celebration, season, etc.) in
order to estimate the age in actual months. 3. When the mother knows neither the age nor the birth date, the events listed in the calendar will help her remember the
circumstances of her child’s birth and to estimate the age in months: • Ask the mother, or the person who cares for the child, if she remembers the period or an event that surrounded the birth
of the child; • According to her answer, ask further questions to locate the month and year of the birth. 4. When it is absolutely impossible to get any reliable indication from the mother, look for a child of similar stature in the
neighbourhood: • Determine the age of the other child; • Estimate the age difference between both children using the calendar; • Deduce the age of the surveyed child.
To determine the age of a child, the surveyor must enter on the questionnaire either the date of birth or the age in months, but not both. If the child has a health notebook or an official identity document that indicates his/her birth date; write down the birth date on the questionnaire.

50
Appendix 5 – Map of Gorom refugee camp
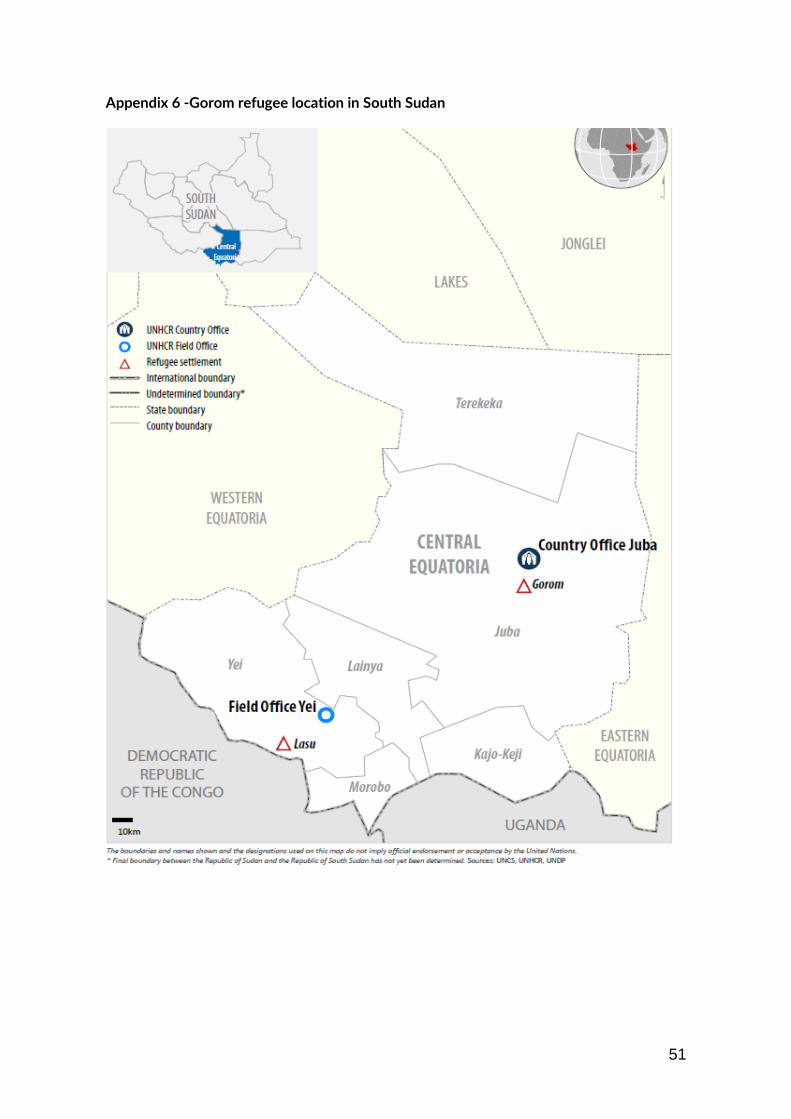
51
Appendix 6 -Gorom refugee location in South Sudan