Embed Size (px)
Citation preview

Standard for Establishing and Assigning
Benchmarks V2.2 Carbon Competitiveness Incentive Regulation
Version 2.2
December 2018

Title: Standard for Establishing and Assigning Benchmarks V2.2
Number: 2.2
Program Name: Carbon Competitiveness Incentive Regulation
Effective Date: January 1, 2018
This document was
updated on:
December 2018
Dec 2018 Standard for Establishing and Assigning Benchmarks V2.2 Page 3 of 60
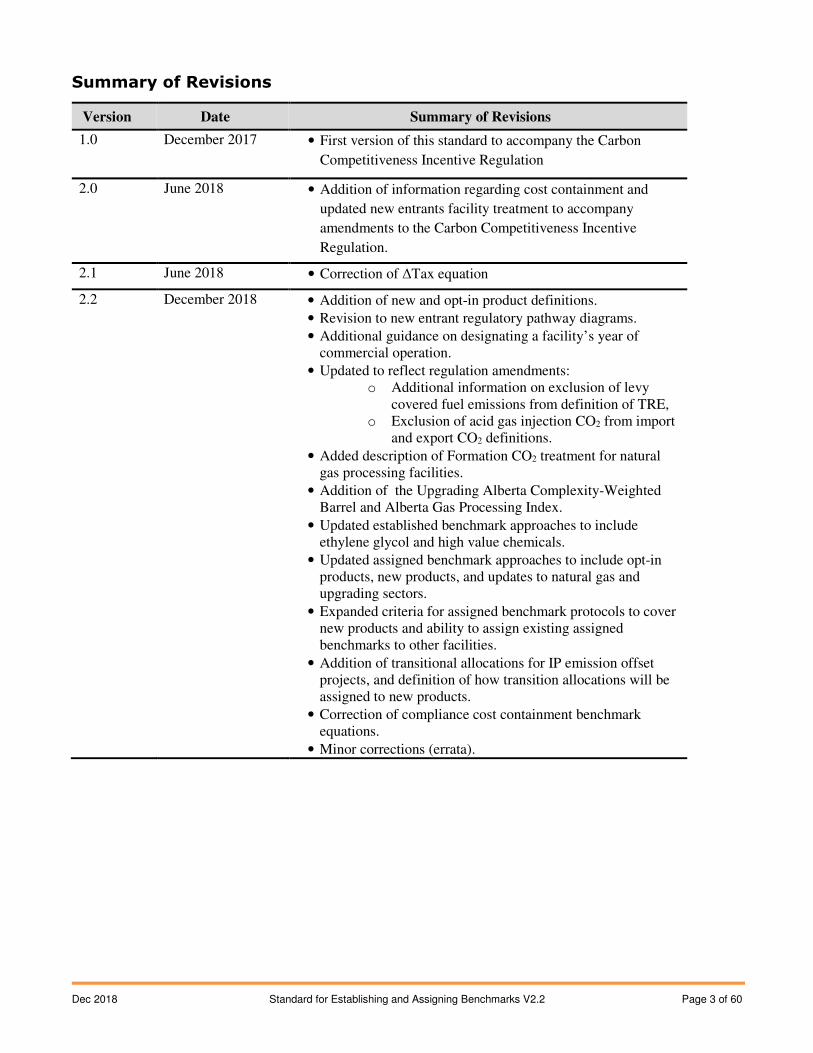
Summary of Revisions
Version Date Summary of Revisions
1.0 December 2017 • First version of this standard to accompany the Carbon
Competitiveness Incentive Regulation
2.0 June 2018 • Addition of information regarding cost containment and
updated new entrants facility treatment to accompany
amendments to the Carbon Competitiveness Incentive
Regulation.
2.1 June 2018 • Correction of ΔTax equation
2.2 December 2018 • Addition of new and opt-in product definitions.
• Revision to new entrant regulatory pathway diagrams.
• Additional guidance on designating a facility’s year of commercial operation.
• Updated to reflect regulation amendments: o Additional information on exclusion of levy
covered fuel emissions from definition of TRE, o Exclusion of acid gas injection CO2 from import
and export CO2 definitions.
• Added description of Formation CO2 treatment for natural gas processing facilities.
• Addition of the Upgrading Alberta Complexity-Weighted Barrel and Alberta Gas Processing Index.
• Updated established benchmark approaches to include ethylene glycol and high value chemicals.
• Updated assigned benchmark approaches to include opt-in products, new products, and updates to natural gas and upgrading sectors.
• Expanded criteria for assigned benchmark protocols to cover new products and ability to assign existing assigned benchmarks to other facilities.
• Addition of transitional allocations for IP emission offset projects, and definition of how transition allocations will be assigned to new products.
• Correction of compliance cost containment benchmark equations.
• Minor corrections (errata).
Dec 2018 Standard for Establishing and Assigning Benchmarks V2.2 Page 4 of 60
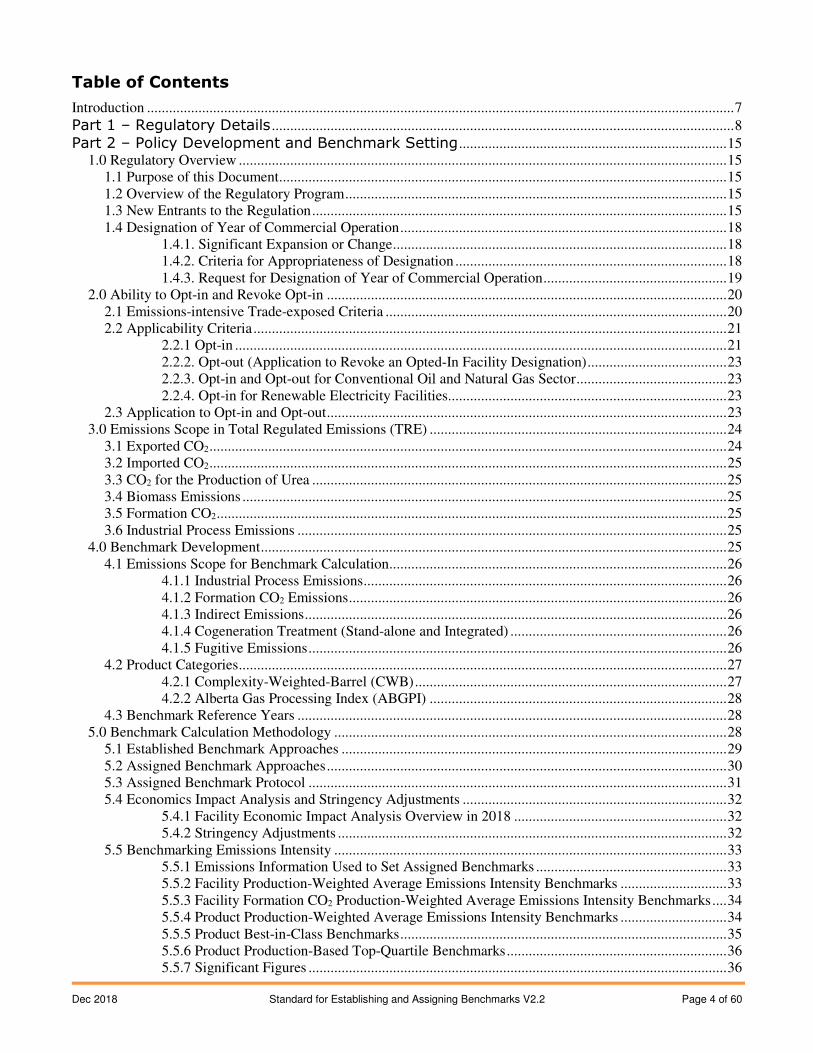
Table of Contents
Introduction ................................................................................................................................................................ 7
Part 1 – Regulatory Details .............................................................................................................................. 8
Part 2 – Policy Development and Benchmark Setting ......................................................................... 15
1.0 Regulatory Overview ..................................................................................................................................... 15
1.1 Purpose of this Document .......................................................................................................................... 15
1.2 Overview of the Regulatory Program ........................................................................................................ 15
1.3 New Entrants to the Regulation ................................................................................................................. 15
1.4 Designation of Year of Commercial Operation ......................................................................................... 18
1.4.1. Significant Expansion or Change ........................................................................................... 18
1.4.2. Criteria for Appropriateness of Designation .......................................................................... 18
1.4.3. Request for Designation of Year of Commercial Operation .................................................. 19
2.0 Ability to Opt-in and Revoke Opt-in ............................................................................................................. 20
2.1 Emissions-intensive Trade-exposed Criteria ............................................................................................. 20
2.2 Applicability Criteria ................................................................................................................................. 21
2.2.1 Opt-in ...................................................................................................................................... 21
2.2.2. Opt-out (Application to Revoke an Opted-In Facility Designation) ...................................... 23
2.2.3. Opt-in and Opt-out for Conventional Oil and Natural Gas Sector ......................................... 23
2.2.4. Opt-in for Renewable Electricity Facilities ............................................................................ 23
2.3 Application to Opt-in and Opt-out ............................................................................................................. 23
3.0 Emissions Scope in Total Regulated Emissions (TRE) ................................................................................. 24
3.1 Exported CO2 ............................................................................................................................................. 24
3.2 Imported CO2 ............................................................................................................................................. 25
3.3 CO2 for the Production of Urea ................................................................................................................. 25
3.4 Biomass Emissions .................................................................................................................................... 25
3.5 Formation CO2 ........................................................................................................................................... 25
3.6 Industrial Process Emissions ..................................................................................................................... 25
4.0 Benchmark Development ............................................................................................................................... 25
4.1 Emissions Scope for Benchmark Calculation ............................................................................................ 26
4.1.1 Industrial Process Emissions ................................................................................................... 26
4.1.2 Formation CO2 Emissions ....................................................................................................... 26
4.1.3 Indirect Emissions ................................................................................................................... 26
4.1.4 Cogeneration Treatment (Stand-alone and Integrated) ........................................................... 26
4.1.5 Fugitive Emissions .................................................................................................................. 26
4.2 Product Categories ..................................................................................................................................... 27
4.2.1 Complexity-Weighted-Barrel (CWB) ..................................................................................... 27
4.2.2 Alberta Gas Processing Index (ABGPI) ................................................................................. 28
4.3 Benchmark Reference Years ..................................................................................................................... 28
5.0 Benchmark Calculation Methodology ........................................................................................................... 28
5.1 Established Benchmark Approaches ......................................................................................................... 29
5.2 Assigned Benchmark Approaches ............................................................................................................. 30
5.3 Assigned Benchmark Protocol .................................................................................................................. 31
5.4 Economics Impact Analysis and Stringency Adjustments ........................................................................ 32
5.4.1 Facility Economic Impact Analysis Overview in 2018 .......................................................... 32
5.4.2 Stringency Adjustments .......................................................................................................... 32
5.5 Benchmarking Emissions Intensity ........................................................................................................... 33
5.5.1 Emissions Information Used to Set Assigned Benchmarks .................................................... 33
5.5.2 Facility Production-Weighted Average Emissions Intensity Benchmarks ............................. 33
5.5.3 Facility Formation CO2 Production-Weighted Average Emissions Intensity Benchmarks .... 34
5.5.4 Product Production-Weighted Average Emissions Intensity Benchmarks ............................. 34
5.5.5 Product Best-in-Class Benchmarks ......................................................................................... 35
5.5.6 Product Production-Based Top-Quartile Benchmarks ............................................................ 36
5.5.7 Significant Figures .................................................................................................................. 36
Dec 2018 Standard for Establishing and Assigning Benchmarks V2.2 Page 5 of 60
5.6 Tightening Rate ......................................................................................................................................... 36
5.7 Phase-in/Transition Allocation Benchmarks ............................................................................................. 37
5.7.1 TA Benchmark for Facilities which had active, pre-existing Alberta Emission Offset Project(s) with IP Emissions Reductions when the CCIR came into Effect .................................... 39
5.7.2 TA Benchmark for the Product of a Facility ........................................................................... 40
5.7.3 TA Benchmarks for New Products in 2018 or 2019 ............................................................... 41
5.8 Application for an Assigned Benchmark ................................................................................................... 42
5.9 Emissions Performance Plan Submission .................................................................................................. 42
6.0 Ability to Receive Cost Containment Designation and Revoke Cost Containment Designation .................. 43
6.1 Economic Hardship Criteria ...................................................................................................................... 43
6.1.1 Economic Hardship Attributable to Incremental Compliance Costs ...................................... 44
6.1.2 Incremental Compliance Costs ............................................................................................... 44
6.1.3 Sales Test ................................................................................................................................ 45
6.1.4 Profit Test ................................................................................................................................ 45
6.1.5 Weighted-Mean Sales Price .................................................................................................... 46
6.1.6 Alternative Economic Hardship Tests .................................................................................... 46
6.1.7 Significant Figures .................................................................................................................. 46
6.2 Application for Cost Containment Designation ........................................................................................ 46
6.3 Cost Containment Relief Mechanisms ...................................................................................................... 47
6.3.1 Compliance Flexibility ............................................................................................................ 48
6.3.2 Compliance Cost Containment Allocation Benchmarks (BCCAs) ......................................... 48
6.4 Emissions Reduction Plan ......................................................................................................................... 52
6.4.1 Emissions Reduction Plan ....................................................................................................... 52
6.4.2 Annual Emissions Reduction Plan Report .............................................................................. 52
List of Tables
Table 1: Sectors and Products that Compete Directly with Facilities regulated by CCIR ....................................... 21
Table 2: Sectors that are Emissions Intensive and Trade Exposed and include at least one facility that meets or exceeds 50,000 tonnes .............................................................................................................................................. 22
Table 3: Benchmarking approach for sector-product categories .............................................................................. 29
Table 4: Current assigned benchmark approaches for sectors with two or more facilities. ..................................... 30
Table 5: Illustrative example of how the production-based top quartile benchmarking approach is applied across seven facilities. ......................................................................................................................................................... 36
Table A1: Fuel prices applied to CANSIM Table 381 0033, 2013 to convert value of fuel used to emissions. ...... 54
Table A2: Emissions factors applied to fuel use calculated based on Table A1 ...................................................... 55
Table A3: Conversion Factors applied ..................................................................................................................... 55
Table A4: Sectors evaluated based on NAICS Codes (based on 2013 data) .......................................................... 55
Table A5: Sector Assigned Benchmark Values ....................................................................................................... 58
Table A6: AB-CWB Factors for Hydrogen Generation at Refining and Upgrading Facilities ................................ 58
Table A7: Oil Equivalent Factors used in the Calculation of m3 of Oil Equivalent ................................................. 58
Table A8: Trade Exposure by Sector ....................................................................................................................... 59
Table A9: Climate Change Emissions Management Fund (CCEMF) Credit Price Assumptions ............................ 60
Table A10: Profit Margin Ratios for Industry Groups or Sectors ............................................................................ 60
List of Figures
Figure 1: New Entrant Regulatory Pathway for 2018. ............................................................................................. 16
Figure 2: New Entrant Regulatory Pathway for 2019 and Subsequent Years. ......................................................... 17
List of Appendices
APPENDIX A .......................................................................................................................................................... 54
Dec 2018 Standard for Establishing and Assigning Benchmarks V2.2 Page 6 of 60
Alberta Climate Change Office Related Publications
• Climate Change and Emissions Management Act
• Carbon Competitiveness Incentive Regulation
• Specified Gas Reporting Regulation
• Standard for Greenhouse Gas Emission Offset Project Developers
• Standard for Completing Greenhouse Gas Compliance and Forecasting Reports
• Technical Guidance for Landfill Operators
• Landfill With Partial Gas Collection Workbook
• Standard for Validation, Verification and Audit
• Quantification Methodologies for the Carbon Competitiveness Incentive Regulation and the Specified
Gas Reporting Program
• Guidance for the Quantification of Area Fugitive Emissions at Oil Sands Mines Consolidated
Reporting Form

Dec 2018 Standard for Establishing and Assigning Benchmarks V2.2 Page 7 of 60
Introduction
Part 1 of the Standard for Establishing and Assigning Benchmarks is adopted by the Carbon Competitiveness Incentive Regulation (the “Regulation”), under the authority of section 61 of the Climate Change and Emissions Management Act (the “Act”). Part 1 of the Standard is enforceable as law.
In addition to the legal requirements in Part 1 of this standard, persons responsible must comply with the Act, the Regulation, and all other applicable laws.
Part 2 of the Standard for Establishing and Assigning Benchmarks sets out additional requirements for persons responsible.
Any changes to this Standard from version 1.0 are effective as of the date of publication.
Dec 2018 Standard for Establishing and Assigning Benchmarks V2.2 Page 8 of 60
Part 1 – Regulatory Details
Definitions
1(1) Terms that are defined in the Act and Regulation are incorporated into and become part of this standard.
(2) In this standard,
(a) “AB-CWB” means Alberta Complexity Weighted Barrel, which is a standardized volumetric
production unit of a refining facility or upgrading facility in Alberta, which is used to represent its
specified gas emissions potential based on its configuration and processing complexity;
(b) “ABGPI” means Alberta Gas Processing Index, which is a modular production metric used to
represent the specified gas emissions potential of an Alberta natural gas processing facility;
(c) “ammonia” means a colourless compound with the chemical formula NH3 that is typically produced
by steam-methane reformation, followed by the reaction of hydrogen with atmospheric nitrogen. For
ammonia produced by a fertilizer plant, ammonia is the gross production from the ammonia plant. For
ammonia produced in the metals sector, the ammonia is the ammonia sales.
(d) “baseline emissions obligation” means the baseline emissions obligation identified in a Baseline
Obligation form described in section 6(1)(d);
(e) “calcined coke” means a carbon-rich solid that is typically produced by the heating of green coke in a
rotary kiln at high temperatures to remove residual volatile hydrocarbons;
(f) “ethanol” means a mixture whose most abundant component is the organic compound with the
molecular formula C2H5OH, which is denatured by adding other chemical compounds such as
methanol, isopropyl alcohol, acetone, methyl ethyl ketone, methyl isobutyl ketone, denatonium,
gasoline, xylene, or toluene, in order to render it unfit for human ingestion;
(g) “ethyl alcohol” means a mixture which contains un-denatured food grade alcohol and is intended for
human ingestion, including liquor and spirits, but excluding beer and wine;
(h) “iso-octane” means an organic compound also known as 2,2,4-Trimethylpentane, with the chemical
formula (CH3)3CCH2CH(CH3)2, that is typically produced by the dimerization of isobutylene
followed by hydrogenation, and includes the pentane by-product resulting from the production of iso-
octane;
(i) “landfill gas methane” means methane generated by the anaerobic decomposition of organic waste
materials within a waste management facility at which waste is disposed of by placing it on or in land,
but does not include a land treatment facility, a surface impoundment, a salt cavern or a disposal well;
(j) “live weight of cattle” means the mass of live animals entering a meat processing facility;
(k) “nickel + cobalt” also referred to as “Metals” means the total sum of pure nickel and cobalt typically
produced by the refining of ore through pressure hydrometallurgy;
(l) “natural gas processing” means the treatment of raw natural gas by the extraction of hydrogen
sulphide, carbon dioxide, helium, ethane, natural gas liquids or other substances;
(m) “natural gas transmission networks” means the network of infrastructure, including pipelines,
designed to transport natural gas from processing facilities to areas of natural gas demand;
(n) “other fertilizer products” means a product comprising a combination of fertilizer products including
one or more of urea, coated urea, ammonium sulphate, ammonium phosphate, and UAN, but
excluding ammonia and ammonium nitrate;
Dec 2018 Standard for Establishing and Assigning Benchmarks V2.2 Page 9 of 60
(o) “Part 1” means the portion of this standard identified by the subtitle “Part 1 – Regulatory Details”;
(p) “Part 2” means the portion of this standard identified by the subtitle “Part 2 – Policy Development
and Benchmark Setting”;
(q) “polyethylene” means a compound typically having the chemical formula of (C2H4)n produced by the
polymerization of ethylene and includes, but is not limited to low density polyethylene (LDPE), linear
low density polyethylene (LLDPE), and high density polyethylene (HDPE);
(r) “Refining AB-CWB” means the AB-CWB for a refining facility;
(s) “Regulation” means the Carbon Competitiveness Incentive Regulation, as amended;
(t) “subbituminous coal” means coal that is recovered or obtained from a coal mine located in the Plains
Region as defined in the Natural Regions and Sub-regions of Alberta published by the department, as
amended or replaced from time to time;
(u) “this standard” means the Standard for Establishing and Assigning Benchmarks, including the
Introduction, Part 1, and Part 2;
(v) “upgrading” means the processing of oil sands bitumen to create a feedstock for further refining;
(w) “Upgrading AB-CWB” means the AB-CWB for an upgrading facility;
(x) “weighted mean sales price” means the weighted mean sales price (WMSP) in Canadian dollars
calculated in accordance with 6.1.5 of Part 2 of this standard.
In the event of a conflict
2(1) If there is any conflict between this standard and the Act or the Regulation, the Act or the Regulation prevails over this standard.
(2) If there is any conflict between Part 1 and Part 2 of this standard, Part 1 prevails.
Application for assigned benchmark
3(1) In preparing the application under section 9 of the Regulation, the person responsible for a facility must hire a third party assurance provider to
(a) verify the application, and
(b) prepare a verification report
in accordance with the Standard for Validation, Verification and Audit.
(2) In an application submitted under section 9 of the Regulation, the person responsible for a facility must include each of the following:
(a) the contact information for the person responsible;
(b) the contact information for the facility;
(c) the location of the facility;
(d) information on the boundaries of the facility including at least where imports and exports of fuels, inputs, products, and CO2 are measured;
(e) information on the emissions and production from the facility, including but not limited to:
(i) data related to the total regulated emissions of the facility,
(ii) production of all products listed in the table in Schedule 2 of the Regulation,
(iii) the amount of electricity imported to the facility,
Dec 2018 Standard for Establishing and Assigning Benchmarks V2.2 Page 10 of 60
(iv) the amount of heat imported to the facility,
(v) the amount of hydrogen imported to the facility,
(vi) any other information required by the director;
(f) a process flow diagram that indicates in schematic detail: (i) the processes that produce direct emissions at the facility, and
(ii) each source of direct emissions that typically produces over 1,000 tonnes of carbon dioxide
equivalent and including any of the following
(A) imported carbon dioxide,
(B) exported carbon dioxide, and
(C) carbon dioxide used as feedstock for the production of urea;
(g) information for each product the facility produces that requires an assigned benchmark including each of the following:
(i) the type of product,
(ii) the quantity of product produced,
(iii) the direct emissions released as a result of the production of the product,
(iv) the amount of carbon dioxide produced as a result of the production of the product that is exported from the facility,
(v) the amount of carbon dioxide imported on site from a different facility to which the Regulation applies that is used in the production of the product,
(vi) in the case of the product urea, the amount of carbon dioxide used by the facility as feedstock for the production of that urea, and
(vii) any other information required by the director;
(h) the following forms as prescribed by the director:
(i) a third party verification report completed under section 3(1)(a)
(ii) a completed Conflict-of-Interest Checklist,
(iii) a completed Statement of Qualification form,
(iv) a completed Statement of Verification form,
(v) a simplified process flow diagram,
(vi) a completed Quantification Methodology Document (QMD),
(vii) a completed Statement of Certification form that must be in electronic form, and
(viii) where the person responsible is requesting confidentiality for any of the information included in the application, a completed Confidentiality Request and supporting documentation;
(i) in the case of a person responsible for a facility in or prior to its 3rd year of commercial operation that is submitting an emissions performance plan, documentation demonstrating that the technology being applied at the facility meets
(i) best in class performance, or
(ii) best available technology that is economically achievable;
and
Dec 2018 Standard for Establishing and Assigning Benchmarks V2.2 Page 11 of 60
(j) any other information required by the director.
Application for facility to be designated as an opted-in facility
4(1) In an application submitted under section 4(2) of the Regulation, the person responsible for a facility must include each of the following:
(a) the contact information for the person responsible;
(b) the contact information for the facility;
(c) the location of the facility;
(d) evidence demonstrating that the facility
(i) competes directly with a facility to which the Regulation applies, or
(ii) is in an emissions-intensive trade-exposed sector and that the facility
(A) had total regulated emissions of 50 000 tonnes or more in 2013 or a subsequent year, or
(B) is likely to have total regulated emissions of 50 000 tonnes or more in its third year of commercial operation;
(e) information on any benefit that has been or is being provided in respect of the facility under an initiative of the Government of Alberta, or an agency of the Government of Alberta that may alleviate the cost of the carbon levy under the Climate Leadership Act in respect of the facility;
(f) where the facility is a renewable electricity facility:
(i) the total nominal capacity of the facility,
(ii) information respecting any renewable electricity support agreement that has been entered into under section 7(4) of the Renewable Electricity Act with respect to the facility, and
(iii) information on any economic benefits being provided under a program or other scheme that are attributable to the electricity produced at the facility having been produced from an energy resource referred to in section 1(1)(dd) of the Regulation;
(g) a completed Statement of Certification form that must be in electronic form;
(h) where the person responsible is requesting confidentiality for any of the information included in the application, a completed Confidentiality Request and supporting documentation, and
(i) any other information required by the director.
(2) In preparing the application under section 4(2) of the Regulation, the person responsible for a facility must comply with the requirement that the Statement of Certification required in section 4(1)(g) of this standard must only be signed by a certifying official with signing authority on behalf of the facility.
Application for designation as opted-in facility to be revoked
5(1) In an application submitted under section 4(6) of the Regulation, the person responsible for a facility must include each of the following:
(a) the contact information for the person responsible;
(b) the contact information for the facility;
(c) the location of the facility;
(d) evidence demonstrating how the Climate Leadership Act or any alternate regulatory system applies to the total regulated emissions of the facility and
(e) a completed Statement of Certification that must be electronic form.
Dec 2018 Standard for Establishing and Assigning Benchmarks V2.2 Page 12 of 60
(2) In preparing the application under section 4(6) of the Regulation, the person responsible for a facility must comply with the requirement that the Statement of Certification required in section 3(2)(h)(vi) of this standard must only be signed by a certifying official with signing authority on behalf of the facility.
Application for cost containment designation
6(1) In an application submitted under section 34.2(1) of the Regulation, the person responsible for a facility must include each of the following:
(a) the contact information for the person responsible;
(b) the contact information for the facility;
(c) the location of the facility;
(d) a completed Baseline Obligation form as prescribed by the director for each year for which the person
responsible for the facility is seeking a cost containment designation;
(e) a certified forecast for the facility of each of the following:
(i) the true-up obligation,
(ii) the total regulated emissions,
(iii) production to be sold,
(iv) net electricity import or export,
(v) net heat import or export,
(vi) net hydrogen import or export,
(vii) the weighted mean sales price for each product produced by the facility and sold,
(viii) the amount of royalties that will be paid in respect of the facility to the Government of
Alberta under the Mines and Minerals Act,
(ix) the amount of royalties that would be paid in respect of the facility to the Government of
Alberta under the Mines and Minerals Act, if the Regulation and the Climate Leadership
Act were not in force, and
(x) the amount of royalties that would be paid in respect of the facility to the Government of
Alberta under the Mines and Minerals Act, if the true-up obligation for the facility for each
year was equivalent to the baseline emission obligation identified in the Baseline
Obligation Form for that year and the amount of money that a person had to contribute to
obtain a fund credit in that year was $15,
for each year for which the person responsible for the facility is seeking a cost containment
designation;
(f) information on any benefit that has been, is being, or will be provided to the person responsible for
the facility in respect of the facility under an initiative of the Government of Alberta, or an agency of
the Government of Alberta;
(g) information on the timeframe for facility permanent closure, temporary closure, or intentional
operation at reduced capacity, where applicable;
(h) where the person responsible is requesting confidentiality for any of the information included in the
application, a completed Confidentiality Request and supporting documentation;
Dec 2018 Standard for Establishing and Assigning Benchmarks V2.2 Page 13 of 60
(i) the amount of royalties that would have been paid in respect of the facility to the Government of
Alberta under the Mines and Minerals Act, for each of the three years of commercial operation
immediately preceding the date the application is submitted under section 34.2(1) of the Regulation,
if the Regulation, the Specified Gas Emitters Regulation, and the Climate Leadership Act were not in
force during that time; and
(j) any other information required by the director.
(2) In the financial statements for the facility required under section 34.2(2)(b) of the Regulation, the person responsible for the facility must include at a minimum each of the following:
(a) the total quantity of each product produced by the facility and sold, based on sales transactions;
(b) if applicable, confirmation that the quantity of each product produced by the facility and sold, as
reported under subsection (2)(a), is equal to the quantity of product produced by the facility and sold
as reported under the Mines and Minerals Act, and where there is a discrepancy, an explanation for
the discrepancy;
(c) the weighted mean sales price for each product produced by the facility and sold, based on the actual
sales price of transactions for the product sold from the facility;
(d) if applicable, confirmation that the weighted-mean sales price for each product produced by the
facility and sold, as reported under subsection (2)(c), is equal to any sales price as reported under the
Mines and Minerals Act, and where there is a discrepancy, an explanation for the discrepancy;
(e) if applicable, the amount of royalties paid in respect of the facility to the Government of Alberta
under the Mines and Minerals Act
for each of the three years of commercial operation immediately preceding the date the application is submitted under section 34.2(1) of the Regulation.
(3) In an emissions reduction plan submitted under section 34.2(2)(c) of the Regulation, the person responsible for a facility must include at least each of the following:
(a) all specified gas emissions and sources at the facility which are intended to be impacted by the plan;
(b) the quantity of emission offsets and emission performance credits the person responsible for the
facility intends to use in determining the net emissions for the facility for each year for which the
person responsible for the facility is seeking a cost containment designation;
(c) a description of each proposed emissions reduction project to be implemented under the emissions
reduction plan;
(d) identification of, and rationale for, the emissions baseline that will be used for each proposed
emissions reduction project;
(e) the projected reduction in emissions associated with each proposed emissions reduction project;
(f) a schedule of implementation for each proposed emissions reduction project, including identification
of any project milestones;
(g) a projected timeframe for expected specified gas emission reductions;
(h) a monitoring plan to assess emissions reductions over the course of each emission reduction project;
(i) an estimate of capital costs and annual operating costs required to implement the emissions reduction
plan;
Dec 2018 Standard for Establishing and Assigning Benchmarks V2.2 Page 14 of 60
(j) any benefit that the person responsible has applied for in respect of the facility under an initiative of
the Government of Alberta, or an agency of the Government of Alberta, but that has not yet been
granted that would support capital and operating cost expenditures required to implement the
emissions reduction plan, and the impact on the emissions reduction plan if the application for the
benefit is not approved; and
(k) a completed Statement of Certification for subsections (a) through (i).
(4) The person responsible for a facility must comply with the requirement that the Statement of Certification required in section 6(3)(k) must only be signed by a certifying official with signing authority on behalf of the facility.
Effective date
7 This standard is effective January 1, 2018.
Dec 2018 Standard for Establishing and Assigning Benchmarks V2.2 Page 15 of 60
Part 2 – Policy Development and Benchmark Setting
1.0 Regulatory Overview
1.1 Purpose of this Document
The purpose of this document is to assist persons responsible for facilities that are regulated by, or considering application to be regulated by, the Carbon Competitiveness Incentive Regulation (the “CCIR” or “the Regulation”). The document outlines the methods for establishing and assigning emissions intensity benchmarks that apply to the production of goods and processes at regulated facilities. This document outlines how benchmarks are developed, including data sets and methodology used for calculating benchmarks. It also outlines criteria detailing opt-in eligibility and the application process for opt-in to the CCIR. Additional information regarding details on emissions scope and coverage, tightening rate, review periods, the assignment of transition allocation benchmarks, and the eligibility and application process for cost containment is also provided.
1.2 Overview of the Regulatory Program
The CCIR replaced the Specified Gas Emitters Regulation on January 1, 2018. As part of the Climate Leadership Plan, the CCIR was introduced for facilities emitting 100,000 or more tonnes of carbon dioxide equivalent (CO2e) specified gas emissions per year in 2003 or any subsequent year. Under the Regulation, the opportunity to opt-in to be regulated by the CCIR is provided to facilities below this threshold.
The Regulation reduces carbon costs for these industries when compared to the carbon levy and provides top performers credits for low emissions intensity. The Regulation also supports comparability with carbon pricing in other jurisdictions. This is intended to help to maintain industry competitiveness in Alberta.
This Regulation is enabled by the Climate Change and Emissions Management Act (2003). The Specified Gas Reporting Regulation (SGRR) (AR 251/2004), requires facilities that meet or exceed a specified gas emission threshold, which is currently10,000 tonnes CO2e per year, to report their specified gas emissions. Any facility regulated under CCIR must report under SGRR.
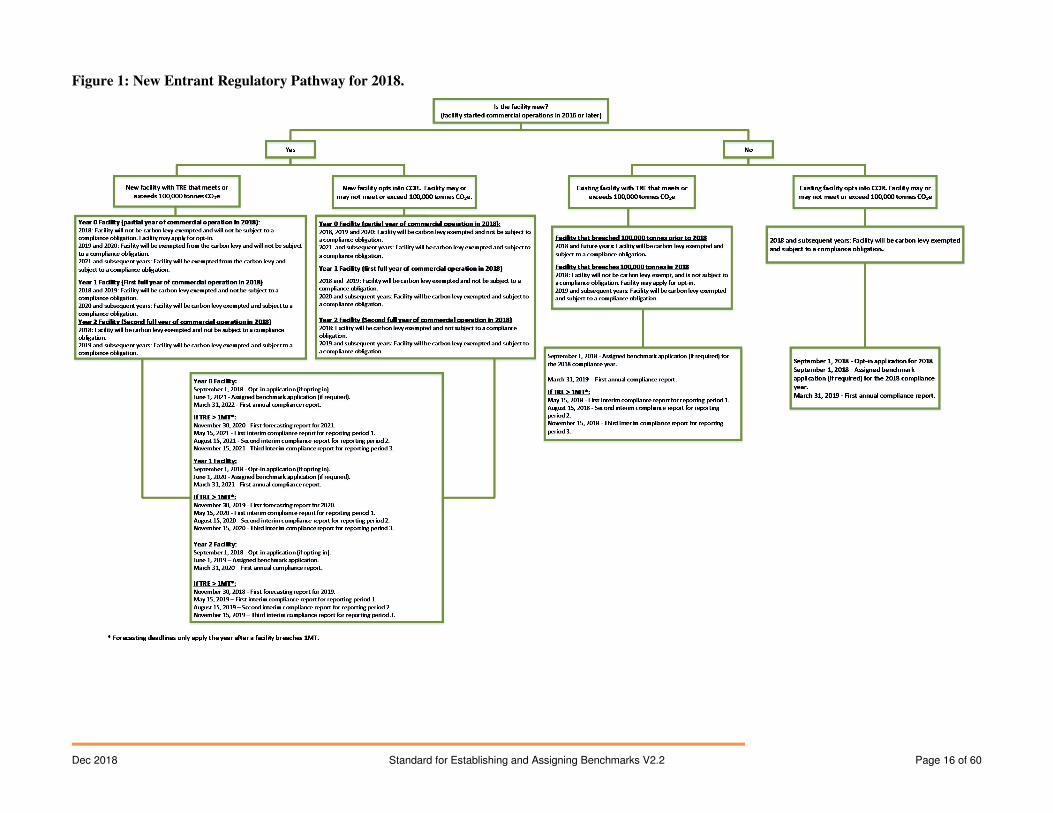
1.3 New Entrants to the Regulation
Figures 1 and 2 provide the regulatory pathways for facilities entering the CCIR in 2018 and 2019 or subsequent years, respectively. In these figures, the first partial year of commercial operations is considered to be “Year 0”, while the first full year of commercial operation is considered to be “Year 1”, the second full year of commercial operation is considered “Year 2” and so forth.
Facilities not covered by the regulatory pathways illustrated should contact the director for further guidance.
Dec 2018 Standard for Establishing and Assigning Benchmarks V2.2 Page 16 of 60
Figure 1: New Entrant Regulatory Pathway for 2018.

Dec 2018 Standard for Establishing and Assigning Benchmarks V2.2 Page 17 of 60
Figure 2: New Entrant Regulatory Pathway for 2019 and Subsequent Years.
Is the facility new?
(Facility in Year 0, Year 1 or Year 2)
Yes No
New facility with TRE that meets or
exceeds 100,000 tonnes CO2e
New facility opts into CCIR. Facility may
or may not meet or exceed 100,000
tonnes CO2e.
Existing faci lity with TRE that meets or
exceeds 100,000 tonnes CO2e
Existing faci lity opts into CCIR. Facility
may or may not meet or exceed
100,000 tonnes CO2e
Facility that has breached 100,000 tonnes in a previous year
Facility will be carbon levy exempted and subject to a compliance
obligation.
Facility that breaches 100,000 tonnes in current year (2019 or
any subsequent year
Facility will not be carbon levy exempted for the year in which the
facility breaches 100,000 tonnes and it will not have a compliance
obligation. Facility may apply to opt-in.
Facility will be carbon levy exempted and subject to a compliance
obligation for the year after it breaches 100 000 tonnes.
Facility will be carbon levy exempted and subject to a compliance
obligation in the year that the facility opts in and subsequent
years.
Facilities that breach 100,000 tonnes in Year 0
Year 0 - Facility will not be carbon levy exempted and not subject to a compliance
obligation. Facility may apply to opt-in.
Year 1 and 2 - Facility will be carbon levy exempted and not be subject to a
compliance obligation.
Year 3 - Facility will be carbon levy exempted and subject to a compliance obligation.
Facilities that breach 100,000 tonnes in Year 1
Year 1 - Facility will not be carbon levy exempted and not be subject to a
compliance obligation. Facility may apply to opt-in.
Year 2 - Facility will be carbon levy exempted and not be subject to a compliance
obligation.
Year 3 - Facility will be carbon levy exempted and subject to a compliance obligation.
Facilities that breach 100,000 tonnes in Year 2
Year 2 – Facilities will not be carbon levy exempted and not be subject to a
compliance obligation. Facilities may apply to opt-in
Year 3 – Facilities will be carbon levy exempted and subject to a compliance
obligation.
Years 0, 1 and 2 - Facility will be carbon levy exempted and
not be subject to a compliance obligation
Year 3 - Facility will be carbon levy exempted and subject to a
compliance obligation.
December 31, 2018 – Opt-in application for 2019
June 1 of the year before opting-in - Opt-in application (if opting in for subsequent years)
June 1 of Year 3 - Assigned benchmark application (if required)
March 31 of Year 4 - First annual compliance report (for Year 3)
If TRE > 1MT*:
November 30 of Year 2 - First forecasting report for Year 3
May 15 of Year 3 - First interim compliance report for reporting period 1
August 15 of Year 3 - Second interim compliance report for reporting period 2
November 15 of Year 3 - Third interim compliance report for reporting period 3
June 1 (same year as first compliance obligation) -
Assigned benchmark application (if required)
March 31 - Annual compliance report for previous
compliance year
If TRE > 1MT*:
November 30 - Annual forecasting report for the following full
compliance year
May 15 of the forecasted year - Interim compliance report for
reporting period 1
August 15 of the forecasted year - Interim compliance report for
reporting period 2
November 15 of the forecasted year - Interim compliance report
for reporting period 3
December 31, 2018 – Opt-in application for 2019
June 1 (year before first compliance obligation) -
Opt-in application for subsequent years.
June 1 (same year as first compliance obligation) -
Assigned benchmark application (if required)
March 31 (year after first compliance) - First annual
compliance report
* Forecasting deadlines only apply the year after a facility breaches 1MT.
Dec 2018 Standard for Establishing and Assigning Benchmarks V2.2 Page 18 of 60
© 2017 Government of Alberta
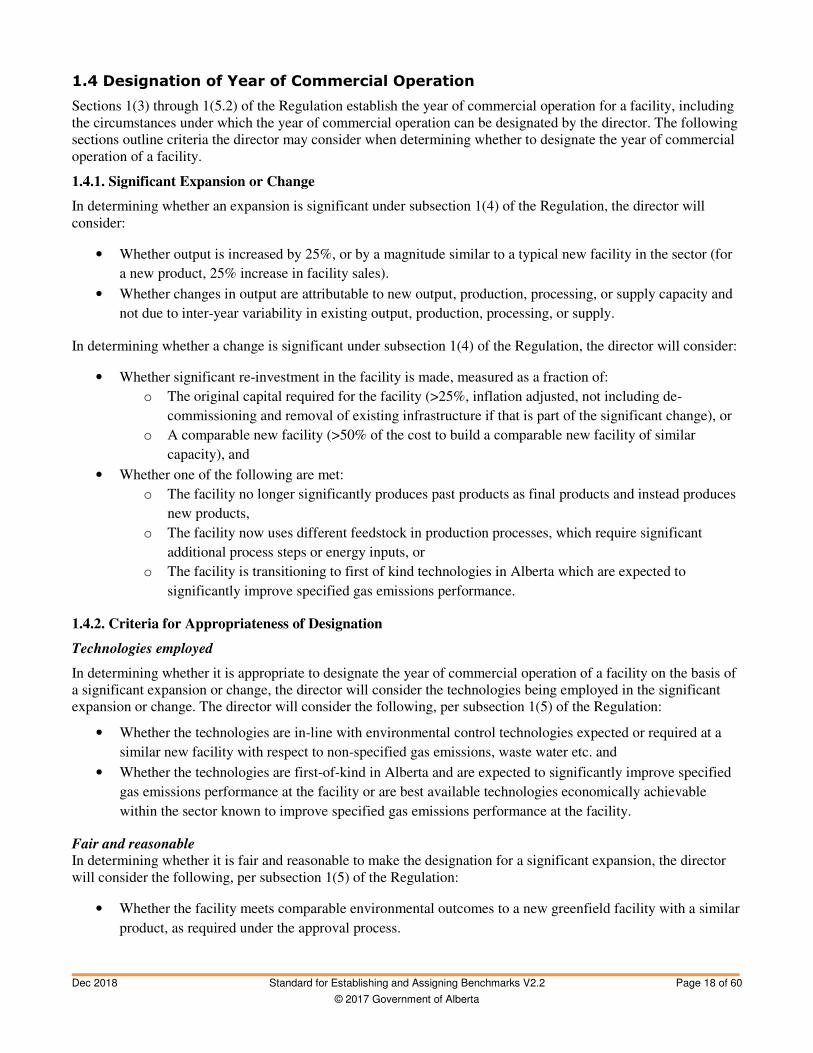
1.4 Designation of Year of Commercial Operation
Sections 1(3) through 1(5.2) of the Regulation establish the year of commercial operation for a facility, including the circumstances under which the year of commercial operation can be designated by the director. The following sections outline criteria the director may consider when determining whether to designate the year of commercial operation of a facility.
1.4.1. Significant Expansion or Change
In determining whether an expansion is significant under subsection 1(4) of the Regulation, the director will consider:
• Whether output is increased by 25%, or by a magnitude similar to a typical new facility in the sector (for
a new product, 25% increase in facility sales).
• Whether changes in output are attributable to new output, production, processing, or supply capacity and
not due to inter-year variability in existing output, production, processing, or supply.
In determining whether a change is significant under subsection 1(4) of the Regulation, the director will consider:
• Whether significant re-investment in the facility is made, measured as a fraction of:
o The original capital required for the facility (>25%, inflation adjusted, not including de-
commissioning and removal of existing infrastructure if that is part of the significant change), or
o A comparable new facility (>50% of the cost to build a comparable new facility of similar
capacity), and
• Whether one of the following are met:
o The facility no longer significantly produces past products as final products and instead produces
new products,
o The facility now uses different feedstock in production processes, which require significant
additional process steps or energy inputs, or
o The facility is transitioning to first of kind technologies in Alberta which are expected to
significantly improve specified gas emissions performance.
1.4.2. Criteria for Appropriateness of Designation
Technologies employed
In determining whether it is appropriate to designate the year of commercial operation of a facility on the basis of a significant expansion or change, the director will consider the technologies being employed in the significant expansion or change. The director will consider the following, per subsection 1(5) of the Regulation:
• Whether the technologies are in-line with environmental control technologies expected or required at a
similar new facility with respect to non-specified gas emissions, waste water etc. and
• Whether the technologies are first-of-kind in Alberta and are expected to significantly improve specified
gas emissions performance at the facility or are best available technologies economically achievable
within the sector known to improve specified gas emissions performance at the facility.
Fair and reasonable
In determining whether it is fair and reasonable to make the designation for a significant expansion, the director will consider the following, per subsection 1(5) of the Regulation:
• Whether the facility meets comparable environmental outcomes to a new greenfield facility with a similar
product, as required under the approval process.
Dec 2018 Standard for Establishing and Assigning Benchmarks V2.2 Page 19 of 60
In determining whether it is fair and reasonable to make the designation for a significant change, the director will consider the following, per subsection 1(5) of the Regulation:
• Whether the facility meets comparable environmental outcomes to a new facility with a similar product,
as required under the approval process,
In considering whether it is fair and reasonable to designate the year of commercial operation of a facility for a significant change or significant expansion, the director will consider the effect that granting compliance relief through year of commercial operation would have on specified gas emissions over the life of the facility. This will generally include:
• the impact of the change to the specified gas profile of the facility
• the potential of the expanded or modified production to displace higher emitting production
• the potential of the granting to de-risk adoption of new specified gas reducing technologies
The director will also consider:
• the treatment of other comparable or competing facilities where new facilities would receive the period of
relief.
• the comparability of cost savings through compliance relief versus investment of capital in the facility.
If the year of commercial operation is being designated in the case of a significant expansion or significant change the designation will be made for either the year of or the year following the significant expansion or significant change and may be made as either the first or second year of commercial operation. In cases where a significant change causes a significant drop in emissions intensity, designation for the year following the significant change will be preferred.
1.4.3. Request for Designation of Year of Commercial Operation
Requests for designation of commercial operation under section 1(4) should be received no later than Nov 30th of the year to which the designation is to first apply. A request for a designation under section 1(4) of the Regulation for a facility that is undergoing or has undergone a significant expansion should include:
• A description of the nature and timing of the expansion including production capacity before and after.
• A description of the environmental controls implemented as part of the expansion and a comparison of
what would be required of a new facility.
• A description of the specified gas characteristics of the technology involved in the expansion in
comparison to the existing site and other available technologies.
• A forecast of the emissions and emissions intensity for the year of the expansion as well as the year
following.
A request for a designation under section 1(4) of the Regulation for a facility that is undergoing or has undergone a significant change should include:
• A description of the nature and timing of the change.
• A description of the environmental controls implemented as part of the significant change and a
comparison of what would be required of a new facility.
• A description of the specified gas characteristics of the new technology deployed with the significant
change in comparison to the existing site and other available technologies.
• Quantification of the re-investment in the facility and of the original cost of facility.
• Indication of change in product, change in feedstock or first of kind technology.
Dec 2018 Standard for Establishing and Assigning Benchmarks V2.2 Page 20 of 60
Facilities may desire an understanding of how a change or expansion would be viewed in advance of proceeding with their project or may be proceeding with a project on uncertain timelines. In these cases the facility is encouraged to contact the department with the details of their plans and the director can provide an indication if the project, as planned, is likely to meet the criteria for designation of year of commercial operation.
2.0 Ability to Opt-in and Revoke Opt-in
Facilities considering opting in to the CCIR are strongly encouraged to assess the cost of complying with the regulatory requirements under CCIR against costs under the carbon levy. Emissions included under the CCIR may exceed those under the carbon levy. Opted-in facilities are subject to all regulatory reporting and compliance obligations, many of which will require third party verification and other expenses, which are wholly the responsibility of the facility.
The opt-in application process is described in part 2, section 2.3 of this standard. Where a facility’s application to the CCIR is accepted, the person responsible for the facility will be required to determine whether any products that are produced by the facility have an established benchmark as set out in the Table in Schedule 2 of the CCIR. Facilities that produce products for which no established benchmark exists may apply for an assigned benchmark by following the process described in part 2, section 5.8 of this standard. A facility may have a combination of established and assigned benchmarks for the different products that are produced by the facility.
Opted-in facilities may apply to opt-out of the Regulation by applying to have their designation as an opted-in facility revoked under certain circumstances. If the director revokes the opted-in designation the facility will be subject to carbon pricing under the carbon levy and/or requirements imposed under an alternative regulatory system.
2.1 Emissions-intensive Trade-exposed Criteria
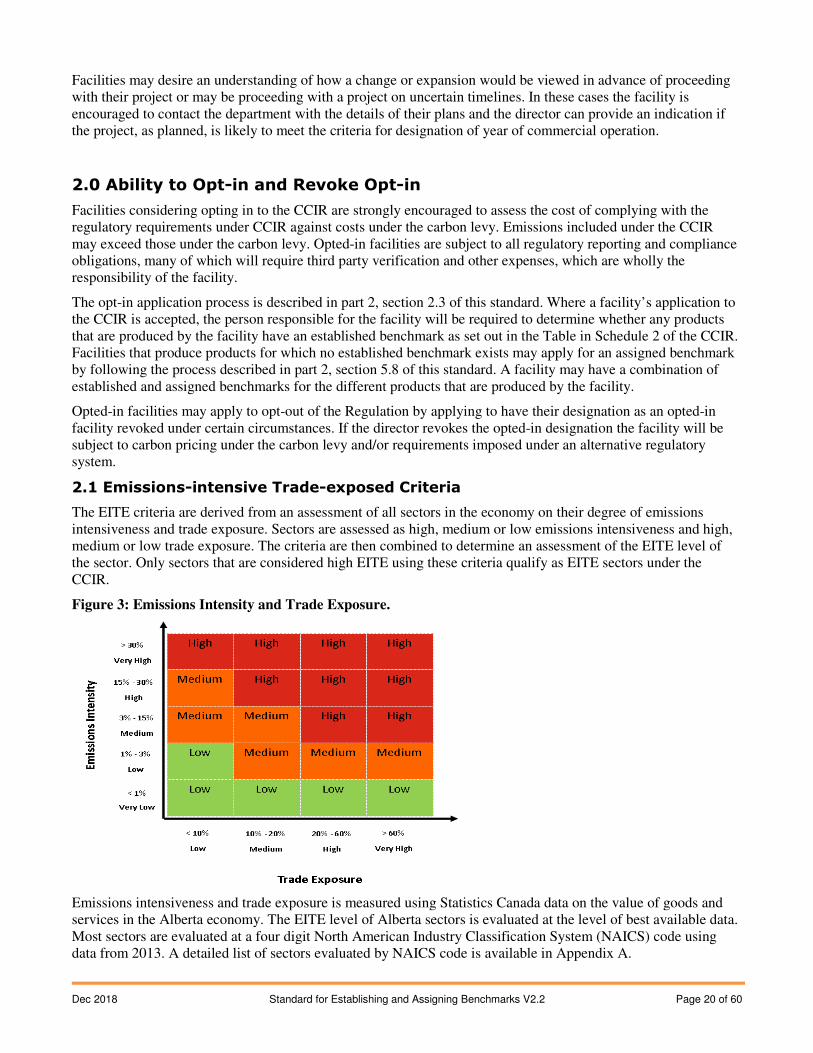
The EITE criteria are derived from an assessment of all sectors in the economy on their degree of emissions intensiveness and trade exposure. Sectors are assessed as high, medium or low emissions intensiveness and high, medium or low trade exposure. The criteria are then combined to determine an assessment of the EITE level of the sector. Only sectors that are considered high EITE using these criteria qualify as EITE sectors under the CCIR.
Figure 3: Emissions Intensity and Trade Exposure.
Emissions intensiveness and trade exposure is measured using Statistics Canada data on the value of goods and services in the Alberta economy. The EITE level of Alberta sectors is evaluated at the level of best available data. Most sectors are evaluated at a four digit North American Industry Classification System (NAICS) code using data from 2013. A detailed list of sectors evaluated by NAICS code is available in Appendix A.
Dec 2018 Standard for Establishing and Assigning Benchmarks V2.2 Page 21 of 60
Trade exposure is the intensity of trade with jurisdictions outside Alberta as defined in section 4(1) of the CCIR.
Emissions intensiveness is calculated as the full carbon pricing costs of the sector divided by the gross value added for the sector. It measures the costs to industry in the absence of output-based allocations to protect against carbon leakage.
The full carbon pricing costs are determined as follows:
1. For sectors that did not include facilities that were regulated under the SGER between 2013 and 2015: The cost of the carbon levy at $30 per tonne applied to the fuel use by each sector for fuels covered under the levy.
2. For sectors that include facilities covered under the SGER between 2013 and 2015: A carbon price of $30 applied to estimates of total direct emissions, not including CO2 emissions from biomass, from the sector.
EITE criteria is established by sector not product. However, if a facility that exceeds the 50,000 tonnes of CO2e threshold qualifies under the application process as part of an EITE sector, it can opt-in to the Regulation and will be eligible to receive a benchmark for one or more of its products.
2.2 Applicability Criteria
2.2.1 Opt-in
Facilities that produce a product listed in Table 1 may apply to opt in as there are currently facilities producing these products that are required to comply with the CCIR. Note that facilities that opted in under SGER in 2017 will not automatically be considered opted-in to the CCIR. These facilities may apply to opt-in under the CCIR.
Table 1 may be updated as more facilities become subject to the CCIR and new products become covered under the Regulation. Please see the Alberta Climate Change Office (ACCO) website for the most up to date version of this table.
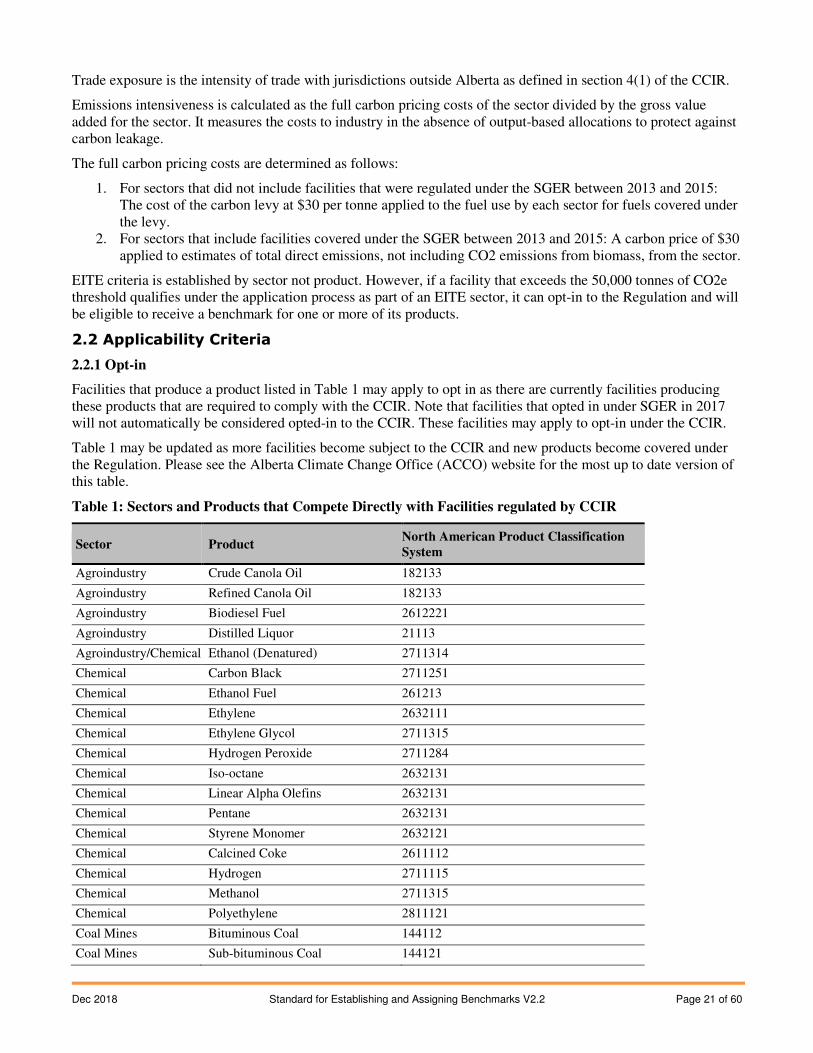
Table 1: Sectors and Products that Compete Directly with Facilities regulated by CCIR
Sector Product North American Product Classification System
Agroindustry Crude Canola Oil 182133
Agroindustry Refined Canola Oil 182133
Agroindustry Biodiesel Fuel 2612221
Agroindustry Distilled Liquor 21113
Agroindustry/Chemical Ethanol (Denatured) 2711314
Chemical Carbon Black 2711251
Chemical Ethanol Fuel 261213
Chemical Ethylene 2632111
Chemical Ethylene Glycol 2711315
Chemical Hydrogen Peroxide 2711284
Chemical Iso-octane 2632131
Chemical Linear Alpha Olefins 2632131
Chemical Pentane 2632131
Chemical Styrene Monomer 2632121
Chemical Calcined Coke 2611112
Chemical Hydrogen 2711115
Chemical Methanol 2711315
Chemical Polyethylene 2811121
Coal Mines Bituminous Coal 144112
Coal Mines Sub-bituminous Coal 144121
Dec 2018 Standard for Establishing and Assigning Benchmarks V2.2 Page 22 of 60
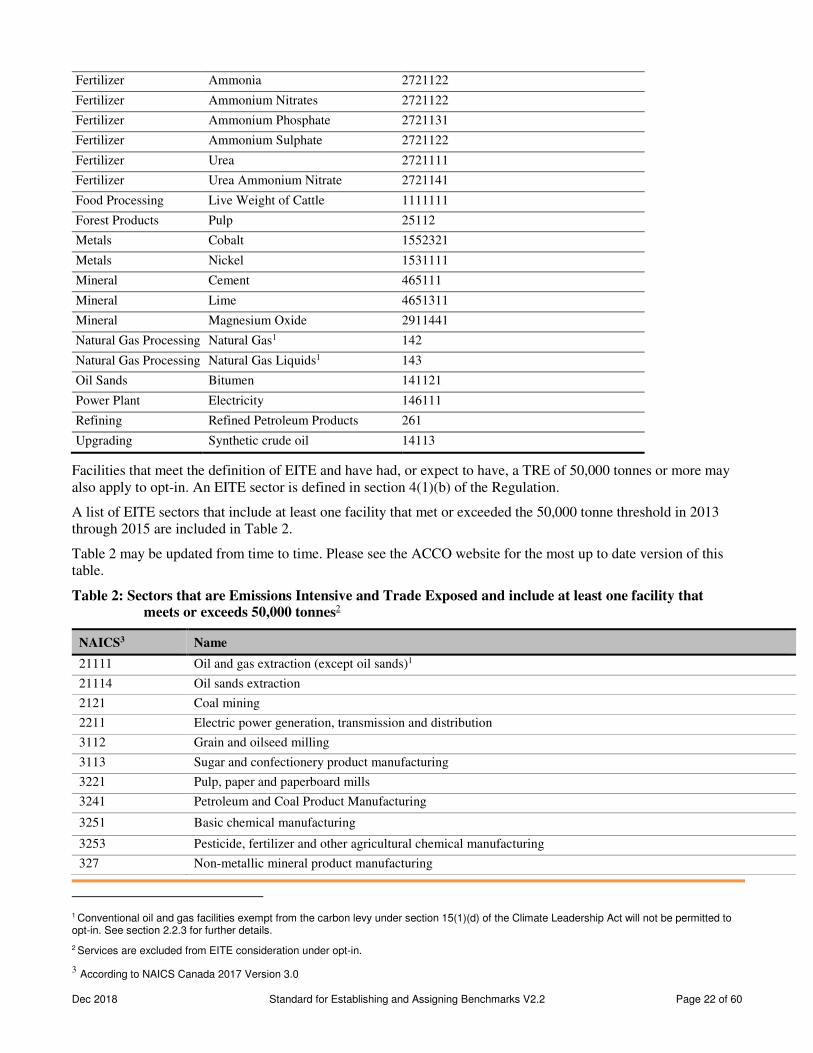
Fertilizer Ammonia 2721122
Fertilizer Ammonium Nitrates 2721122
Fertilizer Ammonium Phosphate 2721131
Fertilizer Ammonium Sulphate 2721122
Fertilizer Urea 2721111
Fertilizer Urea Ammonium Nitrate 2721141
Food Processing Live Weight of Cattle 1111111
Forest Products Pulp 25112
Metals Cobalt 1552321
Metals Nickel 1531111
Mineral Cement 465111
Mineral Lime 4651311
Mineral Magnesium Oxide 2911441
Natural Gas Processing Natural Gas1 142
Natural Gas Processing Natural Gas Liquids1 143
Oil Sands Bitumen 141121
Power Plant Electricity 146111
Refining Refined Petroleum Products 261
Upgrading Synthetic crude oil 14113
Facilities that meet the definition of EITE and have had, or expect to have, a TRE of 50,000 tonnes or more may also apply to opt-in. An EITE sector is defined in section 4(1)(b) of the Regulation.
A list of EITE sectors that include at least one facility that met or exceeded the 50,000 tonne threshold in 2013 through 2015 are included in Table 2.
Table 2 may be updated from time to time. Please see the ACCO website for the most up to date version of this table.
Table 2: Sectors that are Emissions Intensive and Trade Exposed and include at least one facility that meets or exceeds 50,000 tonnes2
NAICS3 Name
21111 Oil and gas extraction (except oil sands)1
21114 Oil sands extraction
2121 Coal mining
2211 Electric power generation, transmission and distribution
3112 Grain and oilseed milling
3113 Sugar and confectionery product manufacturing
3221 Pulp, paper and paperboard mills
3241 Petroleum and Coal Product Manufacturing
3251 Basic chemical manufacturing
3253 Pesticide, fertilizer and other agricultural chemical manufacturing
327 Non-metallic mineral product manufacturing
1 Conventional oil and gas facilities exempt from the carbon levy under section 15(1)(d) of the Climate Leadership Act will not be permitted to opt-in. See section 2.2.3 for further details.
2 Services are excluded from EITE consideration under opt-in.
3 According to NAICS Canada 2017 Version 3.0

Dec 2018 Standard for Establishing and Assigning Benchmarks V2.2 Page 23 of 60
33111 Iron and steel mills and ferro alloy manufacturing
3314 Non-ferrous metal (except aluminum) production and processing
48621 Pipeline transportation of natural gas
Facilities that fall under one of the North American Industry Classification System (NAICS) codes listed in Table 2 may apply to opt-in under the CCIR.
In addition, any other facility that has TRE that meets or exceeds, or expects to meet or exceed, 50,000 tonnes CO2e and is of the view that their sector meets the EITE criteria may apply to opt-in to the CCIR. Persons responsible for such facilities are encouraged to contact the Department to discuss their application. Applications must be supported by documentation that demonstrates they meet the relevant criteria, generated at the expense of the facility.
2.2.2. Opt-out (Application to Revoke an Opted-In Facility Designation)
A facility that intends to opt-out of the CCIR must present evidence that its emissions coverage will be comparable under the carbon levy or an alternative regulatory system, or a combination of both.
Application guidelines are described in section 2.3.
2.2.3. Opt-in and Opt-out for Conventional Oil and Natural Gas Sector
Due to the exemption from the levy until January 1, 2023 for the conventional oil and gas industry, facilities receiving the exemption will not be permitted to opt-in or out of the CCIR. Eligibility for the carbon levy exemption is outlined by Alberta Treasury Board and Finance.4
The CCIR will apply to conventional oil and gas facilities that have a TRE of 100,000 tonnes CO2e or more in 2003 or any subsequent year, regardless of current emission levels.
2.2.4. Opt-in for Renewable Electricity Facilities
Renewable electricity facilities seeking to opt-in to the CCIR must demonstrate that they meet the requirements in 4(11)(b) of the CCIR.
2.3 Application to Opt-in and Opt-out
A person responsible for a facility of the view that it meets the requirements outlined in section 4 of the CCIR may apply to the director to opt-in.
The person responsible for a facility applying to opt-in to the CCIR must follow these procedures:
1. Complete the Opt-In Application Form provided on the Alberta Environment and Parks (AEP) website. As part of the application, the person responsible for the facility will be required to:
a. Confirm that the facility produces one of the products listed in Table 1 of part 2 of this standard, or
b. Confirm that the NAICS code for the facility is a NAICS code listed in Table 2 of part 2 of this standard and TRE met or exceeded 50,000 tonnes in any year since 2013 or is expected to exceed 50,000 tonnes in its third year of commercial operation, or
c. Provide evidence that demonstrates that the facility: i. Competes directly with a facility to which the CCIR applies, or
ii. Meets the definition of EITE in the CCIR and has a TRE that exceeded 50,000 tonnes in any year since 2013 or is expected to exceed 50,000 tonnes in its third year of commercial operation.
4 For further information regarding the Oil and Gas Carbon Levy Exemption please see -
www.finance.alberta.ca/publications/tax_rebates/carbon-levy/SN-CL-5.html or http://www.finance.alberta.ca/publications/tax_rebates/carbon-levy/forms/CL-Exemption-Guide.pdf.
Dec 2018 Standard for Establishing and Assigning Benchmarks V2.2 Page 24 of 60
d. Provide information on benefits that have been or are being provided to a facility under an initiative of the Government of Alberta, or an agency of the Government of Alberta that may alleviate the cost of the carbon levy under the Climate Leadership Act in respect of the facility;
2. The facility’s Opt-In Application must include a Statement of Certification signed by a certifying official who has the authority to bind the company. An electronic copy of the signed statement is acceptable.
The person responsible for the facility must submit the Carbon Competitiveness Incentive Regulation Opt-In Application electronically to [email protected]. Separate email submissions are required for each facility seeking to opt into CCIR. An email confirming receipt of the application will be sent to the applicant.
As part of the review of the application, the director may reach out to the applicant to request additional information. Once the review is complete, the director will send the applicant a letter indicating whether the facility is designated an opted-in facility. If the facility is designated an opted-in facility, the person responsible for the facility must submit a request to the Alberta Treasury Board and Finance (TBF) to receive an exemption to the carbon levy and any carbon levy already paid for during the calendar year, if applicable.
A person responsible for a facility applying to revoke their designation as an opted-in facility must follow these procedures:
1. Complete the Opt-In Revocation Application Form provided on the AEP website. As part of the application, the person responsible for the facility will be required to provide information on the emissions coverage that will apply to the facility if they are no longer covered under the CCIR.
2. The facility’s Opt-In Revocation Application must include a Statement of Certification signed by a certifying official who has the authority to bind the company. An electronic copy of the signed statement is acceptable.
The Opt-In Revocation Application must be submitted electronically to [email protected]. Separate email submissions are required for each facility. An email receipt will be sent to the applicant.
As part of the review of the opt-in revocation application, the director may reach out to the applicant with questions or to request additional information. Once the review is complete, the director will send the facility a letter indicating whether the facility’s opted-in designation has been revoked. The facility is responsible for contacting Alberta Treasury Board and Finance to ensure compliance with the Climate Leadership Act.
3.0 Emissions Scope in Total Regulated Emissions (TRE)
All regulated specified gases are set out in Schedule 1 of the CCIR. A consistent definition of total regulated emissions is applied when calculating benchmarks.
Facility emissions are reported in the following source categories: stationary fuel combustion, industrial processes (IP), on-site transportation, venting and flaring, fugitives, formation CO2, waste and wastewater emissions, and emissions from the use of HFCs, PFCs and SF6. Biomass CO2 emissions are reported under the Specified Gas Reporting Regulation (SGRR), but not included in the calculation of TRE. Emissions generated at CCIR facilities from the combustion of clear gasoline and diesel which are subject to the carbon levy are also excluded from the calculation of TRE.
This section outlines important information regarding emission coverage under the CCIR.
3.1 Exported CO2
All CO2 sent off-site is included in a facility’s TRE calculation, except CO2 in an acid gas stream which is sent to a disposal well for permanent storage in accordance with applicable Alberta Energy Regulator directives. Exported CO2 includes CO2 that has not been emitted to the atmosphere and has been sent from the facility to an off-site location, including CO2 sent off-site as waste, for storage or sold as a product. Exported CO2 is not included in the CO2 reported under any other source category, other than imported CO2 if applicable.
Dec 2018 Standard for Establishing and Assigning Benchmarks V2.2 Page 25 of 60
3.2 Imported CO2
CO2 received on-site which has already been reported as exported CO2 from another facility subject to the CCIR, is subtracted from the facility’s direct emissions to calculate the facility’s TRE (including CO2 used on site), except for any CO2 contained in an acid gas stream which is sent to a disposal well for permanent storage in accordance with applicable Alberta Energy Regulator directives.
3.3 CO2 for the Production of Urea
Where CO2 is used as a feedstock for the production of urea, the amount of CO2 used as a feedstock is included in the facility’s TRE.
3.4 Biomass Emissions
Biomass CO2, CH4, and N2O emissions are generated from the combustion or decomposition of biomass from plant materials and animal waste.
Biomass CO2 emissions are not included in direct emissions. As such, biomass CO2 emissions are excluded from the benchmark setting and TRE, and are not counted toward the emissions threshold for inclusion into the CCIR; however, these emissions are required to be reported under the SGRR.
CH4 and N2O emissions from biomass decomposition including waste and wastewater, or from biomass combustion, are included in benchmark setting and are also included in calculating the facility’s TRE and emissions threshold for inclusion into the CCIR.
3.5 Formation CO2
Formation CO2 emissions are defined in Part 1 of the Standard for Completing Greenhouse Gas Compliance and Forecasting Reports. For more information on Formation CO2 benchmarks please refer to part 2, sections 4.1.2, 4.2.2, 5.2, and 5.5.3 of this standard.
3.6 Industrial Process Emissions
Industrial process (IP) emissions are defined in Part 1 of the Standard for Completing Greenhouse Gas Compliance and Forecasting Reports. IP emissions are included in the TRE. The inclusion of IP emissions in the benchmarking process takes into consideration the difficulty to reduce these emissions see Part 2, section 4.1.1 for details.
4.0 Benchmark Development
There are two general categories of benchmarks: established benchmarks and assigned benchmarks. Transition allocation benchmarks may also be assigned in 2018 and 2019. See Part 2, section 5.7 for details. Cost containment allocation benchmarks may be assigned for facilities that have a cost containment designation. See Part 2, section 6.3.2.2 for details.
Where an established benchmark is available for one or more products produced at a facility, the person responsible for the facility is required to calculate their output-based allocation (OBA) using the established benchmark(s) for the relevant products.
Where an established benchmark is not available for a product produced at a facility, benchmarks are generally assigned using the facility production-weighted average benchmarking approach, with economic impact testing for potential stringency reduction (see Part 2, section 5.2 for more information on assigned benchmarks).
In cases where the person responsible for a facility applies for an assigned benchmark in or before Year 3 of commercial operation, the person responsible for the facility can apply for an assigned benchmark of 100% of production-weighted average emissions. This application must include documentation demonstrating the facility meets best in class performance or employs best available technology that is economically achievable.
Dec 2018 Standard for Establishing and Assigning Benchmarks V2.2 Page 26 of 60
4.1 Emissions Scope for Benchmark Calculation
4.1.1 Industrial Process Emissions
IP emissions are included in established benchmarks at 100% of sector production-weighted average, or 100% of facility production-weighted average for assigned benchmarks and are not subject to a tightening rate. IP emission treatment in the refining and upgrading sectors is an exception to this, where the benchmark is based on the AB-CWB approach, including IP emissions.
4.1.2 Formation CO2 Emissions
Formation CO2 direct emissions for natural gas processing facilities are included in facility-specific assigned benchmarks at 90% of a facility’s Formation CO2 emissions intensity for the reference period. The production basis used for the emissions intensity is the facility’s total production over the reference period expressed on an energy equivalent production basis in cubic meters of oil equivalent5. Formation CO2 emissions are subject to the tightening rate.
Natural gas processing facility formation CO2 emissions are allocated on a facility-specific basis separately from the ABGPI. For more information about the ABGPI please refer to part 2 section 4.2.2.
4.1.3 Indirect Emissions
All benchmarks and output-based allocations (OBAs) are adjusted to account for emissions associated with the import or export of electricity, heat, and hydrogen.
The emissions from imported electricity, heat and hydrogen are added to the facility’s TRE when determining the established and assigned benchmarks. The output-based allocation for regulated facilities is then ‘scope adjusted’ to deduct indirect emissions from the facility’s allocation. Scope-adjustment means that the allocation associated with imported products is subtracted from the product allocations to determine the output-based allocation (OBA) the facility receives.
Indirect emissions associated with electricity, heat and hydrogen are included in the benchmark setting for all facilities. However, emissions associated with imported hydrogen are excluded from the calculation of indirect emissions for the refining and upgrading sectors. The AB-CWB formulas and coefficients directly incorporate hydrogen into production calculations, and the associated OBAs.
4.1.4 Cogeneration Treatment (Stand-alone and Integrated)
Emissions associated with cogeneration facilities that are an integrated part of a facility covered under CCIR are reported as part of the facility’s TRE. Facilities receive allocations associated with net exports of electricity and industrial heat. A consistent allocation is applied in setting product benchmarks. Stand-alone cogeneration meets the definition of a facility under the CCIR. For benchmarking purposes, imports of heat and electricity from stand-alone cogeneration facilities are added to the emissions of the importing facility in the same manner as imports of heat or electricity from any other source. A scope-adjustment is applied when determining the output-based allocation for that facility.
4.1.5 Fugitive Emissions
Sector specific considerations are applied to the treatment of fugitive emissions when setting established benchmarks, however, fugitive emissions are included in setting assigned benchmarks. Fugitive emissions are included in the TRE for all facilities across product categories and benchmarks.
5 Cubic meter of oil equivalent (m3OE) is a unit of energy based on the approximate energy released by burning one m3 of crude oil. It is used to combine different oil and gas throughput or production into a single unit of measure. Oil equivalent conversion factors used to determine the energy equivalent production of natural gas processing facilities are included in Table A7 of Appendix A.
Dec 2018 Standard for Establishing and Assigning Benchmarks V2.2 Page 27 of 60
4.2 Product Categories
Under the CCIR discrete product categories are established to facilitate comparison of emissions performance across facilities producing similar products.
Product categories for which established benchmarks have been determined are listed in the Table in Schedule 2 of the CCIR. Current product categories with assigned benchmarks are described in part 2, section 5.2 of this standard. For products where product categories have not been specified in the Regulation or in this standard, facilities may apply for an assigned benchmark for a new product category. The application will be required to provide additional information to support the addition of a new product category.
The director may assign a benchmark for a product category not listed in Schedule 2, Table 1 of the Regulation or part 2, section 5.2 of the standard. In determining whether a benchmark is appropriate the director will, subject to the availability of data, assess the EITE status of the product category, taking into consideration the EITE criteria used to determine sector level EITE.
4.2.1 Complexity-Weighted-Barrel (CWB)
The CWB approach represents refining and upgrading production for the purpose of reporting emissions intensity and developing benchmarks. The CWB approach accounts for various refinery and upgrader sizes and process complexities in determining production values, and allows reporting of refining or upgrading output with the standardized volume metric of a CWB.
The Canadian CWB (CAN-CWB) was developed specifically for the Canadian Fuels Association and Ontario Refineries. The CAN-CWB refining methodology and factors have been revised for Alberta facilities to produce an Alberta CWB (AB-CWB) for refining (Refining AB-CWB). This revision adopts a majority of CAN-CWB data, and includes updated factors and more detailed approaches for coking, hydrogen production, steam and electricity to reflect specific conditions within Alberta and to work within the multi-product framework of the CCIR.
The CAN-CWB upgrading methodology was developed specifically for the Canadian Fuels Association and the Canadian Association of Petroleum Producers for Canadian bitumen upgraders. The CAN-CWB upgrading methodology and factors have been revised for the currently operating Alberta facilities to produce an AB-CWB for upgrading (Upgrading AB-CWB). Please refer to Table A5 of Appendix A for the default Upgrading AB-CWB assigned benchmark values, which may be assigned in accordance with Section 8 of the Regulation.
The Refining AB-CWB and the Upgrading AB-CWB differ in that the Refining AB-CWB includes several process unit emissions factors specific to refining operations, whereas the Upgrading AB-CWB contains several process unit emissions factors specific to upgrading operations.
The hydrogen generation CWB factors used in the Refining AB-CWB and the Upgrading AB-CWB also differ. The hydrogen generation CWB factor for the Refining AB-CWB was selected based on the lowest emissions intensity hydrogen generation method – steam methane reforming. The hydrogen generation CWB factor for the Upgrading AB-CWB was calculated so that it produces an equivalent output based allocation per tonne of hydrogen produced as the Refining AB-CWB factor. The hydrogen generation CWB factors apply to all hydrogen generation activities within the refining and upgrading sectors, regardless of the actual technology or process used to generate hydrogen. Current hydrogen generation CWB factors for the Refining AB-CWB and the Upgrading AB-CWB are outlined in Table A6 of Appendix A.
The established product benchmark for hydrogen, which applies to merchant hydrogen producers and as an indirect emission to any CCIR regulated facilities which import or export hydrogen other than refineries and upgraders, is listed in the Table in Schedule 2 of the Regulation. The established hydrogen benchmark has also been derived from the Refining AB-CWB approach, to provide equivalent free allocations per tonne of hydrogen produced as the Refining AB-CWB and Upgrading AB-CWB approaches.
The methodology for quantification of the AB-CWB for refining and upgrading will be described in future versions of the Standard for Completing Greenhouse Gas Compliance and Forecasting Reports and Quantification Methodologies for the Carbon Competitiveness Incentive Regulation and the Specified Gas Reporting Program
Dec 2018 Standard for Establishing and Assigning Benchmarks V2.2 Page 28 of 60
(Quantification Methodologies). The person responsible for a facility must ensure they are using the most up to date version of the Quantification Methodologies document.
4.2.2 Alberta Gas Processing Index (ABGPI)
The natural gas processing sector benchmark was developed using a modular approach. This approach accounts for the significant differences in the configuration and complexity of Alberta’s natural gas processing facilities.
Under a modular approach, separate throughput or production quantities and emissions intensity weightings are provided for each of the following gas processing modules of the facility (where applicable): Inlet Compression; Dehydration; Amine Sweetening; Total Refrigeration; Fractionation; Stabilization; Sales Compression; Sulphur Plant; Acid Gas Injection; Ethane Extraction; Cavern Storage; CO2 Plant and Flaring; Venting; Fugitives; and Other. The sum of the products of the individual module weightings with the facility’s corresponding throughput or production for each module6 results in a single standardized production metric called the ABGPI.
Please refer to Table A5 of Appendix A for the default ABGPI assigned benchmark values, which may be assigned in accordance with Section 8 of the Regulation.
The methodology for quantification of the ABGPI, including the weighting factors for each module, will be provided in the Quantification Methodologies for the Carbon Competitiveness Incentive Regulation and the Specified Gas Reporting Program (Quantification Methodologies). The person responsible for the facility must ensure they are using the most up to date version of the Quantification Methodologies document.
4.3 Benchmark Reference Years
For facilities in Year 4 or a subsequent year of commercial operation, assigned benchmarks will be calculated based on the most recent three calendar years of data. The director has the authority to request data from alternate years for assigned benchmark setting, where appropriate.
For facilities in Year 3 of commercial operation, assigned benchmarks will be calculated based on Years 1 and 2 of verified operating data, or a minimum of 24 consecutive months of representative operating data.
The director may depart from the approach set out above in certain circumstances. In these cases, the director would consider the approach taken for establishing reference years for established and assigned benchmarks for 2018:
• For 2018 benchmarks, data was selected to represent the most recent years available at the time of benchmark setting Three years of data (2013, 2014, and 2015) were used for benchmark development except for the followings:
o For mined bitumen, a 1-year data set from 2015 was used to reflect the emissions intensity of current operations due to changes in sector-wide emissions intensity in 2013 and 2014;
o For bituminous and sub-bituminous coal, a 5-year data set was used, as 2013-2015 does not provide a representative dataset to establish and assign benchmarks for this sector;
o For natural gas processing, a 1-year data set from 2015 was used due to the complexity associated with splitting facility production and emissions between the gas processing modules;
o For high value chemicals, a 1-year data set from 2015 was used because it was more representative of the emissions intensity of current operations.
5.0 Benchmark Calculation Methodology
The information below describes the methodological approach to be used for establishing and assigning benchmarks.
6 Natural gas processing module production or throughputs are expressed on an energy equivalent production basis in cubic meters of oil equivalent. Please see part 2, section 4.1.2 for more information.

Dec 2018 Standard for Establishing and Assigning Benchmarks V2.2 Page 29 of 60
5.1 Established Benchmark Approaches
For established benchmarks, each regulated facility receives the same benchmark for each defined product. Current established benchmarks are listed in Schedule 2 of the CCIR. New established benchmarks will be considered during future CCIR reviews. Development of new established benchmarks will take into consideration the methodology used to determine the established benchmarks currently included in the CCIR. Relevant alternative methodologies may also be considered.
For established benchmarks, a production-weighted average approach, starting at 80% of production-weighted average, is applied. Based on results from economic impact analyses, in some instances, benchmarks may be adjusted upward in 10% increments from a:
• 80% of production-weighted average benchmark, to a
• 90% or 100% of production-weighted average benchmark
Economic impact analysis for upward benchmark adjustment is outlined in part 2, section 5.4.2. Additionally, where a benchmark emissions intensity is lower (more stringent) than the best-performing facility within a sector of two or more facilities, a ‘best-in-class’ benchmark would typically be applied. Applying the best-in-class benchmark ensures that no benchmark is more stringent than the emissions performance of the best performing facility producing the product.
In certain circumstances, other approaches were applied to established benchmarks currently in place. Current benchmarking approaches are outlined in Table 3.
Table 3: Benchmarking approach for sector-product categories
Sector Sector - Product Categories Product Benchmarking Approach
Electricity Mega-Watt Hour Good-as-best-gas (best-in-class combined cycle gas) 7
Oil and Gas
In situ Bitumen Top quartile production-based benchmark4
Mined Bitumen Top quartile production-based benchmark4
Refining – Alberta Complexity-Weighted Barrel
Best-in-class according to Refining AB-CWB
Chemicals Ethylene Glycol 80 per cent of production-weighted average
High Value Chemicals Best-in-class
Coal Bituminous coal Best-in-class
Fertilizers Ammonia 90 per cent of production-weighted average
Ammonium Nitrate Best-in-class
Minerals Cement 100 per cent of production-weighted average
Forest Products Hardwood Kraft Pulp 100 per cent of production-weighted average
Softwood Kraft Pulp 100 per cent of production-weighted average
Cross-Sectoral
Industrial Heat Based on a standard boiler efficiency.8
Hydrogen Equivalent to the hydrogen benchmark under the AB-CWB methodology for refining.9
Methodology for calculating best in class, top-quartile production based and production-weighted emissions average benchmarks are outlined in part 2, sections 5.5.4 to 5.5.6 of this standard.
7 Based on recommendations from the Climate Leadership Panel
8 Assumes 80% thermal efficiency based on higher heating value for combustion of Alberta natural gas. Standard efficiency assumption is required due to cross-sectoral nature of production of industrial heat.
9 Based on international best practices.
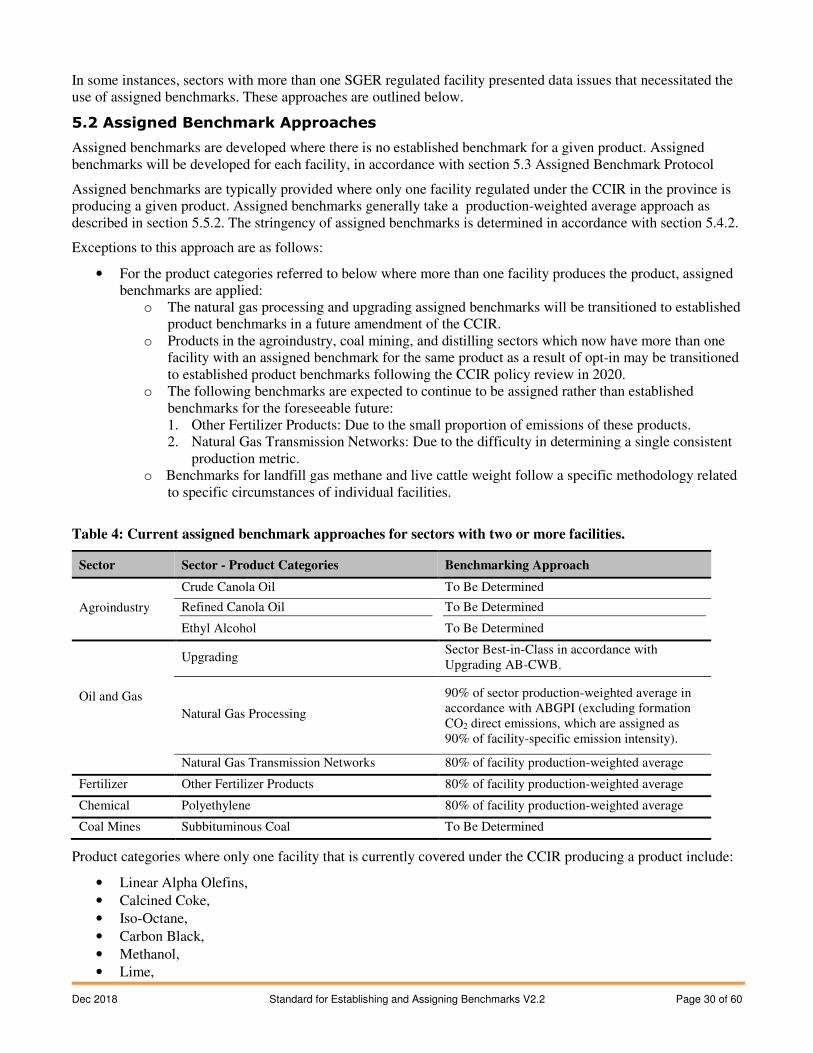
Dec 2018 Standard for Establishing and Assigning Benchmarks V2.2 Page 30 of 60
In some instances, sectors with more than one SGER regulated facility presented data issues that necessitated the use of assigned benchmarks. These approaches are outlined below.
5.2 Assigned Benchmark Approaches
Assigned benchmarks are developed where there is no established benchmark for a given product. Assigned benchmarks will be developed for each facility, in accordance with section 5.3 Assigned Benchmark Protocol
Assigned benchmarks are typically provided where only one facility regulated under the CCIR in the province is producing a given product. Assigned benchmarks generally take a production-weighted average approach as described in section 5.5.2. The stringency of assigned benchmarks is determined in accordance with section 5.4.2.
Exceptions to this approach are as follows:
• For the product categories referred to below where more than one facility produces the product, assigned benchmarks are applied:
o The natural gas processing and upgrading assigned benchmarks will be transitioned to established product benchmarks in a future amendment of the CCIR.
o Products in the agroindustry, coal mining, and distilling sectors which now have more than one facility with an assigned benchmark for the same product as a result of opt-in may be transitioned to established product benchmarks following the CCIR policy review in 2020.
o The following benchmarks are expected to continue to be assigned rather than established benchmarks for the foreseeable future: 1. Other Fertilizer Products: Due to the small proportion of emissions of these products. 2. Natural Gas Transmission Networks: Due to the difficulty in determining a single consistent
production metric. o Benchmarks for landfill gas methane and live cattle weight follow a specific methodology related
to specific circumstances of individual facilities.
Table 4: Current assigned benchmark approaches for sectors with two or more facilities.
Sector Sector - Product Categories Benchmarking Approach
Agroindustry
Crude Canola Oil To Be Determined
Refined Canola Oil
Ethyl Alcohol
To Be Determined
To Be Determined
Oil and Gas
Upgrading Sector Best-in-Class in accordance with Upgrading AB-CWB.
Natural Gas Processing
90% of sector production-weighted average in accordance with ABGPI (excluding formation CO2 direct emissions, which are assigned as 90% of facility-specific emission intensity).
Natural Gas Transmission Networks 80% of facility production-weighted average
Fertilizer Other Fertilizer Products 80% of facility production-weighted average
Chemical Polyethylene 80% of facility production-weighted average
Coal Mines Subbituminous Coal To Be Determined
Product categories where only one facility that is currently covered under the CCIR producing a product include:
• Linear Alpha Olefins,
• Calcined Coke,
• Iso-Octane,
• Carbon Black,
• Methanol,
• Lime,
Dec 2018 Standard for Establishing and Assigning Benchmarks V2.2 Page 31 of 60
• Magnesium Oxide,
• Nickel + Cobalt,
• Live Cattle Weight,
• Landfill Gas Methane,
• Throughput Distance of Haul (natural gas transmission network),
• Pipeline Length of Network (natural gas transmission network),
• Pipeline Throughput (natural gas transmission network),
• Styrene Monomer,
• Ethanol,
• Hydrogen Peroxide, and
• Biodiesel
5.3 Assigned Benchmark Protocol
In general, a ‘production-weighted average” approach starting at 80% of production-weighted average is used to develop an assigned benchmark for individual facilities. Based on economic impact analysis, in some instances benchmarks may be adjusted upward in 10% increments from:
• 80% of production-weighted average, to
• 90%, or 100% of production-weighted average
Economic impact analysis and upward benchmark adjustment is outlined in part 2, section 5.4.
Benchmark stringency adjustments for new entrants that will be assigned benchmarks for facilities in Year 3 or subsequent operating years, will follow the following rules:
1. When an assigned benchmark is provided for a product that is already produced by more than one facility under the CCIR, the assigned benchmark will be based on a facility production-weighted average emissions intensity that applies the same percentage of production-weighted average as the other facilities producing the product under the CCIR, based on the historic facility data. A product benchmark as determined under section 5.5.4 to 5.5.6 may also be assigned where available.
2. When an assigned benchmark is provided for a product that is produced by only one other facility regulated by CCIR, the assigned benchmark will be based on a facility production-weighted average emissions intensity benchmark subject to economic testing to determine the appropriate percent of production-weighted average as per part 2, section 5.4.
3. When an assigned benchmark is provided for a product where there is no established benchmark or previously assigned benchmark- and if the facility has sufficient verifiable emissions and production data for the reference period - then the assigned benchmark will be based on a facility production-weighted average emissions intensity benchmark subject to economic testing to determine the appropriate percent of production-weighted average as per part 2, section 5.4.
4. When an assigned benchmark is provided for a product where there is no established benchmark, but for which a benchmark has been previously assigned to another CCIR regulated facility, the director may assign the value of the previously assigned benchmark to the same product at other CCIR regulated facilities. The assigned benchmark value may be distributed to minor co-products at other facilities, to recognize lower emissions intensity production methods, or for other reasons as deemed appropriate by the director.
5. When an assigned benchmark is provided for a product where there is no established benchmark or previously assigned benchmark, and the product was not produced at the facility anytime prior to 2018, then the assigned benchmark will be based on a facility production-weighted average emissions intensity benchmark which is to be calculated at the conclusion of the applicable compliance period subject to economic testing to determine the appropriate percent of production-weighted average as per part 2, section 5.4. The director may also assign a new benchmark value prior to subsequent compliance years as the new product’s assigned benchmark reference period is being developed in accordance with part 2, section 5.5.1. In the case where the new product is part of a multi-product facility (i.e. a facility where two or more products other than electricity, heat or hydrogen have either assigned or established benchmarks), emissions are divided between the products based on a methodology approved by the
Dec 2018 Standard for Establishing and Assigning Benchmarks V2.2 Page 32 of 60
director. Note that production of a new product may result in a designation of year of commercial operation per part 2, section 1.4 which may affect the applicability of this part.
6. Notwithstanding 2, 3 and 4 above, in 2018 and 2019 the director may assign all facilities producing the same product, facility production-weighted average emissions intensities that apply the same percentage of production-weighted average or the same product benchmark as determined under section 5.5.4 to 5.5.6 and based on economic tests for a group of two or more facilities.
A person responsible for a facility that is in or before the facility’s third year of commercial operation may apply for a benchmark of 100% of production-weighted average if it can demonstrate it employs best available technology that is economically achievable. See part 2, section 5.9 for details.
A person responsible for a facility that is in any year of commercial operation may also apply for a benchmark of 100% of production-weighted average for a new product under rule 5 above, and in accordance with part 2, section 5.9 of this standard, if they can demonstrate that the facility employs best available technology that is economically achievable with respect to emissions intensity for the production of that product. The director will consider the EITE status of the new product category in deciding whether to assign a 100% of average benchmark.
The director may consider departures from this approach or the above approaches where necessary to account for facility or sector specific circumstances. In these cases, the rationale for such departures will be provided to the affected facility(ies).
5.4 Economics Impact Analysis and Stringency Adjustments
5.4.1 Facility Economic Impact Analysis Overview in 2018
Facility economic impacts are assessed to help inform the need for adjustments in benchmark stringency for new established and assigned benchmarks. The Government of Alberta will conduct the same or substantively similar analyses to those used in setting previous benchmarks, to inform future benchmark stringency adjustments.
The economic impact assessment compares the SGER 2015 costs to the incremental cost impact of different CCIR scenarios. Assessment of incremental costs also incorporates facility abatement estimates, supply chain costs, cost-pass through estimates, and tax and royalty interactions. Product prices, as well as other key assumptions were based on publicly available data and reviewed by industry participants.
To estimate economic impacts, sales and profit tests are applied to determine operational vulnerability at each regulated facility. Operational vulnerability is seen to occur at a threshold where incremental CCIR compliance costs above SGER 2015 costs exceed 3% of sales or 10% of profit at a facility. Profit or sales impacts are used to inform stringency adjustments, described in part 2, section 5.4.2.
5.4.2 Stringency Adjustments
Assessment of economic impacts when determining the benchmark stringency include, but are not limited to, the following criteria established by the Government of Alberta. Where economic impact analysis indicates an exceedance of any of the following thresholds, stringency of the established or assigned benchmark should be reduced:
• Percent of production exceeding Sales Test > 10% (from facility level impact analysis)
• Percent of production exceeding Profit Test > 25% (from facility level impact analysis)
• Impact to sector - consideration of additional sector level macro-economic impact analysis
Sectors must exhibit:
• EITE status of High or Very High as described in part 2, section 2.1 of this standard.
Established and assigned benchmark levels for any given product category are adjusted upward in 10% increments, based on the above from 80% production-weighted average, to 90% production-weighted average, to 100% production-weighted average, stopping where thresholds were no longer triggered. Where a sector has only one facility producing a product, facility benchmarks are adjusted upwards based on the above criteria. The application of the economic tests to assigned benchmarks is outlined in part 2, section 5.3.
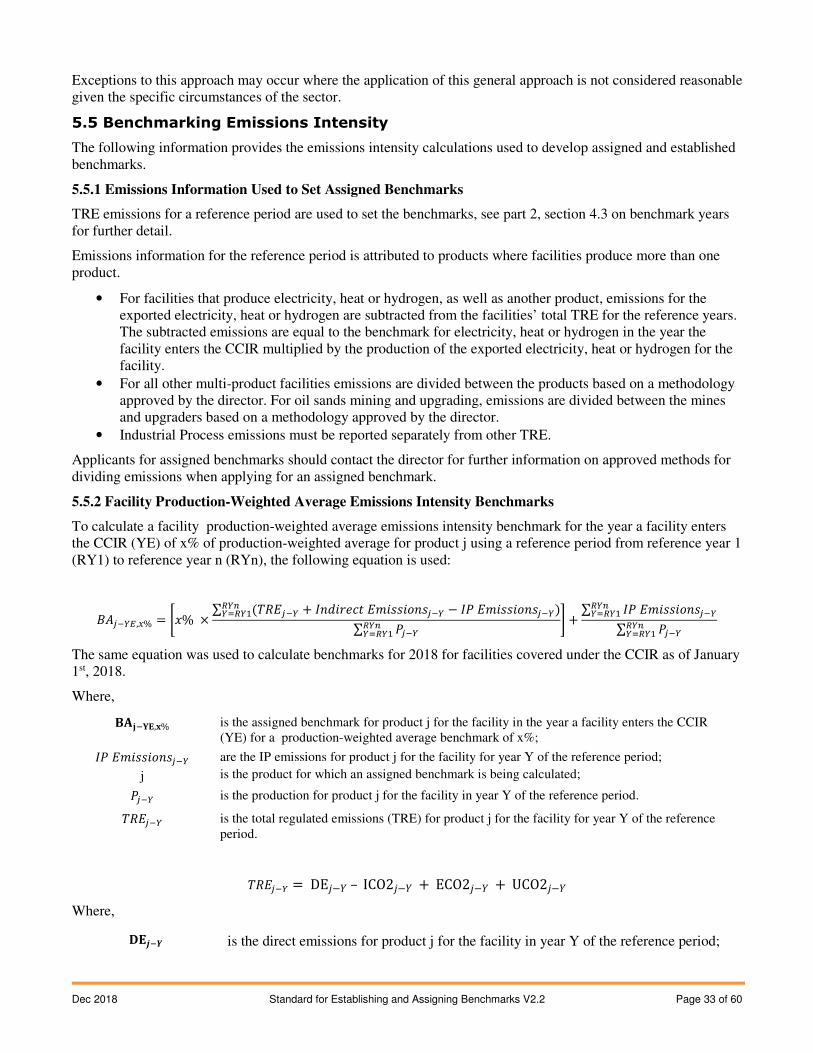
Dec 2018 Standard for Establishing and Assigning Benchmarks V2.2 Page 33 of 60
Exceptions to this approach may occur where the application of this general approach is not considered reasonable given the specific circumstances of the sector.
5.5 Benchmarking Emissions Intensity
The following information provides the emissions intensity calculations used to develop assigned and established benchmarks.
5.5.1 Emissions Information Used to Set Assigned Benchmarks
TRE emissions for a reference period are used to set the benchmarks, see part 2, section 4.3 on benchmark years for further detail.
Emissions information for the reference period is attributed to products where facilities produce more than one product.
• For facilities that produce electricity, heat or hydrogen, as well as another product, emissions for the exported electricity, heat or hydrogen are subtracted from the facilities’ total TRE for the reference years. The subtracted emissions are equal to the benchmark for electricity, heat or hydrogen in the year the facility enters the CCIR multiplied by the production of the exported electricity, heat or hydrogen for the facility.
• For all other multi-product facilities emissions are divided between the products based on a methodology approved by the director. For oil sands mining and upgrading, emissions are divided between the mines and upgraders based on a methodology approved by the director.
• Industrial Process emissions must be reported separately from other TRE.
Applicants for assigned benchmarks should contact the director for further information on approved methods for dividing emissions when applying for an assigned benchmark.
5.5.2 Facility Production-Weighted Average Emissions Intensity Benchmarks
To calculate a facility production-weighted average emissions intensity benchmark for the year a facility enters the CCIR (YE) of x% of production-weighted average for product j using a reference period from reference year 1 (RY1) to reference year n (RYn), the following equation is used:
������,�% = ��% × ∑ (������ + �������� ������������ − �! ������������)#�$�%#�& ∑ !���#�$�%#�& ' + ∑ �! ������������#�$�%#�&∑ !���#�$�%#�&
The same equation was used to calculate benchmarks for 2018 for facilities covered under the CCIR as of January 1st, 2018.
Where,
()*�+,,-% is the assigned benchmark for product j for the facility in the year a facility enters the CCIR (YE) for a production-weighted average benchmark of x%;
�! ������������
j
are the IP emissions for product j for the facility for year Y of the reference period;
is the product for which an assigned benchmark is being calculated;
!��� is the production for product j for the facility in year Y of the reference period.
������ is the total regulated emissions (TRE) for product j for the facility for year Y of the reference period.
������ = DE0−1 – ICO20−1 + ECO20−1 + UCO20−1
Where,
8,9�: is the direct emissions for product j for the facility in year Y of the reference period;
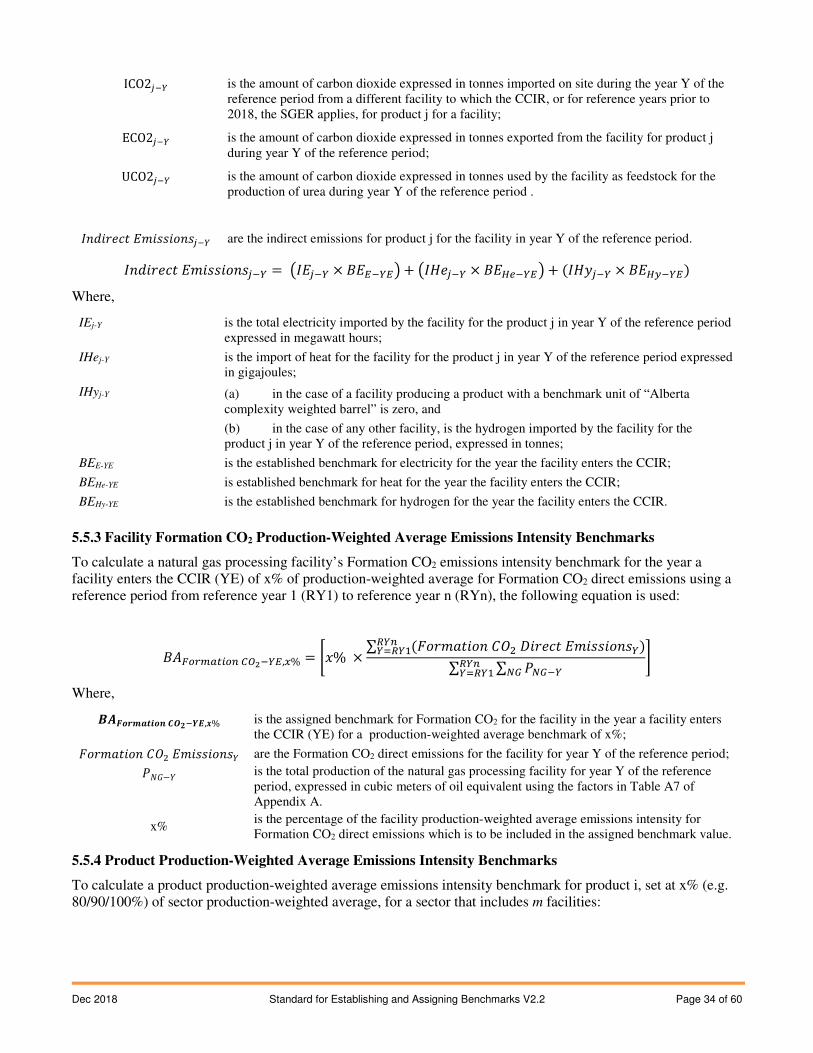
Dec 2018 Standard for Establishing and Assigning Benchmarks V2.2 Page 34 of 60
ICO2��� is the amount of carbon dioxide expressed in tonnes imported on site during the year Y of the reference period from a different facility to which the CCIR, or for reference years prior to 2018, the SGER applies, for product j for a facility;
ECO2��� is the amount of carbon dioxide expressed in tonnes exported from the facility for product j during year Y of the reference period;
UCO2��� is the amount of carbon dioxide expressed in tonnes used by the facility as feedstock for the production of urea during year Y of the reference period .
�������� ������������ are the indirect emissions for product j for the facility in year Y of the reference period.
�������� ������������ = ;����� × ������< + ;�=���� × ��>?���< + (�=@��� × ��>A���)
Where,
IEj-Y is the total electricity imported by the facility for the product j in year Y of the reference period expressed in megawatt hours;
IHej-Y is the import of heat for the facility for the product j in year Y of the reference period expressed in gigajoules;
IHyj-Y (a) in the case of a facility producing a product with a benchmark unit of “Alberta complexity weighted barrel” is zero, and
(b) in the case of any other facility, is the hydrogen imported by the facility for the product j in year Y of the reference period, expressed in tonnes;
BEE-YE is the established benchmark for electricity for the year the facility enters the CCIR;
BEHe-YE is established benchmark for heat for the year the facility enters the CCIR;
BEHy-YE is the established benchmark for hydrogen for the year the facility enters the CCIR.
5.5.3 Facility Formation CO2 Production-Weighted Average Emissions Intensity Benchmarks
To calculate a natural gas processing facility’s Formation CO2 emissions intensity benchmark for the year a facility enters the CCIR (YE) of x% of production-weighted average for Formation CO2 direct emissions using a reference period from reference year 1 (RY1) to reference year n (RYn), the following equation is used:
��BCDEFGHC$ IJK���,�% = ��% × ∑ (L���M���� NOP Q����� ����������)#�$�%#�& ∑ ∑ !RS��RS#�$�%#�& '
Where,
TUVWXYZ[\W] ^_`�:a,b% is the assigned benchmark for Formation CO2 for the facility in the year a facility enters the CCIR (YE) for a production-weighted average benchmark of x%;
L���M���� NOP ���������� !cd−1
x%
are the Formation CO2 direct emissions for the facility for year Y of the reference period;
is the total production of the natural gas processing facility for year Y of the reference period, expressed in cubic meters of oil equivalent using the factors in Table A7 of Appendix A.
is the percentage of the facility production-weighted average emissions intensity for Formation CO2 direct emissions which is to be included in the assigned benchmark value.
5.5.4 Product Production-Weighted Average Emissions Intensity Benchmarks
To calculate a product production-weighted average emissions intensity benchmark for product i, set at x% (e.g. 80/90/100%) of sector production-weighted average, for a sector that includes m facilities:
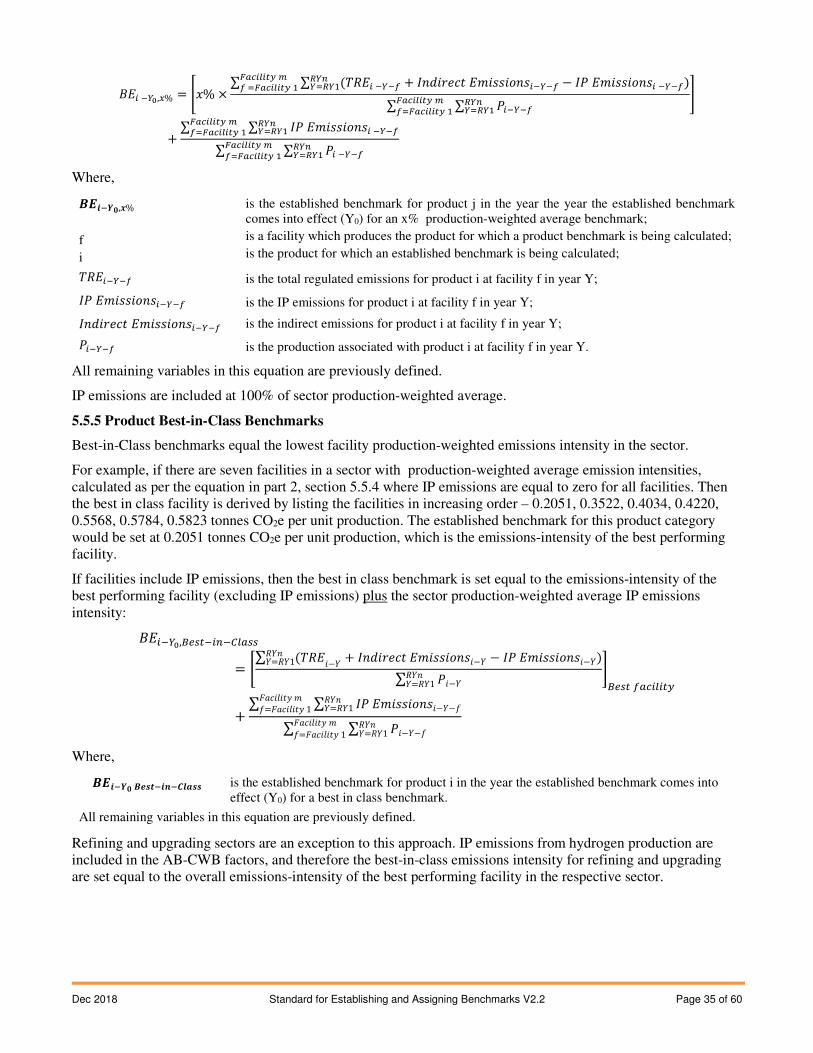
Dec 2018 Standard for Establishing and Assigning Benchmarks V2.2 Page 35 of 60
��H ��e,�% = f�% × ∑ ∑ (���H ���g + �������� ���������H���g − �! ���������H ���g)#�$�%#�&BFhHiHGA Eg %BFhHiHGA & ∑ ∑ !H���g#�$�%#�&BFhHiHGA Eg%BFhHiHGA &j
+ ∑ ∑ �! ���������H ���g#�$�%#�&BFhHiHGA Eg%BFhHiHGA &∑ ∑ !H ���g#�$�%#�&BFhHiHGA Eg%BFhHiHGA &
Where,
Ta\�:k,b%
f
i
is the established benchmark for product j in the year the year the established benchmark comes into effect (Y0) for an x% production-weighted average benchmark;
is a facility which produces the product for which a product benchmark is being calculated;
is the product for which an established benchmark is being calculated;
���H���g is the total regulated emissions for product i at facility f in year Y;
�! ���������H���g is the IP emissions for product i at facility f in year Y;
�������� ���������H���g is the indirect emissions for product i at facility f in year Y;
!H���g is the production associated with product i at facility f in year Y.
All remaining variables in this equation are previously defined.
IP emissions are included at 100% of sector production-weighted average.
5.5.5 Product Best-in-Class Benchmarks
Best-in-Class benchmarks equal the lowest facility production-weighted emissions intensity in the sector.
For example, if there are seven facilities in a sector with production-weighted average emission intensities, calculated as per the equation in part 2, section 5.5.4 where IP emissions are equal to zero for all facilities. Then the best in class facility is derived by listing the facilities in increasing order – 0.2051, 0.3522, 0.4034, 0.4220, 0.5568, 0.5784, 0.5823 tonnes CO2e per unit production. The established benchmark for this product category would be set at 0.2051 tonnes CO2e per unit production, which is the emissions-intensity of the best performing facility.
If facilities include IP emissions, then the best in class benchmark is set equal to the emissions-intensity of the best performing facility (excluding IP emissions) plus the sector production-weighted average IP emissions intensity:
��H��e,l?mG�H$�IiFmm= �∑ (����−1 + �������� ����������−1 − �! ����������−1)�1�1=�11 ∑ !�−1�1�1=�11 '
l?mG gFhHiHGA+ ∑ ∑ �! ����������−1−o�1�1=�11LM��p��@ �o=LM��p��@ 1∑ ∑ !�−1−o�1�1=�11LM��p��@ �o=LM��p��@ 1
Where,
Ta\�:k Tqr[�\]�^sZrr is the established benchmark for product i in the year the established benchmark comes into effect (Y0) for a best in class benchmark.
All remaining variables in this equation are previously defined.
Refining and upgrading sectors are an exception to this approach. IP emissions from hydrogen production are included in the AB-CWB factors, and therefore the best-in-class emissions intensity for refining and upgrading are set equal to the overall emissions-intensity of the best performing facility in the respective sector.
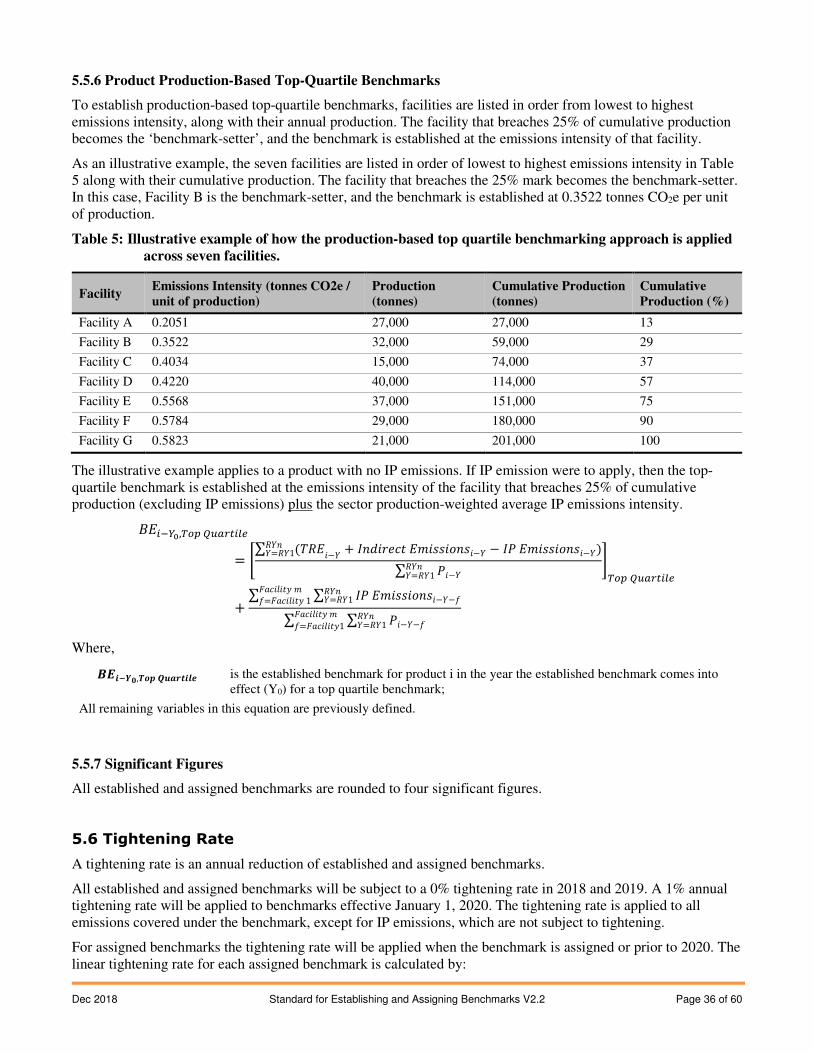
Dec 2018 Standard for Establishing and Assigning Benchmarks V2.2 Page 36 of 60
5.5.6 Product Production-Based Top-Quartile Benchmarks
To establish production-based top-quartile benchmarks, facilities are listed in order from lowest to highest emissions intensity, along with their annual production. The facility that breaches 25% of cumulative production becomes the ‘benchmark-setter’, and the benchmark is established at the emissions intensity of that facility.
As an illustrative example, the seven facilities are listed in order of lowest to highest emissions intensity in Table 5 along with their cumulative production. The facility that breaches the 25% mark becomes the benchmark-setter. In this case, Facility B is the benchmark-setter, and the benchmark is established at 0.3522 tonnes CO2e per unit of production.
Table 5: Illustrative example of how the production-based top quartile benchmarking approach is applied across seven facilities.
Facility Emissions Intensity (tonnes CO2e / unit of production)
Production (tonnes)
Cumulative Production (tonnes)
Cumulative Production (%)
Facility A 0.2051 27,000 27,000 13
Facility B 0.3522 32,000 59,000 29
Facility C 0.4034 15,000 74,000 37
Facility D 0.4220 40,000 114,000 57
Facility E 0.5568 37,000 151,000 75
Facility F 0.5784 29,000 180,000 90
Facility G 0.5823 21,000 201,000 100
The illustrative example applies to a product with no IP emissions. If IP emission were to apply, then the top-quartile benchmark is established at the emissions intensity of the facility that breaches 25% of cumulative production (excluding IP emissions) plus the sector production-weighted average IP emissions intensity.
��H��e,tCu vwFDGHi?= �∑ (����−1 + �������� ����������−1 − �! ����������−1)�1�1=�11 ∑ !�−1�1�1=�11 '
tCu vwFDGHi?+ ∑ ∑ �! ����������−1−o�1�1=�11LM��p��@ �o=LM��p��@ 1∑ ∑ !�−1−o�1�1=�11LM��p��@ �o=LM��p��@1
Where,
Ta\�:k,xWy z{ZX[\sq is the established benchmark for product i in the year the established benchmark comes into effect (Y0) for a top quartile benchmark;
All remaining variables in this equation are previously defined.
5.5.7 Significant Figures
All established and assigned benchmarks are rounded to four significant figures.
5.6 Tightening Rate
A tightening rate is an annual reduction of established and assigned benchmarks.
All established and assigned benchmarks will be subject to a 0% tightening rate in 2018 and 2019. A 1% annual tightening rate will be applied to benchmarks effective January 1, 2020. The tightening rate is applied to all emissions covered under the benchmark, except for IP emissions, which are not subject to tightening.
For assigned benchmarks the tightening rate will be applied when the benchmark is assigned or prior to 2020. The linear tightening rate for each assigned benchmark is calculated by:
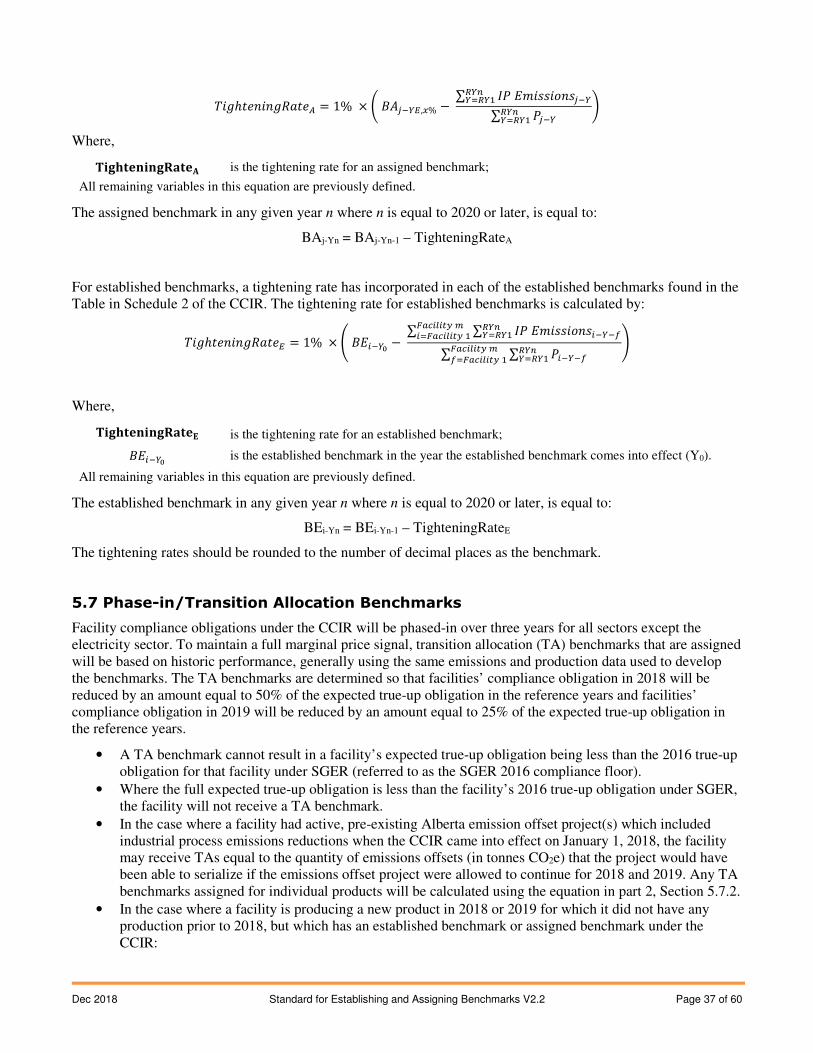
Dec 2018 Standard for Establishing and Assigning Benchmarks V2.2 Page 37 of 60
��|ℎ�����|�M��~ = 1% × � ������,�% − ∑ �! ������������#�$�%#�&∑ !���#�$�%#�& �
Where,
��������������) is the tightening rate for an assigned benchmark;
All remaining variables in this equation are previously defined.
The assigned benchmark in any given year n where n is equal to 2020 or later, is equal to:
BAj-Yn = BAj-Yn-1 – TighteningRateA
For established benchmarks, a tightening rate has incorporated in each of the established benchmarks found in the Table in Schedule 2 of the CCIR. The tightening rate for established benchmarks is calculated by:
��|ℎ�����|�M��� = 1% × � ��H��e − ∑ ∑ �! ���������H���g#�$�%#�&BFhHiHGA EH%BFhHiHGA &∑ ∑ !H���g#�$�%#�&BFhHiHGA Eg%BFhHiHGA &�
Where,
��������������, is the tightening rate for an established benchmark;
��H��e is the established benchmark in the year the established benchmark comes into effect (Y0).
All remaining variables in this equation are previously defined.
The established benchmark in any given year n where n is equal to 2020 or later, is equal to:
BEi-Yn = BEi-Yn-1 – TighteningRateE
The tightening rates should be rounded to the number of decimal places as the benchmark.
5.7 Phase-in/Transition Allocation Benchmarks
Facility compliance obligations under the CCIR will be phased-in over three years for all sectors except the electricity sector. To maintain a full marginal price signal, transition allocation (TA) benchmarks that are assigned will be based on historic performance, generally using the same emissions and production data used to develop the benchmarks. The TA benchmarks are determined so that facilities’ compliance obligation in 2018 will be reduced by an amount equal to 50% of the expected true-up obligation in the reference years and facilities’ compliance obligation in 2019 will be reduced by an amount equal to 25% of the expected true-up obligation in the reference years.
• A TA benchmark cannot result in a facility’s expected true-up obligation being less than the 2016 true-up obligation for that facility under SGER (referred to as the SGER 2016 compliance floor).
• Where the full expected true-up obligation is less than the facility’s 2016 true-up obligation under SGER, the facility will not receive a TA benchmark.
• In the case where a facility had active, pre-existing Alberta emission offset project(s) which included industrial process emissions reductions when the CCIR came into effect on January 1, 2018, the facility may receive TAs equal to the quantity of emissions offsets (in tonnes CO2e) that the project would have been able to serialize if the emissions offset project were allowed to continue for 2018 and 2019. Any TA benchmarks assigned for individual products will be calculated using the equation in part 2, Section 5.7.2.
• In the case where a facility is producing a new product in 2018 or 2019 for which it did not have any production prior to 2018, but which has an established benchmark or assigned benchmark under the CCIR:
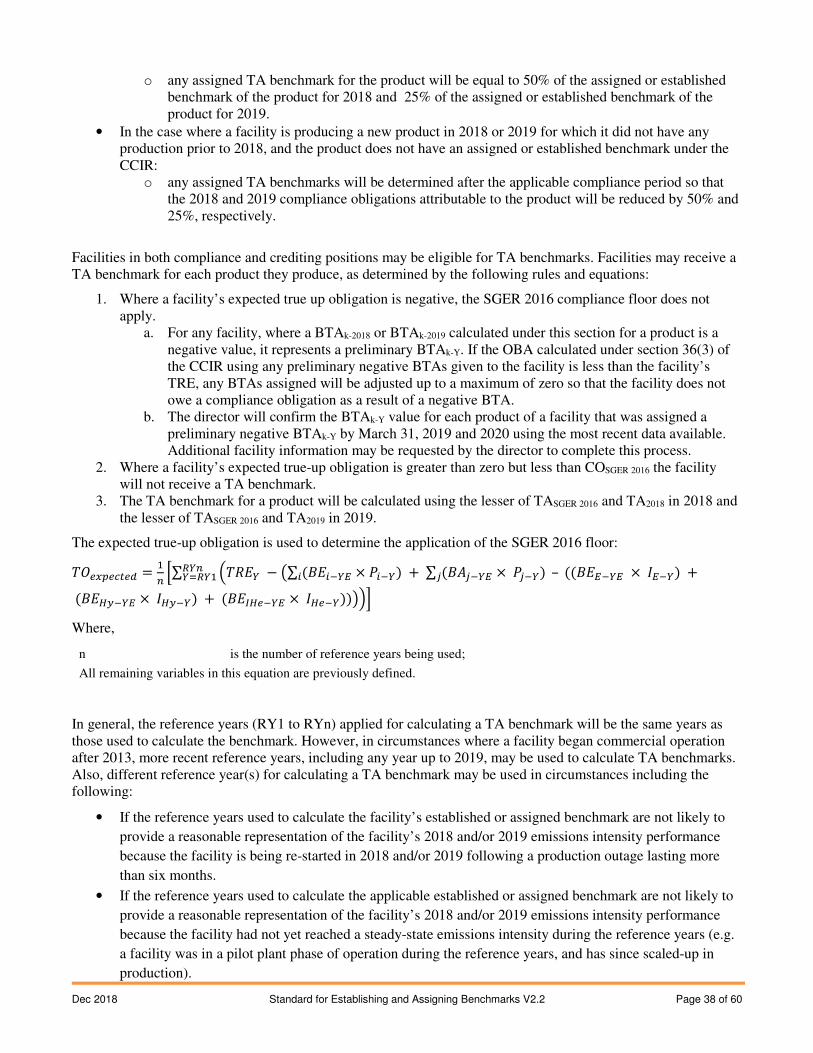
Dec 2018 Standard for Establishing and Assigning Benchmarks V2.2 Page 38 of 60
o any assigned TA benchmark for the product will be equal to 50% of the assigned or established benchmark of the product for 2018 and 25% of the assigned or established benchmark of the product for 2019.
• In the case where a facility is producing a new product in 2018 or 2019 for which it did not have any production prior to 2018, and the product does not have an assigned or established benchmark under the CCIR:
o any assigned TA benchmarks will be determined after the applicable compliance period so that the 2018 and 2019 compliance obligations attributable to the product will be reduced by 50% and 25%, respectively.
Facilities in both compliance and crediting positions may be eligible for TA benchmarks. Facilities may receive a TA benchmark for each product they produce, as determined by the following rules and equations:
1. Where a facility’s expected true up obligation is negative, the SGER 2016 compliance floor does not apply.
a. For any facility, where a BTAk-2018 or BTAk-2019 calculated under this section for a product is a negative value, it represents a preliminary BTAk-Y. If the OBA calculated under section 36(3) of the CCIR using any preliminary negative BTAs given to the facility is less than the facility’s TRE, any BTAs assigned will be adjusted up to a maximum of zero so that the facility does not owe a compliance obligation as a result of a negative BTA.
b. The director will confirm the BTAk-Y value for each product of a facility that was assigned a preliminary negative BTAk-Y by March 31, 2019 and 2020 using the most recent data available. Additional facility information may be requested by the director to complete this process.
2. Where a facility’s expected true-up obligation is greater than zero but less than COSGER 2016 the facility will not receive a TA benchmark.
3. The TA benchmark for a product will be calculated using the lesser of TASGER 2016 and TA2018 in 2018 and the lesser of TASGER 2016 and TA2019 in 2019.
The expected true-up obligation is used to determine the application of the SGER 2016 floor:
�O?�u?hG?� = &$ �∑ ����� − ;∑ (��H��� × !H��) + ∑ (������ × !���)� – ((������ × ����)H +#�$�%#�&
(��>A��� × �>A��) + (���>?��� × �>?��))<�� Where,
n is the number of reference years being used;
All remaining variables in this equation are previously defined.
In general, the reference years (RY1 to RYn) applied for calculating a TA benchmark will be the same years as those used to calculate the benchmark. However, in circumstances where a facility began commercial operation after 2013, more recent reference years, including any year up to 2019, may be used to calculate TA benchmarks. Also, different reference year(s) for calculating a TA benchmark may be used in circumstances including the following:
• If the reference years used to calculate the facility’s established or assigned benchmark are not likely to
provide a reasonable representation of the facility’s 2018 and/or 2019 emissions intensity performance
because the facility is being re-started in 2018 and/or 2019 following a production outage lasting more
than six months.
• If the reference years used to calculate the applicable established or assigned benchmark are not likely to
provide a reasonable representation of the facility’s 2018 and/or 2019 emissions intensity performance
because the facility had not yet reached a steady-state emissions intensity during the reference years (e.g.
a facility was in a pilot plant phase of operation during the reference years, and has since scaled-up in
production).

Dec 2018 Standard for Establishing and Assigning Benchmarks V2.2 Page 39 of 60
• The director has designated a new year of commercial operation in accordance with Section 1(4) of the
CCIR.
The TAs for 2018 are calculated as:
��P�&� = 0.5 �O��������
The TAs for 2019 are calculated as:
��P�&� = 0.25 �O��������
���S�#P�&� = �O�������� − NO�S�#P�&�
Where,
COSGER2016 is the actual 2016 compliance obligation for the given facility under SGER.
5.7.1 TA Benchmark for Facilities which had active, pre-existing Alberta Emission Offset Project(s) with IP Emissions Reductions when the CCIR came into Effect
Industrial process (IP) emissions were not included in the SGER scope of total annual emissions, and were therefore not subject to a reduction target. As such, SGER regulated facilities were able to earn emission offsets for the reduction of IP emissions under approved offset quantification protocols such as the Nitrous Oxide Abatement from Nitric Acid Production.
The CCIR took effect on January 1, 2018. Under the CCIR, IP emissions are now included in the scope of total regulated emissions and are included in benchmark values. As a result, facilities are no longer able to earn emission offsets for IP emissions reductions now occurring within a CCIR facility.
In order to support the transition to the CCIR emissions scope, the director may assign TA benchmarks for 2018 and 2019 to facilities who had pre-existing, active emission offset projects involving IP emissions reductions when the CCIR took effect.
For a facility which had an active emission offset project involving IP emissions reductions when the CCIR came into effect on January 1, 2018, any assigned TA benchmark for 2018 associated with IP emissions reduction relative to the emission offset project baseline condition will typically be calculated as:
���J �� #?�whGHC$m�P�&� = (�M��p��� �! ���������P�&� − !��0��� �! ���������P�&�) × Ooo��� !��0��� QM@�P�&� 365
Where,
TAEO IP Reductions-2018 is the transition allocations for 2018 which correspond to the quantity of Alberta emission offsets, in tonnes CO2eq, that the facility would have received in 2018 due to IP emissions reductions under an emission offset project that was pre-existing when the CCIR took effect;
Baseline IP Emissions2018 is what the facility’s 2018 IP emissions would have been if the emission offset project had not been implemented, in accordance with the baseline condition established as part of its emission offset project, in tonnes CO2eq;
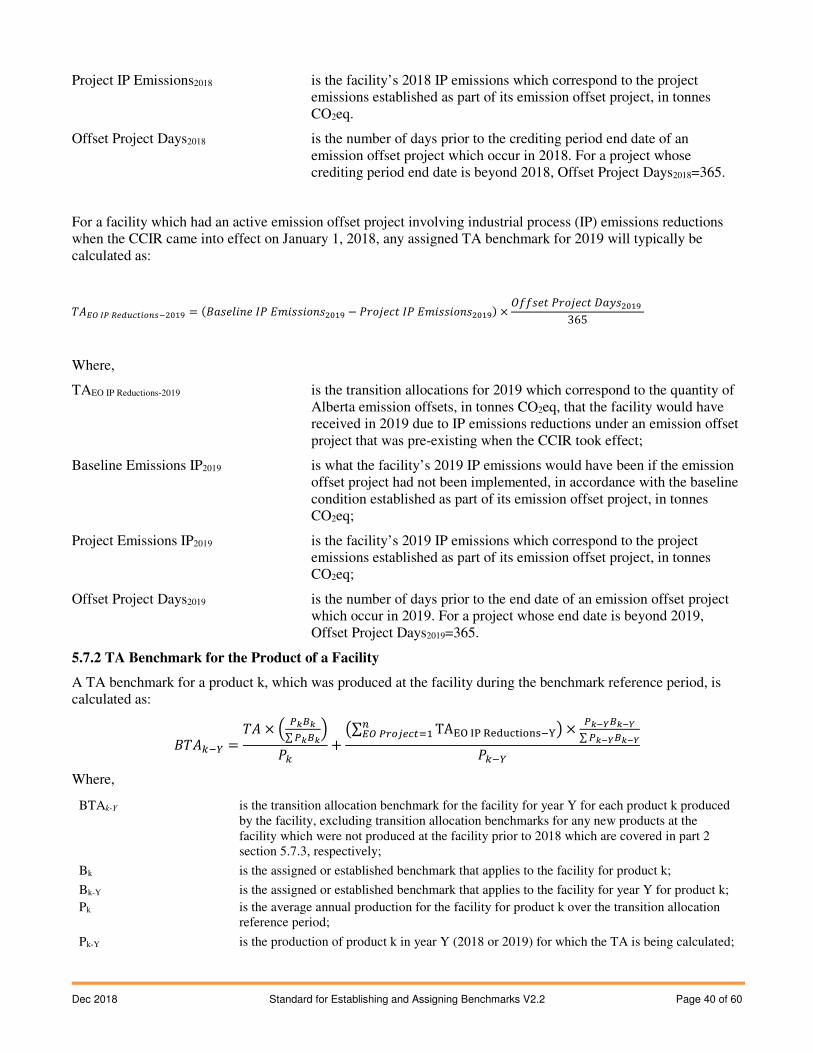
Dec 2018 Standard for Establishing and Assigning Benchmarks V2.2 Page 40 of 60
Project IP Emissions2018 is the facility’s 2018 IP emissions which correspond to the project emissions established as part of its emission offset project, in tonnes CO2eq.
Offset Project Days2018 is the number of days prior to the crediting period end date of an emission offset project which occur in 2018. For a project whose crediting period end date is beyond 2018, Offset Project Days2018=365.
For a facility which had an active emission offset project involving industrial process (IP) emissions reductions when the CCIR came into effect on January 1, 2018, any assigned TA benchmark for 2019 will typically be calculated as:
���J �� #?�whGHC$m�P�&� = (�M��p��� �! ���������P�&� − !��0��� �! ���������P�&�) × Ooo��� !��0��� QM@�P�&� 365
Where,
TAEO IP Reductions-2019 is the transition allocations for 2019 which correspond to the quantity of Alberta emission offsets, in tonnes CO2eq, that the facility would have received in 2019 due to IP emissions reductions under an emission offset project that was pre-existing when the CCIR took effect;
Baseline Emissions IP2019 is what the facility’s 2019 IP emissions would have been if the emission offset project had not been implemented, in accordance with the baseline condition established as part of its emission offset project, in tonnes CO2eq;
Project Emissions IP2019 is the facility’s 2019 IP emissions which correspond to the project emissions established as part of its emission offset project, in tonnes CO2eq;
Offset Project Days2019 is the number of days prior to the end date of an emission offset project which occur in 2019. For a project whose end date is beyond 2019, Offset Project Days2019=365.
5.7.2 TA Benchmark for the Product of a Facility
A TA benchmark for a product k, which was produced at the facility during the benchmark reference period, is calculated as:
������ = �� × � ��l�∑ ��l��!� + ;∑ TA¢£ ¤¥ ¦§¨©ª«¬®¯�°$�J �DC�?hG%& < × ��±²l�±²∑ ��±²l�±²!���
Where,
BTAk-Y is the transition allocation benchmark for the facility for year Y for each product k produced by the facility, excluding transition allocation benchmarks for any new products at the facility which were not produced at the facility prior to 2018 which are covered in part 2 section 5.7.3, respectively;
Bk is the assigned or established benchmark that applies to the facility for product k;
Bk-Y
Pk
is the assigned or established benchmark that applies to the facility for year Y for product k;
is the average annual production for the facility for product k over the transition allocation reference period;
Pk-Y is the production of product k in year Y (2018 or 2019) for which the TA is being calculated;
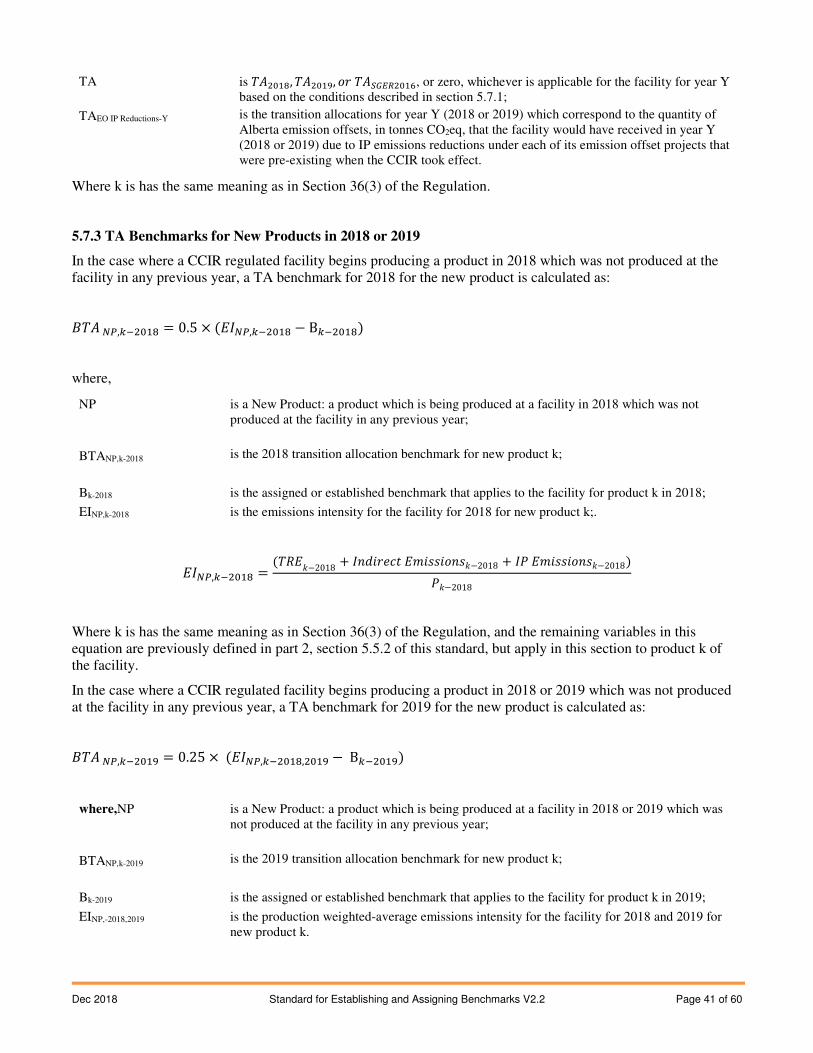
Dec 2018 Standard for Establishing and Assigning Benchmarks V2.2 Page 41 of 60
TA
TAEO IP Reductions-Y
is ��P�&�, ��P�&�, �� ���S�#P�&�, or zero, whichever is applicable for the facility for year Y based on the conditions described in section 5.7.1;
is the transition allocations for year Y (2018 or 2019) which correspond to the quantity of Alberta emission offsets, in tonnes CO2eq, that the facility would have received in year Y (2018 or 2019) due to IP emissions reductions under each of its emission offset projects that were pre-existing when the CCIR took effect.
Where k is has the same meaning as in Section 36(3) of the Regulation.
5.7.3 TA Benchmarks for New Products in 2018 or 2019
In the case where a CCIR regulated facility begins producing a product in 2018 which was not produced at the facility in any previous year, a TA benchmark for 2018 for the new product is calculated as:
��� R�,��P�&� = 0.5 × (��R�,��P�&� − B��P�&�)
where,
NP
BTANP,k-2018
is a New Product: a product which is being produced at a facility in 2018 which was not produced at the facility in any previous year;
is the 2018 transition allocation benchmark for new product k;
Bk-2018 is the assigned or established benchmark that applies to the facility for product k in 2018;
EINP,k-2018 is the emissions intensity for the facility for 2018 for new product k;.
��R�,��P�&� = (���´−2018 + �������� ���������´−2018 + �! ���������´−2018)!´−2018
Where k is has the same meaning as in Section 36(3) of the Regulation, and the remaining variables in this equation are previously defined in part 2, section 5.5.2 of this standard, but apply in this section to product k of the facility.
In the case where a CCIR regulated facility begins producing a product in 2018 or 2019 which was not produced at the facility in any previous year, a TA benchmark for 2019 for the new product is calculated as:
��� R�,��P�&� = 0.25 × (��R�,��P�&�,P�&� − B��P�&�)
where,NP
BTANP,k-2019
is a New Product: a product which is being produced at a facility in 2018 or 2019 which was not produced at the facility in any previous year;
is the 2019 transition allocation benchmark for new product k;
Bk-2019 is the assigned or established benchmark that applies to the facility for product k in 2019;
EINP,-2018,2019 is the production weighted-average emissions intensity for the facility for 2018 and 2019 for new product k.
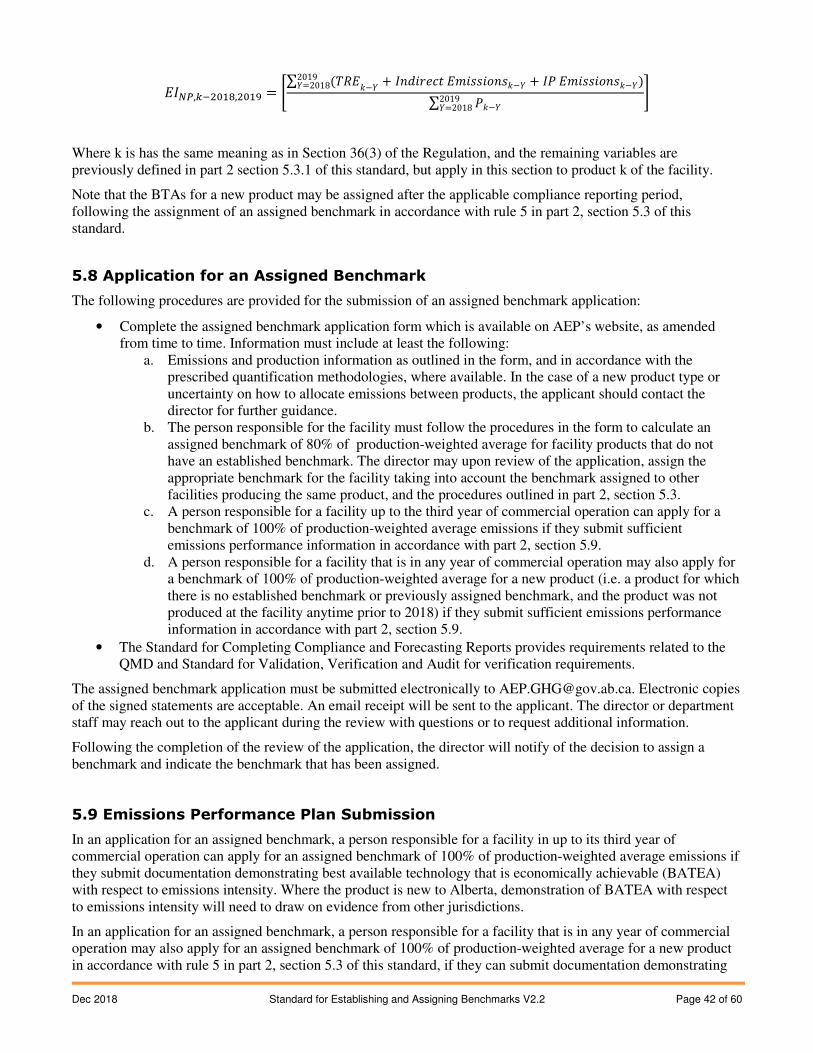
Dec 2018 Standard for Establishing and Assigning Benchmarks V2.2 Page 42 of 60
��R�,��P�&�,P�&� = �∑ (���´−1 + �������� ���������´−1 + �! ���������´−1)20191=2018 ∑ !´−120191=2018 '
Where k is has the same meaning as in Section 36(3) of the Regulation, and the remaining variables are previously defined in part 2 section 5.3.1 of this standard, but apply in this section to product k of the facility.
Note that the BTAs for a new product may be assigned after the applicable compliance reporting period, following the assignment of an assigned benchmark in accordance with rule 5 in part 2, section 5.3 of this standard.
5.8 Application for an Assigned Benchmark
The following procedures are provided for the submission of an assigned benchmark application:
• Complete the assigned benchmark application form which is available on AEP’s website, as amended from time to time. Information must include at least the following:
a. Emissions and production information as outlined in the form, and in accordance with the prescribed quantification methodologies, where available. In the case of a new product type or uncertainty on how to allocate emissions between products, the applicant should contact the director for further guidance.
b. The person responsible for the facility must follow the procedures in the form to calculate an assigned benchmark of 80% of production-weighted average for facility products that do not have an established benchmark. The director may upon review of the application, assign the appropriate benchmark for the facility taking into account the benchmark assigned to other facilities producing the same product, and the procedures outlined in part 2, section 5.3.
c. A person responsible for a facility up to the third year of commercial operation can apply for a benchmark of 100% of production-weighted average emissions if they submit sufficient emissions performance information in accordance with part 2, section 5.9.
d. A person responsible for a facility that is in any year of commercial operation may also apply for a benchmark of 100% of production-weighted average for a new product (i.e. a product for which there is no established benchmark or previously assigned benchmark, and the product was not produced at the facility anytime prior to 2018) if they submit sufficient emissions performance information in accordance with part 2, section 5.9.
• The Standard for Completing Compliance and Forecasting Reports provides requirements related to the QMD and Standard for Validation, Verification and Audit for verification requirements.
The assigned benchmark application must be submitted electronically to [email protected]. Electronic copies of the signed statements are acceptable. An email receipt will be sent to the applicant. The director or department staff may reach out to the applicant during the review with questions or to request additional information.
Following the completion of the review of the application, the director will notify of the decision to assign a benchmark and indicate the benchmark that has been assigned.
5.9 Emissions Performance Plan Submission
In an application for an assigned benchmark, a person responsible for a facility in up to its third year of commercial operation can apply for an assigned benchmark of 100% of production-weighted average emissions if they submit documentation demonstrating best available technology that is economically achievable (BATEA) with respect to emissions intensity. Where the product is new to Alberta, demonstration of BATEA with respect to emissions intensity will need to draw on evidence from other jurisdictions.
In an application for an assigned benchmark, a person responsible for a facility that is in any year of commercial operation may also apply for an assigned benchmark of 100% of production-weighted average for a new product in accordance with rule 5 in part 2, section 5.3 of this standard, if they can submit documentation demonstrating
Dec 2018 Standard for Establishing and Assigning Benchmarks V2.2 Page 43 of 60
that the facility employs best available technology that is economically achievable with respect to emissions intensity for the production of that product. The director will consider the EITE status of the new product category in deciding whether to assign a 100% of average benchmark. Where the product is new to Alberta, demonstration of BATEA with respect to emissions intensity will need to draw on evidence from other jurisdictions.
In addition to the requirements outlined for an assigned benchmark application in part 1 and in section 5.8 of part 2, documentation supporting best in class performance claims may contain the following information:
• Environmental impact assessment or qualified consulting report detailing abatement and emissions reduction equipment utilized at the facility.
• Environmental impact assessment or qualified consulting report detailing expected emissions intensity in 10 subsequent years of operation.
• Detailed comparison of facility emissions intensity per unit output with comparable facilities in Canada (required, where available) and across international jurisdictions (where reliable data are available).
Using the information above, and any other information considered relevant, the person responsible for a facility should provide justification detailing how the facility employs BATEA emissions performance technology and expected real-world performance. The director will review the documentation and assign the appropriate benchmark. The director may request additional information to support this decision.
6.0 Ability to Receive Cost Containment Designation and Revoke Cost
Containment Designation
The cost containment program provides additional relief mechanisms to persons responsible for facilities who are likely to experience economic hardship attributable to incremental compliance costs incurred in respect of the facilities under the CCIR.
Economic hardship can be demonstrated using either of the following two criteria:
• Incremental compliance costs as defined in part 2 section 6.1.2 exceed 3% of facility sales for a facility in
a sector whose trade-exposure is designated as high or very high.
• Incremental compliance costs as defined in part 2 section 6.1.2 exceed 10% of facility profits for a facility
in a sector whose trade-exposure is designated as high or very high.
Facilities considering applying for cost containment are strongly encouraged to assess the associated
administrative costs prior to making an application. Applications require additional reporting, validation and
auditing. Facilities that are admitted to the cost containment program will be subject to additional regulatory
reporting obligations, which will require auditing, third party verification, and third party validation. These
additional costs are wholly the responsibility of the facility and will not be considered as part of incremental
compliance costs when assessing eligibility for cost containment relief mechanisms.
The cost containment designation application process is described in part 2, section 6.2 of this standard.
If the Minister revokes the cost containment designation the facility will remain subject to the CCIR.
6.1 Economic Hardship Criteria
In order to be eligible for a cost containment designation, a facility must demonstrate it is likely to experience economic hardship attributable to incremental compliance costs under the CCIR for at least one compliance year in the period from 2018 through 2022.
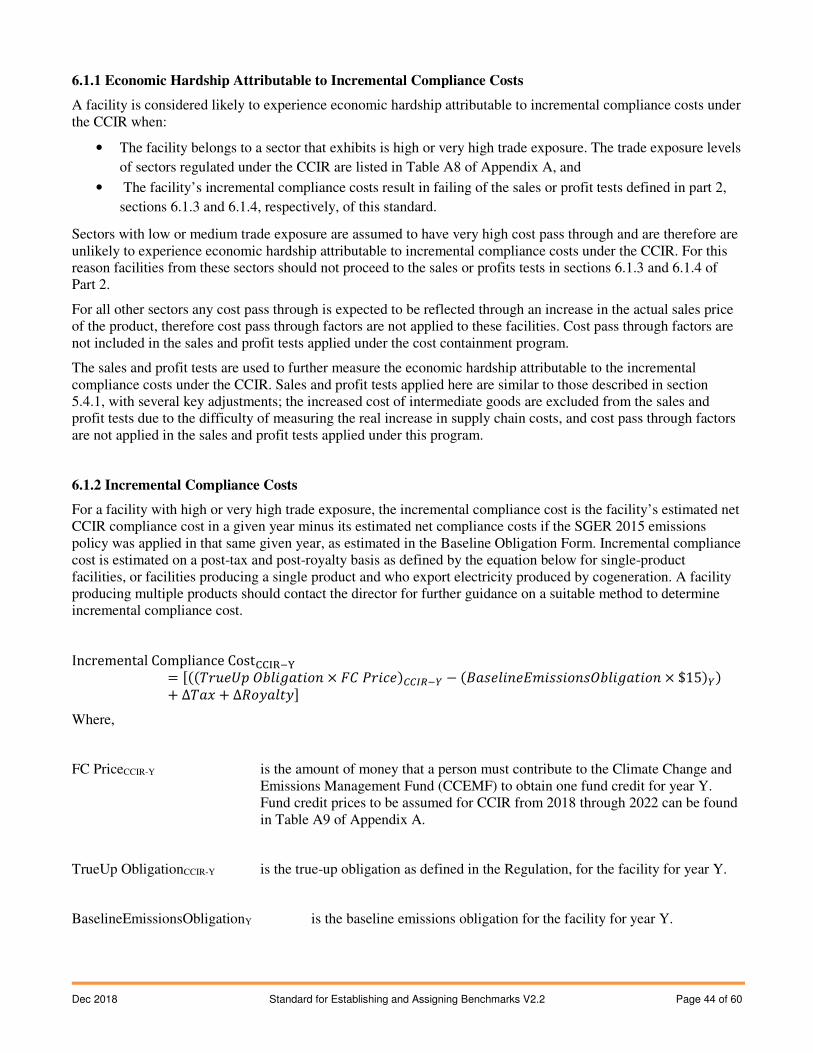
Dec 2018 Standard for Establishing and Assigning Benchmarks V2.2 Page 44 of 60
6.1.1 Economic Hardship Attributable to Incremental Compliance Costs
A facility is considered likely to experience economic hardship attributable to incremental compliance costs under the CCIR when:
• The facility belongs to a sector that exhibits is high or very high trade exposure. The trade exposure levels
of sectors regulated under the CCIR are listed in Table A8 of Appendix A, and
• The facility’s incremental compliance costs result in failing of the sales or profit tests defined in part 2,
sections 6.1.3 and 6.1.4, respectively, of this standard.
Sectors with low or medium trade exposure are assumed to have very high cost pass through and are therefore are unlikely to experience economic hardship attributable to incremental compliance costs under the CCIR. For this reason facilities from these sectors should not proceed to the sales or profits tests in sections 6.1.3 and 6.1.4 of Part 2.
For all other sectors any cost pass through is expected to be reflected through an increase in the actual sales price of the product, therefore cost pass through factors are not applied to these facilities. Cost pass through factors are not included in the sales and profit tests applied under the cost containment program.
The sales and profit tests are used to further measure the economic hardship attributable to the incremental compliance costs under the CCIR. Sales and profit tests applied here are similar to those described in section 5.4.1, with several key adjustments; the increased cost of intermediate goods are excluded from the sales and profit tests due to the difficulty of measuring the real increase in supply chain costs, and cost pass through factors are not applied in the sales and profit tests applied under this program.
6.1.2 Incremental Compliance Costs
For a facility with high or very high trade exposure, the incremental compliance cost is the facility’s estimated net CCIR compliance cost in a given year minus its estimated net compliance costs if the SGER 2015 emissions policy was applied in that same given year, as estimated in the Baseline Obligation Form. Incremental compliance cost is estimated on a post-tax and post-royalty basis as defined by the equation below for single-product facilities, or facilities producing a single product and who export electricity produced by cogeneration. A facility producing multiple products should contact the director for further guidance on a suitable method to determine incremental compliance cost.
Incremental Compliance CostÃä¦�°= Ä((��Å�Æ� OÇp�|M���� × LN !����)II�#�� − (�M��p������������OÇp�|M���� × $15)�)+ ∆�M� + ∆��@Mp�@Ê Where,
FC PriceCCIR-Y is the amount of money that a person must contribute to the Climate Change and Emissions Management Fund (CCEMF) to obtain one fund credit for year Y. Fund credit prices to be assumed for CCIR from 2018 through 2022 can be found in Table A9 of Appendix A.
TrueUp ObligationCCIR-Y is the true-up obligation as defined in the Regulation, for the facility for year Y.
BaselineEmissionsObligationY is the baseline emissions obligation for the facility for year Y.
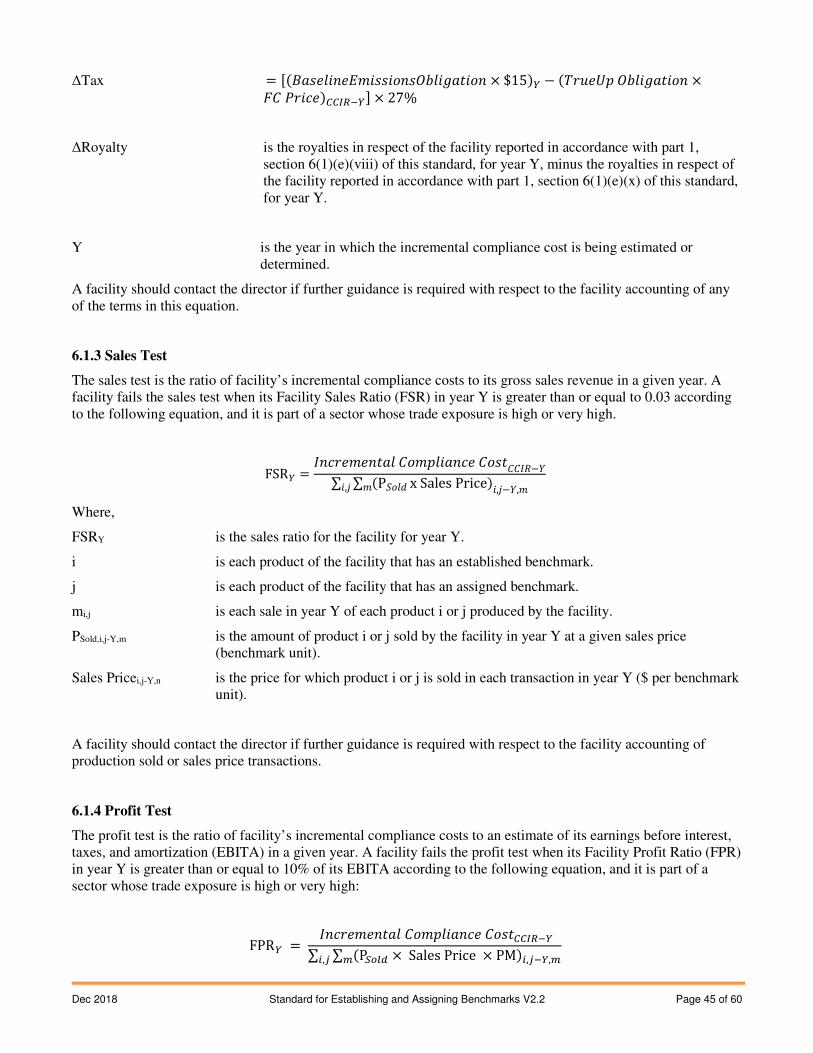
Dec 2018 Standard for Establishing and Assigning Benchmarks V2.2 Page 45 of 60
ΔTax = Ä(�M��p������������OÇp�|M���� × $15)� − (��Å�Æ� OÇp�|M���� ×LN !����)II�#��Ê × 27%
ΔRoyalty is the royalties in respect of the facility reported in accordance with part 1, section 6(1)(e)(viii) of this standard, for year Y, minus the royalties in respect of the facility reported in accordance with part 1, section 6(1)(e)(x) of this standard, for year Y.
Y is the year in which the incremental compliance cost is being estimated or determined.
A facility should contact the director if further guidance is required with respect to the facility accounting of any of the terms in this equation.
6.1.3 Sales Test
The sales test is the ratio of facility’s incremental compliance costs to its gross sales revenue in a given year. A facility fails the sales test when its Facility Sales Ratio (FSR) in year Y is greater than or equal to 0.03 according to the following equation, and it is part of a sector whose trade exposure is high or very high.
FSR� = ���������Mp N���p�M��� N���NN��−1∑ ∑ (PÐ�p� x Sales Price)� �,0−1,��,0 Where,
FSRY is the sales ratio for the facility for year Y.
i is each product of the facility that has an established benchmark.
j is each product of the facility that has an assigned benchmark.
mi,j is each sale in year Y of each product i or j produced by the facility.
PSold,i,j-Y,m is the amount of product i or j sold by the facility in year Y at a given sales price (benchmark unit).
Sales Pricei,j-Y,n is the price for which product i or j is sold in each transaction in year Y ($ per benchmark unit).
A facility should contact the director if further guidance is required with respect to the facility accounting of production sold or sales price transactions.
6.1.4 Profit Test
The profit test is the ratio of facility’s incremental compliance costs to an estimate of its earnings before interest, taxes, and amortization (EBITA) in a given year. A facility fails the profit test when its Facility Profit Ratio (FPR) in year Y is greater than or equal to 10% of its EBITA according to the following equation, and it is part of a sector whose trade exposure is high or very high:
FPR� = ���������Mp N���p�M��� N���II�#��∑ ∑ (P�Ci� × Sales Price × PM)H,���,EEH,�
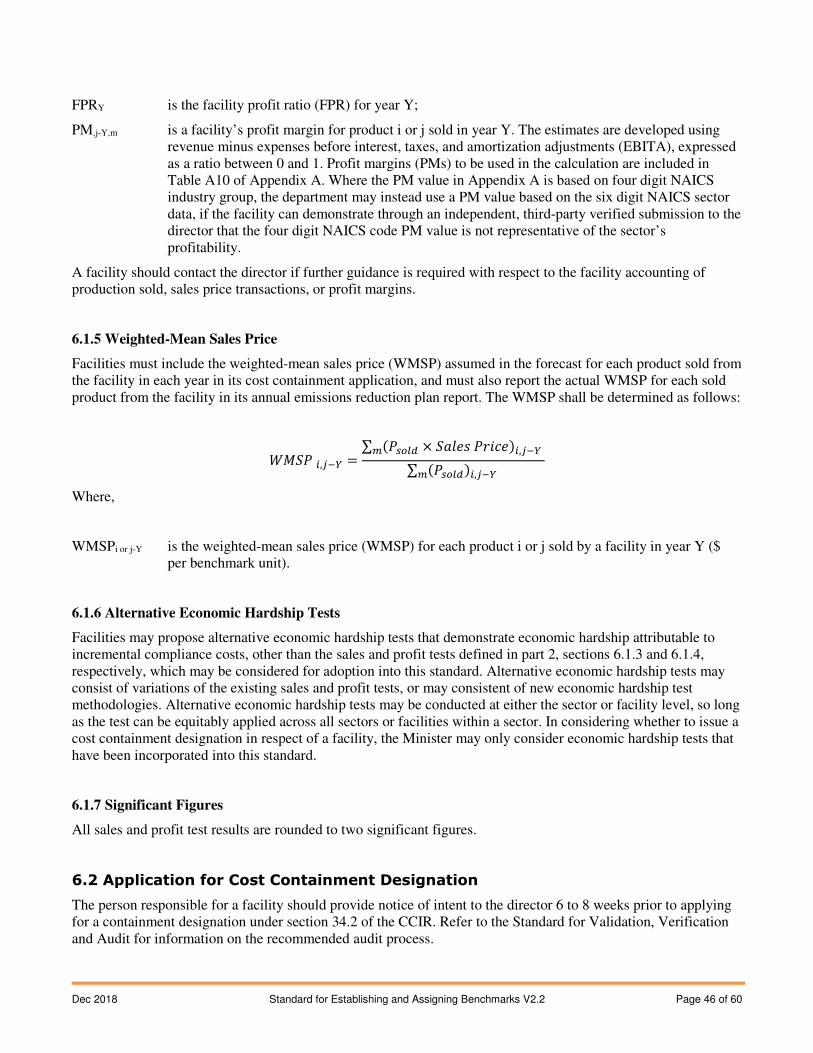
Dec 2018 Standard for Establishing and Assigning Benchmarks V2.2 Page 46 of 60
FPRY is the facility profit ratio (FPR) for year Y;
PM,j-Y,m is a facility’s profit margin for product i or j sold in year Y. The estimates are developed using revenue minus expenses before interest, taxes, and amortization adjustments (EBITA), expressed as a ratio between 0 and 1. Profit margins (PMs) to be used in the calculation are included in Table A10 of Appendix A. Where the PM value in Appendix A is based on four digit NAICS industry group, the department may instead use a PM value based on the six digit NAICS sector data, if the facility can demonstrate through an independent, third-party verified submission to the director that the four digit NAICS code PM value is not representative of the sector’s profitability.
A facility should contact the director if further guidance is required with respect to the facility accounting of production sold, sales price transactions, or profit margins.
6.1.5 Weighted-Mean Sales Price
Facilities must include the weighted-mean sales price (WMSP) assumed in the forecast for each product sold from the facility in each year in its cost containment application, and must also report the actual WMSP for each sold product from the facility in its annual emissions reduction plan report. The WMSP shall be determined as follows:
ÓÔÐ! H,��� = ∑ (!mCi� × ÐMp�� !����)H,��� E ∑ (!mCi�)H,��� E
Where,
WMSPi or j-Y is the weighted-mean sales price (WMSP) for each product i or j sold by a facility in year Y ($ per benchmark unit).
6.1.6 Alternative Economic Hardship Tests
Facilities may propose alternative economic hardship tests that demonstrate economic hardship attributable to incremental compliance costs, other than the sales and profit tests defined in part 2, sections 6.1.3 and 6.1.4, respectively, which may be considered for adoption into this standard. Alternative economic hardship tests may consist of variations of the existing sales and profit tests, or may consistent of new economic hardship test methodologies. Alternative economic hardship tests may be conducted at either the sector or facility level, so long as the test can be equitably applied across all sectors or facilities within a sector. In considering whether to issue a cost containment designation in respect of a facility, the Minister may only consider economic hardship tests that have been incorporated into this standard.
6.1.7 Significant Figures
All sales and profit test results are rounded to two significant figures.
6.2 Application for Cost Containment Designation
The person responsible for a facility should provide notice of intent to the director 6 to 8 weeks prior to applying for a containment designation under section 34.2 of the CCIR. Refer to the Standard for Validation, Verification and Audit for information on the recommended audit process.
Dec 2018 Standard for Establishing and Assigning Benchmarks V2.2 Page 47 of 60
An application for cost containment designation must be completed using the Cost Containment Designation Application Form provided on the Alberta Environment and Parks (AEP) website.
The Baseline Obligation form calculates the emissions obligation that the facility would have experienced if it were under the regime outlined in the Specified Gas Emitters Regulation in 2015 for a given year. Specifically:
• Emissions intensity targets are based on a reduction below facility historic average emissions intensity.
New facilities have an emissions intensity target of 2% below baseline levels in their fourth year of
commercial operation increasing by 2% per year to a maximum of 12%. Existing facilities receive an
emissions intensity target of 12% below baseline levels.
• Total Annual Emissions as calculated under the Specified Gas Emitters Regulation are used rather than
Total Regulated Emissions. For example, under this regulation industrial process emissions are excluded
from the calculations.
• Cogeneration emissions are incorporated in a manner that differed from the CCIR. Indirect emissions for
electricity, heat and hydrogen are not included in the emissions calculations.
In the Baseline Obligation form, the baseline emissions intensity for a facility is the Baseline emissions intensity assigned under SGER for 2017. For a facility that did not have a baseline emissions intensity assigned for 2017, the baseline emissions intensity is estimated using the baselines years as described under part 2, section 4.3 of this standard.
The Statement of Certification included in the application must be signed by a certifying official who has the authority to bind the company. An electronic copy of the signed statement is acceptable.
The person responsible for the facility must submit the Cost Containment Designation Application Form electronically to [email protected]. Separate email submissions are required for each facility seeking to receive a cost containment designation. An email confirming receipt of the application will be sent to the applicant.
A request to revoke a cost containment designation must be signed by a certifying official who has the authority to bind the person responsible. An electronic copy of the signed statement is acceptable.
6.3 Cost Containment Relief Mechanisms
Facilities who receive a cost containment designation may be eligible for the following relief mechanisms:
• The first form of relief provided will be removing the credit usage limit for the facility.
• Next, if increased credit usage is insufficient to relieve economic hardship attributable to incremental
compliance costs, priority will be given to providing relief through Industrial Energy Efficiency (IEE)
and other program grants if applicable.
• Finally, the director may assign a compliance cost containment allocation benchmark for a product of
the facility.
A facility should indicate its desired cost containment relief mechanism(s) in its cost containment designation application.
The total value of cost containment relief received by a cost containment designated facility will be limited to 100% of the facility’s maximum compliance obligation in a given compliance year (i.e. its true-up obligation multiplied by the fund price for the year), except for cost containment designated facilities receiving IEE grant funding. IEE grant funding will be dispersed such that the sum of compliance flexibility value, plus the value of all benefits received from the Government of Alberta which originate from the Climate Change Emissions Management Fund (CCEMF) or carbon levy (including IEE grant funding, but excluding funding provided for adaptation projects at the facility) will not exceed 100% of the facility’s cumulative total maximum compliance obligation through the end of 2022 for years in which it is designated as a cost containment facility. This mechanism for disbursing IEE grant funds will allow for faster deployment of grant funding to emissions
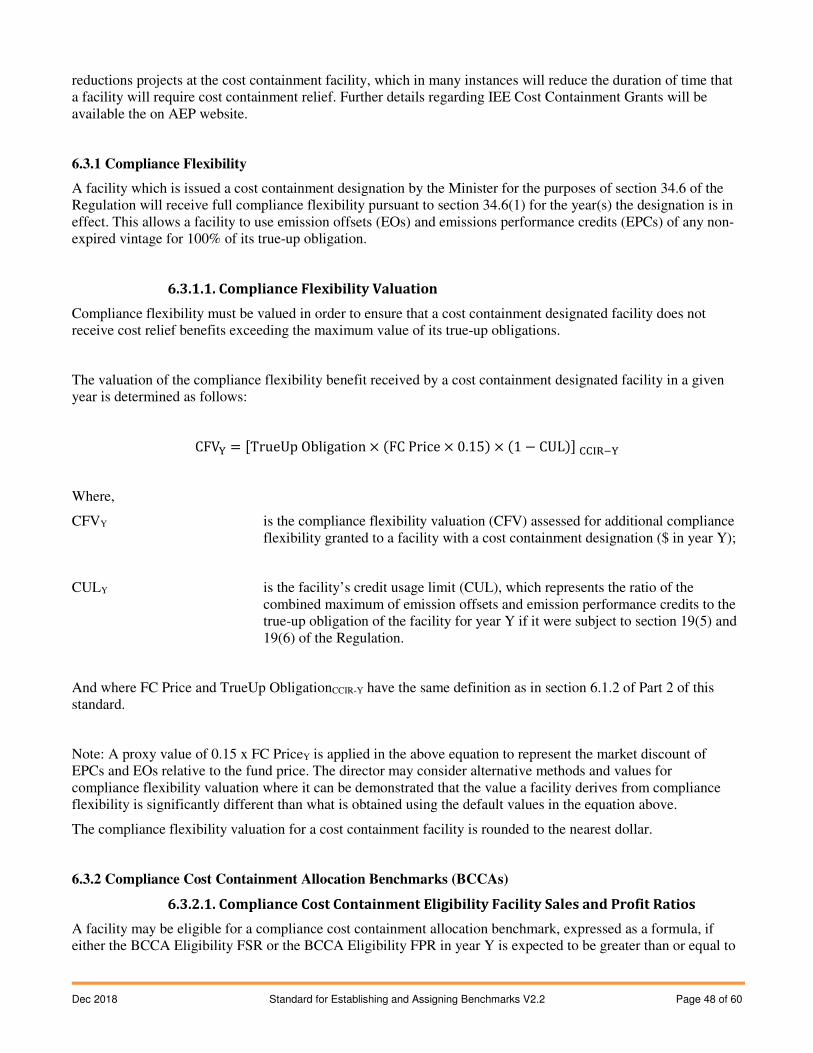
Dec 2018 Standard for Establishing and Assigning Benchmarks V2.2 Page 48 of 60
reductions projects at the cost containment facility, which in many instances will reduce the duration of time that a facility will require cost containment relief. Further details regarding IEE Cost Containment Grants will be available the on AEP website.
6.3.1 Compliance Flexibility
A facility which is issued a cost containment designation by the Minister for the purposes of section 34.6 of the Regulation will receive full compliance flexibility pursuant to section 34.6(1) for the year(s) the designation is in effect. This allows a facility to use emission offsets (EOs) and emissions performance credits (EPCs) of any non-expired vintage for 100% of its true-up obligation.
6.3.1.1. Compliance Flexibility Valuation
Compliance flexibility must be valued in order to ensure that a cost containment designated facility does not receive cost relief benefits exceeding the maximum value of its true-up obligations.
The valuation of the compliance flexibility benefit received by a cost containment designated facility in a given year is determined as follows:
CFV° = ÄTrueUp Obligation × (FC Price × 0.15) × (1 − CUL)Ê Ãä¦�°
Where,
CFVY is the compliance flexibility valuation (CFV) assessed for additional compliance flexibility granted to a facility with a cost containment designation ($ in year Y);
CULY is the facility’s credit usage limit (CUL), which represents the ratio of the combined maximum of emission offsets and emission performance credits to the true-up obligation of the facility for year Y if it were subject to section 19(5) and 19(6) of the Regulation.
And where FC Price and TrueUp ObligationCCIR-Y have the same definition as in section 6.1.2 of Part 2 of this standard.
Note: A proxy value of 0.15 x FC PriceY is applied in the above equation to represent the market discount of EPCs and EOs relative to the fund price. The director may consider alternative methods and values for compliance flexibility valuation where it can be demonstrated that the value a facility derives from compliance flexibility is significantly different than what is obtained using the default values in the equation above.
The compliance flexibility valuation for a cost containment facility is rounded to the nearest dollar.
6.3.2 Compliance Cost Containment Allocation Benchmarks (BCCAs)
6.3.2.1. Compliance Cost Containment Eligibility Facility Sales and Profit Ratios
A facility may be eligible for a compliance cost containment allocation benchmark, expressed as a formula, if either the BCCA Eligibility FSR or the BCCA Eligibility FPR in year Y is expected to be greater than or equal to
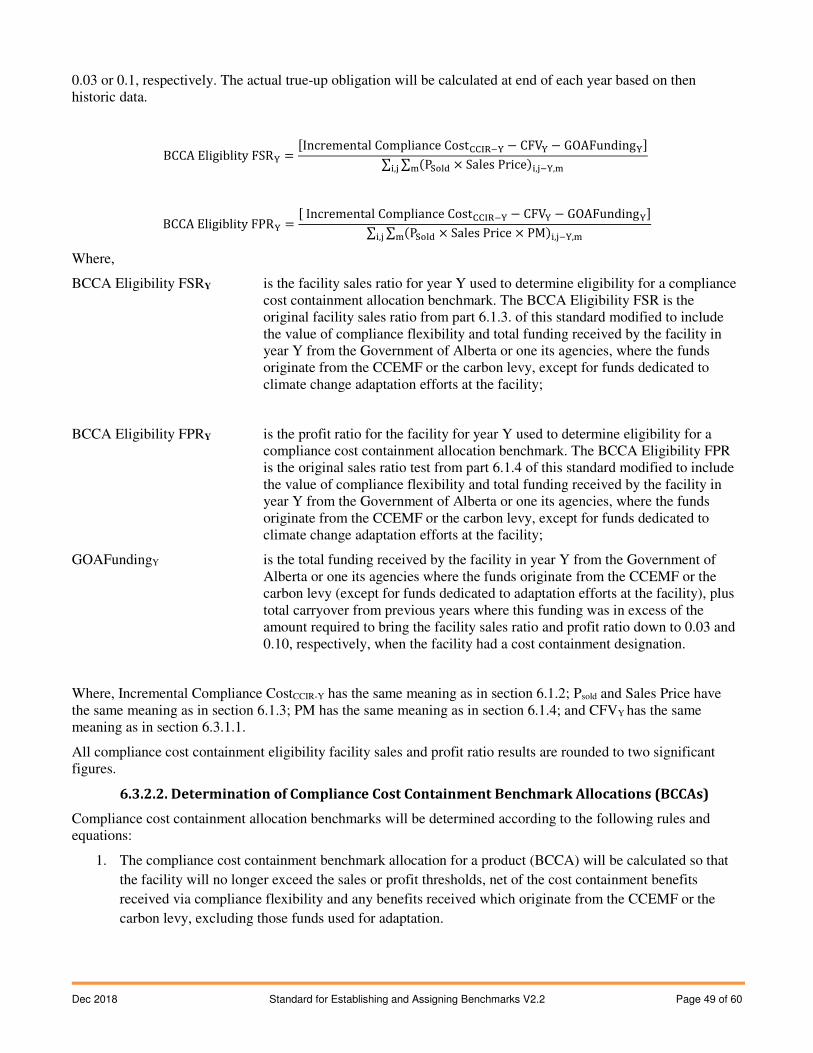
Dec 2018 Standard for Establishing and Assigning Benchmarks V2.2 Page 49 of 60
0.03 or 0.1, respectively. The actual true-up obligation will be calculated at end of each year based on then historic data.
BCCA Eligiblity FSR° = ÄIncremental Compliance CostÃä¦�° − CFV° − GOAFunding°Ê∑ ∑ (PÝÞ¨ × Sales Price)¬,ß�°,àà¬,ß
BCCA Eligiblity FPR° = Ä Incremental Compliance CostÃä¦�° − CFV° − GOAFunding°Ê∑ ∑ (PÝÞ¨ × Sales Price × PM)¬,ß�°,àà¬,ß
Where,
BCCA Eligibility FSRY is the facility sales ratio for year Y used to determine eligibility for a compliance cost containment allocation benchmark. The BCCA Eligibility FSR is the original facility sales ratio from part 6.1.3. of this standard modified to include the value of compliance flexibility and total funding received by the facility in year Y from the Government of Alberta or one its agencies, where the funds originate from the CCEMF or the carbon levy, except for funds dedicated to climate change adaptation efforts at the facility;
BCCA Eligibility FPRY is the profit ratio for the facility for year Y used to determine eligibility for a compliance cost containment allocation benchmark. The BCCA Eligibility FPR is the original sales ratio test from part 6.1.4 of this standard modified to include the value of compliance flexibility and total funding received by the facility in year Y from the Government of Alberta or one its agencies, where the funds originate from the CCEMF or the carbon levy, except for funds dedicated to climate change adaptation efforts at the facility;
GOAFundingY is the total funding received by the facility in year Y from the Government of Alberta or one its agencies where the funds originate from the CCEMF or the carbon levy (except for funds dedicated to adaptation efforts at the facility), plus total carryover from previous years where this funding was in excess of the amount required to bring the facility sales ratio and profit ratio down to 0.03 and 0.10, respectively, when the facility had a cost containment designation.
Where, Incremental Compliance CostCCIR-Y has the same meaning as in section 6.1.2; Psold and Sales Price have the same meaning as in section 6.1.3; PM has the same meaning as in section 6.1.4; and CFVY has the same meaning as in section 6.3.1.1.
All compliance cost containment eligibility facility sales and profit ratio results are rounded to two significant figures.
6.3.2.2. Determination of Compliance Cost Containment Benchmark Allocations (BCCAs)
Compliance cost containment allocation benchmarks will be determined according to the following rules and equations:
1. The compliance cost containment benchmark allocation for a product (BCCA) will be calculated so that
the facility will no longer exceed the sales or profit thresholds, net of the cost containment benefits
received via compliance flexibility and any benefits received which originate from the CCEMF or the
carbon levy, excluding those funds used for adaptation.
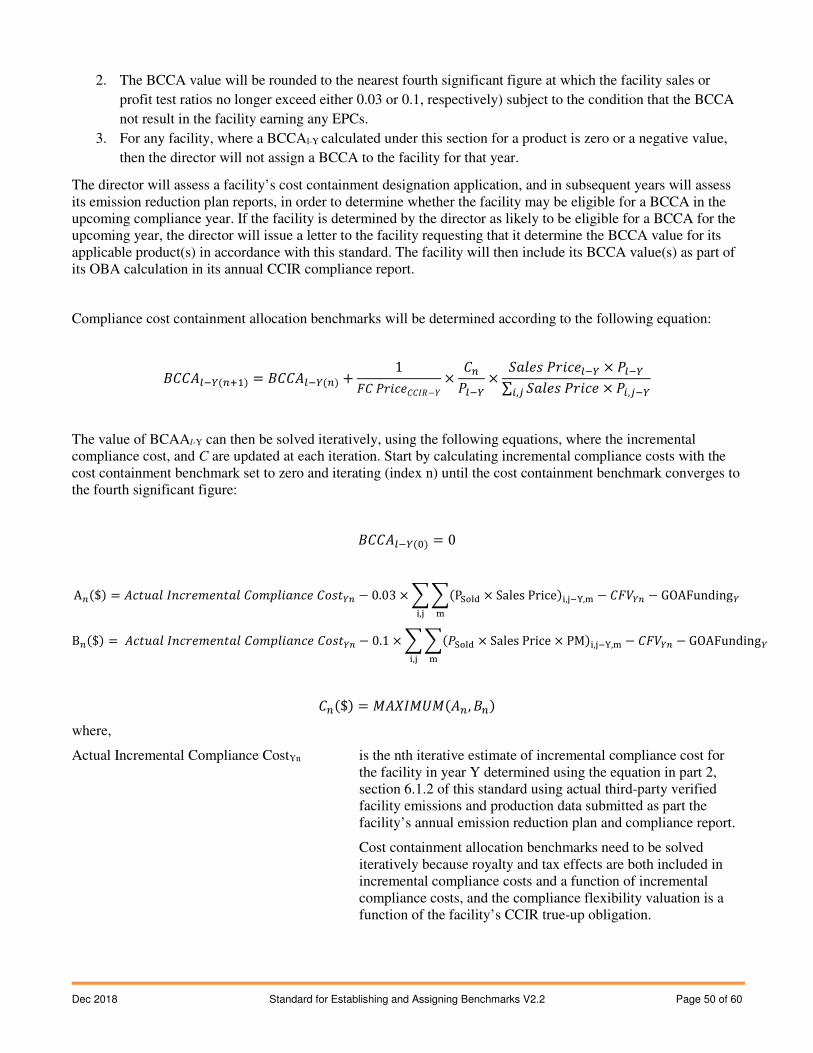
Dec 2018 Standard for Establishing and Assigning Benchmarks V2.2 Page 50 of 60
2. The BCCA value will be rounded to the nearest fourth significant figure at which the facility sales or
profit test ratios no longer exceed either 0.03 or 0.1, respectively) subject to the condition that the BCCA
not result in the facility earning any EPCs.
3. For any facility, where a BCCAl-Y calculated under this section for a product is zero or a negative value,
then the director will not assign a BCCA to the facility for that year.
The director will assess a facility’s cost containment designation application, and in subsequent years will assess its emission reduction plan reports, in order to determine whether the facility may be eligible for a BCCA in the upcoming compliance year. If the facility is determined by the director as likely to be eligible for a BCCA for the upcoming year, the director will issue a letter to the facility requesting that it determine the BCCA value for its applicable product(s) in accordance with this standard. The facility will then include its BCCA value(s) as part of its OBA calculation in its annual CCIR compliance report.
Compliance cost containment allocation benchmarks will be determined according to the following equation:
�NN�i��($á&) = �NN�i��($) + 1LN !����NN��−1 × N$!i�� × ÐMp�� !����i�� × !i��∑ ÐMp�� !���� × !H,���H,�
The value of BCAAl-Y can then be solved iteratively, using the following equations, where the incremental compliance cost, and C are updated at each iteration. Start by calculating incremental compliance costs with the cost containment benchmark set to zero and iterating (index n) until the cost containment benchmark converges to the fourth significant figure:
�NN�i��(�) = 0
A$($) = ���ÅMp ���������Mp N���p�M��� N����$ − 0.03 × â â(PÝÞ¨ × Sales Price)¬,ß�°,àà¬,ß
− NLã�$ − GOAFunding�
B$($) = ���ÅMp ���������Mp N���p�M��� N����$ − 0.1 × â â(!ÝÞ¨ × Sales Price × PM)¬,ß�°,àà¬,ß
− NLã�$ − GOAFunding�
N$($) = Ô�ä�ÔÆÔ(�$, �$)
where,
Actual Incremental Compliance CostYn is the nth iterative estimate of incremental compliance cost for the facility in year Y determined using the equation in part 2, section 6.1.2 of this standard using actual third-party verified facility emissions and production data submitted as part the facility’s annual emission reduction plan and compliance report.
Cost containment allocation benchmarks need to be solved iteratively because royalty and tax effects are both included in incremental compliance costs and a function of incremental compliance costs, and the compliance flexibility valuation is a function of the facility’s CCIR true-up obligation.
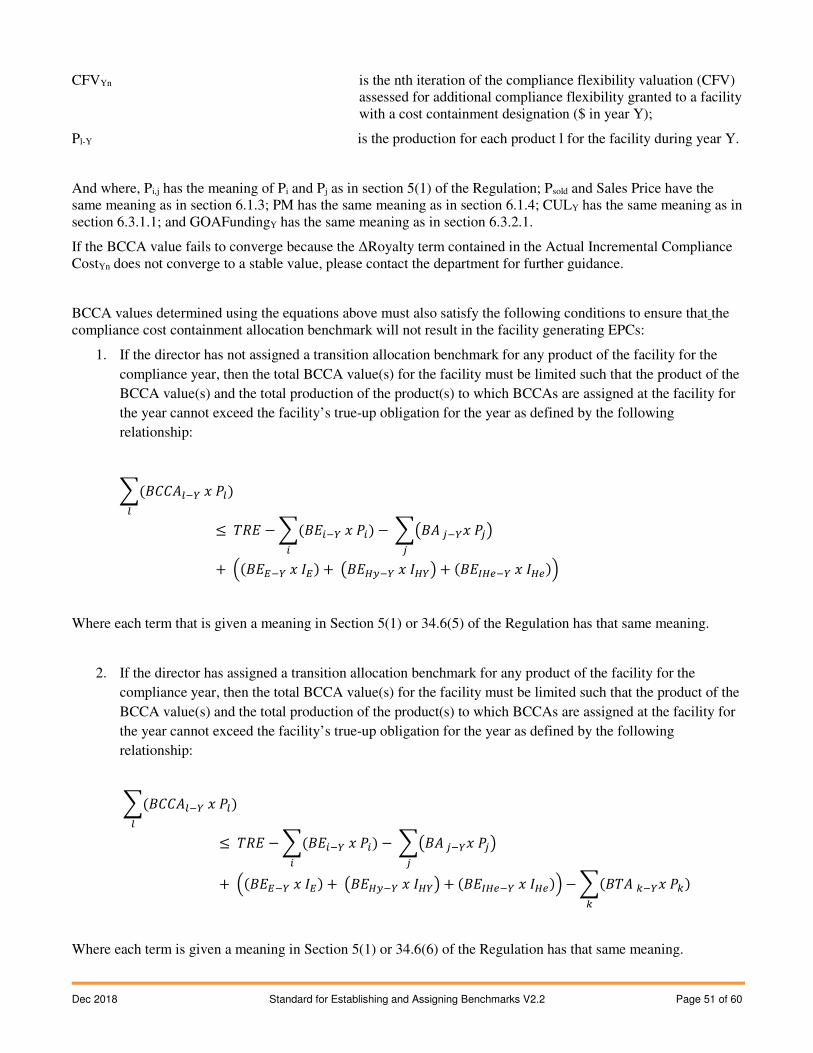
Dec 2018 Standard for Establishing and Assigning Benchmarks V2.2 Page 51 of 60
CFVYn is the nth iteration of the compliance flexibility valuation (CFV) assessed for additional compliance flexibility granted to a facility with a cost containment designation ($ in year Y);
Pl-Y is the production for each product l for the facility during year Y.
And where, Pi,j has the meaning of Pi and Pj as in section 5(1) of the Regulation; Psold and Sales Price have the same meaning as in section 6.1.3; PM has the same meaning as in section 6.1.4; CULY has the same meaning as in section 6.3.1.1; and GOAFundingY has the same meaning as in section 6.3.2.1.
If the BCCA value fails to converge because the ΔRoyalty term contained in the Actual Incremental Compliance CostYn does not converge to a stable value, please contact the department for further guidance.
BCCA values determined using the equations above must also satisfy the following conditions to ensure that the compliance cost containment allocation benchmark will not result in the facility generating EPCs:
1. If the director has not assigned a transition allocation benchmark for any product of the facility for the
compliance year, then the total BCCA value(s) for the facility must be limited such that the product of the
BCCA value(s) and the total production of the product(s) to which BCCAs are assigned at the facility for
the year cannot exceed the facility’s true-up obligation for the year as defined by the following
relationship:
â(�NN�i�� � !i)i ≤ ��� − â(��H�� � !H)
H− â;�� ���� !�<
�+ �(����� � ��) + ;��>A�� � �>�< + (���>?�� � �>?)�
Where each term that is given a meaning in Section 5(1) or 34.6(5) of the Regulation has that same meaning.
2. If the director has assigned a transition allocation benchmark for any product of the facility for the
compliance year, then the total BCCA value(s) for the facility must be limited such that the product of the
BCCA value(s) and the total production of the product(s) to which BCCAs are assigned at the facility for
the year cannot exceed the facility’s true-up obligation for the year as defined by the following
relationship:
â(�NN�i�� � !i)i ≤ ��� − â(��H�� � !H)
H− â;�� ���� !�<
�+ �(����� � ��) + ;��>A�� � �>�< + (���>?�� � �>?)� − â(��� ���� !�)
�
Where each term is given a meaning in Section 5(1) or 34.6(6) of the Regulation has that same meaning.
Dec 2018 Standard for Establishing and Assigning Benchmarks V2.2 Page 52 of 60
The compliance cost containment allocation benchmark value is rounded up to the next fourth significant figure to ensure that the facility BCCA sales and profit ratios are less than the respective thresholds of 0.03 or 0.1.
6.4 Emissions Reduction Plan
6.4.1 Emissions Reduction Plan
The forecast included as part of the emission reduction plan should include two different scenarios:
1. A baseline for the emissions reduction plan where the certified forecast is based on continuation of
facility operation under projected continued emissions intensity performance without implementation of
the emissions reduction plan.
2. Emission reduction plan project(s) where the certified forecast is based on implementation of the
emissions reduction plan. If an applicant intends to use Government of Alberta grant funding as part of its
emissions reduction plan project(s), then this facility should assume that it will receive grant funding from
the Government of Alberta for these projects in accordance with applicable grant program funding
criteria. The emissions reduction plan should also state the impact on the plan if the application for this
funding is not approved. The emission reduction plan project(s) may need to be updated as part of the
annual emissions reduction plan report per Section 34.4(3) of the Regulation in order to reflect any
changes based on actual grant funding amounts and terms and conditions of the grants.
In the case that the emissions reduction plan extends beyond the years for which the person responsible for the facility is seeking a cost containment designation, the plan must demonstrate that the person responsible will implement all known emissions abatement opportunities that have marginal abatement costs less than or equal to the cost of a fund credit in respect of the facility in each year.
A facility should contact the director if further guidance is required with respect to the contents of the emissions reduction plan.
6.4.2 Annual Emissions Reduction Plan Report
Please refer to the Standard for Completing Greenhouse Gas Compliance and Forecasting Reports for further information regarding the Annual Emissions Reduction Plan Report.
Dec 2018 Standard for Establishing and Assigning Benchmarks V2.2 Page 53 of 60
Any comments or questions regarding the content of this document may be directed to:
Alberta Climate Change Office
Regulatory and Compliance Branch
12th Floor, 10025 – 106 Street
Edmonton, Alberta, T5J 1G4
E-mail: [email protected]
XJustin Wheler
Executive Director, Regulatory and Complia...
Original signed by:
Justin Wheler, Executive Director
Regulatory and Compliance Branch
Alberta Climate Change Office
Date: December 20, 2018
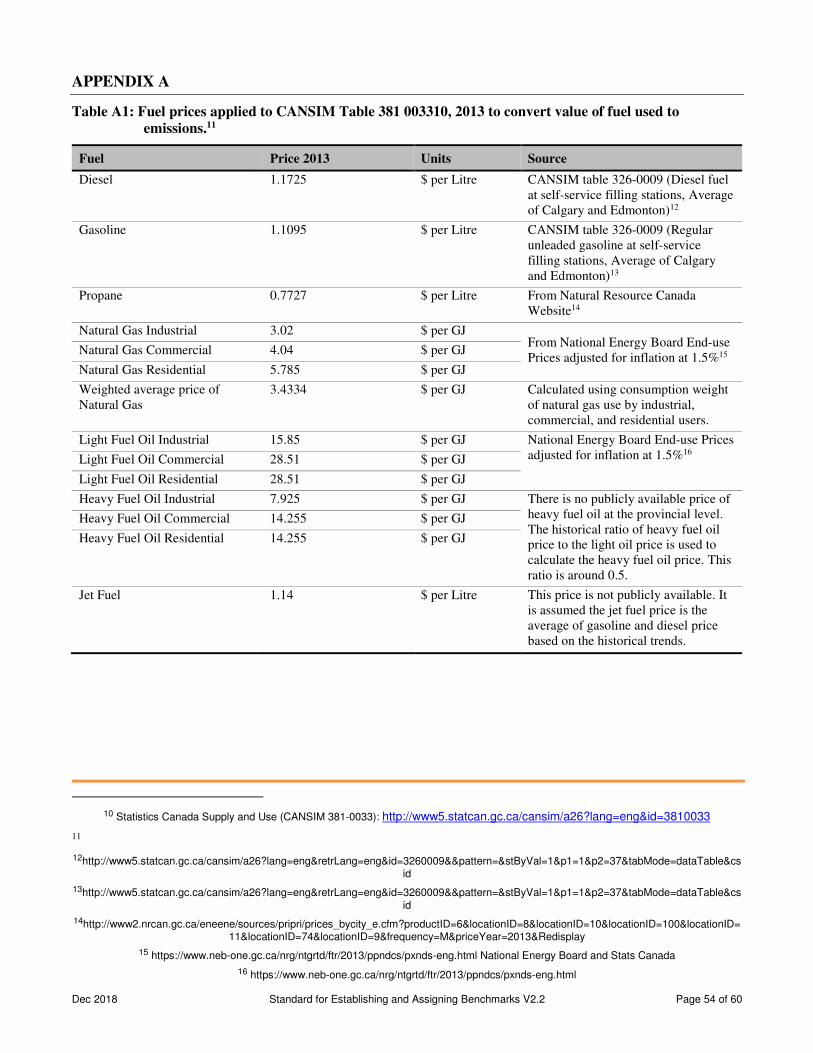
Dec 2018 Standard for Establishing and Assigning Benchmarks V2.2 Page 54 of 60
APPENDIX A
Table A1: Fuel prices applied to CANSIM Table 381 003310, 2013 to convert value of fuel used to emissions.11
Fuel Price 2013 Units Source
Diesel 1.1725 $ per Litre CANSIM table 326-0009 (Diesel fuel at self-service filling stations, Average of Calgary and Edmonton)12
Gasoline 1.1095 $ per Litre CANSIM table 326-0009 (Regular unleaded gasoline at self-service filling stations, Average of Calgary and Edmonton)13
Propane 0.7727 $ per Litre From Natural Resource Canada Website14
Natural Gas Industrial 3.02 $ per GJ From National Energy Board End-use Prices adjusted for inflation at 1.5%15
Natural Gas Commercial 4.04 $ per GJ
Natural Gas Residential 5.785 $ per GJ
Weighted average price of Natural Gas
3.4334 $ per GJ Calculated using consumption weight of natural gas use by industrial, commercial, and residential users.
Light Fuel Oil Industrial 15.85 $ per GJ National Energy Board End-use Prices adjusted for inflation at 1.5%16 Light Fuel Oil Commercial 28.51 $ per GJ
Light Fuel Oil Residential 28.51 $ per GJ
Heavy Fuel Oil Industrial 7.925 $ per GJ There is no publicly available price of heavy fuel oil at the provincial level. The historical ratio of heavy fuel oil price to the light oil price is used to calculate the heavy fuel oil price. This ratio is around 0.5.
Heavy Fuel Oil Commercial 14.255 $ per GJ
Heavy Fuel Oil Residential 14.255 $ per GJ
Jet Fuel 1.14 $ per Litre This price is not publicly available. It is assumed the jet fuel price is the average of gasoline and diesel price based on the historical trends.
10 Statistics Canada Supply and Use (CANSIM 381-0033): http://www5.statcan.gc.ca/cansim/a26?lang=eng&id=3810033
11 12http://www5.statcan.gc.ca/cansim/a26?lang=eng&retrLang=eng&id=3260009&&pattern=&stByVal=1&p1=1&p2=37&tabMode=dataTable&cs
id
13http://www5.statcan.gc.ca/cansim/a26?lang=eng&retrLang=eng&id=3260009&&pattern=&stByVal=1&p1=1&p2=37&tabMode=dataTable&csid
14http://www2.nrcan.gc.ca/eneene/sources/pripri/prices_bycity_e.cfm?productID=6&locationID=8&locationID=10&locationID=100&locationID=11&locationID=74&locationID=9&frequency=M&priceYear=2013&Redisplay
15 https://www.neb-one.gc.ca/nrg/ntgrtd/ftr/2013/ppndcs/pxnds-eng.html National Energy Board and Stats Canada
16 https://www.neb-one.gc.ca/nrg/ntgrtd/ftr/2013/ppndcs/pxnds-eng.html
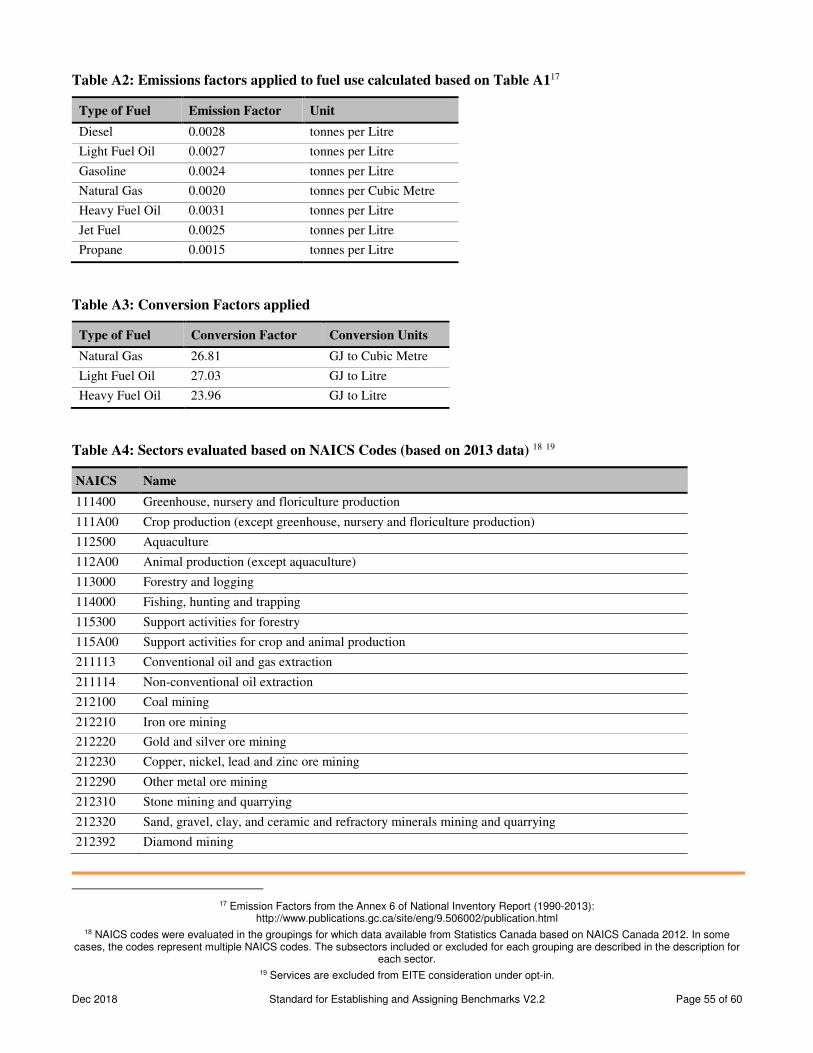
Dec 2018 Standard for Establishing and Assigning Benchmarks V2.2 Page 55 of 60
Table A2: Emissions factors applied to fuel use calculated based on Table A117
Type of Fuel Emission Factor Unit
Diesel 0.0028 tonnes per Litre
Light Fuel Oil 0.0027 tonnes per Litre
Gasoline 0.0024 tonnes per Litre
Natural Gas 0.0020 tonnes per Cubic Metre
Heavy Fuel Oil 0.0031 tonnes per Litre
Jet Fuel 0.0025 tonnes per Litre
Propane 0.0015 tonnes per Litre
Table A3: Conversion Factors applied
Type of Fuel Conversion Factor Conversion Units
Natural Gas 26.81 GJ to Cubic Metre
Light Fuel Oil 27.03 GJ to Litre
Heavy Fuel Oil 23.96 GJ to Litre
Table A4: Sectors evaluated based on NAICS Codes (based on 2013 data) 18 19
NAICS Name
111400 Greenhouse, nursery and floriculture production
111A00 Crop production (except greenhouse, nursery and floriculture production)
112500 Aquaculture
112A00 Animal production (except aquaculture)
113000 Forestry and logging
114000 Fishing, hunting and trapping
115300 Support activities for forestry
115A00 Support activities for crop and animal production
211113 Conventional oil and gas extraction
211114 Non-conventional oil extraction
212100 Coal mining
212210 Iron ore mining
212220 Gold and silver ore mining
212230 Copper, nickel, lead and zinc ore mining
212290 Other metal ore mining
212310 Stone mining and quarrying
212320 Sand, gravel, clay, and ceramic and refractory minerals mining and quarrying
212392 Diamond mining
17 Emission Factors from the Annex 6 of National Inventory Report (1990-2013):
http://www.publications.gc.ca/site/eng/9.506002/publication.html 18 NAICS codes were evaluated in the groupings for which data available from Statistics Canada based on NAICS Canada 2012. In some
cases, the codes represent multiple NAICS codes. The subsectors included or excluded for each grouping are described in the description for each sector.
19 Services are excluded from EITE consideration under opt-in.
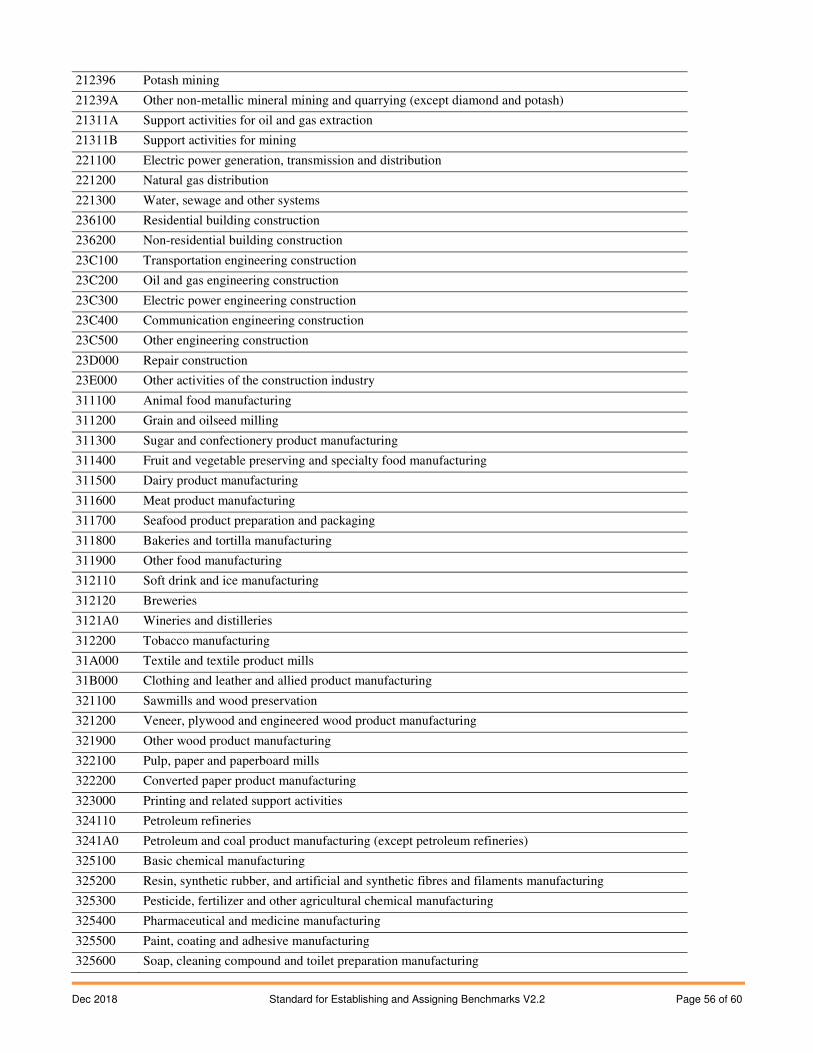
Dec 2018 Standard for Establishing and Assigning Benchmarks V2.2 Page 56 of 60
212396 Potash mining
21239A Other non-metallic mineral mining and quarrying (except diamond and potash)
21311A Support activities for oil and gas extraction
21311B Support activities for mining
221100 Electric power generation, transmission and distribution
221200 Natural gas distribution
221300 Water, sewage and other systems
236100 Residential building construction
236200 Non-residential building construction
23C100 Transportation engineering construction
23C200 Oil and gas engineering construction
23C300 Electric power engineering construction
23C400 Communication engineering construction
23C500 Other engineering construction
23D000 Repair construction
23E000 Other activities of the construction industry
311100 Animal food manufacturing
311200 Grain and oilseed milling
311300 Sugar and confectionery product manufacturing
311400 Fruit and vegetable preserving and specialty food manufacturing
311500 Dairy product manufacturing
311600 Meat product manufacturing
311700 Seafood product preparation and packaging
311800 Bakeries and tortilla manufacturing
311900 Other food manufacturing
312110 Soft drink and ice manufacturing
312120 Breweries
3121A0 Wineries and distilleries
312200 Tobacco manufacturing
31A000 Textile and textile product mills
31B000 Clothing and leather and allied product manufacturing
321100 Sawmills and wood preservation
321200 Veneer, plywood and engineered wood product manufacturing
321900 Other wood product manufacturing
322100 Pulp, paper and paperboard mills
322200 Converted paper product manufacturing
323000 Printing and related support activities
324110 Petroleum refineries
3241A0 Petroleum and coal product manufacturing (except petroleum refineries)
325100 Basic chemical manufacturing
325200 Resin, synthetic rubber, and artificial and synthetic fibres and filaments manufacturing
325300 Pesticide, fertilizer and other agricultural chemical manufacturing
325400 Pharmaceutical and medicine manufacturing
325500 Paint, coating and adhesive manufacturing
325600 Soap, cleaning compound and toilet preparation manufacturing
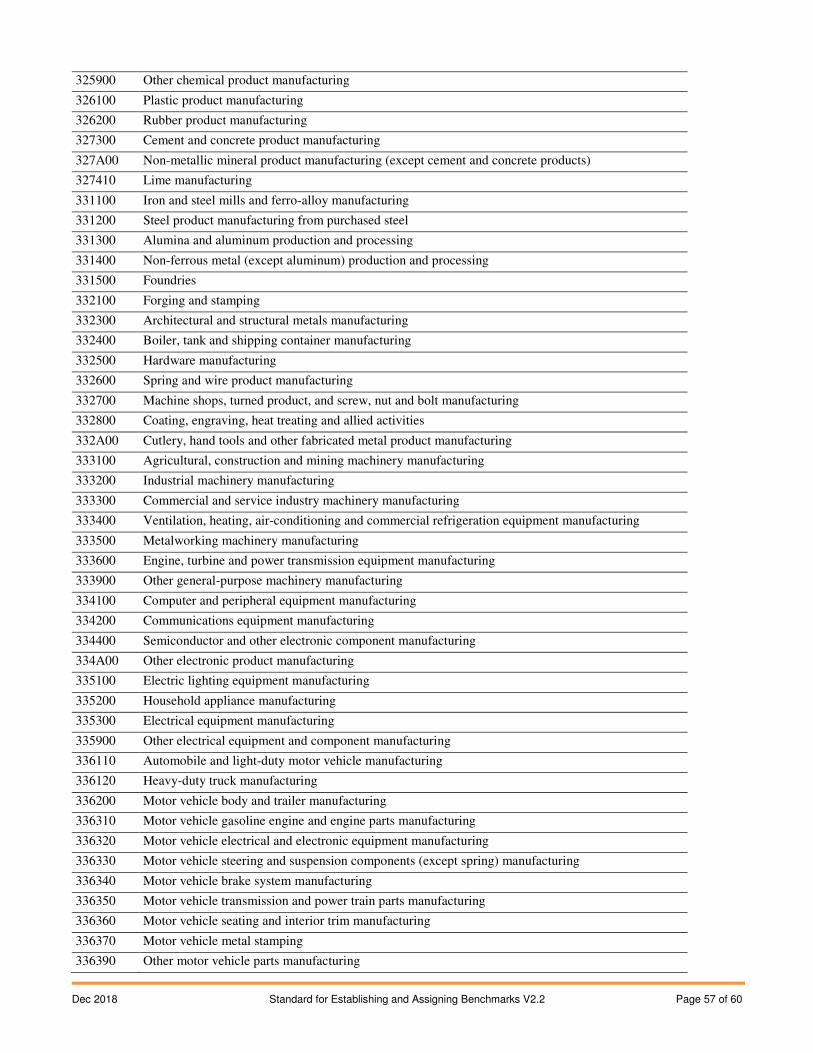
Dec 2018 Standard for Establishing and Assigning Benchmarks V2.2 Page 57 of 60
325900 Other chemical product manufacturing
326100 Plastic product manufacturing
326200 Rubber product manufacturing
327300 Cement and concrete product manufacturing
327A00 Non-metallic mineral product manufacturing (except cement and concrete products)
327410 Lime manufacturing
331100 Iron and steel mills and ferro-alloy manufacturing
331200 Steel product manufacturing from purchased steel
331300 Alumina and aluminum production and processing
331400 Non-ferrous metal (except aluminum) production and processing
331500 Foundries
332100 Forging and stamping
332300 Architectural and structural metals manufacturing
332400 Boiler, tank and shipping container manufacturing
332500 Hardware manufacturing
332600 Spring and wire product manufacturing
332700 Machine shops, turned product, and screw, nut and bolt manufacturing
332800 Coating, engraving, heat treating and allied activities
332A00 Cutlery, hand tools and other fabricated metal product manufacturing
333100 Agricultural, construction and mining machinery manufacturing
333200 Industrial machinery manufacturing
333300 Commercial and service industry machinery manufacturing
333400 Ventilation, heating, air-conditioning and commercial refrigeration equipment manufacturing
333500 Metalworking machinery manufacturing
333600 Engine, turbine and power transmission equipment manufacturing
333900 Other general-purpose machinery manufacturing
334100 Computer and peripheral equipment manufacturing
334200 Communications equipment manufacturing
334400 Semiconductor and other electronic component manufacturing
334A00 Other electronic product manufacturing
335100 Electric lighting equipment manufacturing
335200 Household appliance manufacturing
335300 Electrical equipment manufacturing
335900 Other electrical equipment and component manufacturing
336110 Automobile and light-duty motor vehicle manufacturing
336120 Heavy-duty truck manufacturing
336200 Motor vehicle body and trailer manufacturing
336310 Motor vehicle gasoline engine and engine parts manufacturing
336320 Motor vehicle electrical and electronic equipment manufacturing
336330 Motor vehicle steering and suspension components (except spring) manufacturing
336340 Motor vehicle brake system manufacturing
336350 Motor vehicle transmission and power train parts manufacturing
336360 Motor vehicle seating and interior trim manufacturing
336370 Motor vehicle metal stamping
336390 Other motor vehicle parts manufacturing
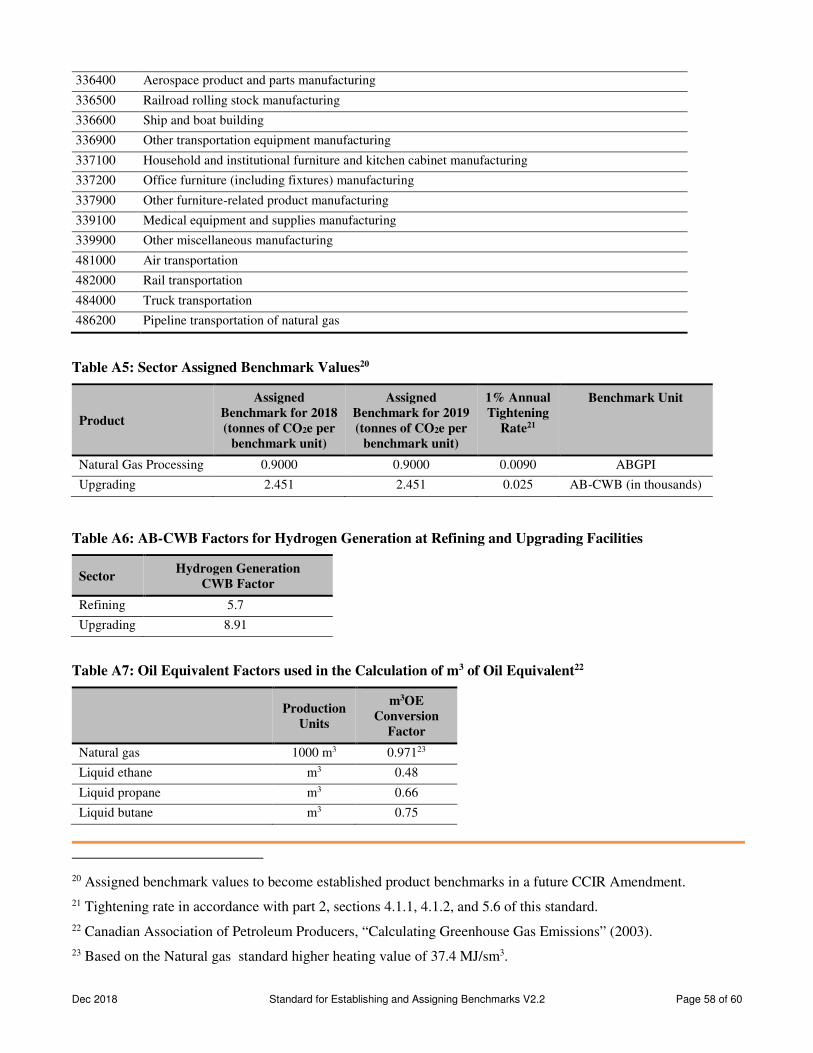
Dec 2018 Standard for Establishing and Assigning Benchmarks V2.2 Page 58 of 60
336400 Aerospace product and parts manufacturing
336500 Railroad rolling stock manufacturing
336600 Ship and boat building
336900 Other transportation equipment manufacturing
337100 Household and institutional furniture and kitchen cabinet manufacturing
337200 Office furniture (including fixtures) manufacturing
337900 Other furniture-related product manufacturing
339100 Medical equipment and supplies manufacturing
339900 Other miscellaneous manufacturing
481000 Air transportation
482000 Rail transportation
484000 Truck transportation
486200 Pipeline transportation of natural gas
Table A5: Sector Assigned Benchmark Values20
Product
Assigned Benchmark for 2018 (tonnes of CO2e per
benchmark unit)
Assigned Benchmark for 2019 (tonnes of CO2e per
benchmark unit)
1% Annual Tightening
Rate21
Benchmark Unit
Natural Gas Processing 0.9000 0.9000 0.0090 ABGPI
Upgrading 2.451 2.451 0.025 AB-CWB (in thousands)
Table A6: AB-CWB Factors for Hydrogen Generation at Refining and Upgrading Facilities
Sector Hydrogen Generation
CWB Factor
Refining 5.7
Upgrading 8.91
Table A7: Oil Equivalent Factors used in the Calculation of m3 of Oil Equivalent22
Production
Units
m3OE Conversion
Factor
Natural gas 1000 m3 0.97123
Liquid ethane m3 0.48
Liquid propane m3 0.66
Liquid butane m3 0.75
20 Assigned benchmark values to become established product benchmarks in a future CCIR Amendment.
21 Tightening rate in accordance with part 2, sections 4.1.1, 4.1.2, and 5.6 of this standard.
22 Canadian Association of Petroleum Producers, “Calculating Greenhouse Gas Emissions” (2003).
23 Based on the Natural gas standard higher heating value of 37.4 MJ/sm3.
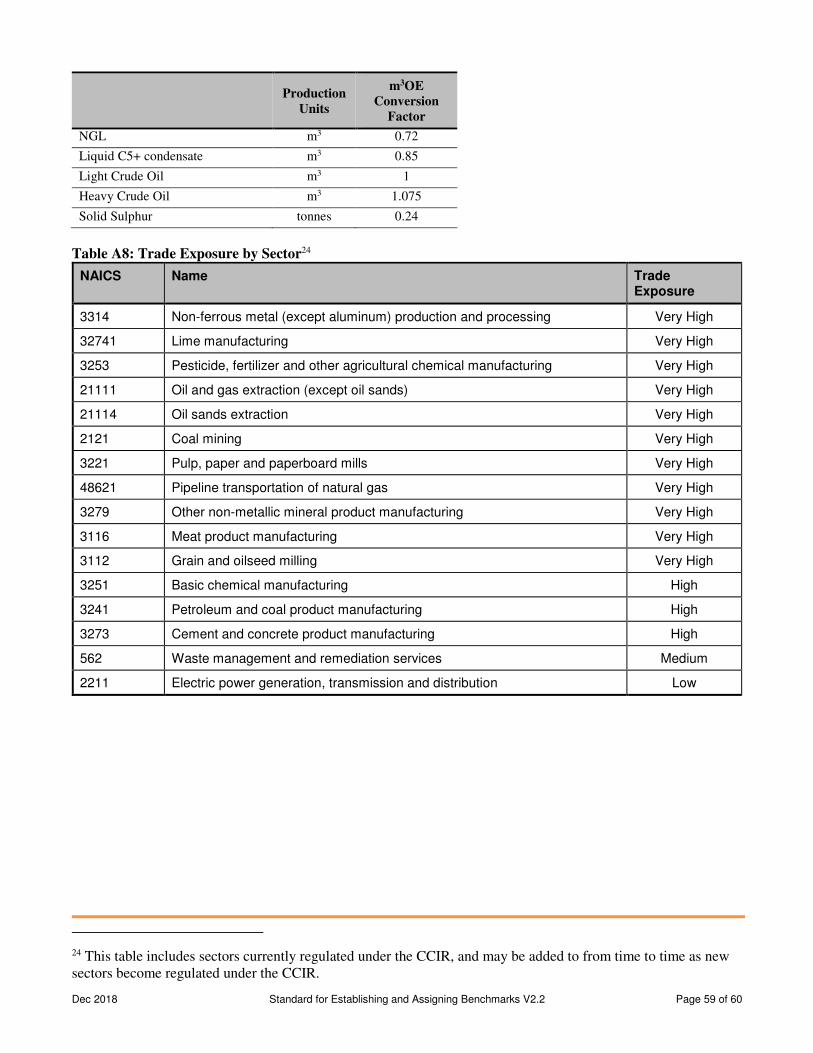
Dec 2018 Standard for Establishing and Assigning Benchmarks V2.2 Page 59 of 60
Production
Units
m3OE Conversion
Factor
NGL m3 0.72
Liquid C5+ condensate m3 0.85
Light Crude Oil m3 1
Heavy Crude Oil m3 1.075
Solid Sulphur tonnes 0.24
Table A8: Trade Exposure by Sector24
NAICS Name Trade Exposure
3314 Non-ferrous metal (except aluminum) production and processing Very High
32741 Lime manufacturing Very High
3253 Pesticide, fertilizer and other agricultural chemical manufacturing Very High
21111 Oil and gas extraction (except oil sands) Very High
21114 Oil sands extraction Very High
2121 Coal mining Very High
3221 Pulp, paper and paperboard mills Very High
48621 Pipeline transportation of natural gas Very High
3279 Other non-metallic mineral product manufacturing Very High
3116 Meat product manufacturing Very High
3112 Grain and oilseed milling Very High
3251 Basic chemical manufacturing High
3241 Petroleum and coal product manufacturing High
3273 Cement and concrete product manufacturing High
562 Waste management and remediation services Medium
2211 Electric power generation, transmission and distribution Low
24 This table includes sectors currently regulated under the CCIR, and may be added to from time to time as new sectors become regulated under the CCIR.
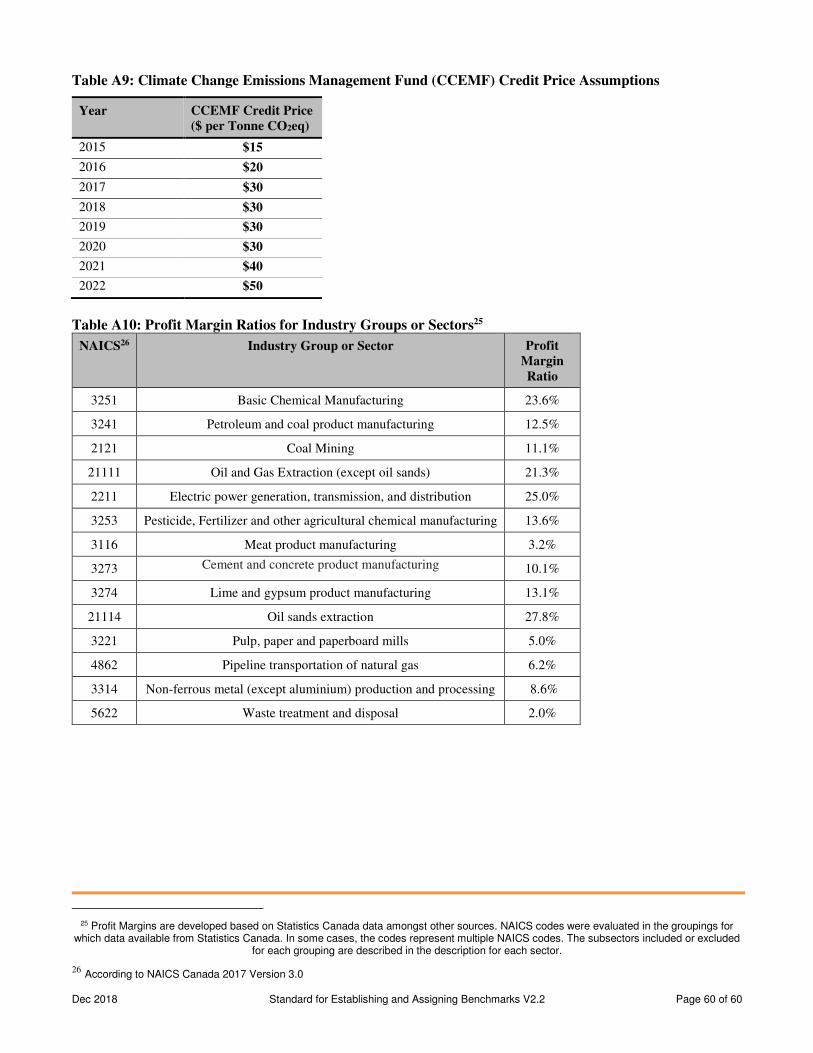
Dec 2018 Standard for Establishing and Assigning Benchmarks V2.2 Page 60 of 60
Table A9: Climate Change Emissions Management Fund (CCEMF) Credit Price Assumptions
Year CCEMF Credit Price ($ per Tonne CO2eq)
2015 $15
2016 $20
2017 $30
2018 $30
2019 $30
2020 $30
2021 $40
2022 $50
Table A10: Profit Margin Ratios for Industry Groups or Sectors25
NAICS26 Industry Group or Sector Profit Margin Ratio
3251 Basic Chemical Manufacturing 23.6%
3241 Petroleum and coal product manufacturing 12.5%
2121 Coal Mining 11.1%
21111 Oil and Gas Extraction (except oil sands) 21.3%
2211 Electric power generation, transmission, and distribution 25.0%
3253 Pesticide, Fertilizer and other agricultural chemical manufacturing 13.6%
3116 Meat product manufacturing 3.2%
3273 Cement and concrete product manufacturing 10.1%
3274 Lime and gypsum product manufacturing 13.1%
21114 Oil sands extraction 27.8%
3221 Pulp, paper and paperboard mills 5.0%
4862 Pipeline transportation of natural gas 6.2%
3314 Non-ferrous metal (except aluminium) production and processing 8.6%
5622 Waste treatment and disposal 2.0%
25 Profit Margins are developed based on Statistics Canada data amongst other sources. NAICS codes were evaluated in the groupings for
which data available from Statistics Canada. In some cases, the codes represent multiple NAICS codes. The subsectors included or excluded for each grouping are described in the description for each sector.
26 According to NAICS Canada 2017 Version 3.0