Embed Size (px)
Citation preview
STAKEHOLDERS’ ATTITUDES CONCERNING BLACK BEARS IN NORTH EAST TEXAS:
A COMPREHENSIVE MANAGEMENT IMPLICATION STUDY
Technical Report
Summer 2008
Texas Parks and Wildlife Department 4200 Smith School Road
Austin, TX 78744
By:
Adam Keul, M.S., Research Assistant; Pat Stephens Williams, Ph.D., Principal Investigator; Ray Darville, Ph.D.; Chris Comer, Ph.D.; Mike Legg, Ph.D.
Arthur Temple College of Forestry and Agriculture Stephen F. Austin State University,
Nacogdoches, Texas
TABLE OF CONTENTS
Background Information 3
Objectives of the Study 5
Survey Methods 6
Survey Design and Execution 6
Results 8
Return Rate 8
Demographics 9
Respondents Feelings and Knowledge about Bears 11
SRI Inferentials 12
Handwritten Comments 16
Potential Public Incident Influence 17
General Knowledge Base of Survey Respondents 18
General Wildlife Attitudes 18
Opinions towards Managing an Increasing Population of Black Bears 19
Opinion Regarding Future Reintroduction of Black Bear 21
Discussion of Demographic, Descriptive, and Inferential Data 21
Conclusions 23
Recommendations 25
Literature Cited 26
Initial Survey Instrument 27
Reminder Postcard 39
Cover Letter for Second Survey Mailing 40
2
BACKGROUND INFORMATION
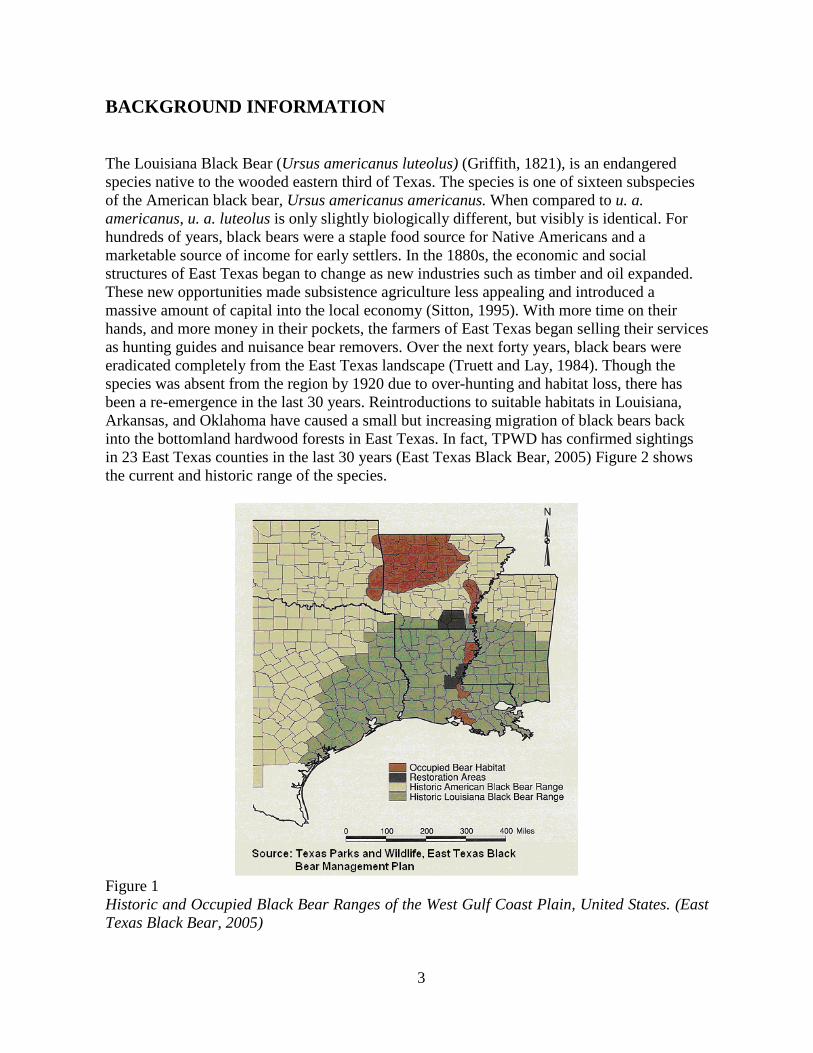
The Louisiana Black Bear (Ursus americanus luteolus) (Griffith, 1821), is an endangered species native to the wooded eastern third of Texas. The species is one of sixteen subspecies of the American black bear, Ursus americanus americanus. When compared to u. a. americanus, u. a. luteolus is only slightly biologically different, but visibly is identical. For hundreds of years, black bears were a staple food source for Native Americans and a marketable source of income for early settlers. In the 1880s, the economic and social structures of East Texas began to change as new industries such as timber and oil expanded. These new opportunities made subsistence agriculture less appealing and introduced a massive amount of capital into the local economy (Sitton, 1995). With more time on their hands, and more money in their pockets, the farmers of East Texas began selling their services as hunting guides and nuisance bear removers. Over the next forty years, black bears were eradicated completely from the East Texas landscape (Truett and Lay, 1984). Though the species was absent from the region by 1920 due to over-hunting and habitat loss, there has been a re-emergence in the last 30 years. Reintroductions to suitable habitats in Louisiana, Arkansas, and Oklahoma have caused a small but increasing migration of black bears back into the bottomland hardwood forests in East Texas. In fact, TPWD has confirmed sightings in 23 East Texas counties in the last 30 years (East Texas Black Bear, 2005) Figure 2 shows the current and historic range of the species.
Figure 1 Historic and Occupied Black Bear Ranges of the West Gulf Coast Plain, United States. (East Texas Black Bear, 2005)
3
The Texas Parks and Wildlife Department (TPWD) responded to this issue by implementing the East Texas Black Bear Conservation and Management Plan which outlined suitable habitats and probable management strategies over the next fifteen years (2005). The agency determined the environmental suitability for sustaining Ursus americanus luteolus in several areas of East Texas. The social impact of bear management, however, was only recently addressed by Morzillo, Liu and Mertig in Southeast Texas (2005). Morzillo et al. implemented a study encompassing twelve counties and included semi-urban areas of Lufkin, the outskirts of Beaumont, and suburban Houston. Her study investigated public attitudes towards bears, toward wildlife in general, and toward the possibility of maintaining Louisiana Black Bear populations in the region. Notably, she found that of the 1,006 people surveyed, more than half were proponents of re-establishing a viable bear population (Morzillo et al., 2005). Nathan Garner, the Texas Parks and Wildlife regional wildlife director for East Texas expressed (personal communication, February 1, 2005) that public opinion research needed to be extended to other regions suitable for Ursus americanus luteolus, particularly in Northeast Texas.
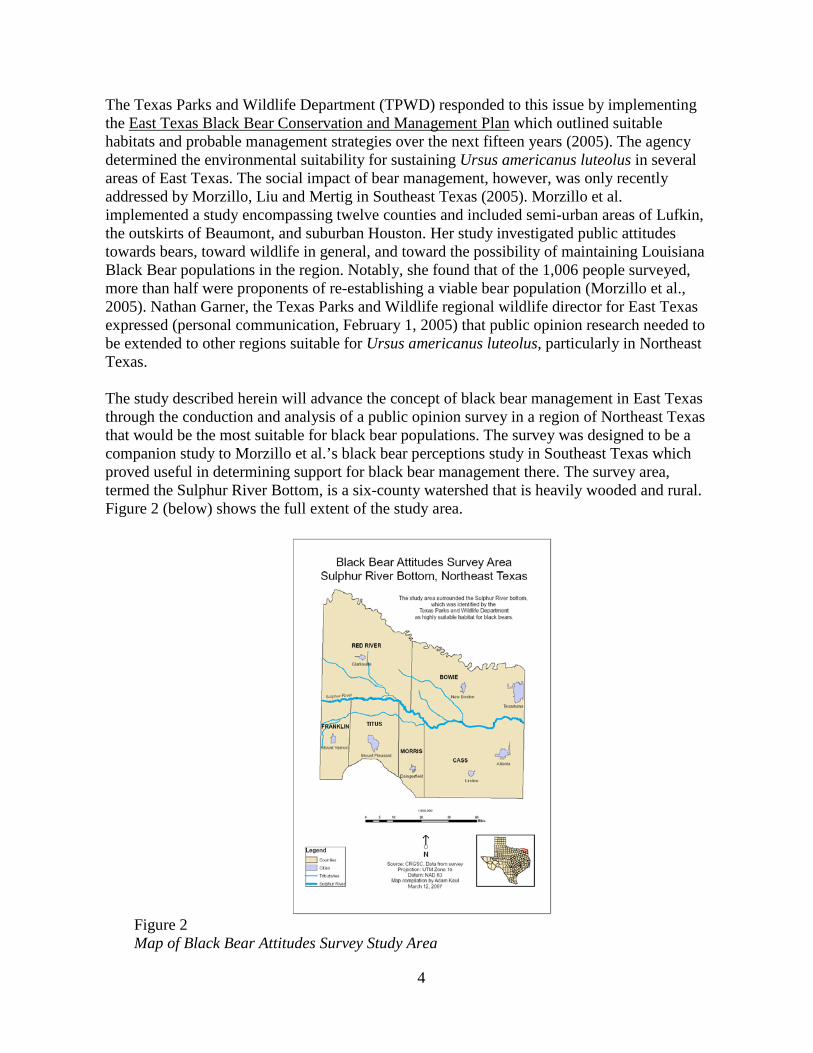
The study described herein will advance the concept of black bear management in East Texas through the conduction and analysis of a public opinion survey in a region of Northeast Texas that would be the most suitable for black bear populations. The survey was designed to be a companion study to Morzillo et al.’s black bear perceptions study in Southeast Texas which proved useful in determining support for black bear management there. The survey area, termed the Sulphur River Bottom, is a six-county watershed that is heavily wooded and rural. Figure 2 (below) shows the full extent of the study area.
Figure 2 Map of Black Bear Attitudes Survey Study Area
4
The counties Red River, Cass, Bowie, Titus, Morris, and Franklin, all border the Sulphur River and are predominately rural (containing only a few small towns) with the exception of the city of Texarkana in Bowie County. TPWD has designated the region biologically suitable habitat for black bear population with a 0.76 Habitat Suitability Index (HSI) (Garner and Willis, 1999). Since the residents of these counties are the most likely to be affected by any future bear management, a survey of their attitudes and opinions was critical in helping to determine the viability of black bear management. Therefore, the study investigated the public opinion of the residents of these six rural counties through a self-administered mail survey. A central goal of the research was to assess public knowledge, opinions, and attitudes relating to wildlife and in particular to black bears. Objectives of the Study
1. At the request of TPWD, use Morzillo’s survey questions as a base format (to provide opportunity to combine data sets) to structure a survey of stakeholders in the Red River, White Oak Creek, and Cypress Basin regions to determine their attitudes concerning black bears, wildlife, and management.
2. Assess the general knowledge base of survey respondents concerning black bears and their presence in East Texas. 3. Determine the level of support for black bears in the northern portion of East Texas. 4. Determine general wildlife attitudes of respondents. 5. Determine the respondents’ opinions towards management of the black bear population. 6. Provide the agency with information that can be used to further management decision-
making.
5
SURVEY METHODOLOGY The objectives of this study were to produce information to help the Texas Parks and Wildlife Department to better understand the Human Dimensions components of residents in the north East Texas region and specifically from those areas identified as potentially suitable habitat for black bear. In order to understand the public opinion concerning black bear management in north East Texas, a mailed survey containing broad questions to assess wildlife attitudes and opinions specifically about black bears was approved by TPWD and sent out to 2000 randomly selected households April 7, 2006. Funding through TPWD and Stephen F. Austin State University covered sample selection, survey production and mailing costs associated with the survey.
Survey Design and Execution Survey design was based on Dillman (2000). The study population consisted of the six counties of Red River, Cass, Bowie, Titus, Morris, and Franklin. The sample of each county was based on its proportion of the total six-county population. Since Bowie county comprised 50% of the total population of the six counties and the survey was designed for a rural population, its effect was minimized by sending only half as many as the county’s proportion of the total. The remaining surveys (75% of the total or, 1500) were divided up based on their proportion of the total population of the remaining five counties. The addresses were purchased from a survey company, Survey Sampling International (SSI). SSI collected addresses from public telephone records and used computerized randomization to eliminate bias from sampling. Upon receiving the addresses, the SFASU post office assisted in checking their accuracy. The survey instrument was based on Morzillo’s instrument in order to provide the future opportunity of combining data sets from Morzillo’s and this study. Minimal modification was implemented. Once the survey design was accepted, the surveys were sent to the SFASU internal print services department for printing. The survey was printed on 10 sheets of grey paper, folded and stapled into a booklet form with a cover letter on the front explaining the project. Outgoing envelopes and Business Reply Mail return envelopes also were printed. The envelopes were stuffed, organized, and mailed out on April 7, 2006.
An initial mailing was sent to all identified potential respondents. This mailing included a copy of the survey with an explanatory cover letter, applicable contact information, and a stamped return envelope for the respondent to return the completed survey. After three weeks a reminder postcard was sent to encourage participation in the survey. After two more weeks a replacement questionnaire (similar to the initial mailing) was sent to survey non-respondents. The results from the returned surveys were entered into a database as they were returned. A cut-off date of July 4, 2006 was set for returned surveys to be included for analysis in the study. The time cycle used for three mailings was mirrored from Morzillo et al.’s study (2005).
6

Once the results were entered into a database, the results were analyzed. The study used the statistical analysis programs SPSS 14.0 to calculate descriptive statistics such as simple means, medians and standard deviation and produce a general overview of public opinion (SPSS Inc.). Next, bivariate correlation, linear regression, and multiple regressions were run to examine relationships between variables and to predict the opinions of residents with similar characteristics.
7
RESULTS
Return Rate The 2,000 surveys were mailed on April 7, 2006. This was followed with a reminder postcard on the first of May. Most of the first round responses were returned by the middle of May, and those who responded were removed from the list of addresses. The third mailing consisted of another copy of the survey and return envelopes and was mailed to 1,750 persons on May 20, 2006. These responses were taken until July 4, 2006, when data entry began. The total number of returned surveys was 420, a 21% response rate (Table 1).
Table 1. Attitudes Survey Return Rates Mailing Number of Surveys Sent Number Returned First Mailing (4/7/06) Second Mailing (5/21/06)
2000 Surveys 1750 Surveys Total Returned Return Rate in Percent
200 220 420
21%
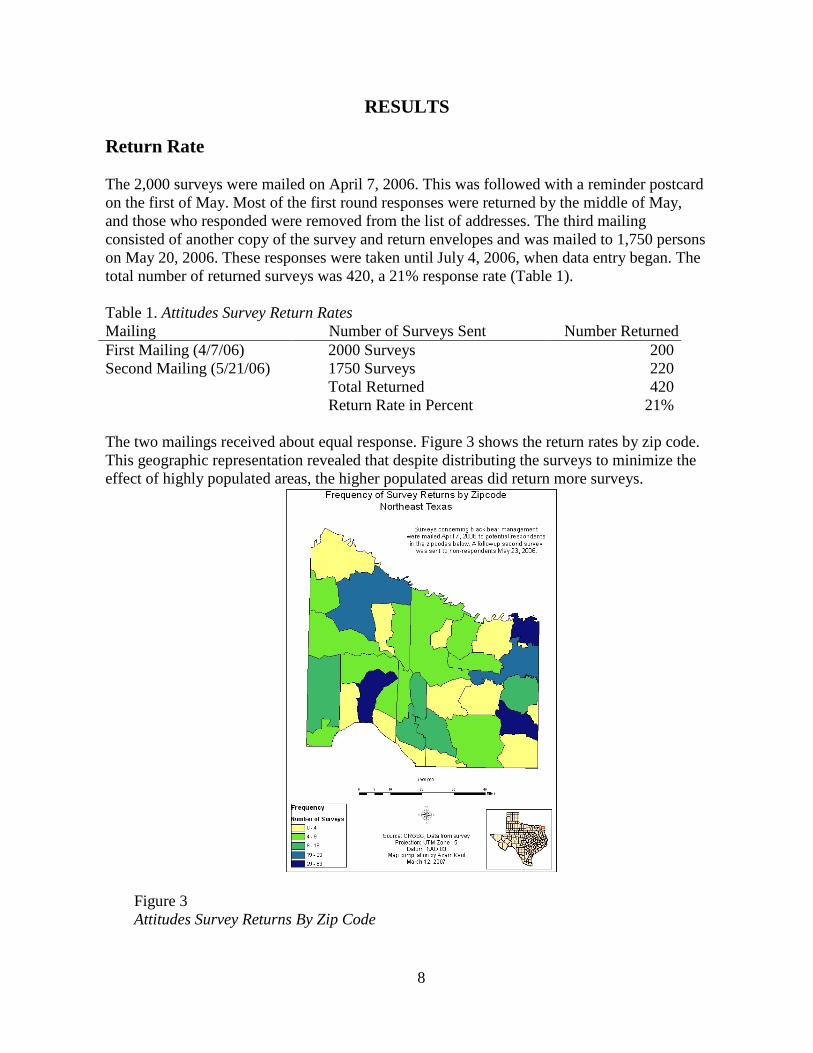
The two mailings received about equal response. Figure 3 shows the return rates by zip code. This geographic representation revealed that despite distributing the surveys to minimize the effect of highly populated areas, the higher populated areas did return more surveys.
Figure 3 Attitudes Survey Returns By Zip Code
8
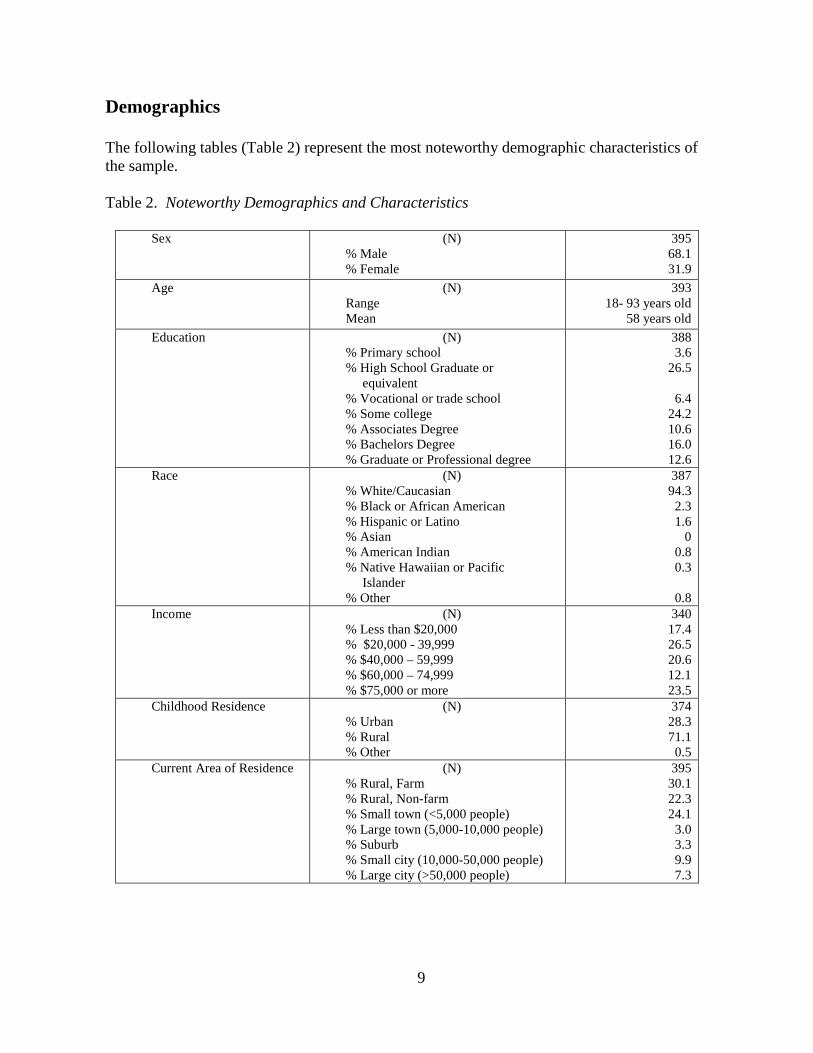
Demographics The following tables (Table 2) represent the most noteworthy demographic characteristics of the sample. Table 2. Noteworthy Demographics and Characteristics
Sex (N) % Male % Female
395 68.1 31.9
Age
(N) Range Mean
393 18- 93 years old
58 years old Education (N)
% Primary school % High School Graduate or equivalent % Vocational or trade school % Some college % Associates Degree % Bachelors Degree % Graduate or Professional degree
388 3.6
26.5
6.4 24.2 10.6 16.0 12.6
Race (N) % White/Caucasian % Black or African American % Hispanic or Latino % Asian % American Indian % Native Hawaiian or Pacific Islander % Other
387 94.3
2.3 1.6
0 0.8 0.3
0.8
Income (N) % Less than $20,000 % $20,000 - 39,999 % $40,000 – 59,999 % $60,000 – 74,999 % $75,000 or more
340 17.4 26.5 20.6 12.1 23.5
Childhood Residence (N) % Urban % Rural % Other
374 28.3 71.1
0.5 Current Area of Residence
(N) % Rural, Farm % Rural, Non-farm % Small town (<5,000 people) % Large town (5,000-10,000 people) % Suburb % Small city (10,000-50,000 people) % Large city (>50,000 people)
395 30.1 22.3 24.1
3.0 3.3 9.9 7.3
9
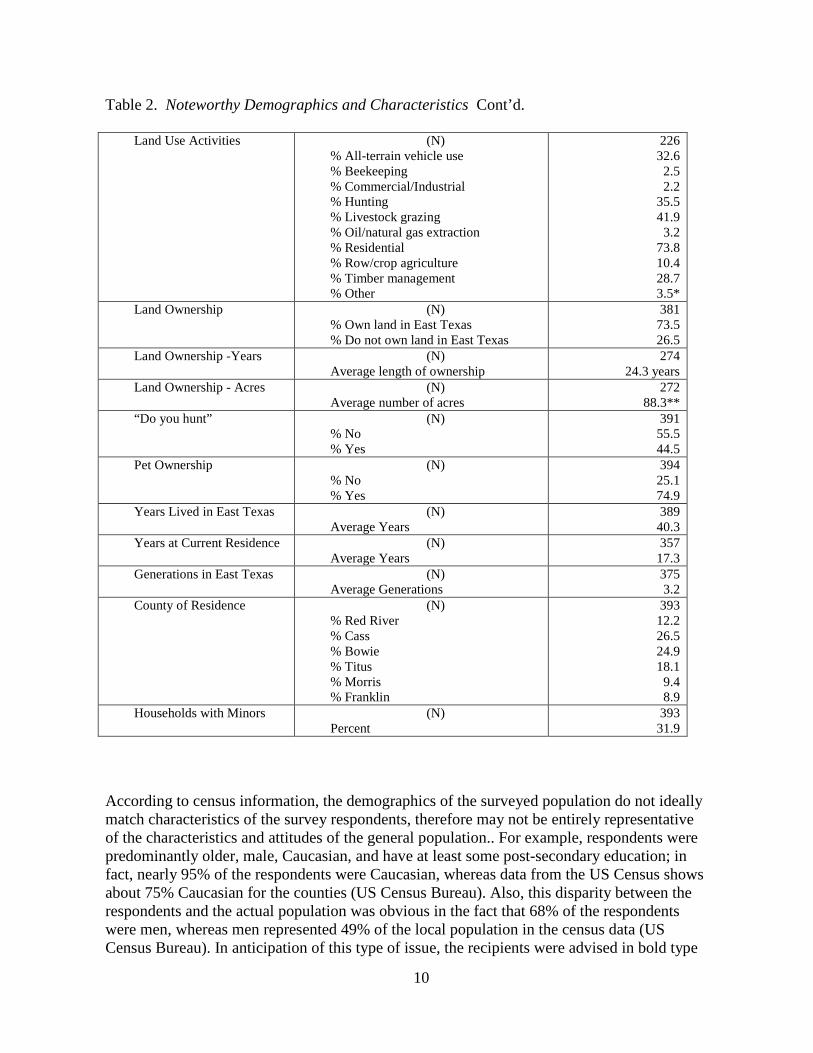
Table 2. Noteworthy Demographics and Characteristics Cont’d.
Land Use Activities (N) % All-terrain vehicle use % Beekeeping % Commercial/Industrial % Hunting % Livestock grazing % Oil/natural gas extraction % Residential % Row/crop agriculture % Timber management % Other
226 32.6
2.5 2.2
35.5 41.9
3.2 73.8 10.4 28.7 3.5*
Land Ownership (N) % Own land in East Texas % Do not own land in East Texas
381 73.5 26.5
Land Ownership -Years (N) Average length of ownership
274 24.3 years
Land Ownership - Acres (N) Average number of acres
272 88.3**
“Do you hunt” (N) % No % Yes
391 55.5 44.5
Pet Ownership (N) % No % Yes
394 25.1 74.9
Years Lived in East Texas (N) Average Years
389 40.3
Years at Current Residence (N) Average Years
357 17.3
Generations in East Texas (N) Average Generations
375 3.2
County of Residence (N) % Red River % Cass % Bowie % Titus % Morris % Franklin
393 12.2 26.5 24.9 18.1
9.4 8.9
Households with Minors (N) Percent
393 31.9
According to census information, the demographics of the surveyed population do not ideally match characteristics of the survey respondents, therefore may not be entirely representative of the characteristics and attitudes of the general population.. For example, respondents were predominantly older, male, Caucasian, and have at least some post-secondary education; in fact, nearly 95% of the respondents were Caucasian, whereas data from the US Census shows about 75% Caucasian for the counties (US Census Bureau). Also, this disparity between the respondents and the actual population was obvious in the fact that 68% of the respondents were men, whereas men represented 49% of the local population in the census data (US Census Bureau). In anticipation of this type of issue, the recipients were advised in bold type
10
on the survey’s cover letter that the only qualifications for the respondent were that he or she was over the age of 18 and a Northeast Texas resident. The survey was not intended only for the addressee. This line was overlooked however, since a number of the surveys were returned marked “deceased” or gave another address for the intended recipient. Further, a racial response rate disparity was noticed in the return. In a region that is approximately 20 % African American, only 2% of respondents were African American. The Hispanic population also was underrepresented. However, the US census reports only 5% of the actual population are Hispanic, and to maximize the return rate, it was deemed economically inefficient to produce a Spanish version of the survey which may have raised Hispanic return rates (US Census Bureau). The respondents tended to have a slightly higher annual income than the national average (US Census Bureau). As designed, the respondents were overwhelmingly rural. Only about 25% listed themselves as living in towns with more than 5,000, and about 25% were classified as “rural” either farm or non-farm. This statistic influenced the fact that nearly three quarters were landowners of more than one acre in East Texas, and most respondents had owned their land parcels for at least twenty years. The mean size of owned land parcels was around 88 acres. This however, was due to a few outlying respondents who owned more than 1,000 acres. Exactly 75% owned between 1 and 50 acres. The respondents can also be described as being long-term residents of their respective counties. The mean years lived in East Texas was more than 40, and the mean years lived in their current residences was more than 17. Many simply wrote-in “life” for years lived in East Texas, and this was computed by using their age. Also, most respondents indicated that their families had lived in the area for at least three generations. Some 44% of the respondents described themselves as hunters. About three-quarters were pet owners, and only about a third listed themselves as having children under the age of 18 in their households.
Respondents Feelings and Knowledge about Bears
Using the basic demographic breakdown of the respondents, several statistical tests were run in order to search for patterns that may help to further understand the opinions of the residents that were surveyed. Although an exhaustive search would certainly yield more data, the tests were founded on the idea that outlining variation of opinion within certain specific groups would provide insight into the highest quality of conclusions. Inferential statistics were used to search for variation in two areas: How the respondents felt about bears, and what the respondents knew about bears. Quantifying the respondents’ knowledge levels was fairly simple (see Objective 2). However, interpreting a numerical representation of how each respondent felt about black bears was more difficult. One approach to judge people’s opinions about a subject is to ask many similar questions about the subject, and search for a pattern in
11
their answers. This can be accomplished statistically using the Summated Rating Index (abbreviated SRI).
SRI Inferentials
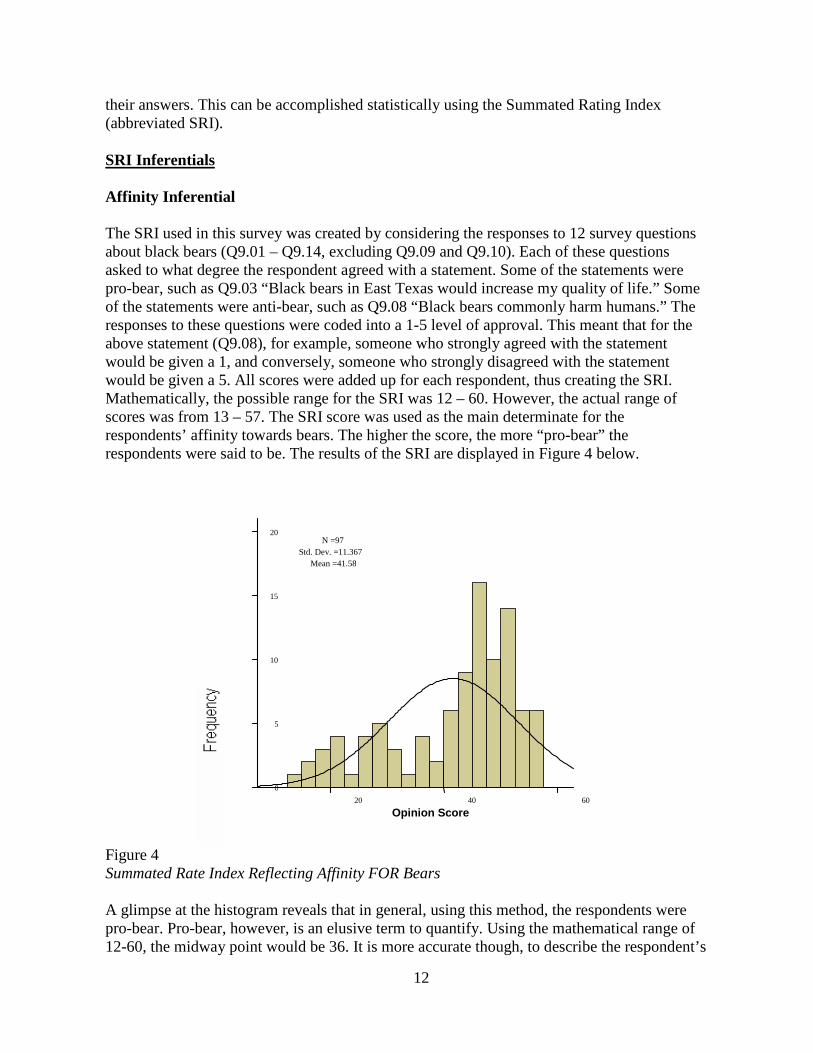
Affinity Inferential The SRI used in this survey was created by considering the responses to 12 survey questions about black bears (Q9.01 – Q9.14, excluding Q9.09 and Q9.10). Each of these questions asked to what degree the respondent agreed with a statement. Some of the statements were pro-bear, such as Q9.03 “Black bears in East Texas would increase my quality of life.” Some of the statements were anti-bear, such as Q9.08 “Black bears commonly harm humans.” The responses to these questions were coded into a 1-5 level of approval. This meant that for the above statement (Q9.08), for example, someone who strongly agreed with the statement would be given a 1, and conversely, someone who strongly disagreed with the statement would be given a 5. All scores were added up for each respondent, thus creating the SRI. Mathematically, the possible range for the SRI was 12 – 60. However, the actual range of scores was from 13 – 57. The SRI score was used as the main determinate for the respondents’ affinity towards bears. The higher the score, the more “pro-bear” the respondents were said to be. The results of the SRI are displayed in Figure 4 below.
Figure 4 Summated Rate Index Reflecting Affinity FOR Bears A glimpse at the histogram reveals that in general, using this method, the respondents were pro-bear. Pro-bear, however, is an elusive term to quantify. Using the mathematical range of 12-60, the midway point would be 36. It is more accurate though, to describe the respondent’s
60 40 20 Opinion Score
20
15
10
5
0
Mean =41.58 Std. Dev. =11.367
N =97
12
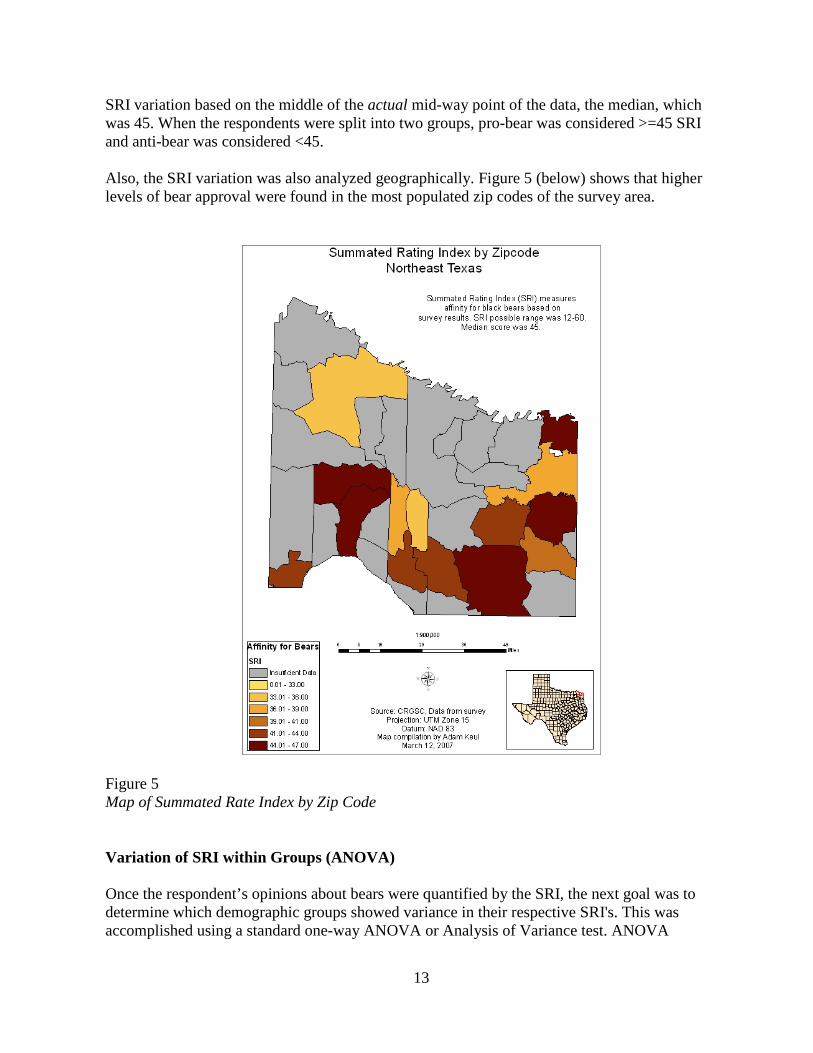
SRI variation based on the middle of the actual mid-way point of the data, the median, which was 45. When the respondents were split into two groups, pro-bear was considered >=45 SRI and anti-bear was considered <45. Also, the SRI variation was also analyzed geographically. Figure 5 (below) shows that higher levels of bear approval were found in the most populated zip codes of the survey area.
Figure 5 Map of Summated Rate Index by Zip Code
Variation of SRI within Groups (ANOVA)
Once the respondent’s opinions about bears were quantified by the SRI, the next goal was to determine which demographic groups showed variance in their respective SRI's. This was accomplished using a standard one-way ANOVA or Analysis of Variance test. ANOVA
13
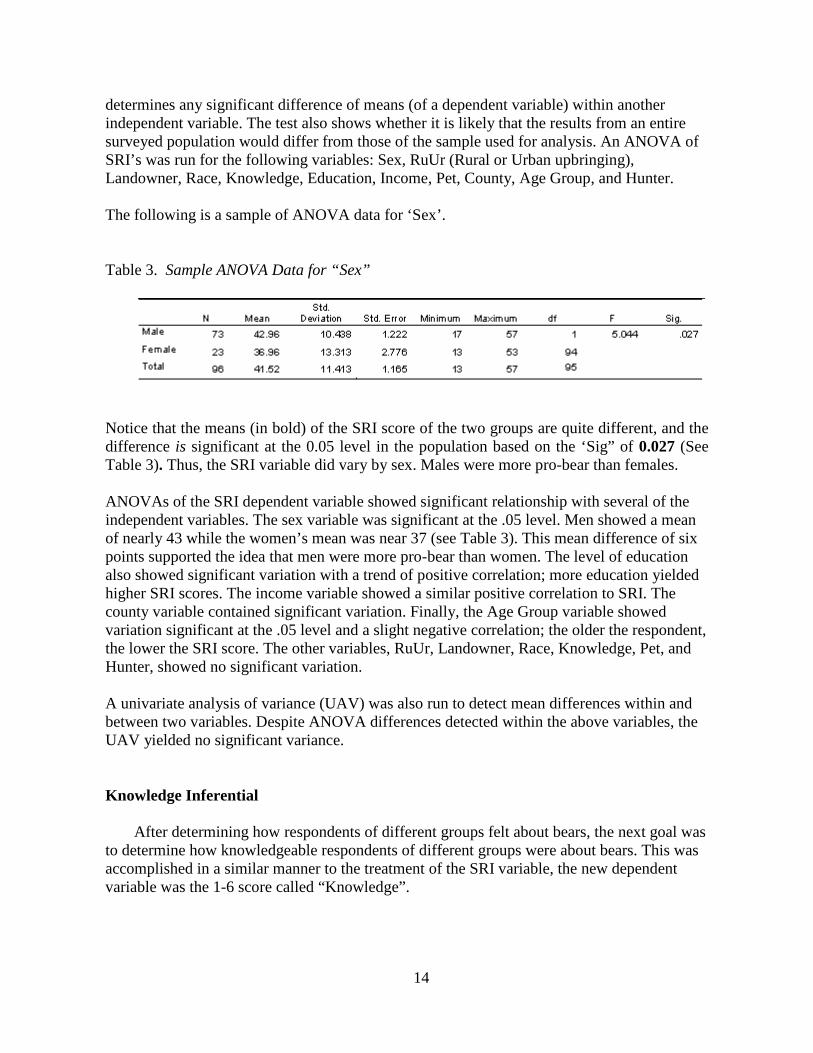
determines any significant difference of means (of a dependent variable) within another independent variable. The test also shows whether it is likely that the results from an entire surveyed population would differ from those of the sample used for analysis. An ANOVA of SRI’s was run for the following variables: Sex, RuUr (Rural or Urban upbringing), Landowner, Race, Knowledge, Education, Income, Pet, County, Age Group, and Hunter. The following is a sample of ANOVA data for ‘Sex’.
Table 3. Sample ANOVA Data for “Sex”
Notice that the means (in bold) of the SRI score of the two groups are quite different, and the difference is significant at the 0.05 level in the population based on the ‘Sig” of 0.027 (See Table 3). Thus, the SRI variable did vary by sex. Males were more pro-bear than females.
ANOVAs of the SRI dependent variable showed significant relationship with several of the independent variables. The sex variable was significant at the .05 level. Men showed a mean of nearly 43 while the women’s mean was near 37 (see Table 3). This mean difference of six points supported the idea that men were more pro-bear than women. The level of education also showed significant variation with a trend of positive correlation; more education yielded higher SRI scores. The income variable showed a similar positive correlation to SRI. The county variable contained significant variation. Finally, the Age Group variable showed variation significant at the .05 level and a slight negative correlation; the older the respondent, the lower the SRI score. The other variables, RuUr, Landowner, Race, Knowledge, Pet, and Hunter, showed no significant variation.
A univariate analysis of variance (UAV) was also run to detect mean differences within and between two variables. Despite ANOVA differences detected within the above variables, the UAV yielded no significant variance. Knowledge Inferential
After determining how respondents of different groups felt about bears, the next goal was
to determine how knowledgeable respondents of different groups were about bears. This was accomplished in a similar manner to the treatment of the SRI variable, the new dependent variable was the 1-6 score called “Knowledge”.
14
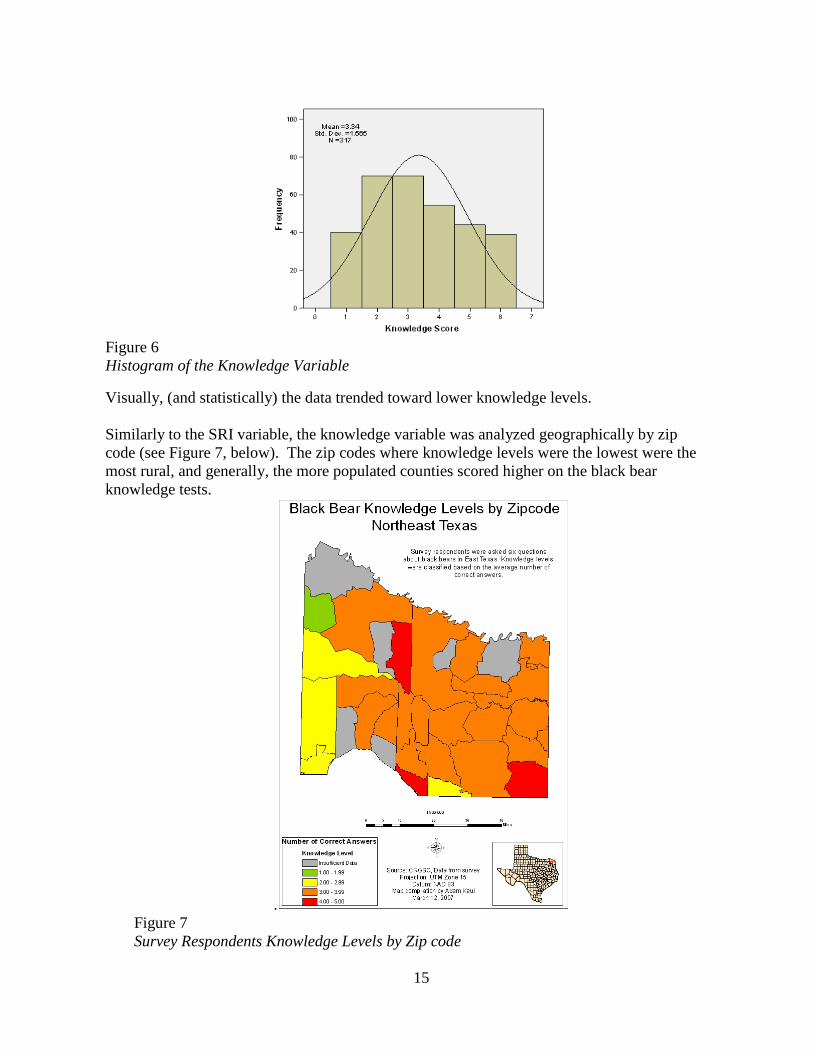
Figure 6 Histogram of the Knowledge Variable
Visually, (and statistically) the data trended toward lower knowledge levels.
Similarly to the SRI variable, the knowledge variable was analyzed geographically by zip code (see Figure 7, below). The zip codes where knowledge levels were the lowest were the most rural, and generally, the more populated counties scored higher on the black bear knowledge tests.
. Figure 7 Survey Respondents Knowledge Levels by Zip code
15
Variation of SRI within Groups (ANOVA) ANOVA was run on several variables to determine any significant relationships of ‘knowledge’ within those variables. The following variables were analyzed: Sex, RuUr, Race, Education, County, Age Group, and Hunter. Of these seven, only Hunter (whether the respondent was a hunter or not) showed a significant relationship of knowledge levels. If the respondent was a hunter, he or she tended to score higher on the knowledge test.
Despite finding little variation within the variables, searching for intra-variation of ‘knowledge’ means was necessary. The UAV test also was run on the variables, but no combination showed any significant variation.
Handwritten Comments
Open-ended questions revealed the following information.
After being asked if they belonged to any wildlife-related organizations, respondents were asked to write-in the organization’s name. The majority of these organizations were hunting related. Ducks Unlimited was the most common answer, but also common were, BASS, National Wild Turkey Federation, national, and local hunting clubs. General conservation groups were also listed. These included: The Audubon Society; The Wilderness Society; and The Sierra Club, respectively. The National Rifle Association was often listed, although this is not considered to be a wildlife-related organization. Those respondents who had seen a bear in the wild were asked to provide when and where they had this experience. The list of states and national parks included nearly every area that bears are known to inhabit. Most importantly though, there were 12 respondents who claimed to have seen a black bear in East Texas at some point. This speaks to the number of unverifiable or unreliable sightings that are not counted in the reports of TPWD.
Questions 10 and 11 polled the respondents concerning perceived beliefs about black bears. Question 10 asked if the respondent believed in general that bears were a danger to humans (yes or no). Below the question was a blank where they were asked to provide reasons for their answer. Statistically, about 60 percent responded that that they did not believe bears to be a danger. The handwritten comments upheld this statistic, as more of the comments spoke of the bears’ fear of humans, or their non-predatory nature. An example of a common response was: “They do not bother people unless they feel threatened.” There were dissenters, however, most feared bear attacks, such as: “Just seeing a bear in my presence could cause heart failure.”
Similarly, question 11 asked if the respondents believed that bears were a nuisance. The statistics again showed that about 60% did not believe that they were a nuisance. The most common responses indicated a fear that bears would get into trash or destroy their gardens. One respondent had a greater fear: “They will eat somebody's dog, cat, or possibly my calves
16
or grandchildren.” Fears such as these, although more than likely unrealistic, reveal that the bear is still perceived by many as a killer. Questions 12a and 13a were intended to make a distinction between respondents wanting the bear population to increase naturally or if they thought a natural resource agency should assist in increasing the population. About two-thirds of the respondents answered that bear populations should increase naturally (12) and that they should not be helped by a natural resource agency (13). The most popular hand-written response on both questions was overwhelmingly “Let nature take its course.” This was reflected by the statistical data analysis as well.
The February 2006 issue of the Texas Parks and Wildlife magazine featured a cover story entitled “Back in Black- Black bears returning to East Texas” (Patoski, 2006). Question 38 asked whether respondents had read the article, if it had changed the way they thought about black bears (38a) and why (38b). Few people had read the article, and even fewer took the time to write-in a response, but those who did felt either informed, or like they already knew most of what Patoski had to say. The final question on the survey stated: Please use this space for any additional comments. The full range is reflected in the select few included below.
“I enjoyed this survey please feel free to send another anytime” “Bring on the black bear” “I don’t like surveys” “I don’t want them next to me, but I do want to know where they are at” “We need all the attractions for East Texas to draw more tourists to help build our economy.” “As you can see I know nothing about black bears” “Who is promoting this? I have seen the news of other areas having problems of bears migrating to populated areas because of lack of food + increased bear population. So what is your GUARANTEE? Please send me a copy. Please sign and date it.”
Potential Public Incident Influence On April 13, 2006, in East Tennessee, a black bear killed a young girl and mauled her mother and brother in a USDA Forest Service recreation area. This event made national headlines and was a serious blow to the perceived image of the black bear as a benign creature. Unfortunately, this attack occurred only a few days after the initial surveys were mailed for this project. The effect of this event on the results of the survey was presupposed and the surveys that were postmarked before the attack made news were separated from all those who could have heard about the attack. Despite the attack, opinions were not statistically affected. A basic ANOVA of the SRI bear approval rating showed that no significant difference existed between the mean scores of those who could have heard about the attack, and those who could not have. However, the event did yield some interesting responses from the surveyed public. Along with several written comments about the incident, we received articles about the attack cut from three local newspapers.
17
General Knowledge Base of Survey Respondents
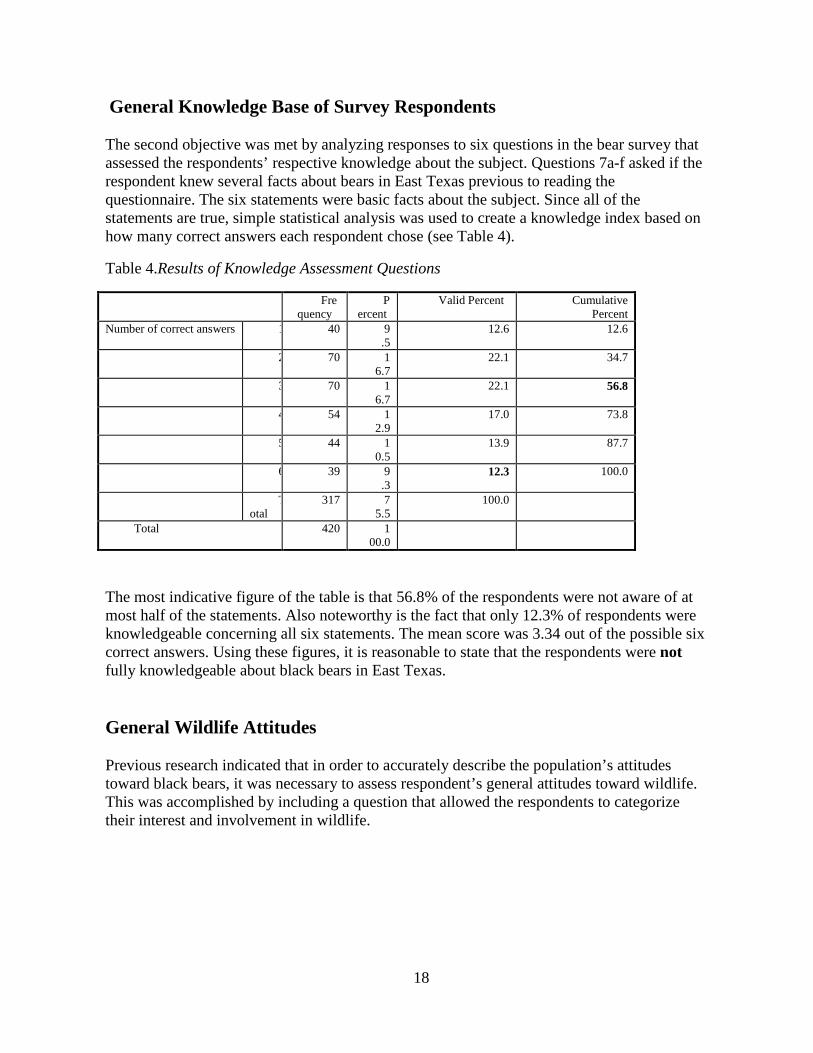
The second objective was met by analyzing responses to six questions in the bear survey that assessed the respondents’ respective knowledge about the subject. Questions 7a-f asked if the respondent knew several facts about bears in East Texas previous to reading the questionnaire. The six statements were basic facts about the subject. Since all of the statements are true, simple statistical analysis was used to create a knowledge index based on how many correct answers each respondent chose (see Table 4).
Table 4.Results of Knowledge Assessment Questions
Fre
quency P
ercent Valid Percent Cumulative
Percent Number of correct answers 1 40 9
.5 12.6 12.6
2 70 16.7
22.1 34.7
3 70 16.7
22.1 56.8
4 54 12.9
17.0 73.8
5 44 10.5
13.9 87.7
6 39 9.3
12.3 100.0
Total
317 75.5
100.0
Total 420 100.0
The most indicative figure of the table is that 56.8% of the respondents were not aware of at most half of the statements. Also noteworthy is the fact that only 12.3% of respondents were knowledgeable concerning all six statements. The mean score was 3.34 out of the possible six correct answers. Using these figures, it is reasonable to state that the respondents were not fully knowledgeable about black bears in East Texas. General Wildlife Attitudes Previous research indicated that in order to accurately describe the population’s attitudes toward black bears, it was necessary to assess respondent’s general attitudes toward wildlife. This was accomplished by including a question that allowed the respondents to categorize their interest and involvement in wildlife.
18
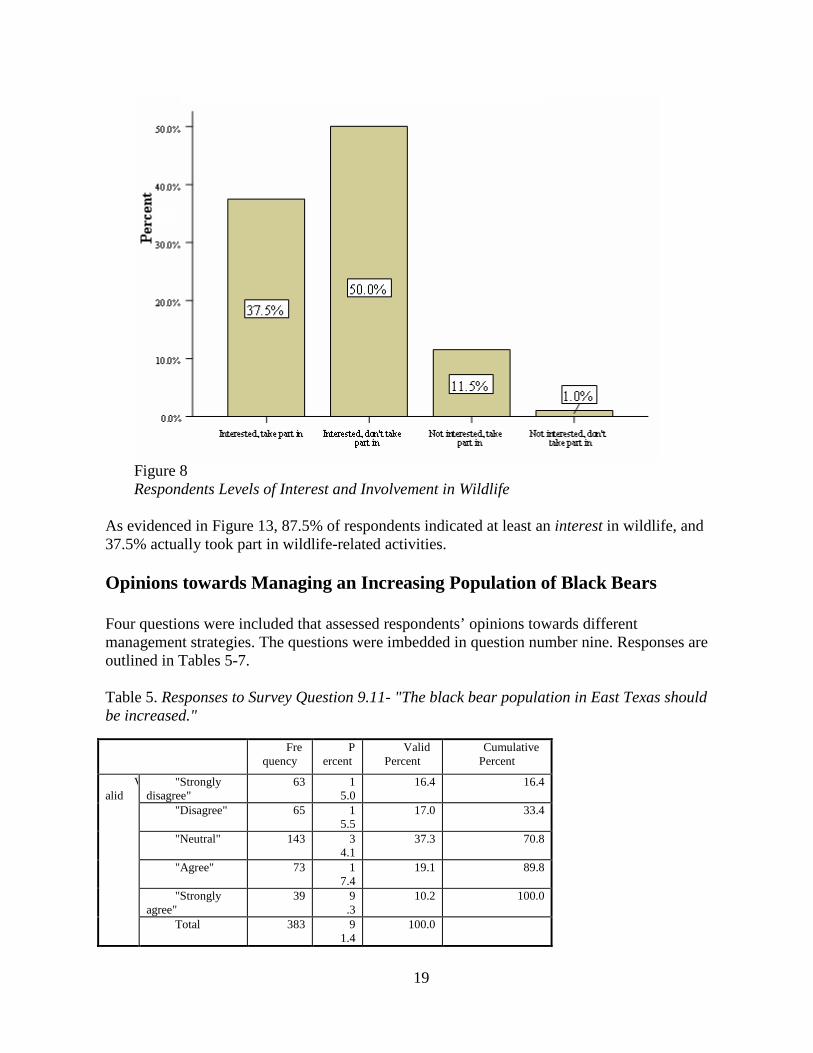
Figure 8 Respondents Levels of Interest and Involvement in Wildlife
As evidenced in Figure 13, 87.5% of respondents indicated at least an interest in wildlife, and 37.5% actually took part in wildlife-related activities.
Opinions towards Managing an Increasing Population of Black Bears Four questions were included that assessed respondents’ opinions towards different management strategies. The questions were imbedded in question number nine. Responses are outlined in Tables 5-7. Table 5. Responses to Survey Question 9.11- "The black bear population in East Texas should be increased."
Fre
quency P
ercent Valid
Percent Cumulative
Percent
Valid
"Strongly disagree"
63 15.0
16.4 16.4
"Disagree" 65 15.5
17.0 33.4
"Neutral" 143 34.1
37.3 70.8
"Agree" 73 17.4
19.1 89.8
"Strongly agree"
39 9.3
10.2 100.0
Total 383 91.4
100.0
19
Total 419 100.0
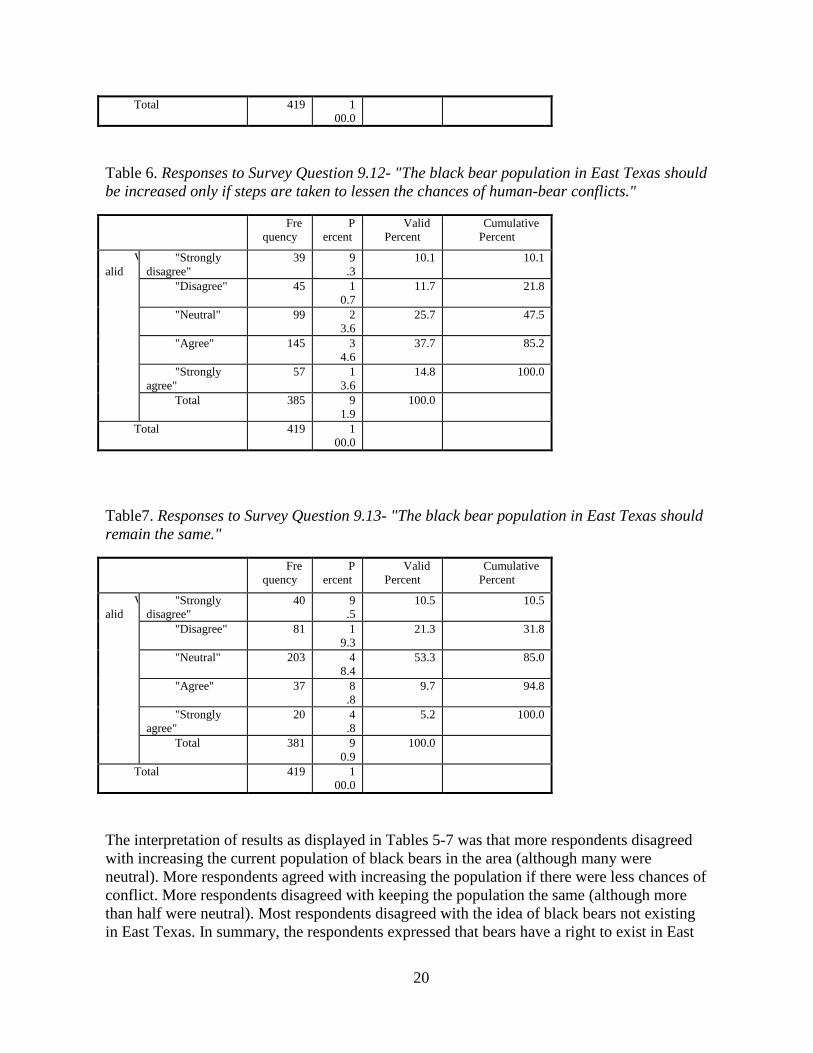
Table 6. Responses to Survey Question 9.12- "The black bear population in East Texas should be increased only if steps are taken to lessen the chances of human-bear conflicts."
Fre
quency P
ercent Valid
Percent Cumulative
Percent
Valid
"Strongly disagree"
39 9.3
10.1 10.1
"Disagree" 45 10.7
11.7 21.8
"Neutral" 99 23.6
25.7 47.5
"Agree" 145 34.6
37.7 85.2
"Strongly agree"
57 13.6
14.8 100.0
Total 385 91.9
100.0
Total 419 100.0
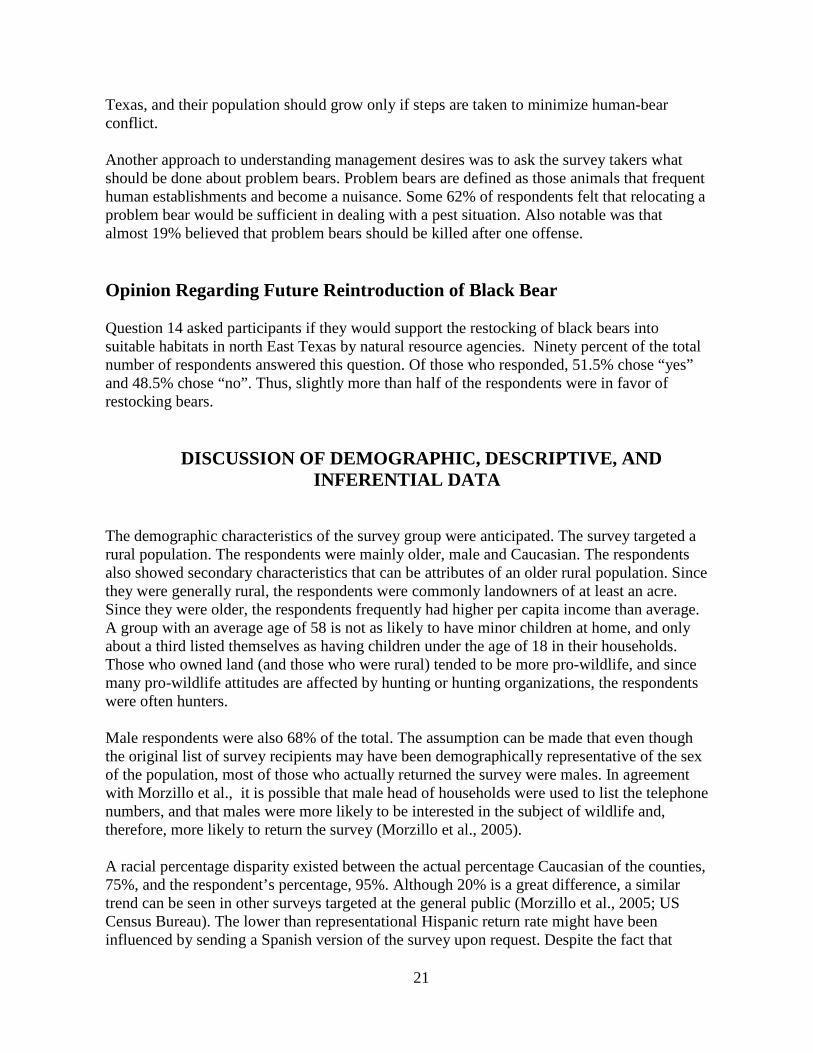
Table7. Responses to Survey Question 9.13- "The black bear population in East Texas should remain the same."
Fre
quency P
ercent Valid
Percent Cumulative
Percent
Valid
"Strongly disagree"
40 9.5
10.5 10.5
"Disagree" 81 19.3
21.3 31.8
"Neutral" 203 48.4
53.3 85.0
"Agree" 37 8.8
9.7 94.8
"Strongly agree"
20 4.8
5.2 100.0
Total 381 90.9
100.0
Total 419 100.0
The interpretation of results as displayed in Tables 5-7 was that more respondents disagreed with increasing the current population of black bears in the area (although many were neutral). More respondents agreed with increasing the population if there were less chances of conflict. More respondents disagreed with keeping the population the same (although more than half were neutral). Most respondents disagreed with the idea of black bears not existing in East Texas. In summary, the respondents expressed that bears have a right to exist in East
20
Texas, and their population should grow only if steps are taken to minimize human-bear conflict. Another approach to understanding management desires was to ask the survey takers what should be done about problem bears. Problem bears are defined as those animals that frequent human establishments and become a nuisance. Some 62% of respondents felt that relocating a problem bear would be sufficient in dealing with a pest situation. Also notable was that almost 19% believed that problem bears should be killed after one offense.
Opinion Regarding Future Reintroduction of Black Bear Question 14 asked participants if they would support the restocking of black bears into suitable habitats in north East Texas by natural resource agencies. Ninety percent of the total number of respondents answered this question. Of those who responded, 51.5% chose “yes” and 48.5% chose “no”. Thus, slightly more than half of the respondents were in favor of restocking bears.
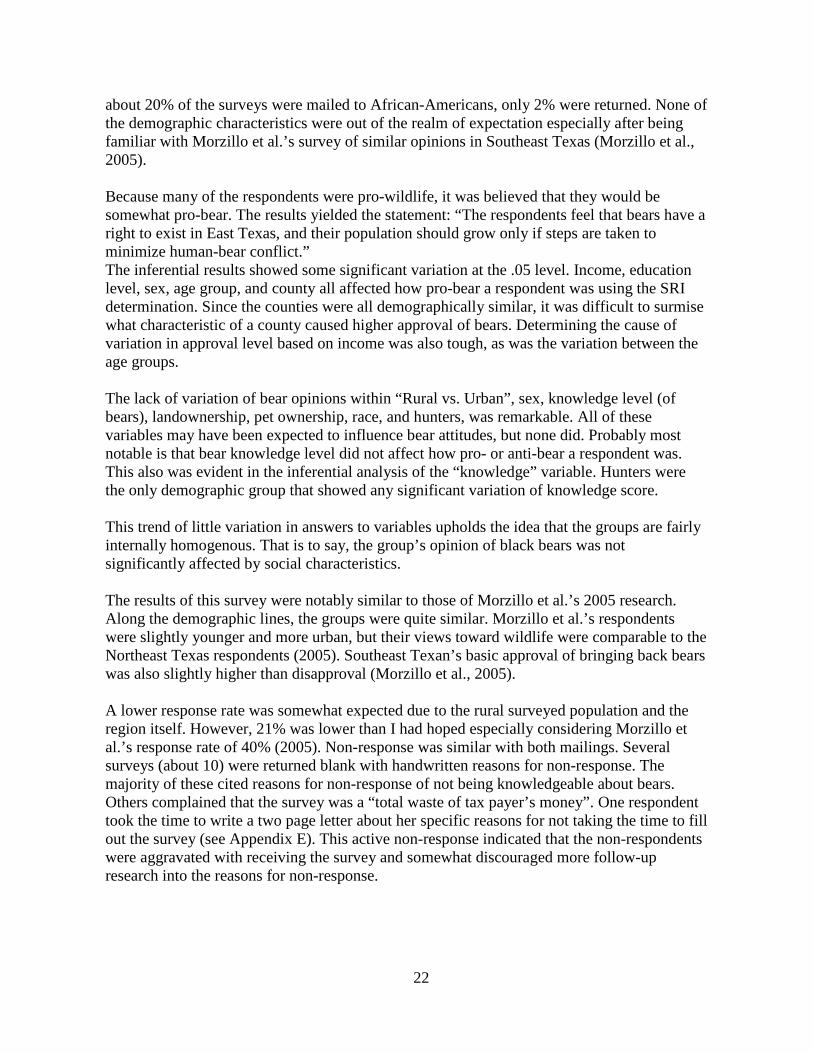
DISCUSSION OF DEMOGRAPHIC, DESCRIPTIVE, AND INFERENTIAL DATA
The demographic characteristics of the survey group were anticipated. The survey targeted a rural population. The respondents were mainly older, male and Caucasian. The respondents also showed secondary characteristics that can be attributes of an older rural population. Since they were generally rural, the respondents were commonly landowners of at least an acre. Since they were older, the respondents frequently had higher per capita income than average. A group with an average age of 58 is not as likely to have minor children at home, and only about a third listed themselves as having children under the age of 18 in their households. Those who owned land (and those who were rural) tended to be more pro-wildlife, and since many pro-wildlife attitudes are affected by hunting or hunting organizations, the respondents were often hunters.
Male respondents were also 68% of the total. The assumption can be made that even though the original list of survey recipients may have been demographically representative of the sex of the population, most of those who actually returned the survey were males. In agreement with Morzillo et al., it is possible that male head of households were used to list the telephone numbers, and that males were more likely to be interested in the subject of wildlife and, therefore, more likely to return the survey (Morzillo et al., 2005). A racial percentage disparity existed between the actual percentage Caucasian of the counties, 75%, and the respondent’s percentage, 95%. Although 20% is a great difference, a similar trend can be seen in other surveys targeted at the general public (Morzillo et al., 2005; US Census Bureau). The lower than representational Hispanic return rate might have been influenced by sending a Spanish version of the survey upon request. Despite the fact that
21
about 20% of the surveys were mailed to African-Americans, only 2% were returned. None of the demographic characteristics were out of the realm of expectation especially after being familiar with Morzillo et al.’s survey of similar opinions in Southeast Texas (Morzillo et al., 2005).
Because many of the respondents were pro-wildlife, it was believed that they would be somewhat pro-bear. The results yielded the statement: “The respondents feel that bears have a right to exist in East Texas, and their population should grow only if steps are taken to minimize human-bear conflict.” The inferential results showed some significant variation at the .05 level. Income, education level, sex, age group, and county all affected how pro-bear a respondent was using the SRI determination. Since the counties were all demographically similar, it was difficult to surmise what characteristic of a county caused higher approval of bears. Determining the cause of variation in approval level based on income was also tough, as was the variation between the age groups. The lack of variation of bear opinions within “Rural vs. Urban”, sex, knowledge level (of bears), landownership, pet ownership, race, and hunters, was remarkable. All of these variables may have been expected to influence bear attitudes, but none did. Probably most notable is that bear knowledge level did not affect how pro- or anti-bear a respondent was. This also was evident in the inferential analysis of the “knowledge” variable. Hunters were the only demographic group that showed any significant variation of knowledge score. This trend of little variation in answers to variables upholds the idea that the groups are fairly internally homogenous. That is to say, the group’s opinion of black bears was not significantly affected by social characteristics.
The results of this survey were notably similar to those of Morzillo et al.’s 2005 research. Along the demographic lines, the groups were quite similar. Morzillo et al.’s respondents were slightly younger and more urban, but their views toward wildlife were comparable to the Northeast Texas respondents (2005). Southeast Texan’s basic approval of bringing back bears was also slightly higher than disapproval (Morzillo et al., 2005). A lower response rate was somewhat expected due to the rural surveyed population and the region itself. However, 21% was lower than I had hoped especially considering Morzillo et al.’s response rate of 40% (2005). Non-response was similar with both mailings. Several surveys (about 10) were returned blank with handwritten reasons for non-response. The majority of these cited reasons for non-response of not being knowledgeable about bears. Others complained that the survey was a “total waste of tax payer’s money”. One respondent took the time to write a two page letter about her specific reasons for not taking the time to fill out the survey (see Appendix E). This active non-response indicated that the non-respondents were aggravated with receiving the survey and somewhat discouraged more follow-up research into the reasons for non-response.
22
CONCLUSIONS
The survey data collected and analyzed produced a number of conclusions. To begin with, the similarities between opinions of those in Northeast and Southeast Texas might indicate that the two geographic regions are only marginally unique from each other (at least socially). The reason the two groups were separated by TPWD was their geographic proximity to the best remaining black bear habitats: the Neches river basin in the south, and the Sulphur river basin in the north. Using GIS to analyze the spatial characteristics of the data revealed several spatial trends. The fact that returns were clustered around highly populated areas despite the fact that all areas were polled equally indicated that at least in this study, the most rural residents were less likely to return the survey. In addition, the more populated areas were also more likely to be knowledgeable about bears, and more likely to be pro-bear. The data showed significant statistical variation of opinions among the six counties. This variation was not explained by available data. Bowie County (containing Texarkana) was the most urban and populous of the six, but was weighted less to focus more on the more rural areas. The other five counties were demographically quite similar, and determination of the source of variation would involve a survey of greater depth and with more respondents. For now, the variation is unexplained.
Another difficult question that arose from the survey data was why income positively and age negatively affected bear opinions. Higher income can be tied to higher education levels, which was expected to positively affect the SRI bear approval rating. Education was identified as a positive effect on opinions, and therefore is a probable explanation of the variation within income levels. Since income was tied to age, and income showed a positive effect, one would expect age to show a positive effect, but it did not. Although they are demographically related, these two variables did not show similar variation when it came to opinions concerning black bears. Age showed a negative effect probably due to the fact that a person’s fear of bears is affected by their ability to defend themselves in the rare instance of attack. A person in their 40s would likely have a better chance of avoiding attack than someone in their 80s. It is probable that higher income provides more time and dispensable money to spend on wildlife related activities. Just over half of the respondents were considered “pro-wildlife”. Perhaps having more time and money gives the stakeholders more opportunity to focus on wildlife activities and organizations, activities that positively influence opinions about bears.
Taken as a whole, the social characteristics of the respondents did not significantly affect their bear opinions. It was inferred to mean that the way people feel about wildlife, or at least black bears, was made up at an early age before social conditions such as income and education begin to shape their adult outlook on life. This supports the idea that the most significant connections with nature and wildlife are made during the formative years (Kahn Jr. & Kellert, 2002).
23
Considering the data from this survey, unless the managing agency can influence opinions towards black bears in East Texas, it is, in a way, the will of the people to not interfere with their natural re-migration to the area. Bears that are here naturally, without manual relocation, will be not be perceived as outsiders. Sometimes in this situation, the species can be seen as the arm of the government, and lashed out against (Parker, 2005). It is necessary to let the public know that they are coming, but not necessary to bring them back by restocking. The respondents see benefit of having bears, but seem to indicate that the natural balance of nature will allow for whatever bears an area can handle, ecologically and socially.
24
RECOMMENDATIONS
Upon total analysis of the data, several recommendations can be made with respect to the future of the black bear in Northeast Texas. The survey data reveals that although the people of the region are generally in favor of having black bears, they do not believe that proactive steps should be taken to bring them to the area. Since the bear will and has naturally re-migrated to the area, efforts should be focused on education and awareness, especially to children and those who spend a significant amount of time outdoors either as an occupation or hobby. It is likely that education and awareness about the myths and realities of living with bears will ease the inevitable transition of Northeast Texas into “bear country.”
The research can be extended or intensified in a variety of directions. First, it may be necessary to fill the gaps in the data along the lines of underrepresented groups. Women, minorities and younger adults were statistically underrepresented, and could be polled using a similar targeted survey or methodology. Also, it would be pertinent to compare the results from this survey to other wildlife surveys in East Texas, or from other parts of Texas. An urban survey of bear-opinions might show a rift between the two socio-geographic realms. In addition, using similar surveys of Northeast and Southeast Texas for reference could help define these regions, or even determine if they are significantly different. To further investigate the impact of opinions on this project, more public meetings, or small discussion panels could meet in those regions affected to elicit detailed information. It seems that a gathering of minds and speaking one-on-one with the stakeholders could give researchers a better representation of local opinions. Moreover, determining the cause of the low response rate would also be a worthwhile endeavor. At this point, it is not known whether non-response was a showing of disapproval for black bears, or a lack of interest in returning unsolicited mail. Although the handwritten comments (including letters) seemed to indicate disdain towards surveys and non-response based on lack of knowledge, a more scientific study of non-response is necessary. To determine this, a random selection of non-respondents should be polled for their reasons for non-response. In addition, it is recommended that future research studies be conducted to look at stakeholders in the adjacent states who have a history of existing bear populations to determine the perceptions concerning living with bears, desired information and education needs, and where they obtain their information, in order to prepare Texans for living with bears; to interview those stakeholders in Texas that have reported bear sightings to determine the differences in attitudes from those who have not had bear encounters; and to do in-depth I and E in those areas identified by this study as “hot” spots of potential fear and non-acceptance.
25
LITERATURE CITED
Black Bear Conservation Committee (BBCC). 2005. Black Bear Management Handbook for Louisiana, Mississippi, Southern Arkansas, and East Texas. Black Bear Conservation Committee, Baton Rouge, Louisiana.
Dillman, D. A.. 2000. Mail and internet Surveys: the tailored design method. 2nd Ed., John
Wiley & Sons, Inc.. New York. Garner, N. P. and S. E. Willis. 1998. Suitability of habitats in East Texas for black bears.
Texas Parks and Wildlife Department, Austin, Texas. 15 pp. Kahn Jr., P., & Kellert, P. H. (2002). Children and Nature. Cambridge, MA:
MIT Press.
Morzillo, A. T., L. J. Jianguo, and A. G. Mertig. 2005. Attitudes about and opinions toward black bears in east Texas. Technical Report, Department of Fisheries and Wildlife,
Michigan State Univerisity, East Lansing, Michigan. 69 pp. Parker, S. W. (2005). Attitudes of Stakeholders Towards Elk in Arkansas.
Unpublished master’s thesis, University of Arkansas, Monticello
Sitton, T. (1995). Backwoodsmen: Stockmen and Hunters Along a Big Thicket River Valley. Norman, OK: University of Oklahoma.
SPSS for Windows. Rel. 14.0.1.366, Chicago: SPSS Inc. Texas Parks and Wildlife Department (TPWD). 2005. East Texas Black Bear Conservation
and Management Plan. 2005–2015. United States Fish and Wildlife Service (USFWS). 1995. Louisiana Black Bear Recovery
Plan. Jackson, Mississippi. 52 pp.
26
INITIAL SURVEY – FORMAT NOT EXACT REPLICATION
Arthur Temple College of Forestry P.O. Box 6109, SFA Station • Nacogdoches, Texas 75962-6109 • (936)468-3301 •
FAX (936) 468-2489
April 1, 2006 Dear Northeast Texas Resident, We need your help!
You have been chosen from the residents of your county to help in a public opinion
survey concerning wildlife management. Your opinion is very important and will be used to make decisions concerning the future of wildlife in your area.
Attached to this letter is a survey that deals with opinions and issues related to black bears in Northeast Texas. The questionnaire should only take 10-15 minutes to complete, and there are no right or wrong answers. The study is part of a master’s research project sponsored by the Texas Parks and Wildlife Department and Stephen F. Austin State University. The results will help guide TPWD in managing wildlife in Northeast Texas.
Please have someone in your household who is 18 years of age or older and a Northeast Texas resident fill out this questionnaire. Return the survey as soon a possible in the postage paid envelope provided. You can be assured of complete confidentiality in your answers. If you have any questions you may contact me, Adam Keul, Graduate Research Assistant, at [email protected], or Dr. Pat Stephens Williams - Principal Investigator, or Dr. Chris Comer at (936) 468-3301 in the Arthur Temple School of Forestry, Stephen F. Austin State University, Nacogdoches, Texas.
Thank you for participating in this study,
Sincerely,
Adam Keul Graduate Research Assistant
27
STAKEHOLDERS’ ATTITUDES TOWARD BLACK BEAR IN
NORTHEAST TEXAS
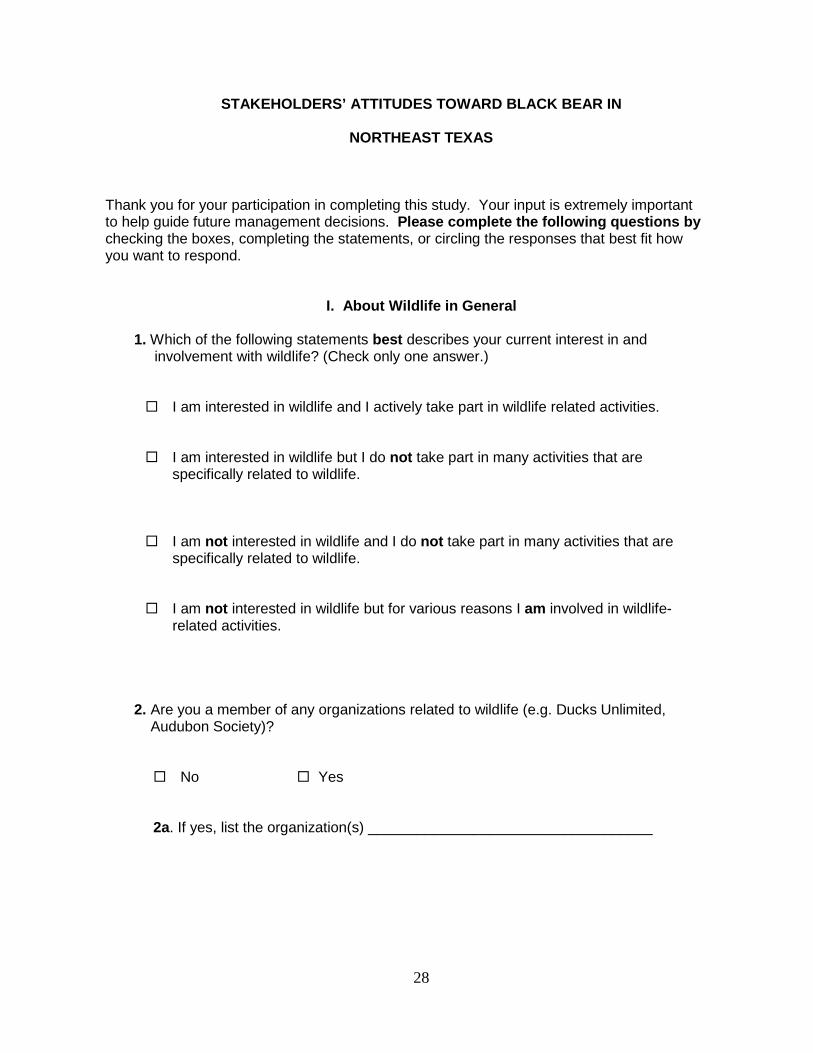
Thank you for your participation in completing this study. Your input is extremely important to help guide future management decisions. Please complete the following questions by checking the boxes, completing the statements, or circling the responses that best fit how you want to respond.
I. About Wildlife in General
1. Which of the following statements best describes your current interest in and involvement with wildlife? (Check only one answer.)
I am interested in wildlife and I actively take part in wildlife related activities.
I am interested in wildlife but I do not take part in many activities that are specifically related to wildlife.
I am not interested in wildlife and I do not take part in many activities that are specifically related to wildlife.
I am not interested in wildlife but for various reasons I am involved in wildlife-related activities.
2. Are you a member of any organizations related to wildlife (e.g. Ducks Unlimited, Audubon Society)?
No Yes
2a. If yes, list the organization(s) ___________________________________
28
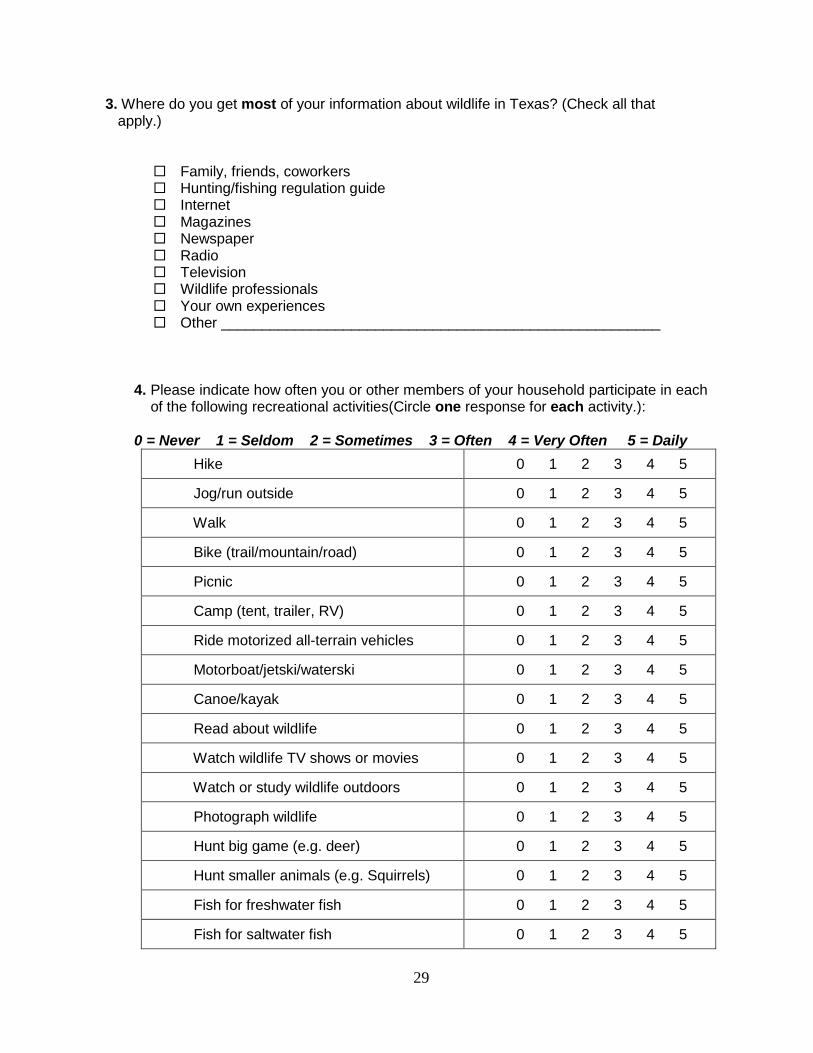
3. Where do you get most of your information about wildlife in Texas? (Check all that apply.)
Family, friends, coworkers Hunting/fishing regulation guide Internet Magazines Newspaper Radio Television Wildlife professionals Your own experiences Other ______________________________________________________
4. Please indicate how often you or other members of your household participate in each of the following recreational activities(Circle one response for each activity.): 0 = Never 1 = Seldom 2 = Sometimes 3 = Often 4 = Very Often 5 = Daily
Hike 0 1 2 3 4 5
Jog/run outside 0 1 2 3 4 5
Walk 0 1 2 3 4 5
Bike (trail/mountain/road) 0 1 2 3 4 5
Picnic 0 1 2 3 4 5
Camp (tent, trailer, RV) 0 1 2 3 4 5
Ride motorized all-terrain vehicles 0 1 2 3 4 5
Motorboat/jetski/waterski 0 1 2 3 4 5
Canoe/kayak 0 1 2 3 4 5
Read about wildlife 0 1 2 3 4 5
Watch wildlife TV shows or movies 0 1 2 3 4 5
Watch or study wildlife outdoors 0 1 2 3 4 5
Photograph wildlife 0 1 2 3 4 5
Hunt big game (e.g. deer) 0 1 2 3 4 5
Hunt smaller animals (e.g. Squirrels) 0 1 2 3 4 5
Fish for freshwater fish 0 1 2 3 4 5
Fish for saltwater fish 0 1 2 3 4 5
29
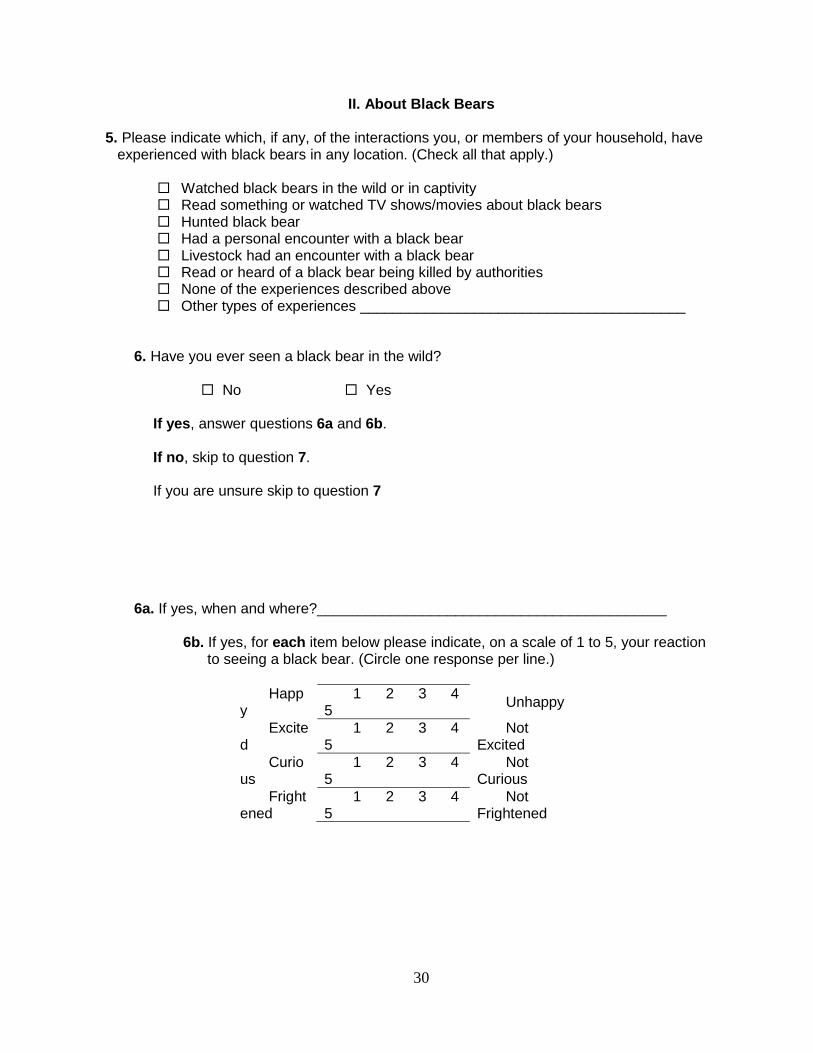
II. About Black Bears 5. Please indicate which, if any, of the interactions you, or members of your household, have
experienced with black bears in any location. (Check all that apply.) Watched black bears in the wild or in captivity Read something or watched TV shows/movies about black bears Hunted black bear Had a personal encounter with a black bear Livestock had an encounter with a black bear Read or heard of a black bear being killed by authorities None of the experiences described above Other types of experiences ________________________________________
6. Have you ever seen a black bear in the wild?
No Yes
If yes, answer questions 6a and 6b. If no, skip to question 7. If you are unsure skip to question 7 6a. If yes, when and where?___________________________________________ 6b. If yes, for each item below please indicate, on a scale of 1 to 5, your reaction to seeing a black bear. (Circle one response per line.)
Happy
1 2 3 4 5 Unhappy
Excited
1 2 3 4 5
Not Excited
Curious
1 2 3 4 5
Not Curious
Frightened
1 2 3 4 5
Not Frightened
30
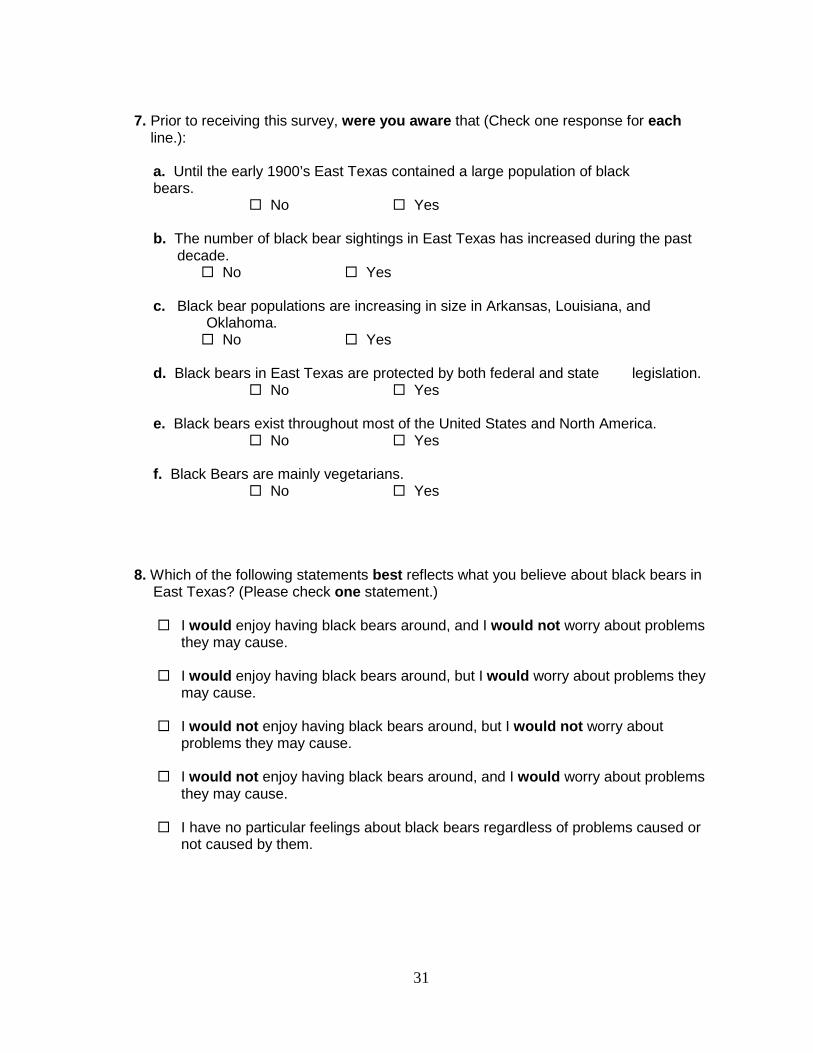
7. Prior to receiving this survey, were you aware that (Check one response for each line.): a. Until the early 1900’s East Texas contained a large population of black
bears. No Yes
b. The number of black bear sightings in East Texas has increased during the past decade. No Yes
c. Black bear populations are increasing in size in Arkansas, Louisiana, and Oklahoma.
No Yes
d. Black bears in East Texas are protected by both federal and state legislation. No Yes e. Black bears exist throughout most of the United States and North America. No Yes f. Black Bears are mainly vegetarians. No Yes 8. Which of the following statements best reflects what you believe about black bears in
East Texas? (Please check one statement.) I would enjoy having black bears around, and I would not worry about problems
they may cause. I would enjoy having black bears around, but I would worry about problems they
may cause.
I would not enjoy having black bears around, but I would not worry about problems they may cause.
I would not enjoy having black bears around, and I would worry about problems they may cause.
I have no particular feelings about black bears regardless of problems caused or not caused by them.
31
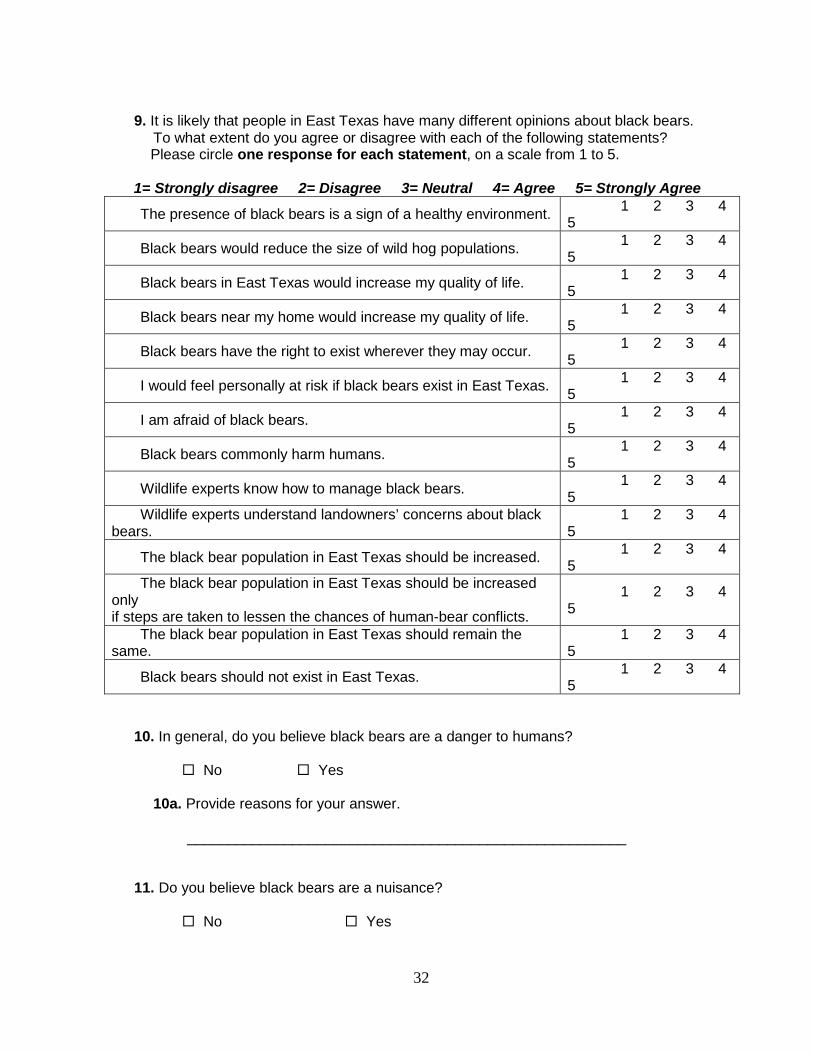
9. It is likely that people in East Texas have many different opinions about black bears.
To what extent do you agree or disagree with each of the following statements? Please circle one response for each statement, on a scale from 1 to 5.
1= Strongly disagree 2= Disagree 3= Neutral 4= Agree 5= Strongly Agree
The presence of black bears is a sign of a healthy environment. 1 2 3 4 5
Black bears would reduce the size of wild hog populations. 1 2 3 4 5
Black bears in East Texas would increase my quality of life. 1 2 3 4 5
Black bears near my home would increase my quality of life. 1 2 3 4 5
Black bears have the right to exist wherever they may occur. 1 2 3 4 5
I would feel personally at risk if black bears exist in East Texas. 1 2 3 4 5
I am afraid of black bears. 1 2 3 4 5
Black bears commonly harm humans. 1 2 3 4 5
Wildlife experts know how to manage black bears. 1 2 3 4 5
Wildlife experts understand landowners’ concerns about black bears.
1 2 3 4 5
The black bear population in East Texas should be increased. 1 2 3 4 5
The black bear population in East Texas should be increased only if steps are taken to lessen the chances of human-bear conflicts.
1 2 3 4 5
The black bear population in East Texas should remain the same.
1 2 3 4 5
Black bears should not exist in East Texas. 1 2 3 4 5
10. In general, do you believe black bears are a danger to humans?
No Yes
10a. Provide reasons for your answer. ______________________________________________________ 11. Do you believe black bears are a nuisance?
No Yes
32
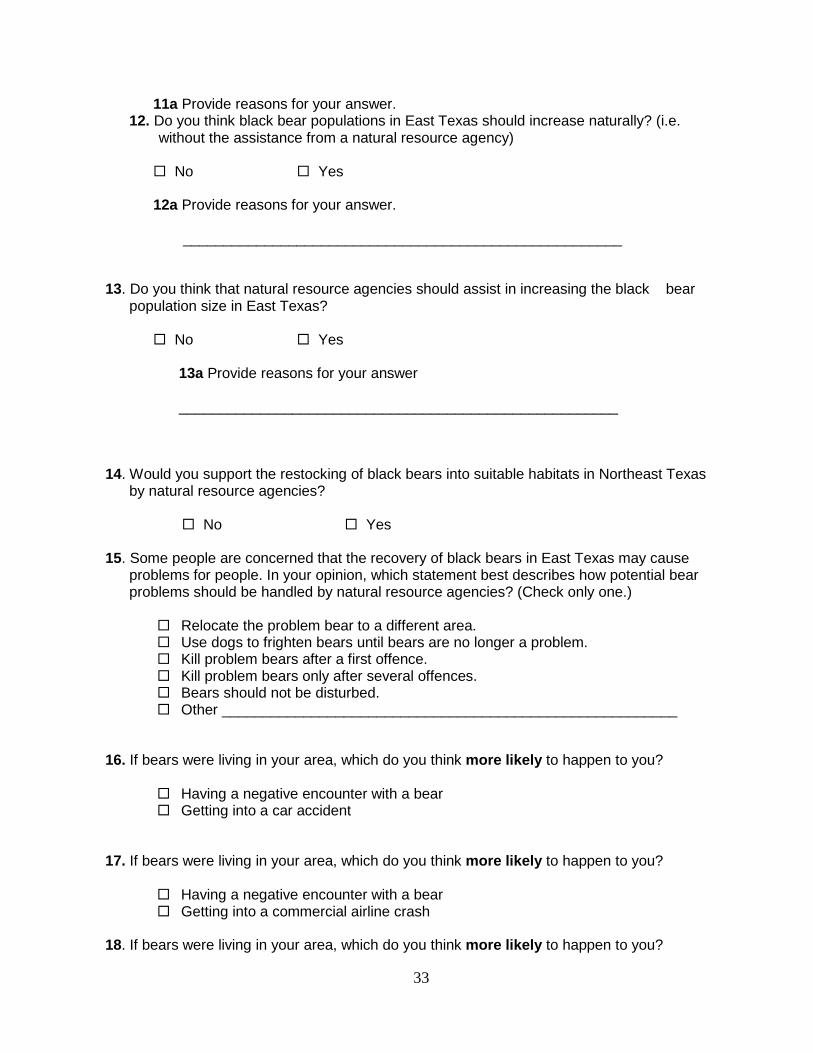
11a Provide reasons for your answer. 12. Do you think black bear populations in East Texas should increase naturally? (i.e. without the assistance from a natural resource agency) No Yes
12a Provide reasons for your answer.
______________________________________________________
13. Do you think that natural resource agencies should assist in increasing the black bear population size in East Texas? No Yes
13a Provide reasons for your answer ______________________________________________________
14. Would you support the restocking of black bears into suitable habitats in Northeast Texas by natural resource agencies?
No Yes
15. Some people are concerned that the recovery of black bears in East Texas may cause problems for people. In your opinion, which statement best describes how potential bear problems should be handled by natural resource agencies? (Check only one.) Relocate the problem bear to a different area. Use dogs to frighten bears until bears are no longer a problem. Kill problem bears after a first offence. Kill problem bears only after several offences. Bears should not be disturbed. Other ________________________________________________________
16. If bears were living in your area, which do you think more likely to happen to you? Having a negative encounter with a bear Getting into a car accident
17. If bears were living in your area, which do you think more likely to happen to you? Having a negative encounter with a bear Getting into a commercial airline crash
18. If bears were living in your area, which do you think more likely to happen to you?
33
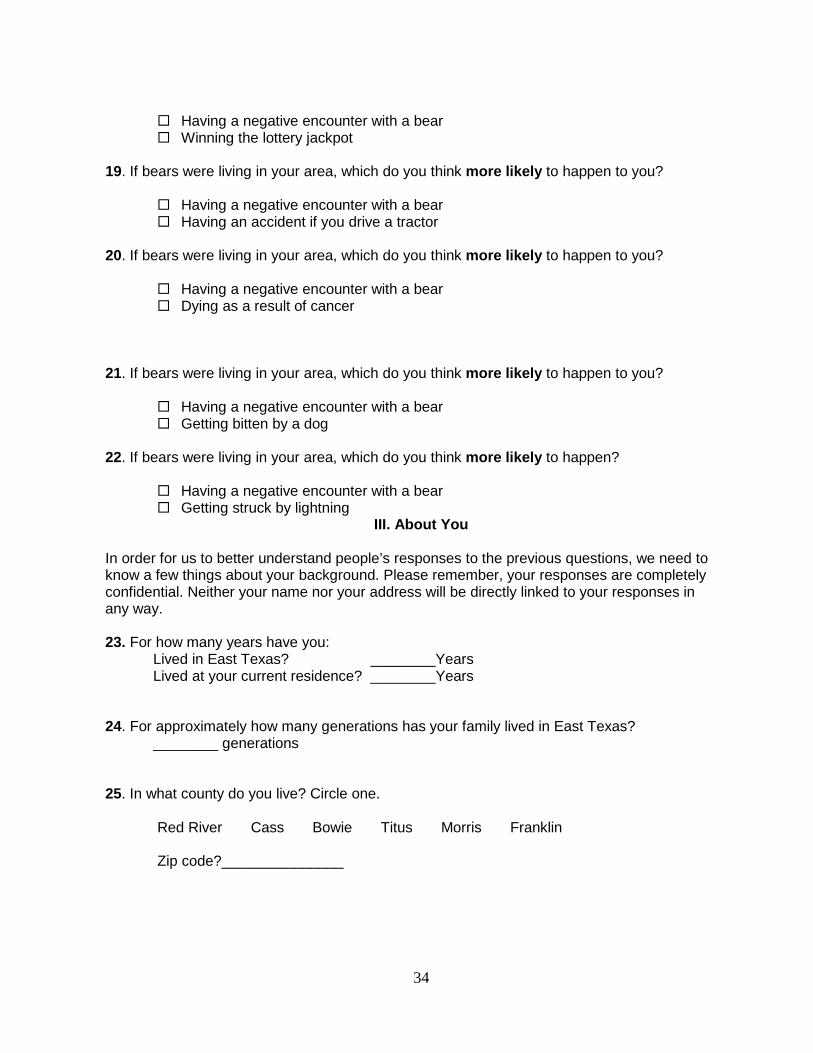
Having a negative encounter with a bear Winning the lottery jackpot
19. If bears were living in your area, which do you think more likely to happen to you?
Having a negative encounter with a bear Having an accident if you drive a tractor
20. If bears were living in your area, which do you think more likely to happen to you?
Having a negative encounter with a bear Dying as a result of cancer
21. If bears were living in your area, which do you think more likely to happen to you? Having a negative encounter with a bear Getting bitten by a dog
22. If bears were living in your area, which do you think more likely to happen?
Having a negative encounter with a bear Getting struck by lightning
III. About You
In order for us to better understand people’s responses to the previous questions, we need to know a few things about your background. Please remember, your responses are completely confidential. Neither your name nor your address will be directly linked to your responses in any way.
23. For how many years have you:
Lived in East Texas? ________Years Lived at your current residence? ________Years
24. For approximately how many generations has your family lived in East Texas? ________ generations
25. In what county do you live? Circle one.
Red River Cass Bowie Titus Morris Franklin Zip code?_______________
34
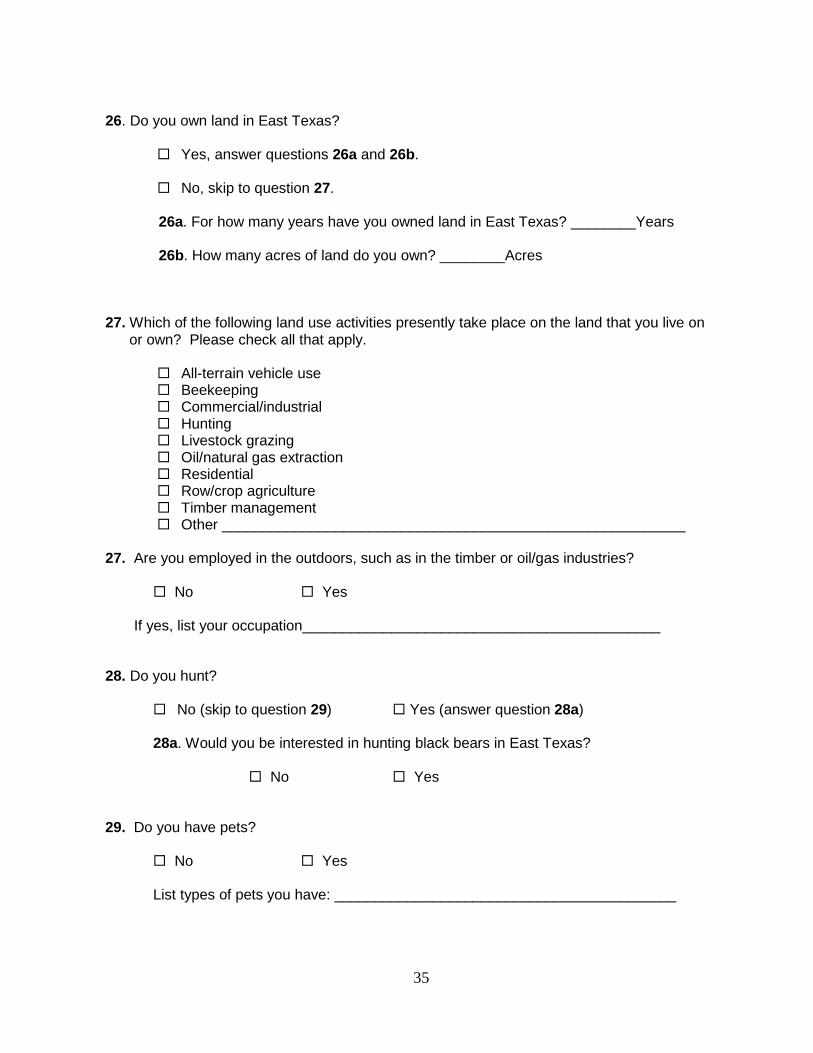
26. Do you own land in East Texas?
Yes, answer questions 26a and 26b.
No, skip to question 27.
26a. For how many years have you owned land in East Texas? ________Years 26b. How many acres of land do you own? ________Acres
27. Which of the following land use activities presently take place on the land that you live on or own? Please check all that apply. All-terrain vehicle use Beekeeping Commercial/industrial Hunting Livestock grazing Oil/natural gas extraction Residential Row/crop agriculture Timber management Other _________________________________________________________
27. Are you employed in the outdoors, such as in the timber or oil/gas industries?
No Yes If yes, list your occupation____________________________________________
28. Do you hunt? No (skip to question 29) Yes (answer question 28a)
28a. Would you be interested in hunting black bears in East Texas? No Yes
29. Do you have pets? No Yes List types of pets you have: __________________________________________
35
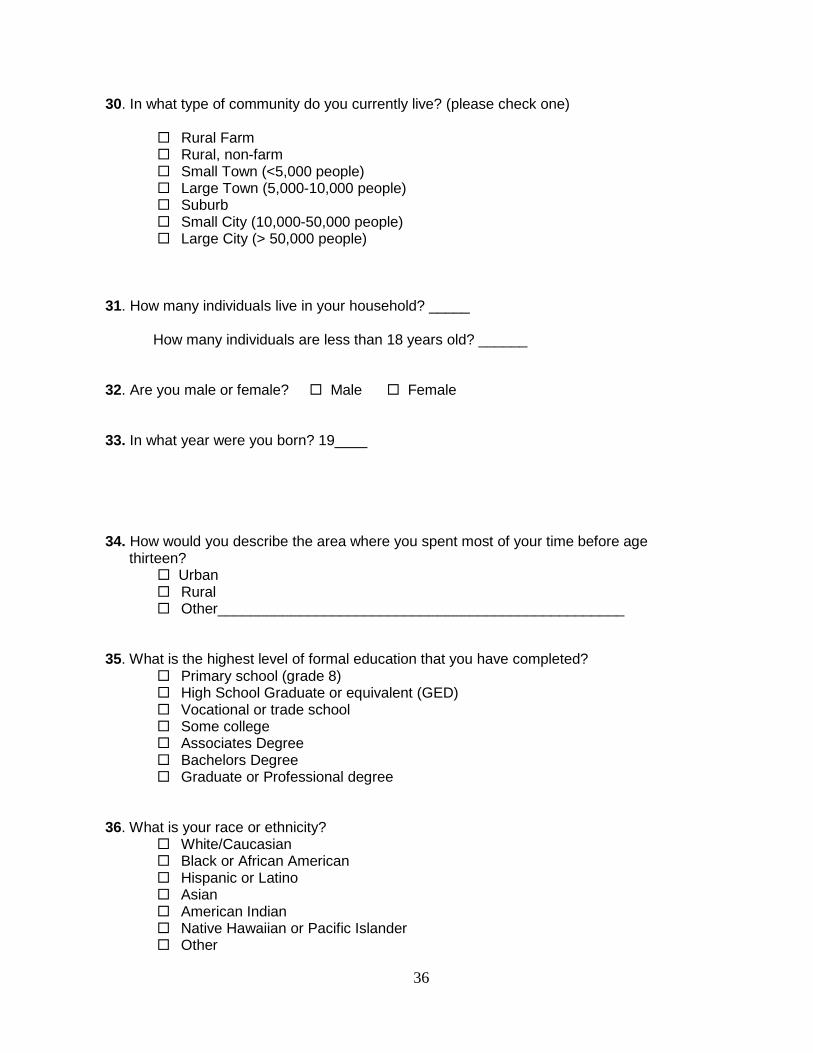
30. In what type of community do you currently live? (please check one) Rural Farm Rural, non-farm Small Town (<5,000 people) Large Town (5,000-10,000 people) Suburb Small City (10,000-50,000 people) Large City (> 50,000 people)
31. How many individuals live in your household? _____ How many individuals are less than 18 years old? ______
32. Are you male or female? Male Female
33. In what year were you born? 19____
34. How would you describe the area where you spent most of your time before age
thirteen? Urban
Rural Other__________________________________________________
35. What is the highest level of formal education that you have completed? Primary school (grade 8) High School Graduate or equivalent (GED) Vocational or trade school Some college Associates Degree Bachelors Degree Graduate or Professional degree
36. What is your race or ethnicity? White/Caucasian Black or African American Hispanic or Latino Asian American Indian Native Hawaiian or Pacific Islander Other
36
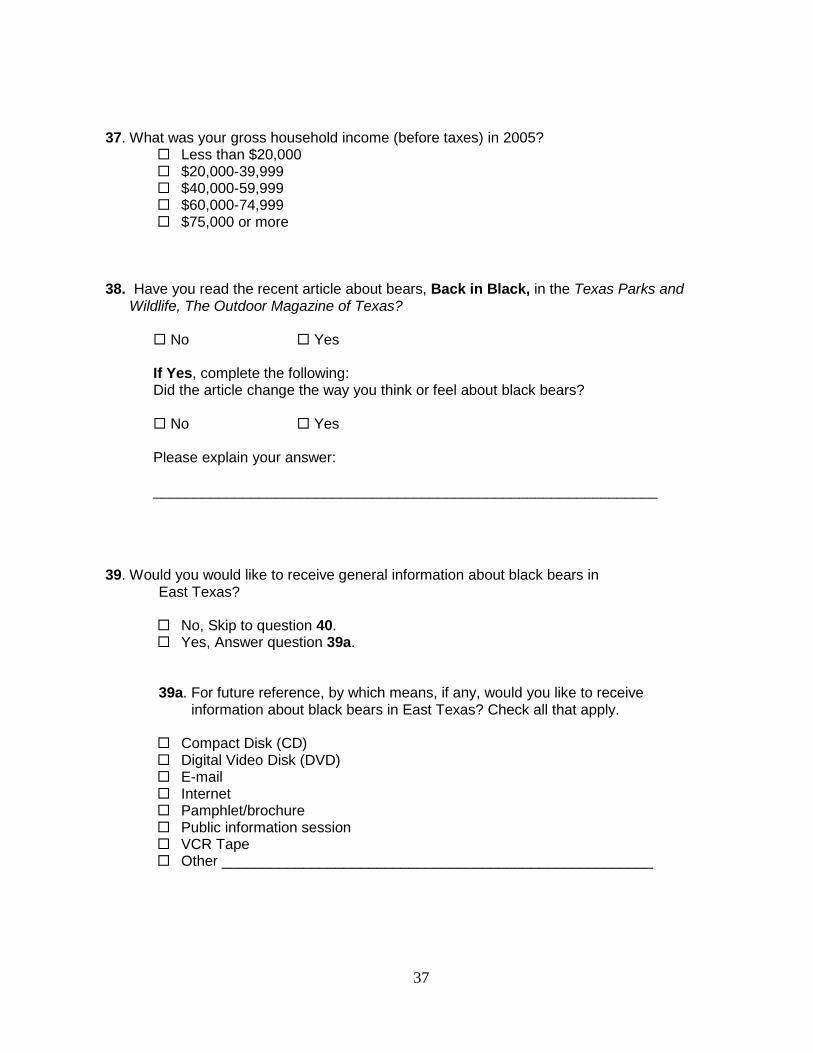
37. What was your gross household income (before taxes) in 2005? Less than $20,000 $20,000-39,999 $40,000-59,999 $60,000-74,999 $75,000 or more
38. Have you read the recent article about bears, Back in Black, in the Texas Parks and
Wildlife, The Outdoor Magazine of Texas? No Yes If Yes, complete the following: Did the article change the way you think or feel about black bears? No Yes Please explain your answer: ______________________________________________________________
39. Would you would like to receive general information about black bears in East Texas? No, Skip to question 40. Yes, Answer question 39a.
39a. For future reference, by which means, if any, would you like to receive information about black bears in East Texas? Check all that apply. Compact Disk (CD) Digital Video Disk (DVD) E-mail Internet Pamphlet/brochure Public information session VCR Tape Other _____________________________________________________
37
40. Please use this space for any additional comments
________________________________________________________________ ________________________________________________________________
________________________________________________________________ ________________________________________________________________ ________________________________________________________________
Thank you for your time!!
Contact information: Adam Keul, Graduate Research Assistant, [email protected]
Dr. Pat Stephens Williams, [email protected] Dr. Chris Comer, [email protected]
College of Forestry and Agriculture Stephen F. Austin State University
Nacogdoches, TX 75962 (936)468-3301
38
REMINDER POSTCARD
April 24, 2006
Dear Northeast Texas Resident,
Recently you were mailed a survey concerning black bear management in your area. In order to accurately determine opinions of people in Northeast Texas, we need to receive as many responses as possible. This card is simply a reminder to you to return the completed survey as soon as possible. If you have already sent it back, we thank you very much for your help, and you may disregard this reminder. If you have lost the survey and need another copy, we would be glad to send you a new one. Your opinion is important and will be used to make wildlife management decisions in the future. For any further questions, or to receive a new copy of the survey please feel free to contact us at: Adam Keul, Graduate Research Assistant, Dr. Pat Stephens Williams Dr. Chris Comer Stephen F. Austin State University Arthur Temple College of Forestry (936) 468-3301 Or email [email protected] Thank you for your time, Adam Keul
39
SURVEY COVER LETTER OF SECOND MAILING
Arthur Temple College of Forestry P.O. Box 6109, SFA Station • Nacogdoches, Texas 75962-6109 • (936) 468-3301 •
FAX (936) 468-2489
May 15, 2006
Dear Northeast Texas Resident,
We still need your help! Recently you were chosen from the residents of your county to help in a public opinion survey concerning wildlife management. We have not yet received your completed survey. If your response has been mailed already, we would like to thank you, and you may disregard this letter.
Some people have written and explained that they have no knowledge of, or experience with black bears and felt that their response was not important. We want you to know that everyone’s views about black bears in Northeast Texas are needed, whatever you opinion or experience may be. Once we receive a completed survey, your name will be removed from our mailing list.
Attached to this letter is a survey that deals with opinions and issues related to black bears in Northeast Texas. The questionnaire should only take 10-15 minutes to complete, and there are no right or wrong answers. The study is part of a research project sponsored by the Texas Parks and Wildlife Department and Stephen F. Austin State University. The results will help guide TPWD in managing wildlife in Northeast Texas.
Please have anyone in your household who is 18 years of age or older and a Northeast Texas resident fill out this questionnaire. Return the survey as soon a possible in the postage paid envelope provided. You can be assured of complete confidentiality in your answers. If you have any questions you may contact me, Adam Keul, Graduate Research Assistant, at [email protected], or Dr. Pat Stephens Williams or Dr. Chris Comer at (936) 468-3301 in the Arthur Temple School of Forestry, Stephen F. Austin State University, Nacogdoches, Texas.
Thank you for participating in this study. Sincerely, Adam Keul Graduate Research Assistant
40