Embed Size (px)
Citation preview
Stakeholders’ Education | Corporate Governance Research | Corporate Governance Score | Proxy Advisory
STAKEHOLDERS EMPOWERMENT SERVICES
1 | P A G E
SECTOR: AUTO REPORTING DATE: 30TH JANUARY, 2018
ANG INDUSTRIES LTD. www.angindustries.com
ANG Industries Ltd. NSE Code - ANGIND TABLE 1 - MARKET DATA (STANDALONE) (AS ON 24TH JANUARY, 2018)
Sector - Auto Ancillaries NSE Market Price (`) 6.40 NSE Market Cap. (₹ Cr.) 10.25
Face Value (`) 10.00 Equity (` Cr.) 16.09
Business Group – N.A. 52 week High/Low (₹) 13.40/5.00 Net worth (₹ Cr.)* -29.61
Year of Incorporation - 1991 TTM P/E (TTM) N.A. Traded Volume (Shares) 14,221
TTM P/BV N.A. Traded Volume (lacs) 0.91
Registered Office - Source - Capitaline, TTM - Trailing Twelve Months, N.A. - Not Applicable, * As on 31st March, 2017
101-106, Plot No 42, 1st Floor, COMPANY BACKGROUND
3-LSC Sharda Chamber-4, Kalkaji, ANG Industries Limited is an India-based company, which is engaged in the manufacturing
of auto components and assemblies. The Company offers products and services, including
automotive components and parts, and heavy steel fabrication. The Company operates
through the segments, which include Automotive Components & Parts; Heavy Steel
Fabrication, and Off Highway Components. The Company is engaged in the manufacturing
of off highway equipment used in agriculture equipment and forestry equipment. The
Company operates both in the domestic market and overseas. The Company's
manufacturing facilities are located in Greater Noida, Gautam Budh Nagar District (Uttar
Pradesh). The Company's subsidiary is ANG Auto USA, Inc.
New Delhi - 110019
Company Website:
www.angindustries.com
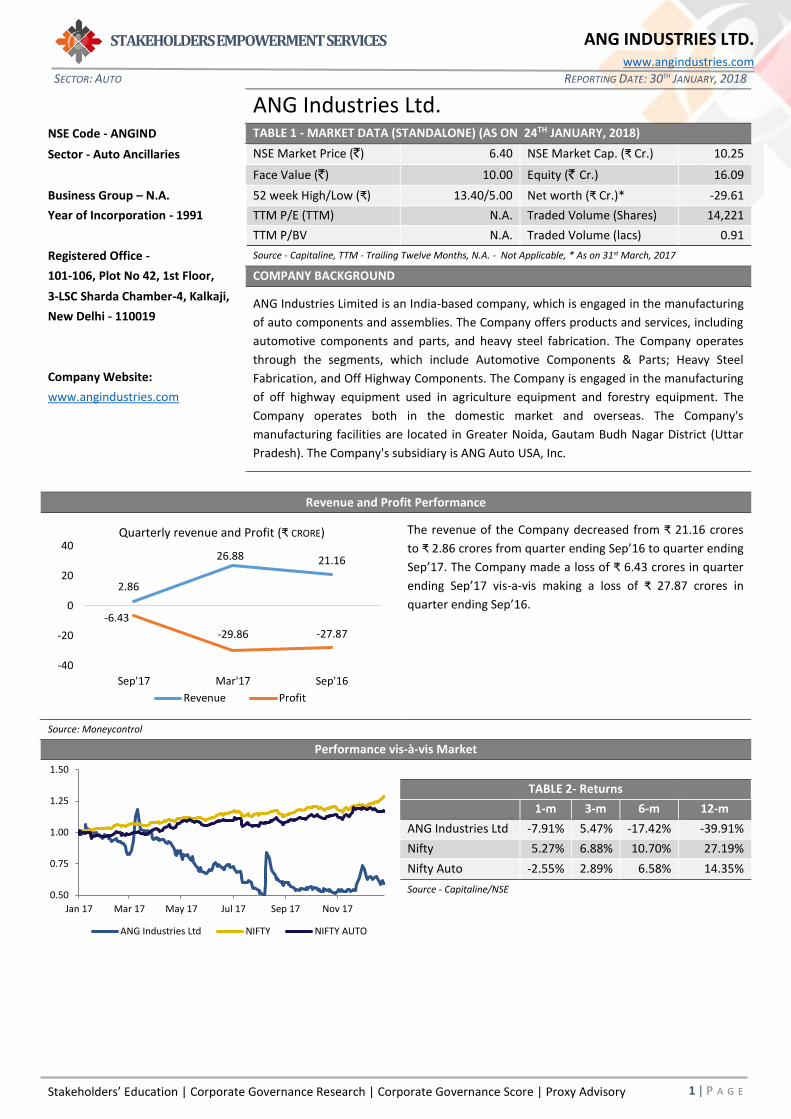
Revenue and Profit Performance
The revenue of the Company decreased from ₹ 21.16 crores
to ₹ 2.86 crores from quarter ending Sep’16 to quarter ending
Sep’17. The Company made a loss of ₹ 6.43 crores in quarter
ending Sep’17 vis-a-vis making a loss of ₹ 27.87 crores in
quarter ending Sep’16.
Source: Moneycontrol
Performance vis-à-vis Market
TABLE 2- Returns
1-m 3-m 6-m 12-m
ANG Industries Ltd -7.91% 5.47% -17.42% -39.91%
Nifty 5.27% 6.88% 10.70% 27.19%
Nifty Auto -2.55% 2.89% 6.58% 14.35%
Source - Capitaline/NSE
0.50
0.75
1.00
1.25
1.50
Jan 17 Mar 17 May 17 Jul 17 Sep 17 Nov 17
ANG Industries Ltd NIFTY NIFTY AUTO
2.86
26.88 21.16
-6.43
-29.86 -27.87
-40
-20
0
20
40
Sep'17 Mar'17 Sep'16
Quarterly revenue and Profit (₹ CRORE)
Revenue Profit
Stakeholders’ Education | Corporate Governance Research | Corporate Governance Score | Proxy Advisory
STAKEHOLDERS EMPOWERMENT SERVICES
2 | P A G E
SECTOR: AUTO REPORTING DATE: 30TH JANUARY, 2018
ANG INDUSTRIES LTD. www.angindustries.com
TABLE 3 - FINANCIALS
(₹ Cr.) Sep’17* Mar’17 Sep’16 % Change
Sep ’17 vs Mar’17 Mar’17 vs Sep’16
Net Worth N.D. -29.61 4.25 N.A. -796.71%
Current Assets N.D. 55.99 98.39 N.A. -43.09%
Non-Current Assets N.D. 105.71 110.17 N.A. -4.05%
Total Assets N.D. 161.70 208.56 N.A. -22.47%
Investments N.D. 0.69 1.59 N.A. -56.60%
Finance Cost 1.80 0.27 2.54 566.67% -89.37%
Long Term Liabilities N.D. 29.73 41.35 N.A. -28.10%
Current Liabilities N.D. 161.58 162.96 N.A. -0.85%
Turnover 2.86 26.88 21.16 -89.36% 27.03%
Profit After Tax -6.43 -29.86 -27.87 N.A. N.A.
EPS (₹) -39.95 0.00 0.00 N.A. N.A.
Source - Money Control/Stock exchange filing | *The Company has not disclosed the Standalone Balance Sheet for Quarter ending Sep’ 17.
AUDIT QUALIFICATIONS
Audit Qualifications in last 3 years: The Statutory Auditors have raised qualification in their Report for FY 2016-17 and FY 2015-
16. No qualification was raised for FY 2014-15.
The report of Statutory Auditors for FY 2016-17, contains the following observation on the financial statement:
1. The financial results shows that the company had made the provisions of NIL in their books of account for payment of
premium to LIC on account of group gratuity cash accumulation plan during the financial year 2016-17. As the company
had not paid the premium even in this year to LIC. Further, the company has not obtained the actuary valuation from
independent actuary for the current year.
Management View: The Company has paid gratuity to the outgoing employees amounting to Rs. 40,25,165/- during the
year due to paucity of fund and mismatch in cash flow and the requisite amount in LIC Fund could not be deposited and
similarly the actuary valuation has also not done.
2. The Company has not provided interest amounting to Rs. 678.22 Lacs accrued and payable by the company on the loans
availed from State Bank of India and Bank of Baroda. All the said loans have been termed as NPA w.e.f. 30.06.2016 and the
Banks have stopped charging interest in the regular accounts of the company. Profit has been understated to the extent
interest not booked by the Company. Loan has been increased by the amount of export bills crystalized by the banks.
Management View: The Company has not provided for the interest as the banks have stopped charging the interest in the
regular account of the company in their books.
3. During the year major inventories items have been classified as obsolete and has been classified as scrap by the Company.
Out of the same major portion has been sold out during the year. However, it is not possible to quantify the impact of
losses due to this.
Management View: The company has suffered losses due to reduction in the valuation and generation of excessive scrap
due to cancellation of orders of various components like Diff. Spiders, Worm and Gear, Diff. Pins, Automatic Slack
Adjusters, Log Splitter parts, etc. from various overseas customers and Heavy Steel Fabrication for Bharat Heavy Electrical
Limited.
4. In our opinion, there are many operations which have been either closed down or production have been suspended. The
ANG Industries Limited Annual Report 2016-17 8 hundred percent of exports orders have been cancelled. The majority of
the Banks have declared the company’s account as NPA. The sources of additional funds coming to the company are
unforeseeable. This is an audit requirement for a qualification as going concern concept.
Management View: The company is making all efforts to revive its operations of the suspended production units for which
it has already submitted a detailed restructure plan to the Joint Lender Forum of the Banks and which is under
Stakeholders’ Education | Corporate Governance Research | Corporate Governance Score | Proxy Advisory
STAKEHOLDERS EMPOWERMENT SERVICES
3 | P A G E
SECTOR: AUTO REPORTING DATE: 30TH JANUARY, 2018
ANG INDUSTRIES LTD. www.angindustries.com
consideration.
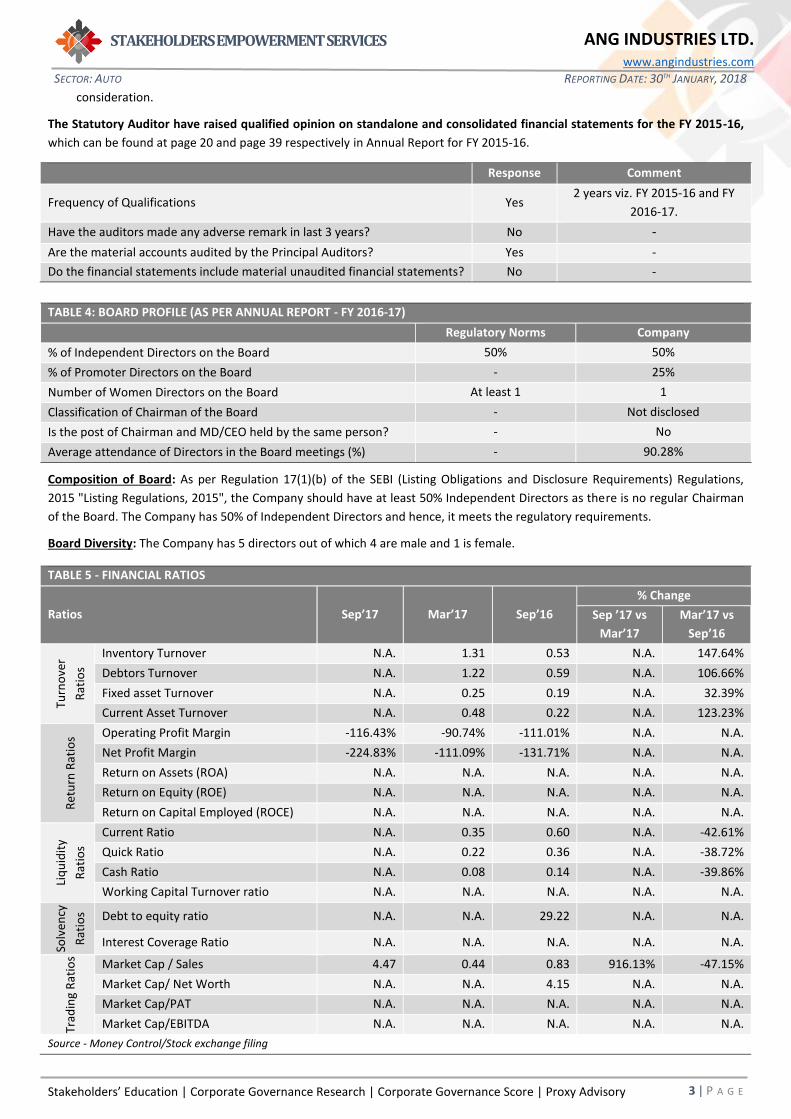
The Statutory Auditor have raised qualified opinion on standalone and consolidated financial statements for the FY 2015-16,
which can be found at page 20 and page 39 respectively in Annual Report for FY 2015-16.
Response Comment
Frequency of Qualifications Yes 2 years viz. FY 2015-16 and FY
2016-17.
Have the auditors made any adverse remark in last 3 years? No -
Are the material accounts audited by the Principal Auditors? Yes -
Do the financial statements include material unaudited financial statements? No -
TABLE 4: BOARD PROFILE (AS PER ANNUAL REPORT - FY 2016-17)
Regulatory Norms Company
% of Independent Directors on the Board 50% 50%
% of Promoter Directors on the Board - 25%
Number of Women Directors on the Board At least 1 1
Classification of Chairman of the Board - Not disclosed
Is the post of Chairman and MD/CEO held by the same person? - No
Average attendance of Directors in the Board meetings (%) - 90.28%
Composition of Board: As per Regulation 17(1)(b) of the SEBI (Listing Obligations and Disclosure Requirements) Regulations,
2015 "Listing Regulations, 2015", the Company should have at least 50% Independent Directors as there is no regular Chairman
of the Board. The Company has 50% of Independent Directors and hence, it meets the regulatory requirements.
Board Diversity: The Company has 5 directors out of which 4 are male and 1 is female.
TABLE 5 - FINANCIAL RATIOS
Ratios Sep’17 Mar’17 Sep’16
% Change
Sep ’17 vs
Mar’17
Mar’17 vs
Sep’16
Turn
ove
r
Rat
ios
Inventory Turnover N.A. 1.31 0.53 N.A. 147.64%
Debtors Turnover N.A. 1.22 0.59 N.A. 106.66%
Fixed asset Turnover N.A. 0.25 0.19 N.A. 32.39%
Current Asset Turnover N.A. 0.48 0.22 N.A. 123.23%
Ret
urn
Rat
ios Operating Profit Margin -116.43% -90.74% -111.01% N.A. N.A.
Net Profit Margin -224.83% -111.09% -131.71% N.A. N.A.
Return on Assets (ROA) N.A. N.A. N.A. N.A. N.A.
Return on Equity (ROE) N.A. N.A. N.A. N.A. N.A.
Return on Capital Employed (ROCE) N.A. N.A. N.A. N.A. N.A.
Liq
uid
ity
Rat
ios
Current Ratio N.A. 0.35 0.60 N.A. -42.61%
Quick Ratio N.A. 0.22 0.36 N.A. -38.72%
Cash Ratio N.A. 0.08 0.14 N.A. -39.86%
Working Capital Turnover ratio N.A. N.A. N.A. N.A. N.A.
Solv
ency
Rat
ios Debt to equity ratio N.A. N.A. 29.22 N.A. N.A.
Interest Coverage Ratio N.A. N.A. N.A. N.A. N.A.
Trad
ing
Rat
ios
Market Cap / Sales 4.47 0.44 0.83 916.13% -47.15%
Market Cap/ Net Worth N.A. N.A. 4.15 N.A. N.A.
Market Cap/PAT N.A. N.A. N.A. N.A. N.A.
Market Cap/EBITDA N.A. N.A. N.A. N.A. N.A.
Source - Money Control/Stock exchange filing
Stakeholders’ Education | Corporate Governance Research | Corporate Governance Score | Proxy Advisory
STAKEHOLDERS EMPOWERMENT SERVICES
4 | P A G E
SECTOR: AUTO REPORTING DATE: 30TH JANUARY, 2018
ANG INDUSTRIES LTD. www.angindustries.com
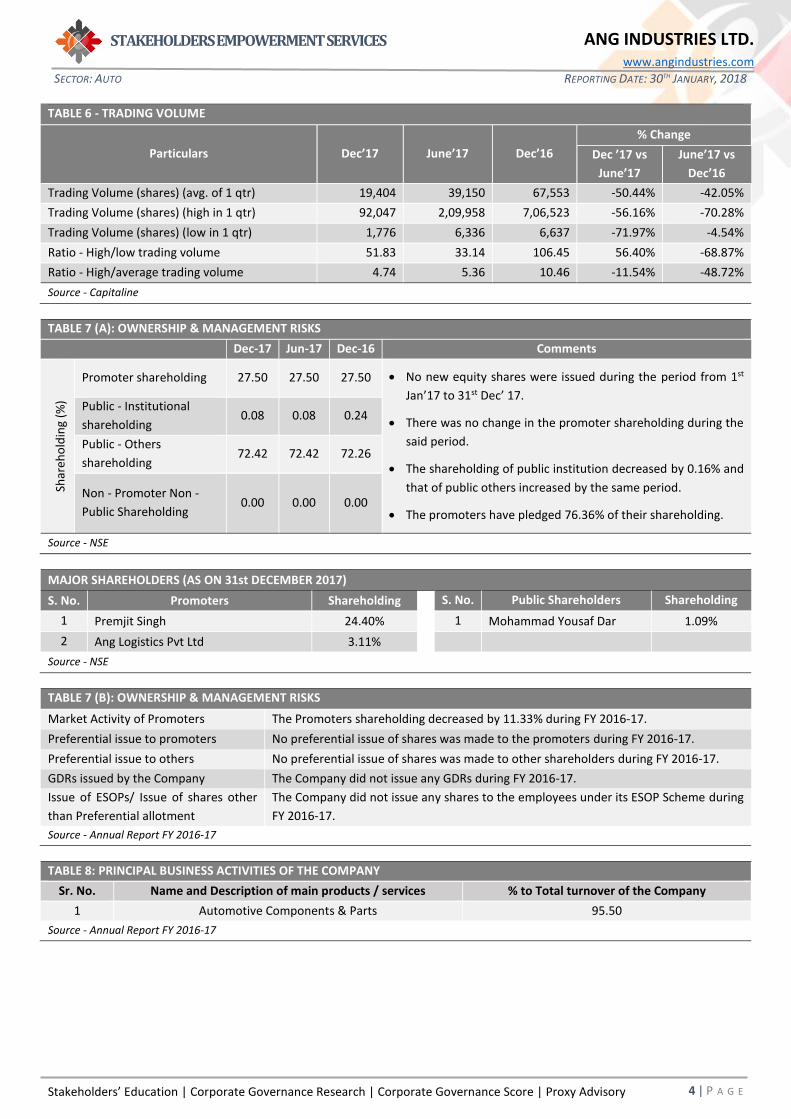
TABLE 6 - TRADING VOLUME
Particulars Dec’17 June’17 Dec’16
% Change
Dec ’17 vs
June’17
June’17 vs
Dec’16
Trading Volume (shares) (avg. of 1 qtr) 19,404 39,150 67,553 -50.44% -42.05%
Trading Volume (shares) (high in 1 qtr) 92,047 2,09,958 7,06,523 -56.16% -70.28%
Trading Volume (shares) (low in 1 qtr) 1,776 6,336 6,637 -71.97% -4.54%
Ratio - High/low trading volume 51.83 33.14 106.45 56.40% -68.87%
Ratio - High/average trading volume 4.74 5.36 10.46 -11.54% -48.72%
Source - Capitaline
TABLE 7 (A): OWNERSHIP & MANAGEMENT RISKS
Dec-17 Jun-17 Dec-16 Comments
Shar
eho
ldin
g (%
)
Promoter shareholding 27.50 27.50 27.50 • No new equity shares were issued during the period from 1st
Jan’17 to 31st Dec’ 17.
• There was no change in the promoter shareholding during the
said period.
• The shareholding of public institution decreased by 0.16% and
that of public others increased by the same period.
• The promoters have pledged 76.36% of their shareholding.
Public - Institutional
shareholding 0.08 0.08 0.24
Public - Others
shareholding 72.42 72.42 72.26
Non - Promoter Non -
Public Shareholding 0.00 0.00 0.00
Source - NSE
MAJOR SHAREHOLDERS (AS ON 31st DECEMBER 2017)
S. No. Promoters Shareholding S. No. Public Shareholders Shareholding
1 Premjit Singh 24.40% 1 Mohammad Yousaf Dar 1.09%
2 Ang Logistics Pvt Ltd 3.11%
Source - NSE
TABLE 7 (B): OWNERSHIP & MANAGEMENT RISKS
Market Activity of Promoters The Promoters shareholding decreased by 11.33% during FY 2016-17.
Preferential issue to promoters No preferential issue of shares was made to the promoters during FY 2016-17.
Preferential issue to others No preferential issue of shares was made to other shareholders during FY 2016-17.
GDRs issued by the Company The Company did not issue any GDRs during FY 2016-17.
Issue of ESOPs/ Issue of shares other
than Preferential allotment
The Company did not issue any shares to the employees under its ESOP Scheme during
FY 2016-17.
Source - Annual Report FY 2016-17
TABLE 8: PRINCIPAL BUSINESS ACTIVITIES OF THE COMPANY
Sr. No. Name and Description of main products / services % to Total turnover of the Company
1 Automotive Components & Parts 95.50
Source - Annual Report FY 2016-17
Stakeholders’ Education | Corporate Governance Research | Corporate Governance Score | Proxy Advisory
STAKEHOLDERS EMPOWERMENT SERVICES
5 | P A G E
SECTOR: AUTO REPORTING DATE: 30TH JANUARY, 2018
ANG INDUSTRIES LTD. www.angindustries.com
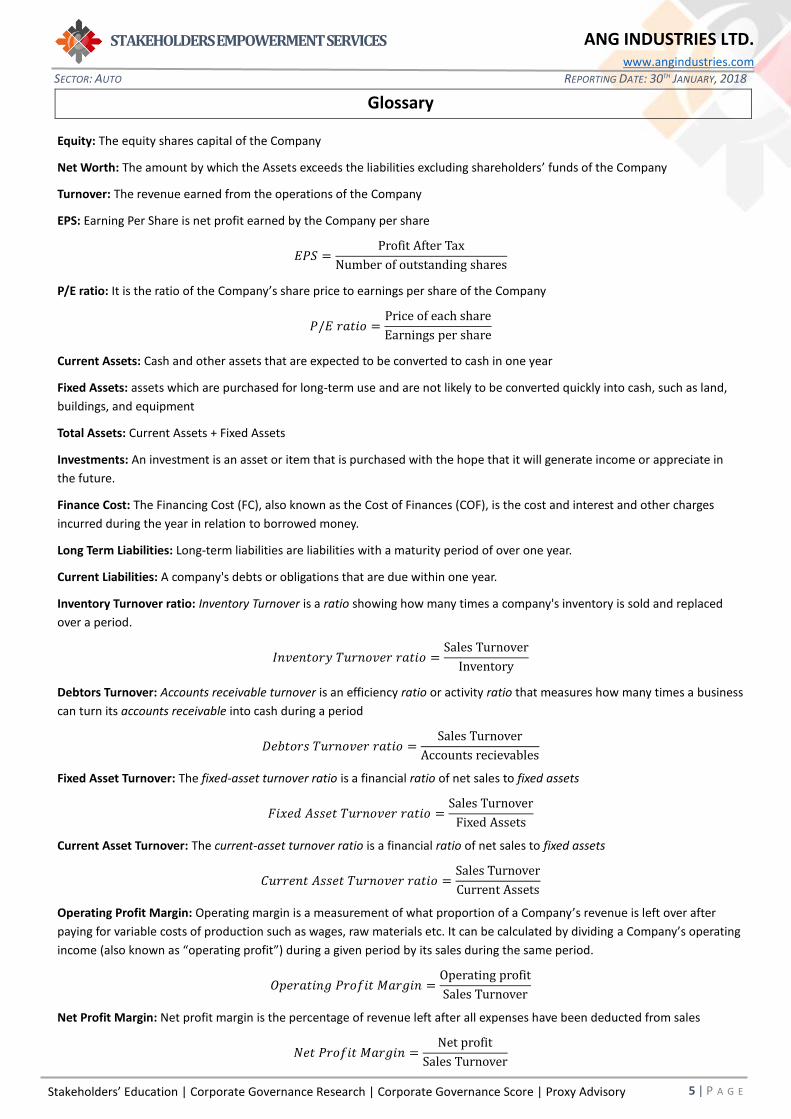
Glossary
Equity: The equity shares capital of the Company
Net Worth: The amount by which the Assets exceeds the liabilities excluding shareholders’ funds of the Company
Turnover: The revenue earned from the operations of the Company
EPS: Earning Per Share is net profit earned by the Company per share
𝐸𝑃𝑆 =Profit After Tax
Number of outstanding shares
P/E ratio: It is the ratio of the Company’s share price to earnings per share of the Company
𝑃/𝐸 𝑟𝑎𝑡𝑖𝑜 =Price of each share
Earnings per share
Current Assets: Cash and other assets that are expected to be converted to cash in one year
Fixed Assets: assets which are purchased for long-term use and are not likely to be converted quickly into cash, such as land,
buildings, and equipment
Total Assets: Current Assets + Fixed Assets
Investments: An investment is an asset or item that is purchased with the hope that it will generate income or appreciate in
the future.
Finance Cost: The Financing Cost (FC), also known as the Cost of Finances (COF), is the cost and interest and other charges
incurred during the year in relation to borrowed money.
Long Term Liabilities: Long-term liabilities are liabilities with a maturity period of over one year.
Current Liabilities: A company's debts or obligations that are due within one year.
Inventory Turnover ratio: Inventory Turnover is a ratio showing how many times a company's inventory is sold and replaced
over a period.
𝐼𝑛𝑣𝑒𝑛𝑡𝑜𝑟𝑦 𝑇𝑢𝑟𝑛𝑜𝑣𝑒𝑟 𝑟𝑎𝑡𝑖𝑜 =Sales Turnover
Inventory
Debtors Turnover: Accounts receivable turnover is an efficiency ratio or activity ratio that measures how many times a business
can turn its accounts receivable into cash during a period
𝐷𝑒𝑏𝑡𝑜𝑟𝑠 𝑇𝑢𝑟𝑛𝑜𝑣𝑒𝑟 𝑟𝑎𝑡𝑖𝑜 =Sales Turnover
Accounts recievables
Fixed Asset Turnover: The fixed-asset turnover ratio is a financial ratio of net sales to fixed assets
𝐹𝑖𝑥𝑒𝑑 𝐴𝑠𝑠𝑒𝑡 𝑇𝑢𝑟𝑛𝑜𝑣𝑒𝑟 𝑟𝑎𝑡𝑖𝑜 =Sales Turnover
Fixed Assets
Current Asset Turnover: The current-asset turnover ratio is a financial ratio of net sales to fixed assets
𝐶𝑢𝑟𝑟𝑒𝑛𝑡 𝐴𝑠𝑠𝑒𝑡 𝑇𝑢𝑟𝑛𝑜𝑣𝑒𝑟 𝑟𝑎𝑡𝑖𝑜 =Sales Turnover
Current Assets
Operating Profit Margin: Operating margin is a measurement of what proportion of a Company’s revenue is left over after
paying for variable costs of production such as wages, raw materials etc. It can be calculated by dividing a Company’s operating
income (also known as “operating profit”) during a given period by its sales during the same period.
𝑂𝑝𝑒𝑟𝑎𝑡𝑖𝑛𝑔 𝑃𝑟𝑜𝑓𝑖𝑡 𝑀𝑎𝑟𝑔𝑖𝑛 =Operating profit
Sales Turnover
Net Profit Margin: Net profit margin is the percentage of revenue left after all expenses have been deducted from sales
𝑁𝑒𝑡 𝑃𝑟𝑜𝑓𝑖𝑡 𝑀𝑎𝑟𝑔𝑖𝑛 =Net profit
Sales Turnover
Stakeholders’ Education | Corporate Governance Research | Corporate Governance Score | Proxy Advisory
STAKEHOLDERS EMPOWERMENT SERVICES
6 | P A G E
SECTOR: AUTO REPORTING DATE: 30TH JANUARY, 2018
ANG INDUSTRIES LTD. www.angindustries.com
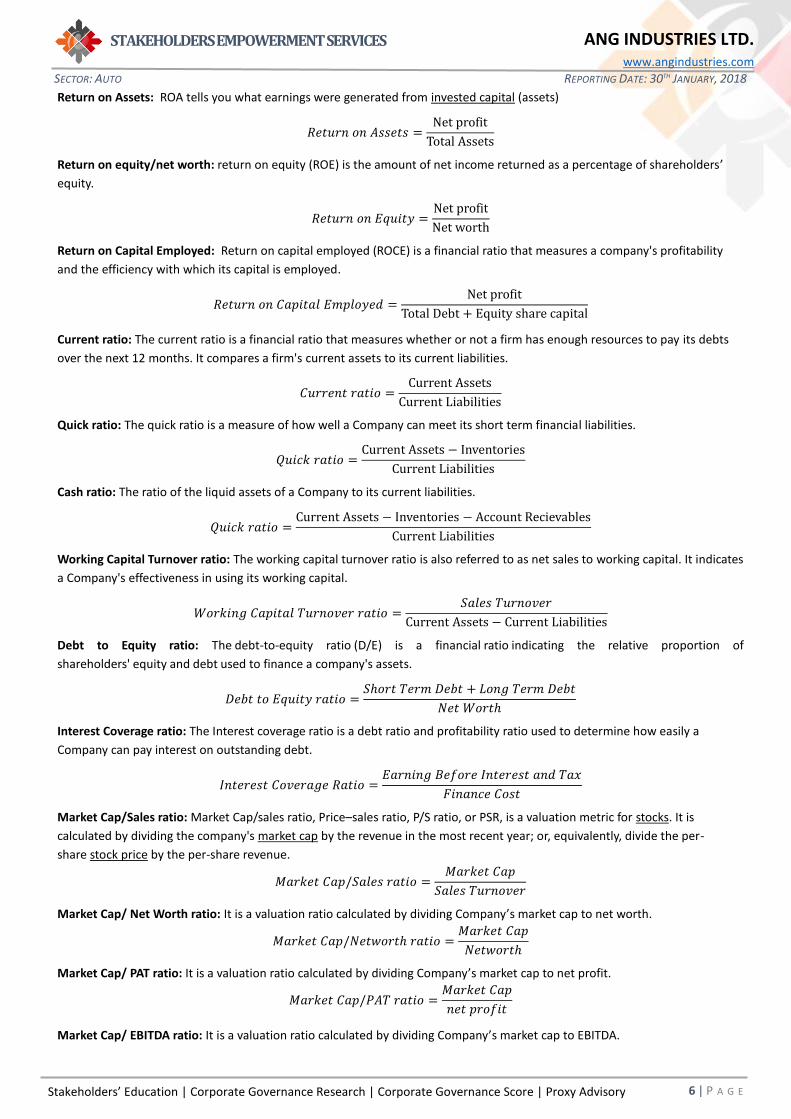
Return on Assets: ROA tells you what earnings were generated from invested capital (assets)
𝑅𝑒𝑡𝑢𝑟𝑛 𝑜𝑛 𝐴𝑠𝑠𝑒𝑡𝑠 =Net profit
Total Assets
Return on equity/net worth: return on equity (ROE) is the amount of net income returned as a percentage of shareholders’
equity.
𝑅𝑒𝑡𝑢𝑟𝑛 𝑜𝑛 𝐸𝑞𝑢𝑖𝑡𝑦 =Net profit
Net worth
Return on Capital Employed: Return on capital employed (ROCE) is a financial ratio that measures a company's profitability
and the efficiency with which its capital is employed.
𝑅𝑒𝑡𝑢𝑟𝑛 𝑜𝑛 𝐶𝑎𝑝𝑖𝑡𝑎𝑙 𝐸𝑚𝑝𝑙𝑜𝑦𝑒𝑑 =Net profit
Total Debt + Equity share capital
Current ratio: The current ratio is a financial ratio that measures whether or not a firm has enough resources to pay its debts
over the next 12 months. It compares a firm's current assets to its current liabilities.
𝐶𝑢𝑟𝑟𝑒𝑛𝑡 𝑟𝑎𝑡𝑖𝑜 =Current Assets
Current Liabilities
Quick ratio: The quick ratio is a measure of how well a Company can meet its short term financial liabilities.
𝑄𝑢𝑖𝑐𝑘 𝑟𝑎𝑡𝑖𝑜 =Current Assets − Inventories
Current Liabilities
Cash ratio: The ratio of the liquid assets of a Company to its current liabilities.
𝑄𝑢𝑖𝑐𝑘 𝑟𝑎𝑡𝑖𝑜 =Current Assets − Inventories − Account Recievables
Current Liabilities
Working Capital Turnover ratio: The working capital turnover ratio is also referred to as net sales to working capital. It indicates
a Company's effectiveness in using its working capital.
𝑊𝑜𝑟𝑘𝑖𝑛𝑔 𝐶𝑎𝑝𝑖𝑡𝑎𝑙 𝑇𝑢𝑟𝑛𝑜𝑣𝑒𝑟 𝑟𝑎𝑡𝑖𝑜 =𝑆𝑎𝑙𝑒𝑠 𝑇𝑢𝑟𝑛𝑜𝑣𝑒𝑟
Current Assets − Current Liabilities
Debt to Equity ratio: The debt-to-equity ratio (D/E) is a financial ratio indicating the relative proportion of
shareholders' equity and debt used to finance a company's assets.
𝐷𝑒𝑏𝑡 𝑡𝑜 𝐸𝑞𝑢𝑖𝑡𝑦 𝑟𝑎𝑡𝑖𝑜 =𝑆ℎ𝑜𝑟𝑡 𝑇𝑒𝑟𝑚 𝐷𝑒𝑏𝑡 + 𝐿𝑜𝑛𝑔 𝑇𝑒𝑟𝑚 𝐷𝑒𝑏𝑡
𝑁𝑒𝑡 𝑊𝑜𝑟𝑡ℎ
Interest Coverage ratio: The Interest coverage ratio is a debt ratio and profitability ratio used to determine how easily a
Company can pay interest on outstanding debt.
𝐼𝑛𝑡𝑒𝑟𝑒𝑠𝑡 𝐶𝑜𝑣𝑒𝑟𝑎𝑔𝑒 𝑅𝑎𝑡𝑖𝑜 =𝐸𝑎𝑟𝑛𝑖𝑛𝑔 𝐵𝑒𝑓𝑜𝑟𝑒 𝐼𝑛𝑡𝑒𝑟𝑒𝑠𝑡 𝑎𝑛𝑑 𝑇𝑎𝑥
𝐹𝑖𝑛𝑎𝑛𝑐𝑒 𝐶𝑜𝑠𝑡
Market Cap/Sales ratio: Market Cap/sales ratio, Price–sales ratio, P/S ratio, or PSR, is a valuation metric for stocks. It is
calculated by dividing the company's market cap by the revenue in the most recent year; or, equivalently, divide the per-
share stock price by the per-share revenue.
𝑀𝑎𝑟𝑘𝑒𝑡 𝐶𝑎𝑝/𝑆𝑎𝑙𝑒𝑠 𝑟𝑎𝑡𝑖𝑜 =𝑀𝑎𝑟𝑘𝑒𝑡 𝐶𝑎𝑝
𝑆𝑎𝑙𝑒𝑠 𝑇𝑢𝑟𝑛𝑜𝑣𝑒𝑟
Market Cap/ Net Worth ratio: It is a valuation ratio calculated by dividing Company’s market cap to net worth.
𝑀𝑎𝑟𝑘𝑒𝑡 𝐶𝑎𝑝/𝑁𝑒𝑡𝑤𝑜𝑟𝑡ℎ 𝑟𝑎𝑡𝑖𝑜 =𝑀𝑎𝑟𝑘𝑒𝑡 𝐶𝑎𝑝
𝑁𝑒𝑡𝑤𝑜𝑟𝑡ℎ
Market Cap/ PAT ratio: It is a valuation ratio calculated by dividing Company’s market cap to net profit.
𝑀𝑎𝑟𝑘𝑒𝑡 𝐶𝑎𝑝/𝑃𝐴𝑇 𝑟𝑎𝑡𝑖𝑜 =𝑀𝑎𝑟𝑘𝑒𝑡 𝐶𝑎𝑝
𝑛𝑒𝑡 𝑝𝑟𝑜𝑓𝑖𝑡
Market Cap/ EBITDA ratio: It is a valuation ratio calculated by dividing Company’s market cap to EBITDA.

Stakeholders’ Education | Corporate Governance Research | Corporate Governance Score | Proxy Advisory
STAKEHOLDERS EMPOWERMENT SERVICES
7 | P A G E
SECTOR: AUTO REPORTING DATE: 30TH JANUARY, 2018
ANG INDUSTRIES LTD. www.angindustries.com
𝑀𝑎𝑟𝑘𝑒𝑡 𝐶𝑎𝑝/𝐸𝐵𝐼𝑇𝐷𝐴 𝑟𝑎𝑡𝑖𝑜 =𝑀𝑎𝑟𝑘𝑒𝑡 𝐶𝑎𝑝
𝐸𝐵𝐼𝑇𝐷𝐴
Trading Volume (shares) (avg. of 1 year): Average number of shares/day traded in 1 year
Trading volume (shares) (high in 1 year): Highest number of shares/day traded in 1 year
Trading volume (shares) (minimum in 1 year): Lowest number of shares traded on any one day in 1 year
Stakeholders’ Education | Corporate Governance Research | Corporate Governance Score | Proxy Advisory
STAKEHOLDERS EMPOWERMENT SERVICES
8 | P A G E
SECTOR: AUTO REPORTING DATE: 30TH JANUARY, 2018
ANG INDUSTRIES LTD. www.angindustries.com
DISCLAIMER
Sources Company Information
Only publicly available data has been used while making the factsheet. Our data sources include: BSE, NSE, SEBI, Capitaline, Moneycontrol, Businessweek, Reuters, Annual Reports, IPO Documents and Company Website.
Analyst Certification
The analysts involved in development of this factsheet certify that no part of any of the research analyst’s compensation was, is, or will be directly or indirectly related to the contents of this factsheet.
Disclaimer
While SES has made every effort and has exercised due skill, care and diligence in compiling this factsheet based on publicly available information, it neither guarantees its accuracy, completeness or usefulness, nor assumes any liability whatsoever for any consequence from its use. This factsheet does not have any approval, express or implied, from any authority, nor is it required to have such approval. The users are strongly advised to exercise due diligence while using this factsheet. This factsheet in no manner constitutes an offer, solicitation or advice to buy or sell securities, nor solicits votes or proxies on behalf of any party. SES, which is a not-for-profit Initiative or its staff, has no financial interest in the companies covered in this factsheet except what is disclosed on its website. The factsheet is released in India and SES has ensured that it is in accordance with Indian laws. Person resident outside India shall ensure that laws in their country are not violated while using this factsheet; SES shall not be responsible for any such violation. All disputes subject to jurisdiction of High Court of Bombay, Mumbai.
SEBI Reg. No. INH000000016
This factsheet or any portion hereof may not be reprinted, sold, reproduced or redistributed without the written consent of Stakeholders Empowerment Services
Contact Information
Stakeholders Empowerment Services
A 202, Muktangan, Upper Govind Nagar,
Malad East, Mumbai – 400 097
Tel +91 22 4022 0322
www.sesgovernance.com
Research Analyst: Mukesh Solanki