Embed Size (px)
Citation preview
NREL is a national laboratory of the U.S. Department of Energy, Office of Energy Efficiency & Renewable Energy, operated by the Alliance for Sustainable Energy, LLC.
Contract No. DE-AC36-08GO28308
Staging Rankine Cycles Using Ammonia for OTEC Power Production D. Bharathan
Technical Report NREL/TP-5500-49121 March 2011
NREL is a national laboratory of the U.S. Department of Energy, Office of Energy Efficiency & Renewable Energy, operated by the Alliance for Sustainable Energy, LLC.
National Renewable Energy Laboratory 1617 Cole Boulevard Golden, Colorado 80401 303-275-3000 • www.nrel.gov
Contract No. DE-AC36-08GO28308
Staging Rankine Cycles Using Ammonia for OTEC Power Production D. Bharathan
Prepared under Task No. WA10.4010
Technical Report NREL/TP-5500-49121 March 2011
NOTICE
This report was prepared as an account of work sponsored by an agency of the United States government. Neither the United States government nor any agency thereof, nor any of their employees, makes any warranty, express or implied, or assumes any legal liability or responsibility for the accuracy, completeness, or usefulness of any information, apparatus, product, or process disclosed, or represents that its use would not infringe privately owned rights. Reference herein to any specific commercial product, process, or service by trade name, trademark, manufacturer, or otherwise does not necessarily constitute or imply its endorsement, recommendation, or favoring by the United States government or any agency thereof. The views and opinions of authors expressed herein do not necessarily state or reflect those of the United States government or any agency thereof.
Available electronically at http://www.osti.gov/bridge
Available for a processing fee to U.S. Department of Energy and its contractors, in paper, from:
U.S. Department of Energy Office of Scientific and Technical Information P.O. Box 62 Oak Ridge, TN 37831-0062 phone: 865.576.8401 fax: 865.576.5728 email: mailto:[email protected]
Available for sale to the public, in paper, from:
U.S. Department of Commerce National Technical Information Service 5285 Port Royal Road Springfield, VA 22161 phone: 800.553.6847 fax: 703.605.6900 email: [email protected] online ordering: http://www.ntis.gov/help/ordermethods.aspx
Cover Photos: (left to right) PIX 16416, PIX 17423, PIX 16560, PIX 17613, PIX 17436, PIX 17721
Printed on paper containing at least 50% wastepaper, including 10% post consumer waste.

iii
Acknowledgements
The author would like to acknowledge the support of the DOE Program Manager Alejandro Moreno of the Wind and Hydro Technologies Program of the Office of Energy Efficiency and Renewable Energy. Support by Bob Thresher and Al LiVecchi of the National Wind Technology Center of NREL is also appreciated.
iv
Table of Contents
Introduction ..................................................................................................................................... 1
Approach ......................................................................................................................................... 1
Baseline plant .............................................................................................................................. 2
Staged Power Plants .................................................................................................................... 6
Concluding remarks ...................................................................................................................... 10
References ..................................................................................................................................... 11
v
List of Figures
Figure 1 Cycle temperature-entropy (T-S) diagram for a single and two-staged Carnot cycles (not to scale) ........................................................................................................................................... 2Figure 2 Detailed flow conditions for a single-stage 10 MWe plant .............................................. 4Figure 3 Variation of net power versus ammonia circulation rate .................................................. 5Figure 4 Temperature/entropy diagram for the single-stage ammonia OTEC power plant ........... 6Figure 5 Two-stage Rankine cycle power plant showing details of the streams ............................ 7Figure 6 Variation of gross, net and parasitic powers with the number of stages .......................... 9Figure 7 Variation of heat exchanger (UA) product requirements with the number of stages ..... 10
List of Tables
Table 1 Summary of parameters for the baseline 10 MWe OTEC plant ........................................ 3Table 2 Power system summary for staged OTEC cycles .............................................................. 8
1
Introduction
Recent focus on renewable power production has renewed interest in looking into Ocean thermal energy conversion (OTEC) systems. Early studies in OTEC applicability indicate that the Island of Hawaii offers a potential market for a nominal 40-MWe system. However, a 40-MW system represents a large leap in the current state of OTEC technology with the associated risks, considering that the largest net-power producing system was tested at a power level of only 200 kWe in the 1990s [Bharathan 1990]. Smaller sized plants on the order of 1 to 2 MWe should be pursued first. Lockheed Martin Inc., under US Navy funding, is currently developing a 10-MWe system design [Lockheed 2009]. With estimated capital cost per capacity ranging from 10,000$/kWe to 15,000$/kWe [Vega 2003] or more, it is essential that the potential risks associated with the first-of-the-kind plant be minimized. Every means for cost reduction must also be pursued without adding potential risks. Considering that majority of the costs are associated with the seawater systems, maximum use of the resource water takes on a high-importance. It is with this in mind that we take on this short study to assess the potential for increasing return on the investment both in terms of effective use of the seawater and of reducing equipment costs.
Approach
Many potential thermodynamic cycles have been investigated with the aim of reducing the overall cost for OTEC. Those include the familiar Rankine cycle, the open or Claude cycle, and others, such as mist-lift cycle [Ridgeway 1980], Kalina cycle [Kalina 1984] and Uehara [Uehara 1999] cycle, among others. On account its well-established practice in the engineering community we confine our analyses to the closed Rankine cycle at this time.
With respect to the working fluid, ammonia remains the fluid of choice for OTEC closed-cycle systems, even though other fluids such as propylene and various refrigerants have been looked into in the literature. We analyze power systems that use ammonia as the working fluid. At OTEC conditions, there is considerable amount experimental data available for heat exchangers that use ammonia and seawater, both for boiling and condensation [see for example, Panchal 1981]. Studies have also addressed qualification of aluminum alloys and methods for mitigation of biofouling [Panchal 1990].
Having made these practical and less-risky choices of ammonia and Rankine cycle, options to increase power yield from the seawater resources come in the form of staging the cycles. Staging allows maximum potential extraction of heat and power from a set of given resources. Many researchers have studied staging power cycles.
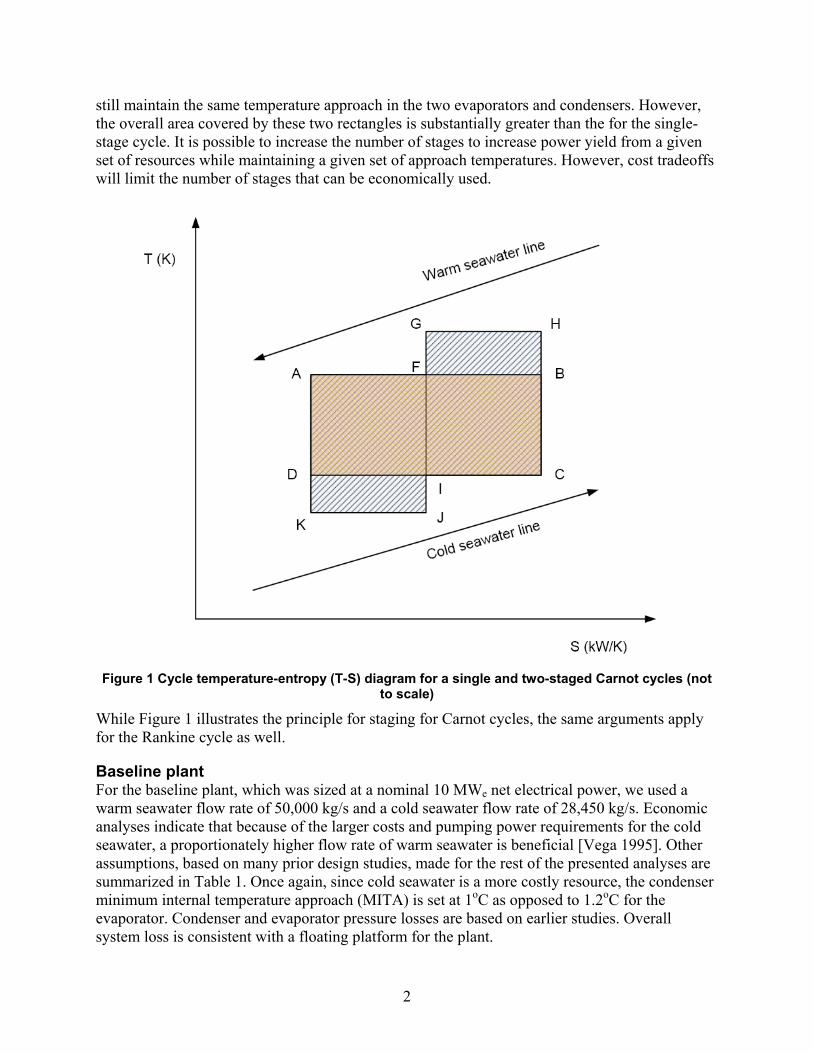
Figure 1 illustrates the nature of staging. A temperature-entropy (T-S) diagram shows both a single-stage and a two-stage Carnot cycles. Advantages of staging is best illustrated with Carnot cycles, without any loss of applicability. Both cooling and heating lines for the warm and cold seawater are indicated in this figure. The single stage working fluid state points are indicated by points ABCD. The area within this rectangle represents the amount of power that can be generated from that cycle. The temperature approach at points A and C are dictated by the minimal internal temperature approach (MITA) on the evaporator and condenser, respectively. If the cycle is staged as two separate cycles, indicated by the rectangles, AFJK and GHCI, one can
2
still maintain the same temperature approach in the two evaporators and condensers. However, the overall area covered by these two rectangles is substantially greater than the for the single-stage cycle. It is possible to increase the number of stages to increase power yield from a given set of resources while maintaining a given set of approach temperatures. However, cost tradeoffs will limit the number of stages that can be economically used.
Figure 1 Cycle temperature-entropy (T-S) diagram for a single and two-staged Carnot cycles (not to scale)
While Figure 1 illustrates the principle for staging for Carnot cycles, the same arguments apply for the Rankine cycle as well.
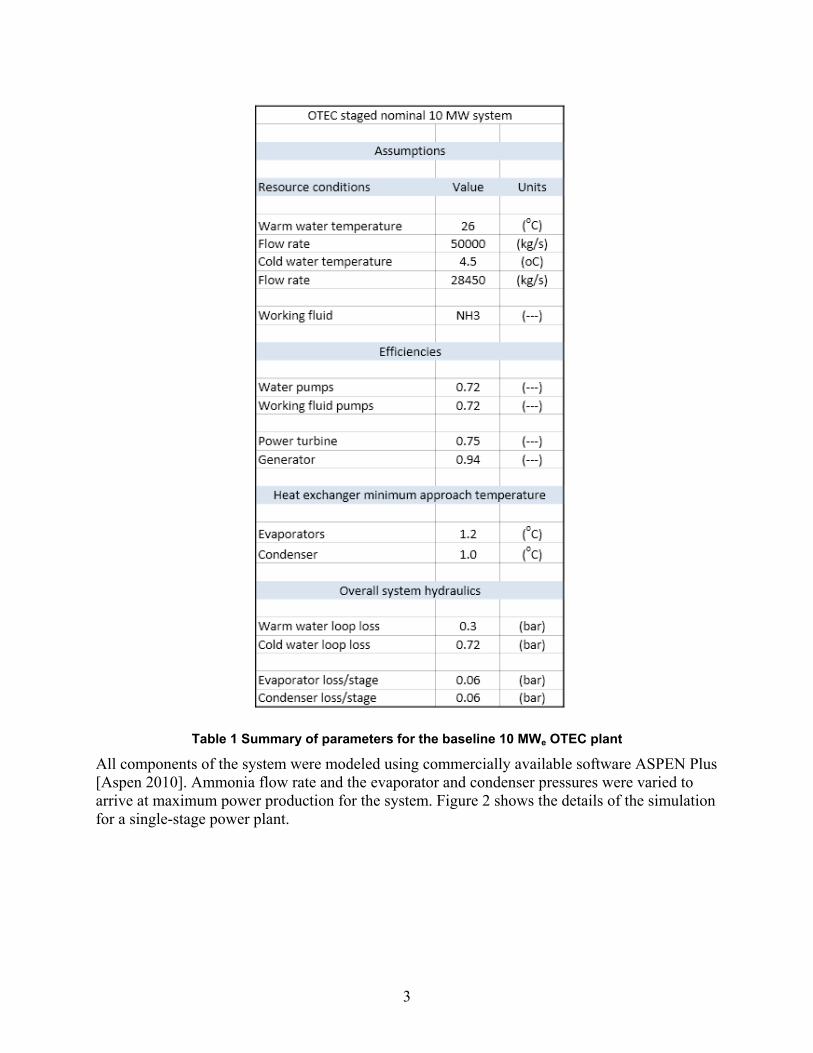
Baseline plant For the baseline plant, which was sized at a nominal 10 MWe net electrical power, we used a warm seawater flow rate of 50,000 kg/s and a cold seawater flow rate of 28,450 kg/s. Economic analyses indicate that because of the larger costs and pumping power requirements for the cold seawater, a proportionately higher flow rate of warm seawater is beneficial [Vega 1995]. Other assumptions, based on many prior design studies, made for the rest of the presented analyses are summarized in Table 1. Once again, since cold seawater is a more costly resource, the condenser minimum internal temperature approach (MITA) is set at 1oC as opposed to 1.2oC for the evaporator. Condenser and evaporator pressure losses are based on earlier studies. Overall system loss is consistent with a floating platform for the plant.
3
Table 1 Summary of parameters for the baseline 10 MWe OTEC plant
All components of the system were modeled using commercially available software ASPEN Plus [Aspen 2010]. Ammonia flow rate and the evaporator and condenser pressures were varied to arrive at maximum power production for the system. Figure 2 shows the details of the simulation for a single-stage power plant.
4
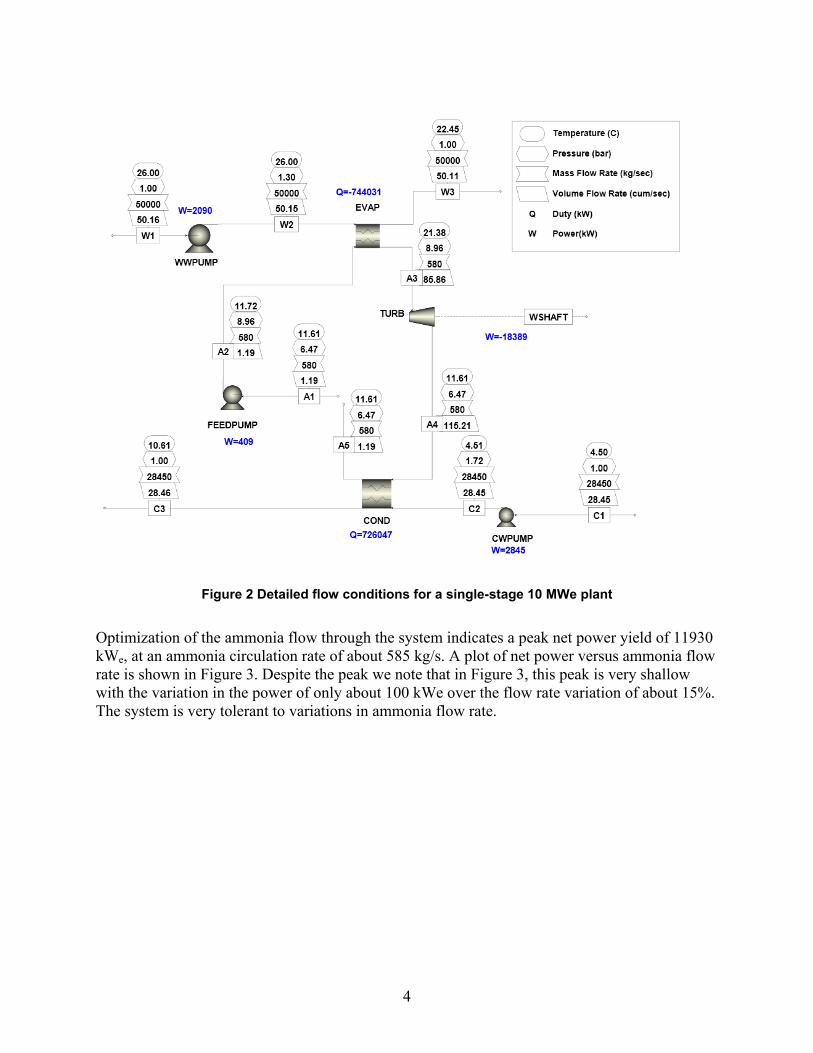
Figure 2 Detailed flow conditions for a single-stage 10 MWe plant
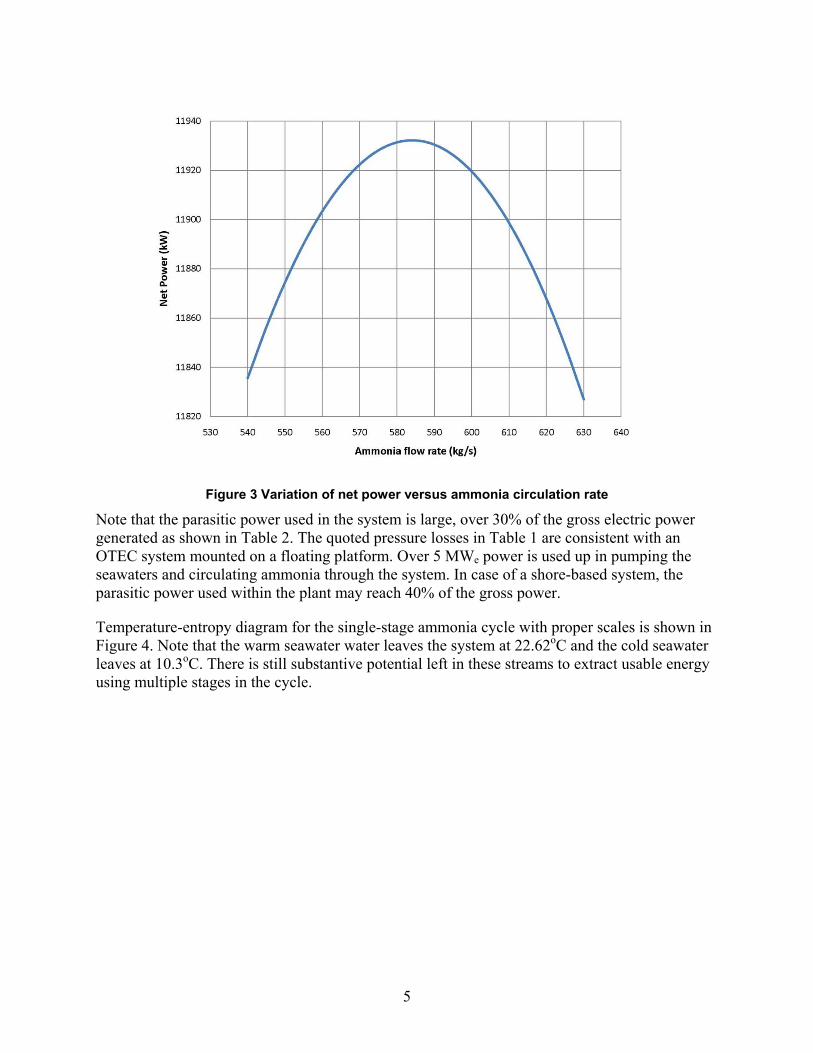
Optimization of the ammonia flow through the system indicates a peak net power yield of 11930 kWe, at an ammonia circulation rate of about 585 kg/s. A plot of net power versus ammonia flow rate is shown in Figure 3. Despite the peak we note that in Figure 3, this peak is very shallow with the variation in the power of only about 100 kWe over the flow rate variation of about 15%. The system is very tolerant to variations in ammonia flow rate.
5
Figure 3 Variation of net power versus ammonia circulation rate
Note that the parasitic power used in the system is large, over 30% of the gross electric power generated as shown in Table 2. The quoted pressure losses in Table 1 are consistent with an OTEC system mounted on a floating platform. Over 5 MWe power is used up in pumping the seawaters and circulating ammonia through the system. In case of a shore-based system, the parasitic power used within the plant may reach 40% of the gross power.
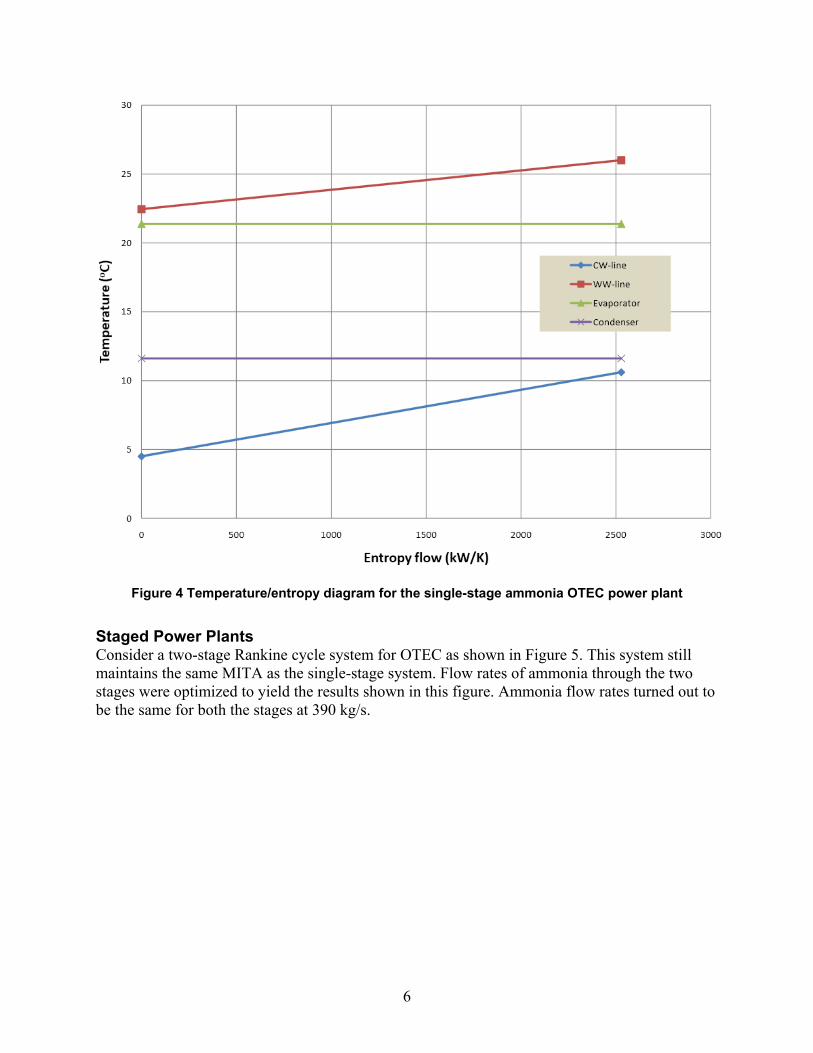
Temperature-entropy diagram for the single-stage ammonia cycle with proper scales is shown in Figure 4. Note that the warm seawater water leaves the system at 22.62oC and the cold seawater leaves at 10.3oC. There is still substantive potential left in these streams to extract usable energy using multiple stages in the cycle.
6
Figure 4 Temperature/entropy diagram for the single-stage ammonia OTEC power plant
Staged Power Plants Consider a two-stage Rankine cycle system for OTEC as shown in Figure 5. This system still maintains the same MITA as the single-stage system. Flow rates of ammonia through the two stages were optimized to yield the results shown in this figure. Ammonia flow rates turned out to be the same for both the stages at 390 kg/s.
7
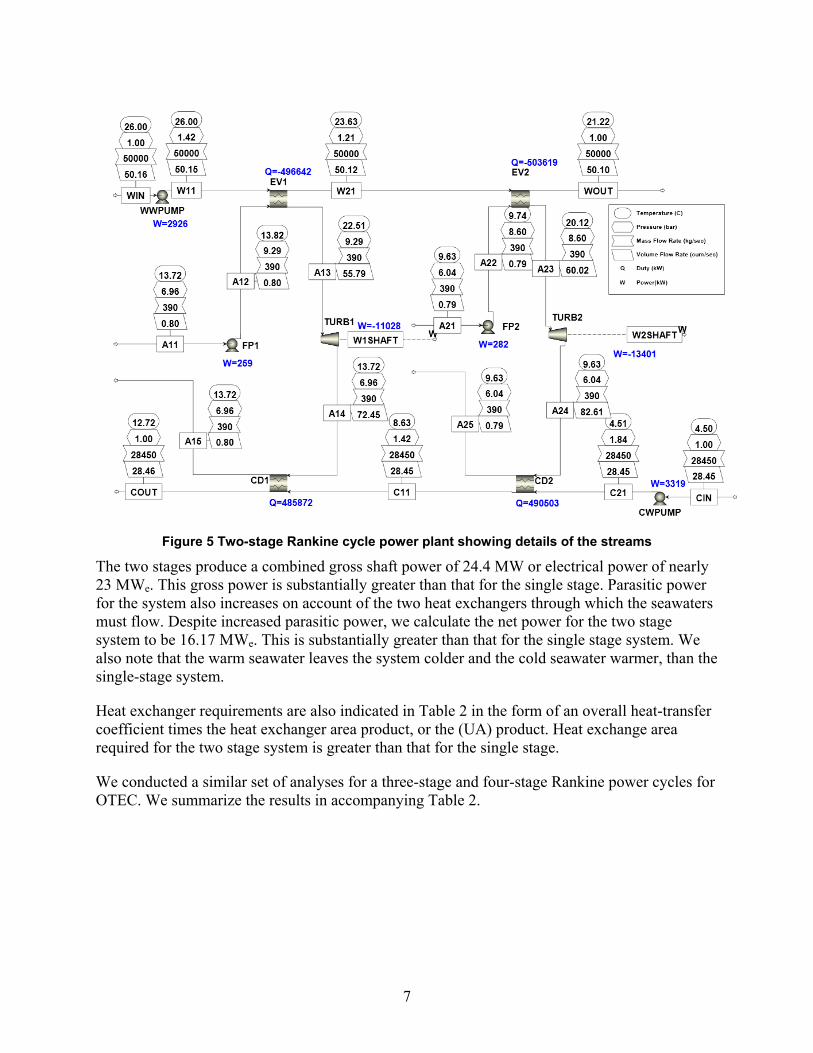
Figure 5 Two-stage Rankine cycle power plant showing details of the streams
The two stages produce a combined gross shaft power of 24.4 MW or electrical power of nearly 23 MWe. This gross power is substantially greater than that for the single stage. Parasitic power for the system also increases on account of the two heat exchangers through which the seawaters must flow. Despite increased parasitic power, we calculate the net power for the two stage system to be 16.17 MWe. This is substantially greater than that for the single stage system. We also note that the warm seawater leaves the system colder and the cold seawater warmer, than the single-stage system.
Heat exchanger requirements are also indicated in Table 2 in the form of an overall heat-transfer coefficient times the heat exchanger area product, or the (UA) product. Heat exchange area required for the two stage system is greater than that for the single stage.
We conducted a similar set of analyses for a three-stage and four-stage Rankine power cycles for OTEC. We summarize the results in accompanying Table 2.
8
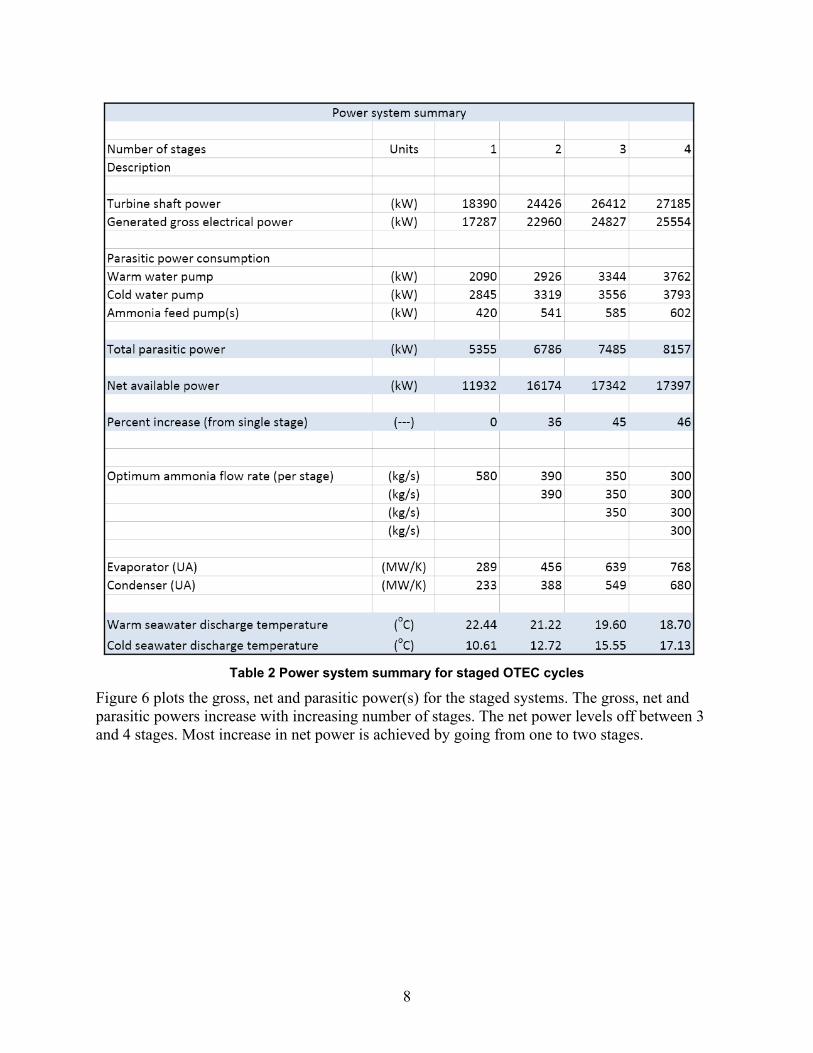
Table 2 Power system summary for staged OTEC cycles
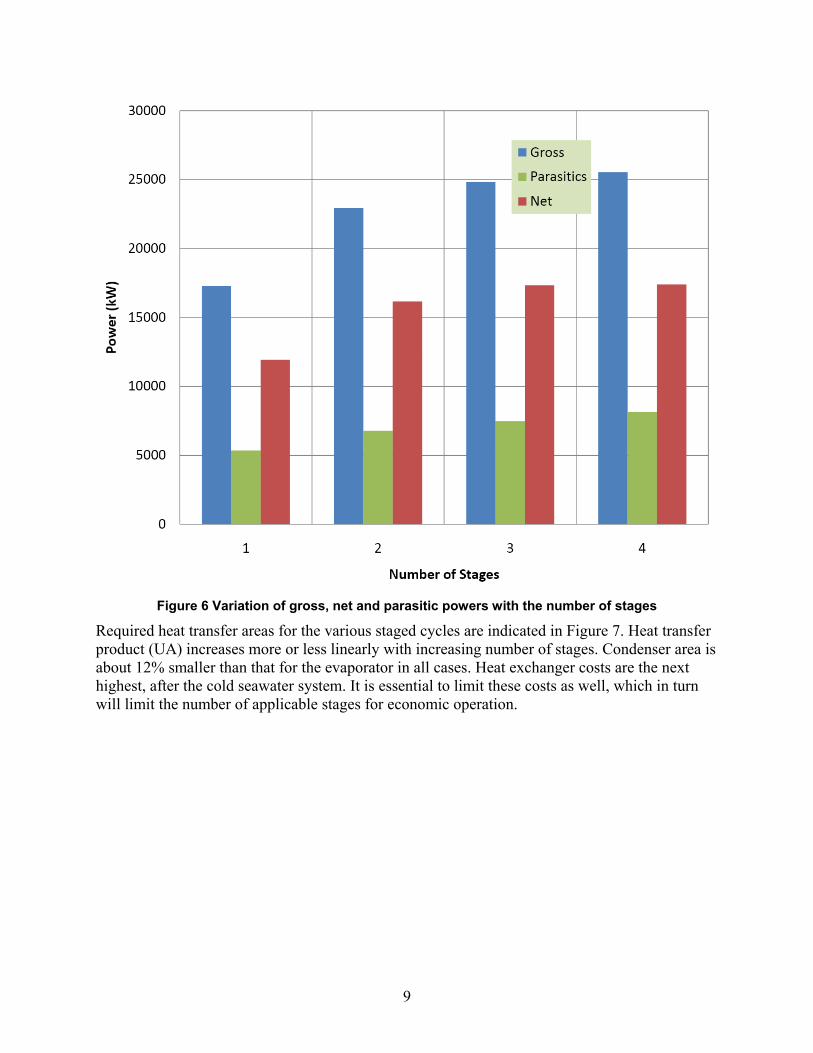
Figure 6 plots the gross, net and parasitic power(s) for the staged systems. The gross, net and parasitic powers increase with increasing number of stages. The net power levels off between 3 and 4 stages. Most increase in net power is achieved by going from one to two stages.
9
Figure 6 Variation of gross, net and parasitic powers with the number of stages
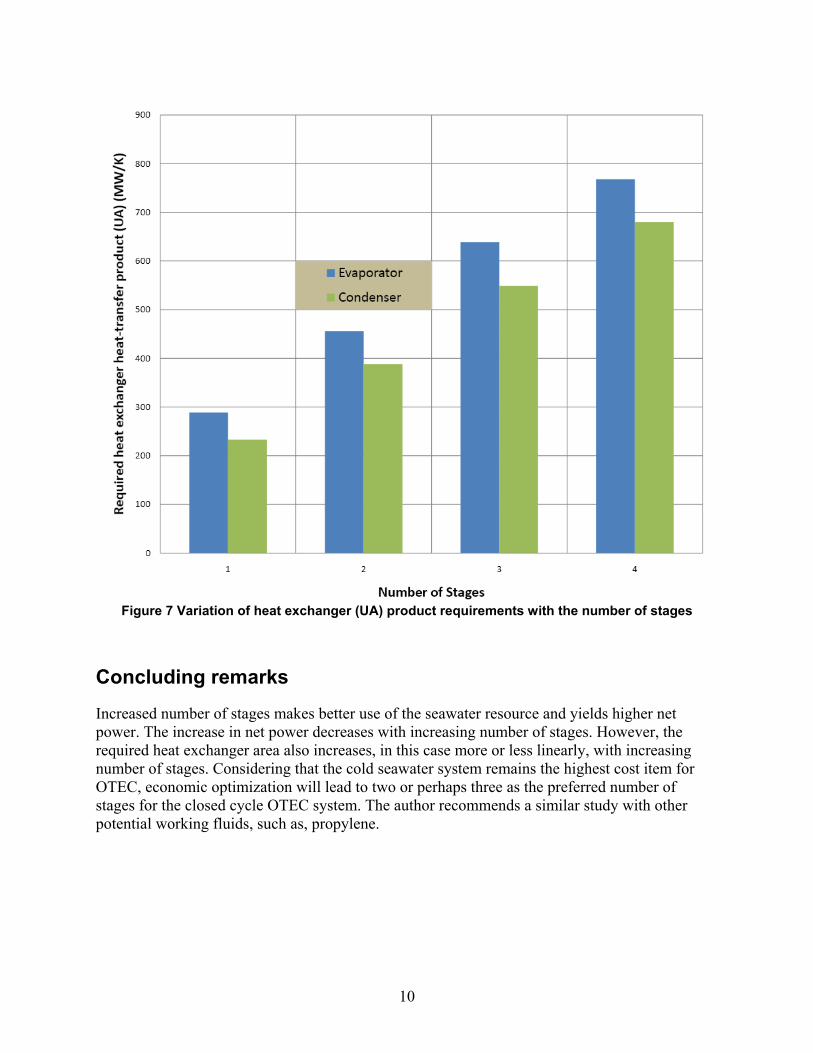
Required heat transfer areas for the various staged cycles are indicated in Figure 7. Heat transfer product (UA) increases more or less linearly with increasing number of stages. Condenser area is about 12% smaller than that for the evaporator in all cases. Heat exchanger costs are the next highest, after the cold seawater system. It is essential to limit these costs as well, which in turn will limit the number of applicable stages for economic operation.
10
Figure 7 Variation of heat exchanger (UA) product requirements with the number of stages
Concluding remarks
Increased number of stages makes better use of the seawater resource and yields higher net power. The increase in net power decreases with increasing number of stages. However, the required heat exchanger area also increases, in this case more or less linearly, with increasing number of stages. Considering that the cold seawater system remains the highest cost item for OTEC, economic optimization will lead to two or perhaps three as the preferred number of stages for the closed cycle OTEC system. The author recommends a similar study with other potential working fluids, such as, propylene.
11
References
[Bharathan 1990] Bharathan, D., H.J. Green, H.F. Link, B.K. Parsons, J.M. Parsons, and F. Zangrando, "Conceptual Design of an Open-Cycle Ocean Thermal Energy Conversion Net Power Producing Experiment," Solar Energy Research Institute, SERI/TR-253-3616.
[Kalina 1984] Kalina, A.L., “Combined cycle system with novel bottoming cycle,” ASME J. of Engineering for Power, October, pp 737-742.
[Lockheed 2009] www.lockheedmartin.com/products/OTEC/index.html
[Panchal 1981] Panchal, C. B., D. L. Hillis, J. J. Lorenz, D. T. Young," OTEC Performance Tests of the Trane Plate-Fin Heat Exchanger," Argonne National Laboratory Report, ANL/OTEC-PS-8, April,1981.
[Panchal 1990] Panchal, C.B., H. Stevens, L. Genens, A. Thomas, C. Clark, D. Sasscer, F. Yaggee, J. Darby, J.Larsen-Basse, B. Liebert, L. Berger, A. Bhargava, and B. Lee, "OTEC Biofouling and Corrosion Study at the Natural Energy Laboratory of Hawaii," Argonne National Laboratory Report, ANL/ESD-10, Oct. 1990.
[Ridgeway 1980] Ridgeway, S.L., Mist flow ocean thermal energy process, U.S Patent 4, 216,657.
[Uehara 1999] Uehera, H, et. al., “The experimental research on ocean therma energy conversion using the Uehara cycle,” Proc. of the International OTEC/DOWA conference, Imari, Japan, pp 132-141.
[Vega 1995] Vega, L.A., “Ocean thermal energy conversion,” Encyclopedia of Energy Technology and the Environment, Jon Wiley & Sons, Inc., New York, NY, pp 2104-2119.
[Vega 2009] Vega, L.A., OTEC Technology Status: Summary Outline,” presented at the NOAA workshop on Ocean Energy, held at Univ. of New Hampshire, November.
F1147-E(10/2008)
REPORT DOCUMENTATION PAGE Form Approved OMB No. 0704-0188
The public reporting burden for this collection of information is estimated to average 1 hour per response, including the time for reviewing instructions, searching existing data sources, gathering and maintaining the data needed, and completing and reviewing the collection of information. Send comments regarding this burden estimate or any other aspect of this collection of information, including suggestions for reducing the burden, to Department of Defense, Executive Services and Communications Directorate (0704-0188). Respondents should be aware that notwithstanding any other provision of law, no person shall be subject to any penalty for failing to comply with a collection of information if it does not display a currently valid OMB control number. PLEASE DO NOT RETURN YOUR FORM TO THE ABOVE ORGANIZATION. 1. REPORT DATE (MM-YYYY)
March 2011 2. REPORT TYPE
Technical paper 3. DATES COVERED (From - To)
4. TITLE AND SUBTITLE
Staging Rankine Cycles Using Ammonia for OTEC Power Production
5a. CONTRACT NUMBER DE-AC36-08GO28308
5b. GRANT NUMBER
5c. PROGRAM ELEMENT NUMBER
6. AUTHOR(S) D. Bharathan
5d. PROJECT NUMBER NREL/TP-5500-49121
5e. TASK NUMBER WA093030
5f. WORK UNIT NUMBER
7. PERFORMING ORGANIZATION NAME(S) AND ADDRESS(ES) National Renewable Energy Laboratory 1617 Cole Blvd. Golden, CO 80401-3393
8. PERFORMING ORGANIZATION REPORT NUMBER NREL/TP-5500-49121
9. SPONSORING/MONITORING AGENCY NAME(S) AND ADDRESS(ES)
10. SPONSOR/MONITOR'S ACRONYM(S) NREL
11. SPONSORING/MONITORING AGENCY REPORT NUMBER
12. DISTRIBUTION AVAILABILITY STATEMENT National Technical Information Service U.S. Department of Commerce 5285 Port Royal Road Springfield, VA 22161
13. SUPPLEMENTARY NOTES
14. ABSTRACT (Maximum 200 Words) Recent focus on renewable power production has renewed interest in looking into ocean thermal energy conversion (OTEC) systems. Early studies in OTEC applicability indicate that the island of Hawaii offers a potential market for a nominal 40-MWe system. A 40-MWe system represents a large leap in the current state of OTEC technology. Lockheed Martin Inc. is currently pursuing a more realistic goal of developing a 10-MWe system under U.S. Navy funding (Lockheed 2009). It is essential that the potential risks associated with the first-of-its-kind plant should be minimized for the project's success. Every means for reducing costs must also be pursued without increasing risks. With this in mind, the potential for increasing return on the investment is assessed both in terms of effective use of the seawater resource and of reducing equipment costs.
15. SUBJECT TERMS Ocean thermal energy; staged cycles; rankine cycle; OTEC, ammonia
16. SECURITY CLASSIFICATION OF: 17. LIMITATION OF ABSTRACT
UL
18. NUMBER OF PAGES
19a. NAME OF RESPONSIBLE PERSON a. REPORT
Unclassified b. ABSTRACT Unclassified
c. THIS PAGE Unclassified 19b. TELEPHONE NUMBER (Include area code)
Standard Form 298 (Rev. 8/98) Prescribed by ANSI Std. Z39.18