Embed Size (px)
Citation preview

OTEC Economics
Luis A. Vega, Ph.D.Technical Director
Offshore Infrastructure Asso.
August 22, 2007

Full Disclosure: I am virtuous and my actions threaten our way of life
Energy conservation is just "a sign of personal virtue" and relying on renewables would threaten "our way of life."Vice President Cheney, April 2001
OTEC Economics 3
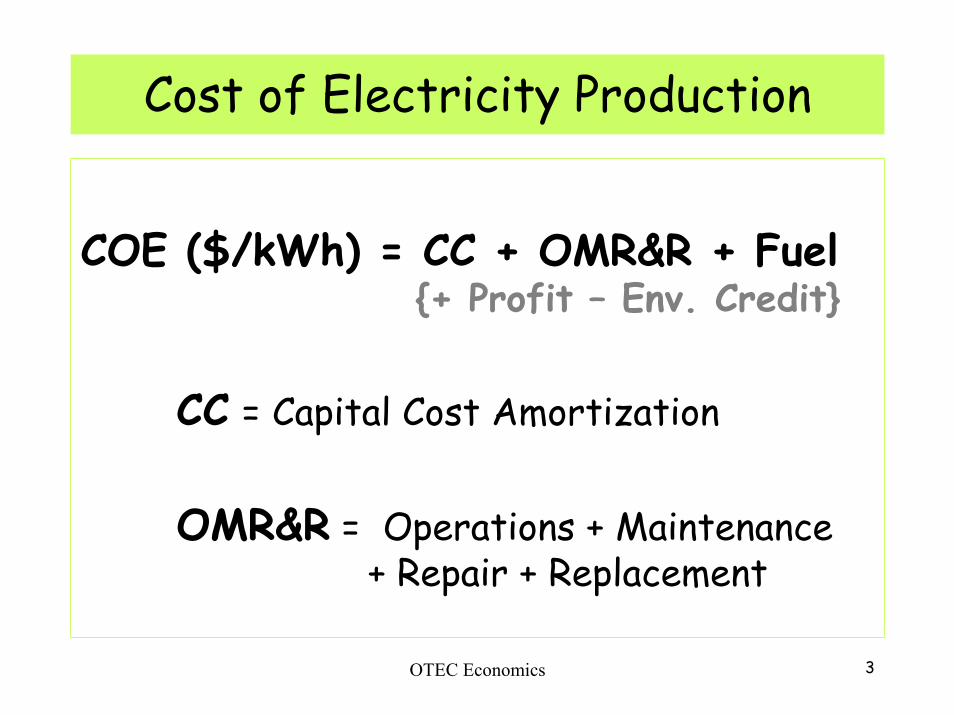
Cost of Electricity Production
COE ($/kWh) = CC + OMR&R + Fuel{+ Profit – Env. Credit}
CC = Capital Cost Amortization
OMR&R = Operations + Maintenance + Repair + Replacement
OTEC Economics 4
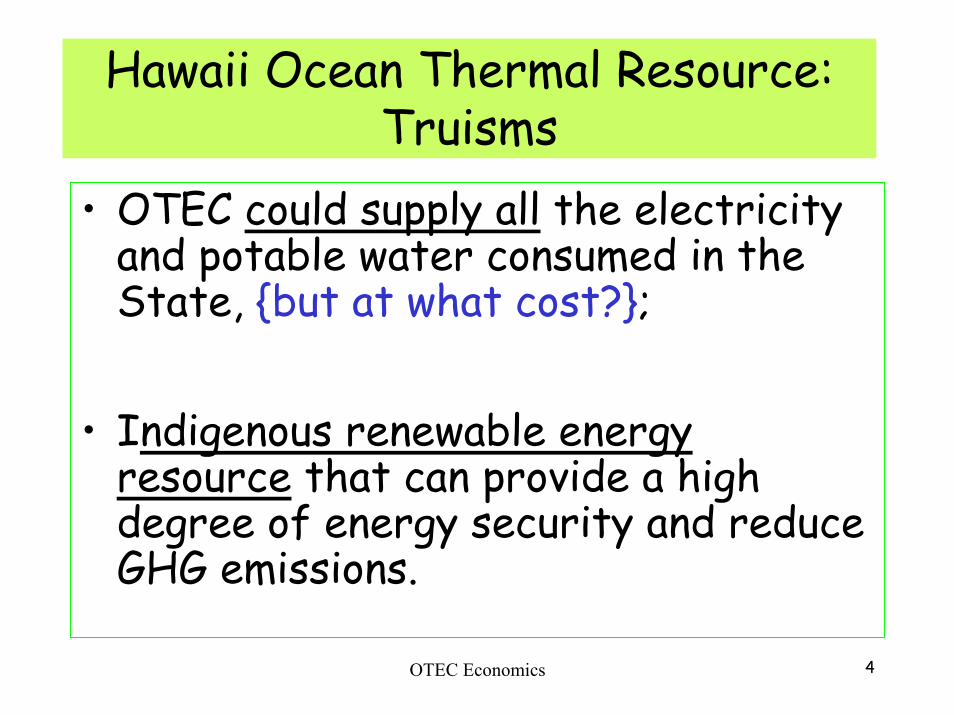
Hawaii Ocean Thermal Resource: Truisms
• OTEC could supply all the electricity and potable water consumed in the State, {but at what cost?};
• Indigenous renewable energy resource that can provide a high degree of energy security and reduce GHG emissions.
OTEC Economics 5
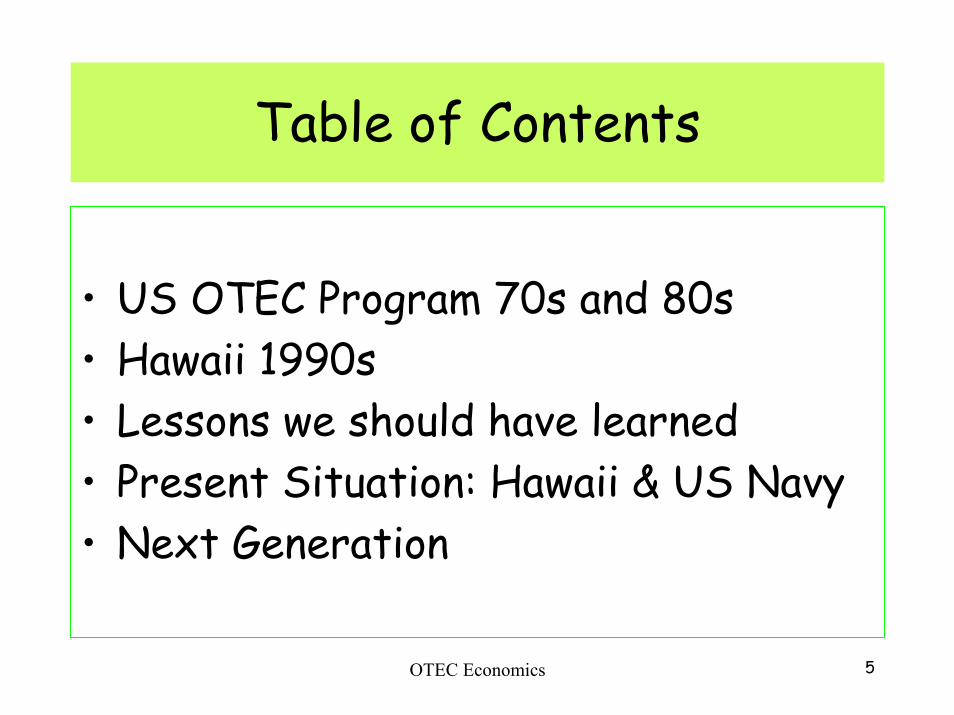
Table of Contents
• US OTEC Program 70s and 80s• Hawaii 1990s• Lessons we should have learned• Present Situation: Hawaii & US Navy• Next Generation
OTEC Economics 6
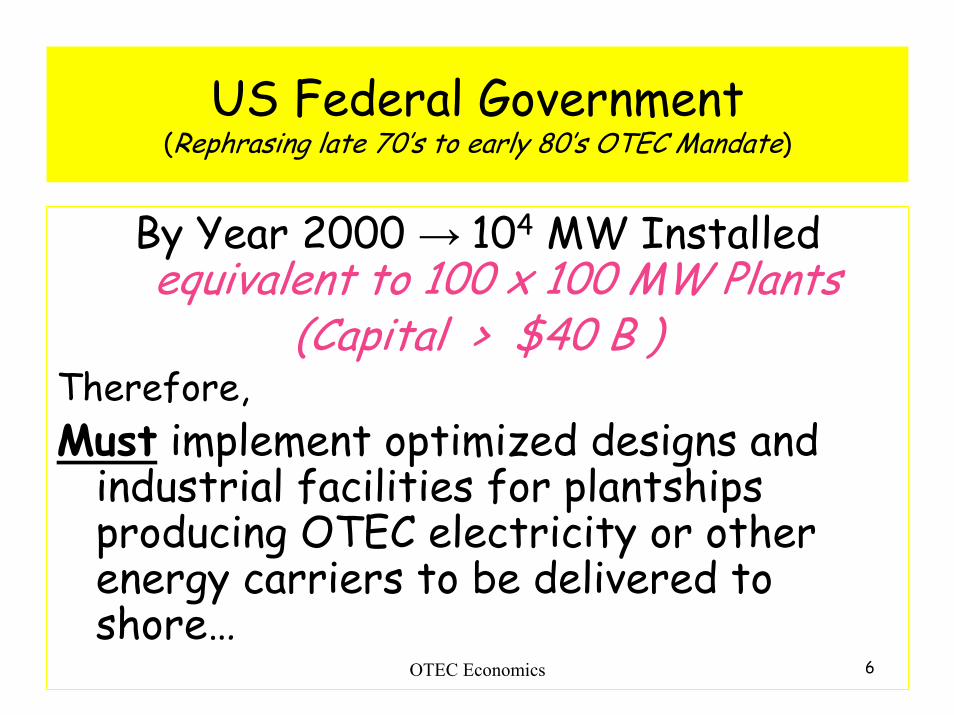
US Federal Government (Rephrasing late 70’s to early 80’s OTEC Mandate)
By Year 2000 → 104 MW Installedequivalent to 100 x 100 MW Plants
(Capital > $40 B )Therefore,Must implement optimized designs and
industrial facilities for plantshipsproducing OTEC electricity or other energy carriers to be delivered to shore…
US Federal Government OTEC Program (70’s –80’s)
Hindsight →should have used funds ($0.25 B) to build at least one “large” plant with off-the-shelve hardware…

OTEC Economics 8
OTEC in Hawaii 1990’s
OTEC Economics 9
OTEC Assessment (‘90s)
Continuous (24/7) production of electricity and water demonstrated:
- MiniOTEC - Nauru- OC-OTEC Experimental Apparatus
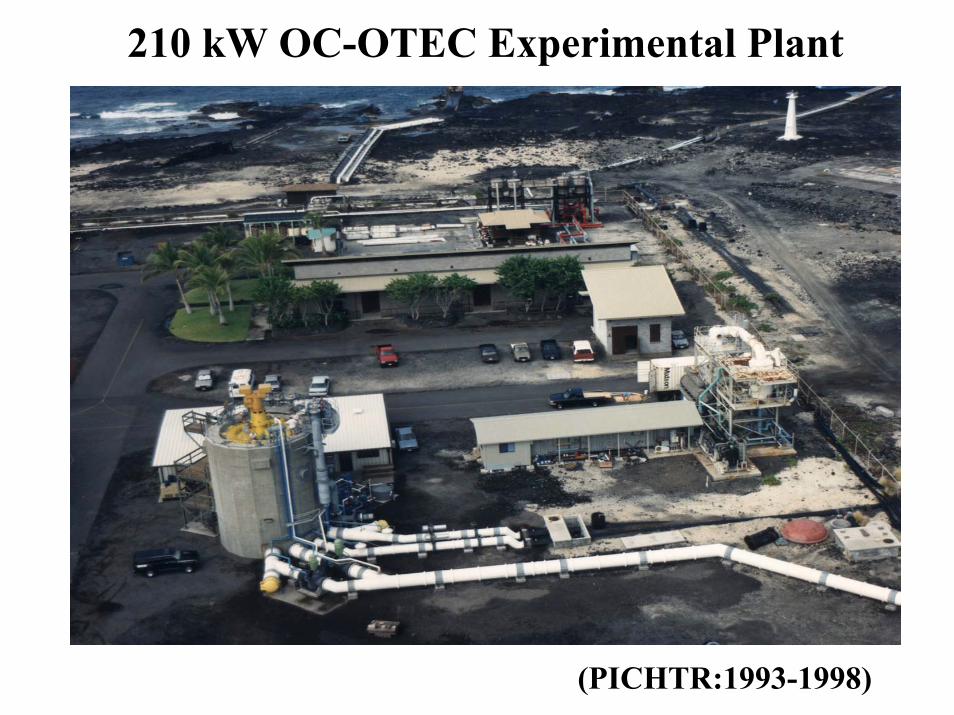
210 kW OC-OTEC Experimental Plant
(PICHTR:1993-1998)

Desalinated Water
Production
(PICHTR:
‘94-’98)
OTEC Economics 12
OTEC Assessment (‘90s)
• Should build a pre-commercial plantto establish the operational record required to secure financing for commercial size plants;
• Pre-commercial plant would produce relatively high cost products such that government support funding was required.
OTEC Economics 13
OTEC Assessment (90’s)
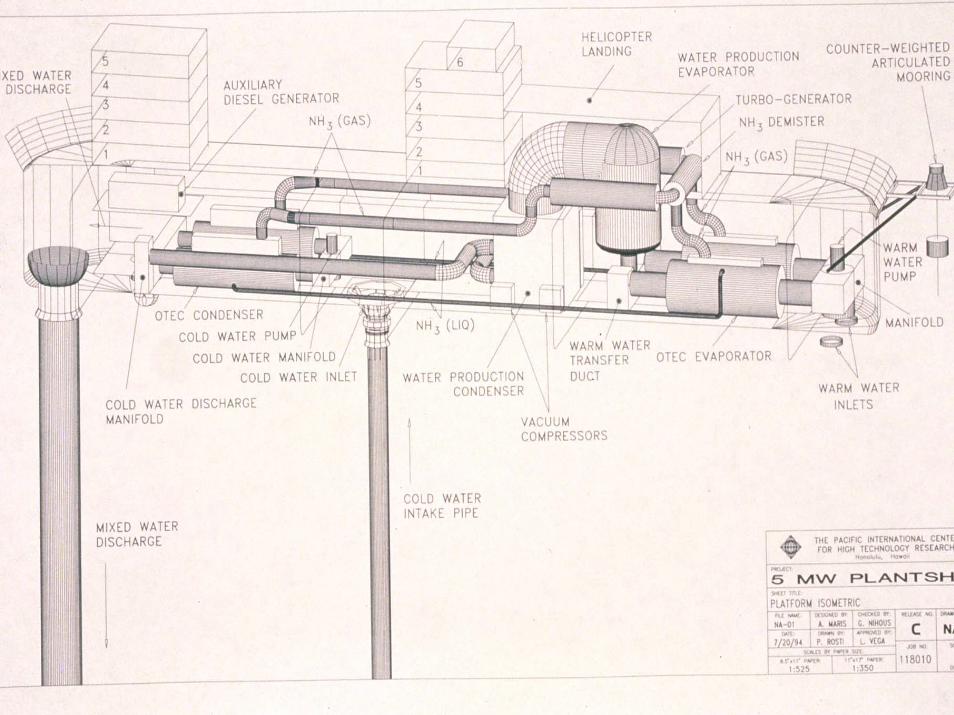
• In mid 90s PICHTR designed a 5 MW pre-commercial plant;
• Petroleum fuels price was relatively low and government funding for the pre-commercial plant could not be obtained.
OTEC Economics 14
OTEC Economics 15
Lessons Learned
• Life-Cycle Design
• Constructability
• System Integration
• Capital Cost
OTEC Economics 16
Lessons Learned
Life-Cycle Design (cradle to grave)
e.g., locating a component in the water column yields higher efficiencies but result in elaborate maintenance requirements and higher operational costs

OTEC Economics 17
Lessons Learned
Constructability
Can equipment be manufactured using commercially available practices and in existing factories?
OTEC Economics 18
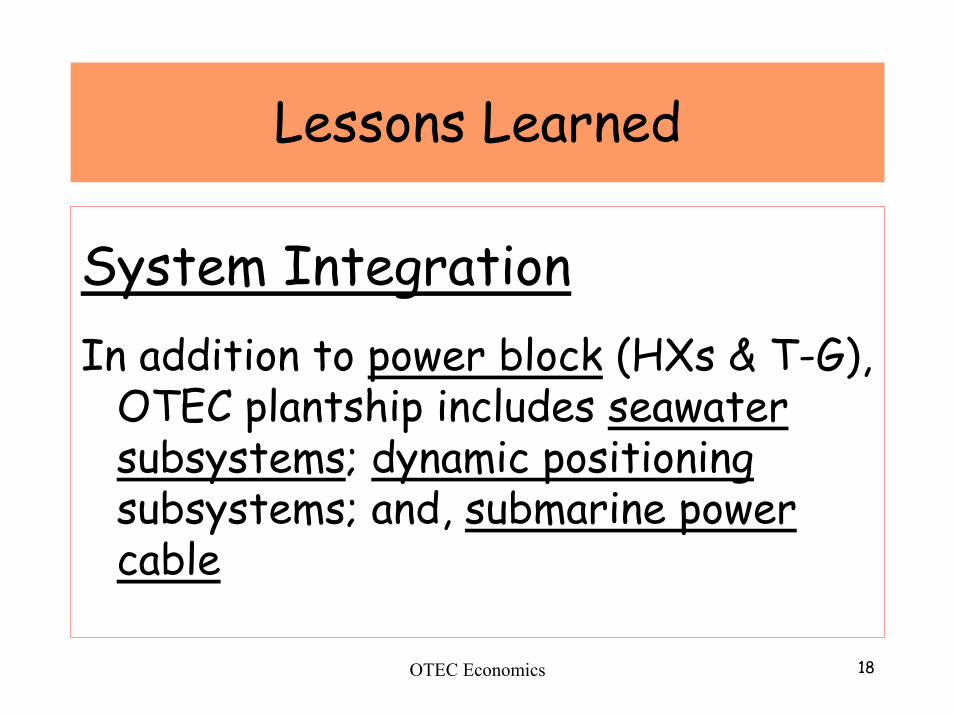
Lessons Learned
System IntegrationIn addition to power block (HXs & T-G),
OTEC plantship includes seawater subsystems; dynamic positioningsubsystems; and, submarine power cable
OTEC Economics 19
Capital Cost: Strong Function of Plant Size
OTEC Economics 20
Economic feasibility: under specific (fuel-and-water-costs)
scenarios
OTEC Economics 21
Present Situation (2007)
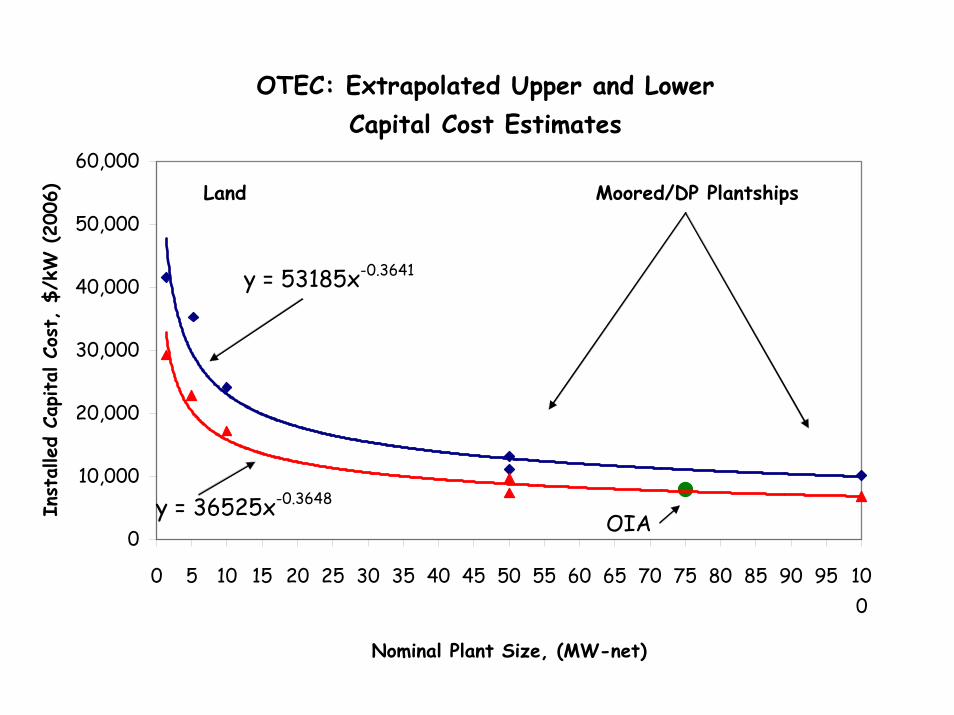
OTEC: Extrapolated Upper and Lower Capital Cost Estimates
y = 53185x-0.3641
y = 36525x-0.3648
0
10,000
20,000
30,000
40,000
50,000
60,000
0 5 10 15 20 25 30 35 40 45 50 55 60 65 70 75 80 85 90 95 100
Nominal Plant Size, (MW-net)
Inst
alled
Capita
l Co
st,
$/kW
(20
06)
OIA
Land Moored/DP Plantships
OTEC Economics 23
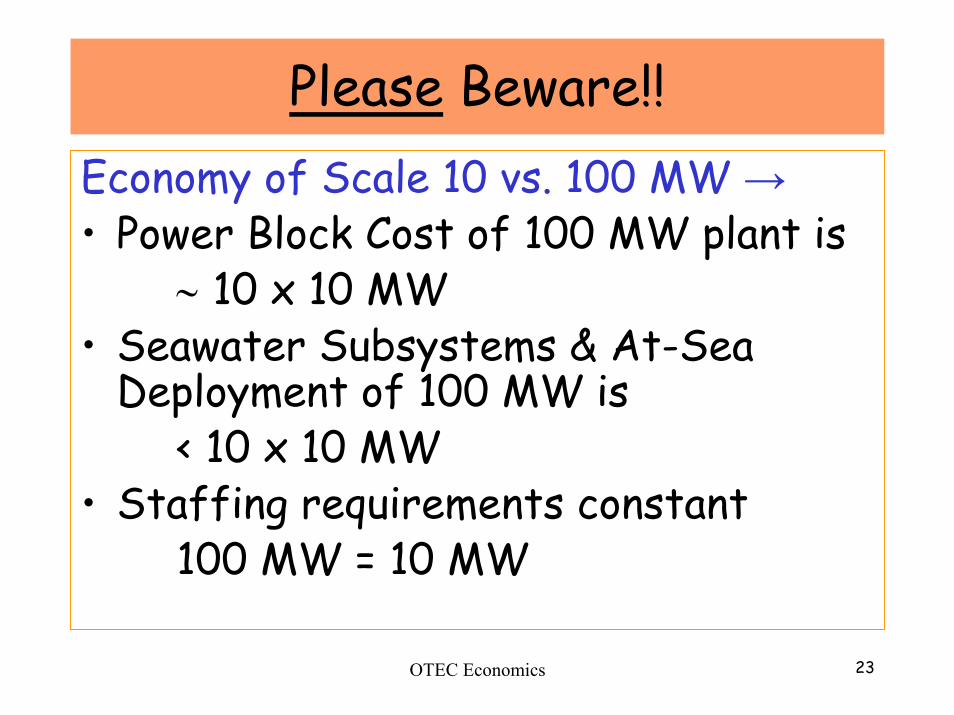
Please Beware!!Economy of Scale 10 vs. 100 MW →• Power Block Cost of 100 MW plant is
∼ 10 x 10 MW• Seawater Subsystems & At-Sea
Deployment of 100 MW is < 10 x 10 MW
• Staffing requirements constant 100 MW = 10 MW
OTEC Economics 24
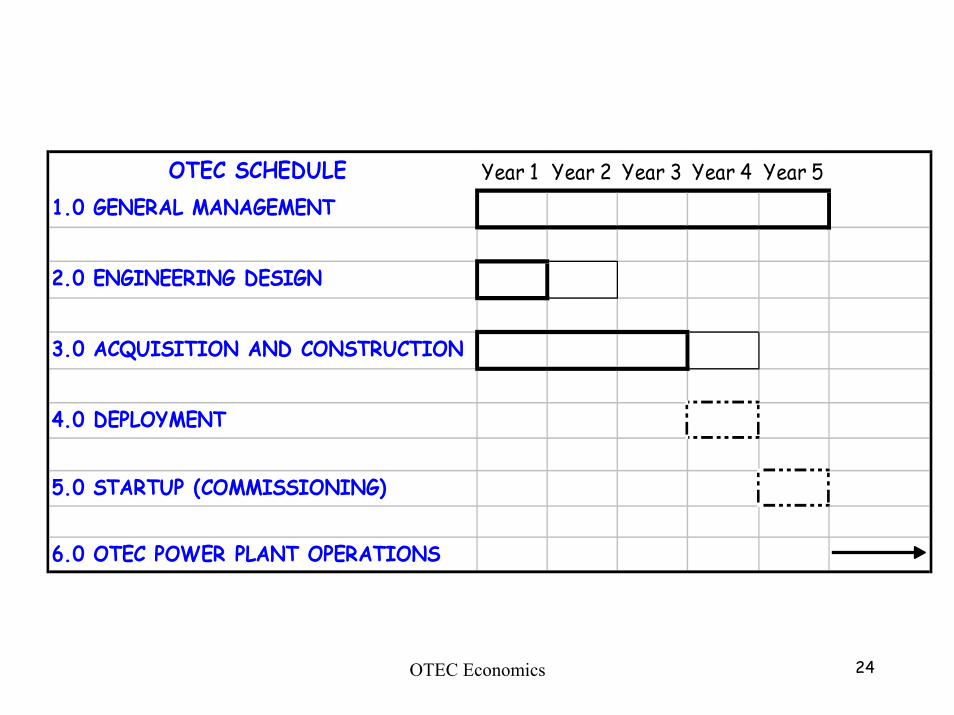
OTEC SCHEDULE Year 1 Year 2 Year 3 Year 4 Year 51.0 GENERAL MANAGEMENT
2.0 ENGINEERING DESIGN
3.0 ACQUISITION AND CONSTRUCTION
4.0 DEPLOYMENT
5.0 STARTUP (COMMISSIONING)
6.0 OTEC POWER PLANT OPERATIONS
OTEC Economics 25
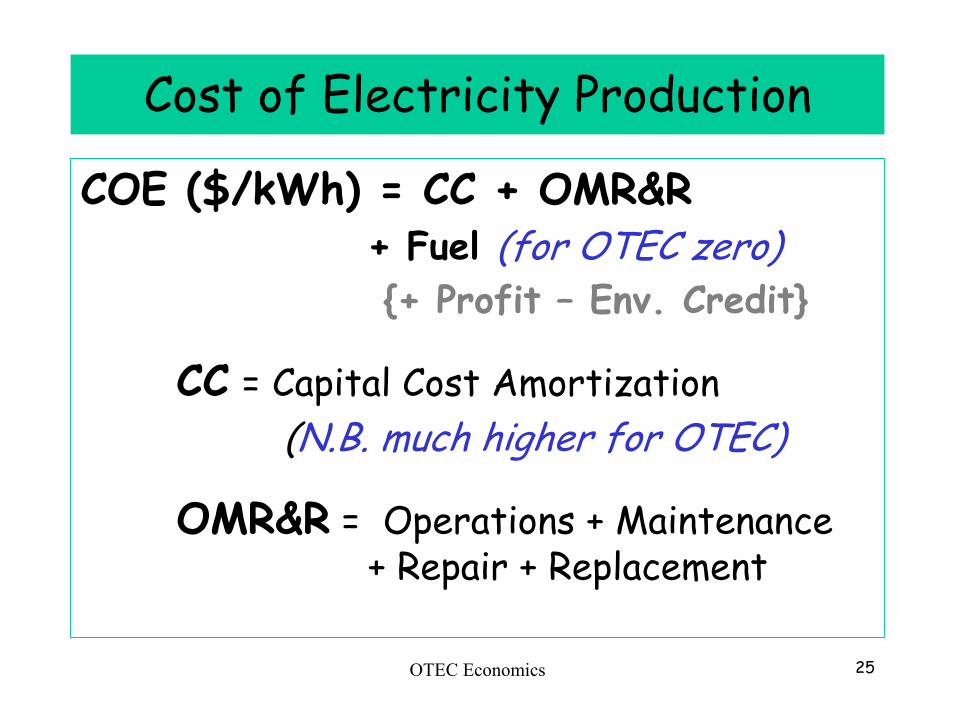
Cost of Electricity Production
COE ($/kWh) = CC + OMR&R+ Fuel (for OTEC zero){+ Profit – Env. Credit}
CC = Capital Cost Amortization(N.B. much higher for OTEC)
OMR&R = Operations + Maintenance + Repair + Replacement
OTEC Economics 26
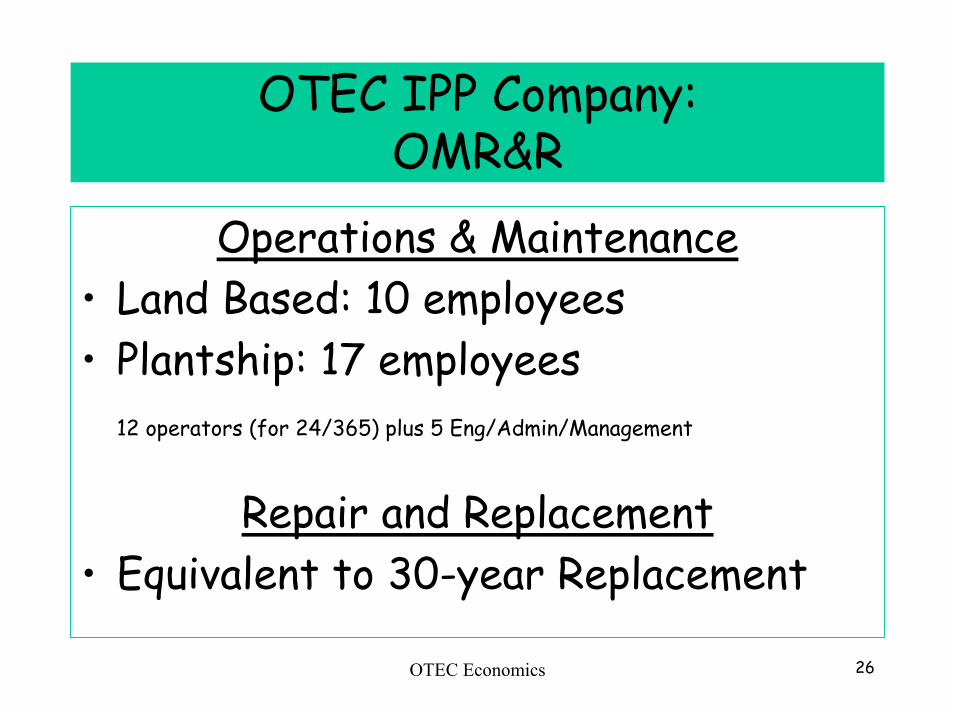
OTEC IPP Company:OMR&R
Operations & Maintenance• Land Based: 10 employees• Plantship: 17 employees
12 operators (for 24/365) plus 5 Eng/Admin/Management
Repair and Replacement• Equivalent to 30-year Replacement
OTEC Economics 27
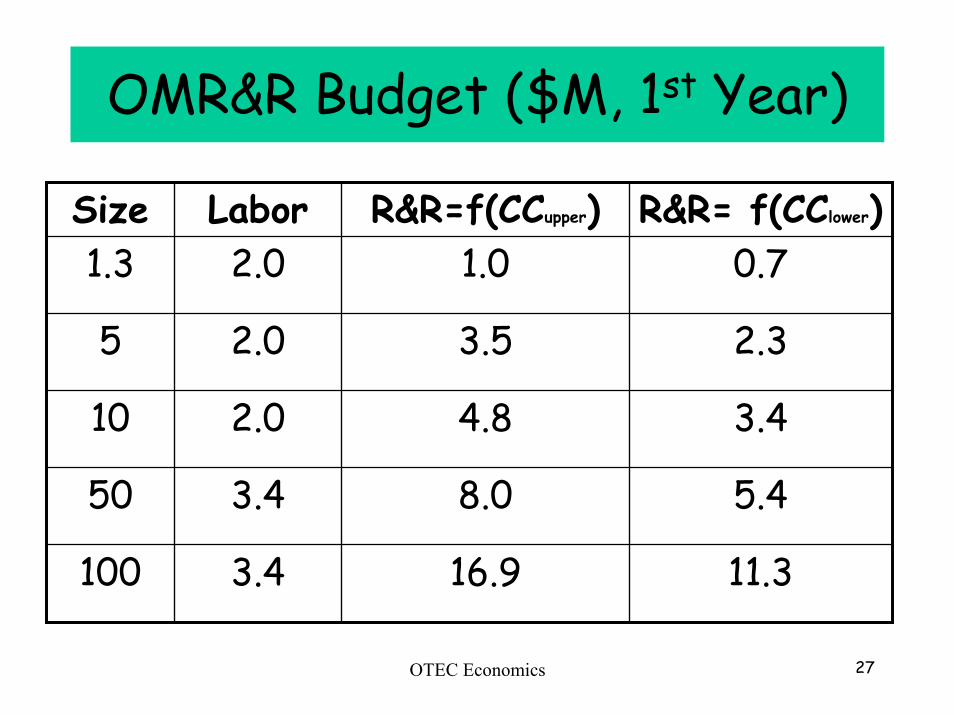
OMR&R Budget ($M, 1st Year)
11.316.93.4100
5.48.03.450
3.44.82.010
2.33.52.05
0.71.02.01.3R&R= f(CClower)R&R=f(CCupper)LaborSize
OTEC Economics 28
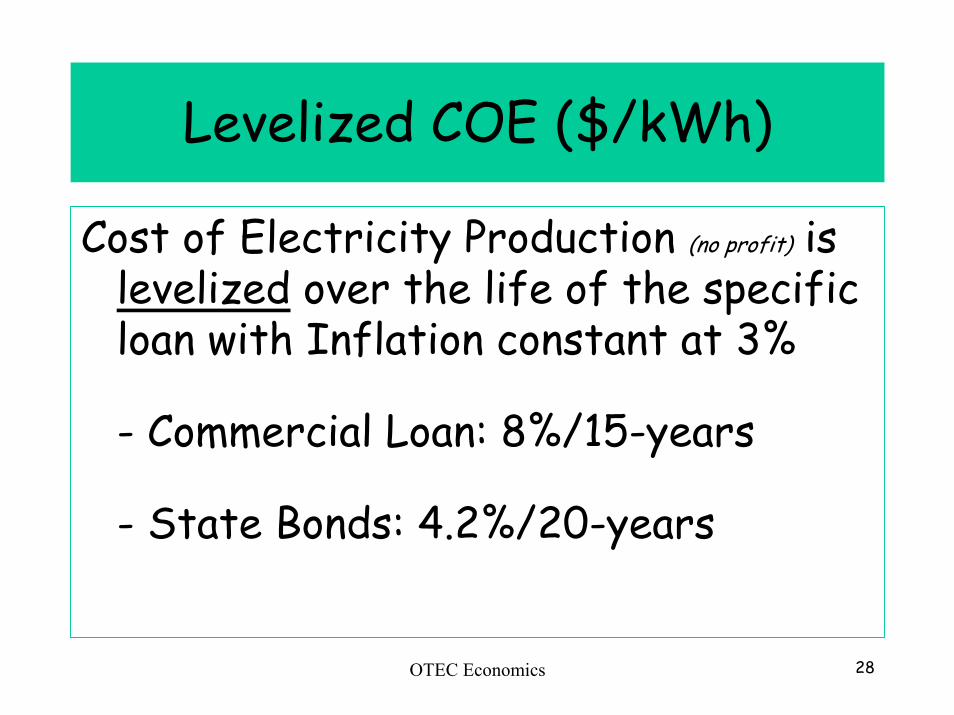
Levelized COE ($/kWh)
Cost of Electricity Production (no profit) is levelized over the life of the specific loan with Inflation constant at 3%
- Commercial Loan: 8%/15-years
- State Bonds: 4.2%/20-years
OTEC Economics 29
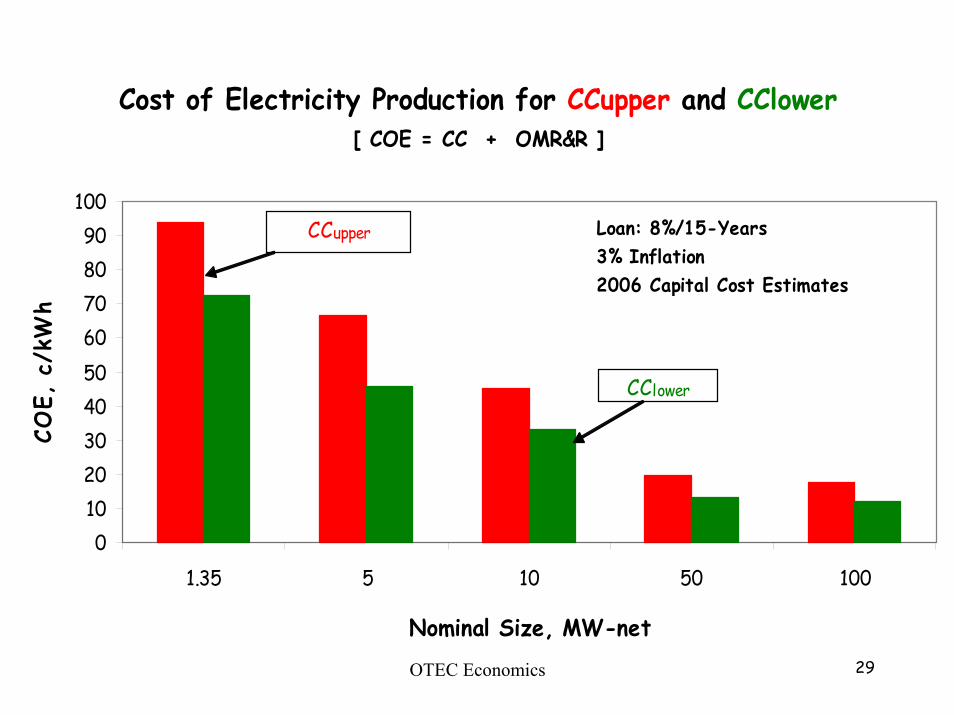
Cost of Electricity Production for CCupper and CClower[ COE = CC + OMR&R ]
0102030405060708090
100
1.35 5 10 50 100
Nominal Size, MW-net
COE,
c/k
Wh
Loan: 8%/15-Years 3% Inflation2006 Capital Cost Estimates
CClower
CCupper
OTEC Economics 30
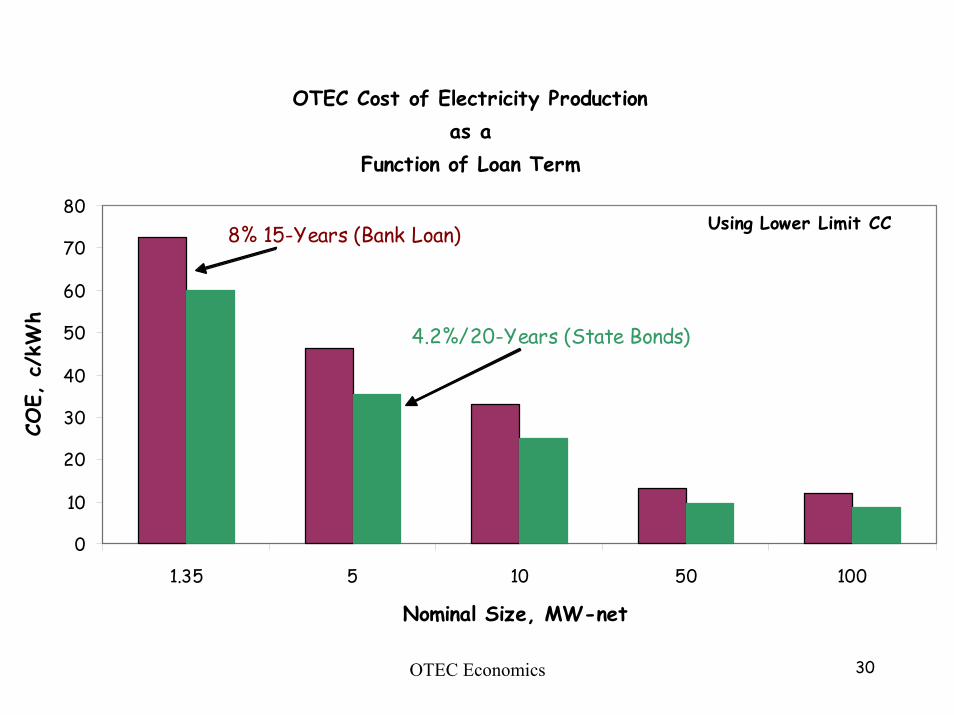
OTEC Cost of Electricity Production as a
Function of Loan Term
0
10
20
30
40
50
60
70
80
1.35 5 10 50 100
Nominal Size, MW-net
COE,
c/k
Wh
8% 15-Years (Bank Loan)
4.2%/20-Years (State Bonds)
Using Lower Limit CC
OTEC Economics 31
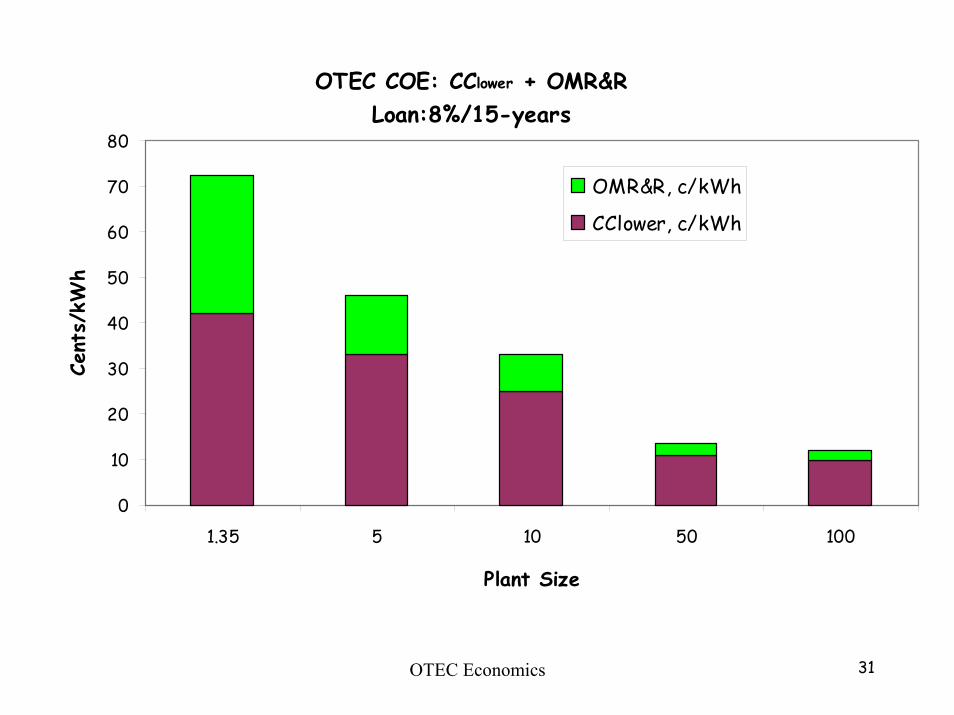
OTEC COE: CClower + OMR&RLoan:8%/15-years
0
10
20
30
40
50
60
70
80
1.35 5 10 50 100
Plant Size
Cent
s/kW
h
OMR&R, c/kWh
CClower, c/kWh

Case Studies:Hawai’i
Kwajalein (RMI)
OTEC Economics 33
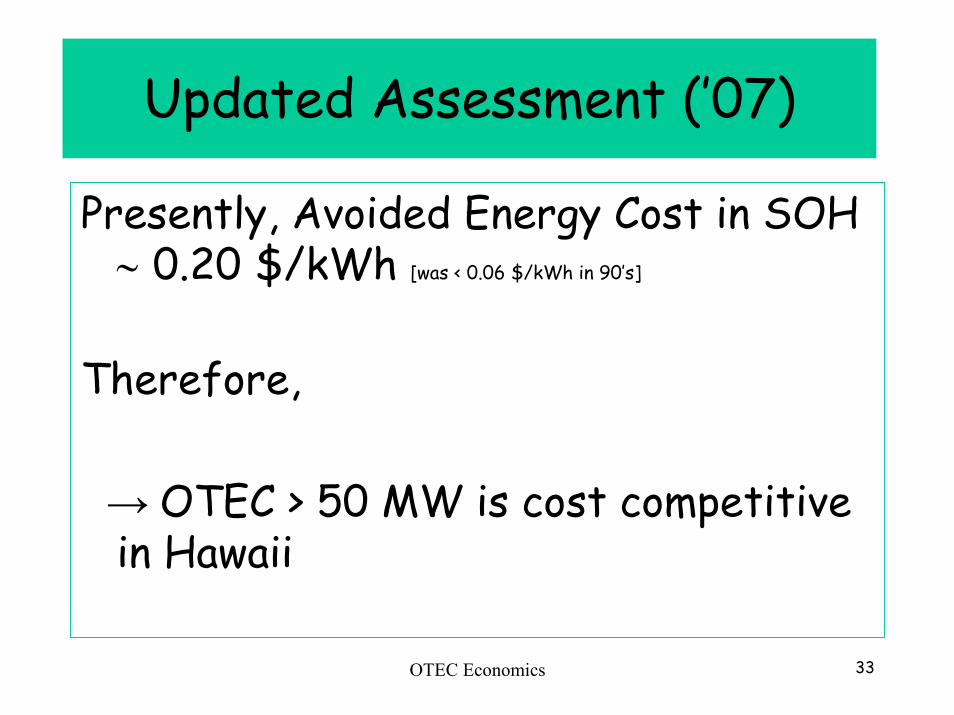
Updated Assessment (’07)
Presently, Avoided Energy Cost in SOH ∼ 0.20 $/kWh [was < 0.06 $/kWh in 90’s]
Therefore,
→ OTEC > 50 MW is cost competitive in Hawaii
OTEC Economics 34
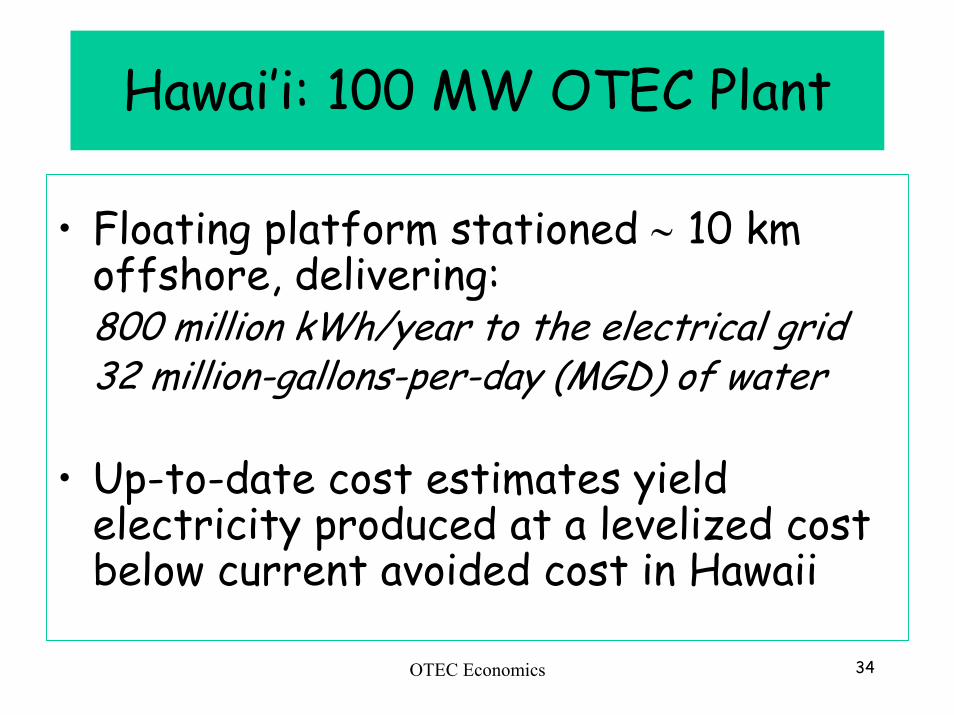
Hawai’i: 100 MW OTEC Plant
• Floating platform stationed ∼ 10 km offshore, delivering:800 million kWh/year to the electrical grid 32 million-gallons-per-day (MGD) of water
• Up-to-date cost estimates yield electricity produced at a levelized cost below current avoided cost in Hawaii
OTEC Economics 35
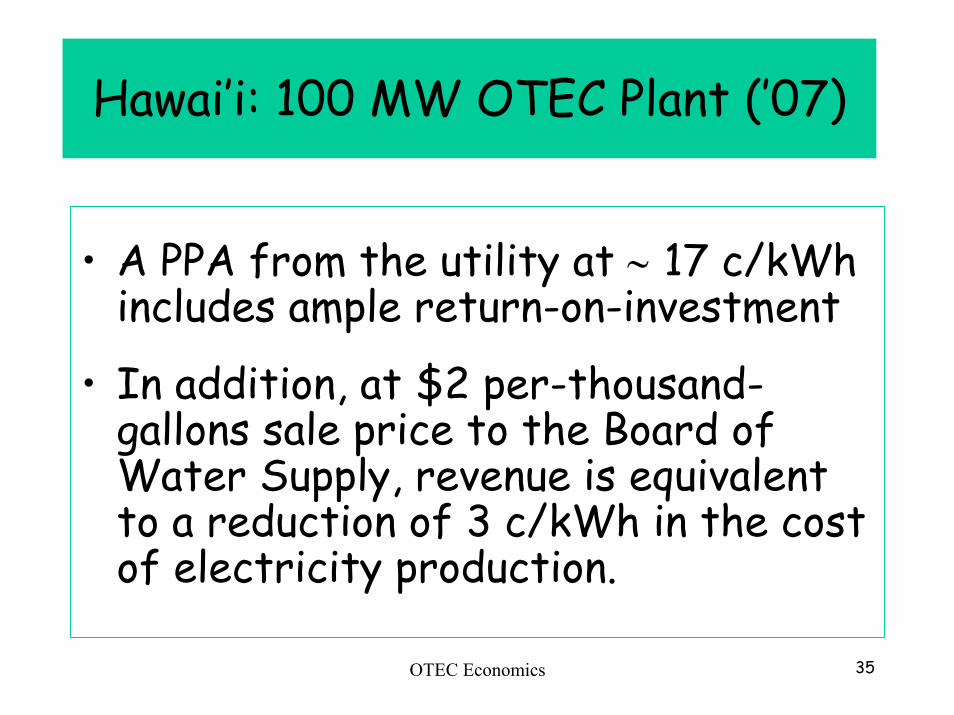
Hawai’i: 100 MW OTEC Plant (’07)
• A PPA from the utility at ∼ 17 c/kWh includes ample return-on-investment
• In addition, at $2 per-thousand-gallons sale price to the Board of Water Supply, revenue is equivalent to a reduction of 3 c/kWh in the cost of electricity production.
OTEC Economics 36
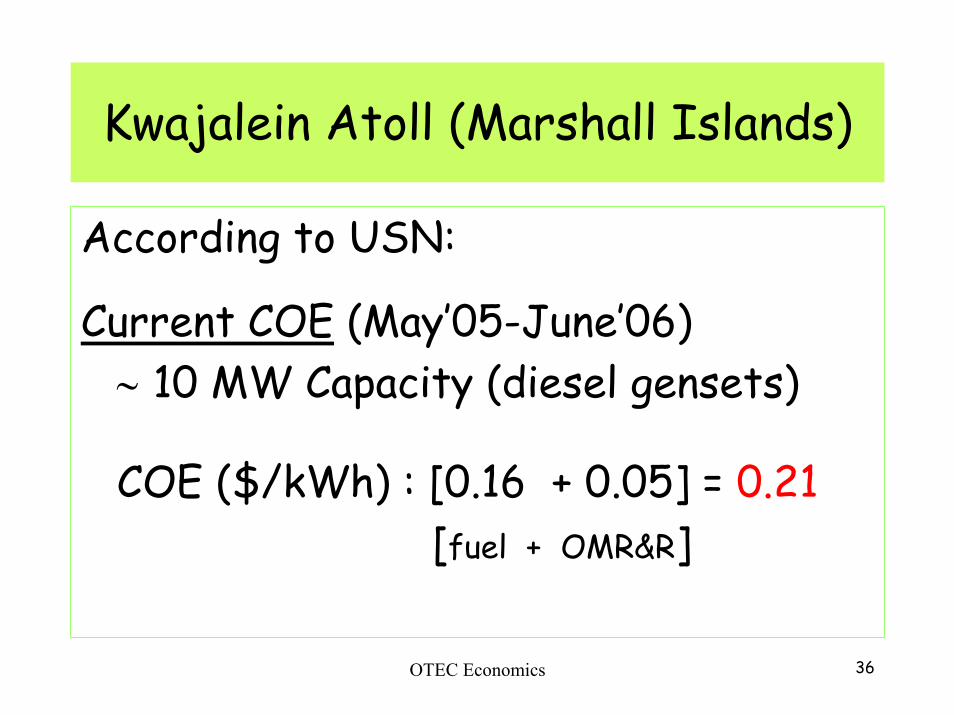
Kwajalein Atoll (Marshall Islands)
According to USN:
Current COE (May’05-June’06) ∼ 10 MW Capacity (diesel gensets)
COE ($/kWh) : [0.16 + 0.05] = 0.21[fuel + OMR&R]
OTEC Economics 37
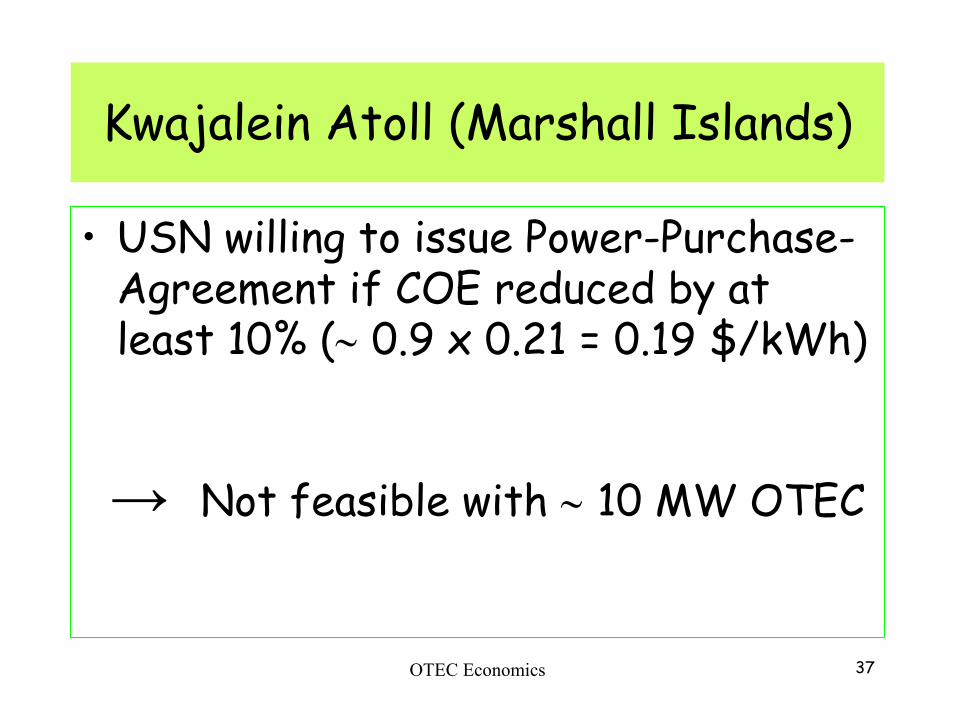
Kwajalein Atoll (Marshall Islands)
• USN willing to issue Power-Purchase-Agreement if COE reduced by at least 10% (∼ 0.9 x 0.21 = 0.19 $/kWh)
→ Not feasible with ∼ 10 MW OTEC
OTEC Economics 38
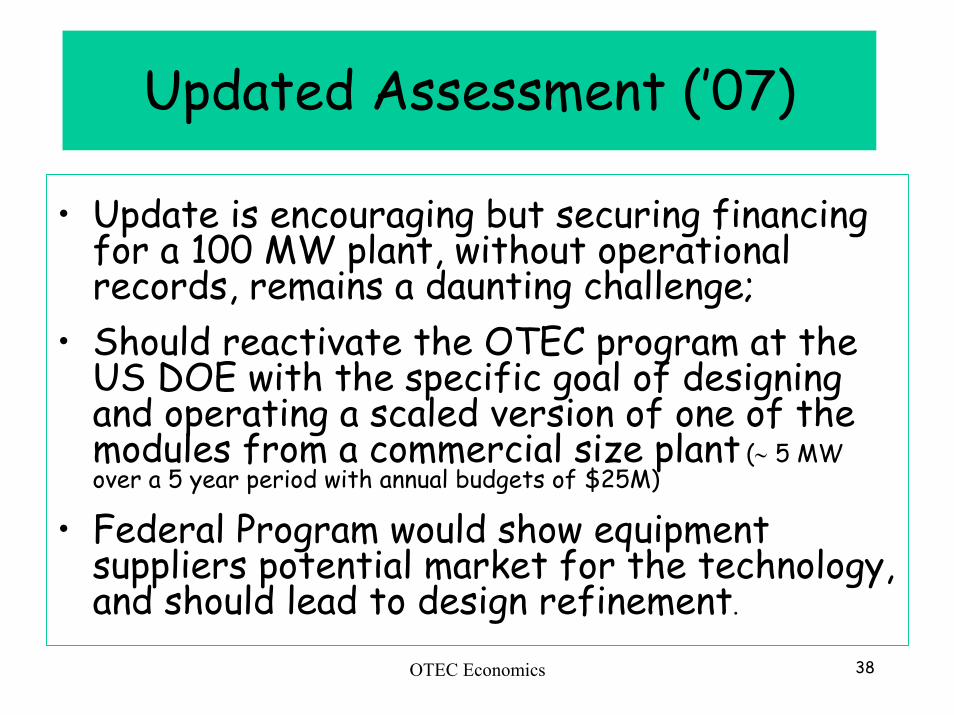
Updated Assessment (’07)
• Update is encouraging but securing financing for a 100 MW plant, without operational records, remains a daunting challenge;
• Should reactivate the OTEC program at the US DOE with the specific goal of designing and operating a scaled version of one of the modules from a commercial size plant (∼ 5 MW over a 5 year period with annual budgets of $25M)
• Federal Program would show equipment suppliers potential market for the technology, and should lead to design refinement.
OTEC Economics 39
Futuristic View
Petroleum resources (IEA, API, USGS) available to meet world demand for the next 30-50 years;
diminishing resources → price increases
OTEC Economics 40
Energy Carriers
OTEC energy could be transported via electrical, chemical, thermal and electrochemical carriers:
Presently, all yield costs higher than those estimated for the submarine power cable (< 400 km offshore).
OTEC Economics 41
Energy CarriersTwo to three decades from now, would
it make sense to produce H2 or NH3in floating OTEC plantships deployed along Equator?
→ Presently, would need barrel of petroleum fuel at least 7x higher ($400) to be “cost effective”

OTEC Economics 42
Therefore, Revive OTEC?
OTEC Economics 43
President Sarkosy, April 2007• "La mer tropicale est une source majeure
d’énergies renouvelables”, rappelle le nouveau chef de l’Etat, qui cite notamment l’énergie thermiquedes mers comme piste pertinente de recherche"
• "La mer tropicale est également une source majeure d’énergies renouvelables, malheureusement inexploitée aujourd’hui. Leurdéveloppement passe par une recherche appliquéepertinente sur l’éolien offshore, sur l’hydrolien et surtout sur l’énergie thermique des mers, actuellement ignorée.
OTEC Economics 44
President Sarkosy, April 2007
" The Tropical Sea is also a major source for Renewable Energies, unfortunately not exploited today. Their development needs relevant applied research on offshore wind , sea current and more especially on OTEC which is presently ignored".