Embed Size (px)
Citation preview

Report No:
Meeting Date
17-325
December 13, 2017
Alameda-Contra Costa Transit District
RECOMMENDED ACTION(S)
Consider adopting the AC Transit Clean Corridors Plan which recommends severalcommunitiesand corridors to receive future zero-emissions buses based on their designation asDisadvantaged Communities by the State of California through SB 535.
BACKGROUND/RATIONALE
In 2015, the California Air Resources Board(CARB) began public vetting of a potential new rule,the Advanced Clean Transit regulation, which mandates public transit fleets be entirelyemissions-free by 2040. It also requires transit agencies begin incorporating zero-emissionsvehicles (ZEVs) into their fleets in 2018 if passed. This new regulation will require that theAlameda-Contra Costa Transit District (District) purchases no more diesel or hybrid busesstarting in 2028 given the standard 12-year lifespan of a heavy-duty transit coach, and 2026given the 14-year lifespan of commuter coaches.
The District is in the enviable position of having operating a zero-emission fleet since 2010 witha sub-fleet of thirteen 40-foot hydrogen fuel-cell buses operated out of Emeryville and EastOakland bus divisions. In addition, the District will receive another ten 40-foot and one 60-foothydrogen fuel-cell buses across the next severalyears, reaching the maximum fueling capacityof the District's existing fueling stations. The District has also received grant funding to helpprocure five battery-electric buses for use out of Division 4 in East Oakland.
The District should begin planning where to prioritize future ZEVs to ensure they are distributedequitably around the service area as well as contribute to meeting regional and state-wideemissions-reductions goals. The development of the Clean Corridors Plan ensures the District iswell-prepared to apply for and compete for various grant opportunities. The analysis supportsspecific, "shovel-ready" lines that maximize the benefit of zero-emissions buses as they enterth n tl nnt
The corridors and communities identified in the Clean Corridors Plan reflect those areas that
willbe prioritized for zero-emissions buses as the District procures more ZEVs. The overallgoalof the plan is to have vehicles used on all lines serving these corridors and communities becompletely zero-emissions (whether battery-electric or hydrogen fuel-cell) by 2032. Staff willupdate this plan as progress is made on achieving implementation or as conditions/prioritieschange
STAFF R E PO RTTO: AC Transit Board of Directors FROM: Michael A. Hursh, General Manager SUBJECT: Clean Corridors Plan Adoption ACTION ITEM
1 of 25

Report No. 17-325
Page 2 of 4
Zero-Emissions Vehicle Assignment
The current fleet of 40-foot ZEVs are not dedicated on any specific lines but can be generallyfound on some of the most frequent lines with the highest ridership such as the 51A and 51B.The new battery-electric buses willbe assigned to lines in Division 4. While by 2040 allvehicleswill be zero-emissions and as such there will be no issue with where they are assigned, it iscritical that as these buses enter the fleet, they are distributed throughout the service areabased on three key criteria:
1) Environmental Justice and Social Equity,21 Ridership, and31 Facility Capability.
State Senate Bill 535 designates communities as "Disadvantaged" based on a complexcalculation of a variety of socioeconomic, public health and environmental hazard criteria. Themap of communities currently designated as SB535 Disadvantaged Communities is on page 7 ofthe Clean Corridors Plan(Attachment 1). Staff reviewed these communities and identified linesthat served them.
Staff then ranked each line serving a Disadvantaged Community by how many riders use theline. The goal with this criteria is to ensure the new ZEVs are having a positive impact on thegreatest number of customers.
Finally, staff considered constraints related to where and when ZEV fueling/charginginfrastructure can be accommodated at District operating divisions. There are constraintsrelated to how much space expanded fuel-cell infrastructure or electric charging stations willtake up at the individualdivisions as wellas constraints related to Pacific Gas & Electric's abilityto accommodate a significant amount of additionalelectricity at multiple sites. The initialgoalof the program is to limit the number of operating divisions as the Clean Corridor Plan rolls out,but eventually all divisions will be able to accommodate ZEVs as they make up a largerpercentage of the fleet.
The initial Clean Corridors identified in the plan include the City of Richmond, the San PabloCorridor, the Macarthur/Grand Corridor, and portions of West Oakland. The following lines areincluded in each corridor/community:
Richmond: 70, 71, 74, 76.San Pablo: 72, 72M, 72R.Macarthur/Grand: 57, NL NX-series.West Oakland: ].4, 29, 36, 62, 88, NL
Other areas were considered, including portions of Central/Southern Alameda County and theInternational Boulevard/East 14th Street corridor, but there were too few lines with highenough frequency and ridership in Central/Southern Alameda County that also servedDisadvantaged Communities. The International/East 14th Corridor will soon become a BusRapid Transit corridor and brand new dedicated buses are being procured for that line. Inaddition, both areas are also operated out of Division 6 which currently has no existing zero-emissions infrastructure.
2 of 25

Report No. 17-325Page 3 of 4
Anticipated Cost
Staff evaluated the costs associated with this plan for both the vehicles themselves as well asthe fueling/charging infrastructure. Staff assumed a cost of $985,000 for a 40-foot zero-emissions bus and an incrementalcost of$496,000 for fueling/charging infrastructure for eachbus. Altogether, fullimplementation of the Plan is estimated to be$213,264,000.
Exhibit lbelow details the number of buses(peak and spare) as well as the estimated cost ofthe vehicles and supporting fueling/charging infrastructure. There will be a total of 144 busescovering the corridors and communities identified in the plan, comprising nearly a quarter ofthe total fleet.
Exhibit 1 - Clean Corridors Buses and Costs
Implementation
In the interest of ensuring the District has flexibility with respect to procuring and assigningZEVs in the future, the Clean Corridors Plan is not prescriptive in terms of which corridors willbe the first to go completely zero-emissions. However, with five new electric buses coming toDivision 4, it makes sense to have the first Clean Corridors operating out of that division. Thiswould mean either partial implementation in West Oakland (lines 14 and 62) or fullimplementation of the Macarthur-Grand Corridor.
BUDGETARY/FISCAL IMPACT
The Clean Corridors Plan does not obligate the District to spend any money on buses orinfrastructure. It lays out the approximate costs associated with implementing zero-emissionsvehicles in areas identified by SB 535 as Disadvantaged Communities. The District's fleet willberequired to be entirely emissions-free by 2040 based on recent CARB rules and as such theDistrict will be purchasing increasing numbers of zero-emissions vehicles across the next twodecades to meet that requirement.
Clean Corridor Division Peak Buses SparesRichmond 3 18 4
3 of 25

Report No. 17-325
Page 4 of 4
ADVANTAGES/DISADVANTAGES
Advantages
The Clean Corridors Plan provides staff with clarity regarding which lines and facilities should be
prioritized for zero-emissions vehicles as the District transitions to a completely zero-emissionsfleet by 2040. Staff willbe able to use the direction provided by the Board through the adoptionof this plan to make decisions regarding where to make commitments to Pacific Gas & Electric
and other vendors/utilities to ensure the infrastructure is in the correct place to allow for zero-emissions vehicles to be prioritized where they willhave the greatest impact.
In addition, the Plan provides staff with clarity regarding which lines should be prioritized forinclusion within grant applications for dollars necessary to procure new or replacement zero-emissions vehicles.
The Clean Corridors Plan is not binding and can be revised as needed to reflect changingconditions or priorities.
Dbgdvantages
The plan lays out specific lines and communities which should be prioritized for zero-emissionsbuses, but it is not a binding document, only an effort to set a vision for where to prioritizezero-emissions buses and infrastructure as they are procured by the District.
ALTERNATIVES ANALYSIS
There are two alternatives to adopting the Clean Corridors Plan: 1) request staff makeadjustments to the criteria used to select the communities/corridors included in the plan, or 2)decline to approve the Plan.
PRIOR RELEVANT BOARD ACTION/POLICIES
None
ATTACHMENTS
Attachment 1 - Clean Corridors Plan
Approved by:
Reviewed by:
Ramakrishna Pochiraju, Executive Director of Planning and Engineering
Salvador Llamas, Chief Operations OfficerRobert del Rosario, Director of Service Development and PlanningDerik Calhoun, Director of TransportationMichaeIEshleman, Service Planning ManagerPrepared by:
4 of 25

SR 17-325Attachment I
WDROGW FUEL
l
CLEAN CORRIDORS PLANAC TRA NSIT
Service Planning Department
5 of 25

Table of ContentsI ntrod uctio n .
Evaluation
Existing Zero-Emission Fleet
Division Capacity
Planned Expansion
Clean Corridors Evaluation ........
Disadvantaged Communities.
Ridership....
Division Infrastructure
Recommendations
Lanespp aPaPgP on a aaaa&a
San Pablo Avenue
West Oakland ...
Macarthur-Grand Corridor
Richmond
Divisions
CapitalCost and Benefits ...............
Implementation
Challenges
Funding
Division Infrastructure
Division Capacity
Vehicle Assignment Flexibility
Schedule
3
5
5
5
6
6
6
8
10
11
11
12
13
14
15
16
17
18
18
18
19
20
21
21
6 of 25

INTRODUCTIONIn 2015, the California Air Resources Board (CARB) began public vetting of a potential new rule, theAdvanced Clean Transit regulation, which mandates public transit fleets be entirely emissions-free by
2040. It may also require transit agencies to begin incorporating zero-emissions buses(ZEBs) into their
fleets in 2018. This new regulation may require that the Alameda-Contra Costa Transit District (District)transition to a fully zero-emission fleet by 2040, which would mean all vehicle purchases after 2027would have to be zero-emission. And beyond CARB regulations, several major auto manufacturers havediscussed their plans to phase out fossilfuelpowered vehicles over a similar time frame
The term "zero-emissions" is used in the plan and throughout the Bay Area to connote tail-pipe
emissions. Clearly, there are emissions into the atmosphere from any type of fueling technology.However, it is also evident that Hydrogen fuel-cell and electric battery powered buses have significantly
lower overall emissions than diesel buses, especially given the District's Bloombox technology and
California's increasingly clean energy portfolio. Electric buses, due to the high levels of energy needed to
produce and dispose of batteries, need to be used for their projected life (beyond 10 years) in order to
fully recover life-cycle emissions. There are also emissions associated with procurement, delivery,assembly, maintenance, and decommissioning that are not addressed in this plan. Notwithstanding theabove, the District realizes the benefits of moving toward a "zero-emissions" fleet and supports a move
in that direction, while acknowledging the more appropriate name may be low emissions. For thepurposes of this plan, the term zero-emissions will be used and is duly qualified.
The District is in the enviable position of having over 16 years of experience with zero-emission buses
starting with its initialthree-bus fuelcellelectric bus(FCEB) fleet in the early 2000s. The current fleet of
13 hydrogen fuel-cell electric buses operated out of garages in Emeryville and East Oakland are one ofthe longest running zero-emission bus fleets in the country. However, with a need to transition to a 100-
percent zero-emission bus fleet by 2040, the District should begin planning where to prioritize futureZEBs to ensure they are distributed equitably around the service area as well as contribute to meeting
regionaland state-wide emissions-reductions goals.
The corridors and communities identified in this plan reflect those areas that will be prioritized for zero-
emissions buses as the District procures more ZEBs. The overall goal of the plan is to have vehicles usedon all lines serving these corridors and communities be completely zero-emissions (whether battery-
electric bus or hydrogen fuel-cellelectric bus) by 2032
The California Legislature passed AB 32 -- the California GlobalWarming Solutions Act of 2006 - which is
commonly referred to as the Cap and Trade Program. This program is designed to create a market fortrading emissions credits and the proceeds from sales in the marketplace are used to reduce
greenhouse gas emissions that cause climate change. In 2017 the state reaffirmed its commitment tothe Cap and Trade program when the legislature passed AB 398 with a two-thirds margin, extending the
program to 2030. Investments from Cap and Trade are also specifically targeted at disadvantaged
Service Planning Department 3
7 of 25

communities, with legislation from 2012 ISB 535) and 2016 IAB 1550) requiring 25 percent of theproceeds from Cap and Trade funds go to projects that provide a benefit to disadvantaged communities
and gave CaIEPA responsibility for identifying those communities.
The focus on investments in disadvantaged communities are aimed at improving public health, quality oflife and economic opportunity in California's most burdened communities at the same time reducing
pollution that causes climate change. The Clean Corridors Plan willuse the terminology Disadvantaged
Communities (DACs) to refer to the communities designated by the CaIEPA with their CaIEnviroScreentool
The methodology for identifying and prioritizing the corridors and communities in this plan is as follows
1) Evaluate existing conditions.
2) Review areas identified as DACs in our service area.
3) Rank lines based on ridership and productivity to ensure maximum impact of the zero-emissionbus fleet.
4) Consider constraints such as capacity/capability of divisions to accommodate ZEB growth.
5) Scope out the number of vehicles and supporting infrastructure required to convert entirecorridors/communities into Clean Corridors.
6) Forecast operating and capital costs associated with conversion to Clean Corridors.
The following chapters detailthe evaluation process, recommendations, the operating and capitalcosts,
and the implementation plan. The District's vision is to review and refresh this document as conditions,funding sources, or priorities change.
Service Planning Depa rtment
8 of 25

EVALUATIONThis section evaluates existing AC Transit lines to determine the most appropriate lines to prioritize for
assignment of future zero-emissions buses. The chapter consists of the following elements:1) Baseline description of existing and procured zero-emissions bus fleet.
2) Discussion of existing division and infrastructure capacity.
3) Planned future expansion of the zero-emission fleet.4) The evaluation of lines and corridors for priority ZEB assignment.
EXISTING ZERO-EMISSION FLEET
The District currently has 13 40-foot hydrogen fuel-cell electric buses, which represents the largest and
longest-running fuel-cell transit fleet in the nation. The District has begun procurement of 10 additional40-foot fuel-cell electric buses as well as a demonstration project of one 60-foot fuel-cell electric bus.This willbring the District's fuel-cellelectric bus fleet to 24 buses, which willbe the maximum number of
buses existing hydrogen fueling infrastructure at Divisions 2 and 4 can accommodate. The District hasalso received funding to assist with the purchase of five 40-foot battery-electric buses that will likely be
deployed from Division 4 on various routes including Line 73 in East Oakland, operating along 73'd andHegenberger between Eastmont Transit Center and the Oakland InternationaIAirport. The current and
planned fleet is depicted in Exhibit I below. By the end of 2019, the District plans to have 29 zero-emission buses in its fleet.
DIVISION CAPACITY
At present, the District has capacity for 12 hydrogen fuel-cell electric buses at each of two divisions - 2
and 4. There is no current infrastructure in place to allow for the charging of battery-electric buses.
Planned expansions willmean an additional ll hydrogen fuel-cellelectric buses will join the fleet acrossthe next several years, bringing the District to its full capacity of 24 buses. Along with the 10 hydrogenfuel-cell electric bus purchase, the District will be upgrading the hydrogen fueling infrastructure atDivision 2 to allow for faster and more efficient fueling operations, but not increasing capacity. TheDistrict willalso installfive depot charging stations at division 4 to support the five battery-electric buses
coming in 2019.
Expansion of the hydrogen fuel-cell electric bus fleet beyond the planned 24 buses will require
significant upgrade of existing fueling stations or construction of another hydrogen fuel station atanother division to accommodate growth. The District is also in discussions with Pacific Gas & Electric
IPG&E) regarding any infrastructure changes necessary to accommodate charging systems for thebattery-electric buses. Discussions include potential scalability of the battery electric bus charging
infrastructure from the initialfive bus capacity up to fifty battery electric buses. Given the significant up-front cost associated with improving the transmission infrastructure for the battery electric bus charging
system there may be a requirement to provide PG&E a detailed phased growth of the battery electricbus fleet to avoid incurring cost of the unused infrastructure capacity installed by PG&E.
Service Planning Department 5
9 of 25
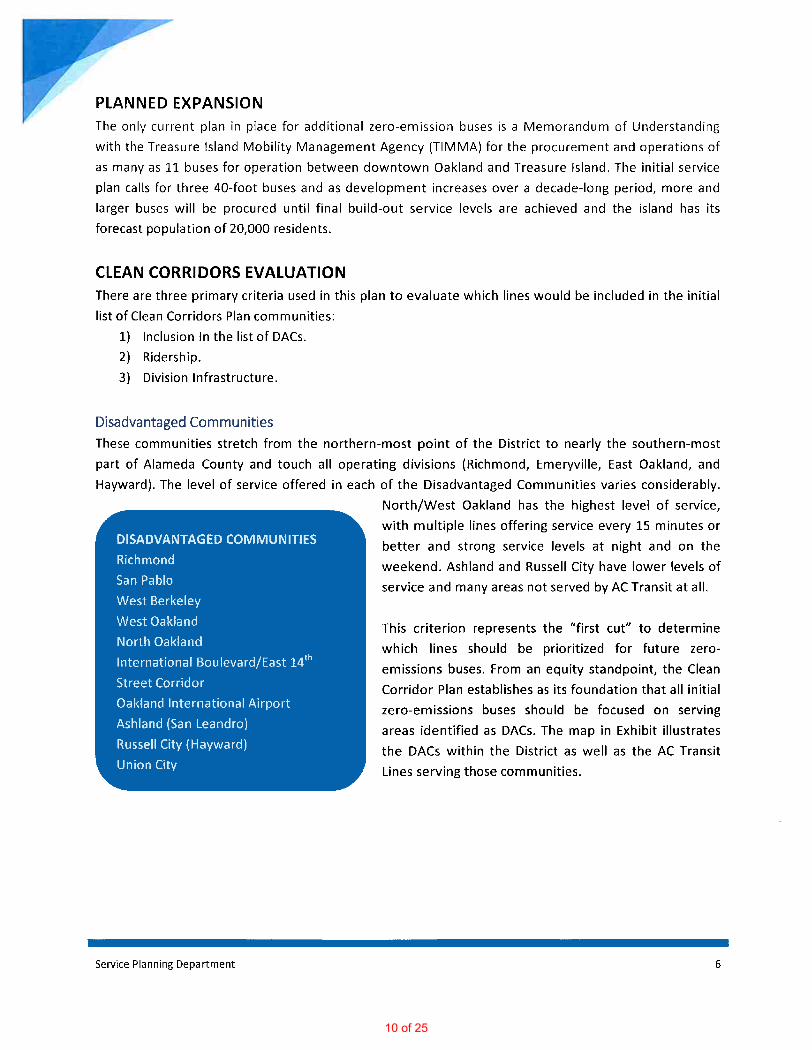
P LANNED EXPANSION
The only current plan in place for additional zero-emission buses is a Memorandum of Understandingwith the Treasure Island Mobility Management Agency(TIMMA) for the procurement and operations ofas many as llbuses for operation between downtown Oakland and Treasure Island. The initialservice
plan calls for three 40-foot buses and as development increases over a decade-long period, more andlarger buses will be procured until final build-out service levels are achieved and the island has its
forecast population of 20,000 residents.
CLEAN CORRIDORS EVALUATION
There are three primary criteria used in this plan to evaluate which lines would be included in the initiallist of Clean Corridors Plan communities:
1) Inclusion in the list of DACs.
2) Ridership.
3) Division Infrastructure
Disadvantaged CommunitiesThese communities stretch from the northern-most point of the District to nearly the southern-most
part of Alameda County and touch all operating divisions (Richmond, Emeryville, East Oakland, andHayward). The level of service offered in each of the Disadvantaged Communities varies considerably.
North/West Oakland has the highest level of service,
with multiple lines offering service every 15 minutes orbetter and strong service levels at night and on theweekend. Ashland and Russell City have lower levels ofservice and many areas not served by AC Transit at all.
DISADVANTAGED COMMUNITIES
RichmondSan Pablo
West BerkeleyWest OaklandNorth Oakland
InternationaIBoulevard/East 14thStreet Corridor
Oakland InternationaIAirport
Ashland (San Leandro)
Russell City (Haywa rd)Union City
This criterion represents the "first cut" to determinewhich lines should be prioritized for future zero-
emissions buses. From an equity standpoint, the CleanCorridor Plan establishes as its foundation that all initial
zero-emissions buses should be focused on serving
areas identified as DACs. The map in Exhibit illustratesthe DACs within the District as well as the AC Transit
Lines serving those communities.
Service Planning Department
10 of 25

Exhibit 1- AC Transit Lines Serving SB 535 Disadvantaged Communities
+
S£
#
.l-Pl-H
qe
../.+
S
y'
€
}
\
}Key- AC Transit Routes
= Disadvantaged Communities (SB 535)= -Miles bm.s1 2 6
q
Service Planning Department 7
11 of 25

Ridership
The District operates 39 regular localand select Transbay lines that also serve significant portions of theDACs identified in the map in Exhibit 1. The next step in the evaluation of which lines to prioritize for the
operation of ZEBs is to rank the lines serving those communities by ridership. The purpose of usingridership is to ensure the new ZEBs benefit the greatest number of customers as they're rolled out,keeping in mind that ultimately alIAC Transit vehicles may wellbe zero-emissions by 2040.
Exhibit 2 illustrates those lines serving the DACs as well as their termini, passengers/service hourjproductivity), and average daily ridership. The lines are ranked by average passengers/service hourridership.
The highest-ridership line - Line 1-- is slated for replacement by AC Transit's first bus rapid transit line in
2019 and the District is taking delivery of purpose-built, five-door articulated buses for that line. Al127 of
these vehicles will be diesel-hybrid coaches. A common theme emerges with the first half of the list as
the lines are primarily along major corridors, in Richmond, or in east or west Oakland.
There are a handful of lines from Division 6 - 10, 83, 86, and 97. These lines serve Hesperian, East 14th.
or the industrial area in west Hayward (Russell City) where Division 6 and the Training and Education
Center are located.
To provide more clarity regarding which corridors or communities to designate "Clean Corridors" for the
purposes of this plan, the lines were then assigned to areas. Some common themes emerged from these
groupings:B Manyof the lines in East Oakland operate along single corridors- lines 40, 54, 73, 90, 98, etc.--
and are spaced some distance apart, minimizing the impact of assigning large numbers of zero-emissions buses.
e Some lines, while touching DACs, spent much of their alignment well outside of those
communities, including lines 18, 19, 20, 46, 46L 47, 96, and O.
e Some lines had lower ridership butwere in key areas such as Richmond or West Oakland where
they could be coupled with other lines to form a cohesive community of clean buses, includinglines 29 and 36 in West Oakland and lines 71and 74 in Richmond.
e Some lines were so unproductive on their own, coupled with not having many other nearby
lines to join them with, that they did not make sense for ZEB prioritization, including lines 80,
81, and 251.
Service Planning Department
12 of 25

Exhibit 2 Lines Serving SB 535 Disadvantaged Communities
Service Planning Department 9
Line Type DivisionWeekday
Ridership
Passengers/
Hour
l Trunk D6 12,856 48.5
40 Trunk D4 8,978 44.3
54 Urba n Crosstown D4 2,022 42.8
73 Maj or Corridor D4 2,817 40.3
20 Major Corridor D4 2,875 36.0
72R Rapid D2 5,981 33.4
76 Urba n Crosstown D3 2,651 32.8
72M Trunk D2 3,830 31.4
14 Urba n Crosstown D4 4,594 31.3
57 Trunk D4 6,472 31.0
72 Trunk D2 4,110 30.5
62 Urba n Crosstown D4 3,314 28.0
97 Major Corridor D6 4,155 27.9
18 Trunk D2 4,484 27.3
0 Tra nsba y D4 1,841 26.3
88 Major Corridor D2 2,551 25.7
21 Urba n Crosstown D4 1,742 25.5
NL Tra nsba y D4 3,242 25.1
70 Urba n Crosstown D3 1,059 24.6
10 Major Corridor D6 2,954 24.5
45 Urba n Crosstown D4 2,009 22.8
13 of 25

Lines operated out of Division 6 as well as Line I were removed
from the list and the lines were then combined into groupings torank them based on the combined ridership of those lines servingeach corridor/community
Exhibit 3 - Ridership by Area
IMArea
When combined, the ridership for four key areas rose to the top ofthe evaluation:
e San Pablo AvenueWest Oakland
e Macarthur/G rand
e Richmond
Macart h ur/Gran dRichmondMLK
Shoreline
73rd/Hege nbe rge r35thSemina
Alameda/Tra nsba yAlameda
Fruitvale/Airport98thAshb
9Uh82nd
50th/Monticello
6,546
lml 4,484
2,875
2,817
.022
HIHI 1,749
1,742
1,532
897
The list also gives the District insight regarding future Clean
Corridors communities, including the Martin Luther King corridor
and many areas in East Oakland.
Division Infrastructure
Divisions 2 and 4 currently have a combined capacity of 24hydrogen fuel-cell buses with an additional five battery-electricbuses likely planned for Division 4. The District is currently working
with PG&E on electrical infrastructure requirements to support as many as fifty battery electric buses atDivision 4. As part of any agreement for PG&E to improve the electrical infrastructure at Division 4, theDistrict would need to prove it will have enough electric buses to utilize that infrastructure or possibly
incur cost from PG&E for the expanded charging infrastructure capacity not being used.
AC TRANSIT DIVISIONS
Division 2 -- EmeryvilleDivision 3 -- Richmond
Division 4 - East Oakland
Division 6 -- Haywa rd
Division 2 is the next logical location for zero-emissions buses as it isalready home to a hydrogen fuel-cell electric bus fleet. In addition, the
District has discussed electrical charging infrastructure with PG&E anddue to existing infrastructure in the area, there should not be any issueswith expanding battery-electric capacity at the Emeryville division.
Division 3 in Richmond is the District's smallest operating division but is
in a DAC and its small size would allow the District to convert a significant portion of the fleet there tozero-emissionsjust by converting the locaIRichmond lines - 70, 71, 74, 76 - to zero-emissions.
Division 6 would be the lowest priority in the near-term given it has few lines serving DACs and many of
the lines operating out of Division 6 have low ridership, meaning the benefits of zero-emissions buses
would be felt by fewer customers. As it does convert to zero-emissions, priority should be placed onlines 10, 83, 86, and 97.
Service Planning Department 10
14 of 25
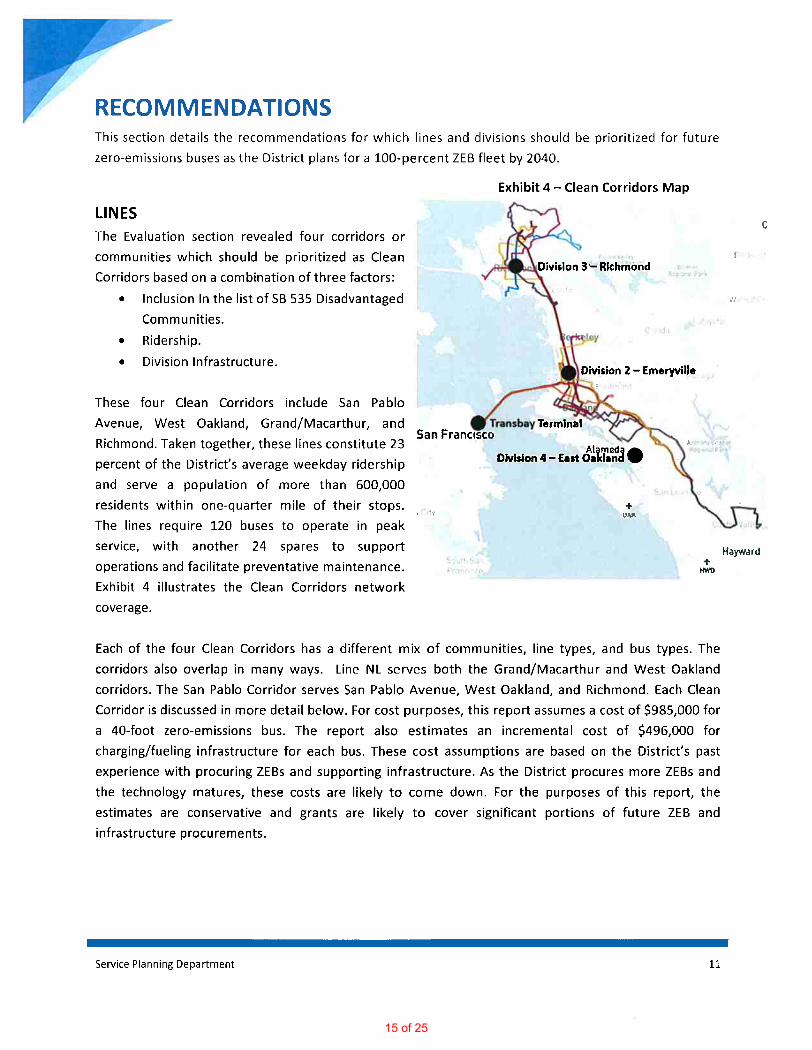
RECOMMENDATIONSThis section details the recommendations for which lines and divisions should be prioritized for futurezero-emissions buses as the District plans for a 100 percent ZEB fleet by 2040.
Exhibit 4 - Clean Corridors Map
LINES
The Evaluation section revealed four corridors or
communities which should be prioritized as CleanCorridors based on a combination of three factors:
e Inclusion in the list of SB 535 DisadvantagedCom m unities.
e Ridership.
e Division Infrastructure
Watnv( C
These four Clean Corridors include San Pablo
Avenue, West Oakland, Grand/Macarthur, andRichmond. Taken together, these lines constitute 23
percent of the District's average weekday ridershipand serve a population of more than 600,000
residents within one-quarter mile of their stops.The lines require 120 buses to operate in peakservice, with another 24 spares to supportoperations and facilitate preventative maintenance.Exhibit 4 illustrates the Clean Corridors network
coverage
San Fund
S€j&:h SaR
Each of the four Clean Corridors has a different mix of communities, line types, and bus types. The
corridors also overlap in many ways. Line NL serves both the Grand/Macarthur and West Oaklandcorridors. The San Pablo Corridor serves San Pablo Avenue, West Oakland, and Richmond. Each Clean
Corridor is discussed in more detail below. For cost purposes, this report assumes a cost of$985,000 for
a 40-foot zero-emissions bus. The report also estimates an incremental cost of $496,000 forcharging/fueling infrastructure for each bus. These cost assumptions are based on the District's past
experience with procuring ZEBs and supporting infrastructure. As the District procures more ZEBs andthe technology matures, these costs are likely to come down. For the purposes of this report, theestimates are conservative and grants are likely to cover significant portions of future ZEB andinfrastructure procurements.
Service Planning Department 11
15 of 25

San Pablo Avenue
The San Pablo Avenue Corridor is the longest of the four. Exhibit 5 - San Pablo Avenue Corridor MapFwith three lines serving Oakland, Emeryville, Berkeley,
Albany, EICerrito, Richmond, and San Pablo. Lines 72,
72M, and 72R carry nearly 14,000 riders on a typicalweekday and have a combined headway of about 6.5minutes through the core of the corridor(Jack London
Square to Macdonald Avenue in Richmond). Together,the lines require 33 peak buses and seven spares to
operate each weekday. Operating these linesexclusively with zero-emissions vehicles would benefit
more than 150,000 residents living within a quarter
mile of the bus stops they serve.
\
RichmondEast Richmond
]cightsPin
Waters
ll
bbnlpb 51c
lCerrito
Kensington
TildenRegional
Pink
The total cost of converting these lines to zero
emissions is estimated to be $58,647,600, includinginfrastructure. All of these lines operate out of
Division 2 in Emeryville, which already has hydrogenfueling infrastructure in place. However, thehydrogen infrastructure will be at maximum capacitywith the fuel cell fleet additions already in process.Any expansion of zero-emissions fleet at Division 2 will
require either new electric charging infrastructure, the
expansion of the existing hydrogen fueling station, or
a new fueling station altogether.
Berkeley
Unlverslof Catifor
Pied
Exhibit 6 San Pablo Avenue Corridor Fleet and Costs
Service Planning Depp rtment 12
Li nes Division Peak Buses Spares
16 of 25

West Oakland
Surrounded by freeways and connections to the
Bay Bridge and in close proximity to the Port ofOakland, West Oakland has long been subject tothe externalities of projects that benefit othercommunities. The area is served by five lines notcovered by other Clean Corridors: 14, 29, 36, 62,and 88. Together, these lines carry more than12,500 customers on a typicalweekday and require36 peak buses and seven spares to operate
Exhibit 7 - West Oakland Corridor Map
The total cost of converting these lines to zero-
emissions is estimated to be$63,979,200, includinginfrastructure. Lines 29, 36, and 88 operate out ofDivision 2 in Emeryville and lines 14 and 62 operateout of Division 4 in East Oakland. Both facilities
already have hydrogen fueling infrastructure inplace. However, the hydrogen infrastructure will
be at maximum capacity with the fuel cell fleetadditions already in process. Any expansion of
zero-emissions fleet at either facility will requireexpansion of the existing hydrogen fueling station, or
either new electric
a new fueling stationcharging infrastructure,
altogether.
the
Exhibit 8 West Oakland Corridor Fleet and Costs
Service Planning Department 13
Line s Division Peak Buses Spares14 4 10 2.0
17 of 25
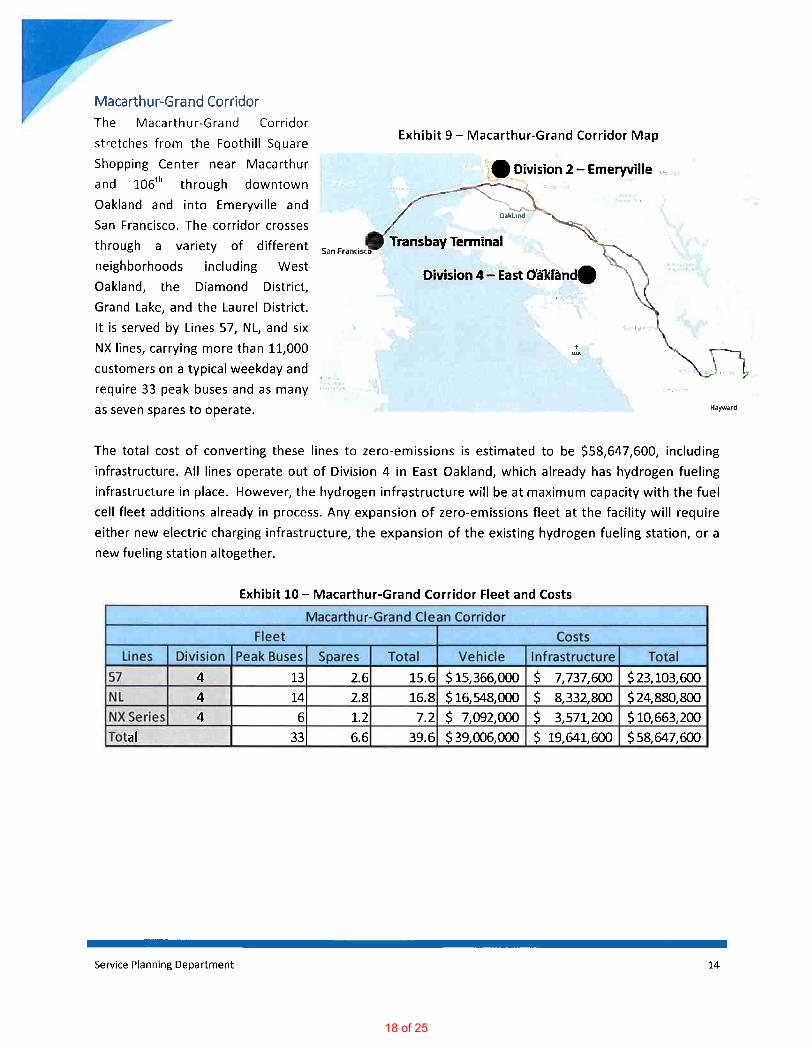
Maca rthur-Gra nd CorridorThe Maca rthur-Grand Corridor
stretches from the Foothill Square
Shopping Center near Macarthurand 106th through downtown
Oakland and into Emeryville andSan Francisco. The corridor crosses
through a variety of different
neighborhoods including WestOakland, the Diamond District,Grand Lake, and the Laurel District.
It is served by Lines 57, NL and six
NX lines, carrying more than 11,000
customers on a typicalweekday and
require 33 peak buses and as many
as seven spares to operate
Exhibit 9 Macarthur-Grand Corridor Map
psion 2 -- Emeryville
The total cost of converting these lines to zero-emissions is estimated to be $58,647,600, including
infrastructure. All lines operate out of Division 4 in East Oakland, which already has hydrogen fuelinginfrastructure in place. However, the hydrogen infrastructure will be at maximum capacity with the fuel
cell fleet additions already in process. Any expansion of zero-emissions fleet at the facility will requireeither new electric charging infrastructure, the expansion of the existing hydrogen fueling station, or a
new fueling station altogether.
Exhibit lO Macarthur-Grand Corridor Fleet and Costs
Service Planning Department 14
Li nes Division Peak Buses Spares
18 of 25

Richmond Exhibit 11- Richmond Corridor Map
Similar to West Oakland,
Richmond is hemmed in by two
freeways and is home to some
heavy industrial sites, includinga Chevron oil refinery. The area
is served by four lines notcovered by other Clean
Corridors: 70, 71, 74, and 76.
Together, these buses carrymore than 6,500 customers on a
typical weekday and require 18peak buses and four spares to
operate
P-f\aie V+Utt P
?
W'!4{a! C a-/en& Reg <se Pa4
n 9 -- Richmond
The total cost of convertingthese lines to zero-emissions is
estimated to be $31,989,600,
including infrastructure. All four lines operate out of Division 3 in Richmond on weekdays and Division 2on weekends. The Richmond facility does not currently have any electric charging stations or hydrogenfueling infrastructure in place. As such, any conversion of the fleet at Division 3 from diesel to zero-
emissions fleet at the facility will require either new electric charging infrastructure, the expansion ofthe existing hydrogen fueling station, or a new fueling station altogether.
Et Cerrito
Exhibit 12 - Richmond Corridor Fleet and Costs
Service Planning Department 15
Lines Division Peak Buses Spares70 3 3 l
19 of 25
DIVISIONS
Among the District's four current operating divisions, two - Division 2 in Emeryville and Division 4 in
Oakland - are equipped with hydrogen fueling infrastructure. Division 4 may also soon have electriccharging infrastructure for five buses as the District is in discussions with PG&E regarding upgrading its
infrastructure for as many as fifty battery-electric buses in the next severalyears.
Given that Division 4 is already accustomed to operating hydrogen fuel-cellelectric buses and willsoonhave capacity for battery-electric buses, it should be prioritized as the first division to support the CleanCorridors Plan. This willfacilitate the Macarthur-Grand Corridor(40 coaches) and Lines 14 and 62 from
the West Oakland Corridor (22 coaches). Since PG&E is planning to expand distribution capacity near
Division 4 for the District to only handle up to fifty battery-electric buses, the District can follow one offour paths:
1)
2)
3)
4)
Discuss increasing the capacity for Division for to handle 60 buses with PG&E
Only partially implement the two corridors, leaving 16 of the 71Clean Corridors buses as diesel.This can be accomplished by using the dieselor diesel hybrid buses as spares.Utilize a mix of hydrogen fuel-cellelectric and battery-electric buses for some of the Clean
Corridors buses. This willrequire expanding, re-building, or constructing a new hydrogen fuelingstation .
Dedicate existing hydrogen fuel-cellelectric buses to Clean Corridors lines to make up the gap.
Division 2 should be prioritized as the second operating division for facilitating the Clean Corridors Plan
as it already has hydrogen fueling infrastructure and supports the San Pablo and West OaklandCorridors. It will also be the most likely division to support future service to Treasure Island, which is
planned to be a completely zero-emission service. Together with Division 4, the District can convert all
lines to zero-emissions lines except for 70, 71, 74, and 76. This would benefit 36,223 daily customers(20
percent of the District total) and about 500,000 residents living within a quarter-mile of the lines.
Division 3 serves the Richmond Clean Corridor and should be the third division prioritized for the
program given converting the local Richmond 70-series lines into zero-emissions lines would benefitabout 6,500 daily customers and 150,000 residents within a quarter mile of their bus stops.
Division 6 should be the final operating division given it does not currently have any zero-emissions
infrastructure and has few high-ridership lines serving DACs and the resources spent on zero-emissions
buses would benefit a greater number of customers and residents on lines elsewhere in the District.
Service Planning Department 16
20 of 25

CAPITAL COST AND BENEFITSThis section analyzes the capitaloutlays necessary to implement the recommendations in the previous
section as well as some of the benefits associated with implementing the plan. A caution that many of
the costs projected below are based on assumptions and require further research and industryexperience. Even the District's considerable experience with fuel cellbuses is only reaching the mid-life
stage of the bus. In addition, the infrastructure and operationalimplications of scaling up ZEB fleets are
stillbeing determined. No transit agency has as of yet converted more than a smallportion of their fleettn /}- Rc
Exhibit 13 below details the cost of replacing each vehicle in each of the Clean Corridors with battery-electric or hydrogen fuel-cell electric buses from a capital perspective. The numbers are then combined
into a total for the entire program. Altogether, procuring the buses and charging/fueling infrastructure
for Clean Corridors in these four areas is estimated to be$213.3 million. This represents capitalcosts of
approximately$100 million above the cost of replacing the same buses with dieselcoaches. These costsare based on the District's past experience with procuring ZEBs and supporting infrastructure. As the
District procures more ZEBs and the technology matures, these costs are likely to come down. For thepurposes of this report, the estimates are conservative and grants are likely to cover significant portionsof future ZEB and infrastructure procurements. The District's Zero Emissions Bus Study will evaluate the
specific costs to the District for Batter-electric and Hydrogen fuel-cell vehicles next year and this reportwillbe adjusted to reflect those new numbers.
Exhibit 13 Clean Corridor Program CapitalCosts
While there are additional costs associated with procuring ZEBs for use along these corridors, thebenefits are substantial. First, California transit fleets may be required to be 100-percent zero emissions
by 2040 so the added cost over diesel is moot as all buses will need to be ZEBs regardless. Second,eliminating tail-pipe emissions from the lines serving these communities willlead to improvements in air
quality for local residents. Third, implementing this plan demonstrates the District's continuedcommitment to being at the forefront of transit technology deployment as well as its commitment toimproving environmental quality for our customers, communities, and employees. Finally, it is a great
opportunity to attract new customers, especially those who consider sustainability a core tenet of theirdecision-making process.
Service Planning Depa rtment 17
Clean Corridor Division Peak Buses SparesRichmond 3 18 4
21 of 25

IMPLEMENTATIONThis section details some of the specific challenges related to implementing the recommendations in the
Clean Corridors Plan as wellas a schedule and the short-term next steps.
CHALLENGES
The following issues may be challenges associated with implementing the Clean Corridors Plan as
presented in this document.
fundingGiven the additiona]cost of rep]acing].37 dieselbuses with zero-emissions buses, funding plays a criticalrole in ensuring the District can successful implement the Clean Corridors Plan. Through the existing
Metropolitan Transportation Commission's Transit CapitalPriorities(TCP) Program, the District is eligibleto receive FederaITransit Administration(FTA) funds for 70% of the cost of a bus replacement, with the
District responsible for the remaining 30% local matching funds. The TCP policy allows an agency torequest funding for up to the cost of a hybrid diesel-electric bus when purchasing a zero-emission bus.
To purchase a ZEB the District must find funding for the "increment" of the ZEB above a hybrid buswhich is the $300,000 to $400,000 mentioned earlier. The following are some of the key grant programs
that can fund allor part of a ZEB purchase:
1) Federal Transit Administration(FTA) Grants
a) FTA Section 5339 Bus and Bus Facilities Infrastructure Investment Program is adiscretionary program the District can apply for to supplement local funds for thepurchase and replacement of transit vehicles, regardless of power source.
b) FTA Section 5339 Low or No Emission Competitive Program provides grants on a
competitive basis to supplement local dollars for the replacement of Hybrid and zeroemissions vehicles. As much as$55 million is available each year through FY 2020. AC
Transit is currently using this source to fund a portion of the cost of the five futurebattery-electric buses.
2) State Funding: The most prominent state programs for funding zero emission transit servicecomes from the Cap and Trade Program. Proceeds from California's Cap and Trade program are
channeled to fund four programs:
a) Low Carbon Transit Operations Program (LCTOP): The District receives LCI'OP funds
annually through a formula to support capital projects that reduce GHG emissions and
increase ridership.
b) Transit and Intercity Rail Capital Program (TIRCP): This is a large-scale competitive grantprogram for investments that reduce GHG emissions and increase ridership.
c) Affordable Housing and Sustainable Communities Program (AHSC): The CaliforniaStrategic Growth Council offers grants through the Affordable Housing and Sustainable
Communities (AHSC) Program to support -- among other things -- projects that improve
transit service and amenities or improve the environmental sustainability of transit
Service Planning Department 18
22 of 25

service in communities identified as SB 535 Disadvantaged Communities. The projectseeks to reduce greenhouse-gas emissions, vehicle-miles traveled, and use of single-occupancy vehicles. The District successfully partnered with four housing developments
to win funding for four hybrid diesel-electric buses to support AC Go service expansion.d) Low Carbon Transportation Investments and Air Quality Improvement Program (AQIPI
are CARB funding programs with components designed to incentivize the transition tozero-emissions fleets. One continuing program under AQIP is the Hybrid and Zero-
Emission Truck and Bus Voucher Incentive Project (HVIP), which provides vouchers fortransit agencies to purchase hybrid and zero-emission buses on a first-come, first-servedbasis. New Flyer, the manufacturer of the five electric buses, applied for and received
this funding on behalf of the District to facilitate purchase of those buses.Bay Area Air(duality Management District(BAAQMDI
a) Regionally, the Transportation Fund for Clean Air Program (TFCA) provides significant
funding for emissions-reducing projects. The BAAQMD provides TFCA funding throughthe Heavy-Duty Zero-Emissions Vehicle (ZEV) Program which will partially fund thepurchase ten hydrogen fuel cell buses in 2018. BAACIMD also has funding programs that
support construction of new hydrogen fueling stations and electricalcharging stations.
3)
Division Infrastructure
There is current capacity for 24 hydrogen fuel-cell electric buses between Divisions 2 and 4. When the
five new battery-electric buses are added to the fleet in 2019, the District will have capacity for thosefive buses, and PG&E is exploring the possibility to scale up to have power available for charging up to
45 more battery-electric buses at Division 4. The District needs to increase charging and hydrogenfueling capacity at divisions in a strategic manner alongside any planned increases in zero-emissions
buses. Rolling out any new hydrogen fueling will require expanding or building new fuelinginfrastructure while introducing or increasing battery-electric buses to a division will requirecoordinating with PG&E to assess the electrical transmission capacity at each division before committing
to procuring the vehicles and their requisite charging infrastructure. The District's Facility Utilization Plan
will include specific recommendations for how to lay out the operating divisions to accommodate
changes in fleet composition. Further, the Zero Emission Bus (ZEB) Analysis will identify -- on a lifecyclebasis - the economic costs, performance issues, risks, and recommended timeline associated withtransition to a zero emission transit bus fleet.
Service Planning Department 19
23 of 25

Division CapacityThe District currently has capacity for about 680 buses among its four operating divisions, dependingupon striping configurations. While this plan doesn't explicitly callfor fleet expansion, the transition to
zero-emissions technology will necessitate a period from 2019 - when battery-electric buses enter to
fleet - to 2040 - when the entire fleet is zero-emissions - when we have three different power sources.The need to have hydrogen fuel-cell, diesel, and electric charging infrastructure could place stress on
operating divisions with respect to space constraints. Compounding this issue is the number of subfleets operated by the District. Looking to 2018, the fleet will be composed of 13 different sub-fleets
based on power source, branding, service type, size, and number of doors.
The breakdown of the District's fleet types is illustrated in Exhibit 14 below. Once the battery-electric
buses enter the fleet, there will be four different 40' buses. Once the 60' hydrogen fuel-cell electric busand the 27 BRT buses (which don't have fareboxes but do have five doors) enter the fleet, there will be
three different articulated sub-fleets. There are already two different sub-fleets for the 30' buses andthe double-decker buses willadd a third Transbay sub-fleet when they arrive in spring 2018.
Exhibit 14 - AC Transit Sub-Fleets in 2018
+Expand to 23 in 2019+q'Enter Fleet in 2019
++'k Enters Fleet in 2019
While the large number of sub-fleets allows AC Transit to tailor vehicle type for specific lines orcommunities, it also means the Divisions must know how to maintain, fuel, and assign the different
fleets effectively. This also impacts the spare ratios for each sub-fleet limiting availability of busesdesignated for maintenance programs. Decisions must be made about which vehicles should beprioritized for specific lines and accommodating the separate fueling and charging infrastructure takesup additional space. The District will evaluate other striping layouts to expand Division capacity and
accommodate in-stallbattery-electric charging in parking stalls/lanes.
Service Planning Department 20
Bus Type Sub-Type Length Rowe r Source
Standard Diesel 40 Diesel
Hydrogen Fuel-Cello 40 Fuel Cell
Hybrid 40 Hybrid
Batterv-Electric++ 40 Battery-ElectricArticulated Diesel 60' Diesel
Hydrogen Fuel-Cell+++ 60' Fuel Cell
24 of 25

Vehicle Assignment flexibilityImplementing the Clean Corridors Plan will mean prioritizing the lines in the plan as the primaryassignment of the new zero-emissions buses. However, AC Transit operates in a dynamic environmentand sometimes ideal bus assignment isn't feasible given conditions in the field or maintenance
schedules. The Plan calls for sufficient spares to ensure the Clean Corridors lines always have zero-emissions buses available, but should that faildue to forces beyond the control of the operations and
maintenance staff, the lines should be prioritized for assignment of the District's existing hydrogen fuel-cellelectric buses or diesel-hybrid buses.
SCHEDULE
The following is a proposed schedule of implementation of the four corridors identified in the CleanCorridors Plan.
@uk.i: ®:;:-...L
r
Staff willevaluate the appropriate order for implementation of the corridors based on the findings fromthe facilities Utilization Plan and Zero Emission Bus Analysis as wellas discussions with PG&E and other
critical stakeholders. The Clean Corridors Plan will be revised as the specific corridors are prioritized. As
each corridor is implemented, staff will update the plan with new corridors for prioritization with thegoalof a complete zero-emissions bus fleet by 2040.
Service Planning Department 21
25 of 25