Embed Size (px)
Citation preview

Stabilization of Horseshoe Lake Road using Geofibers and Soil-Sement®
Final Report AUTC # S12609
DTFH70-09-E-00020
Prepared by: Billy Connor, PE Rodney Collins Date Prepared for: Alaska University Transportation Center Federal Highway Association Duckering Building Room 245 1200 New Jersey Avenue, SE PO Box 755900 Washington, DC 20590 Fairbanks, AK 99775-
Fed
eral High
way A
ssociation
Alask
a Un
iversity Tran
sportation
Cen
ter

REPORT DOCUMENTATION PAGE
Form approved OMB No.
Public reporting for this collection of information is estimated to average 1 hour per response, including the time for reviewing instructions, searching existing data sources, gathering and maintaining the data needed, and completing and reviewing the collection of information. Send comments regarding this burden estimate or any other aspect of this collection of information, including suggestion for reducing this burden to Washington Headquarters Services, Directorate for Information Operations and Reports, 1215 Jefferson Davis Highway, Suite 1204, Arlington, VA 22202-4302, and to the Office of Management and Budget, Paperwork Reduction Project (0704-1833), Washington, DC 20503 1. AGENCY USE ONLY (LEAVE BLANK)
2. REPORT DATE April 3, 2012
3. REPORT TYPE AND DATES COVERED Final Research Report (8/18/2009-12/31/2011)
4. TITLE AND SUBTITLE Stabilization of Horseshoe Lake Road using Geofibers and Soil-Sement®
5. FUNDING NUMBERS G00005806-334659-68102 DTFH70-09-E-00020 S12609
6. AUTHOR(S) Billy Connor, PE Rodney Collins 7. PERFORMING ORGANIZATION NAME(S) AND ADDRESS(ES) Alaska University Transportation Center P.O. Box 755900 Fairbanks, AK 99775-5900
8. PERFORMING ORGANIZATION REPORT NUMBER S12609
9. SPONSORING/MONITORING AGENCY NAME(S) AND ADDRESS(ES) Federal Highway Administration 1200 New Jersey Avenue, SE Washington, DC 20590
10. SPONSORING/MONITORING AGENCY REPORT NUMBER
11. SUPPLENMENTARY NOTES 12a. DISTRIBUTION / AVAILABILITY STATEMENT No restrictions
12b. DISTRIBUTION CODE
13. ABSTRACT (Maximum 200 words) One solution to reducing the cost of importing gravel in areas where available soils are predominately silts and sands is to stabilize the local soils with geofibers and synthetic fluids. There have been several studies which have evaluated improvements in soil strength using geofibers. Laboratory work at the Alaska University Transportation Center has shown that the use of geofibers in combination with synthetic fluids has the potential to stabilize silts and sands, making them usable for roadway and airport construction. A test 500 foot test section was constructed on Horseshoe Lake Road, near Wasilla, Alaska. The test section was comprised of 250 feet using six inches of geofiber and Soil-Sement® and 250 feet using twelve inches of geofiber and Soil-Sement®. The test section was monitored over 16 months for performance and soil strength. Overall the test section has performed well. 14- KEYWORDS : soil stabilization, geofiber, synthetic fluid, silt, sand
15. NUMBER OF PAGES 38 16. PRICE CODE
N/A 17. SECURITY CLASSIFICATION OF REPORT
Unclassified
18. SECURITY CLASSIFICATION OF THIS PAGE
Unclassified
19. SECURITY CLASSIFICATION OF ABSTRACT
Unclassified
20. LIMITATION OF ABSTRACT
N/A
NSN 7540-01-280-5500 STANDARD FORM 298 (Rev. 2-98) Prescribed by ANSI Std. 239-18 298-1

II
Table of Contents List of Figures ............................................................................................................................................... III
List of Tables ................................................................................................................................................ III
Abstract ......................................................................................................................................................... 1
Acknowledgements ....................................................................................................................................... 1
Introduction .................................................................................................................................................. 2
Materials ....................................................................................................................................................... 4
Preliminary Testing ....................................................................................................................................... 6
Construction ................................................................................................................................................ 10
Initial Test Results ....................................................................................................................................... 19
Week 1 and Week 3 Measurements (August 7th and August 28th, 2010) ................................................... 22
Measurements taken on September 7th and October 7th, 2010 ................................................................. 27
2011 Field CBR Measurements ................................................................................................................... 29
Discussion ................................................................................................................................................... 32
Conclusions ................................................................................................................................................. 34
References .................................................................................................................................................. 35

III
List of Figures
Figure 1: Horseshoe Lake Location Map ........................................................................................................................ 4
Figure 2: Horseshoe Lake soil gradation ........................................................................................................................ 5
Figure 3: Modified Proctor Curve .................................................................................................................................. 6
Figure 4: CBR values of Horseshoe Lake sand treated with fibers................................................................................. 7
Figure 5: CBR results of samples at 8% moisture treated with Soil-Sement ................................................................. 8
Figure 6: CBR results for samples at 4% moisture with Soil-Sement ............................................................................. 8
Figure 7: CBR test results of using both Soil-Sement and geofibers .............................................................................. 9
Figure 8: Fibers used on Horseshoe Lake road ............................................................................................................ 13
Figure 9: Soil-Sement shipping totes ........................................................................................................................... 14
Figure 10: Soil-Sement applied from water truck ........................................................................................................ 14
Figure 11: Roadway after being "fluffed" ................................................................................................................... 15
Figure 12: Achieving uniform application of fibers ...................................................................................................... 16
Figure 13: Rototilling geofibers ................................................................................................................................... 16
Figure 14: Final mixing of Soil-Sement and geofibers ................................................................................................. 17
Figure 15: Shaping and grading ................................................................................................................................... 17
Figure 16: Compacting roadway .................................................................................................................................. 18
Figure 17: Completed roadway ................................................................................................................................... 18
Figure 18: Roadway one week after construction ....................................................................................................... 23
Figure 19: Roadway three weeks after construction (August 28th, 2010) ................................................................... 25
Figure 20: Test section September 7, 2010 ................................................................................................................. 28
Figure 21: CBR over time ............................................................................................................................................. 31
List of Tables
Table 1: CBR values 100 ft. immediately before start of construction (July 30th) ....................................................... 20
Table 2: CBR values 100 feet immediately after end of construction (July 30th) ......................................................... 21
Table 3: CBR values of test section immediately after construction (July 31st) ........................................................... 21
Table 4: CBR measurements one week after construction (August 7th, 2010) ............................................................ 24
Table 5: CBR measurements three weeks after construction (August 28th, 2010) ...................................................... 26
Table 6: CBR measurements September 7, 2010 ........................................................................................................ 27
Table 7: CBR measurements October 7, 2010 ............................................................................................................. 29
Table 8: CBR measurements May 22, 2011 ................................................................................................................. 30
Table 9: CBR measurements September 9, 2011 ........................................................................................................ 31

1
Abstract
One solution to reducing the cost of importing gravel in areas where available soils are
predominately silts and sands is to stabilize the local soils with geofibers and synthetic fluids.
There have been several studies which have evaluated improvements in soil strength using
geofibers. Laboratory work at the Alaska University Transportation Center has shown that the
use of geofibers in combination with synthetic fluids has the potential to stabilize silts and
sands, making them usable for roadway and airport construction. A test 500 foot test section
was constructed on Horseshoe Lake Road, near Wasilla, Alaska. The test section was comprised
of 250 feet using six inches of geofiber and Soil-Sement® and 250 feet using twelve inches of
geofiber and Soil-Sement®. The test section was monitored over 16 months for performance
and soil strength. Overall the test section has performed well.
Acknowledgements
The authors wish to thank Amit Armstrong, Western Federal Lands Highway Division, FHWA for
funding this study. The authors also wish to thank Dave Brangan, Peak Oil Industries for his
assistance in constructing the test section and Melvin Main, Midwest Industries for his
assistance in providing technical expertise and securing the Soil-Sement® for the project. We
appreciate the work done by Dr. Kenan Harzirbaba to develop the project specifications before
leaving AUTC.
2
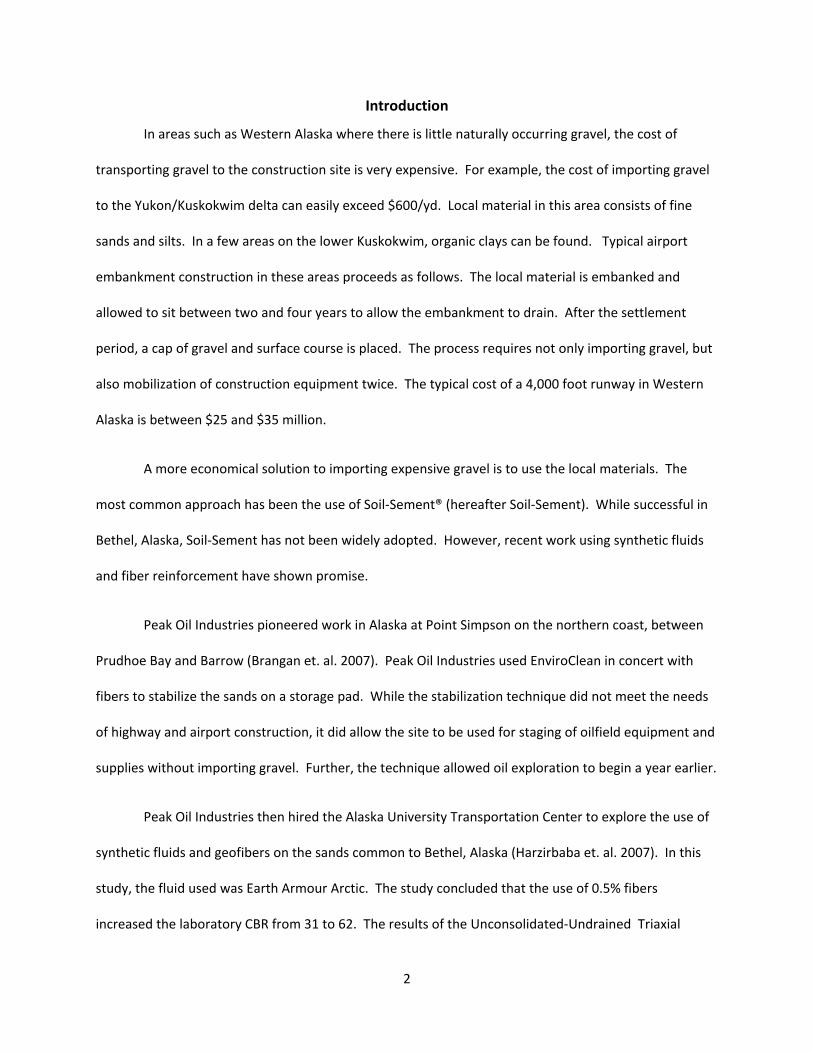
Introduction
In areas such as Western Alaska where there is little naturally occurring gravel, the cost of
transporting gravel to the construction site is very expensive. For example, the cost of importing gravel
to the Yukon/Kuskokwim delta can easily exceed $600/yd. Local material in this area consists of fine
sands and silts. In a few areas on the lower Kuskokwim, organic clays can be found. Typical airport
embankment construction in these areas proceeds as follows. The local material is embanked and
allowed to sit between two and four years to allow the embankment to drain. After the settlement
period, a cap of gravel and surface course is placed. The process requires not only importing gravel, but
also mobilization of construction equipment twice. The typical cost of a 4,000 foot runway in Western
Alaska is between $25 and $35 million.
A more economical solution to importing expensive gravel is to use the local materials. The
most common approach has been the use of Soil-Sement® (hereafter Soil-Sement). While successful in
Bethel, Alaska, Soil-Sement has not been widely adopted. However, recent work using synthetic fluids
and fiber reinforcement have shown promise.
Peak Oil Industries pioneered work in Alaska at Point Simpson on the northern coast, between
Prudhoe Bay and Barrow (Brangan et. al. 2007). Peak Oil Industries used EnviroClean in concert with
fibers to stabilize the sands on a storage pad. While the stabilization technique did not meet the needs
of highway and airport construction, it did allow the site to be used for staging of oilfield equipment and
supplies without importing gravel. Further, the technique allowed oil exploration to begin a year earlier.
Peak Oil Industries then hired the Alaska University Transportation Center to explore the use of
synthetic fluids and geofibers on the sands common to Bethel, Alaska (Harzirbaba et. al. 2007). In this
study, the fluid used was Earth Armour Arctic. The study concluded that the use of 0.5% fibers
increased the laboratory CBR from 31 to 62. The results of the Unconsolidated-Undrained Triaxial

3
Compression tests also showed an increase in friction angle from 41.8o to 53.6o and an increase in
cohesion from 2.9 psi to 23.5 psi. The failure mode of the fiber-treated soil was similar to that of a
granular material. The study also concludes that the fiber-treated soil became strain-hardened, which is
again similar to the behavior of a granular soil. When 5% Earth Armour was added and aged for 10 days,
CBR strengths of 124 were achieved. The study showed the combination of fibers and synthetic fluid
could be used to stabilize fine-grained sands.
Geofibers and synthetic fluid is a developing technology. Additional laboratory work at the
University of Alaska Fairbanks has shown that this technology can be used on a wide range of sands and
silts to increase the bearing capacity of these soils (Gullu and Hazirbaba, 2010). Work by Jeb Tingle and
others has also shown the value of this technique. (Tingle and Santoni, 2003)
The combination of geofibers and synthetic fluid have not been used extensively in the field yet,
so moving the concept from laboratory experiments to field applications is the next step. Test sites are
the only way of proving the performance of this technology. FHWA Federal Lands graciously funded the
construction of a test section at Horseshoe Lake.
Horseshoe Lake is located near Houston, Alaska. The site is a road that travels around the
perimeter of the lake; the section of road containing the soil used in this investigation is 520 feet long.
The site was chosen because of the presence of poorly graded sand that is similar in nature to material
found in more rural portions of Alaska. Visual inspection of the soil at Horseshoe Lake showed a small
amount of fines, and very few large cobbles. A satellite picture of the site appears in Figure 1. The
Horseshoe lake site presents the advantage of being relatively close to Wasilla, making monitoring the
road easy and affordable. The construction of the test site was provided by Peak Civil Technologies, a
company based in Anchorage, Alaska.

4
Figure 1: Horseshoe Lake Location Map
Materials
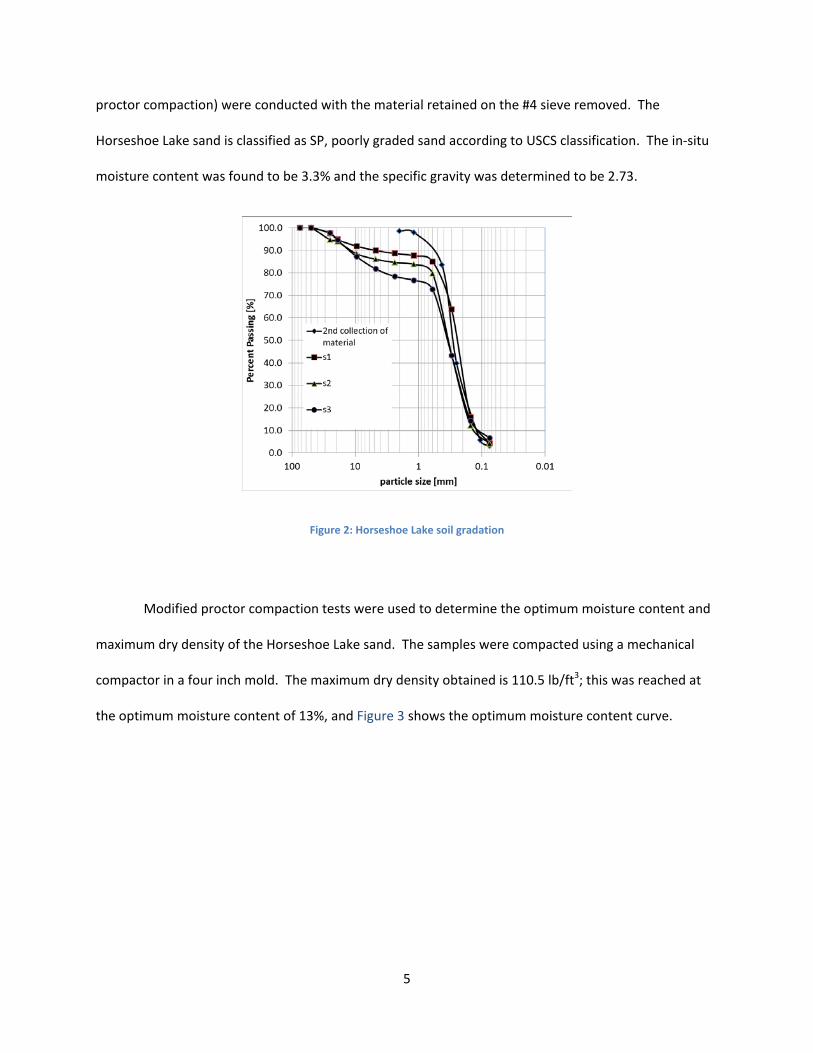
The sand available at the site was tested for general soil properties in the laboratory at the
University of Alaska Fairbanks. Tests performed to determine general soil properties were Sieve
Analysis (ASTM 422), Modified Proctor Compaction (ASTM D1557), and Specific Gravity (ASTM 792). The
particle size distribution curve is shown as Figure 2. The original Horseshoe Lake samples are
represented as S1, S2, and S3 on the particle distribution curve. Additional Horseshoe Lake sand was
collected for testing because the initial collection did not yield enough material to finish all testing. In
order to verify that the second material collected was relatively similar to that of the first samples, the
grain size was examined. In Figure 2, the curve titled “2nd collection of material” corresponds with these
samples. The material that did not pass a #4 sieve was discarded prior to the ASTM 422 standard sieving
process. This was done to remove some small organic material; there are no data points on the graph
for that region. It should be noted that all tests after sieve analysis (CBR, specific gravity, modified
5
proctor compaction) were conducted with the material retained on the #4 sieve removed. The
Horseshoe Lake sand is classified as SP, poorly graded sand according to USCS classification. The in-situ
moisture content was found to be 3.3% and the specific gravity was determined to be 2.73.
Figure 2: Horseshoe Lake soil gradation
Modified proctor compaction tests were used to determine the optimum moisture content and
maximum dry density of the Horseshoe Lake sand. The samples were compacted using a mechanical
compactor in a four inch mold. The maximum dry density obtained is 110.5 lb/ft3; this was reached at
the optimum moisture content of 13%, and Figure 3 shows the optimum moisture content curve.

6
Figure 3: Modified Proctor Curve
Preliminary Testing
The test used to determine material strength in the laboratory was the California Bearing Ratio
(CBR) test (ASTM D1883). Prior to construction at the Horseshoe Lake site, laboratory tests were
completed to determine the amount of geofiber and Soil-Sement required to produce the greatest
increase in strength.
The initial phase of laboratory testing examined the CBR value when varying amounts of fiber
percentages were included. The fiber percentages used were 0.2%, 0.5%, and 0.8% by the dry weight of
the soil; these were chosen based on the previous research by Gullu and Hazirbaba (2010). The fibers
used during testing were fibrillated fibers two inches in length. The samples used in the fiber-only tests
were unsoaked (that is, immediately after compaction the samples were tested). Only two moisture
content levels were tested, 4% and 8%, because the change in dry density is fairly low (less than 1 lb/ft3).
The results of the fiber-only testing are presented in Figure 4. The optimum fiber content in both cases
is 0.5% by the dry weight of the soil.

7
Figure 4: CBR values of Horseshoe Lake sand treated with fibers
The Soil-Sement came with a manufacturer’s recommendation to use 1 gallon of Soil-Sement for
a section of 20 square feet and a section depth of 4 inches. The unit weight of the Soil-Sement is
1.08g/mL based on our laboratory evaluation; this yields a dosage percentage of nearly 2% by the dry
weight of the soil. The final dry-weight percentages of Soil-Sement used for testing were 1%, 1.5%, and
2%. Two moisture contents,4%, and 8%, were examined for testing with Soil-Sement with and without
fibers. The results showed that for samples containing 8% moisture and treated with Soil-Sement, all
treatment dosages produced relatively similar CBR results (around 40; see Figure 5). The samples with
4% moisture content and 2% Soil-Sement start to show a noticeable increase in the CBR value. Test
results for samples with 4% moisture, Soil-Sement, and geofibers is shown in Figure 6.

8
Figure 5: CBR results of samples at 8% moisture treated with Soil-Sement
Figure 6: CBR results for samples at 4% moisture with Soil-Sement
0
10
20
30
40
50
60
CBR
Valu
e
0
10
20
30
40
50
60
0%GF+0%SF+4%W 0.5%F+0%SF+4%W 0.5%F+1%SS+4%W-14day cure
CBR
Valu
e

9
The final series of laboratory tests evaluated the use of Soil-Sement in a freeze-and-thaw
condition. Test samples were prepared in two ways: (1) samples were cured for 14 days in an open air
environment, soaked for 96 hours, frozen in a closed system environment for 24 hours, then allowed to
thaw for 24 hours at 100% relative humidity before CBR testing; and (2) Samples were allowed to cure
for 14 days, then frozen and thawed according to the same process, with no soaking prior to freezing
and thawing.
The results of the freeze-thaw testing showed that samples treated with Soil-Sement showed
little to no degradation in CBR value for either the soaked or the un-soaked samples. The results of the
freeze-thaw CBR testing are presented in Figure 7. The data indicates the material is not freeze-thaw
susceptible, an important consideration in cold climates.
Figure 7: CBR test results of using both Soil-Sement and geofibers
10
Construction
The test section at Horseshoe Lake consisted of two subsections of 250 feet each. The eastern
end of the section was 6 inches in thickness while the western end of the test section was 12 inches
thick. The 12 inch section was constructed in two layers, and each layer was compacted with a
minimum of six coverages by a 4 ton steel-wheeled roller.
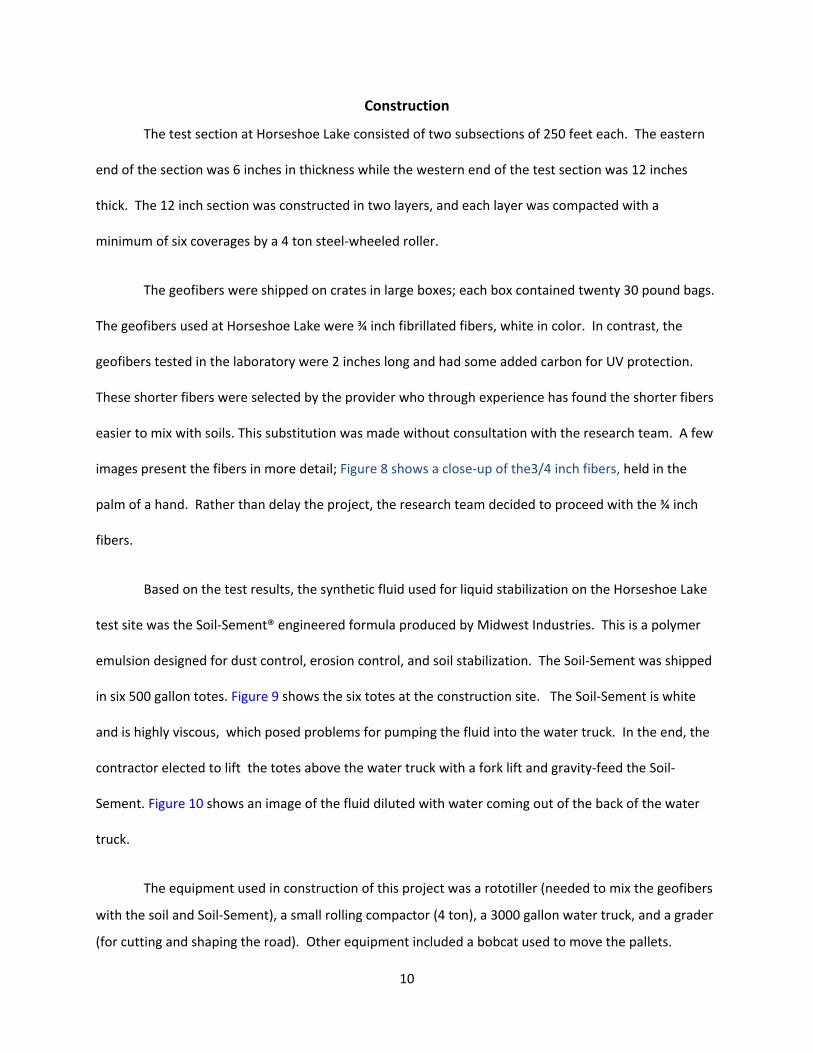
The geofibers were shipped on crates in large boxes; each box contained twenty 30 pound bags.
The geofibers used at Horseshoe Lake were ¾ inch fibrillated fibers, white in color. In contrast, the
geofibers tested in the laboratory were 2 inches long and had some added carbon for UV protection.
These shorter fibers were selected by the provider who through experience has found the shorter fibers
easier to mix with soils. This substitution was made without consultation with the research team. A few
images present the fibers in more detail; Figure 8 shows a close-up of the3/4 inch fibers, held in the
palm of a hand. Rather than delay the project, the research team decided to proceed with the ¾ inch
fibers.
Based on the test results, the synthetic fluid used for liquid stabilization on the Horseshoe Lake
test site was the Soil-Sement® engineered formula produced by Midwest Industries. This is a polymer
emulsion designed for dust control, erosion control, and soil stabilization. The Soil-Sement was shipped
in six 500 gallon totes. Figure 9 shows the six totes at the construction site. The Soil-Sement is white
and is highly viscous, which posed problems for pumping the fluid into the water truck. In the end, the
contractor elected to lift the totes above the water truck with a fork lift and gravity-feed the Soil-
Sement. Figure 10 shows an image of the fluid diluted with water coming out of the back of the water
truck.
The equipment used in construction of this project was a rototiller (needed to mix the geofibers
with the soil and Soil-Sement), a small rolling compactor (4 ton), a 3000 gallon water truck, and a grader
(for cutting and shaping the road). Other equipment included a bobcat used to move the pallets.

11
Prior to construction, the road was “fluffed” using a rototiller (see Figure 11). “Fluffing” helps
reduce density in the road soils before treatment, which aids in better distribution of the geofibers and
Soil-Sement. The fluffing process involves simply running the rototiller over the surface of the test site
in situ.
In order to approximate the correct dosage rate, workers emptied each 30lb bag of geofibers at
8 foot intervals. The actual mixture reached was 0.4% geofibers by dry weight of the soil, which is
slightly lower than the laboratory-observed optimum fiber point. Because the weight of fiber delivered
to the project was lower than expected, the amount of geofiber was reduced in order to get a uniform
distribution of fiber. The fibers were placed and spread using a garden rake, as shown in Figure 12.
Once the fibers were placed evenly throughout the road bed, they were mixed into the sand
using the rototiller (see Figure 13). The rototiller made several passes over the surface of the road until
the fibers were thoroughly and evenly mixed throughout the test site.
Application of the Soil-Sement was completed using the 3000 gallon water truck (Figure 10). As
noted above, the main problem encountered was transferring the Soil-Sement to the water truck.
Elevating the containers so that gravity-feeding increased the pumping speed overcame this issue, albeit
with some delay. The Soil-Sement was diluted with water to aid application as well as to bring the soil
closer to the optimum moisture content. Field moisture content tests were conducted to determine
the in-situ moisture content of the soil, which was found to be 8% on average before construction.
Several hours elapsed between mixing the fibers with the soil and application of the Soil-Sement
because of the delaying getting the Soil-Sement into the water truck. New measurements, taken after
the Soil-Sement was transferred to the water truck showed that the moisture content had fallen to 6%.
A total of 1650 gallons of Soil-Sement was mixed with roughly 1450 gallons of water and applied at the
Horseshoe Lake test site. Using these amounts brings the total percentage of Soil-Sement per the dry

12
weight of the soil to be 3.2%, at a moisture content of 8.6%. This is slightly lower than the 4% optimum
determined in the laboratory.
The water truck applied the Soil-Sement/water solution a total of four times, twice in each
direction of traffic. After the first application on each side, the sand seemed to absorb most of the Soil-
Sement; on the second pass the liquid pooled on the top layer of soil several minutes before eventually
being absorbed.
Once the Soil-Sement was applied, the rototiller was used to thoroughly combine it with the
geofibers and soil. The rototiller combining all the treatment materials is shown in Figure 14. In this
picture the noticeable pooling during Soil-Sement application is visible on the parallel tracks in front of
the rototiller. After mixing, the road section was then cut and shaped using a grader (see Figure 15).
Once the road was shaped and leveled it was compacted as shown in Figure 16.
The road was prepared initially as though the entire 500 foot section would be shaped in a 6
inch lift. Once the entire 500 foot section was compacted, for half the test section, excess soil on the
sides was pushed on top to create a second layer for the twelve inch section. The second 6 inch layer
was prepared through the same processes described earlier.
Once thorough mixing was finished and the road was compacted a final application of Soil-
Sement was used to seal the top layer of the soil. The sealant application was composed of 1450 gallons
of Soil-Sement mixed with a small amount of water. The Soil-Sement sealant keeps the surface fibers in
place and provides a stiff surface on the road bed. The completed roadway is shown in Figure 17.
The cost of the 500 foot constructed section was $50,000, a figure that does not include any profit for
either the contractor or the supplier. This equates to about $180/ton. Assuming addition of a 15%
profit, the cost would increase to about $207/ton. Similar applications in western Alaska could be

13
estimated at about twice that ($414/ton), a price that is still competitive with that of importing gravel
for more traditional construction methods.
Figure 8: Fibers used on Horseshoe Lake road

14
Figure 9: Soil-Sement shipping totes
Figure 10: Soil-Sement applied from water truck

15
Figure 11: Roadway after being "fluffed"

16
Figure 12: Achieving uniform application of fibers
Figure 13: Rototilling geofibers

17
Figure 14: Final mixing of Soil-Sement and geofibers
Figure 15: Shaping and grading

18
Figure 16: Compacting roadway
Figure 17: Completed roadway

19
Initial Test Results
The measure of improvement used to gauge the strength increase in the road over time is the
stiffness. The stiffness of the road is a convenient measurement because it can easily be measured
using a Humboldt Geogauge, and just as simply, converted to CBR. According to Humboldt, the
Geogauge measures the average stiffness up to a depth of 8 inches.
To establish initial stiffness of the original road bed, preliminary stiffness tests were taken at
points 100 feet before the treated section of road and 100 feet after. The treated section had already
been fluffed using heavy equipment, so it was determined that using the sections of road before and
after the treated section would produce stiffness results similar to that of the test section before the soil
was disturbed.
Stiffness measurements were taken with a Humboldt Geogauge at 10 foot increments initially
(in 2010) and at 50 foot increments in 2011. For each location, three readings were taken; one through
the center of the road and one nine feet from the center on either side. The stiffness measurements
were converted to CBR values so that they could be compared with the results of the laboratory testing.
The stiffness and CBR results for the 100 foot section of road before the test section are presented in
Table 1. The results from the stiffness measurements on the 100 foot section after the treated section
are presented in Table 2. The 100 foot stretch of road before the treated section had an average CBR of
23; the 100 foot stretch after the treated section had a CBR value of 36 in the center of the road and
slightly lower on the sides (12 closest to the lake and 18 on the north side). Informal, prior observation
suggested that the test section was softer than these stretches. When the test section was selected, the
research team noted that tires made a slight depression in the surface in the test area and not on the

20
adjacent areas. Unfortunately, the contractor tilled the test section the day before the research team
arrived, making it impossible to collect a good set of base measurements.
Once the test section was completed, a series of stiffness measurements were taken to provide
a basis for documenting stiffness improvement over time. These stiffness measurements were taken at
50 foot intervals throughout the full 500 feet of the road, encompassing both the 6 inch and 12 inch lifts.
These initial measurements were very low, with an average CBR value of 5 in the center of the road and
3 on the outside measurements. The individual CBR values for the road on July 31st, the day of
construction, are presented in Table 3. These results are similar to how the road bed would react
without the influence of the treatment, because the Soil-Sement had not cured and the fibers had not
undergone enough strain to activate their potential contribution.
Table 1: CBR values 100 ft. immediately before start of construction (July 30th)
Distance measurement
Taken Lake Side Center of Road Tree Side [ft] (MN/m) CBR (MN/m) CBR (MN/m) CBR 0 10.98 30 8.15 14 7.35 10
10 10.21 25 8.21 14 8.29 14 20 10.15 24 10.91 29 8.3 14 30 10.62 27 10.84 29 10.39 26 40 10.79 28 10.15 24 10.58 27 50 11.06 30 9.38 20 9.2 19 60 10.66 28 11.69 34 8.61 16 70 9.14 19 8.85 17 10.81 29 80 10.97 30 7.47 11 10.06 24 90 7.95 13 10.57 27 12.5 40
100 8.26 14 9.9 23 10.66 28 Averages 24.4 22.0 22.1

21
Table 2: CBR values 100 feet immediately after end of construction (July 30th)
Distance measurement
Taken Lake Side Center of Road Tree Side [ft] (MN/m) CBR (MN/m) CBR (MN/m) CBR 0 7.78 12 11.05 30 8.15 14
10 8.75 17 11.94 36 8.92 18 20 8.8 17 10.59 27 6.04 5 30 6.22 6 12.85 43 10.38 26 40 7.07 9 12.93 43 8.44 15 50 9.1 19 11.43 33 8.52 16 60 7.51 11 12.75 42 8.13 14 70 9.13 19 11.95 36 9.38 20 80 6.76 8 10.63 27 7.19 9 90 6.82 8 12.65 41 11.54 33
100 6.46 6 12.6 41 9.83 23 Averages 12.0 36.3 17.8
Table 3: CBR values of test section immediately after construction (July 31st)
Distance measurement
Taken Lake Side Center of Road Tree Side [ft] (MN/m) CBR (MN/m) CBR (MN/m) CBR 0 6.15 5 9.23 19 5.45 3
50 4.4 0 5.81 4 5.46 3 100 5.46 3 5.36 3 6.51 7 150 6.15 5 7.26 10 7.12 9 200 5.58 3 8.34 15 5.95 5 258 4.79 1 5.99 5 5.66 4
6” Layer Avg 2.8 9.3 5.2 300 5.17 2 4.63 1 4.63 1 350 4.62 1 3.08 0 4.07 0 400 6.06 5 4.54 0 3.98 0 450 5.24 2 3.66 0 4.44 0 500 4.54 0 4.46 0 4.71 1 530 5.75 4 5.2 2 6.05 5
12” Layer Avg 2.3 0.5 1.2

22
Week 1 and Week 3 Measurements (August 7th and August 28th, 2010)
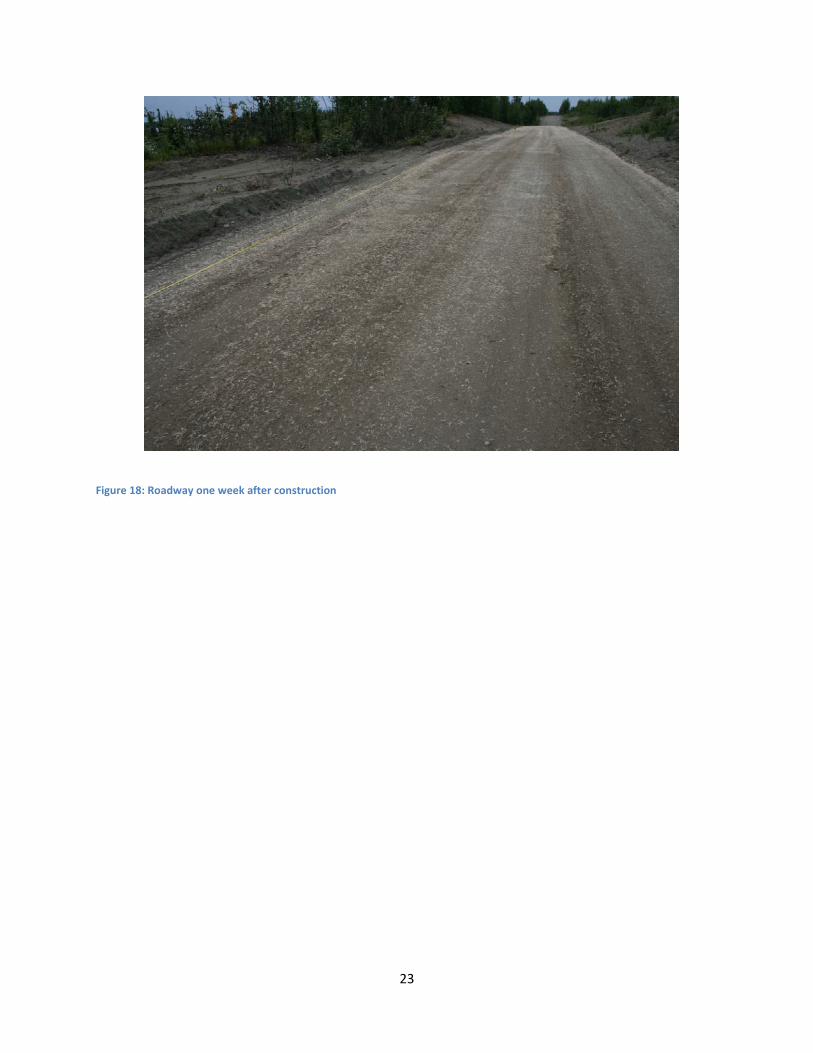
One week after the completion of the treatment, stiffness measurements were taken were
taken again at 25 foot intervals. To visual observation, the test site appeared stiffer and the surface
looked more abrasion-resistant than immediately after construction; Figure 18 shows the road a week
after construction. The average CBR value in the center of the road is 22, an improvement of 340%.
The CBR values on the sides of the road also increased, with values of 17 and 18, on the tree and lake
sides respectively. The CBR values obtained throughout the road one week (August 7th) after treatment
are presented in Table 4.
It is interesting to note that local residents repeatedly indicate how much better the roadway
performed than before. Some even ask if the approach could be used on their driveways.
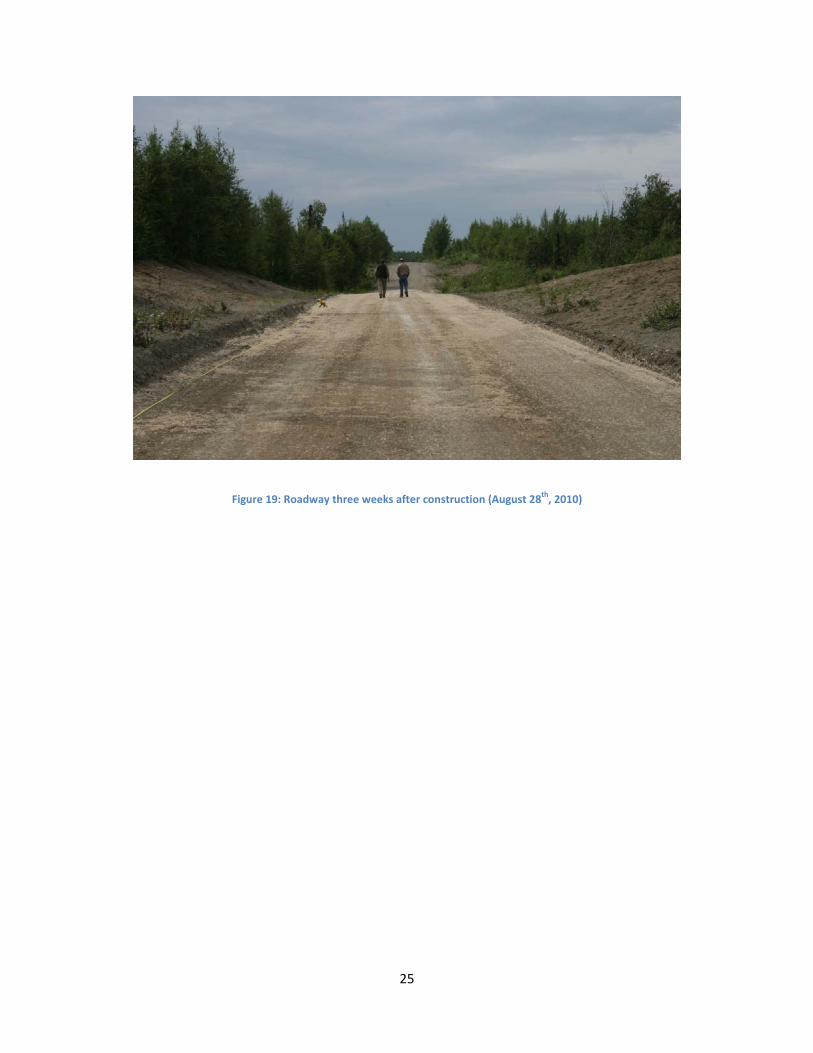
Some initial visual observations noted that some fibers had collected on the surface of the road
near the center; this redistribution was most likely due to the wind from passing vehicles picking up the
surface fibers and redepositing them. The fibers in the center of the road are visible in Figure 19. It is
evident that at the front of the road (photo foreground) there are fewer fibers on the surface, but closer
to where the people are standing it is clear there are significantly more fibers in this area.
The readings taken on the road three weeks after treatment (August 28th) were slightly lower
than the ones taken on August 7th. This could be attributed to the low volume of traffic on the road not
yet activating the potential stiffness increase offered by the geofibers. The results of the stiffness
measurements are presented in Table 5; the average CBR value in the center of the road is 15, with
values of 11 and 10 on the tree and lake sides of the road respectively.
23
Figure 18: Roadway one week after construction

24
Table 4: CBR measurements one week after construction (August 7th, 2010)
Distance measurement
Taken Lake Side Center of Road Tree Side [ft] (MN/m) CBR (MN/m) CBR (MN/m) CBR 0 8 13 9.84 23 8.43 15
25 8.43 15 9.06 18 7.56 11 50 7.76 12 9.73 22 8.83 17 75 7.33 10 8.58 16 9.27 19
100 6.68 7 7.04 9 7.55 11 125 6.55 7 7.03 9 7.75 12 150 5.45 3 7.79 12 8.05 13 175 6.19 5 7.59 11 8.35 15 200 7.36 10 12.19 38 7.65 11 225 5.6 3 9.93 23 8.1 13 250 6.56 7 9.41 20 8.03 13 258 6.81 8 8.11 14 6.09 5
6” Layer Avg 8.3 17.9 12.9 275 7.8 12 8.94 18 5.97 5 300 6.52 7 7.98 13 5.91 4 325 8.97 18 7.6 11 7.87 12 350 8.38 15 7.55 11 6.37 6 375 6.09 5 7.58 11 6.32 6 400 8.41 15 7.32 10 6.96 8 425 6.5 7 7.92 13 5.96 5 450 6.94 8 7.08 9 6.45 6 475 7.61 11 6.31 6 8.08 13 516 11.72 35 9.01 18 7.32 10
12” Layer Avg 13.3 11.9 7.5
25
Figure 19: Roadway three weeks after construction (August 28th, 2010)

26
Table 5: CBR measurements three weeks after construction (August 28th, 2010)
Distance measurement
Taken Lake Side Center of Road Tree Side [ft] (MN/m) CBR (MN/m) CBR (MN/m) CBR 0 8 13 9.84 23 8.43 15
25 8.43 15 9.06 18 7.56 11 50 7.76 12 9.73 22 8.83 17 75 7.33 10 8.58 16 9.27 19
100 6.68 7 7.04 9 7.55 11 125 6.55 7 7.03 9 7.75 12 150 5.45 3 7.79 12 8.05 13 175 6.19 5 7.59 11 8.35 15 200 7.36 10 12.19 38 7.65 11 225 5.6 3 9.93 23 8.1 13 250 6.56 7 9.41 20 8.03 13 258 6.81 8 8.11 14 6.09 5
6” Layer Avg 8.3 17.9 12.9 275 7.8 12 8.94 18 5.97 5 300 6.52 7 7.98 13 5.91 4 325 8.97 18 7.6 11 7.87 12 350 8.38 15 7.55 11 6.37 6 375 6.09 5 7.58 11 6.32 6 400 8.41 15 7.32 10 6.96 8 425 6.5 7 7.92 13 5.96 5 450 6.94 8 7.08 9 6.45 6 475 7.61 11 6.31 6 8.08 13 516 11.72 35 9.01 18 7.32 10
12” Layer Avg 14.1 12.0 7.5

27
Measurements taken on September 7th and October 7th, 2010
Table 6: CBR measurements September 7, 2010
Distance measurement Taken Lake Side
Center of Road Tree Side
[ft] (MN/m) CBR (MN/m) CBR (MN/m) CBR 0 7.62 11 9.97 23 8.75 17 25 9.15 19 9.84 23 7.13 9 50 7.15 9 8.42 15 8.86 17 75 7.85 12 8.68 16 8.2 14 100 8.28 14 8.95 18 7.56 11 125 7.13 9 7.81 12 8.51 15 150 8.87 17 9.46 20 8.17 14 175 8.48 15 11.61 34 8.37 15 200 6.22 6 11.09 30 7.97 13 225 7.92 13 9.69 22 7.49 11 258 7.73 12 7.12 9 6.98 9 6” Layer Avg 12.4 20.2 13.2 275 8.32 15 6.48 7 7.13 9 300 7.65 11 8.32 15 6.99 9 325 8.89 17 6.74 8 6.63 7 350 9.72 22 6.38 6 6.99 9 375 6.88 8 8.05 13 7.15 9 400 6.92 8 7.59 11 6.91 8 425 7.49 11 6.15 5 6.45 6 450 9.41 20 8.95 18 9.28 20 516 11.87 36 7.52 11 8.47 15 12” Layer Avg 16.4 10.4 10.2

28
Figure 20: Test section September 7, 2010

29
Table 7: CBR measurements October 7, 2010
Distance measurement Taken Lake Side
Center of Road Tree Side
[ft] (MN/m) CBR (MN/m) CBR (MN/m) CBR 0 9.94 23 12.59 41 7.9 13 25 9.90 23 10.11 24 8.18 14 50 9.34 20 8.16 14 8.99 18 75 9.29 20 6.72 7 8.68 16 100 9.53 21 7.56 11 7.63 11 125 6.26 6 8.32 15 6.81 8 150 9.33 20 10.46 26 8.29 14 175 10.35 26 7.73 12 8.69 16 200 10.78 28 13.65 49 9.61 21 225 6.28 6 8.74 17 9.34 20 258 9.11 19 9.14 19 8.38 15 6” Layer Avg 19.3 21.3 15.1 260 8.20 14 10.26 25 7.28 10 275 7.90 14 8.13 14 5.91 4 300 6.74 13 5.60 3 5.97 5 325 8.12 8 7.39 10 9.88 23 350 8.61 14 5.92 5 7.21 9 375 7.57 16 7.26 10 5.96 5 400 5.97 11 7.32 10 8.03 13 425 6.93 5 8.02 13 6 5 450 7.37 8 5.35 3 7.06 9 475 8.06 10 6.74 8 9.05 18 516 7.73 13 6.88 8 11.03 30 12” Layer Avg 11.4 9.9 11.9
2011 Field CBR Measurements
The first CBR measurements of 2011 were taken on May 22, 2011. As indicated in Table 8, the data
shows the CBR values to be slightly higher than those measured the previous fall. Fortunately, there

30
was no degradation of the surface or soil strength over the winter, a major concern in cold climates.
Indeed, the surface looked exactly the same as the previous fall as shown in Figure 20.
Table 9 shows the CBR measurements on September 9, 2011. Again, measurements suggest a slight
increase in strength over the summer months. The roadway showed no change in characteristics from
the spring visit. However, there appears to be a slight increase in the amount of fiber on the side of the
road, indicating that there is some abrasion occurring. Unfortunately, no provision was made in the
testing protocol to measure the loss of thickness.
Figure 21 shows the average of CBR values over time for both the 6 inch and 12 inch test sections. Both
sections show a steady increase in strength over time. However, the 12 inch section has lower CBR
values until the September 9 measurements. This is likely due to inadequate compaction effort on the
12 inch section.
Table 8: CBR measurements May 22, 2011
Distance measurement Taken Lake Side
Center of Road Tree Side
[ft] (MN/m) CBR (MN/m) CBR (MN/m) CBR 0 10.15 24 6.96 8 9.86 23 50 11.45 33 7.94 13 9.72 22 100 8.86 17 7.19 9 7.78 12 150 10.81 29 9.93 23 8.46 15 200 6.43 6 12.02 37 8.84 17 250 7.83 12 9.56 21 10.61 27 6” Layer Avg 20.2 18.5 19.3 260 7.96 13 9.54 21 6.86 8 300 9.62 21 7.70 12 7.88 12 350 9.16 19 9.88 23 7.85 12 400 8.62 16 9.04 18 8.97 18 450 6.79 8 7.46 11 7.11 9 516 7.16 9 10.85 29 11.7 34 12” Layer Avg 14.3 19.0 15.5

31
Table 9: CBR measurements September 9, 2011
Distance measurement Taken Lake Side
Center of Road Tree Side
[ft] (MN/m) CBR (MN/m) CBR (MN/m) CBR 0 10.91 29 13.10 45 12.06 37 50 9.28 20 8.55 16 10.56 27 100 11.57 34 9.48 21 9.56 21 150 7.72 12 8.92 18 9.6 21 200 8.49 15 8.65 16 8.83 17 250 10.11 24 10.35 26 10.73 28 6” Layer Avg 22.3 23.7 25.2 300 10.48 26 8.51 15 10.88 29 350 9.38 20 10.52 27 9.56 21 400 8.99 18 14.08 52 9.28 20 450 10.73 28 12.66 41 10.51 27 500 9.79 22 9.24 19 11.09 30 12” Layer Avg 20.8 30.8 25.7
Figure 21: CBR over time
0
5
10
15
20
25
30
July
30-
2010
Augu
s 7-2
010
Augu
st 2
8- 2
010
Sept
embe
r 7- 2
010
Oct
ober
7- 2
010
May
22-
201
1
Sept
embe
r 9- 2
011
CBR
Valu
e
6-inch layer
12-inch layer

32
Discussion
The Horseshoe Lake Road test site continues to perform well despite the lower-than-expected
CBR measurements. We did anticipate lower CBR values than those obtained in the laboratory since
Field CBRs do tend to be somewhat lower than laboratory values. Even taking this trend into account,
the values were lower than expected. This could be the result of using the Humbolt Gauge, which uses a
small vibratory load to estimate the stiffness of the soil. Soil stiffness in turn is correlated to CBR. Since
the correlation used was not developed for fiber-reinforced soils, the CBR reported could be a bit low.
Nonetheless, the Humbolt CBRs are valuable. The initial strength increase can be attributed to
the curing of the Soil-Sement. The continued increase in strength is likely due to the tensioning of the
fibers.
Our greatest concern for the test section was the anticipated abrasion of the surface. While
some abrasion is occurring, as evidenced by the continued increase in fiber along the roadway edge,
surface loss seems relatively small. However, the traffic volume and speed along the roadway has been
low. In the future, treating the surface with additional Soil-Sement or a chip seal to improve abrasion
resistance is advisable.
To date, there is no rutting in either the 6 inch or 12 inch lift test sections, which indicates the
stability of the treated sections is sufficient to support the light traffic. While the few trucks and school
busses that traverse this section have cause no distress, more frequent traffic would allow a more
thorough evaluation of the treatment durability.
The field freeze-thaw durability is consistent with the laboratory testing, since there was no
noticeable reduction in strength or loss of performance during the spring thaw. As is the custom in the
MatSu Borough, two to four inches of snow pack was left on the roadway through the winter months
and removed during the thawing period. We had asked the maintenance contractor to be especially
33
careful not to grade the surface of the road when removing the soft snowpack in the spring. We saw no
evidence of damage from the spring grading.
While the construction was not exactly as designed, the section is performing well. To date, we
have not repeated the laboratory testing to evaluate the differences between the ¾ inch fiber used and
the 2 inch fibers specified. The supplier and contractor were quite concerned about the use of longer
fibers for this application. They claim the longer fibers are nearly impossible to incorporate into the soil.
However, the work by Tingle et. al. (2003) showed that longer fibers could be incorporated. While the
research team was disappointed not to have the longer fibers incorporated into the project, the
information gained is still valuable. The ¾ in fibers do seem to be working well.
The construction did go smoothly. There were two minor problems, both of which are easily
resolved. The first was that the viscosity of the Soil-Sement made pumping difficult, primarily because
the pumps were sized to pump water. The contractor overcame this by gravity feeding the Soil-Sement
directly out of the totes into the water truck. The other option would be to use a suitable pump.
The second problem was that the compaction equipment was undersized. In the future, a 8 ton
rubber tire roller is recommended. The kneading action of the rubber tires should help tension the
fibers, thus improving the strength of the surface. The additional weight would allow compaction to a
greater depth than the compactor used in this first field test allowed. For the 12 inch lift section, the
compaction of the lower six inches of the fiber is likely inadequate.
Finally, since the six inch section is performing well, the need for the twelve inch section is
unclear due to the light traffic at this site. However, after evaluating the test section, it is recommended
that the synthetic fluid be eliminated in the lower six inches of the thicker section. This
recommendation is based on the performance of the test section and the laboratory test results, which
indicate that most of the strength gain comes from the fibers.

34
Conclusions
The Horseshoe Lake Road test site provides a good opportunity to carefully examine the use of
geofibers and Soil-Sement in a field application. Monitoring this easily accessible site near Wasilla,
Alaska will make it possible to note and identify problems that may come up so that contractors can be
better prepared in a remote area. The Horseshoe Lake sand is the ideal material to improve because it
has little-to-no bearing capacity as it sits untreated.
The use of fiber and Soil-Sement proved effective. Unfortunately, the traffic volumes are not
high enough to fully test the treatments. While the performance has been excellent over 16 months
since construction, the section should be monitored until the anticipated reconstruction in 2014.
The ¾ inch fibers seem to perform well, it is unknown whether the longer fibers would work any
better. Additional laboratory work should be performed to compare the fiber length with stiffness.
Since contractors claim shorter fibers are easier to handle, the shortest fiber which will provide the
desired soil strength should be used.
It is unclear how much the additional 6 inches of treated section adds to the performance, since
both sections are performing essentially the same at this point. Both time and traffic are needed to
answer this question.
Finally, at an estimated cost of $415/ton in Western Alaska, this process is competitive with
importing gravel.

35
References
Gullu and Hazirbaba, (2010) Hamza Gullu and Kenan Hazirbaba, California Bearing Ration Improvement
and Freeze-Thaw Performance of fine-grained soils treated with geofiber and synthetic fluid, Cold
Regions Science and Technology, volume 63, Issues 1-2, August 2010, Pages 50-60.
Hazirbaba, K., Connor, B., Davis, D., and Zhang, Y., (2007), “Final Report: The Use of Geofiber and
Synthetic Fluid for Stabilizing Marginal Soils,” INE Project Number: RR.07.03, October 1, 2007.
Tingle, JS, Santoni, RL (2003) “ Stabilization of Clay Soils with Nontraditional Additives,” Transportation
Research Record 1819, TRB, National Research Council, Washington DC, 2003, pp. 72-84.