Embed Size (px)
Citation preview
Civil and Environmental Science Journal
Vol. III, No. 02, pp. 060-071, 2020
60
Stability of Existing Banyukuwung Dam in Recent Hydrology
and Geotechnical Conditions
Pitojo Tri Juwono1, Runi Asmaranto1*, Ari Murdhianti2
1Water Resources Engineering Department, Faculty of Engineering, Universitas
Brawijaya, Malang, 65145, Indonesia 2Associate Expert water resources and dam, PT. Triando Konsultama, Malang, 65145,
Indonesia
Received 08-04-2019; accepted 25-06-2020
Abstract. Banyukuwung Dam is located in the villages of Sukorejo and Sudo, Sumber District,
Rembang Regency, Central Java Province. This dam was built in 1995-1997 to serve the needs
of 7750 ha of irrigation water and 35 l/s of raw water needs. Dam type is homogeneous reservoir,
has a height of 19.40 m above the riverbed and 25.40 m above the foundation excavation. The
length of the dam peak is 181.00 m and the width is 5.00 m while the reservoir volume under
normal water conditions is 1.64 million m3. Along with seasonal changes and extreme
hydrological behavior and based on an investigation of current geotechnical conditions, stability
analysis is needed based on these two conditions. It is very important to plan operational and
maintenance activities related to the dam maintenance program. So that it is expected to be useful
for the relevant agencies in making operational decisions. The purpose of this study was to
determine the stability of the existing Banyukuwung dam based on the latest hydrological and
geotechnical behavior. The results are expected to provide recommendations in the management,
operation and maintenance of the dam manager
Keywords: Banyukuwung reservoir, dam stability, hydrogeotechnical
1. Introduction
Water Resources are very important for humans because they are basic human needs. From all of
the water on the surface of the earth, only 2.5% is in the form of fresh water. With this very limited
amount, then needs the presence of protection on the existence of water resources and their optimal use.
In the context of the maximum utilization of water sources, needed the development effort and good
water management namely by building reservoirs to store water.
Banyukuwung Dam is located in Sumber District, Rembang Regency, it was built in 1995 [2]. In
general, the Dam is to collect water that is used to meet various needs including irrigation, raw water,
flood control, tourism and others. Analysis of the existing Banyukuwung dam stabilization needs to be
done considering the age of the building which is old and there are some symptoms of damage due to
hydraulic behavior, so that the preservation of building functions will be maintained [1][2][3].
1 Cite this as: Juwono, P., Asmaranto, R., & Murdhianti, A. (2020). Stability of Existing Banyukuwung DAM in
Recent Hydrology and Geotechnical Conditions. Civil and Environmental Science Journal (Civense), 3(2), 60-
71. doi: https://doi.org/10.21776/ub.civense.2020.00302.1
Civil and Environmental Science Journal
Vol. III, No. 02, pp. 060-071, 2020
61
2. Material and Methods
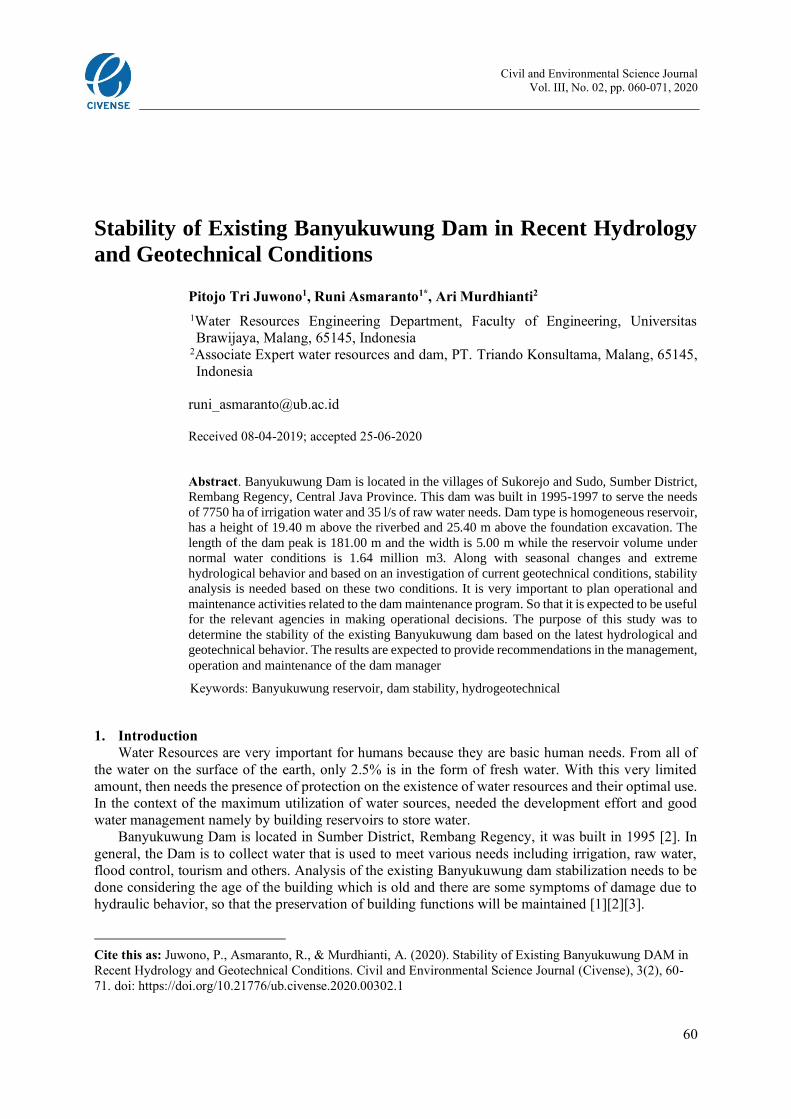
2.1. Study Location
The Study Location is Banyukuwung Dam which is located at the coordinate 06°46’51” S and
111°19’18,9” E in Banyukuwung, Sukorejo and Sudo Village, Sumber Subdistrict, Rembang Regency,
Central Java Province.
Figure 1. Location of Study
Banyukuwung Dam was built to provide 35 l/s raw water estimated to be able to meet the water
needs of ± 20,000 residents in Rembang Regency, especially Kaliori District; and to provide irrigation
supplies of around 775 ha through the Pentil Weir [2].
2.2. Primary and secondary data collection
Data needed in the processing of this study, among others [2][5];
1. Rainfall Data from Banyukuwung station for 1973-2017
2. Map of the Indonesian Earthquake 2017
3. Geotechnical investigation data of the foundation and body of Dam
4. Cross section of Banyukuwung dam body
5. Instrumentation measurement of standpipe Piezometer
2.3. Study Stage
The steps of this study are arranged systematically so that facilitate the completion of this analysis.
The steps of the study that conducted are as follows [5][6];
1. Primary and secondary data collection
2. Determine the regional rainfall
3. Test the skewness of rainfall data
4. Frequency analysis test
5. Goodness of fit test
6. Maximum annual daily rainfall
7. Analysis of design flood discharge with the latest hydrological conditions
8. Flood Routing
9. Analysis of seepage in the body of the dam using the latest geotechnical data
10. Analysis of dam body stability using Bishop modified methods uses the latest soil sampling data
2.4. Geotechnical Survey and Investigation
A geotechnical investigation survey was conducted to find out the latest geotechnical parameters
which include [5][11]
Sukorejo Village
Rembang Regency
Banyukuwung dam
Civil and Environmental Science Journal
Vol. III, No. 02, pp. 060-071, 2020
62
1. Piezometer measurement
2. Investigation of undisturbed sampling at :
a. physical properties of landfill and foundation
b. mechanical properties of soil embankments and foundations
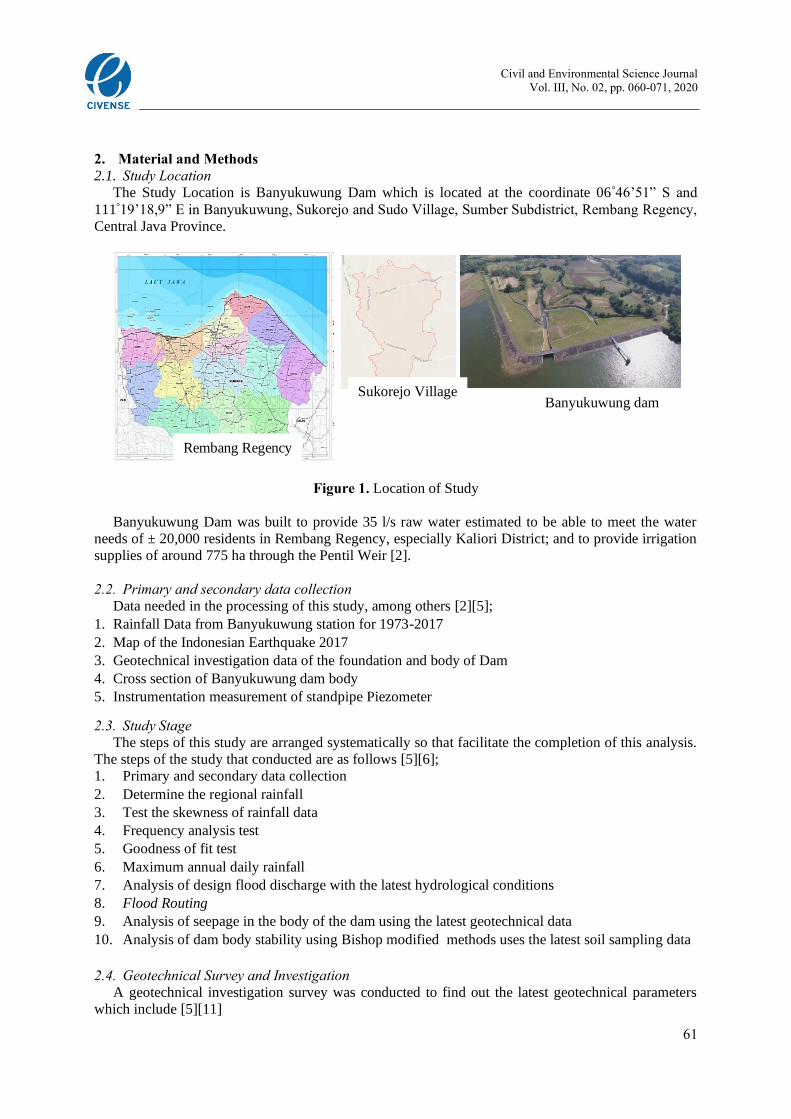
c. Permeability of embankments and foundation. Investigation of land in the field was carried out
by PT Supraharmonia in collaboration with the dam manager. The location of undisturbed
sampling points is as follows:
Figure 2. Drilling Bor location of soil properties investigation
Table. 1. Coordinate of drilling bore and depth
Location X Y Depth (m)
DB-1 535460.61 9250423.01 15 m
DB -2 535403.03 9250413.43 15 m
DB -3 535398.74 9250439.85 10 m
DB -4 535396.65 9250459.20 10 m
DB -5 535327.03 9250448.97 10 m
5 (five) drilling point locations (2 @ 15 m and 3 @ 10 m accompanied by a standard penetration test)
have been carried out accompanied by fairly undisturbed samples in several depths of soil.
2.5. Hydrological Analysis
Hydrological analysis is done by comparing the analysis of rainfall and flood plans based on the
results of analysis of studies in 1999, 2015 and present conditions. Hydrological calculations use basic
rain data at Sulang and Sumber rain stations. Flood tracing is conducted to determine the modification
of flood flow, to find out the maximum outflow discharge and maximum water level above the overflow
threshold.
Frequency analysis can be applied to river discharge or rain data using annual maximum data, the
largest data that occurs during one year, measured over several years. There are several forms of
continuous (theoretical) distribution functions, which are often used in frequency analysis for hydrology
such as the Normal distribution, Normal Log, Gumbel, Pearson, Pearson Log, etc [8][15].
DB-5 DB-1
DB-2
DB-3
DB-4
Civil and Environmental Science Journal
Vol. III, No. 02, pp. 060-071, 2020
63
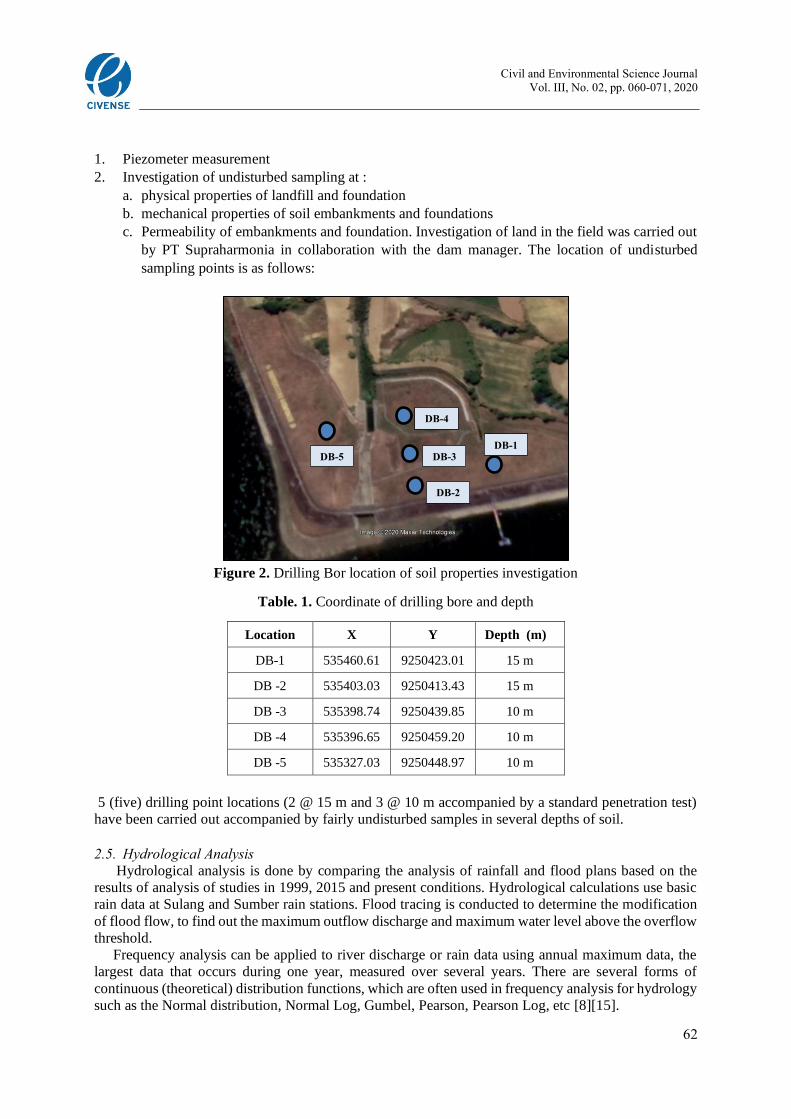
Figure 3. Banyukuwung catchment area
(11.20 km2)
2.6. Design Flood Discharge
Design Flood Discharge is a flood
discharge used to plan the safety level of danger
with the largest probability number. To analyze
the design flood discharge can be done using the
hydrograph method which is conducted using
the assist of a synthetic unit hydrograph model
and non-hydrographic methods carried out with
the help of frequency analysis techniques.
In this study conducted the comparison of
Nakayasu Synthetic Unit Hydrograph method
[17], Gamma I Synthetic Unit Hydrograph [16]
and HSS ITB Synthetic Unit Hydrograph
method [6][8]
2.7. Flood Routing
To obtain the flood water level on the dam
body it is necessary to conduct flood routing to
determine the outflow discharge of the flood
storage in the reservoir [11][17].
The width threshold type spillway is used
with elevation and volume as follows [4][12];
Q = Cd × B × H3/2 ……….(1)
With:
Cd = Discharge coefficient
B = Diversion width (m)
H = Water Level above the Spillway (m)
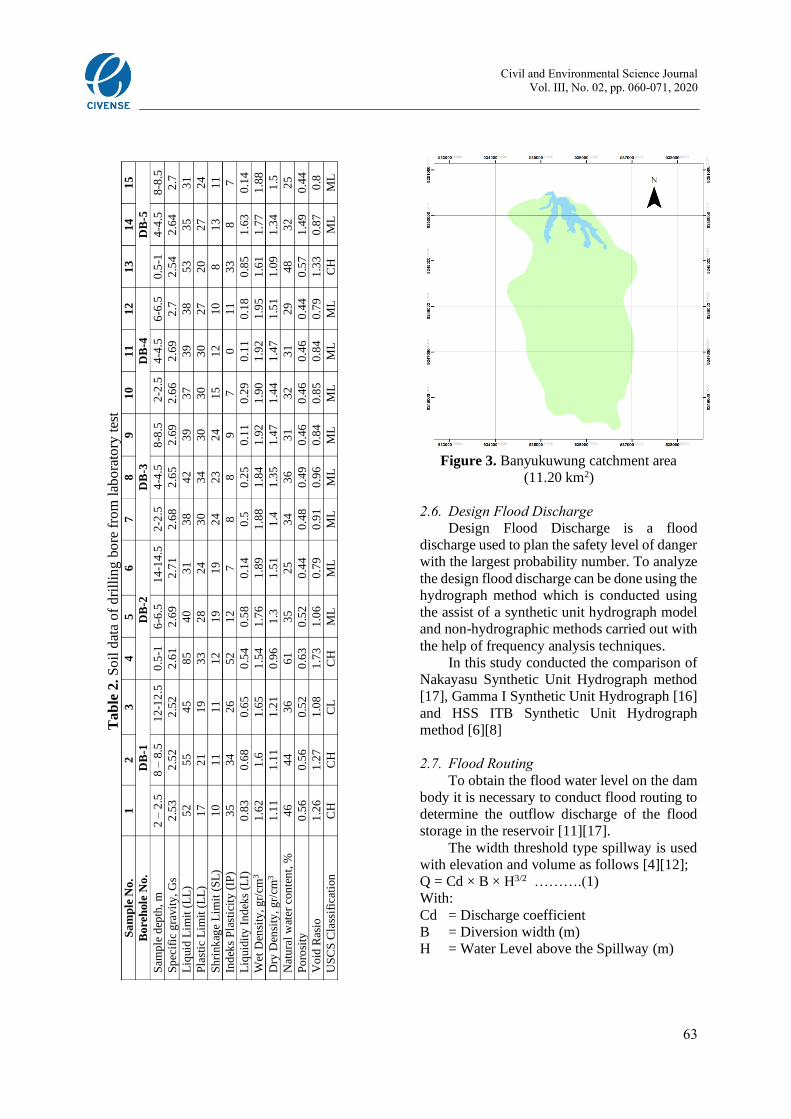
Ta
ble
2.
So
il d
ata
of
dri
llin
g b
ore
fro
m l
abo
rato
ry t
est
Sa
mp
le N
o.
1
2
3
4
5
6
7
8
9
10
11
12
13
14
15
Bo
reh
ole
No
. D
B-1
D
B-2
D
B-3
D
B-4
D
B-5
Sam
ple
dep
th, m
2
– 2
.5
8 –
8.5
1
2-1
2.5
0
.5-1
6
-6.5
1
4-1
4.5
2
-2.5
4
-4.5
8
-8.5
2
-2.5
4
-4.5
6
-6.5
0
.5-1
4
-4.5
8
-8.5
Sp
ecif
ic g
ravit
y, G
s 2
.53
2.5
2
2.5
2
2.6
1
2.6
9
2.7
1
2.6
8
2.6
5
2.6
9
2.6
6
2.6
9
2.7
2
.54
2.6
4
2.7
Liq
uid
Lim
it (
LL
) 5
2
55
45
85
40
31
38
42
39
37
39
38
53
35
31
Pla
stic
Lim
it (
LL
) 1
7
21
19
33
28
24
30
34
30
30
30
27
20
27
24
Sh
rink
age
Lim
it (
SL
) 1
0
11
11
12
19
19
24
23
24
15
12
10
8
13
11
Ind
eks
Pla
stic
ity
(IP
) 3
5
34
26
52
12
7
8
8
9
7
0
11
33
8
7
Liq
uid
ity
In
dek
s (L
I)
0.8
3
0.6
8
0.6
5
0.5
4
0.5
8
0.1
4
0.5
0
.25
0.1
1
0.2
9
0.1
1
0.1
8
0.8
5
1.6
3
0.1
4
Wet
Den
sity
, g
r/cm
3
1.6
2
1.6
1
.65
1.5
4
1.7
6
1.8
9
1.8
8
1.8
4
1.9
2
1.9
0
1.9
2
1.9
5
1.6
1
1.7
7
1.8
8
Dry
Den
sity
, g
r/cm
3
1.1
1
1.1
1
1.2
1
0.9
6
1.3
1
.51
1.4
1
.35
1.4
7
1.4
4
1.4
7
1.5
1
1.0
9
1.3
4
1.5
Nat
ura
l w
ater
con
ten
t, %
4
6
44
36
61
35
25
34
36
31
32
31
29
48
32
25
Po
rosi
ty
0.5
6
0.5
6
0.5
2
0.6
3
0.5
2
0.4
4
0.4
8
0.4
9
0.4
6
0.4
6
0.4
6
0.4
4
0.5
7
1.4
9
0.4
4
Vo
id R
asio
1
.26
1.2
7
1.0
8
1.7
3
1.0
6
0.7
9
0.9
1
0.9
6
0.8
4
0.8
5
0.8
4
0.7
9
1.3
3
0.8
7
0.8
US
CS
Cla
ssif
icat
ion
CH
C
H
CL
C
H
ML
M
L
ML
M
L
ML
M
L
ML
M
L
CH
M
L
ML
Civil and Environmental Science Journal
Vol. III, No. 02, pp. 060-071, 2020
64
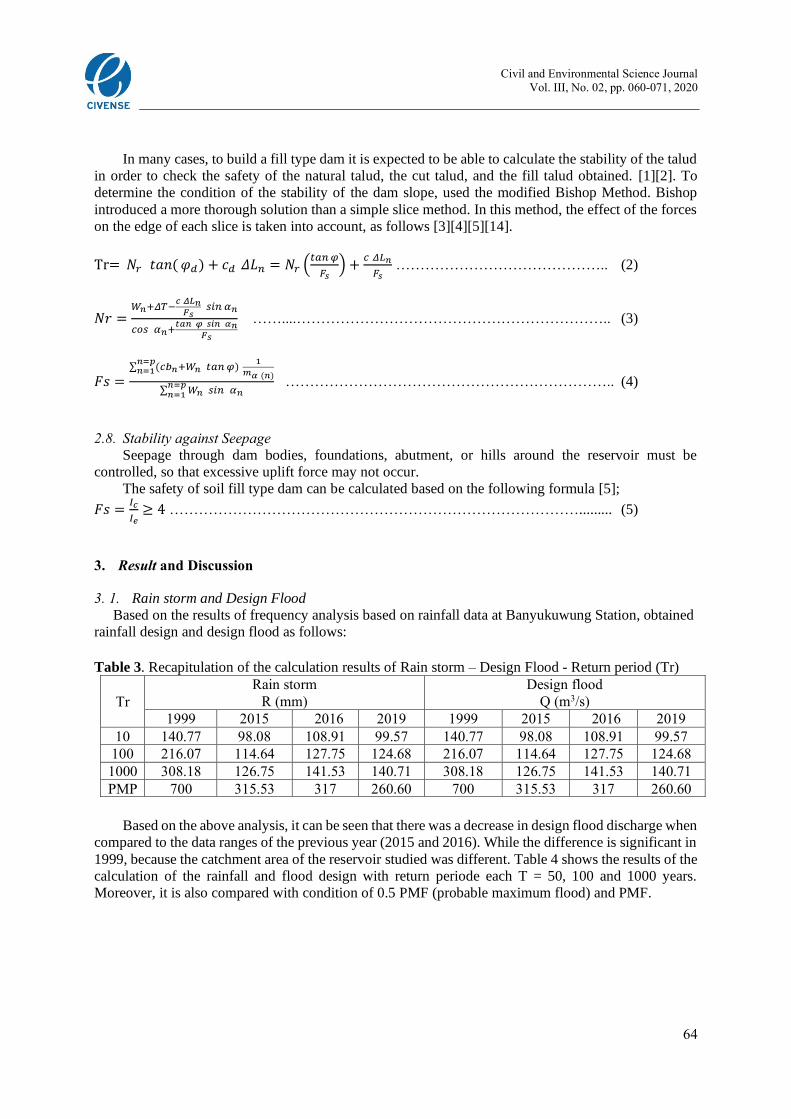
In many cases, to build a fill type dam it is expected to be able to calculate the stability of the talud
in order to check the safety of the natural talud, the cut talud, and the fill talud obtained. [1][2]. To
determine the condition of the stability of the dam slope, used the modified Bishop Method. Bishop
introduced a more thorough solution than a simple slice method. In this method, the effect of the forces
on the edge of each slice is taken into account, as follows [3][4][5][14].
Tr= 𝑁𝑟 𝑡𝑎𝑛( 𝜑𝑑) + 𝑐𝑑 𝛥𝐿𝑛 = 𝑁𝑟 (𝑡𝑎𝑛 𝜑
𝐹𝑠) +
𝑐 𝛥𝐿𝑛
𝐹𝑠 …………………………………….. (2)
𝑁𝑟 =𝑊𝑛+𝛥𝑇−
𝑐 𝛥𝐿𝑛𝐹𝑠
𝑠𝑖𝑛 𝛼𝑛
𝑐𝑜𝑠 𝛼𝑛+𝑡𝑎𝑛 𝜑 𝑠𝑖𝑛 𝛼𝑛
𝐹𝑠
……....……………………………………………………….. (3)
𝐹𝑠 =∑ (𝑐𝑏𝑛+𝑊𝑛 𝑡𝑎𝑛 𝜑)
1
𝑚𝛼 (𝑛)
𝑛=𝑝𝑛=1
∑ 𝑊𝑛𝑛=𝑝𝑛=1 𝑠𝑖𝑛 𝛼𝑛
………………………………………………………….. (4)
2.8. Stability against Seepage
Seepage through dam bodies, foundations, abutment, or hills around the reservoir must be
controlled, so that excessive uplift force may not occur.
The safety of soil fill type dam can be calculated based on the following formula [5];
𝐹𝑠 =𝐼𝑐
𝐼𝑒≥ 4 …………………………………………………………………………......... (5)
3. Result and Discussion
3. 1. Rain storm and Design Flood
Based on the results of frequency analysis based on rainfall data at Banyukuwung Station, obtained
rainfall design and design flood as follows:
Table 3. Recapitulation of the calculation results of Rain storm – Design Flood - Return period (Tr)
Tr
Rain storm
R (mm)
Design flood
Q (m3/s)
1999 2015 2016 2019 1999 2015 2016 2019
10 140.77 98.08 108.91 99.57 140.77 98.08 108.91 99.57
100 216.07 114.64 127.75 124.68 216.07 114.64 127.75 124.68
1000 308.18 126.75 141.53 140.71 308.18 126.75 141.53 140.71
PMP 700 315.53 317 260.60 700 315.53 317 260.60
Based on the above analysis, it can be seen that there was a decrease in design flood discharge when
compared to the data ranges of the previous year (2015 and 2016). While the difference is significant in
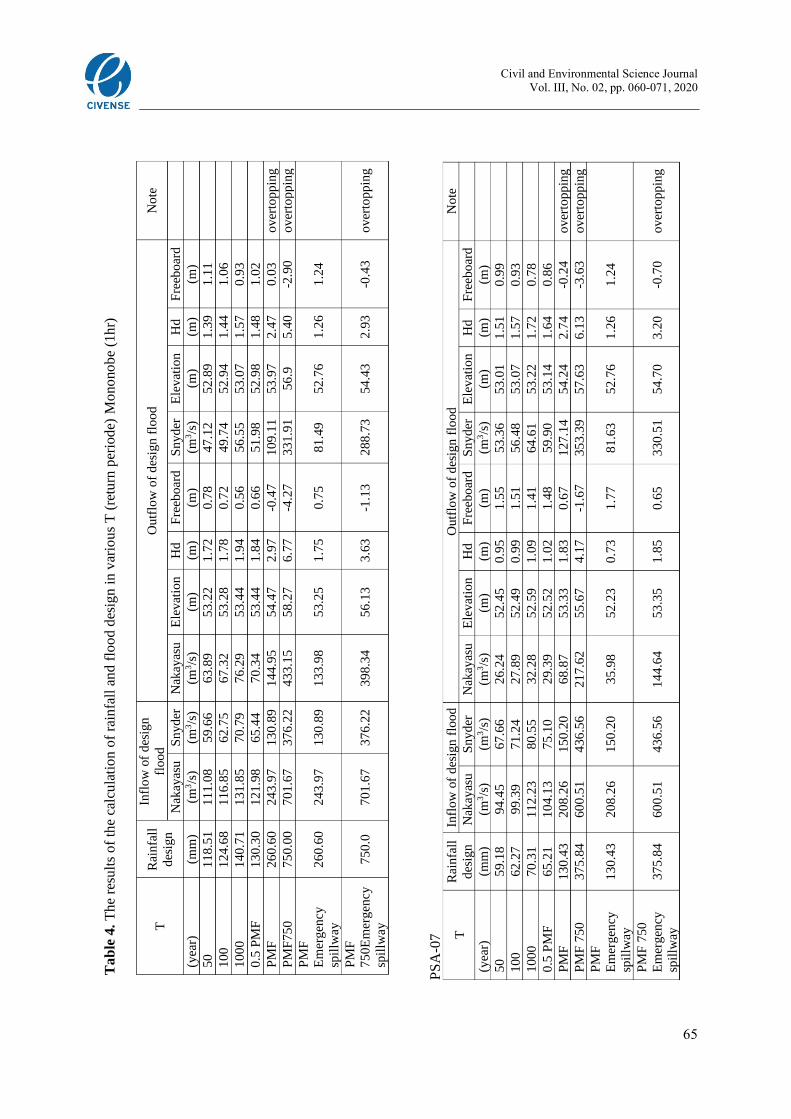
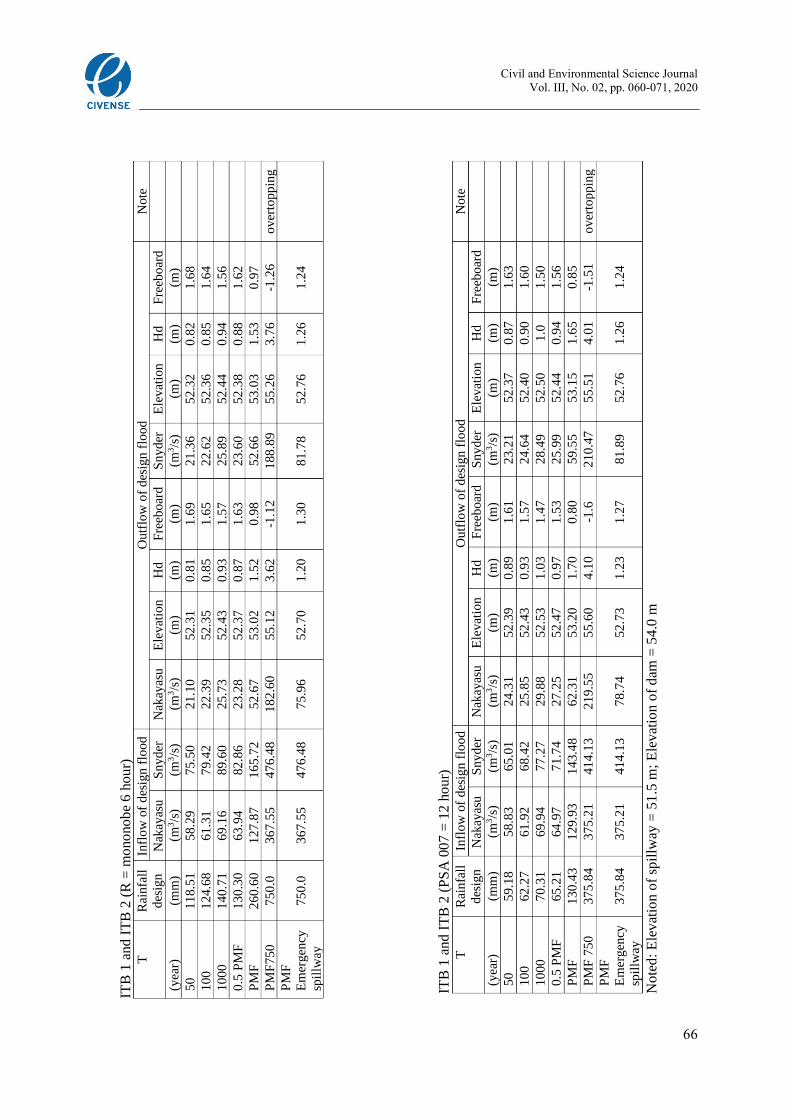
1999, because the catchment area of the reservoir studied was different. Table 4 shows the results of the
calculation of the rainfall and flood design with return periode each T = 50, 100 and 1000 years.
Moreover, it is also compared with condition of 0.5 PMF (probable maximum flood) and PMF.
Civil and Environmental Science Journal
Vol. III, No. 02, pp. 060-071, 2020
65
Ta
ble
4.
Th
e re
sult
s o
f th
e ca
lcu
lati
on
of
rain
fall
an
d f
loo
d d
esig
n i
n v
ario
us
T (
retu
rn p
erio
de)
Mo
no
no
be
(1h
r)
T
Rai
nfa
ll
des
ign
Infl
ow
of
des
ign
flood
O
utf
low
of
des
ign
flo
od
Note
Nak
ayas
u
Snyder
N
akay
asu
E
levat
ion
H
d
Fre
eboar
d
Snyder
E
levat
ion
H
d
Fre
eboar
d
(yea
r)
(mm
) (m
3/s
) (m
3/s
) (m
3/s
) (m
) (m
) (m
) (m
3/s
) (m
) (m
) (m
)
50
118.5
1
111.0
8
59.6
6
63.8
9
53.2
2
1.7
2
0.7
8
47.1
2
52.8
9
1.3
9
1.1
1
10
0
124.6
8
116.8
5
62.7
5
67.3
2
53.2
8
1.7
8
0.7
2
49.7
4
52.9
4
1.4
4
1.0
6
10
00
140.7
1
131.8
5
70.7
9
76.2
9
53.4
4
1.9
4
0.5
6
56.5
5
53.0
7
1.5
7
0.9
3
0.5
PM
F
130.3
0
121.9
8
65.4
4
70.3
4
53.4
4
1.8
4
0.6
6
51.9
8
52.9
8
1.4
8
1.0
2
PM
F
260.6
0
243.9
7
130.8
9
144.9
5
54.4
7
2.9
7
-0.4
7
109.1
1
53.9
7
2.4
7
0.0
3
over
toppin
g
PM
F75
0
750.0
0
701.6
7
376.2
2
433.1
5
58.2
7
6.7
7
-4.2
7
331.9
1
56.9
5.4
0
-2.9
0
over
toppin
g
PM
F
Em
ergen
cy
spil
lway
260.6
0
243.9
7
130.8
9
133.9
8
53.2
5
1.7
5
0.7
5
81.4
9
52.7
6
1.2
6
1.2
4
PM
F
75
0E
mer
gen
cy
spil
lway
750.0
701.6
7
376.2
2
398.3
4
56.1
3
3.6
3
-1.1
3
288.7
3
54.4
3
2.9
3
-0.4
3
over
toppin
g
PS
A-0
7 T
Rai
nfa
ll
des
ign
Infl
ow
of
des
ign f
lood
Outf
low
of
des
ign f
lood
Note
Nak
ayas
u
Snyder
N
akay
asu
E
levat
ion
H
d
Fre
eboar
d
Snyder
E
levat
ion
H
d
Fre
eboar
d
(yea
r)
(mm
) (m
3/s
) (m
3/s
) (m
3/s
) (m
) (m
) (m
) (m
3/s
) (m
) (m
) (m
)
50
59.1
8
94
.45
67.6
6
26.2
4
52.4
5
0.9
5
1.5
5
53.3
6
53.0
1
1.5
1
0.9
9
100
62.2
7
99
.39
71.2
4
27.8
9
52.4
9
0.9
9
1.5
1
56.4
8
53.0
7
1.5
7
0.9
3
1000
70.3
1
11
2.2
3
80.5
5
32.2
8
52.5
9
1.0
9
1.4
1
64.6
1
53.2
2
1.7
2
0.7
8
0.5
PM
F
65.2
1
10
4.1
3
75.1
0
29.3
9
52.5
2
1.0
2
1.4
8
59.9
0
53.1
4
1.6
4
0.8
6
PM
F
130.4
3
208
.26
150.2
0
68.8
7
53.3
3
1.8
3
0.6
7
127.1
4
54.2
4
2.7
4
-0.2
4
over
toppin
g
PM
F 7
50
375.8
4
60
0.5
1
436.5
6
217.6
2
55.6
7
4.1
7
-1.6
7
353.3
9
57.6
3
6.1
3
-3.6
3
over
toppin
g
PM
F
Em
ergen
cy
spil
lway
130.4
3
20
8.2
6
150.2
0
35.9
8
52.2
3
0.7
3
1.7
7
81.6
3
52.7
6
1.2
6
1.2
4
PM
F 7
50
Em
ergen
cy
spil
lway
375.8
4
60
0.5
1
436.5
6
144.6
4
53.3
5
1.8
5
0.6
5
330.5
1
54.7
0
3.2
0
-0.7
0
over
toppin
g
Civil and Environmental Science Journal
Vol. III, No. 02, pp. 060-071, 2020
66
ITB
1 a
nd
IT
B 2
(R
= m
ono
no
be
6 h
ou
r)
T
Rai
nfa
ll
des
ign
Infl
ow
of
des
ign f
lood
Outf
low
of
des
ign f
lood
Note
Nak
ayas
u
Snyder
N
akay
asu
E
levat
ion
H
d
Fre
eboar
d
Snyder
E
levat
ion
H
d
Fre
eboar
d
(yea
r)
(mm
) (m
3/s
) (m
3/s
) (m
3/s
) (m
) (m
) (m
) (m
3/s
) (m
) (m
) (m
)
50
118.5
1
58.2
9
75.5
0
21.1
0
52.3
1
0.8
1
1.6
9
21.3
6
52.3
2
0.8
2
1.6
8
100
124.6
8
61.3
1
79.4
2
22.3
9
52.3
5
0.8
5
1.6
5
22.6
2
52.3
6
0.8
5
1.6
4
1000
140.7
1
69.1
6
89.6
0
25.7
3
52.4
3
0.9
3
1.5
7
25.8
9
52.4
4
0.9
4
1.5
6
0.5
PM
F
130.3
0
63.9
4
82.8
6
23.2
8
52.3
7
0.8
7
1.6
3
23.6
0
52.3
8
0.8
8
1.6
2
PM
F
260.6
0
127.8
7
165.7
2
52.6
7
53.0
2
1.5
2
0.9
8
52.6
6
53.0
3
1.5
3
0.9
7
PM
F750
750.0
367.5
5
476.4
8
182.6
0
55.1
2
3.6
2
-1.1
2
188.8
9
55.2
6
3.7
6
-1.2
6
over
toppin
g
PM
F
Em
ergen
cy
spil
lway
750.0
367.5
5
476.4
8
75.9
6
52.7
0
1.2
0
1.3
0
81.7
8
52.7
6
1.2
6
1.2
4
ITB
1 a
nd
IT
B 2
(P
SA
00
7 =
12
ho
ur)
T
R
ainfa
ll
des
ign
Infl
ow
of
des
ign f
lood
Outf
low
of
des
ign f
lood
Note
Nak
ayas
u
Snyder
N
akay
asu
E
levat
ion
H
d
Fre
eboar
d
Snyder
E
levat
ion
H
d
Fre
eboar
d
(yea
r)
(mm
) (m
3/s
) (m
3/s
) (m
3/s
) (m
) (m
) (m
) (m
3/s
) (m
) (m
) (m
)
50
59.1
8
58.8
3
65.0
1
24.3
1
52.3
9
0.8
9
1.6
1
23.2
1
52.3
7
0.8
7
1.6
3
100
62.2
7
61.9
2
68.4
2
25.8
5
52.4
3
0.9
3
1.5
7
24.6
4
52.4
0
0.9
0
1.6
0
1000
70.3
1
69.9
4
77.2
7
29.8
8
52.5
3
1.0
3
1.4
7
28.4
9
52.5
0
1.0
1.5
0
0.5
PM
F
65.2
1
64.9
7
71.7
4
27.2
5
52.4
7
0.9
7
1.5
3
25.9
9
52.4
4
0.9
4
1.5
6
PM
F
130.4
3
129.9
3
143.4
8
62.3
1
53.2
0
1.7
0
0.8
0
59.5
5
53.1
5
1.6
5
0.8
5
PM
F 7
50
375.8
4
375.2
1
414.1
3
219.5
5
55.6
0
4.1
0
-1.6
210.4
7
55.5
1
4.0
1
-1.5
1
over
toppin
g
PM
F
Em
ergen
cy
spil
lway
375.8
4
375.2
1
414.1
3
78.7
4
52.7
3
1.2
3
1.2
7
81.8
9
52.7
6
1.2
6
1.2
4
No
ted
: E
lev
atio
n o
f sp
illw
ay =
51
.5 m
; E
lev
atio
n o
f d
am =
54
.0 m
Civil and Environmental Science Journal
Vol. III, No. 02, pp. 060-071, 2020
67
Based on the results of the flood discharge analysis above it can be seen that the condition of the Dam
is safe against flood discharge of 0.5x QPMF and below. However, it is not safe against QPMF discharge,
overtopping will occur, and the watch height is less than the required minimum of 0.75 m. However, if
an emergency spillway is utilized, the condition is still safe from QPMF flooding. Based on field
conditions, the emergency spillway is tending to solidify because it is used as a traffic access for
residents in the fields/rice fields.
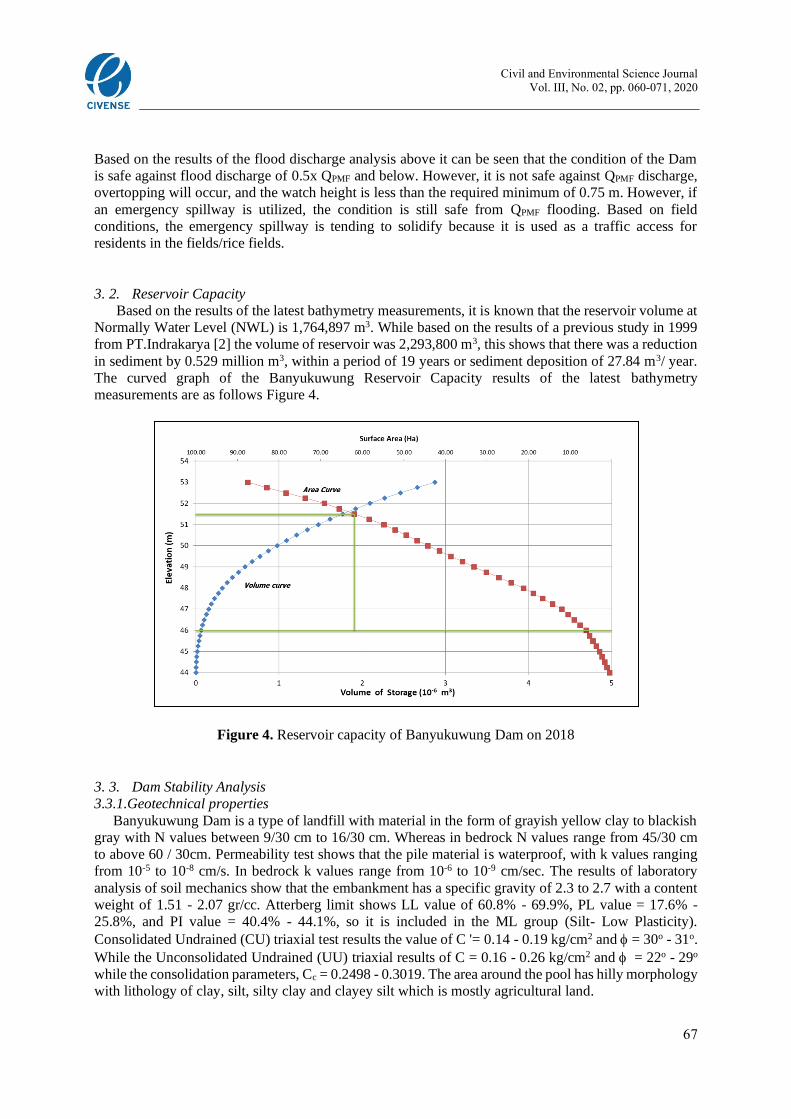
3. 2. Reservoir Capacity
Based on the results of the latest bathymetry measurements, it is known that the reservoir volume at
Normally Water Level (NWL) is 1,764,897 m3. While based on the results of a previous study in 1999
from PT.Indrakarya [2] the volume of reservoir was 2,293,800 m3, this shows that there was a reduction
in sediment by 0.529 million m3, within a period of 19 years or sediment deposition of 27.84 m3/ year.
The curved graph of the Banyukuwung Reservoir Capacity results of the latest bathymetry
measurements are as follows Figure 4.
Figure 4. Reservoir capacity of Banyukuwung Dam on 2018
3. 3. Dam Stability Analysis
3.3.1.Geotechnical properties Banyukuwung Dam is a type of landfill with material in the form of grayish yellow clay to blackish
gray with N values between 9/30 cm to 16/30 cm. Whereas in bedrock N values range from 45/30 cm
to above 60 / 30cm. Permeability test shows that the pile material is waterproof, with k values ranging
from 10-5 to 10-8 cm/s. In bedrock k values range from 10-6 to 10-9 cm/sec. The results of laboratory
analysis of soil mechanics show that the embankment has a specific gravity of 2.3 to 2.7 with a content
weight of 1.51 - 2.07 gr/cc. Atterberg limit shows LL value of 60.8% - 69.9%, PL value = 17.6% -
25.8%, and PI value = 40.4% - 44.1%, so it is included in the ML group (Silt- Low Plasticity).
Consolidated Undrained (CU) triaxial test results the value of C '= 0.14 - 0.19 kg/cm2 and = 30o - 31o.
While the Unconsolidated Undrained (UU) triaxial results of C = 0.16 - 0.26 kg/cm2 and = 22o - 29o
while the consolidation parameters, Cc = 0.2498 - 0.3019. The area around the pool has hilly morphology
with lithology of clay, silt, silty clay and clayey silt which is mostly agricultural land.
Civil and Environmental Science Journal
Vol. III, No. 02, pp. 060-071, 2020
68
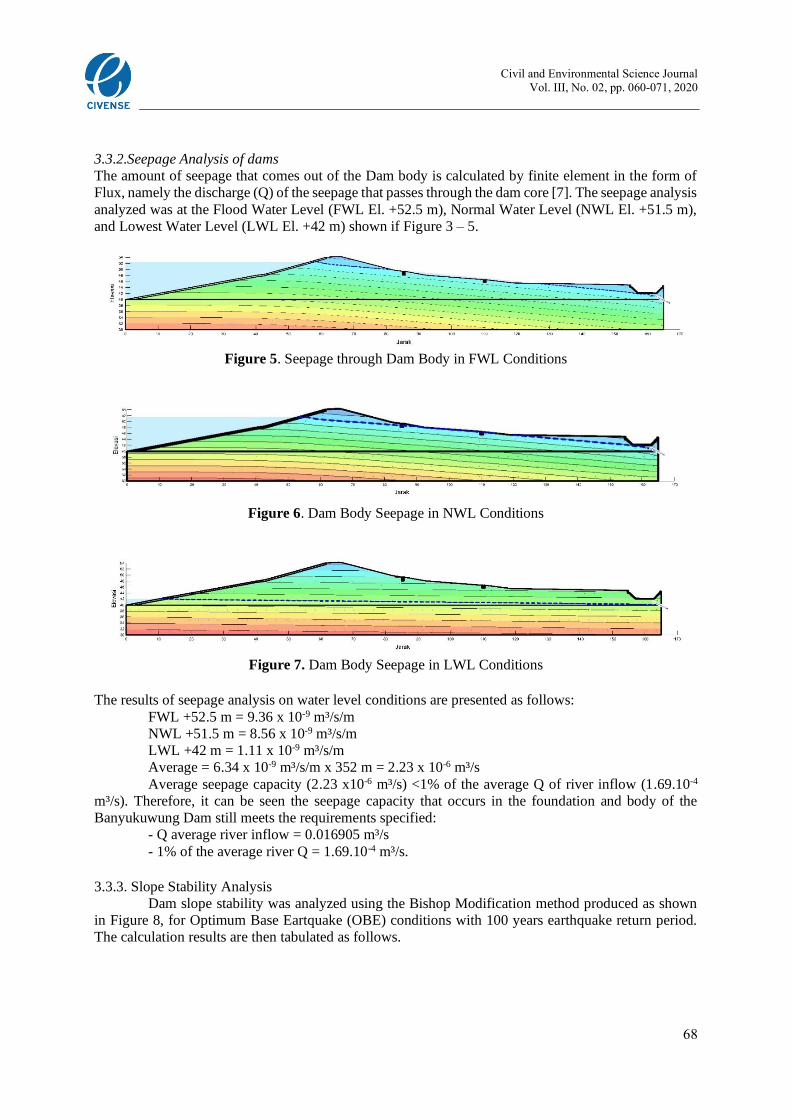
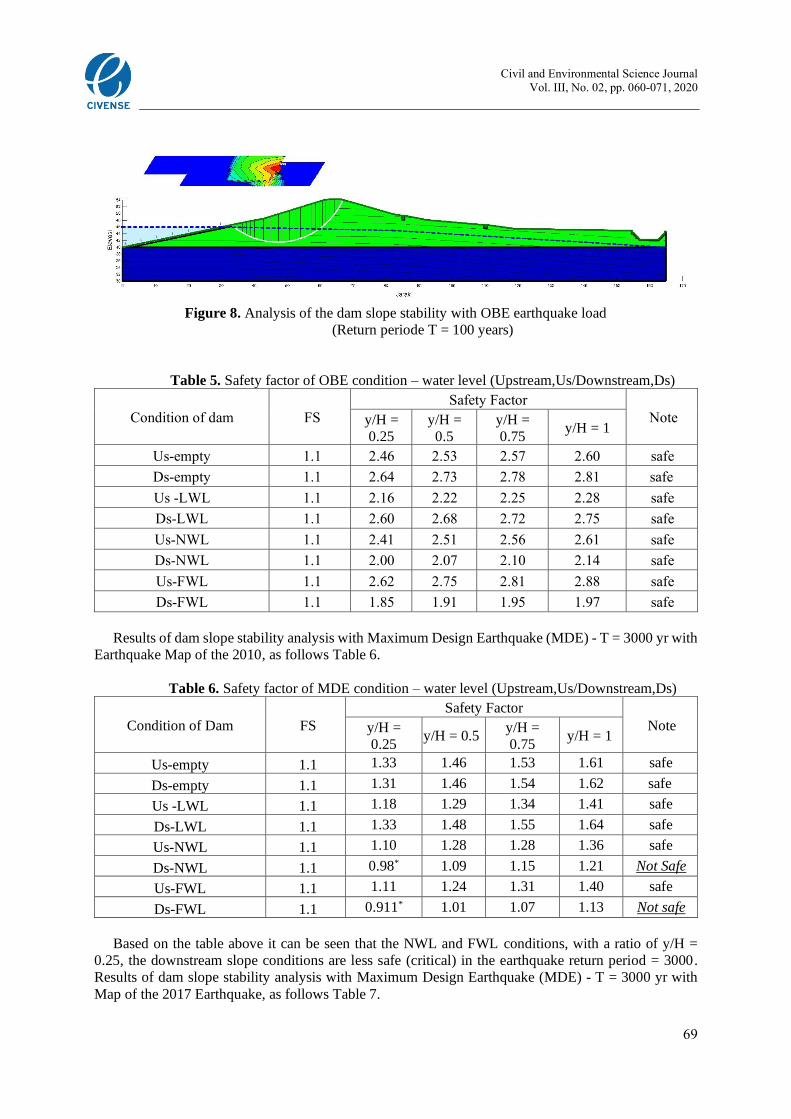
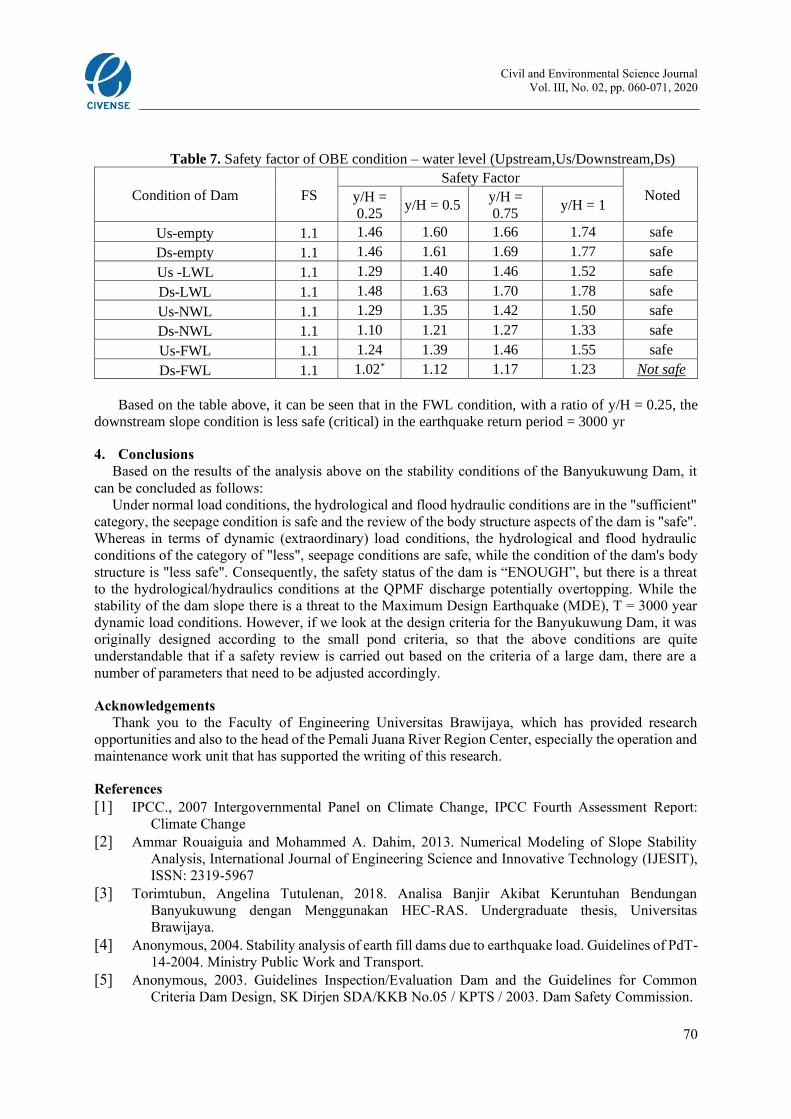
3.3.2.Seepage Analysis of dams
The amount of seepage that comes out of the Dam body is calculated by finite element in the form of
Flux, namely the discharge (Q) of the seepage that passes through the dam core [7]. The seepage analysis
analyzed was at the Flood Water Level (FWL El. +52.5 m), Normal Water Level (NWL El. +51.5 m),
and Lowest Water Level (LWL El. +42 m) shown if Figure 3 – 5.
Figure 5. Seepage through Dam Body in FWL Conditions
Figure 6. Dam Body Seepage in NWL Conditions
Figure 7. Dam Body Seepage in LWL Conditions
The results of seepage analysis on water level conditions are presented as follows:
FWL +52.5 m = 9.36 x 10⁻⁹ m³/s/m
NWL +51.5 m = 8.56 x 10⁻⁹ m³/s/m
LWL +42 m = 1.11 x 10⁻⁹ m³/s/m
Average = 6.34 x 10⁻⁹ m³/s/m x 352 m = 2.23 x 10⁻⁶ m³/s
Average seepage capacity (2.23 x10⁻⁶ m³/s) <1% of the average Q of river inflow (1.69.10-4
m³/s). Therefore, it can be seen the seepage capacity that occurs in the foundation and body of the
Banyukuwung Dam still meets the requirements specified:
- Q average river inflow = 0.016905 m³/s
- 1% of the average river Q = 1.69.10-4 m³/s.
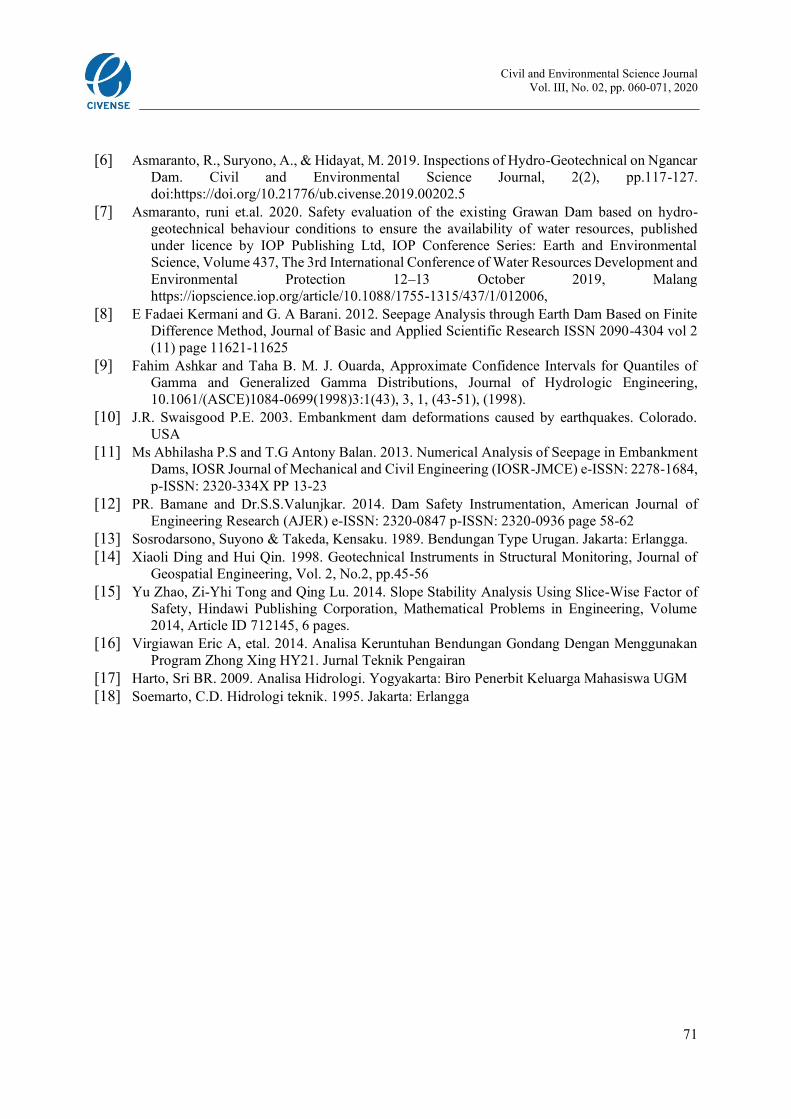
3.3.3. Slope Stability Analysis
Dam slope stability was analyzed using the Bishop Modification method produced as shown
in Figure 8, for Optimum Base Eartquake (OBE) conditions with 100 years earthquake return period.
The calculation results are then tabulated as follows.
Civil and Environmental Science Journal
Vol. III, No. 02, pp. 060-071, 2020
69
Figure 8. Analysis of the dam slope stability with OBE earthquake load
(Return periode T = 100 years)
Table 5. Safety factor of OBE condition – water level (Upstream,Us/Downstream,Ds)
Condition of dam FS
Safety Factor
Note y/H =
0.25
y/H =
0.5
y/H =
0.75 y/H = 1
Us-empty 1.1 2.46 2.53 2.57 2.60 safe
Ds-empty 1.1 2.64 2.73 2.78 2.81 safe
Us -LWL 1.1 2.16 2.22 2.25 2.28 safe
Ds-LWL 1.1 2.60 2.68 2.72 2.75 safe
Us-NWL 1.1 2.41 2.51 2.56 2.61 safe
Ds-NWL 1.1 2.00 2.07 2.10 2.14 safe
Us-FWL 1.1 2.62 2.75 2.81 2.88 safe
Ds-FWL 1.1 1.85 1.91 1.95 1.97 safe
Results of dam slope stability analysis with Maximum Design Earthquake (MDE) - T = 3000 yr with
Earthquake Map of the 2010, as follows Table 6.
Table 6. Safety factor of MDE condition – water level (Upstream,Us/Downstream,Ds)
Condition of Dam FS
Safety Factor
Note y/H =
0.25 y/H = 0.5
y/H =
0.75 y/H = 1
Us-empty 1.1 1.33 1.46 1.53 1.61 safe
Ds-empty 1.1 1.31 1.46 1.54 1.62 safe
Us -LWL 1.1 1.18 1.29 1.34 1.41 safe
Ds-LWL 1.1 1.33 1.48 1.55 1.64 safe
Us-NWL 1.1 1.10 1.28 1.28 1.36 safe
Ds-NWL 1.1 0.98* 1.09 1.15 1.21 Not Safe
Us-FWL 1.1 1.11 1.24 1.31 1.40 safe
Ds-FWL 1.1 0.911* 1.01 1.07 1.13 Not safe
Based on the table above it can be seen that the NWL and FWL conditions, with a ratio of y/H =
0.25, the downstream slope conditions are less safe (critical) in the earthquake return period = 3000.
Results of dam slope stability analysis with Maximum Design Earthquake (MDE) - T = 3000 yr with
Map of the 2017 Earthquake, as follows Table 7.
Civil and Environmental Science Journal
Vol. III, No. 02, pp. 060-071, 2020
70
Table 7. Safety factor of OBE condition – water level (Upstream,Us/Downstream,Ds)
Condition of Dam FS
Safety Factor
Noted y/H =
0.25 y/H = 0.5
y/H =
0.75 y/H = 1
Us-empty 1.1 1.46 1.60 1.66 1.74 safe
Ds-empty 1.1 1.46 1.61 1.69 1.77 safe
Us -LWL 1.1 1.29 1.40 1.46 1.52 safe
Ds-LWL 1.1 1.48 1.63 1.70 1.78 safe
Us-NWL 1.1 1.29 1.35 1.42 1.50 safe
Ds-NWL 1.1 1.10 1.21 1.27 1.33 safe
Us-FWL 1.1 1.24 1.39 1.46 1.55 safe
Ds-FWL 1.1 1.02* 1.12 1.17 1.23 Not safe
Based on the table above, it can be seen that in the FWL condition, with a ratio of y/H = 0.25, the
downstream slope condition is less safe (critical) in the earthquake return period = 3000 yr
4. Conclusions
Based on the results of the analysis above on the stability conditions of the Banyukuwung Dam, it
can be concluded as follows:
Under normal load conditions, the hydrological and flood hydraulic conditions are in the "sufficient"
category, the seepage condition is safe and the review of the body structure aspects of the dam is "safe".
Whereas in terms of dynamic (extraordinary) load conditions, the hydrological and flood hydraulic
conditions of the category of "less", seepage conditions are safe, while the condition of the dam's body
structure is "less safe". Consequently, the safety status of the dam is “ENOUGH”, but there is a threat
to the hydrological/hydraulics conditions at the QPMF discharge potentially overtopping. While the
stability of the dam slope there is a threat to the Maximum Design Earthquake (MDE), T = 3000 year
dynamic load conditions. However, if we look at the design criteria for the Banyukuwung Dam, it was
originally designed according to the small pond criteria, so that the above conditions are quite
understandable that if a safety review is carried out based on the criteria of a large dam, there are a
number of parameters that need to be adjusted accordingly.
Acknowledgements
Thank you to the Faculty of Engineering Universitas Brawijaya, which has provided research
opportunities and also to the head of the Pemali Juana River Region Center, especially the operation and
maintenance work unit that has supported the writing of this research.
References
[1] IPCC., 2007 Intergovernmental Panel on Climate Change, IPCC Fourth Assessment Report:
Climate Change
[2] Ammar Rouaiguia and Mohammed A. Dahim, 2013. Numerical Modeling of Slope Stability
Analysis, International Journal of Engineering Science and Innovative Technology (IJESIT),
ISSN: 2319-5967
[3] Torimtubun, Angelina Tutulenan, 2018. Analisa Banjir Akibat Keruntuhan Bendungan
Banyukuwung dengan Menggunakan HEC-RAS. Undergraduate thesis, Universitas
Brawijaya.
[4] Anonymous, 2004. Stability analysis of earth fill dams due to earthquake load. Guidelines of PdT-
14-2004. Ministry Public Work and Transport.
[5] Anonymous, 2003. Guidelines Inspection/Evaluation Dam and the Guidelines for Common
Criteria Dam Design, SK Dirjen SDA/KKB No.05 / KPTS / 2003. Dam Safety Commission.
Civil and Environmental Science Journal
Vol. III, No. 02, pp. 060-071, 2020
71
[6] Asmaranto, R., Suryono, A., & Hidayat, M. 2019. Inspections of Hydro-Geotechnical on Ngancar
Dam. Civil and Environmental Science Journal, 2(2), pp.117-127.
doi:https://doi.org/10.21776/ub.civense.2019.00202.5
[7] Asmaranto, runi et.al. 2020. Safety evaluation of the existing Grawan Dam based on hydro-
geotechnical behaviour conditions to ensure the availability of water resources, published
under licence by IOP Publishing Ltd, IOP Conference Series: Earth and Environmental
Science, Volume 437, The 3rd International Conference of Water Resources Development and
Environmental Protection 12–13 October 2019, Malang
https://iopscience.iop.org/article/10.1088/1755-1315/437/1/012006,
[8] E Fadaei Kermani and G. A Barani. 2012. Seepage Analysis through Earth Dam Based on Finite
Difference Method, Journal of Basic and Applied Scientific Research ISSN 2090-4304 vol 2
(11) page 11621-11625
[9] Fahim Ashkar and Taha B. M. J. Ouarda, Approximate Confidence Intervals for Quantiles of
Gamma and Generalized Gamma Distributions, Journal of Hydrologic Engineering,
10.1061/(ASCE)1084-0699(1998)3:1(43), 3, 1, (43-51), (1998).
[10] J.R. Swaisgood P.E. 2003. Embankment dam deformations caused by earthquakes. Colorado.
USA
[11] Ms Abhilasha P.S and T.G Antony Balan. 2013. Numerical Analysis of Seepage in Embankment
Dams, IOSR Journal of Mechanical and Civil Engineering (IOSR-JMCE) e-ISSN: 2278-1684,
p-ISSN: 2320-334X PP 13-23
[12] PR. Bamane and Dr.S.S.Valunjkar. 2014. Dam Safety Instrumentation, American Journal of
Engineering Research (AJER) e-ISSN: 2320-0847 p-ISSN: 2320-0936 page 58-62
[13] Sosrodarsono, Suyono & Takeda, Kensaku. 1989. Bendungan Type Urugan. Jakarta: Erlangga.
[14] Xiaoli Ding and Hui Qin. 1998. Geotechnical Instruments in Structural Monitoring, Journal of
Geospatial Engineering, Vol. 2, No.2, pp.45-56
[15] Yu Zhao, Zi-Yhi Tong and Qing Lu. 2014. Slope Stability Analysis Using Slice-Wise Factor of
Safety, Hindawi Publishing Corporation, Mathematical Problems in Engineering, Volume
2014, Article ID 712145, 6 pages.
[16] Virgiawan Eric A, etal. 2014. Analisa Keruntuhan Bendungan Gondang Dengan Menggunakan
Program Zhong Xing HY21. Jurnal Teknik Pengairan
[17] Harto, Sri BR. 2009. Analisa Hidrologi. Yogyakarta: Biro Penerbit Keluarga Mahasiswa UGM
[18] Soemarto, C.D. Hidrologi teknik. 1995. Jakarta: Erlangga