Embed Size (px)
Citation preview

El Vado Dam Hydrologic EvaluationJoseph Wright, P.E.Bureau of Reclamation Technical Services CenterFlood Hydrology and Meteorology Group

Reclamation Dam Safety
2011-SOD-A: “Conduct a corrective action study to address the hydrologic failure modes under Reclamation’s Safety of Dams Program”
The 2010 risk analysis identified three potential failure modes that justify taking risk-reduction actions.
The potential failure modes included failure of the emergency spillway in addition to the service spillway.

Flood Risk
For a Corrective Action Study, Reclamation best practices guidelines require that multiple methods are used to estimate the flood risk.
•Method 1 – We combined observed historical peak discharge data with estimated pre-historical data and fit a statistical distribution to determine annual peak discharge exceedance probabilities.
•Method 2 – We developed a stochastic event rainfall-runoff model for the watershed above El Vado Dam.

Method 1 - Observed Peak Discharge
• 97 Observations• 101 Years
08285500 – Rio Chama below El Vado1914 – 1924, 7 Years of Data
08283500 – Rio Chama at Park View1913, 1925 – 1955, 31 Years of Data
08284100 – Rio Chama near La Puente1956 – 2014, 59 Years of Data

Pre-Historical Peak Discharge
• A flood terrace was observed and studied at 10 different locations downstream of El Vado Dam on the Rio Chama.
• Soil stratigraphic relationships suggest a large flood occurred at least once during the past 4,300 to 4,500 years.
• 2-dimensional hydraulic modeling of the Rio Chama below El Vado Dam suggests the peak discharge of this flood was between 11,000 and 14,000 ft3/s.
• A non-exceedance bound with a discharge between 65,000 and 75,000 ft3/s has not occurred during the past 8,000 to 10,000 years.

Peak Discharge Timeline
-10000-9000
-8000-7000
-6000-5000
18801890
19001910
19201930
19401950
19601970
19801990
20002010
100
200
300
400500600700800900
1,000
2,000
3,000
4,0005,0006,0007,0008,0009,000
10,000
20,000
30,000
40,00050,00060,00070,00080,000
100
1,000
10,000
paleoflood non-exceedance bound65,000 - 75,000 cfs8,000 - 10,000 years
paleoflood non-exceedance bound11,000 - 14,000 cfs4,300 - 4,500 years
Years Before Present
Peak
Disc
harg
e (ft3 /s
)
Water Year

Peak Discharge Estimate - EMA
99 98 95 90 80 70 60 50 40 30 20 10 5 2 1 0.5 0.1 0.01 1E-3 1E-4100
1,000
10,000
100,000
Paleoflood Exceedance:4300-4500 yrs 11,000-14,000 ft3/s
Modeled Event:4400 yrs 14,000 ft3/s
Observations EMA Model Results 90% Confidence Interval Paleoflood Events & Non-Exceedance
Disc
harg
e (ft3 /s
)
Probability (%)
Non-Exceedance Box:8000-10,000 yrs 65,000-75,000 ft3/s

Method 2 - Stochastic Rainfall-Runoff Model
1. Develop physical based 1-dimensional rainfall-runoff using hydrologic runoff units (HRU’s)
2. Estimate a precipitation frequency curve using the L-Moments method of regional statistics
3. Randomly sample the frequency precipitation curve as well as a storm pattern to determine an annual maximum storm event
4. Randomly determine the initial model conditions
5. Repeat steps 3 and 4 to develop a simulate time-series of maximum flood events
6. Fit a statistical distribution to the time series of annual maximum events

Physical Based Model
18 Subbasins

Soils
10 Soil Zones (including
Water)

Mean Annual Precipitation (MAP)
9 MAP Zones

Elevation
10 Elevation Zones

HRU’s
900 HRU’s (excluding subs)
16,200 unique HRU’s

Regional Precipitation Analysis

Regional Precipitation Analysis
• 154 Precipitation Gages• 2,911 station years of data• L-Moments was used to determine the L-skewness,
and L-kurtosis• A Generalized Extreme Value (GEV) distribution was
fit to the L-Moments

Regional Precipitation Analysis
98 80 50 20 2 0.1 1E-4 1E-70
5
10
15
20
48-h
r P
reci
pita
tion
(in)
% AEP
Basin Average At Site PMP

Spatial and Temporal Storm Pattern
Storm DateIndex Freezing Level Height (ft)
Index 1000mb Temperature (deg
F)
Lapse Rate deg F/1000ft
Adjusted Point Precipitation
(in)
May 25, 1975 13619 82.1 3.68 0.57
June 1, 1983 14002 86.1 3.86 0.59
May 17, 1984 13070 84.5 4.02 0.88
March 12, 1985 9660 65.8 3.50 4.41
May 8, 1985 13218 82.2 3.80 0.06
August 24, 1992 15019 82.7 3.38 2.01
September 21, 1997 14876 84.1 3.50 2.17
April 30, 1999 12232 79.1 3.85 2.64
September 10, 2003 14398 82.4 3.50 4.78
May 22, 2005 12597 81.5 3.93 0.27

Spatial Storm Pattern – Sep 10,2003

Temporal Precipitation Pattern
Sep 10, 2003 Storm
18 Sub-basins

Sep 10, 2003 Storm
Max 24hr Sea Level Temperature = 82.4 deg F
Max 24hr Freeze Level = 14,398 ft
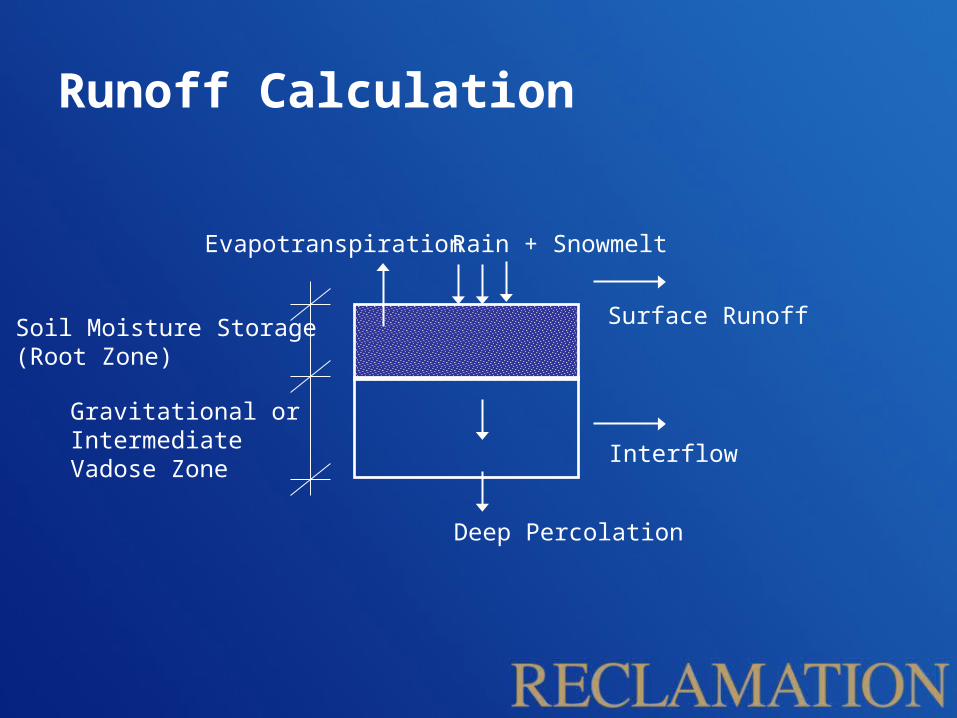
Runoff Calculation
Soil Moisture Storage(Root Zone)
Gravitational or Intermediate Vadose Zone
Surface Runoff
Interflow
Deep Percolation
Rain + SnowmeltEvapotranspiration

Runoff Transformation (HEC-1)

Calibrate

Monte CarloSelect Month of Occurrence
Select Storm Characteristics
Repeatn
Times
Rank All Events in Descending Order of MagnitudeDevelop Flood Magnitude-Frequency Curves
Select All Hydrometeorological, Hydrologic,And Hydraulic Parameters that are
Dependent Upon Month of Occurrence
Select Remaining Parameters that areIndependent of Other Parameters
Select Remaining Parameters that areDependent Upon Other Parameters
Do Flood Modeling and Reservoir Routing

Rank and Plot Peak Discharge
99 98 95 90 80 70 60 50 40 30 20 10 5 2 1 0.5 0.1 0.01 1E-3 1E-4100
1,000
10,000
100,000
Paleoflood Exceedance:4300-4500 yrs 11,000-14,000 ft3/s
Modeled Event:4400 yrs 14,000 ft3/s
Observations EMA Model Results 90% Confidence Interval Paleoflood Events & Non-Exceedance D
Disc
harg
e (ft3 /s
)
AEP (%)
Non-Exceedance Box:8000-10,000 yrs 65,000-75,000 ft3/s

El Vado Peak Discharge
2 1 0.5 0.1 0.01 1E-3 1E-4
10000
100000
Median SEFM Estimate 90% Confidence SEFM Estimate Paleoflood Non-Exceedance EMA Median Estimate EMA Confidence CFR Estimate
Probability (%)
Peak
Dis
char
ge (ft
3 /s)

El Vado Hydrologic Loading
• This study defines hydrologic loading as Maximum Routed Reservoir Elevation
• Each SEFM simulated hydrograph is routed through El Vado Dam (As well as Heron Dam)
• The initial reservoir water surface elevation is determined by sampling historic data. The historic data is correlated with antecedent precipitation.
• The maximum routed reservoir elevations are ranked and plotted on a probability plot to determine the frequency-elevation curve.

El Vado Hydrologic Loading
2 1 0.5 0.1 0.01 1E-3 1E-46900
6905
6910
6915
6920
Top of Dam = 6919.5 ft
Best Estimate 90% Confidence 2004CFR
Max
imum
Res
ervo
ir El
evati
on (ft
)
Probability (%)
Top of Auxiliary Spillway = 6906.0 ft

Questions?