Embed Size (px)
Citation preview
The Inequality of Maternal Health in Urban Sub-Saharan Africa
Monica Magadi, Eliya Zulu, and Martin Brockerhoff
Abstract
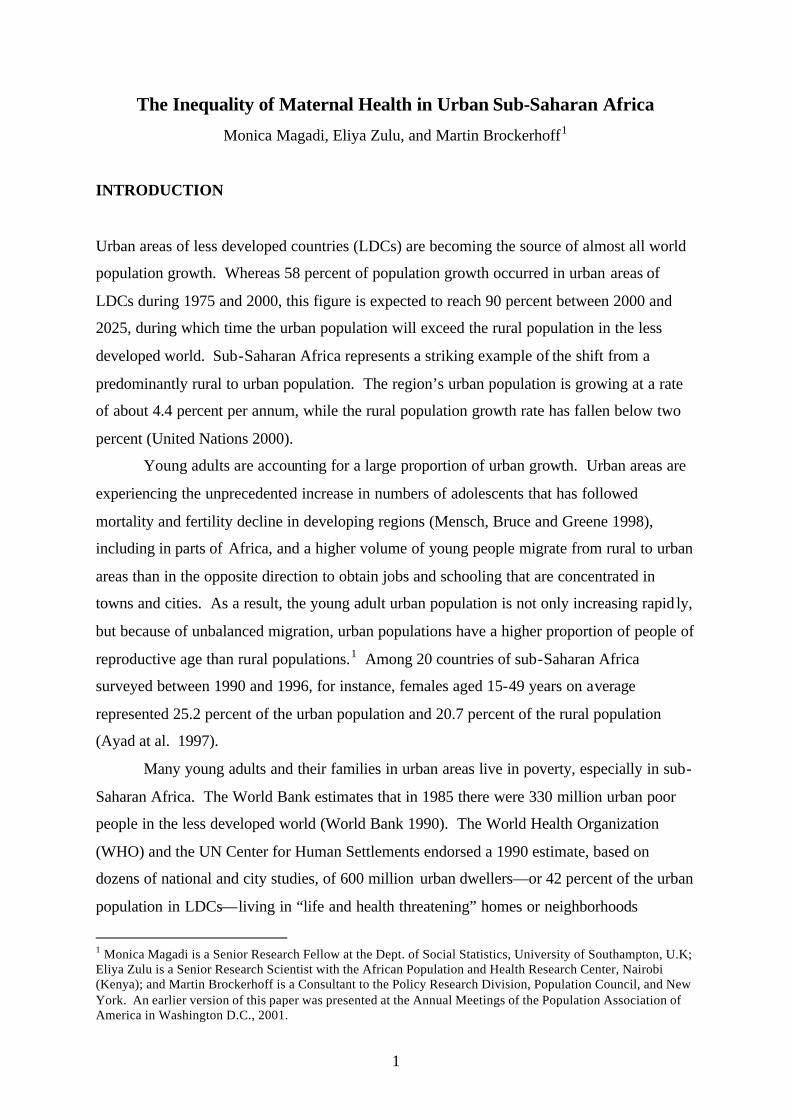
Numerous studies document the urban poor disadvantage in child health conditions in
African cities. This study uses DHS data from 23 countries in sub-Saharan Africa to examine
whether the urban poor experience comparable disadvantages in maternal health. The results
show that although the urban poor on average receive better antenatal and delivery care than
rural residents, they consistently have poorer maternal health indicators than the urban non-
poor. Further analyses based on a multilevel approach reveal significant variations in urban
maternal health inequalities across countries of sub-Saharan Africa. The urban poor
disadvantage is more pronounced in countries with better average maternal health indicators,
where the urban poor tend to be even worse off than rural residents.
SSRC Applications and Policy Working Paper A03/01
1
The Inequality of Maternal Health in Urban Sub-Saharan Africa
Monica Magadi, Eliya Zulu, and Martin Brockerhoff1
INTRODUCTION
Urban areas of less developed countries (LDCs) are becoming the source of almost all world
population growth. Whereas 58 percent of population growth occurred in urban areas of
LDCs during 1975 and 2000, this figure is expected to reach 90 percent between 2000 and
2025, during which time the urban population will exceed the rural population in the less
developed world. Sub-Saharan Africa represents a striking example of the shift from a
predominantly rural to urban population. The region’s urban population is growing at a rate
of about 4.4 percent per annum, while the rural population growth rate has fallen below two
percent (United Nations 2000).
Young adults are accounting for a large proportion of urban growth. Urban areas are
experiencing the unprecedented increase in numbers of adolescents that has followed
mortality and fertility decline in developing regions (Mensch, Bruce and Greene 1998),
including in parts of Africa, and a higher volume of young people migrate from rural to urban
areas than in the opposite direction to obtain jobs and schooling that are concentrated in
towns and cities. As a result, the young adult urban population is not only increasing rapid ly,
but because of unbalanced migration, urban populations have a higher proportion of people of
reproductive age than rural populations.1 Among 20 countries of sub-Saharan Africa
surveyed between 1990 and 1996, for instance, females aged 15-49 years on average
represented 25.2 percent of the urban population and 20.7 percent of the rural population
(Ayad at al. 1997).
Many young adults and their families in urban areas live in poverty, especially in sub-
Saharan Africa. The World Bank estimates that in 1985 there were 330 million urban poor
people in the less developed world (World Bank 1990). The World Health Organization
(WHO) and the UN Center for Human Settlements endorsed a 1990 estimate, based on
dozens of national and city studies, of 600 million urban dwellers—or 42 percent of the urban
population in LDCs—living in “life and health threatening” homes or neighborhoods
1 Monica Magadi is a Senior Research Fellow at the Dept. of Social Statistics, University of Southampton, U.K; Eliya Zulu is a Senior Research Scientist with the African Population and Health Research Center, Nairobi (Kenya); and Martin Brockerhoff is a Consultant to the Policy Research Division, Population Council, and New York. An earlier version of this paper was presented at the Annual Meetings of the Population Association of America in Washington D.C., 2001.
2
(Cairncross, Hardoy, and Satterthwaite 1990). The United Nations Population Fund
concluded in 1996 that 27.7 percent of LDC urbanites were living in poverty, including 41.1
percent in sub-Saharan Africa (United Nations Population Fund 1996). Whatever the exact
figure, a large proportion of the urban population in less developed countries lack the basic
material resources and amenities necessary for a decent standard of living.
The health consequences of urban poverty under conditions of rapid urban growth
have been well documented for children ( Harpham, Lusty and Vaughn 1988; Bradley et. al.
1992; Timaeus and Lush 1995; Atkinson, Songsore and Werna 1996; Brockerhoff and
Brenan 1998). A common research finding is large child health disparities between more-
and less-affluent city residents. A recent study in the slums of Nairobi show similar patterns
whereby the infant mortality rate for slum dwellers was 91.3, while the comparative rates for
residents of other urban areas and rural parts of the country were 56.6 and 75.9, respectively
(APHRC 2002). This pattern parallels the historical experience of many now-developed
countries in Europe and North America during their period of most rapid urban growth, 1875-
1900. In the United States in 1900, for example, for every 1,000 children born the number
who died before age five was 177 in rural areas, 215 in urban areas, and 237 in New York
City (Preston and Haines 1991).
Paradoxically, there has been scant comparative research on reproductive health in
urban areas of developing countries, despite the rapidly increasing size and concentration of
the developing world’s reproductive-age population in cities. This gap in research is most
glaring in the case of sub-Saharan Africa’s cities, given the persistent poverty and high
morbidity of the region, and that most countries have adopted structural adjustment policies
that may affect city residents most adversely. 2 Indeed, while poverty is increasing across the
board in most African countries, emerging evidence shows that deprivation is growing more
rapidly in urban areas and major cities than in rural areas (see, for example Central Bureau of
Statistics 2000).3 As the region urbanizes quickly, documenting the types of urban areas and
groups most in need of particular reproductive health services is essential to efforts to
improve maternal and child health at the national level, as well as to help women achieve
their reproductive preferences and thereby facilitate mortality decline. Comparing
reproductive health conditions within urban areas, as well as between urban and rural areas, is
required to assess whether women have benefited from most governments’ commitment to
universal access to safe and affordable reproductive health care services, as declared most
notably at the 1994 International Conference on Population and Development.
3
This study uses survey data from 23 countries of sub-Saharan Africa to examine
whether the presumed superiority of reproductive health care of urban women, as compared
to rural counterparts, masks significant differentials in care within urban areas, and whether
some urban women, in fact, have poorer reproductive health than women in rural areas.
Large health disparities within cities would suggest that equal proximity to health facilities
cannot be interpreted as equal access to services. Similar health conditions among rural and
large groups of urban women would indicate that “urban bias” in the allocation and
concentration of public and private health care resources does not necessarily translate into
widespread health advantages for urban women.
This paper focuses on the urban poor, women who live in dwellings without
electricity and who also do not use minimally safe drinking water and safe waste disposal
facilities. This classification of urban poverty presumably encompasses those persons living
in slums, squatter settlements, and peri-urban areas of cities, as well as persons living in
small, remote towns where infrastructure remains poorly developed. While many indicators
of reproductive health merit investigation, this study focuses on three broad categories:
unwanted fertility and family planning, antenatal care, and conditions at delivery. These
themes cover a course of reproduction from before conception, through pregnancy, to
childbirth.
Reproductive Health Care in Sub-Saharan Africa
A review of the literature produces scanty readings on reproductive health care in urban parts
of Sub-Saharan Africa. Many studies that compare availability of health services between
rural and urban areas highlight the plight of rural areas, given most income-earning
opportunities and the major hospitals that consume a disproportionately large component of
the overall health budget are concentrated in cities and big towns (Kwast 1989). For
instance, it has been estimated that in some countries about 75% of the health budget funds
hospitals, most of which are located in urban areas, and 25% goes to primary health care
services which serve rural residents (Biddulph 1993). However, the physical proximity to the
hospitals may not give poor urban residents much leverage over their rural counterparts due
to economic deprivation, among other factors.
The plight of the urban poor may be escalating in many African cities as the vast
majority of them reside in informal settlements that are customarily deprived of health
services by the central governments. As shown in India, slum residents may not readily
4
utilize health services, even when provided free of charge or brought closer to their
residences, because of time constraints generated by pressure to raise money for bare survival
(Sarin 1997; Mulgaonkar at al. 1994). Lack of stable and regular sources of income and the
high costs of living in cities often force women into the commercial sector, doing adhoc jobs
and trading during business hours that conflict with the hours of operation of major health
facilities; poor women can ill afford to lose hours of pay to attend facilities under less than
dire circumstances. Economic vulnerability also forces many poor urban women to indulge
in risky sexual behavior such as having extramarital or multiple sexual partners in order to
make ends meet (Ulin 1992, Carael and Allen 1995; Omorodion 1999; Zulu, Ezeh and
Dodoo. forthcoming). Family support networks are generally weaker in cities than in
villages, leaving many women fewer options to attend to young children and therefore more
reluctant to obtain adequate antenatal and obstetrical care. Social heterogeneity and
stratification according to ethnicity, occupation, neighborhood of residence and place of
origin, and other features are typically more common in cities than in more homogeneous
villages, and may lead, at best, to selective service of clients by practitioners, and at worst to
poor or inadequate service as a result of covert discrimination.
The expansion of female migration from rural to urban areas and the consequent
increasing proportion of women in cities raise new challenges in examining women's health
in the urban setting. New migrants to urban areas tend to have worse reproductive health
outcomes than those who have stayed in urban areas for a long time and those who have lived
in rural areas (Brockerhoff and Biddlecom 1999). Migrants may comprise a large minority of
the city’s population, and many of them stay seasonally or for short durations, frequenting
health facilities only in their home villages. In very large cities, the slums in which the poor
live are often inaccessible to health care workers. These and many other factors combined
with the cost of health services in urban areas may lead to inadequate reproductive health
care for poor mothers. Thus, there are many constraints to reproductive health in urban areas
that deserve recognition, factors unique to urban settings and that particularly affect the poor.
DATA AND METHODS
Measuring Urban Poverty with Demographic Surveys
Montgomery at al. (2000) note that in the absence of reliable data on income and
consumption to measure living standards in health-related surveys, researchers typically rely
5
on one of three sets of indicators: (1) access to potable water and the nature of toilet facilities,
(2) quality of housing materials, or (3) ownership of selected consumer durables. Like
income and consumption, which do not necessarily represent all of the material resources
available to a household, each of these three proxy measures of living standards is inadequate
to distinguish the urban poor from the non-poor in low-income countries. For instance, with
respect to building materials of the dwelling, a cement floor may represent the preference of a
well-to-do household that values a solid foundation, whereas for others it reflects illegal or
non-tenured housing on sidewalks, streets, or in parks (Perlman 1986). Ownership of
consumer durables is partly a function of taste and choice, and may be independent of wealth
or income. A poorer household, for instance, may expend the bulk of its income on a radio,
motorbike, and other goods yet live in squalor; a wealthier household may eschew these same
non-perishable goods for other purchases (for example, travel). Furthermore, consumer
durables often do not work, nor are they always purchased by the current users or owners.
Household linkage to electricity and use of safe drinking water and sanitation—a
“basic amenities” definition for urban areas—is perhaps the least flawed indicator to gauge
urban poverty, since electricity and the ready availability of potable water and clean fecal
waste disposal facilities can be considered as universally-desired and needed services in
urban areas; wealth and income are the main constraints on the demand for these items.
While start-up costs of implementing these major services are typically high in cities, the
marginal costs of extending the services throughout a compact community are usually low
(Hardoy and Satterthwaite 1989). Therefore, wealthier and poorer urban households can
usually be distinguished based on whether major infrastructure is in place in their
neighborhoods or is used. Nonetheless, an absence of any single amenity cannot be taken to
represent poverty. For instance, many deprived households illegally “tap into” electrical
power sources from distant origins, while others use fresh water sources (e.g., collected
rainwater) rather than local standpipes and boreholes for drinking, or open public space rather
than safe septic tanks or cesspools for urination and excretion (for instance, because local
facilities are too scarce). To overcome such practices that would undermine a basic amenities
classification of urban poverty, a strict definition of the urban poor can be applied, for
instance as persons whose dwellings lack (or who do not avail themselves of ) a set of basic
infrastructure items.
In a study meant to compare sexual outcomes between slum and non-slum residents
of Nairobi City based on Demographic and Health Survey (DHS) data, Zulu, Dodoo and
Ezeh (2002) use the simultaneous absence of electricity, water (pumped into the residence),
6
and sanitation (flush toilets) as a proxy indicator of slum residence. The authors argue that
while there are some slum dwellers who have one or two of these amenities, and there are
also some non-slum dwellers who lack one or two of the three amenities, it is inconceivable
to think of a non-slum location in the city where all three are simultaneously absent. Thus,
although the measure does not capture a clean dichotomy of slum versus non-slum contexts,
it is at least able to identify the core of slum settlements where none of the three amenities is
available. The authenticity of using the simultaneous absence of these amenities as an
indicator of slum residence is validated by the closeness of the results (for slum areas) in the
Zulu et al. paper and those obtained from a representative sample of the city’s slum
settlements (APHRC 2002).
Data
Data analyzed in this paper are from DHS conducted in 23 countries of sub-Saharan Africa
during the 1990s. The DHS apply probability-based sampling separately to urban and rural
strata, to provide valid samples of the urban and rural populations at the national level.
Typically, the urban sample is large enough (at least 1000 female respondents) to produce
acceptably low sampling errors and high reliability of estimates. In cases where the urban
sample is a small proportion of the national sample (as in many DHS conducted in Africa)
urban areas are over-sampled. In such cases, the analyses in this study apply individual
weights to each survey respondent to produce a representative urban sample.
In this study, we define the “urban poor” as those women of reproductive age who do
not have electricity in their dwellings and also do not use drinking water that is piped into
their home or from a public tap, nor use a private or shared flush toilet. The non-existence or
nonuse of all three amenities in this classification arguably produces a conservative estimate
of the urban poor, although it represents those urbanites living in the most extreme conditions
of deprivation. A multi- item definition is necessary so as to not over-represent as poor those
persons living in small urban areas where one of the amenities (for instance, electricity) is
much more likely to be absent than in big cities. Analysis of pooled data from Mali, Niger,
and Senegal reveals a Pearson correlation coefficient of 0.893 (p<.01) between an urban
woman living in a dwelling without any basic amenities and living in an urban cluster (or
community) where most households lack all basic amenities. Therefore, in describing the
urban poor in Africa, one can extrapolate from the individual to community level with a high
degree of confidence.
7
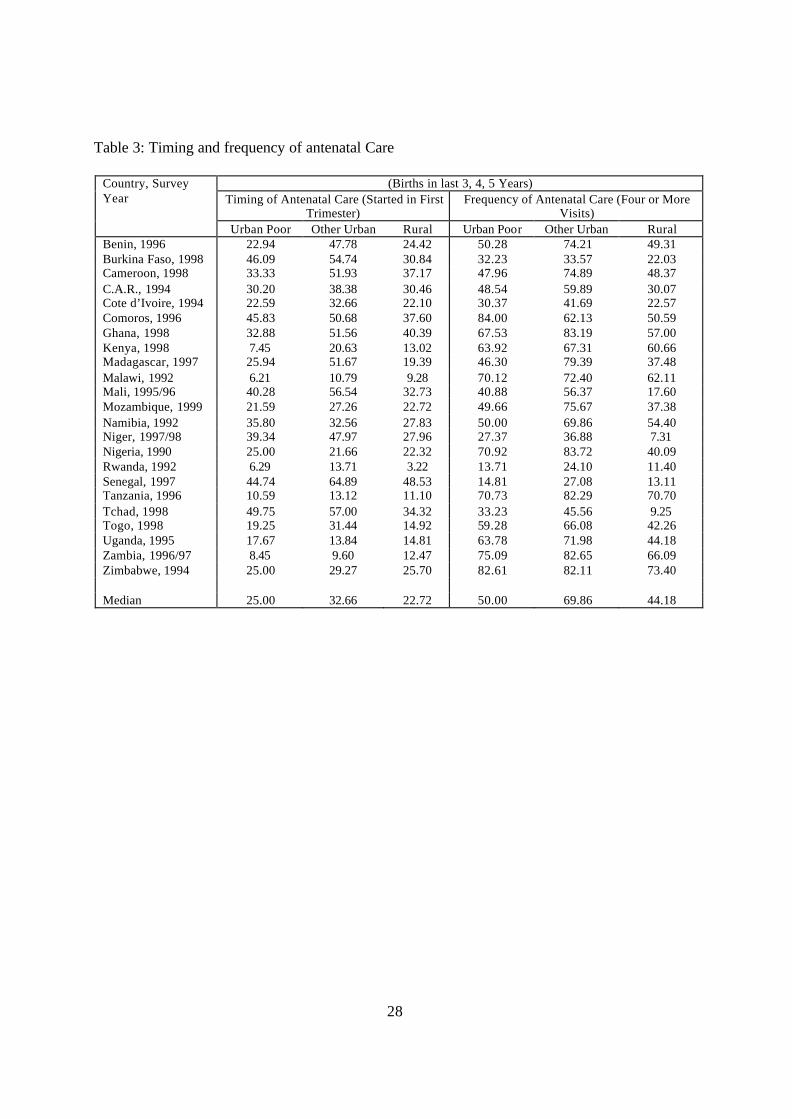
The indicators of maternal health analyzed, namely: unplanned fertility; antenatal
care; and delivery care relate to births to women in the 3, 4 or 5 years immediately preceding
the surveys. Unplanned fertility is classified into three categories: mistimed (wanted later),
unwanted (wanted no more) and wanted fertility (wanted then). Antenatal care is assessed
based on both the timing and the frequency of visits during pregnancy, while delivery care
indicators include delivery attendant, place of delivery, and delivery of tetanus vaccinations
to the women.
Methods of Analysis
The analysis proceeded as follows. First, descriptive statistics are presented for three groups
of women—the urban poor, other urbanites, and rural residents—to determine whether
substantial differentials exist between the urban poor and others according to well-
established, minimally acceptable levels of maternal health care, as declared at international
conferences since the 1970s. Since cultural practices of maternal health vary greatly across
African settings, our main interest is in intra-national differentials rather than cross-national
comparisons. Median values from the 23 countries arguably represent approximate
conditions in the region.
The descriptive analysis is followed by multivariate analyses that examine the effect
of residence (urban poor, other urban, and rural) on maternal health outcomes, while
controlling for the effects of other important covariates: parity, age, education level, religion
and region/province of residence. The three outcome variables here have binary responses
(with only two broad categories), and hence, the multivariate analyses are based on binomial
logistic regression models to examine the variations in the odds of unplanned fertility,
inadequate antenatal care, and non-professional delivery care between pairs of the three
residential categories (urban poor, other urban, and rural residents).
Further analyses have examined the variations in urban maternal health inequalities
across different countries in sub-Saharan Africa using multilevel logistic regression models.
The analysis, based on two-level models that treat the country effect as random and allows
the effect of residence to vary across countries, seeks to determine the magnitude and pattern
of variations in the urban maternal health inequalities across countries. This will help
determine to what extent the observed maternal health inequalities are generalizable across
countries of sub-Saharan Africa. The general form of the random coefficients multilevel
logistic model used in the analysis may be expressed as:
8
Where:
π ij - is the probability of a given outcome for a particular birth, i, in country, j ; X’ij - is the vector of covariates which may be defined at birth, or country level; β - is the associated vector of fixed parameters; Y’ij- is a vector of covariates (usually a subset of X’ij) the effects of which vary
randomly at country level; and uj - is the vector of country level random effects.
The multilevel regression analyses were carried out using the MLwiN statistical package
(Institute of Education, 2000). The estimates are based on second-order predictive quasi
likelihood (PQL) procedure.
RESULTS
Descriptive Analysis
Extent of Urban Poverty
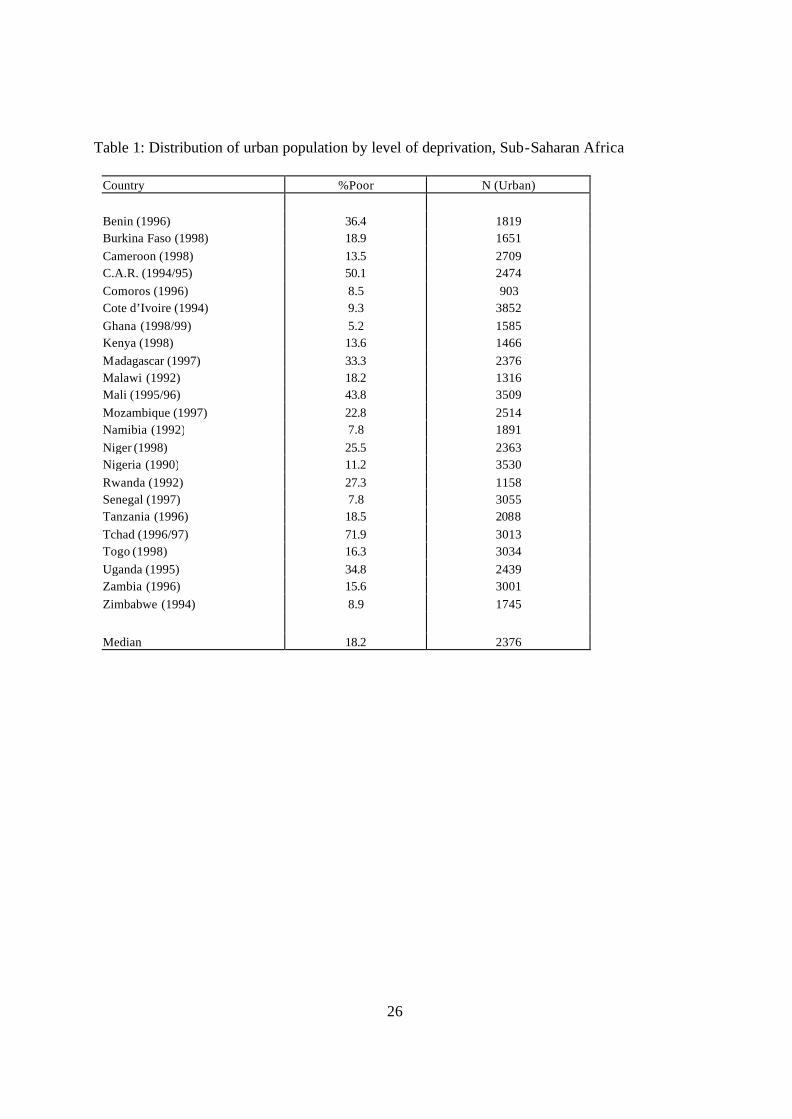
The percentage of urban women interviewed in the 23 countries who are classified as poor
ranges from under 10 percent in six countries—Ghana, Côte d’Ivoire, Comoros, Namibia,
Senegal and Zimbabwe—to 72 percent in Tchad (Table 1). Despite this variation, the
validity of a basic amenities definition of urban poverty is indicated by the consistent levels
observed in adjacent or nearby countries. For instance, levels are between 9 and 16 percent
in Ghana, Nigeria and Togo; 14 percent in Kenya and 18 percent in Tanzania. Further
support for this classification of urban poverty comes from a Pearson correlation coefficient
of -.566 (p<.01) between levels of urban poverty and Gross National Product per capita in the
survey year.4
[Table 1 about here]
Extreme differences in urban poverty levels between countries may be attributable to
their urban structures and histories.5 For example, almost half of the urban population of
Senegal resides in greater Dakar, which benefited as the longtime center of French colonial
West Africa, and which continues to draw a disproportionate share of direct foreign
investment in the Sahel region. 6 The urban population of Uganda, on the other hand, consists
uY + X = Logit jijijij '' βπ
9
of localities of 100 or more residents, the lowest threshold in the developing world; most
urbanites in Uganda live in scattered large villages or small towns.7
Fertility, Unwanted Fertility and Unmet Need for Family Planning
Ensuring that women have the freedom to decide whether and when to have children is one of
the major goals of family planning and reproductive health programs. However, studies
show that a large proportion of births in the developing countries result from unplanned
pregnancies. Such pregnancies have been linked to a variety of negative health consequences,
such as unsafe induced abortions and poor antenatal care (Joyce and Groomsman 1987;
Dixon-Mueller 1989; Magadi, Madise and Rodrigues 2000). The determinants of unplanned
fertility are complex, not easily reduced to factors such as lack of contraception or education.
Even though use of family planning is expected to reduce the incidence of unplanned
pregnancies, it has been suggested that as actual fertility declines, wanted fertility may
decline even faster, so that the proportion of births that are unplanned may actually grow
even when fertility control is becoming more prevalent (Tsui, Wasserheit and Haaga 1997).
Analysis of DHS data by Westoff and Bankole (1995) shows that much of the unmet need for
contraception, especially in sub-Saharan Africa, is motivated by the desire to delay first
pregnancies or to space pregnancies, rather than to stop childbearing.
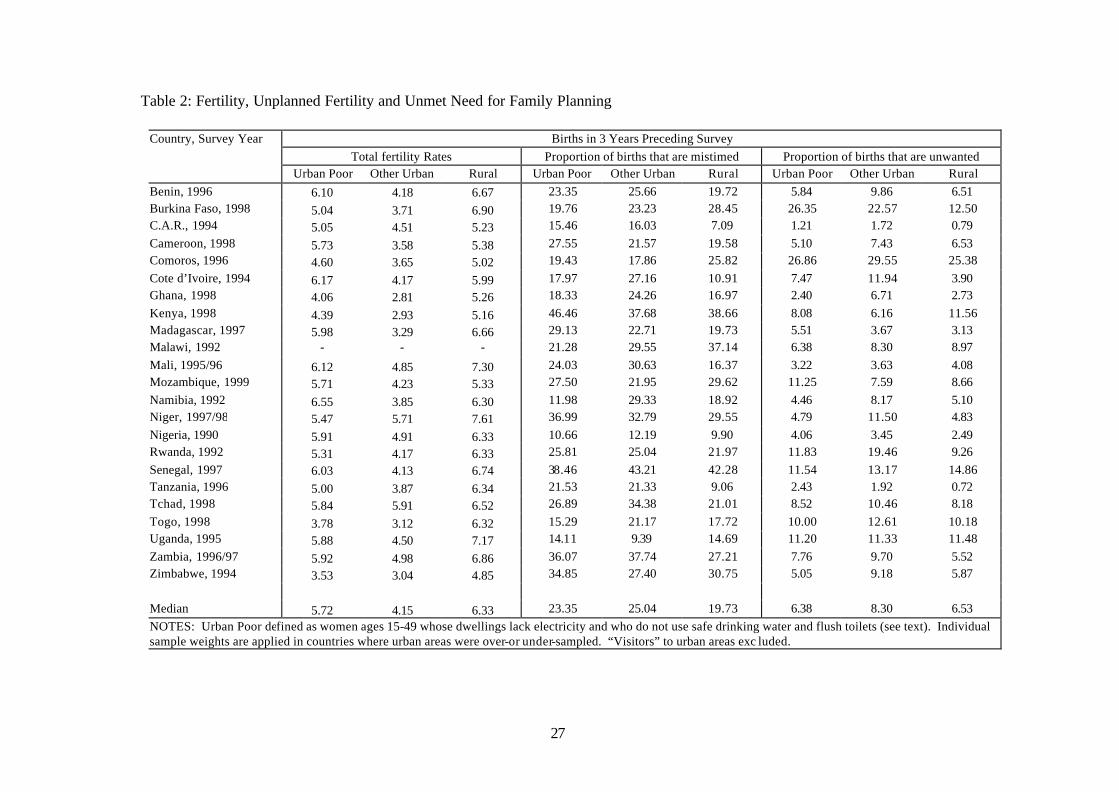
The fertility levels presented in Table 2 vary considerably across the three residential
sub-categories as well as between countries. Fertility levels for the urban poor range from
3.5 (Zimbabwe) to 5.6 (Namibia), while for rural areas they range from 4.9 (Zimbabwe) to
7.6 (Niger). These variations reflect broader differences on reproductive contexts in which
the urban poor operate across the countries. Fertility of the urban poor in sub-Saharan Africa
more closely resembles the fertility of rural women than of more affluent urban residents. As
shown in Table 2, the median total fertility rate (TFR) of the urban poor in the three years
preceding the surveys was 5.72 births, a level 0.61 lower than in rural areas (6.33) and 1.57
higher than among other urbanites (4.15). In all countries except Cote d’Ivoire, Namibia,
Cameroon and Mozambique, the urban poor have higher fertility than rural residents. The
TFR was higher among the urban poor than other urban residents in 20 of 22 countries, the
exceptions being Niger and Tchad. The most extreme difference is in Namibia, and also in
Madagascar, where fertility among the relatively large population of urban poor was nearly
twice as high as among other urban residents. Almost all countries with a difference of one
child or less (between the urban poor and non-poor) have relatively high fertility levels in
10
general, with the exception of Zimbabwe, where the urban poor have about half a child more
than other urbanites. The median wanted fertility rate from the data we have analyzed was
1.2 births higher among the urban poor (4.8) than among other urbanites (3.6).8 These
differentials support the observation of Mamdami at al. (1993) that the urban poor generally
desire more children than other urban residents despite the relatively high costs of child-
rearing in cities, costs that poorer households presumably are less equipped to sustain.
[Table 2 about here]
High wanted fertility of the urban poor in Africa, however, obscures their high levels
of unwanted births. The next two panels of Table 2 show that a considerable proportion of
all births (30, 33, and 26 percent among the urban poor, other urbanites, and rural residents,
respectively) in sub-Saharan Africa are either unplanned or unwanted. The median
proportion of mistimed births among the urban poor (23.4 percent) was higher than the
proportion for rural areas (19.7 percent), but slightly lower than that for other urbanites (25
percent). The patterns seem rather inconsistent as some countries with more or less similar
reproductive conditions exhibit not only different levels of variations, but also in different
directions. For instance, the neighboring Malawi and Tanzania have the biggest difference in
the levels of mistimed fertility between the urban poor and rural residents, but the differences
are in opposite directions. The big proportion of mistimed births in rural areas in Malawi may
be a reflection of intense emphasis of child-spacing in the country’s traditional reproductive
regime (Zulu 1998; Zulu and Kalipeni, forthcoming). In general, births are about as likely to
be unwanted among the urban poor (6.4 percent) as among rural residents (6.5 percent) but
more likely to be unwanted among other urban residents (8.5 percent) in this sample of
African countries.
Intra-urban differentials in unwanted fertility correspond closely with differences in
the unmet need for family planning. The median level of unmet need is 19 percent among the
urban poor (and 20 percent among rural women), as compared to 16 percent among other
urban residents. In 18 of the 22 countries, unmet need is higher among the urban poor than
other urbanites, and levels nearly twice as high among the urban poor are observed in
countries with relatively high as well as low fertility (for instance, Namibia and Zimbabwe).
One can interpret from these statistics that the relatively high unwanted (and total) fertility of
the urban poor in sub-Saharan African could be lowered by programs that more effectively
meet couples’ need for contraception. Data available from 12 countries (not shown) on
family planning outreach services (defined as having been visited recently by a family
planning worker) offer modest evidence that service provision is inferior in poor urban areas.
11
In 8 of the 12 countries, the urban poor were less likely to have been visited by a family
planning worker in the past year than were other urbanites; only in Zimbabwe, where both
urban and rural fertility rates are low, have the urban poor been serviced with particular
vigor.
Prenatal Care
Poor antenatal care is a risk factor for adverse pregnancy outcomes for both the mother and
the baby, including maternal mortality, perinatal mortality, premature delivery, pre-eclampsia
and anemia, in many settings of the developing world (Anandalakshmy et al. 1993; Fawcus et
al. 1996; Magadi, Diamond and Madise 2001). Initiation (timing), frequency, and overall
quality of antenatal care are important for timely identification and mitigation of potential
pregnancy complications. To ensure that potential pregnancy problems are identified in
good time, it is important that antenatal care is started early in pregnancy and continue at
regular intervals throughout the pregnancy. It should be noted, however, that the number of
antenatal visits may not have much impact on maternal health and the outcome of the
pregnancy if the health personnel are not well trained and equipped to timely and effectively
screen and manage potential risk factors both to the mother and fetus, and provide education
and counseling on how to deal with various issues outside the clinic (Rooney 1992).
Unfortunately, these management and quality of care aspects are not reflected in the
information on the timing and frequency of antenatal care.
Table 3 shows that few women in sub-Saharan Africa receive prenatal care in the first
trimester from a health service provider, particularly in East, Central, and Southern Africa.
Among the urban poor, for instance, less than 10 percent of the women in Malawi, Rwanda,
Kenya and Zambia initiate prenatal care in the first trimester, compared to between 40 and 50
percent of their counterparts in Mali, Senegal, Comoros, Burkina Faso, and Tchad).
Nonetheless, large disparities exist between urban groups and rural women in most countries.
While urban populations presumably have far greater physical proximity to antenatal care
(and greater resources to use it) median averages are close for women in poor urban areas and
rural areas, with 25 and 23 percent of recent births of both groups receiving early care. In
eleven of the 23 countries, fewer urban poor women initiate antenatal care in the first
trimester than rural women. Early use of prenatal care is significantly higher among other
urbanites, at 33 percent. This general pattern of differentials is most pronounced in
12
Madagascar, but it is typical of coastal West African countries including Benin, Senegal,
Ghana, Cameroon, Mali, Togo, and Côte d’Ivoire.
[Table 3 about here]
Less early antenatal care in East, Central, and Southern Africa apparently reflects a
common practice in those areas of postponing visits until later in pregnancy rather than not
having them, while West African women tend to have fewer overall visits, despite starting
earlier. Most of the countries in East, Central and Southern Africa which have the lowest
proportion of women attending antenatal care in the first trimester are among the best
performers when we look at proportion of women making four or more antenatal visits during
pregnancy. The urban non-poor are more likely to make frequent antenatal care visits, with
70 percent of women having made four or more antenatal visits, compared to the poor
urbanites (50 percent) and rural residents (44 percent). Indeed, only on the small island of
Comoros are the urban poor (84 percent) more likely than the non-poor (62 percent) to have
attended four or more antenatal care visits. In 21 of the 23 countries, rural residents make
less antenatal visits than urban residents.
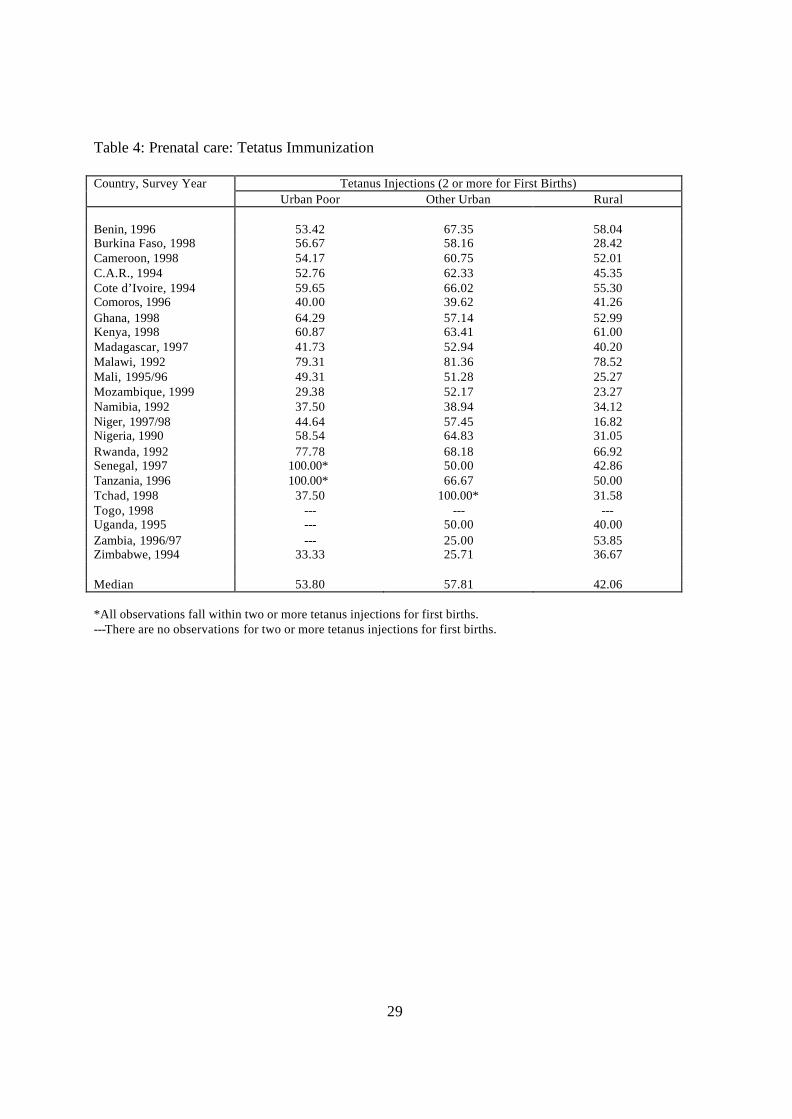
The 1990 World Summit for Children established a goal of universal tetanus toxoid
immunization by the year 2000. Tetanus vaccinations are used to protect the mother and the
child from infections during and immediately after delivery. The results (Table 4) show huge
variations in the coverage of tetanus immunization across countries with the southern African
countries of Zimbabwe, Mozambique and Namibia exhibiting the lowest levels (below 40%),
while Tanzania and Senegal have universal coverage (Table 4). On average, poor women in
urban Africa in the 1990s were much more likely than rural women to have received
injections, at 54 and 42 percent, respectively, but less likely than other urban women, at 58
percent. Intra-urban differences in tetanus immunization are not large in the majority of the
countries, but they are systematic across the region, with the poor being disadvantaged in 14
of the 20 countries with data on this indicator. In Tchad, while universal tetanus
immunization is achieved among the urban non-poor, less than 40% of the urban poor and
rural residents received the immunizations.
[Table 4 about here]
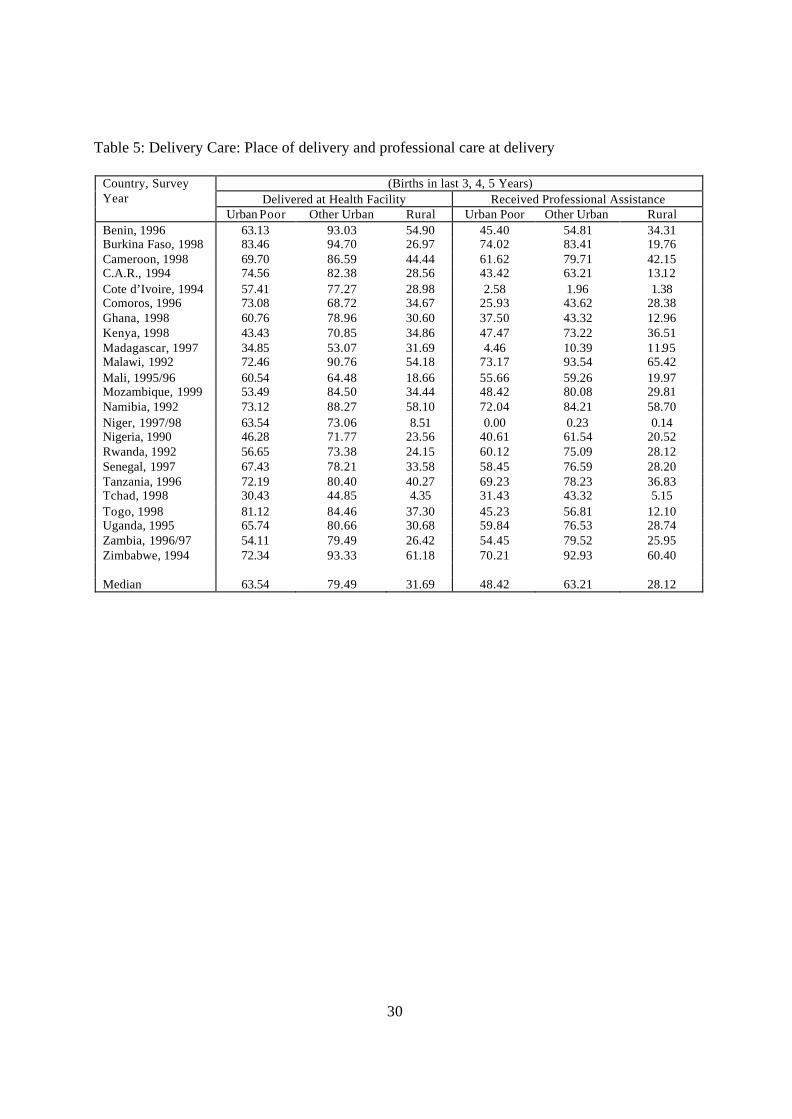
Conditions at Delivery
Appropriate delivery care is important for the health of both the mother and the newborn,
especially in cases where childbirth complications develop. It is important that mothers
13
deliver their babies in a hygienic setting and in the presence of a qualified attendant and
equipment/supplies in order to reduce the risk of infections and be in a position to effectively
manage any complications that may arise. Delivery care in most parts of sub-Saharan Africa
is far from adequate as a large proportion of deliveries occur at home, and without a qualified
attendant (see for example Magadi, Diamond and Rodrigues, 2001).
Table 5 presents data for the nature of delivery care that African women accessed in
the 1990s. Although distance to a health facility may not differ greatly among urban
population groups in Africa, the use of health facilities for giving birth does differ. For the
urban poor, the percentage of births delivered in health facilities varies from less than half in
Tchad, Madagascar, Kenya and Nigeria, to over 80 percent in Togo and Burkina Faso. The
urban poor are more likely than their non-poor urbanites to deliver outside health facilities in
all countries, except the Comoros. While only about a third of rural births are delivered in
health facilities, close to two-thirds of children of the urban poor and four fifths of births of
the non-poor urbanites are delivered at such facilities. The urban poor are advantaged
compared to their rural counterparts in all the 23 countries, though the differentials are more
pronounced in Western Africa than they are in Eastern and Southern Africa. The biggest
difference between the two groups is observed in Niger where only 63.5 percent of births
among the urban poor are delivered in health facilities, compared to only 8.5 percent among
rural residents. Use of health facilities for delivery generally differs less between the two
urban groups in Western Africa than in Eastern and Southern Africa.
[Table 5 about here]
Delivery assistance from a health professional (nurse, doctor or trained TBA) shows a
similar pattern of differentials as place of delivery. We did not separate those who attended
care from physicians and those who got care from nurses because physicians are often seen
when there are complications that midwives and nurses, who ordinarily handle deliveries,
cannot deal with. As such, differences in attendance by physicians reflect both the extent of
pregnancy/delivery complications and choice of delivery attendant by some clients. In
countries like Cote d’Ivoire and Madagascar, less than five percent of the urban poor received
professional assistance, while in Zimbabwe, Namibia, Malawi and Burkina Faso over 70
percent of all deliveries were attended to by professional assistance. Cote d’Ivoire and
Madagascar (alongside Niger) exhibit the lowest (less than 12%) utilization of professional
delivery care for all the three residential categories. In general, Southern African countries
exhibit higher levels of professional care utilization than West African countries.
14
Greater use of professional assistance during delivery among the urban non-poor
compared to the urban poor is observed in all countries, except Cote d’Ivoire. Huge
differences of close to or over 20 percentage points are noted in Southern Africa
(Mozambique, Zambia, Zimbabwe, and Malawi), as well as in Kenya and Nigeria. The urban
poor are more likely to receive professional care than rural residents in all countries, except
Madagascar, the Comoros, Niger and Cote d’Ivoire, indicating that in some countries on the
continent, there is need to pay more attention to the reproductive health needs of the urban
poor.
In sum, there is considerable intra-urban inequality in maternal health care in sub-
Saharan Africa. The urban poor are disadvantaged compared to the urban non-poor
according almost all indicators of maternal health considered. Although the urban poor
disadvantage is more pronounced in some countries more than others, they are at least
modestly deprived in virtually all countries.
Multivariate Analysis
The associations between residence and reproductive health outcomes observed in the
descriptive analysis may be spurious due to the effects of other important socio-economic and
demographic factors that are associated with residence. For instance, urban residents are
likely to comprise a higher proportion of women who are younger, with fewer children and
more educated. In addition, factors such as religious affiliation and region of residence may
also have independent effects on reproductive health outcomes. The results of the
multivariate analysis presented in this section control for the effects of these factors.
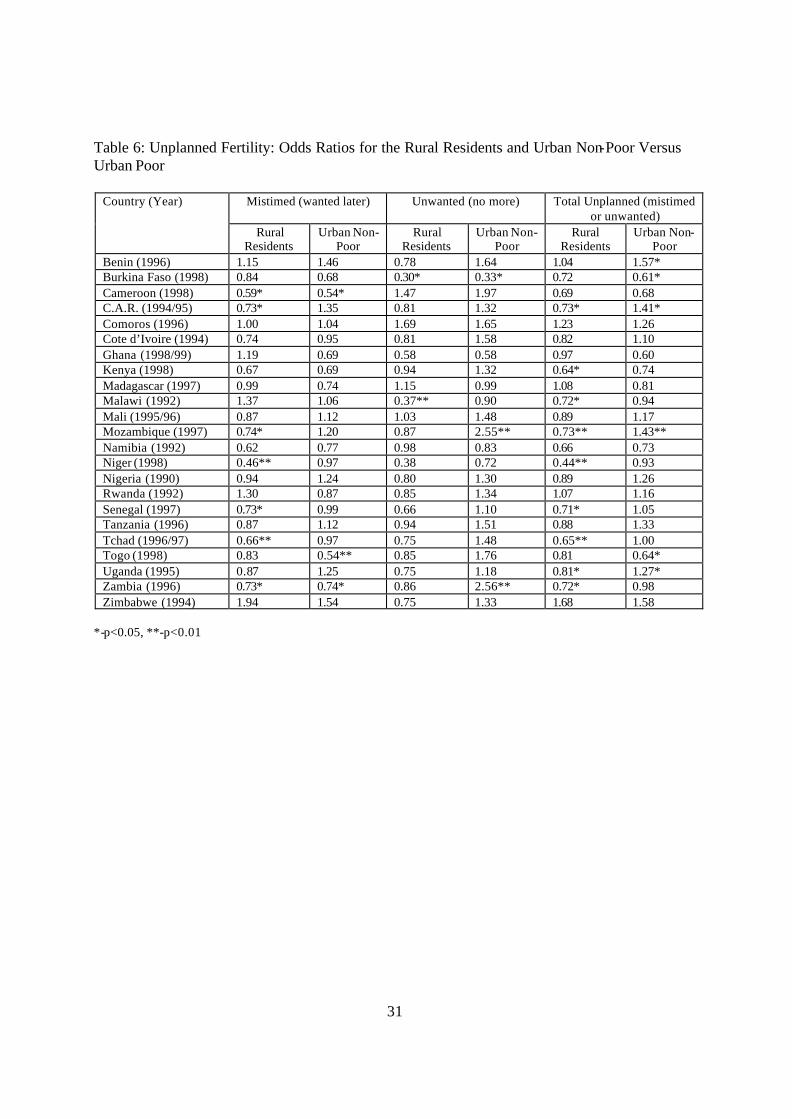
Unplanned fertility
Results from the multivariate analysis presented in Table 6 show that rural women are less
likely to report mistimed fertility as compared to the urban poor. In virtually all countries
(seven) where there is a significant association between residence and unplanned versus
wanted fertility (p<0.05), the urban poor are more likely to have mistimed or unwanted births
than their rural counterparts. In comparison with the urban non-poor, the urban poor are
more likely to have mistimed fertility in all the three countries where there is a significant
difference between the two residential categories. For unwanted fertility, evidence of
15
significantly higher rates among the urban non-poor compared to the urban poor are observed
in Zambia and Mozambique (in Southern Africa), while the relationship is reversed in
Burkina Faso (in West Africa). For the analysis of combined mistimed and unwanted fertility,
the results are similar; the urban poor are more disadvantaged than urban non-poor in all the
countries with significant residential residence/deprivation effects, while positive effects are
noted in four and negative ones in two of the six countries where significant results are noted
for intra-urban variations. These relationships control for the effects of the other covariates
such as birth-order, which have very strong associations with unplanned fertility. As would
be expected, increasing birth order is consistently associated with high probability of
unplanned fertility, especially unwanted births (results not shown).
[Table6 about here]
Prenatal Care
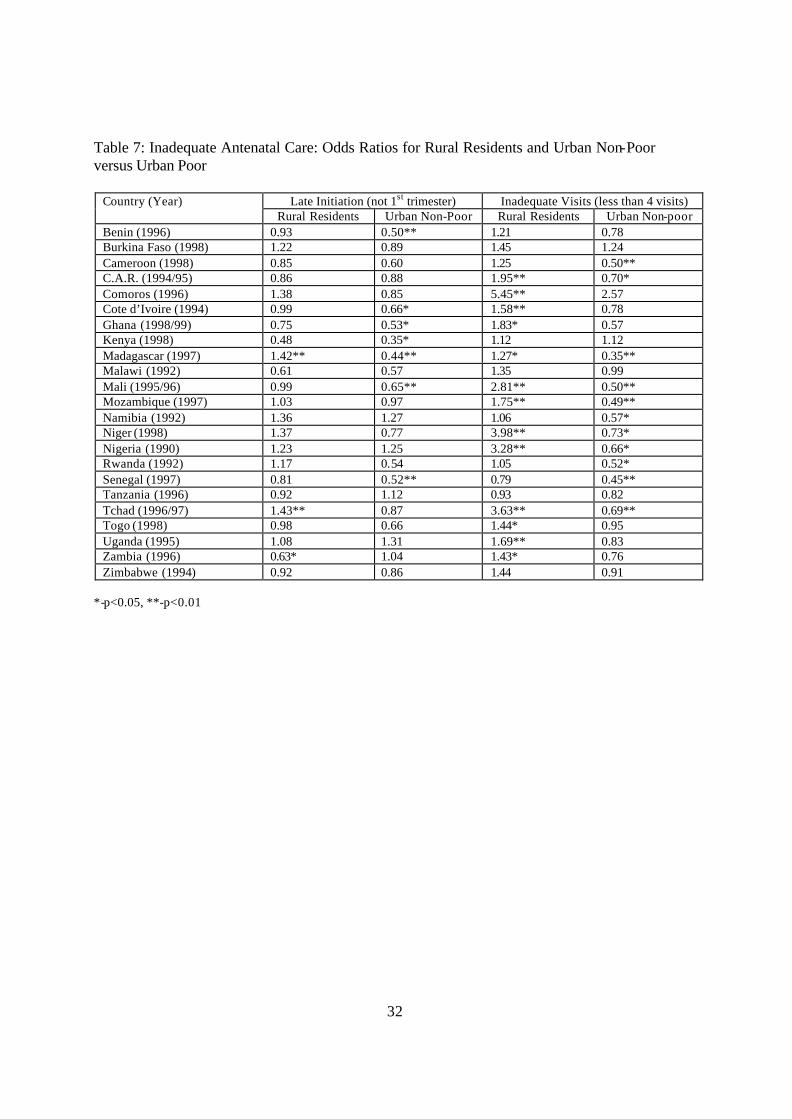
Table 7 shows limited and inconsistent differences in the timing of antenatal care between the
urban poor and rural women, as the urban poor are more likely to initiate early prenatal care
than rural residents in Zambia, but less likely to do so in Madagascar and Tchad. The urban
non-poor are more likely than the urban poor to initiate antenatal care in the first trimester.
All countries (7 out of the 23) showing significant differences (p<0.05) in timing of antenatal
care between the urban poor and urban non-poor conform to this general pattern.
[Table 7 about here]
The urban poor are also generally less likely to receive adequate antenatal care, based
on frequency of visits, as compared to the urban non-poor. However, compared to rural
residents, the urban poor are better off. In all countries showing significant relationships, the
urban poor are less likely than the urban non-poor, but more likely than rural women to
receive adequate antenatal care (make at least four visits during pregnancy).
Delivery Care
Of all the maternal health indicators examined in this paper, delivery care shows the greatest
consistency with respect to residential disparities (see Table 8). In almost all the countries,
the urban poor have significantly lower risks of non-professional deliveries than rural
residents. The only exceptions are Madagascar and Zimbabwe (though only significant for
delivery attendant in Madagascar) where professional delivery care is higher among rural
16
residents than among the urban poor. As would be expected, professional delivery care is
generally significantly higher among the urban non-poor than the urban poor. In Zimbabwe,
for instance, the urban non-poor are 6.2 times more likely to have professional delivery care
than the urban poor.
[Table 8 about here]
The urban poor advantage in delivery care, over rural residence, may be attributed
mainly to physical inaccessibility of health services and cultural beliefs surrounding delivery
in many rural settings of sub-Saharan Africa. Unlike the antenatal care services which are
usually available in smaller health centers, facilities providing delivery care are usually
distant for many rural residents. On the other hand, the urban poor versus non-poor disparity
is most probably due to cost implications, since professional delivery care services are likely
to be unaffordable to the urban poor.
Variations in Maternal Health Inequalities Between Countries
This section examines variations in maternal health inequalities between countries of sub-
Saharan Africa, using merged data set for 23 countries of sub-Saharan Africa. The variations
between countries are examined after taking into account the effect of the main factors known
to influence maternal health in the region: mothers educational attainment, age and parity at
the time of birth of index child. This analysis seeks to establish the extent to which the
observed maternal health inequalities are generalizable across countries of sub-Saharan
Africa.
Unplanned fertility
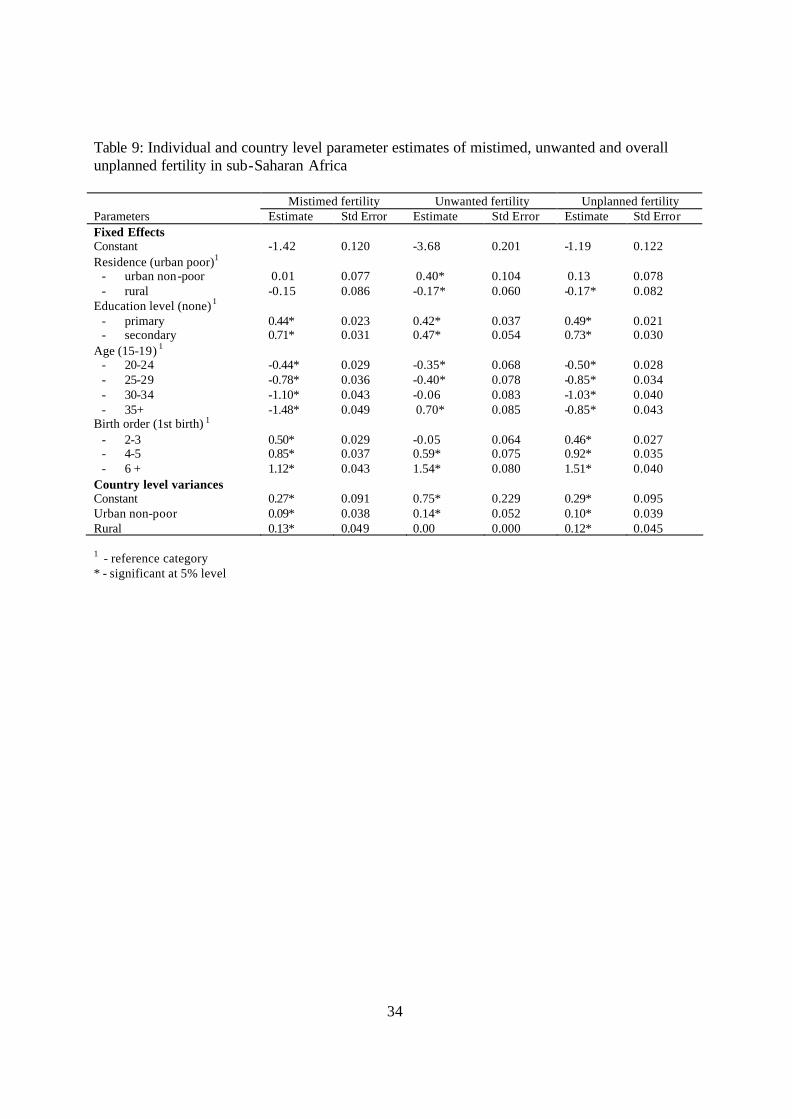
The individual and country level parameter estimates for mistimed, unwanted and overall
unplanned fertility are presented in Table 9. The results for the socio-demographic factors
are consistent with existing literature, showing higher risks of unplanned fertility among
teenagers, higher order births, and the more educated women, compared to their older,
nulliparous or uneducated counterparts.
[Table 9 about here]
Averaging across countries, there is no significant difference between urban poor and
urban non-poor in terms of mistimed or overall unplanned fertility, but unwanted fertility is
significantly higher among the urban non-poor. The urban poor have, on average, higher
17
unwanted or overall unplanned fertility than rural residents. Despite these general patterns,
the country level variances indicate that the levels of unplanned fertility vary significantly
between countries and the residential inequalities also vary significantly across countries.
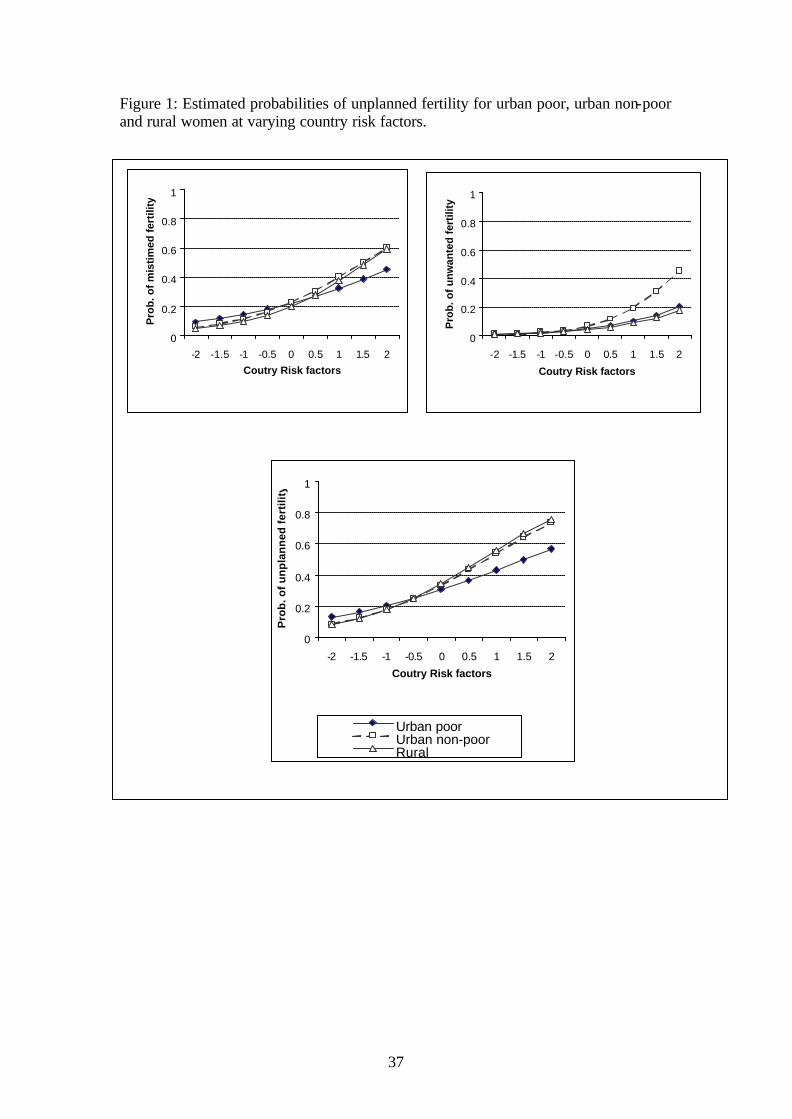
Figure 1 shows the variations in mistimed, unwanted and overall unplanned fertility for urban
poor, urban non-poor and rural residents, for countries with varying risks/ levels of unplanned
fertility. Since the countries risk factors have a standard normal distribution, the values are
varied from -2 to +2, representing countries with the lowest and highest risks respectively.
(Figure 1 about here)
The graphs show that the urban poor have relatively higher mistimed or overall
unplanned fertility than the urban non-poor or rural residents for countries with low
levels/risks of unplanned fertility. However, for countries with relatively high risks/levels of
unplanned fertility, the urban poor are notably less likely to have a mistimed or overall
unplanned fertility compared to the urban non-poor or rural residents. For unwanted fertility,
the urban poor are not different from rural residents across countries. However, the urban
non-poor in countries with higher than average risks of unwanted fertility exhibit
significantly higher levels of unplanned fertility than their urban poor or rural counterparts.
Antenatal Care
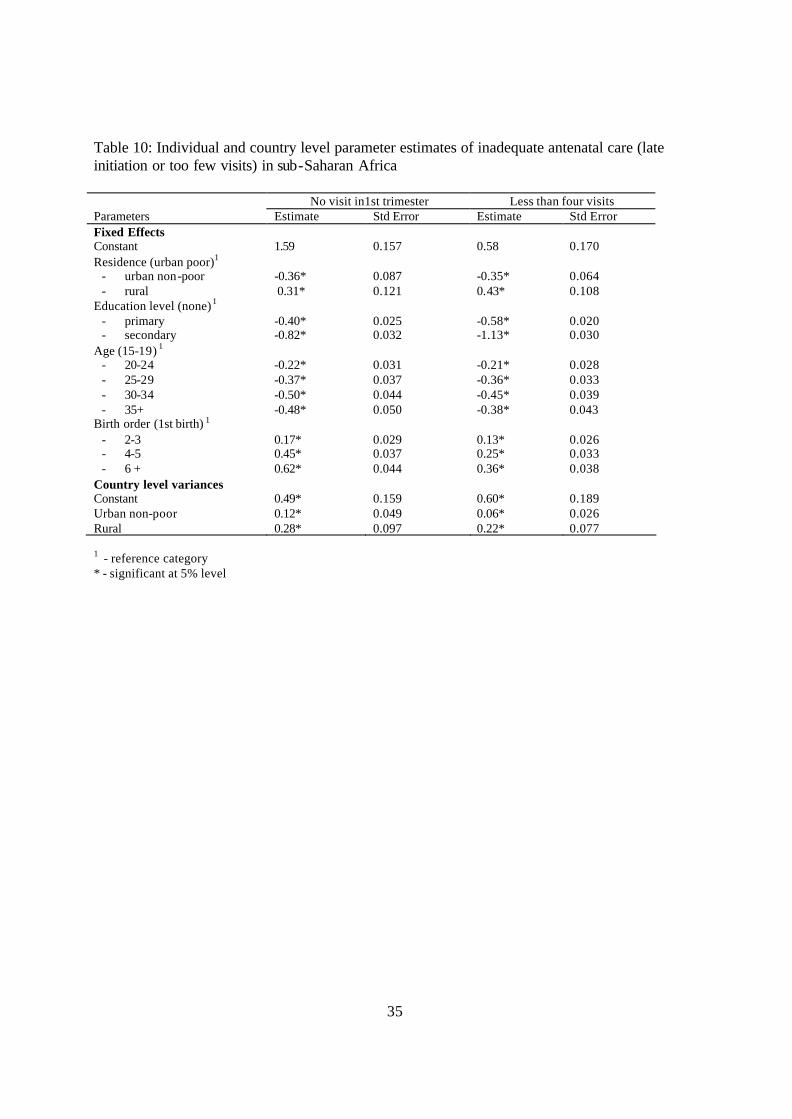
The results for antenatal care presented in Table 10 confirm the general pattern that antenatal
care for the urban poor is significantly worse off than for the urban non-poor, albeit better
than rural residents. The urban poor in sub-Saharan Africa are on average 1.4 times more
likely to initiate antenatal care late in pregnancy (during 2nd or 3rd trimester) or make an
inadequate number of antenatal visits (three or less) during pregnancy. In general, the results
further confirm findings from earlier studies showing overall significantly poorer antenatal
care among teenage mothers, less educated women and higher order births, compared to their
counterparts who are older, more educated or lower order births. The results further show
that urban inequalities in antenatal care vary significantly between countries.
[Table 10 about here]
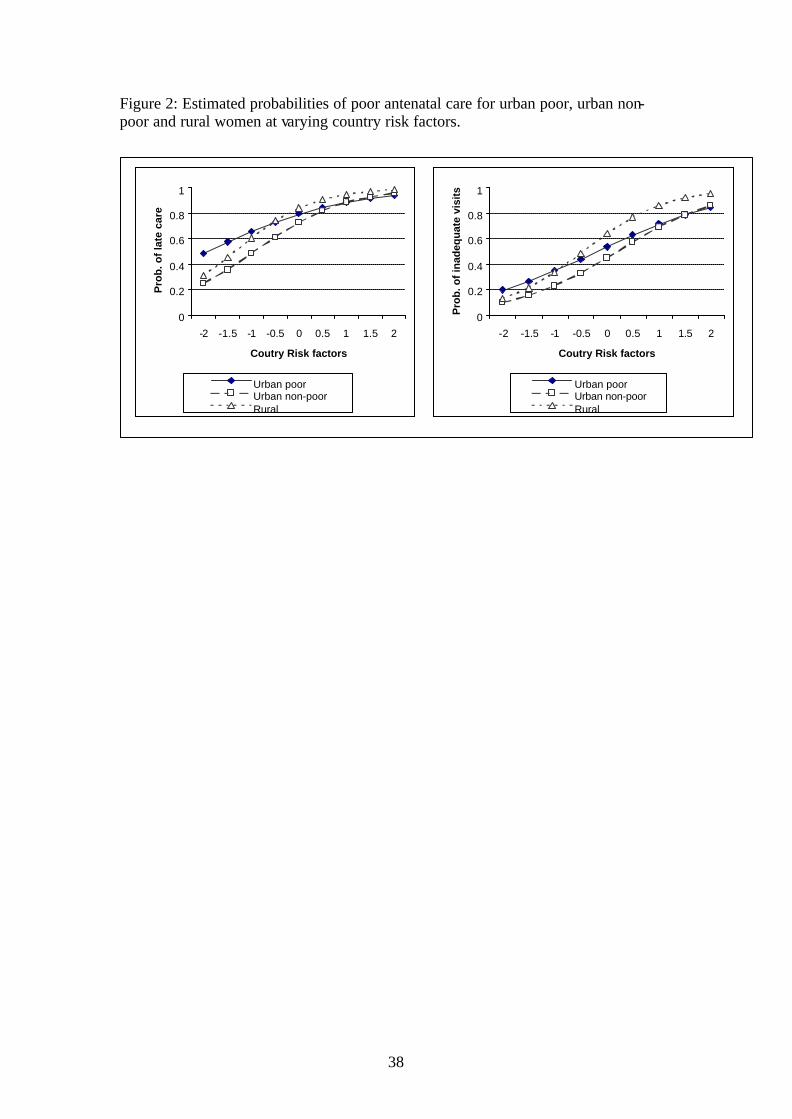
We further explore, in Figure 2, the implications of county risk factors on the
probability of poor antenatal care for urban poor, urban non-poor and rural women. The
results suggest that the urban inequalities in antenatal care are greatest for countries with
relatively low risks of poor antenatal care, and almost non-existent for countries with very
18
high probabilities of poor antenatal care. For countries with very low probabilities of poor
antenatal care, the urban poor are worse off, even in comparison to the rural residents.
[Figure 2 about here]
Delivery Care
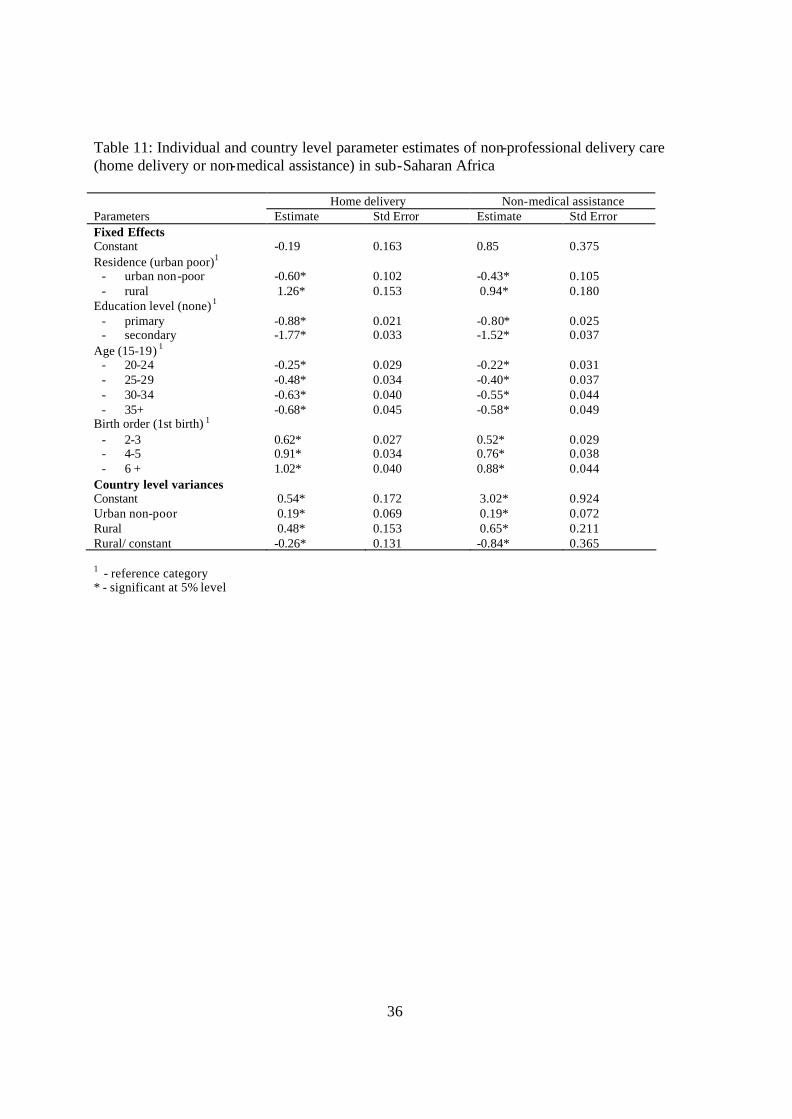
Table 11 gives the individual and country level parameter estimates of non-
professional delivery care in sub-Saharan Africa. In general, the probability of non-
professional delivery care declines with increasing maternal education and age, but increases
with increasing parity. On average, the urban poor are more likely to have non-professional
delivery care than the urban non-poor, but less likely compared to the rural residents. The
country level variances show that there is a significant variation in delivery care across
countries of sub-Saharan Africa, and that residential inequalities in delivery vary significantly
across countries.
[Table 11 about here]
The variation in delivery care for the urban poor, urban non-poor and the rural
residents in countries with different risk factors are presented in Figure 3. The urban
inequalities in delivery care are greater in countries with lower than average levels of non-
professional care, than those with above average levels, with the greatest inequality being
observed in countries about 0.5-1 standard deviation below the mean level of professional
care. On the other hand, the rural disadvantage is most pronounced for countries with average
levels of professional delivery care.
(Figure 3 about here)
DISCUSSIONS AND CONCLUSIONS
This paper has examined maternal health status in sub-Saharan Africa, differentiated by three
groups: the urban non-poor, the urban poor, and rural women. Along most indicators of
maternal health care there is a continuum from rural through urban poor to urban non-poor,
although the urban poor closely resemble rural women in many respects even after
controlling for personal characteristics such as educational attainment that typically confer
better health care to urban women.
19
The analysis of maternal health care suggests that poverty is possibly an impediment
to receiving adequate maternal health care among urban residents of sub-Saharan Africa. The
urban poor are more likely to initiate antenatal care late in pregnancy, make less frequent
visits during pregnancy, and receive non-professional delivery care, compared to the urban
non-poor. These results corroborate findings from previous studies which have demonstrated
a link between low socio-economic status and underutilization of maternal health services
(McKinlay and McKinlay 1972; Magadi 1999). Although there is an indication that the
urban poor are on average more likely to receive professional delivery care and make more
frequent visits than rural residents, there is no significant evidence that they initiate antenatal
care earlier, despite closer physical proximity to health services in urban areas.
It is important to point out that the observed general patterns of residential disparities
in maternal health observed in this paper are not uniform across countries of sub-Saharan
Africa. Country level analyses reveal significant variations in the urban maternal health
inequalities across countries. The urban poor disadvantage with respect to antenatal and
delivery care (relative to the urban non-poor) is more pronounced in countries with better
maternal health indicators. In fact, the urban poor tend to have worse indicators than even the
rural residents in countries with the best maternal health indicators. This suggests that insofar
as there have been improvements in maternal health care in some countries of sub-Saharan
Africa, the urban poor have least benefited from such improvements.
It is universally acknowledged that the urban poor represent a rapidly growing
segment of the developing world’s population, and that young adults are the fastest growing
segment of the urban poor. As in the United States, the concentration of poverty and young
adults in cities is inevitable because most of the developing world’s population will soon live
in urban areas. Continua tion of trends that impact negatively on the urban poor—macro-
economic reforms, shortages of affordable and safe housing, exclusion from municipal
governance, decline of national economies, AIDS affliction—may increase and intensify
urban poverty, and possibly widen inequality between the poor, a moderately sized middle
class, and a few affluent persons employed in government and foreign-controlled businesses.
Urbanization trends will certainly elevate the need for basic services in cities.
To date, health programs in Africa have focused their efforts in rural areas where
most population resides and where it is assumed that disease is most rampant and essential
health services are most lacking. This paper identifies a need to channel more reproductive
health services to the growing number of poor women in urban Africa, though neglect of
rural health problems is not warranted. Among the reproductive health priorities of the urban
20
poor is control of unplanned fertility, perhaps through satisfaction of their relatively high
unmet need for family planning.
As the urban poor grow in number, failure to address the inequality of reproductive
health care in urban Africa could lead to an urban health crisis for a major proportion of
women and children. A historical precedent for this—high mortality in cities of the U.S. and
Europe in the 19th century prior to the formation of a sizeable middle class population—
makes this a likely scenario for Africa. Regrettably, Africa’s current economic crisis and
political instability in parts of the region dampen the prospects for economic growth that is
sufficient to benefit the middle class and the poor.
Further research needs to identify whether the urban poor in Africa reside mainly in
small cities and towns—where the majority of urbanites live in most countries—or in the
growing slums and peri-urban areas of large cities. In Kenya, where a large majority of urban
dwellers live in the capital city Nairobi, it is estimated that between 55% and 70% of the
city’s residents live in slum settlements (Matrix Development Consultants 1993). This
pattern—of the urban poor comprising about one-half of the biggest city residents—may be
atypical of the region. Moreover, reproductive health care in poor areas of big and small
urban settlements needs to be compared. This information is vital for the targeting of
reproductive health programs during a period of low resources for and expenditures on health
services in the region. Unfortunately, the urban sample sizes of DHS surveys conducted in
Africa are too small to disaggregate the urban population beyond what is done in this paper
while providing reliable estimation. Field research in large and small urban areas of Africa is
necessary to address the reproductive health care needs of particular segments of the urban
poor.
Acknowledgement

21
This work was partially made possible through the Rockefeller core support grant (Grant#RF 99009#199) to the African Population and Health Research Center (APHRC), and through the Department for International Development (DfID) fund to the Opportunities and Choices Reproductive Health Programme, University of Southampton, UK.

22
NOTES
23
REFERENCES
Anandalakshmy P. N, P. P. Taller, K. Buckshee and V. Hingorani. 1993 “Demographic, socio -economic and medical factors affecting maternal mortality - an Indian experience” The Journal of Family Welfare, 39:1-4
African Population and Health Research Center (APHRC). 2002. Population and Health Dynamics in Nairobi’s Informal Settlements. Nairobi (Kenya): African Population and Health Research Center.
Atkinson, Sarah, Jacob Songsore and Edmundo Werna (eds.). 1996. Urban Health Research in Developing countries: Implications for Policy. New York: Oxford University Press.
Ayad, Mohamed, Bernard Barrère and James Otto. 1997. Demographic and Socioeconomic Characteristics of Households. Demographic and Health Surveys Comparative Studies No. 26. Calverton, Maryland: Macro International Inc.
Biddulph J. 1993. "Priorities and practice in tropical pediatrics," Journal of Paediatrics and Child Health. 29(1):12-15
Brockerhoff M. and A. E. Biddlecom. 1999. “Migration, sexual behavior and the risk of HIV in Kenya”, International Migration Review. 33(4):833-856.
Brockerhoff, M. and Ellen Brennan. 1998. "The poverty of cities in developing countries", Population and Development Review 24 (1): 75-114.
Bradley David, Carolyn Stephens, Trudy Harpham, and Sandy Cairncross. 1992. “A Review of Environmental Health Impacts in Developing Countries.” Urban Management Programme Discussion Paper 6. Washington: Then World Bank.
Cairncross, Sandy, Jorge E. Hardoy, and David Satterthwaite, eds. 1990. The Poor Die Young: Housing and Health in Third World Cities. London: Earthscan Publications.
Carael M. and S. Allen. 1995. "Women's vulnerability to HIV/STD in Sub-Saharan Africa: an increasing evidence," in Palina Makinwa and An-Magritt Jensen (eds.), Women's position and demographic change in Sub-Saharan Africa, Liege - Belgium: International Union for the Scientific Study of Population (IUSSP), pp. 201-222.
Central Bureau of Statistics. 2000. Welfare Monitoring Survey III: Government Priorities. Nairobi: Ministry of Planning and National Development.
Dixon-Mueller, R. (1989). “Psychological consequences to women of contraceptive use and controlled fertility” in A. M. Parnell (Ed) Contraceptive Use and Controlled Fertility: health Issues for Women and Children. Committee on Population, National Research Council, Washington DC, National Academy Press, pp 140-160.
Fawcus, S., M. Mbizvo, G. Lindmark, and L. Nystrom (1996) “A community-based investigation of avoidable factors for maternal mortality in Zimbabwe” Studies in Family Planning 27:319-327
Institute of Education (2000) A User’s Guide to MlwiN Multilevel Models project, University of London
24
Harpham, T., T. Lusty and P. Vaughan. 1988. In the Shadow of the City: Community Health and the Urban Poor. Oxford: Oxford University Press.
Hardoy, Jorge, and David Satterthwaite. 1989. Squatter Citizen: Life in the Urban Third World. London: Earthscan Publications.
Joyce, T.J. and M. Grossman. 1987. “Pregnancy Wantedness and Initiation of Antenatal Care Demoraphy 27:1-17
Kwast, B. E. 1989. "Maternal mortality: levels, causes and promising interventions. Journal of Biosocial Science. Supplement. 10:(51-67)
Magadi, M. A (1999). “The Determinants of Poor Maternal Health Care and Adverse Pregnancy Outcomes in Kenya” PhD Thesis, University of Southampton, U.K.
Magadi, M. A., N. J. Madise and R. N. Rodrigues. 2000. “Frequenc y and Timing of Antenatal Care in Kenya: explaining the variations between women of different communities” Social Science and Medicine 51:551-561.
Magadi, M. A., I. Diamond and N. J. Madise. 2001. “Analysis of Factors Associated with Maternal Mortality in Kenyan Hospitals” Journal of Biosocial Science 33 (3):375-389
Magadi, M. A., I. Diamond and R. N. Rodrigues. 2001. “The Determinants of Delivery care in Kenya” Social Biology 47 (3-4):164-188 (in press)
Mamdani, M., P. Garner, T. Harpham and O. Campbell. 1993. “Fertility and Contraceptive Use in Poor Urban Areas of Developing Countries,” Health Policy and Planning, 8(1): 1-18.
Matrix Development Consultants. 1993. "Nairobi's informal settlements: An inventory". A Report Prepared for USAID/REDSO/ ESA. Nairobi: USAID.Mensch, Barbara, Judith Bruce and Margaret E. Greene . 1998. The Unchartered Passage: Girls’ Adolescence in the Developing World. New York: The Population Council.
McKinlay J.B. and S.M. McKinlay. 1972. “Some social characteristics of lower working class utilizers and underutilizers of maternity care services. Journal of Health and Social Behaviour 13: 369-382
Mensch, B. S., Judith Bruce and Margaret E. Greene. 1998. The Uncharted Passage: Girls' Adolescence in the Developing World. New York: Population Council.
Montgomery, Mark R., Michele Gragnolati, Kathleen Burke and Edmundo Paredes. 2000. “Measuring Living Standards with Proxy Variables.” Demography 37(2): 1556-1574.
Mulgaonkar V. B., I. G. Parikh, V. R. Taskar, N. D. Dharap, and V. P. Pradhan. 1994. "Perceptions of Bombay slum women regarding refusal to participate in a gynaecological health programme," in Joel Gittelsohn, M. E. Bentley, P. J. Pelto, M. Nag, S. Pachauri, A. D. Harrison, L. T. Landman (eds.). Listening to women talk about their health issues and evidence from India, New Delhi: Har-Anand Publications. Pp. 154-167
Omorodion, F. I. 1999. "Sexual networking among market women in Benin City, Bendel State Nigeria," in John C. Caldwell and James P. M. Ntodzi (eds.), The continuing HIV/AIDS epidemic in Africa, Canberra: Health Transition Centre, Australian National University, pp. 9-18
25
Perlman, Janice. 1986. “Six Misconceptions about squatter settlements.” Development: Seeds of Change, 4: 40-44.Pick William and Dianne Cooper. 1997. "Urbanization and Women's health in South Africa". Africa Journal of Reproductive Health 1(1):45-55
Preston, Samuel H. and Michael R. Haines. 1991. Fatal Years: Child Mortality in Late Nineteenth Century America. Princeton, NJ: University Press.
Rooney C. 1992. “Antenatal Care and Maternal Health: How Effective Is It? A Review of the Evidence” World Health Organization Document No. WHO/MSM/92.4
Sarin, A. R. 1997. "Underutilization of Maternal health services", World Health Forum. 18(1):67-68
Timaeus, Ian and Louisiana Lush. 1995. “Intra-Urban Differentials in Child Health,” Health Transition Review 5(2): 163-190.
Tsui, A. O., Wasserheit, J. N., and Haaga, J. G. (Eds). 1997. Reproductive Health in Developing Countries: Expanding Dimensions, Bu ilding Solutions. National Research Council, Washington DC, National Academy Press.
Ulin, P. R. 1992. "African Women and AIDS: negotiating behavioral change," Social Science and Medicine 34(1): 63-73.
United Nations. 2000. World Urbanization Prospects: The 1999 Revision. New York: The United Nations.
United Nations Population Fund. 1996. The State of the World Population 1996. Changing Places: Population, Development and the Urban Poor. New York: United Nations..
Westoff, C. F., and Bankole, A. 1995. Unmet Need: 1990 – 1994. DHS Comparative Studies No. 16, Calverton, Md. : Macro International, Inc.
World Bank. 1990. World Development Report 1990: Poverty. New York: Oxford University Press for the World Bank.
Zulu, E. M., F. Nii-Amoo Dodoo, and A. C. Ezeh. 2002. “Sexual risk-taking in the slums of Nairobi, Kenya, 1993-98”, Population Studies 56 (in press)
Zulu, E. M.; A. C. Ezeh, A. C. and F. Nii-Amoo Dodoo. Forthcoming. "Urbanization, Poverty and Sex: Roots of Risky Sexual Behaviors in Slum Settlements in Nairobi, Kenya." In E. Kalipeni; J. Oppong, S. Craddock and J. Ghosh, (eds.) HIV/AIDS in Africa: Mapping the Issues. Malden, MA: Blackwell Publishers (in Press).
26
Table 1: Distribution of urban population by level of deprivation, Sub-Saharan Africa
Country %Poor N (Urban) Benin (1996) 36.4 1819 Burkina Faso (1998) 18.9 1651 Cameroon (1998) 13.5 2709 C.A.R. (1994/95) 50.1 2474 Comoros (1996) 8.5 903 Cote d’Ivoire (1994) 9.3 3852 Ghana (1998/99) 5.2 1585 Kenya (1998) 13.6 1466 Madagascar (1997) 33.3 2376 Malawi (1992) 18.2 1316 Mali (1995/96) 43.8 3509 Mozambique (1997) 22.8 2514 Namibia (1992) 7.8 1891 Niger (1998) 25.5 2363 Nigeria (1990) 11.2 3530 Rwanda (1992) 27.3 1158 Senegal (1997) 7.8 3055 Tanzania (1996) 18.5 2088 Tchad (1996/97) 71.9 3013 Togo (1998) 16.3 3034 Uganda (1995) 34.8 2439 Zambia (1996) 15.6 3001 Zimbabwe (1994) 8.9 1745
Median 18.2 2376
27
Table 2: Fertility, Unplanned Fertility and Unmet Need for Family Planning
Births in 3 Years Preceding Survey Total fertility Rates Proportion of births that are mistimed Proportion of births that are unwanted
Country, Survey Year
Urban Poor Other Urban Rural Urban Poor Other Urban Rural Urban Poor Other Urban Rural Benin, 1996 6.10 4.18 6.67 23.35 25.66 19.72 5.84 9.86 6.51 Burkina Faso, 1998 5.04 3.71 6.90 19.76 23.23 28.45 26.35 22.57 12.50 C.A.R., 1994 5.05 4.51 5.23 15.46 16.03 7.09 1.21 1.72 0.79 Cameroon, 1998 5.73 3.58 5.38 27.55 21.57 19.58 5.10 7.43 6.53 Comoros, 1996 4.60 3.65 5.02 19.43 17.86 25.82 26.86 29.55 25.38 Cote d’Ivoire, 1994 6.17 4.17 5.99 17.97 27.16 10.91 7.47 11.94 3.90 Ghana, 1998 4.06 2.81 5.26 18.33 24.26 16.97 2.40 6.71 2.73 Kenya, 1998 4.39 2.93 5.16 46.46 37.68 38.66 8.08 6.16 11.56 Madagascar, 1997 5.98 3.29 6.66 29.13 22.71 19.73 5.51 3.67 3.13 Malawi, 1992 - - - 21.28 29.55 37.14 6.38 8.30 8.97 Mali, 1995/96 6.12 4.85 7.30 24.03 30.63 16.37 3.22 3.63 4.08 Mozambique, 1999 5.71 4.23 5.33 27.50 21.95 29.62 11.25 7.59 8.66 Namibia, 1992 6.55 3.85 6.30 11.98 29.33 18.92 4.46 8.17 5.10 Niger, 1997/98 5.47 5.71 7.61 36.99 32.79 29.55 4.79 11.50 4.83 Nigeria, 1990 5.91 4.91 6.33 10.66 12.19 9.90 4.06 3.45 2.49 Rwanda, 1992 5.31 4.17 6.33 25.81 25.04 21.97 11.83 19.46 9.26 Senegal, 1997 6.03 4.13 6.74 38.46 43.21 42.28 11.54 13.17 14.86 Tanzania, 1996 5.00 3.87 6.34 21.53 21.33 9.06 2.43 1.92 0.72 Tchad, 1998 5.84 5.91 6.52 26.89 34.38 21.01 8.52 10.46 8.18 Togo, 1998 3.78 3.12 6.32 15.29 21.17 17.72 10.00 12.61 10.18 Uganda, 1995 5.88 4.50 7.17 14.11 9.39 14.69 11.20 11.33 11.48 Zambia, 1996/97 5.92 4.98 6.86 36.07 37.74 27.21 7.76 9.70 5.52 Zimbabwe, 1994 3.53 3.04 4.85 34.85 27.40 30.75 5.05 9.18 5.87 Median 5.72 4.15 6.33 23.35 25.04 19.73 6.38 8.30 6.53 NOTES: Urban Poor defined as women ages 15-49 whose dwellings lack electricity and who do not use safe drinking water and flush toilets (see text). Individual sample weights are applied in countries where urban areas were over-or under-sampled. “Visitors” to urban areas exc luded.
28
Table 3: Timing and frequency of antenatal Care
(Births in last 3, 4, 5 Years) Timing of Antenatal Care (Started in First
Trimester) Frequency of Antenatal Care (Four or More
Visits)
Country, Survey Year
Urban Poor Other Urban Rural Urban Poor Other Urban Rural Benin, 1996 22.94 47.78 24.42 50.28 74.21 49.31 Burkina Faso, 1998 46.09 54.74 30.84 32.23 33.57 22.03 Cameroon, 1998 33.33 51.93 37.17 47.96 74.89 48.37 C.A.R., 1994 30.20 38.38 30.46 48.54 59.89 30.07 Cote d’Ivoire, 1994 22.59 32.66 22.10 30.37 41.69 22.57 Comoros, 1996 45.83 50.68 37.60 84.00 62.13 50.59 Ghana, 1998 32.88 51.56 40.39 67.53 83.19 57.00 Kenya, 1998 7.45 20.63 13.02 63.92 67.31 60.66 Madagascar, 1997 25.94 51.67 19.39 46.30 79.39 37.48 Malawi, 1992 6.21 10.79 9.28 70.12 72.40 62.11 Mali, 1995/96 40.28 56.54 32.73 40.88 56.37 17.60 Mozambique, 1999 21.59 27.26 22.72 49.66 75.67 37.38 Namibia, 1992 35.80 32.56 27.83 50.00 69.86 54.40 Niger, 1997/98 39.34 47.97 27.96 27.37 36.88 7.31 Nigeria, 1990 25.00 21.66 22.32 70.92 83.72 40.09 Rwanda, 1992 6.29 13.71 3.22 13.71 24.10 11.40 Senegal, 1997 44.74 64.89 48.53 14.81 27.08 13.11 Tanzania, 1996 10.59 13.12 11.10 70.73 82.29 70.70 Tchad, 1998 49.75 57.00 34.32 33.23 45.56 9.25 Togo, 1998 19.25 31.44 14.92 59.28 66.08 42.26 Uganda, 1995 17.67 13.84 14.81 63.78 71.98 44.18 Zambia, 1996/97 8.45 9.60 12.47 75.09 82.65 66.09 Zimbabwe, 1994 25.00 29.27 25.70 82.61 82.11 73.40 Median 25.00 32.66 22.72 50.00 69.86 44.18
29
Table 4: Prenatal care: Tetatus Immunization
Tetanus Injections (2 or more for First Births) Country, Survey Year Urban Poor Other Urban Rural
Benin, 1996 53.42 67.35 58.04 Burkina Faso, 1998 56.67 58.16 28.42 Cameroon, 1998 54.17 60.75 52.01 C.A.R., 1994 52.76 62.33 45.35 Cote d’Ivoire, 1994 59.65 66.02 55.30 Comoros, 1996 40.00 39.62 41.26 Ghana, 1998 64.29 57.14 52.99 Kenya, 1998 60.87 63.41 61.00 Madagascar, 1997 41.73 52.94 40.20 Malawi, 1992 79.31 81.36 78.52 Mali, 1995/96 49.31 51.28 25.27 Mozambique, 1999 29.38 52.17 23.27 Namibia, 1992 37.50 38.94 34.12 Niger, 1997/98 44.64 57.45 16.82 Nigeria, 1990 58.54 64.83 31.05 Rwanda, 1992 77.78 68.18 66.92 Senegal, 1997 100.00* 50.00 42.86 Tanzania, 1996 100.00* 66.67 50.00 Tchad, 1998 37.50 100.00* 31.58 Togo, 1998 --- --- --- Uganda, 1995 --- 50.00 40.00 Zambia, 1996/97 --- 25.00 53.85 Zimbabwe, 1994 33.33 25.71 36.67 Median 53.80 57.81 42.06 *All observations fall within two or more tetanus injections for first births. ---There are no observations for two or more tetanus injections for first births.
30
Table 5: Delivery Care: Place of delivery and professional care at delivery
(Births in last 3, 4, 5 Years) Delivered at Health Facility Received Professional Assistance
Country, Survey Year
Urban Poor Other Urban Rural Urban Poor Other Urban Rural Benin, 1996 63.13 93.03 54.90 45.40 54.81 34.31 Burkina Faso, 1998 83.46 94.70 26.97 74.02 83.41 19.76 Cameroon, 1998 69.70 86.59 44.44 61.62 79.71 42.15 C.A.R., 1994 74.56 82.38 28.56 43.42 63.21 13.12 Cote d’Ivoire, 1994 57.41 77.27 28.98 2.58 1.96 1.38 Comoros, 1996 73.08 68.72 34.67 25.93 43.62 28.38 Ghana, 1998 60.76 78.96 30.60 37.50 43.32 12.96 Kenya, 1998 43.43 70.85 34.86 47.47 73.22 36.51 Madagascar, 1997 34.85 53.07 31.69 4.46 10.39 11.95 Malawi, 1992 72.46 90.76 54.18 73.17 93.54 65.42 Mali, 1995/96 60.54 64.48 18.66 55.66 59.26 19.97 Mozambique, 1999 53.49 84.50 34.44 48.42 80.08 29.81 Namibia, 1992 73.12 88.27 58.10 72.04 84.21 58.70 Niger, 1997/98 63.54 73.06 8.51 0.00 0.23 0.14 Nigeria, 1990 46.28 71.77 23.56 40.61 61.54 20.52 Rwanda, 1992 56.65 73.38 24.15 60.12 75.09 28.12 Senegal, 1997 67.43 78.21 33.58 58.45 76.59 28.20 Tanzania, 1996 72.19 80.40 40.27 69.23 78.23 36.83 Tchad, 1998 30.43 44.85 4.35 31.43 43.32 5.15 Togo, 1998 81.12 84.46 37.30 45.23 56.81 12.10 Uganda, 1995 65.74 80.66 30.68 59.84 76.53 28.74 Zambia, 1996/97 54.11 79.49 26.42 54.45 79.52 25.95 Zimbabwe, 1994 72.34 93.33 61.18 70.21 92.93 60.40 Median 63.54 79.49 31.69 48.42 63.21 28.12
31
Table 6: Unplanned Fertility: Odds Ratios for the Rural Residents and Urban Non-Poor Versus Urban Poor
Mistimed (wanted later) Unwanted (no more) Total Unplanned (mistimed or unwanted)
Country (Year)
Rural Residents
Urban Non-Poor
Rural Residents
Urban Non-Poor
Rural Residents
Urban Non-Poor
Benin (1996) 1.15 1.46 0.78 1.64 1.04 1.57* Burkina Faso (1998) 0.84 0.68 0.30* 0.33* 0.72 0.61* Cameroon (1998) 0.59* 0.54* 1.47 1.97 0.69 0.68 C.A.R. (1994/95) 0.73* 1.35 0.81 1.32 0.73* 1.41* Comoros (1996) 1.00 1.04 1.69 1.65 1.23 1.26 Cote d’Ivoire (1994) 0.74 0.95 0.81 1.58 0.82 1.10 Ghana (1998/99) 1.19 0.69 0.58 0.58 0.97 0.60 Kenya (1998) 0.67 0.69 0.94 1.32 0.64* 0.74 Madagascar (1997) 0.99 0.74 1.15 0.99 1.08 0.81 Malawi (1992) 1.37 1.06 0.37** 0.90 0.72* 0.94 Mali (1995/96) 0.87 1.12 1.03 1.48 0.89 1.17 Mozambique (1997) 0.74* 1.20 0.87 2.55** 0.73** 1.43** Namibia (1992) 0.62 0.77 0.98 0.83 0.66 0.73 Niger (1998) 0.46** 0.97 0.38 0.72 0.44** 0.93 Nigeria (1990) 0.94 1.24 0.80 1.30 0.89 1.26 Rwanda (1992) 1.30 0.87 0.85 1.34 1.07 1.16 Senegal (1997) 0.73* 0.99 0.66 1.10 0.71* 1.05 Tanzania (1996) 0.87 1.12 0.94 1.51 0.88 1.33 Tchad (1996/97) 0.66** 0.97 0.75 1.48 0.65** 1.00 Togo (1998) 0.83 0.54** 0.85 1.76 0.81 0.64* Uganda (1995) 0.87 1.25 0.75 1.18 0.81* 1.27* Zambia (1996) 0.73* 0.74* 0.86 2.56** 0.72* 0.98 Zimbabwe (1994) 1.94 1.54 0.75 1.33 1.68 1.58
*-p<0.05, **-p<0.01
32
Table 7: Inadequate Antenatal Care: Odds Ratios for Rural Residents and Urban Non-Poor versus Urban Poor
Late Initiation (not 1st trimester) Inadequate Visits (less than 4 visits) Country (Year) Rural Residents Urban Non-Poor Rural Residents Urban Non-poor
Benin (1996) 0.93 0.50** 1.21 0.78 Burkina Faso (1998) 1.22 0.89 1.45 1.24 Cameroon (1998) 0.85 0.60 1.25 0.50** C.A.R. (1994/95) 0.86 0.88 1.95** 0.70* Comoros (1996) 1.38 0.85 5.45** 2.57 Cote d’Ivoire (1994) 0.99 0.66* 1.58** 0.78 Ghana (1998/99) 0.75 0.53* 1.83* 0.57 Kenya (1998) 0.48 0.35* 1.12 1.12 Madagascar (1997) 1.42** 0.44** 1.27* 0.35** Malawi (1992) 0.61 0.57 1.35 0.99 Mali (1995/96) 0.99 0.65** 2.81** 0.50** Mozambique (1997) 1.03 0.97 1.75** 0.49** Namibia (1992) 1.36 1.27 1.06 0.57* Niger (1998) 1.37 0.77 3.98** 0.73* Nigeria (1990) 1.23 1.25 3.28** 0.66* Rwanda (1992) 1.17 0.54 1.05 0.52* Senegal (1997) 0.81 0.52** 0.79 0.45** Tanzania (1996) 0.92 1.12 0.93 0.82 Tchad (1996/97) 1.43** 0.87 3.63** 0.69** Togo (1998) 0.98 0.66 1.44* 0.95 Uganda (1995) 1.08 1.31 1.69** 0.83 Zambia (1996) 0.63* 1.04 1.43* 0.76 Zimbabwe (1994) 0.92 0.86 1.44 0.91
*-p<0.05, **-p<0.01

33
Table 8: Professional Delivery Care: Odds Ratios for Rural Residents and Urban Non-Poor versus Urban Poor
Professional (medical) Attendant Health Facility Deliveries Country (Year)
Rural Residents Urban Non-Poor Rural Residents Urban Non-Poor Benin (1996) 0.50** 0.72 0.46** 2.38** Burkina Faso (1998) 0.11** 1.53 0.12** 2.56** Cameroon (1998) 0.20** 0.86 0.18** 1.35 C.A.R. (1994/95) 0.24** 1.44* 0.16** 1.19 Comoros (1996) 0.97 2.05 0.15** 0.79 Cote d’Ivoire (1994) 0.60 0.56 0.33** 2.19** Ghana (1998/99) 0.27** 0.75 0.25** 1.48 Kenya (1998) 0.51** 2.32** 0.56* 2.39** Madagascar (1997) 4.29** 1.50 1.14 1.15 Malawi (1992) 0.78 4.44** 0.45** 2.79** Mali (1995/96) 0.17** 1.30* 0.11** 2.14** Mozambique (1997) 0.48** 2.25** 0.48** 2.69** Namibia (1992) 0.45** 1.36 0.42** 1.63 Niger (1998) -- -- 0.05** 1.30 Nigeria (1990) 0.49** 1.82** 0.47** 2.41** Rwanda (1992) 0.42** 1.73* 0.40** 1.84** Senegal (1997) 0.30** 1.56** 0.30** 1.20 Tanzania (1996) 0.30** 1.31 0.29** 1.26 Tchad (1996/97) 0.14** 1.67** 0.14** 1.85** Togo (1998) 0.17** 0.99 0.20** 0.78 Uganda (1995) 0.34** 1.53** 0.28** 1.42* Zambia (1996) 0.32** 2.06** 0.33** 2.13** Zimbabwe (1994) 1.36 6.23** 1.23 5.49**
, *-p<0.05, **-p<0.01
34
Table 9: Individual and country level parameter estimates of mistimed, unwanted and overall unplanned fertility in sub-Saharan Africa
Mistimed fertility Unwanted fertility Unplanned fertility Parameters Estimate Std Error Estimate Std Error Estimate Std Error Fixed Effects Constant -1.42 0.120 -3.68 0.201 -1.19 0.122 Residence (urban poor)1
- urban non-poor - rural
0.01 -0.15
0.077 0.086
0.40* -0.17*
0.104 0.060
0.13 -0.17*
0.078 0.082
Education level (none) 1 - primary - secondary
0.44* 0.71*
0.023 0.031
0.42* 0.47*
0.037 0.054
0.49* 0.73*
0.021 0.030
Age (15-19) 1 - 20-24 - 25-29 - 30-34 - 35+
-0.44* -0.78* -1.10* -1.48*
0.029 0.036 0.043 0.049
-0.35* -0.40* -0.06 0.70*
0.068 0.078 0.083 0.085
-0.50* -0.85* -1.03* -0.85*
0.028 0.034 0.040 0.043
Birth order (1st birth) 1 - 2-3 - 4-5 - 6 +
0.50* 0.85* 1.12*
0.029 0.037 0.043
-0.05 0.59* 1.54*
0.064 0.075 0.080
0.46* 0.92* 1.51*
0.027 0.035 0.040
Country level variances Constant Urban non-poor Rural
0.27* 0.09* 0.13*
0.091 0.038 0.049
0.75* 0.14* 0.00
0.229 0.052 0.000
0.29* 0.10* 0.12*
0.095 0.039 0.045
1 - reference category * - significant at 5% level
35
Table 10: Individual and country level parameter estimates of inadequate antenatal care (late initiation or too few visits) in sub-Saharan Africa
No visit in1st trimester Less than four visits Parameters Estimate Std Error Estimate Std Error Fixed Effects Constant 1.59 0.157 0.58 0.170 Residence (urban poor)1
- urban non-poor - rural
-0.36* 0.31*
0.087 0.121
-0.35* 0.43*
0.064 0.108
Education level (none) 1 - primary - secondary
-0.40* -0.82*
0.025 0.032
-0.58* -1.13*
0.020 0.030
Age (15-19) 1 - 20-24 - 25-29 - 30-34 - 35+
-0.22* -0.37* -0.50* -0.48*
0.031 0.037 0.044 0.050
-0.21* -0.36* -0.45* -0.38*
0.028 0.033 0.039 0.043
Birth order (1st birth) 1 - 2-3 - 4-5 - 6 +
0.17* 0.45* 0.62*
0.029 0.037 0.044
0.13* 0.25* 0.36*
0.026 0.033 0.038
Country level variances Constant Urban non-poor Rural
0.49* 0.12* 0.28*
0.159 0.049 0.097
0.60* 0.06* 0.22*
0.189 0.026 0.077
1 - reference category * - significant at 5% level
36
Table 11: Individual and country level parameter estimates of non-professional delivery care (home delivery or non-medical assistance) in sub-Saharan Africa
Home delivery Non-medical assistance Parameters Estimate Std Error Estimate Std Error Fixed Effects Constant -0.19 0.163 0.85 0.375 Residence (urban poor)1
- urban non-poor - rural
-0.60* 1.26*
0.102 0.153
-0.43* 0.94*
0.105 0.180
Education level (none) 1 - primary - secondary
-0.88* -1.77*
0.021 0.033
-0.80* -1.52*
0.025 0.037
Age (15-19) 1 - 20-24 - 25-29 - 30-34 - 35+
-0.25* -0.48* -0.63* -0.68*
0.029 0.034 0.040 0.045
-0.22* -0.40* -0.55* -0.58*
0.031 0.037 0.044 0.049
Birth order (1st birth) 1 - 2-3 - 4-5 - 6 +
0.62* 0.91* 1.02*
0.027 0.034 0.040
0.52* 0.76* 0.88*
0.029 0.038 0.044
Country level variances Constant Urban non-poor Rural Rural/ constant
0.54* 0.19* 0.48* -0.26*
0.172 0.069 0.153 0.131
3.02* 0.19* 0.65* -0.84*
0.924 0.072 0.211 0.365
1 - reference category * - significant at 5% level
37
Figure 1: Estimated probabilities of unplanned fertility for urban poor, urban non-poor and rural women at varying country risk factors.
0
0.2
0.4
0.6
0.8
1
-2 -1.5 -1 -0.5 0 0.5 1 1.5 2
Coutry Risk factors
Pro
b. o
f m
isti
med
fer
tilit
y
0
0.2
0.4
0.6
0.8
1
-2 -1.5 -1 -0.5 0 0.5 1 1.5 2
Coutry Risk factors
Pro
b. o
f u
nw
ante
d f
erti
lity
0
0.2
0.4
0.6
0.8
1
-2 -1.5 -1 -0.5 0 0.5 1 1.5 2
Coutry Risk factors
Pro
b. o
f u
np
lan
ned
fer
tilit
y
Urban poorUrban non-poorRural
38
Figure 2: Estimated probabilities of poor antenatal care for urban poor, urban non-poor and rural women at varying country risk factors.
0
0.2
0.4
0.6
0.8
1
-2 -1.5 -1 -0.5 0 0.5 1 1.5 2
Coutry Risk factors
Pro
b. o
f la
te c
are
Urban poorUrban non-poorRural
0
0.2
0.4
0.6
0.8
1
-2 -1.5 -1 -0.5 0 0.5 1 1.5 2
Coutry Risk factors
Pro
b. o
f in
adeq
uat
e vi
sits
Urban poorUrban non-poorRural
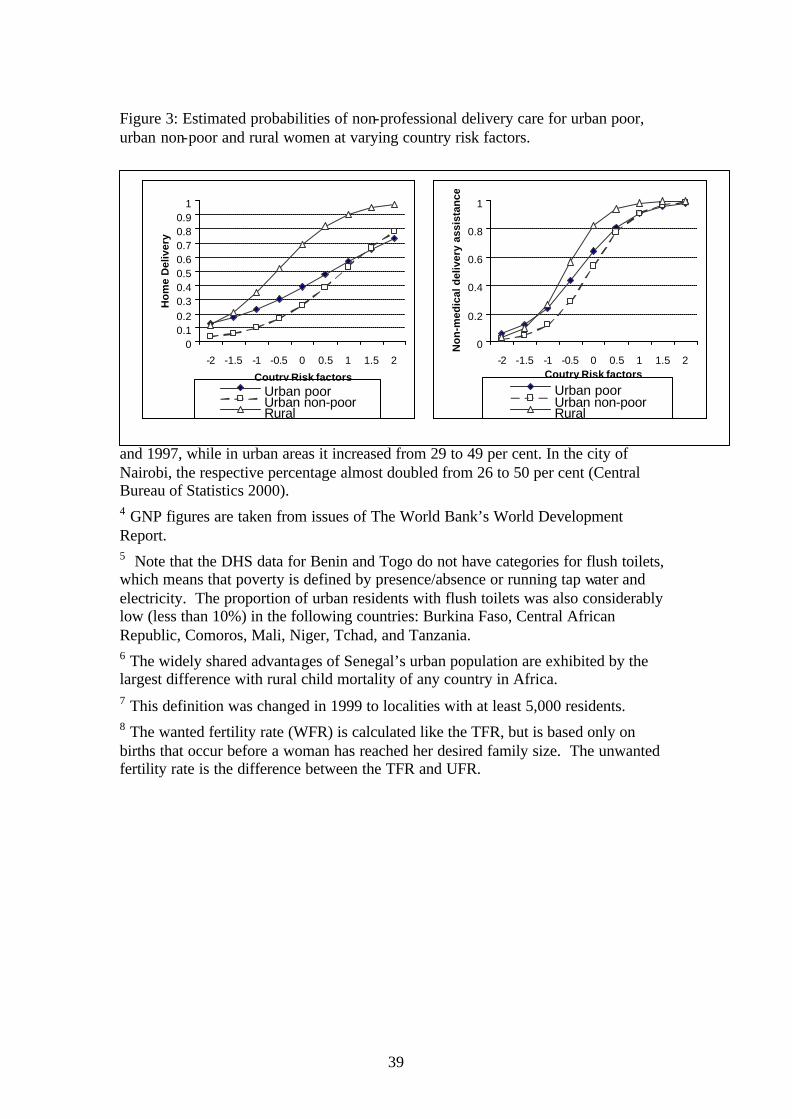
39
Figure 3: Estimated probabilities of non-professional delivery care for urban poor, urban non-poor and rural women at varying country risk factors. 1 This means that while the urbanization level of the developing world was 41 percent in 2000, the urbanization level of its population of reproductive age was higher. Moreover, this pattern would result in a majority of the reproductive age population living in urban areas before the developing world becomes half urbanized by around 2015. 2 Among the goals of structural reform programs in Africa are foreign debt repayment, which necessitates reduction of public expenditures on services and on government jobs that are disproportionately concentrated in cities; and raising the productivity of agriculture, which results in part from increased food prices in cities. 3 The proportion of people who cannot afford the minimum food and non-food basic requirements increased from 48 to 53 per cent in rural areas in Kenya between 1992 and 1997, while in urban areas it increased from 29 to 49 per cent. In the city of Nairobi, the respective percentage almost doubled from 26 to 50 per cent (Central Bureau of Statistics 2000). 4 GNP figures are taken from issues of The World Bank’s World Development Report. 5 Note that the DHS data for Benin and Togo do not have categories for flush toilets, which means that poverty is defined by presence/absence or running tap water and electricity. The proportion of urban residents with flush toilets was also considerably low (less than 10%) in the following countries: Burkina Faso, Central African Republic, Comoros, Mali, Niger, Tchad, and Tanzania. 6 The widely shared advantages of Senegal’s urban population are exhibited by the largest difference with rural child mortality of any country in Africa. 7 This definition was changed in 1999 to localities with at least 5,000 residents. 8 The wanted fertility rate (WFR) is calculated like the TFR, but is based only on births that occur before a woman has reached her desired family size. The unwanted fertility rate is the difference between the TFR and UFR.
00.10.20.30.40.50.60.70.80.9
1
-2 -1.5 -1 -0.5 0 0.5 1 1.5 2
Coutry Risk factors
Ho
me
Del
iver
y
Urban poorUrban non-poorRural
0
0.2
0.4
0.6
0.8
1
-2 -1.5 -1 -0.5 0 0.5 1 1.5 2Coutry Risk factors
No
n-m
edic
al d
eliv
ery
assi
stan
ce
Urban poorUrban non-poorRural