Embed Size (px)
Citation preview
Economics
The Future Business Environment of the Sunshine Coast
June 2014 Update
Prepared by: Central 1 Credit Union, Economics
The Future Business Environment of the Sunshine Coast 2
Central 1 Credit Union - Economics
Table of Contents
Summary 6
Report Objective 7
Report Outline 7
Location and Features 7
Data Sources 7
Regional Economy 8
SCRD Historical Economic Performance 8
Economic Structure and Base 9
Private Businesses in the SCRD 11
Recent Labour Market Trends - Employment Insurance Claims 12
Economic Outlook 13
Macro-economic Setting 13
SCRD Industry Analysis and Economic Outlook 14
Industry Analysis 14
Forestry 14
Pulp and Paper 15
Fishing and Aquaculture 16
Agriculture 17
Mining 17
Tourism 18
Construction 19
Real Estate, Rental, and Leasing 20
Finance and Insurance 20
Professional, Scientifi c, and Technical Services 20
Administrative, Support, and Waste Management Services 20
Transportation and warehousing 20
Retail Trade 21
The Future Business Environment of the Sunshine Coast 3
Central 1 Credit Union - Economics
Contents (continued)
Wholesale Trade 21
Utilities 21
Health and Social Services 22
Education Services 22
Public Administration 22
High Technology 22
Economic Outlook – Sunshine Coast RD 23
Population and Demographics 23
Population 23
Post Census Estimates 23
Demographic Profi le 24
BC Stats Population Projection 25
Central 1 Population Forecast 26
Housing Market Analysis and Outlook 27
Housing Market Trends 27
Housing Forecast 27
Appendix A: Location Quotients and Shift-Share Techniques 29
Appendix B: Analysis of the SCRD Housing Stock - 2010 32
Housing Stock Growth 32
External Ownership 32
Appendix C: Additional Tables 34
Appendix D: Additional Charts 37
List of Tables:
Table 1 - Income Dependency Changes SCRD 1991 to 2006 10
Table 2: Employed by Place of Work Status, Sunshine Coast RD, 1991 – 2011 10
Table 3: Long-Term Economic Forecasts - GDP % change over previous year 13
Table 4: Interest Rate and Exchange Rate Long-Term Forecasts 14
Table 5: B.C. Long-Term Economic Forecasts 14
Table 6: Room Revenue - SCRD 18
The Future Business Environment of the Sunshine Coast 4
Central 1 Credit Union - Economics
Contents (continued)
Table 7: Long-Term Economic Forecast - Sunshine Coast Regional District 23
Table 8: Sunshine Coast Population Estimates 25
Table 9: Long Term Population and Houisng Forecast: Sunshine Coast Regional District 28
Table 10: Components of Employment Growth and Industry Specialization,
Sunshine Coast RD, 1996 to 2001 29
Table 11: Components of Employment Growth and Industry Specialization,
Sunshine Coast RD, 2001 to 2006 30
Table 12 - Owned Residential Stock - 2010 32
Table 13: Industry Composition of Labour Force, Sunshine Coast RD, 1986 – 2006 34
Table 14: Registered Businesses - Sunshine Coast RD (2013) 35
Table 15: Annual harvest volume (in m3) in Sunshine Coast Forest District 35
Table 16: Sunshine Coast Timer Supply Area Mills 36
Table 17: Sunshine Coast Regional District Population Growth Components 36
List of Charts:
Chart 1: Labour Force and Employment - SCRD, 1986 - 2011 8
Chart 2: Employment Growth - SCRD, Lower Mainland-Southwest DR and B.C., 1986 – 2011 8
Chart 3: Unemployment Rates - SCRD, Lower mainland-southwest DR and B.C., 1986 – 2011 8
Chart 4: Industry Composition of Labour Force - SCRD, 1986 – 2011 9
Chart 5: Employment in Goods Industries - SCRD, 1986 – 2011 9
Chart 6: Employment in Selected Industries - SCRD, 1986 – 2011 9
Chart 7: Employed by Place of Residence and Place of Work - SCRD, 1996 – 2011 10
Chart 8: Number of Employees by Business - SCRD, 2013 11
Chart 9: Business Incorporations - SCRD, 1990 – 2013 12
Chart 10: E.I. Benefi ciaries Receiving Regular Benefi ts - SCRD, Monthly 12
Chart 11: Trends in E.l. Benefi ciaries - SCRD, LM-SW, and B.C., Monthly 12
Chart 12: Annual Timber Harvest -Sunshine Coast Forest District 15
Chart 13: Room Revenues - SCRD, Annually 18
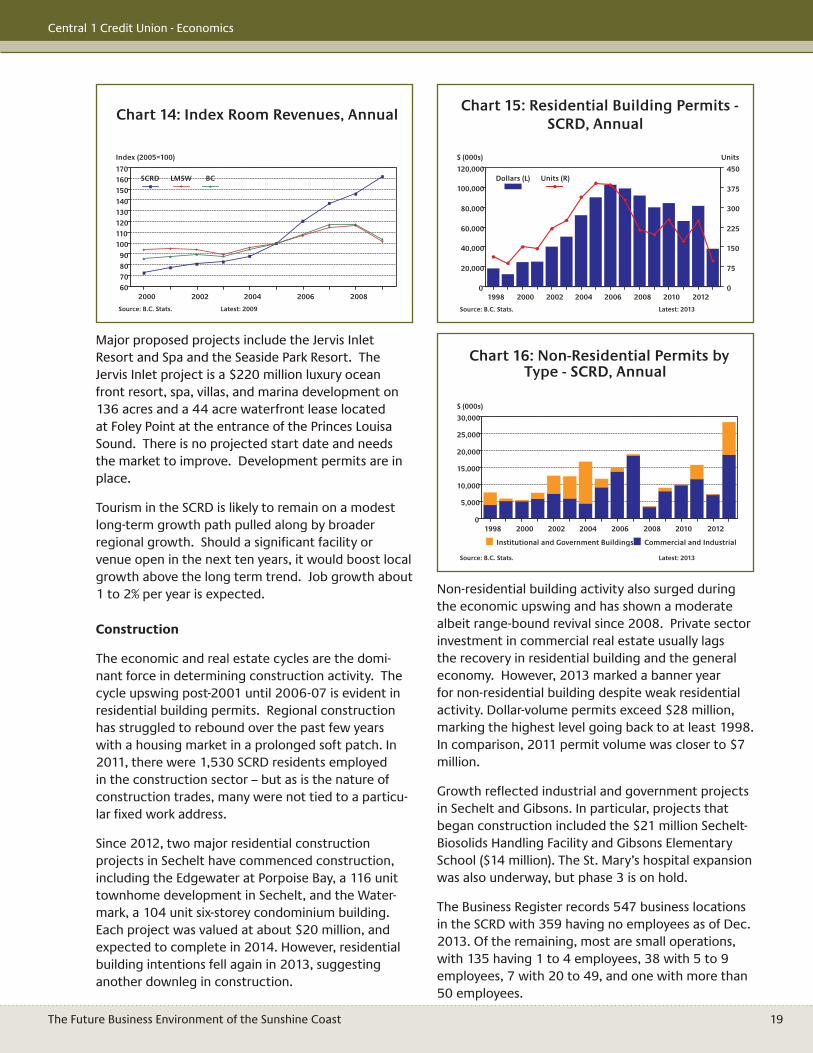
Chart 14: Index Room Revenue, Annual 19
Chart 15: Residential Building Permits - SCRD, Annually 19
The Future Business Environment of the Sunshine Coast 5
Central 1 Credit Union - Economics
Contents (continued)
Chart 16: Non-Residential Permits by Type - SCRD, Annually 19
Chart 17: Population - SCRD, 1956 – 2011 24
Chart 18: Population Growth - SCRD and B.C., 1961 – 2011 24
Chart 19: Population Age Distribution - SCRD and B.C., 2013 24
Chart 20: Evolution of SCRD Population Age Distribution 25
Chart 21: Migration Components, Sunshine Coast RD, Annual 25
Chart 22: Population Forecast 26
Chart 23: Net Migration Projections - SCRD, 1987 – 2026 26
Chart 24: Projected Age Distribution of SCRD Population 26
Chart 25: Residential Sales - SCRD, 1976 – 2013 28
Chart 26: Residential Median Sales Price - SCRD, 1976 – 2013 28
Chart 27: External Ownership of Housing in SCRD, 2001-2010 32
Chart 28: External Ownership of SCRD Housing by Location, 2010 33
Chart 29: Canadian External Ownership of SCRD Housing, 2010 33
Chart 30: Lower Mainland External Ownership of SCRD Housing, 2010 33
Chart 31: Dwelling Type Composition of Residential Sales, SCRD, 1976 - 2013 37
Chart 32: Residential Transactions by New and Resale - SCRD, Annually 37
Chart 33: International External Ownership of SCRD Housing, 2010 37
The Future Business Environment of the Sunshine Coast 6
Central 1 Credit Union - Economics
Summary
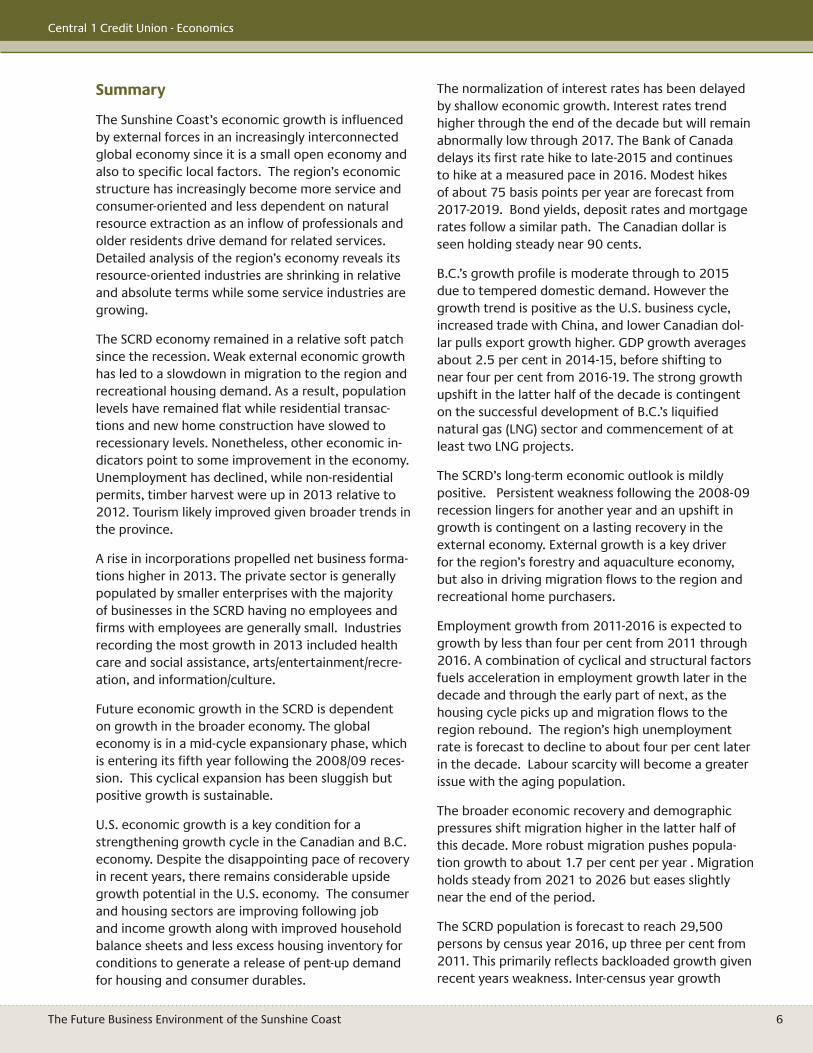
The Sunshine Coast’s economic growth is infl uenced by external forces in an increasingly interconnected global economy since it is a small open economy and also to specifi c local factors. The region’s economic structure has increasingly become more service and consumer-oriented and less dependent on natural resource extraction as an infl ow of professionals and older residents drive demand for related services. Detailed analysis of the region’s economy reveals its resource-oriented industries are shrinking in relative and absolute terms while some service industries are growing.
The SCRD economy remained in a relative soft patch since the recession. Weak external economic growth has led to a slowdown in migration to the region and recreational housing demand. As a result, population levels have remained fl at while residential transac-tions and new home construction have slowed to recessionary levels. Nonetheless, other economic in-dicators point to some improvement in the economy. Unemployment has declined, while non-residential permits, timber harvest were up in 2013 relative to 2012. Tourism likely improved given broader trends in the province.
A rise in incorporations propelled net business forma-tions higher in 2013. The private sector is generally populated by smaller enterprises with the majority of businesses in the SCRD having no employees and fi rms with employees are generally small. Industries recording the most growth in 2013 included health care and social assistance, arts/entertainment/recre-ation, and information/culture.
Future economic growth in the SCRD is dependent on growth in the broader economy. The global economy is in a mid-cycle expansionary phase, which is entering its fi fth year following the 2008/09 reces-sion. This cyclical expansion has been sluggish but positive growth is sustainable.
U.S. economic growth is a key condition for a strengthening growth cycle in the Canadian and B.C. economy. Despite the disappointing pace of recovery in recent years, there remains considerable upside growth potential in the U.S. economy. The consumer and housing sectors are improving following job and income growth along with improved household balance sheets and less excess housing inventory for conditions to generate a release of pent-up demand for housing and consumer durables.
The normalization of interest rates has been delayed by shallow economic growth. Interest rates trend higher through the end of the decade but will remain abnormally low through 2017. The Bank of Canada delays its fi rst rate hike to late-2015 and continues to hike at a measured pace in 2016. Modest hikes of about 75 basis points per year are forecast from 2017-2019. Bond yields, deposit rates and mortgage rates follow a similar path. The Canadian dollar is seen holding steady near 90 cents.
B.C.’s growth profi le is moderate through to 2015 due to tempered domestic demand. However the growth trend is positive as the U.S. business cycle, increased trade with China, and lower Canadian dol-lar pulls export growth higher. GDP growth averages about 2.5 per cent in 2014-15, before shifting to near four per cent from 2016-19. The strong growth upshift in the latter half of the decade is contingent on the successful development of B.C.’s liquifi ed natural gas (LNG) sector and commencement of at least two LNG projects.
The SCRD’s long-term economic outlook is mildly positive. Persistent weakness following the 2008-09 recession lingers for another year and an upshift in growth is contingent on a lasting recovery in the external economy. External growth is a key driver for the region’s forestry and aquaculture economy, but also in driving migration fl ows to the region and recreational home purchasers.
Employment growth from 2011-2016 is expected to growth by less than four per cent from 2011 through 2016. A combination of cyclical and structural factors fuels acceleration in employment growth later in the decade and through the early part of next, as the housing cycle picks up and migration fl ows to the region rebound. The region’s high unemployment rate is forecast to decline to about four per cent later in the decade. Labour scarcity will become a greater issue with the aging population.
The broader economic recovery and demographic pressures shift migration higher in the latter half of this decade. More robust migration pushes popula-tion growth to about 1.7 per cent per year . Migration holds steady from 2021 to 2026 but eases slightly near the end of the period.
The SCRD population is forecast to reach 29,500 persons by census year 2016, up three per cent from 2011. This primarily refl ects backloaded growth given recent years weakness. Inter-census year growth
The Future Business Environment of the Sunshine Coast 7
Central 1 Credit Union - Economics
motivation. Population projections by age-cohort are presented as well.
Housing market activity and trends since 1976 are presented along with an analysis of current condi-tions. The housing stock by local and non-local ownership reveals a prominent feature of the SCRD market. Housing forecasts of sales and prices through to 2026 are made.
Location and Features
The SCRD is part of the Lower Mainland-Southwest economic region (LM-SW) of British Columbia located on the eastern shore of the Strait of Georgia and to the northwest of Metro Vancouver. The SCRD is ac-cessed by water and air only since no roads connect it with the rest of the province. From Vancouver, BC ferries is a 40 minute trip from Horseshoe Bay to Gibsons and at the northern end of the region, BC ferries travel from Earl’s Cove to Saltery Bay.
The majority of the SCRD is sparsely populated and concentrated along the coast in Gibsons, Roberts Creek, Sechelt, Halfmoon Bay, Secret Cove, and Pender Harbour. The 2011 Census reported a total population of 28,619 persons in a land area of 3,776.62 km² for a density of 7.6 persons per km2.
Data Sources
Data from the Census of Canada, Statistics Canada, B.C. Stats, Landcor Data Corp, the Real Estate Board of Greater Vancouver, and others were utilized. This provides the base of quantitative information to analyze the region’s economic and labour market performance and prospects moving forward. A key challenge in regional economic analysis is the avail-ability of data. Information published at the provin-cial and large metro area level is often not available for areas such as the SCRD or is compiled infrequently with signifi cant time lags.
Changes to the Canadian Census in 2011 introduced signifi cant data challenges. While a full census was maintained to enumerate total population and age/sex distributions, the mandatory long-form census was replaced with a voluntary National Household Survey (NHS).
The long-form census/NHS is used to estimate popula-tion characteristics including labour market activity, commuter patterns, and other socio-economic factors. However, the voluntary nature of the NHS in-troduced sampling and non-response bias, potentially
accelerates to 7.8 per cent from 2016 to 2021 with nine per cent gain from 2021 to 2026.
Housing is in a post-recession slump but a rising market is forecast to take hold by 2015 with a cyclical peak reached around 2017. This cycle foreseeably drives sales to a peak of near 900 units per annum as recreational demand combines with population driven demand. Following this cycle peak will be an inevitable downturn which will push sales below pro-jected levels by the end of the decade. This decline is a normal market adjustment phase to balance supply and demand and not a severe downturn brought about by an economic recession.
Over the course of this next decade, we expect the median price level to follow the shape of the sales trajectory. Given that sales remain in a cyclical lull, price gains are expected to remain muted until the second half of the decade. As the economy recovers, homeowners ramp up demand for recreational or secondary housing and retirees will be in a better position to transition to retirement housing. The median price is projected to reach $421,000 by 2021, refl ecting no growth in the fi rst half of the decade followed by average annual growth of about 3.5 per cent. Average annual growth of fi ve per cent from 2021 to 2026 pushes the median value to $538,500. Sales will outpace the growth in inventory and new supply bidding up price levels in the region
Report Objective
The purpose of this research is to determine the most likely economic and demographic conditions in the Sunshine Coast Regional District (SCRD) during the
next ten years.
Report Outline
The report begins with a broad view of the region’s economy followed by an industry analysis. Trends and developments in the SCRD’s economy and industries are identifi ed helping to shape the region’s economic forecast. A macro-economic forecast is used to shape the business cycle and feed into the B.C., lower mainland, and SCRD forecasts.
Next, the region’s population and demographics are examined and forecast. Overall population growth and migration forecasts are infl uenced by the eco-nomic forecast as well as non-economic factors such as the aging of the population and the quality of life
The Future Business Environment of the Sunshine Coast 8
Central 1 Credit Union - Economics
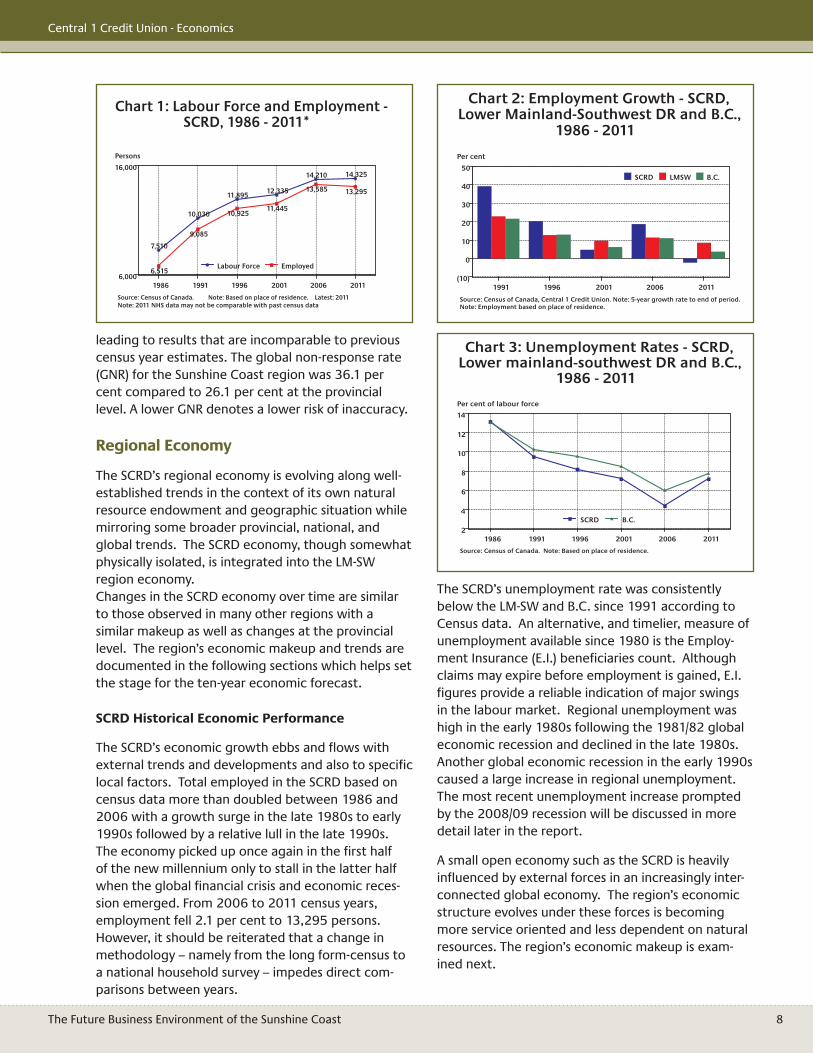
The SCRD’s unemployment rate was consistently below the LM-SW and B.C. since 1991 according to Census data. An alternative, and timelier, measure of unemployment available since 1980 is the Employ-ment Insurance (E.I.) benefi ciaries count. Although claims may expire before employment is gained, E.I. fi gures provide a reliable indication of major swings in the labour market. Regional unemployment was high in the early 1980s following the 1981/82 global economic recession and declined in the late 1980s. Another global economic recession in the early 1990s caused a large increase in regional unemployment. The most recent unemployment increase prompted by the 2008/09 recession will be discussed in more detail later in the report.
A small open economy such as the SCRD is heavily infl uenced by external forces in an increasingly inter-connected global economy. The region’s economic structure evolves under these forces is becoming more service oriented and less dependent on natural resources. The region’s economic makeup is exam-ined next.
leading to results that are incomparable to previous census year estimates. The global non-response rate (GNR) for the Sunshine Coast region was 36.1 per cent compared to 26.1 per cent at the provincial level. A lower GNR denotes a lower risk of inaccuracy.
Regional Economy
The SCRD’s regional economy is evolving along well-established trends in the context of its own natural resource endowment and geographic situation while mirroring some broader provincial, national, and global trends. The SCRD economy, though somewhat physically isolated, is integrated into the LM-SW region economy. Changes in the SCRD economy over time are similar to those observed in many other regions with a similar makeup as well as changes at the provincial level. The region’s economic makeup and trends are documented in the following sections which helps set the stage for the ten-year economic forecast.
SCRD Historical Economic Performance
The SCRD’s economic growth ebbs and fl ows with external trends and developments and also to specifi c local factors. Total employed in the SCRD based on census data more than doubled between 1986 and 2006 with a growth surge in the late 1980s to early 1990s followed by a relative lull in the late 1990s. The economy picked up once again in the fi rst half of the new millennium only to stall in the latter half when the global fi nancial crisis and economic reces-sion emerged. From 2006 to 2011 census years, employment fell 2.1 per cent to 13,295 persons. However, it should be reiterated that a change in methodology – namely from the long form-census to a national household survey – impedes direct com-parisons between years.
6,515
9,085
10,92511,445
13,585 13,295
7,510
10,030
11,89512,335
14,210 14,325
1986 1991 1996 2001 2006 20116,000
16,000
Persons
Labour Force Employed
Source: Census of Canada. Note: Based on place of residence. Latest: 2011Note: 2011 NHS data may not be comparable with past census data
Chart 1: Labour Force and Employment - SCRD, 1986 - 2011*
1991 1996 2001 2006 2011(10)
0
10
20
30
40
50
Per cent
SCRD LMSW B.C.
Source: Census of Canada, Central 1 Credit Union. Note: 5-year growth rate to end of period.Note: Employment based on place of residence.
Chart 2: Employment Growth - SCRD, Lower Mainland-Southwest DR and B.C.,
1986 - 2011
1986 1991 1996 2001 2006 20112
4
6
8
10
12
14
Per cent of labour force
SCRD B.C.
Source: Census of Canada. Note: Based on place of residence.
Chart 3: Unemployment Rates - SCRD, Lower mainland-southwest DR and B.C.,
1986 - 2011
The Future Business Environment of the Sunshine Coast 9
Central 1 Credit Union - Economics
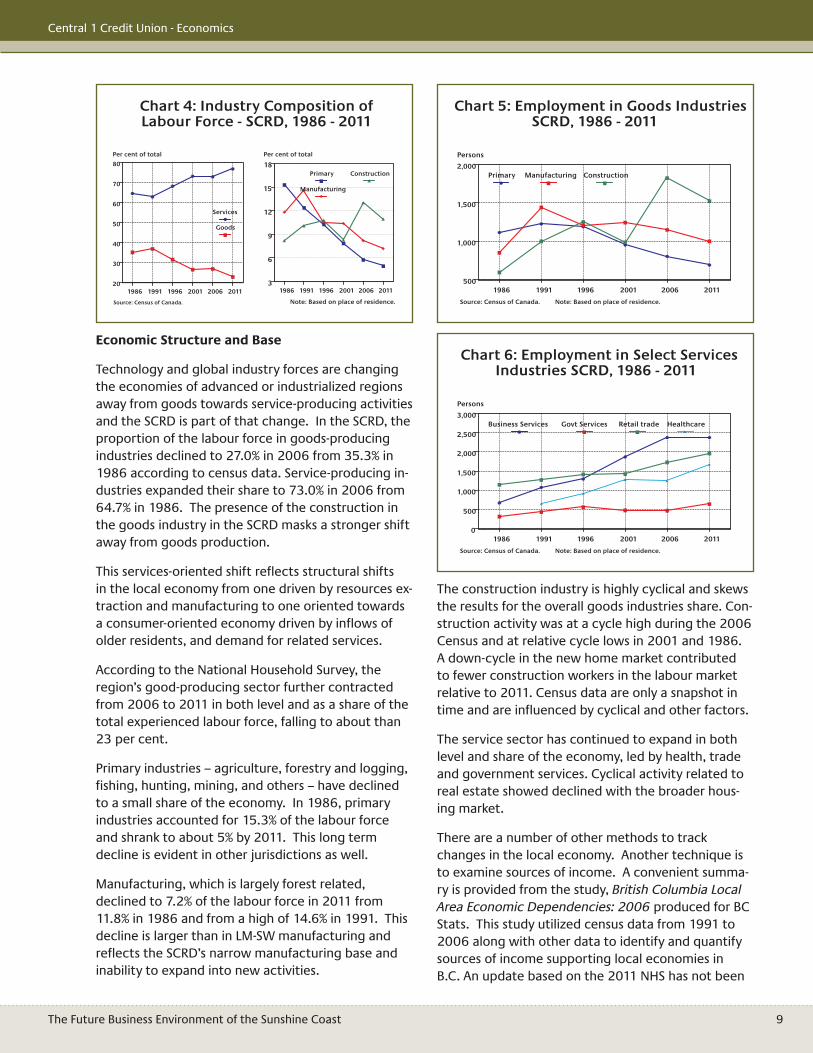
The construction industry is highly cyclical and skews the results for the overall goods industries share. Con-struction activity was at a cycle high during the 2006 Census and at relative cycle lows in 2001 and 1986. A down-cycle in the new home market contributed to fewer construction workers in the labour market relative to 2011. Census data are only a snapshot in time and are infl uenced by cyclical and other factors.
The service sector has continued to expand in both level and share of the economy, led by health, trade and government services. Cyclical activity related to real estate showed declined with the broader hous-ing market.
There are a number of other methods to track changes in the local economy. Another technique is to examine sources of income. A convenient summa-ry is provided from the study, British Columbia Local Area Economic Dependencies: 2006 produced for BC Stats. This study utilized census data from 1991 to 2006 along with other data to identify and quantify sources of income supporting local economies in B.C. An update based on the 2011 NHS has not been
Economic Structure and Base
Technology and global industry forces are changing the economies of advanced or industrialized regions away from goods towards service-producing activities and the SCRD is part of that change. In the SCRD, the proportion of the labour force in goods-producing industries declined to 27.0% in 2006 from 35.3% in 1986 according to census data. Service-producing in-dustries expanded their share to 73.0% in 2006 from 64.7% in 1986. The presence of the construction in the goods industry in the SCRD masks a stronger shift away from goods production.
This services-oriented shift refl ects structural shifts in the local economy from one driven by resources ex-traction and manufacturing to one oriented towards a consumer-oriented economy driven by infl ows of older residents, and demand for related services.
According to the National Household Survey, the region’s good-producing sector further contracted from 2006 to 2011 in both level and as a share of the total experienced labour force, falling to about than 23 per cent.
Primary industries – agriculture, forestry and logging, fi shing, hunting, mining, and others – have declined to a small share of the economy. In 1986, primary industries accounted for 15.3% of the labour force and shrank to about 5% by 2011. This long term decline is evident in other jurisdictions as well.
Manufacturing, which is largely forest related, declined to 7.2% of the labour force in 2011 from 11.8% in 1986 and from a high of 14.6% in 1991. This decline is larger than in LM-SW manufacturing and refl ects the SCRD’s narrow manufacturing base and inability to expand into new activities.
1986 1991 1996 2001 2006 2011500
1,000
1,500
2,000
Persons
Primary Manufacturing Construction
Source: Census of Canada. Note: Based on place of residence.
Chart 5: Employment in Goods Industries SCRD, 1986 - 2011
1986 1991 1996 2001 2006 20110
500
1,000
1,500
2,000
2,500
3,000
Persons
Business Services Govt Services Retail trade Healthcare
Source: Census of Canada. Note: Based on place of residence.
Chart 6: Employment in Select Services Industries SCRD, 1986 - 2011
1986 1991 1996 2001 2006 201120
30
40
50
60
70
80
Per cent of total
Services
Goods
Source: Census of Canada.
Chart 4: Industry Composition of Labour Force - SCRD, 1986 - 2011
1986 1991 1996 2001 2006 20113
6
9
12
15
18
Per cent of total
Primary
Manufacturing
Construction
Note: Based on place of residence.
The Future Business Environment of the Sunshine Coast 10
Central 1 Credit Union - Economics
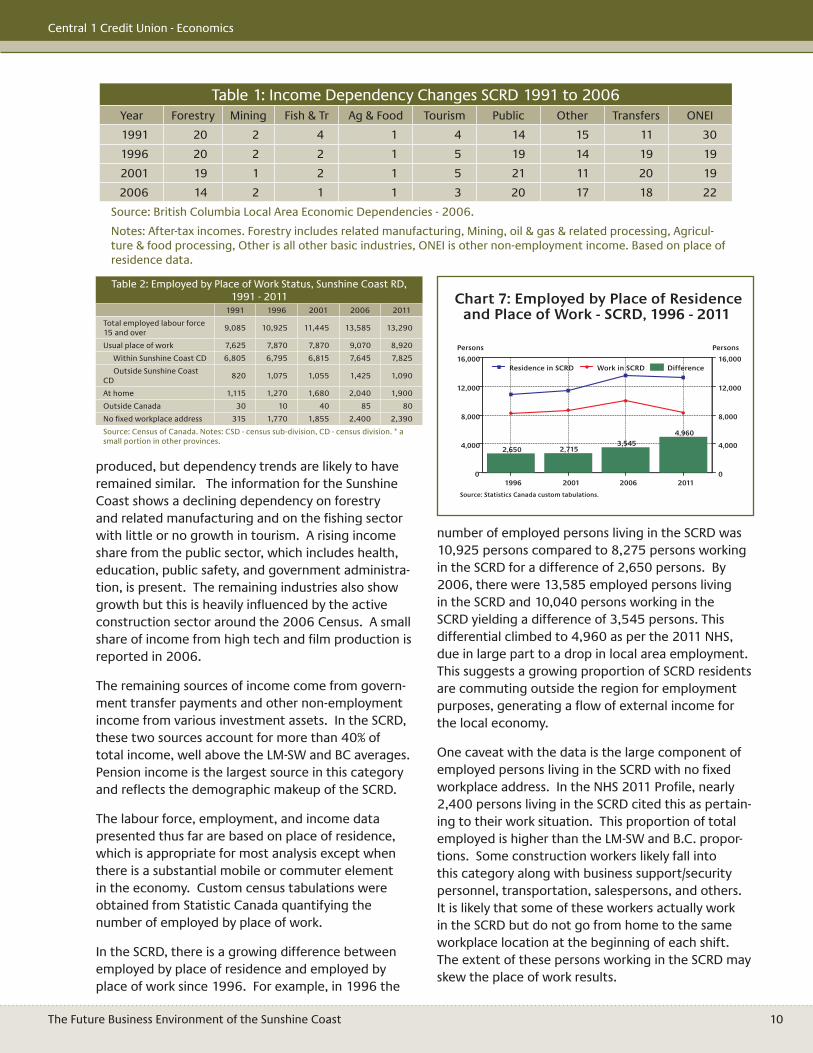
number of employed persons living in the SCRD was 10,925 persons compared to 8,275 persons working in the SCRD for a difference of 2,650 persons. By 2006, there were 13,585 employed persons living in the SCRD and 10,040 persons working in the SCRD yielding a difference of 3,545 persons. This differential climbed to 4,960 as per the 2011 NHS, due in large part to a drop in local area employment. This suggests a growing proportion of SCRD residents are commuting outside the region for employment purposes, generating a fl ow of external income for the local economy.
One caveat with the data is the large component of employed persons living in the SCRD with no fi xed workplace address. In the NHS 2011 Profi le, nearly 2,400 persons living in the SCRD cited this as pertain-ing to their work situation. This proportion of total employed is higher than the LM-SW and B.C. propor-tions. Some construction workers likely fall into this category along with business support/security personnel, transportation, salespersons, and others. It is likely that some of these workers actually work in the SCRD but do not go from home to the same workplace location at the beginning of each shift. The extent of these persons working in the SCRD may skew the place of work results.
produced, but dependency trends are likely to have remained similar. The information for the Sunshine Coast shows a declining dependency on forestry and related manufacturing and on the fi shing sector with little or no growth in tourism. A rising income share from the public sector, which includes health, education, public safety, and government administra-tion, is present. The remaining industries also show growth but this is heavily infl uenced by the active construction sector around the 2006 Census. A small share of income from high tech and fi lm production is reported in 2006.
The remaining sources of income come from govern-ment transfer payments and other non-employment income from various investment assets. In the SCRD, these two sources account for more than 40% of total income, well above the LM-SW and BC averages. Pension income is the largest source in this category and refl ects the demographic makeup of the SCRD.
The labour force, employment, and income data presented thus far are based on place of residence, which is appropriate for most analysis except when there is a substantial mobile or commuter element in the economy. Custom census tabulations were obtained from Statistic Canada quantifying the number of employed by place of work.
In the SCRD, there is a growing difference between employed by place of residence and employed by place of work since 1996. For example, in 1996 the
2,650 2,7153,545
4,960
1996 2001 2006 20110
4,000
8,000
12,000
16,000
Persons
0
4,000
8,000
12,000
16,000
Persons
Residence in SCRD Work in SCRD Difference
Source: Statistics Canada custom tabulations.
Chart 7: Employed by Place of Residence and Place of Work - SCRD, 1996 - 2011
Table 2: Employed by Place of Work Status, Sunshine Coast RD, 1991 - 2011
1991 1996 2001 2006 2011
Total employed labour force 15 and over
9,085 10,925 11,445 13,585 13,290
Usual place of work 7,625 7,870 7,870 9,070 8,920
Within Sunshine Coast CD 6,805 6,795 6,815 7,645 7,825
Outside Sunshine Coast CD
820 1,075 1,055 1,425 1,090
At home 1,115 1,270 1,680 2,040 1,900
Outside Canada 30 10 40 85 80
No fi xed workplace address 315 1,770 1,855 2,400 2,390
Source: Census of Canada. Notes: CSD - census sub-division, CD - census division. * a small portion in other provinces.
Table 1: Income Dependency Changes SCRD 1991 to 2006Year Forestry Mining Fish & Tr Ag & Food Tourism Public Other Transfers ONEI
1991 20 2 4 1 4 14 15 11 30
1996 20 2 2 1 5 19 14 19 19
2001 19 1 2 1 5 21 11 20 19
2006 14 2 1 1 3 20 17 18 22
Source: British Columbia Local Area Economic Dependencies - 2006.
Notes: After-tax incomes. Forestry includes related manufacturing, Mining, oil & gas & related processing, Agricul-ture & food processing, Other is all other basic industries, ONEI is other non-employment income. Based on place of residence data.
The Future Business Environment of the Sunshine Coast 11
Central 1 Credit Union - Economics
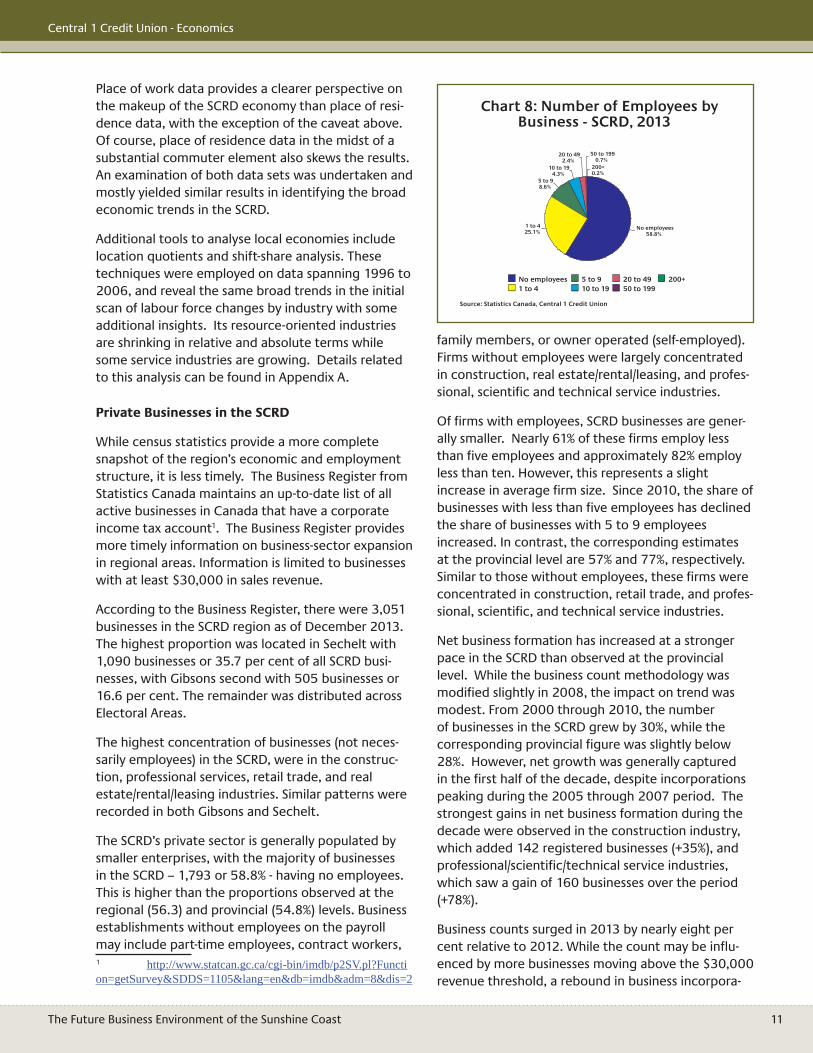
family members, or owner operated (self-employed). Firms without employees were largely concentrated in construction, real estate/rental/leasing, and profes-sional, scientifi c and technical service industries.
Of fi rms with employees, SCRD businesses are gener-ally smaller. Nearly 61% of these fi rms employ less than fi ve employees and approximately 82% employ less than ten. However, this represents a slight increase in average fi rm size. Since 2010, the share of businesses with less than fi ve employees has declined the share of businesses with 5 to 9 employees increased. In contrast, the corresponding estimates at the provincial level are 57% and 77%, respectively. Similar to those without employees, these fi rms were concentrated in construction, retail trade, and profes-sional, scientifi c, and technical service industries.
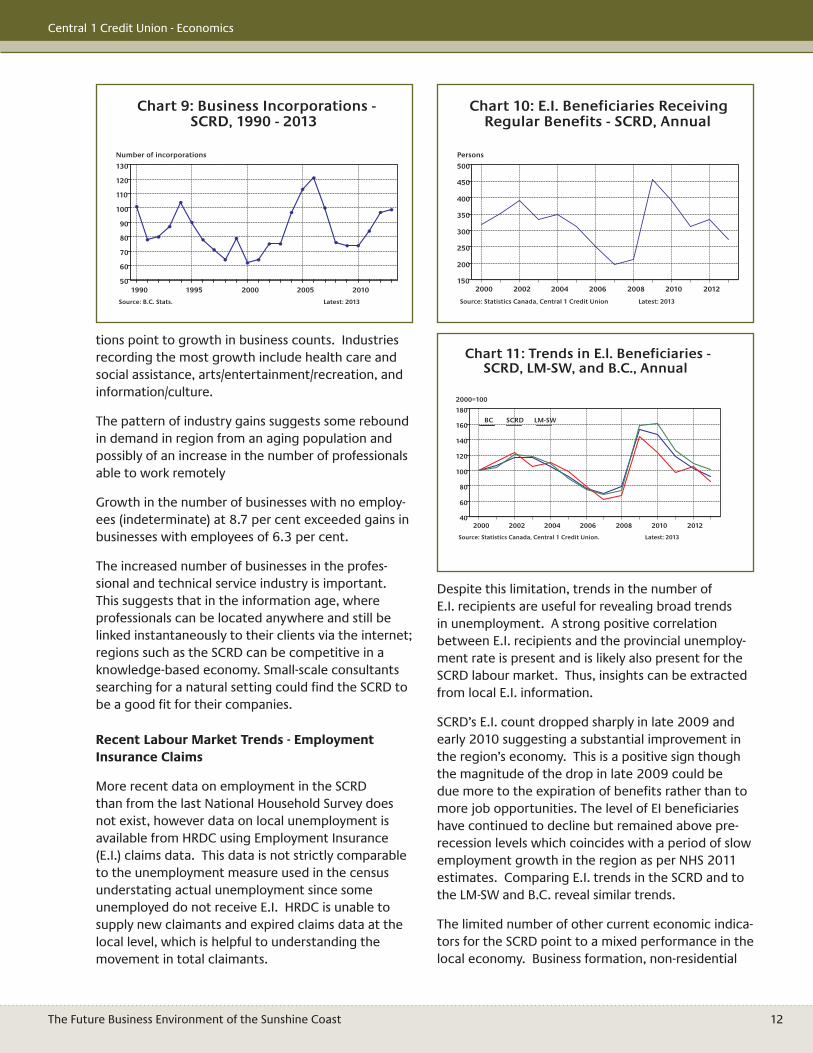
Net business formation has increased at a stronger pace in the SCRD than observed at the provincial level. While the business count methodology was modifi ed slightly in 2008, the impact on trend was modest. From 2000 through 2010, the number of businesses in the SCRD grew by 30%, while the corresponding provincial fi gure was slightly below 28%. However, net growth was generally captured in the fi rst half of the decade, despite incorporations peaking during the 2005 through 2007 period. The strongest gains in net business formation during the decade were observed in the construction industry, which added 142 registered businesses (+35%), and professional/scientifi c/technical service industries, which saw a gain of 160 businesses over the period (+78%).
Business counts surged in 2013 by nearly eight per cent relative to 2012. While the count may be infl u-enced by more businesses moving above the $30,000 revenue threshold, a rebound in business incorpora-
Place of work data provides a clearer perspective on the makeup of the SCRD economy than place of resi-dence data, with the exception of the caveat above. Of course, place of residence data in the midst of a substantial commuter element also skews the results. An examination of both data sets was undertaken and mostly yielded similar results in identifying the broad economic trends in the SCRD.
Additional tools to analyse local economies include location quotients and shift-share analysis. These techniques were employed on data spanning 1996 to 2006, and reveal the same broad trends in the initial scan of labour force changes by industry with some additional insights. Its resource-oriented industries are shrinking in relative and absolute terms while some service industries are growing. Details related to this analysis can be found in Appendix A.
Private Businesses in the SCRD
While census statistics provide a more complete snapshot of the region’s economic and employment structure, it is less timely. The Business Register from Statistics Canada maintains an up-to-date list of all active businesses in Canada that have a corporate income tax account1. The Business Register provides more timely information on business-sector expansion in regional areas. Information is limited to businesses with at least $30,000 in sales revenue.
According to the Business Register, there were 3,051 businesses in the SCRD region as of December 2013. The highest proportion was located in Sechelt with 1,090 businesses or 35.7 per cent of all SCRD busi-nesses, with Gibsons second with 505 businesses or 16.6 per cent. The remainder was distributed across Electoral Areas.
The highest concentration of businesses (not neces-sarily employees) in the SCRD, were in the construc-tion, professional services, retail trade, and real estate/rental/leasing industries. Similar patterns were recorded in both Gibsons and Sechelt.
The SCRD’s private sector is generally populated by smaller enterprises, with the majority of businesses in the SCRD – 1,793 or 58.8% - having no employees. This is higher than the proportions observed at the regional (56.3) and provincial (54.8%) levels. Business establishments without employees on the payroll may include part-time employees, contract workers, 1 http://www.statcan.gc.ca/cgi-bin/imdb/p2SV.pl?Function=getSurvey&SDDS=1105&lang=en&db=imdb&adm=8&dis=2
No employees58.8%
1 to 425.1%
5 to 98.6%
10 to 194.3%
20 to 492.4%
50 to 1990.7%
200+0.2%
No employees1 to 4
5 to 910 to 19
20 to 4950 to 199
200+
Source: Statistics Canada, Central 1 Credit Union
Chart 8: Number of Employees by Business - SCRD, 2013
The Future Business Environment of the Sunshine Coast 12
Central 1 Credit Union - Economics
Despite this limitation, trends in the number of E.I. recipients are useful for revealing broad trends in unemployment. A strong positive correlation between E.I. recipients and the provincial unemploy-ment rate is present and is likely also present for the SCRD labour market. Thus, insights can be extracted from local E.I. information.
SCRD’s E.I. count dropped sharply in late 2009 and early 2010 suggesting a substantial improvement in the region’s economy. This is a positive sign though the magnitude of the drop in late 2009 could be due more to the expiration of benefi ts rather than to more job opportunities. The level of EI benefi ciaries have continued to decline but remained above pre-recession levels which coincides with a period of slow employment growth in the region as per NHS 2011 estimates. Comparing E.I. trends in the SCRD and to the LM-SW and B.C. reveal similar trends.
The limited number of other current economic indica-tors for the SCRD point to a mixed performance in the local economy. Business formation, non-residential
tions point to growth in business counts. Industries recording the most growth include health care and social assistance, arts/entertainment/recreation, and information/culture.
The pattern of industry gains suggests some rebound in demand in region from an aging population and possibly of an increase in the number of professionals able to work remotely
Growth in the number of businesses with no employ-ees (indeterminate) at 8.7 per cent exceeded gains in businesses with employees of 6.3 per cent.
The increased number of businesses in the profes-sional and technical service industry is important. This suggests that in the information age, where professionals can be located anywhere and still be linked instantaneously to their clients via the internet; regions such as the SCRD can be competitive in a knowledge-based economy. Small-scale consultants searching for a natural setting could fi nd the SCRD to be a good fi t for their companies.
Recent Labour Market Trends - Employment Insurance Claims
More recent data on employment in the SCRD than from the last National Household Survey does not exist, however data on local unemployment is available from HRDC using Employment Insurance (E.I.) claims data. This data is not strictly comparable to the unemployment measure used in the census understating actual unemployment since some unemployed do not receive E.I. HRDC is unable to supply new claimants and expired claims data at the local level, which is helpful to understanding the movement in total claimants.
1990 1995 2000 2005 201050
60
70
80
90
100
110
120
130
Number of incorporations
Source: B.C. Stats. Latest: 2013
Chart 9: Business Incorporations - SCRD, 1990 - 2013
2000 2002 2004 2006 2008 2010 2012150
200
250
300
350
400
450
500
Persons
Source: Statistics Canada, Central 1 Credit Union Latest: 2013
Chart 10: E.I. Beneficiaries Receiving Regular Benefits - SCRD, Annual
2000 2002 2004 2006 2008 2010 201240
60
80
100
120
140
160
180
2000=100
BC SCRD LM-SW
Source: Statistics Canada, Central 1 Credit Union. Latest: 2013
Chart 11: Trends in E.l. Beneficiaries - SCRD, LM-SW, and B.C., Annual
The Future Business Environment of the Sunshine Coast 13
Central 1 Credit Union - Economics
through outcome is likely. Economic growth is the normal state of affairs with recessions occurring less than 20% of the time.
Key cyclical patterns are generally sustainable eco-nomic growth with higher infl ation and an upward trend in interest rates. Despite the disappointing pace of recovery in recent years, there remains considerable upside growth potential in the U.S. economy. The consumer and housing sectors are improving following job and income growth along with improved household balance sheets and less excess housing inventory for conditions to generate a release of pent-up demand for housing and consumer durables. U.S. economic growth is a key condition for a strengthening growth cycle in the Canadian and B.C. economy.
Long-term trends are faster growth in emerging mar-ket countries than in developed countries, increased demand for commodities from emerging countries, and fi scal challenges in those countries with aging demographics, large entitlement programs, and slowing labour force growth.
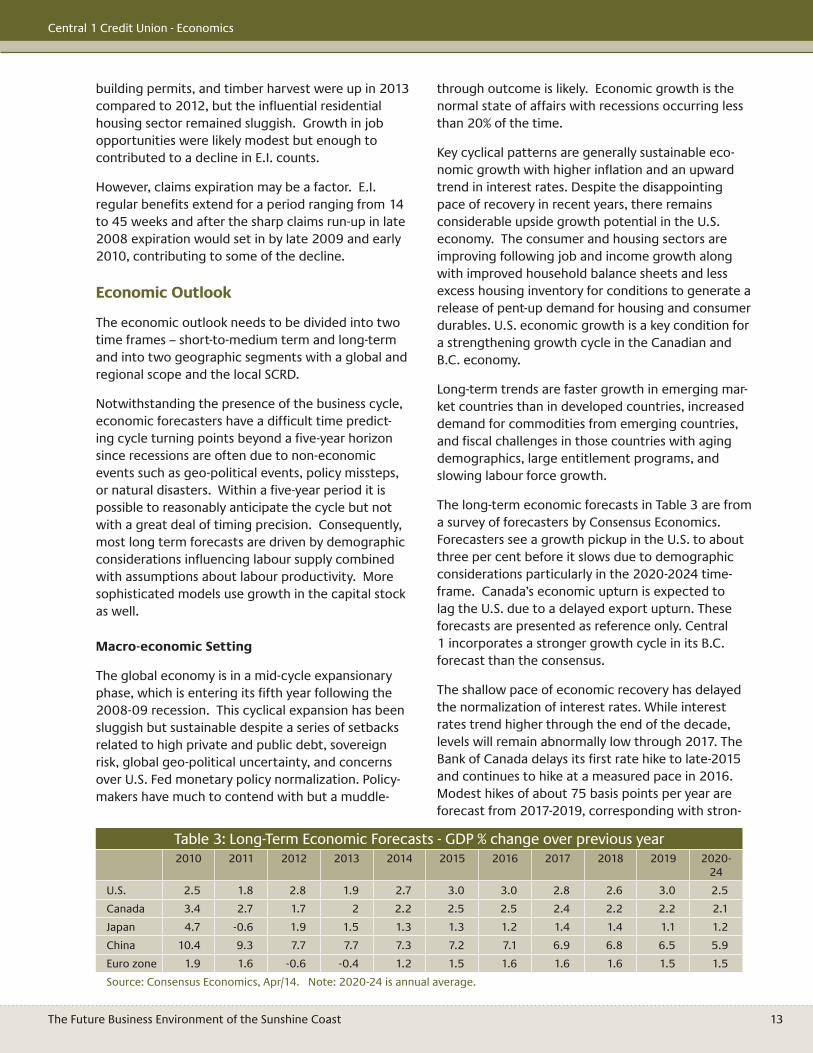
The long-term economic forecasts in Table 3 are from a survey of forecasters by Consensus Economics. Forecasters see a growth pickup in the U.S. to about three per cent before it slows due to demographic considerations particularly in the 2020-2024 time-frame. Canada’s economic upturn is expected to lag the U.S. due to a delayed export upturn. These forecasts are presented as reference only. Central 1 incorporates a stronger growth cycle in its B.C. forecast than the consensus.
The shallow pace of economic recovery has delayed the normalization of interest rates. While interest rates trend higher through the end of the decade, levels will remain abnormally low through 2017. The Bank of Canada delays its fi rst rate hike to late-2015 and continues to hike at a measured pace in 2016. Modest hikes of about 75 basis points per year are forecast from 2017-2019, corresponding with stron-
building permits, and timber harvest were up in 2013 compared to 2012, but the infl uential residential housing sector remained sluggish. Growth in job opportunities were likely modest but enough to contributed to a decline in E.I. counts.
However, claims expiration may be a factor. E.I. regular benefi ts extend for a period ranging from 14 to 45 weeks and after the sharp claims run-up in late 2008 expiration would set in by late 2009 and early 2010, contributing to some of the decline.
Economic Outlook
The economic outlook needs to be divided into two time frames – short-to-medium term and long-term and into two geographic segments with a global and regional scope and the local SCRD.
Notwithstanding the presence of the business cycle, economic forecasters have a diffi cult time predict-ing cycle turning points beyond a fi ve-year horizon since recessions are often due to non-economic events such as geo-political events, policy missteps, or natural disasters. Within a fi ve-year period it is possible to reasonably anticipate the cycle but not with a great deal of timing precision. Consequently, most long term forecasts are driven by demographic considerations infl uencing labour supply combined with assumptions about labour productivity. More sophisticated models use growth in the capital stock as well.
Macro-economic Setting
The global economy is in a mid-cycle expansionary phase, which is entering its fi fth year following the 2008-09 recession. This cyclical expansion has been sluggish but sustainable despite a series of setbacks related to high private and public debt, sovereign risk, global geo-political uncertainty, and concerns over U.S. Fed monetary policy normalization. Policy-makers have much to contend with but a muddle-
Table 3: Long-Term Economic Forecasts - GDP % change over previous year2010 2011 2012 2013 2014 2015 2016 2017 2018 2019 2020-
24
U.S. 2.5 1.8 2.8 1.9 2.7 3.0 3.0 2.8 2.6 3.0 2.5
Canada 3.4 2.7 1.7 2 2.2 2.5 2.5 2.4 2.2 2.2 2.1
Japan 4.7 -0.6 1.9 1.5 1.3 1.3 1.2 1.4 1.4 1.1 1.2
China 10.4 9.3 7.7 7.7 7.3 7.2 7.1 6.9 6.8 6.5 5.9
Euro zone 1.9 1.6 -0.6 -0.4 1.2 1.5 1.6 1.6 1.6 1.5 1.5
Source: Consensus Economics, Apr/14. Note: 2020-24 is annual average.
The Future Business Environment of the Sunshine Coast 14
Central 1 Credit Union - Economics
Alberta and Saskatchewan attract workers. In the later years, the net interprovincial outfl ow reversed due to strengthening B.C. economy, an aging popula-tion and a larger infl ow of retirees.
Housing lags other sectors of the economy due to rising interest rates, slow uptick in demand and some inventory overhang. Housing starts hold steady below 30,000 units through 2018. Housing prices, though, rise to new highs by the end of 2021 and climb almost every year following a fl at performance in recent years.
SCRD Industry Analysis and Economic Outlook
The region’s industries are examined for key trends and developments followed by the economic outlook for the SCRD.
Industry Analysis
Forestry
The competitive edge of the SCRD forestry industry has fl uctuated since 1996. While activity declined from 2001 to 2006, it has picked up since the reces-sion. Although wood processing activities faced challenges in the 2000s, logging activities have rebounded. In 2011, about 220 persons living in the SCRD were employed in forestry and logging, not including those in associated support activities.
ger economic growth. Bond yields, deposit rates and mortgage rates follow a similar path. The Canadian dollar is seen holding steady over the forecast period after a 10 per cent slide against the U.S. dollar in 2013. A stronger relative pace of U.S. economic growth and interest rates maintains the exchange rate near 90 cents.
B.C.’s long-term forecast incorporates a stronger cyclical pickup in the U.S. economy than the consen-sus view. U.S. economic growth approaches 3.5% in 2016 and averages above three per cent from 2015-2019. Growth in 2020-25 averages about 2.5 per cent. Canada’s growth profi le is on similar cyclical path though less robust due in part to weaker domes-tic factors and a more modest recession downturn.
The growth rate profi le for B.C.’s economy is moder-ate through to 2015 due to tempered domestic demand. However the growth trend is positive as the U.S. business cycle, increased trade with China, and lower Canadian dollar pulls export growth higher. GDP growth averages about 2.5 per cent in 2014-15, before shifting to near four per cent from 2016-19. The strong growth upshift in the latter half of the decade is contingent on the successful development of B.C.’s liquifi ed natural gas (LNG) sector and com-mencement of at least two LNG projects.
Population growth in B.C. trends at about one per cent through 2016 which refl ects lower interprovin-cial migration as stronger economies in neighbouring
Table 4: Interest Rate and Exchange Rate Long-Term Economic Forecasts2010 2011 2012 2013 2014 2015 2016 2017 2018 2019 2020-25
3 Month T-Bill Rate (%) 0.60 0.92 0.97 1.00 1.00 1.05 1.70 2.50 3.25 4.00 4.75
10 Year Gov. Bond (%) 3.66 3.21 2.33 2.68 3.00 3.35 4.00 4.65 5.35 6.00 6.75
Exchange Rate ($US) 97.08 101.09 100.06 97.09 90.00 88.89 90.50 90.50 89.69 88.11 89.00
Source: Statistics Canada, Central 1 Credit Union. Note: 2020-25 is annual average.
Table 5: B.C. Long-Term Economic Forecasts 2010 2011 2012 2013 2014 2015 2016 2017 2018 2019 2020-
2025
Real GDP - % chg. 3.3 2.7 1.5 2 2.2 2.6 3.7 4.6 3.9 3.8 2.8
Nominal GDP - % chg. 5.1 4.4 2.3 1.8 3.2 4.4 5.6 7 6.3 5.9 5.4
Employment - % chg. 1.7 0.8 1.7 -0.2 1.1 1.6 1.8 2.2 1.9 1.7 1.5
Unemployment Rate - % 7.6 7.5 6.7 6.6 6.4 5.9 5.9 5.1 4.8 4.1 4.3
Population - % chg. 1.3 0.7 1 0.9 0.9 0.9 1.1 1.2 1.2 1.4 1.6
Housing Starts (000s) 26.5 26.4 27.5 27.1 26.5 27.3 28.7 28.2 28.7 35 35.0
CPI - % chg. 1.4 2.3 1.1 0.2 1.6 2.3 1.7 2 2.2 2.1 2.2
Personal Income - % chg. 2.9 5 4.4 2.1 3.3 4.8 6 6.8 6.8 7.1 5.5
Source: Statistics Canada, Central 1 Credit Union. Note: 2020-25 is annual average.
The Future Business Environment of the Sunshine Coast 15
Central 1 Credit Union - Economics
capacity of 425,000 tonnes of northern bleached softwood pulp and 230,000 tonnes of newsprint.3 Formerly owned jointly by Canadian company Canfor Co. and Oji Paper Co. of Japan, the operations were purchased by Paper Excellence BV, the Netherlands based unit of Indonesia’s Sinar Mas4. The fi rm has embarked on an aggressive expansion strategy in Canada, purchasing idle mills in Mackenzie, B.C. as well as Prince Albert, Saskatchewan. The purchase by Paper Excellence will open up new sources of demand by manufacturers of high-quality paper in Asia. Anecdotal evidence suggests that employment at the mill has increased since the sale.
The Port Mellon mill produces high quality kraft pulp and mechanical paper. Kraft pulp is sold to custom-ers around the world. Newsprint is designed to meet the stringent requirements of the Japanese presses. The mill is an industry leader in environmental protec-tion and underwent a $1.3 billion modernization and expansion project in the 1990s. More recently, it received $6-million funding by the Government of Canada to improve its environmental performance under the Pulp and Paper Green Transformation Program for its Evaporator Capacity Increase Proj-ect. This project will allow the mill to improve its environmental performance by increasing its energy effi ciency and production of renewable energy. The mill plans a series of upgrades to its evaporator to redirect more steam for the production of electricity and to reduce its reliance on natural gas and green-house gas emissions. The upgrades are also expected to produce an excess of 8,200 megawatt-hours of electrical power, which the mill sells to BC Hydro.
3 http://www.paperexcellence.com/mills/howe-sound-pp/ 4 h p://www.canada.com/vancouversun/news/business/story.html?id=5bc38d97-1c27-45b7-806c-b58b86a942b3&k=83415
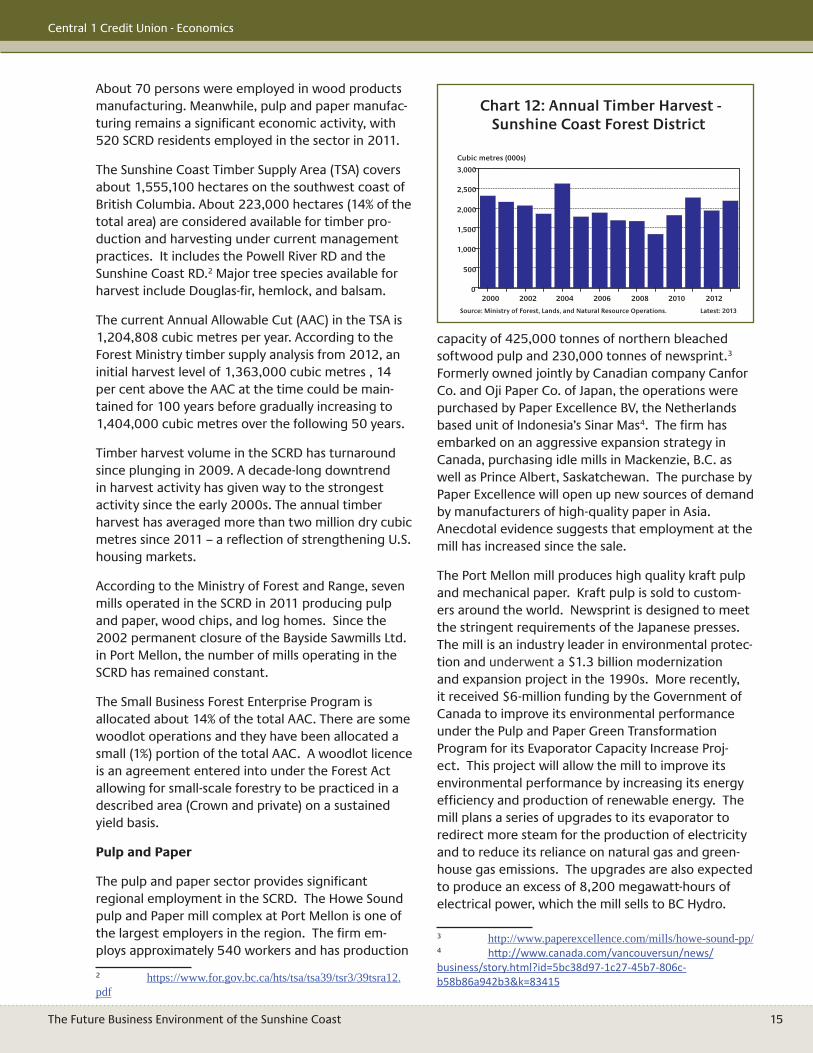
About 70 persons were employed in wood products manufacturing. Meanwhile, pulp and paper manufac-turing remains a signifi cant economic activity, with 520 SCRD residents employed in the sector in 2011.
The Sunshine Coast Timber Supply Area (TSA) covers about 1,555,100 hectares on the southwest coast of British Columbia. About 223,000 hectares (14% of the total area) are considered available for timber pro-duction and harvesting under current management practices. It includes the Powell River RD and the Sunshine Coast RD.2 Major tree species available for harvest include Douglas-fi r, hemlock, and balsam.
The current Annual Allowable Cut (AAC) in the TSA is 1,204,808 cubic metres per year. According to the Forest Ministry timber supply analysis from 2012, an initial harvest level of 1,363,000 cubic metres , 14 per cent above the AAC at the time could be main-tained for 100 years before gradually increasing to 1,404,000 cubic metres over the following 50 years.
Timber harvest volume in the SCRD has turnaround since plunging in 2009. A decade-long downtrend in harvest activity has given way to the strongest activity since the early 2000s. The annual timber harvest has averaged more than two million dry cubic metres since 2011 – a refl ection of strengthening U.S. housing markets.
According to the Ministry of Forest and Range, seven mills operated in the SCRD in 2011 producing pulp and paper, wood chips, and log homes. Since the 2002 permanent closure of the Bayside Sawmills Ltd. in Port Mellon, the number of mills operating in the SCRD has remained constant.
The Small Business Forest Enterprise Program is allocated about 14% of the total AAC. There are some woodlot operations and they have been allocated a small (1%) portion of the total AAC. A woodlot licence is an agreement entered into under the Forest Act allowing for small-scale forestry to be practiced in a described area (Crown and private) on a sustained yield basis.
Pulp and Paper
The pulp and paper sector provides signifi cant regional employment in the SCRD. The Howe Sound pulp and Paper mill complex at Port Mellon is one of the largest employers in the region. The fi rm em-ploys approximately 540 workers and has production
2 https://www.for.gov.bc.ca/hts/tsa/tsa39/tsr3/39tsra12.pdf
2000 2002 2004 2006 2008 2010 20120
500
1,000
1,500
2,000
2,500
3,000
Cubic metres (000s)
Source: Ministry of Forest, Lands, and Natural Resource Operations. Latest: 2013
Chart 12: Annual Timber Harvest -Sunshine Coast Forest District
The Future Business Environment of the Sunshine Coast 16
Central 1 Credit Union - Economics
As part of the primary industries, which declined in local specialization and competitive advantage commercial fi shing has been the weak link, while aquaculture has generally expanded over the past two decades.
Aquaculture, which includes establishments engaged in farm-raising fi nfi sh, shellfi sh or other aquatic ani-mals or plants, is spread around coastal regions of the province. While the sector is signifi cant for the local economy, it plays a marginal role for the province as a whole. According to BC Stats, the aquaculture sector made up a scant 0.1 per cent of provincial nominal gross domestic product in 2011.
The aquaculture sector experienced a moderation in activity following the recession. Average annual real (infl ation-adjusted) output declined more than 10 per cent in 2009-2011 relative to the 2006-2008 perfor-mance. This corresponds to a decline in farmed fi nfi sh and shell fi sh exports during the period. Nonetheless, sector-GDP was still up about three-fold compared to the 1990s.5 Even with a salmon moratorium in place from 1995 to 2002, growth was still strong, and further accelerated once the moratorium was removed.
Aquaculture employment held steady from 2007-2011, but remained below mid-decade highs. There were about 1,700 persons employed in the sector in 2011. Despite an increase in economic output, sector employment has held range-bound since the 1990s, a refl ection of an industry that is not as labour-intensive as others.
Major aquaculture operations in the SCRD include Greig Seafood, a Norway-based global aquaculture giant. The company has eight farm sites in Sechelt, producing Atlantic, Coho, and Chinook salmon. Target Marine Hatcheries near Grey Creek produces Coho, Chinook, Atlantic salmon and Sturgeon. The SCRD also contains some shellfi sh production and processing operations. The primary shellfi sh species harvested are oysters and clams, which are destined for markets in the USA, Canada, and Asia.
The outlook for this sector is affected by several fac-tors including the market for seafood products, local costs of production and the high Canadian dollar, land use confl icts between aquaculture operators and other users of this resource, regulations govern-ing aquaculture, First Nations considerations, and 5 BC Stats, British Columbia’s Fisheries and Aquaculture Sector, 2012 Edition. http://www.bcstats.gov.bc.ca/StatisticsBySubject/BusinessIndustry/FisheriesAquacultureHuntingTrapping.aspx
Pulp, like most commodities, is a cyclical industry. While the demand from China and other markets should expand over time, particularly when the U.S. and European economies return to more normal activity levels, another recession for either industry specifi c reasons or a macro event such as in 2008 is likely in the next ten years. A pulp industry recession is the more likely outcome and would result from fast supply growth overtaking demand causing lower prices. Several large pulp mills in Latin America are expected to appear within the next ten years along with some additional new capacity in China.
The outlook for the pulp and newsprint market is mixed. For pulp, the main storyline remains emerging markets, which are increasing the demand for and supply of pulp. However, demand has been held back by global unease and a slowdown in Chinese economic growth which has kept prices below peak. An upshift in global growth should underpin pulp and paper markets going forward, which will fuel higher prices as manufacturers increase paper production.
The implications for the Port Mellon pulp and paper mill and the SCRD economy are generally positive. While pulp prices and demand will go through another cycle in the next ten years, the important consideration is how will this mill fare? Is it an ef-fi cient operation able to withstand a long-term price decline due to technological change or to an increase in supply from lower cost producers in Latin America and elsewhere? B.C. and Canada’s pulp industry is littered with examples of unprofi table mill closures in the past two decades. Recent investments in the mill are positive for its longer term viability and no closure is expected in this ten year forecast.
Fishing and Aquaculture
The fi shing and aquaculture industry includes com-mercial fi shing, sport fi shing, and seafood manufac-turing activities. Timely employment and GDP fi gures are not specifi cally available for this sector since it is aggregated with agriculture and logging. To further cloud the matter, commercial fi shing is one of those activities for which there is no fi xed place of work.
Fisheries and aquaculture is a relatively small industry in B.C., and accounted for only 0.4% of total nominal GDP, or $860.7 million in 2011. Of this amount, aqua-culture generated $182 million, while fi sh processing made up $183 million. Commercial fi shing comprised $135 million.
The Future Business Environment of the Sunshine Coast 17
Central 1 Credit Union - Economics
smaller quarries are in the vicinity. The Construction Aggregate site has been operating since the late 1980s and has a life span of another 40 years or so. Its product is shipped to the lower mainland and to the Pacifi c Coast of the U.S. About 110 persons living in the SCRD were employed by the mining and quarrying sector in 2011 according to the NHS.
This sector is an area or specialization for the Sun-shine Coast and a source of job growth. The geologi-cal potential of the SCRD is considerable and there is potential to develop new aggregate mines. Two proposed projects are listed on the Major Projects Inventory compiled quarterly for the B.C. govern-ment.
The McNab Aggregate Mine proposed by BURNCO Rock Products Ltd. is a sand and gravel pit and processing plant located on the northwest shore of Howe Sound in the McNab Valley with a produc-tion capacity of 1 to 1.6 million tonnes/year and a projected mine life of 20-30 years. A marine loading facility, maintenance building, small craft dock and electrical substation will be included in the project. The total value of the project is $60 million but a there is no estimated start or fi nish date associated with the project. This project is in the pre-application stage at the Environmental Assessment Offi ce.8
The controversial Sechelt Carbonate Mine Project by UK based Pan Pacifi c Aggregates Ltd project with an estimated project cost of $100 million seems to have been shelved. The project which proposed a large carbonate rock mine with a production capacity of up to 6 million tonnes/year is on hold and faces considerable local opposition for its large mining foot-print and its delivery method of the product to the coast. While still listed on the MPI, the environmental assessment was terminated on May 14, 2012 due to environmental concerns, suggesting the project will not go forward.9
Other projects in the region are possible but all hinge on meeting environmental regulations, overcoming local opposition, and favourable market conditions. Since most, if not all, of the new supply would be exported to the U.S., the demand for construction aggregates depend on the state of that economy and its construction activity. The U.S. is on a cyclical upswing, which will fuel demand for aggregates from non-residential and engineering construction sectors 8 Canadian Environmental Assessment Agency, https://www.ceaa-acee.gc.ca/050/index-eng.cfm 9 Canadian Environmental Assessment Agency, http://www.ceaa-acee.gc.ca/052/details-eng.cfm?pid=26740
sport fi shing issues. Declining salmon runs are an overarching concern. Ongoing research and innova-tion in aquaculture is required and to that end the Deep Bay Marine Field Station on Vancouver Island is nearing completion with the goal of supporting sustainable shellfi sh aquaculture development and preservation of coastal ecosystems.
The job growth outlook for the next ten years is generally weak to poor under current circumstances. On the positive side, there is increasing demand for seafood products due to a growing world population but how and whether the SCRD can maintain or capture a larger share of this growth is quite uncer-tain. This forecast assumes no material change in employment levels.
Agriculture
Agriculture is a small industry in the SCRD that has contracted over the past decade. There were 89 farms in the region in 2011, down from 96 in 2006. There are no dominant farm types in the region, although nursery/tree and horse/other equine produc-tion make up a substantial proportion of total farms. The farm footprint declined from 867 ha down to 621 ha between censal periods, with the average farm size falling to about seven ha.6 Gross farm receipts in 2011 were $2.55 million, down about 1.3 per cent from 2006. A decline in the farm footprint contributed to a rise in per hectare farm receipts, but the sector was less profi table in 2011 compared to 2006. Net margin (receipts less operating expenses) was negative two per cent, compared to 3.7 per cent in 2006. Margin was well below the provincial value of 10.7 per cent.7
The SCRD specialization in agriculture is low and likely not expanding. Future expansion opportunities are tapping into the local food or 10 mile diet consumer movement and into the agri-tourism market.
Mining
Activity in this sector in the SCRD is highlighted by Construction Aggregate’s open pit sand and gravel mine in Sechelt – the largest in North America. Other 6 Statistics Canada, 2011 Census of Agriculture. http://www29.statcan.gc.ca/ceag-web/eng/data-type-selection-type-donnees.action;jsessionid=7C192B05512936BAD23F325973B53209?geoId=590229000 7 SCRD, Sunshine Coast Agriculture Area Plan: Stage 1 Background Report, 2013. h p://www.scrd.ca/fi les/File/Community/Planning/Projects/AAP%20Background%20Report%20Jan%2030%202013%20compressed.pdf
The Future Business Environment of the Sunshine Coast 18
Central 1 Credit Union - Economics
more than 60 bed and breakfast establishments in the region.
Room revenue data may also understate actual tourist visits due to the large proportion of residential property owned by individuals residing outside the SCRD. Seasonal owners would not be captured in the room revenue statistics, nor would rentals of these units to tourists.
Key factors affecting the tourism outlook are ac-cess, costs of transportation and accommodation, energy prices, the exchange rate, political events, the economic cycle, and the number, quality, and service level of tourist facilities. The SCRD has scenic and environmental advantages and is in reasonable proximity to a major metropolitan area. However, tourist offerings in the SCRD are small-scale and not well known outside the lower mainland region or province. There is no high-profi le attraction that can attract large numbers and serve as an anchor for busi-nesses to develop or expand.
of the economy. That said, new projects will likely face signifi cant environmental opposition related to new mine proposals. The ten year forecast sees some new job growth when the U.S. economy is on a suffi ciently strong cyclical upswing. More robust construction activity in B.C. is helpful but a healthier U.S. market is what is required to bring on new supply of construction aggregates.
Tourism
Tourism is not a specifi c industry classifi cation but rather a combination of several industries such as accommodation, food, transportation, retail, arts, culture, and recreation. The Local Area Economic Dependency study in 2006 identifi ed tourism gener-ating about 3% of the income in the Sunshine Coast, down from 4 to 5% in previous Censuses.
Accommodation room revenues, which include lodgings such as hotels, motels, vacation rentals and fi shing lodges, rose at a faster pace in the second half of the fi rst decade in the SCRD. While large season-ally-adjusted quarterly declines were observed in the fi rst quarters of 2009 and 2010, annual year-over-year revenues growth has been positive growing 10% in 2010 following 11% the previous year. Revenues in the region have grown at faster pace than the province as a whole over the last decade. Tourists to the SCRD come largely from the Lower Mainland and the rest of BC.
Room revenue estimates for July 2010 onwards in the SCRD are unavailable. Revenue estimates were based on a Hotel Tax that was repealed and replaced by the Harmonized Sales Tax on all services, which includes accommodations. However, regional tourism activity has likely picked up. SCRD and provincial tourism has historically been positively correlated, and the latter has exhibited signs of stable to rising room revenues and rising hotel occupancy rates.
The stock of available rooms in the SCRD has increased since declining to near 400 in 2006/07. At the beginning of the last decade, the stock was closer to 500 units. Declines refl ected a drop in hotel rooms in 2002 and a subsequent decline in motel rooms in 2004. Recent gains in room counts were led by the miscellaneous component, which include guest ranches, bed and breakfasts and houseboats. It should be noted that there are signifi cant limitations in this data, in particular, properties with three or fewer rooms, such as smaller bed and breakfast op-erations are not captured. An internet search yielded
2000 2002 2004 2006 2008 20100
1,000
2,000
3,000
4,000
5,000
6,000
7,000
8,000
9,000
$ (000s)
Source: B.C. Stats. Latest: 2010
Chart 13: Room Revenues - SCRD, Annual
Table 6: Room Revenue Revenues ($000s) Change # of Rooms
2000 3,461 ** 510
2001 3,699 6.9% 496
2002 3,858 4.3% 464
2003 3,951 2.4% 476
2004 4,199 6.3% 414
2005 4,773 13.7% 447
2006 5,743 20.3% 406
2007 6,543 13.9% 390
2008 6,948 6.2% 441
2009 7,732 11.3% 466
2010 8,522 10.2% 462
Source: BC Stats, Central 1 Credit Union
The Future Business Environment of the Sunshine Coast 19
Central 1 Credit Union - Economics
Non-residential building activity also surged during the economic upswing and has shown a moderate albeit range-bound revival since 2008. Private sector investment in commercial real estate usually lags the recovery in residential building and the general economy. However, 2013 marked a banner year for non-residential building despite weak residential activity. Dollar-volume permits exceed $28 million, marking the highest level going back to at least 1998. In comparison, 2011 permit volume was closer to $7 million.
Growth refl ected industrial and government projects in Sechelt and Gibsons. In particular, projects that began construction included the $21 million Sechelt-Biosolids Handling Facility and Gibsons Elementary School ($14 million). The St. Mary’s hospital expansion was also underway, but phase 3 is on hold.
The Business Register records 547 business locations in the SCRD with 359 having no employees as of Dec. 2013. Of the remaining, most are small operations, with 135 having 1 to 4 employees, 38 with 5 to 9 employees, 7 with 20 to 49, and one with more than 50 employees.
Major proposed projects include the Jervis Inlet Resort and Spa and the Seaside Park Resort. The Jervis Inlet project is a $220 million luxury ocean front resort, spa, villas, and marina development on 136 acres and a 44 acre waterfront lease located at Foley Point at the entrance of the Princes Louisa Sound. There is no projected start date and needs the market to improve. Development permits are in place.
Tourism in the SCRD is likely to remain on a modest long-term growth path pulled along by broader regional growth. Should a signifi cant facility or venue open in the next ten years, it would boost local growth above the long term trend. Job growth about 1 to 2% per year is expected.
Construction
The economic and real estate cycles are the domi-nant force in determining construction activity. The cycle upswing post-2001 until 2006-07 is evident in residential building permits. Regional construction has struggled to rebound over the past few years with a housing market in a prolonged soft patch. In 2011, there were 1,530 SCRD residents employed in the construction sector – but as is the nature of construction trades, many were not tied to a particu-lar fi xed work address.
Since 2012, two major residential construction projects in Sechelt have commenced construction, including the Edgewater at Porpoise Bay, a 116 unit townhome development in Sechelt, and the Water-mark, a 104 unit six-storey condominium building. Each project was valued at about $20 million, and expected to complete in 2014. However, residential building intentions fell again in 2013, suggesting another downleg in construction.
2000 2002 2004 2006 200860708090
100110120130140
150160170
Index (2005=100)
SCRD LMSW BC
Source: B.C. Stats. Latest: 2009
Chart 14: Index Room Revenues, Annual
1998 2000 2002 2004 2006 2008 2010 20120
20,000
40,000
60,000
80,000
100,000
120,000
$ (000s)
0
75
150
225
300
375
450
Units
Dollars (L) Units (R)
Source: B.C. Stats. Latest: 2013
Chart 15: Residential Building Permits -SCRD, Annual
1998 2000 2002 2004 2006 2008 2010 20120
5,000
10,000
15,000
20,000
25,000
30,000
$ (000s)
Institutional and Government Buildings Commercial and Industrial
Source: B.C. Stats. Latest: 2013
Chart 16: Non-Residential Permits by Type - SCRD, Annual
The Future Business Environment of the Sunshine Coast 20
Central 1 Credit Union - Economics
The Business Register as of Dec. 2013 recorded 279 business locations (unique physical production units) in the SCRD with no employees, another 124 locations having less than 20 employees each and 2 location with 50 to 199 employees.
A relatively high proportion of persons in this sector work outside the SCRD and in Metro Vancouver which speaks to the location attributes of the SCRD such as a high quality of life and relatively lower housing costs. Transportation is an issue but today’s technology and more fl exible work arrangements can mitigate some of this negative aspect.
Administrative, Support, and Waste Management Services
This sector comprises various administration activi-ties, security, cleaning buildings, and other services to a variety of businesses and, in some cases, to households. Waste management services involve the collection, treatment, and disposal of waste material, the operation of material recovery facilities, and the remediation of polluted sites.
According to the Business Register Dec. 2013, the number of business locations in the SCRD with no employees totaled 84 with another 52 locations hav-ing less than 20 employees each and four locations with 20 to 49 employees.
Transportation and warehousing
This sector comprises establishments primarily engaged in transporting passengers and goods, ware-housing and storing goods, and providing services to these establishments. The modes of transportation are road (trucking, transit and ground passenger), rail, water, air and pipeline. National post offi ce and courier establishments, which also transport goods, are included in this sector.
A low degree of specialization in the industry exists locally with little change in total employment during the past ten years. About one-half of the employed do not have a fi xed address for their place of work and the main form of employment is in water transportation. Air travel only makes up a very small percentage of travelers to the area, and the majority of the access by air is via fl oat plane companies that fl y into Sechelt Inlet where there are two landing docks. The District of Sechelt Airport is very small and can only accommodate smaller aircraft because of its runway length.
Real Estate, Rental, and Leasing
Real estate dominates this industry group but eco-nomic activity is highly cyclical, moving with housing market conditions.
The Business Register as of Dec. 2013 captured 235 locations with no employees, 61 with less than 20 employees, and 2 with 20 to 49 employees. This sector includes a large number of real estate agents that would be self-employed businesses.
This sector is driven by population and household growth, the economic cycle, and the demand for secondary homes. A prominent feature of the SCRD real estate market is the large proportion of owners residing outside the SCRD. According to data from Landcor Data Corp. using the BC Assessment roll, more than 50% of the owned properties were held by non-SCRD residents.
Real estate activity is currently at the lower part of the cycle but up from the recession bottom. The outlook is for the cycle to rise and peak sometime in the next fi ve years and decline to a higher cycle low. The long-term trend will be rising with anticipated population and income growth and the aging demo-graphic shift favouring greater demand for secondary vacation homes.
Major potential residential developments are limited and dependent on a stronger recovery in the general economy.
Finance and Insurance
This industry serves the domestic market and is driven by population, housing, and business growth along with product and technological changes in the fi nancial services. The Business Register as of Dec. 2013 captured 80 locations with no employees, 21 with less than 20 employees, 2 with 20 to 49 employ-ees, and 1 with 50 to 199 employees.
Professional, Scientifi c, and Technical Services
This sector comprises legal services, accounting and related services, architectural, engineering and related services, surveying and mapping services, design services, management, scientifi c and technical consulting services, scientifi c research and develop-ment services, and advertising services. Most of the services are largely dependent on human capital.
The Future Business Environment of the Sunshine Coast 21
Central 1 Credit Union - Economics
Tourists demand some retail services during visits and probably a larger infl uence is the substantial presence of vacation or secondary homeowners who have permanent residence elsewhere, typically in Metro Vancouver. Their infl ux into the SCRD causes retail activity to be higher than what could be supported by the local population.
Future employment growth will depend on popula-tion and demographic change, tourism, non-resident homeownership, technological change (internet and e-commerce), and economic/income growth.
Wholesale Trade
Wholesalers primarily sell merchandise to retailers, and business and institutional clients and this is a small sector in the SCRD. The degree of concentra-tion is one of the lowest of any industry at 0.25 in 2006 by place of work and refl ects the dominance of the LM-SW whose wholesalers can serve the SCRD through same-day shipping. The difference between place of residence and place of work employed was 42% in 2006. The Business Register has 74 business locations for this sector with 34 having no employees, 39 with less than 20, and 1 with 20 to 49 employees.
Employment growth is minimal in the past several years and there is nothing on the horizon to suggest a material change. At some point due to higher trans-portation costs and a local population suffi ciently large a larger wholesaling presence will emerge.
Utilities
In employment terms, the utilities sector in the SCRD is very small and encompasses electric, gas, water, sewer systems and treatment facilities. By place of residence, there were 125 persons employed in the 2006 Census while only 35 persons mentioned the SCRD as their place of work. Population growth is usually its main driver.
A number of small energy projects are on the Major Project Inventory list: Box Canyon Hydroelectric Project, the NI Hydro Holding Corp. project 30 km north of Sechelt, Phantom Lake Hydropower Project, and Jervis Inlet Hydro Project.
These projects are in the early stages and none are close to receiving the necessary go-ahead from BC Hydro or the Environmental Assessment Offi ce. BC Hydro’s Clean Energy Call of 2008 issued approvals to a couple of those projects. It is not clear when and if
According to the Major Projects Inventory airport expansion is on hold pending further funding. The proposed expansion includes terminal upgrades, ex-tending the runway to 1,200 m, 12 new hangars and a light industrial area at a cost of $15 million slated. This will improve access to the area and facilitate economic growth. Sechelt
Issues facing this sector are transportation costs not only ferry fares but also energy and gasoline prices. Energy prices are seen on a long term upward trend in the next ten years, albeit with some cyclical movement along the way. Higher carbon taxes are a possibility as well. Higher energy prices will restrain some demand growth and prompt businesses to seek operating effi ciencies.
In addition to the airport expansion, the SCRD would benefi t from additional marina and harbour redevel-opment and expansion to support and enhance its tourism and sport fi shing sectors. Should another large aggregate mine site emerge, its shipping needs would spur some development.
The warehousing sector is small in the SCRD with many goods shipped in from Metro Vancouver and then distributed to retailers.
Some components of transportation are tied to local population growth, e.g. transit, while business growth is another factor. The long term employment trend was slightly positive since 1996 and the ten-year projection is for a modest trend increase aided by population growth, the airport expansion, and a probability of additional water-based facilities appear-ing.
Retail Trade
This sector comprises store and non-store retailers and is one of the largest employers in the SCRD. They typically sell merchandise to the general public for personal or household consumption, but some also serve business and institutional clients. Non-store retailers sell their merchandise and services at non-fi xed point of sale locations via the internet, broadcasting and publishing channels, and by other means. The Business Register recorded 299 retail business locations with 123 having no employees as of Dec. 2013.
The retail sector has a relatively stronger footprint in the SCRD than what is found for the LMSW region as a whole. There are a couple of reasons for high con-centration of retail activities in the SCRD economy.

The Future Business Environment of the Sunshine Coast 22
Central 1 Credit Union - Economics
Longer term data from 1986 on the sector’s labour force residing in the SCRD reveals large swings between every censal period. The school-age popula-tion peaked in the late 1990s and is on a declining trend. This trend will remain in place until after 2020, though the elementary age school population will be increasing while the high school population is declin-ing.
A growing demand for retraining due to job or career turnover, technological change, and lifelong learning points to more post-secondary education – both private and public. The SCRD’s smaller population base could limit the establishment of new facilities and demand could be satisfi ed in Metro Vancouver facilities.
Employment growth is fl at to negative through to 2015 and expected to grow somewhat thereafter.
Public Administration
Little to no employment growth in the government sector in the past decade is largely due to provincial government downsizing. Local government employ-ment likely increased, though specifi c data are not available. The concentration of government employ-ment in the SCRD is in less than one which is fairly typical for similar areas. About 20% of public admin-istration workers live in the SCRD but work elsewhere or have no fi xed workplace.
The outlook is mixed depending on the level of government. Local government employment will increase roughly with the rate of population growth while provincial and federal employment is depen-dent on budgetary and policy decisions. The current fi scal situation in the federal and provincial govern-ment suggests job reductions lie ahead, especially at the federal level. However since the number of federal government jobs in the SCRD are limited, cutbacks will be few if any. Long term job growth is roughly pegged to the rate of population growth.
High Technology
The sector is an amalgam of several industries often categorized into manufacturing and services. In the SCRD, high tech is services-based in areas such as computer services, telecommunications, internet, software development, consulting, and the like. High tech emerged as a signifi cant force in the past 20 years driven by technological change. No doubt future employment growth will depend on further
these projects will proceed due to substantial envi-ronmental and community concerns. The NI Hydro Project located on Chickwat Creek, and Upper and Lower Romana Creeks remains in the review phase of the Environmental Assessment Act, but received an Electricity Purchase Agreement from BC Hydro in March 2010.
A water treatment plant is proposed for the Sechelt area and the site has received approval from the Agri-cultural Land Commission. Its construction schedule or cost is not known. The construction job impact will be larger than the operating job impact.
Utility facilities are capital intensive with a low labour content. The long term employment forecast tracks population growth with some uplift from some of the proposed projects.
Health and Social Services
This industry’s employment growth stagnated between 2001 and 2006 following a signifi cant ex-pansion in the previous fi ve–year period. The degree of specialization for this sector is usually around one since it follows population growth. Local conditions subtracted from total job growth, whether measured by place of residence or place of work data.
A signifi cant expansion at St. Mary’s Hospital is underway which includes renovations to the existing facility, expanding ambulatory and emergency care, special care, and acute care. Phase 1 expansion is expected to complete in Spring 2012, with phase 2 renovations to complete in Dec 2012. The project cost is $44 million. When complete, it will increase acute care beds to 63 from 41.
Employment will see a one-time increase as a result of the hospital expansion and a longer term growth trend of 1 to 2% per year. Public health funding will grow over time in response to a variety of cost increases and some service expansions in the context of regionalization of specialized services to the larger centres in the province. Expansion of health and social services generally follows population growth as well as the aging population shift. The demand for private health services is increasing and will increase from relatively affl uent baby-boom retirees.
Education Services
Similar to health, the SCRD’s specialization in the education industry is close to one as it is largely determined by population and demographics.
The Future Business Environment of the Sunshine Coast 23
Central 1 Credit Union - Economics
Population and Demographics Analysis and Outlook
This section presents local population and demo-graphic information and forecasts.
Population
Population growth in the SCRD was high and out-paced B.C. by a wide margin the 1970s, late 1980s and early 1990s, and post 2001. These high growth periods occurred during a robust economy and housing market and by a weaker economic environ-ment during low growth periods, further highlighting the interconnectedness of the SCRD with broader economic forces.
The most recent census counts available are those compiled in 2011. At that time, the population observed in the Sunshine Coast Regional District numbered 28,619 individuals, which was 3.1 per cent higher than that observed in 2006. While the SCRD has typically outperformed benchmark provincial growth, the latest intra-period performance has lagged provincial gains of seven per cent.
Within the regional district, population growth was concentrated in Sechelt DM which grew 9.9 per cent and Gibsons which recorded a 6.1 per cent increase in the population level. Electoral Area A (Egmont/Pender Harbour) grew 2.1 per cent while Electoral Area B (Halfmoon Bay) recorded a 4.6 per cent increase. In contrast, contractions were recorded in other areas, led by a 9.8 per cent decline in Electoral Area F (West Howe Sound).
Post Census Estimates
Post-2011 Census population estimates are compiled by both Statistics Canada and B.C. Stats. While the methods vary, annual growth rates between the two are consistent. Both data sources are used in this report, but due to more granular estimates at the sub-regional district level, B.C. Stats estimates are generally referenced.
technological change but less in the next ten years than in the prior ten years.
Economic Outlook – Sunshine Coast RD
The SCRD’s long-term economic outlook is mildly positive. Persistent weakness following the 2008-09 recession lingers for another year and an upshift in growth is contingent on a lasting recovery in the external economy. External growth is a key driver for the region’s forestry and aquaculture economy, but also in driving migration fl ows to the region and recreational home purchasers. Following a weak 2006 to 2011 growth period, employment growth is expected to growth by less than four per cent from 2011 through 2016. A combination of cyclical and structural factors fuels acceleration in employment growth later in the decade, as the housing cycle picks up and migration fl ows to the region rebound. The region’s high unemployment rate is forecast to decline to about four per cent later in the decade. Labour scarcity will become a greater issue with the aging population.
The timing of the expected growth resurgence is subject to some uncertainty and may occur later than assumed in this forecast but the resurgence is not uncertain. When the U.S. economy enters its robust growth phase, it is a rising tide that lifts all economies as when it falls into recession dragging down nearby and interconnected economies. Local factors are also at play during the next ten years
Industries with above-average forecast growth in the SCRD over the long-term are construction, real es-tate, professional/technical services, and retail trade. Industries with below-average forecast growth are logging, agriculture, aquaculture, health, education, and public administration. Moderate growth indus-tries are transportation, high tech, fi nance/insurance, administrative/support/waste management, tourism, utilities, and the pulp-paper sector.
Table 7: Long-Term Economic Forecast - Sunshine Coast Regional District1991 1996 2001 2006 2011 2016 2021 2026
Labour Force 10,030 11,895 12,335 14,210 14,325 14,800 15,800 16,900
% change 33.6 18.6 3.7 15.2 0.8 3.3 6.8 7.0
Employment1. 9,085 10,925 11,445 13,585 13,295 13,800 15,000 16,200
% change 39.4 20.2 4.8 18.7 -2.1 3.8 8.7 8.0
Unemployment Rate (%) 9.5 8.2 7.2 4.4 7.2 6.8 5.1 4.2
Source: Statistics Canada, Central 1 Credit Union. Forecast commences 2016. 1. Place of residence.
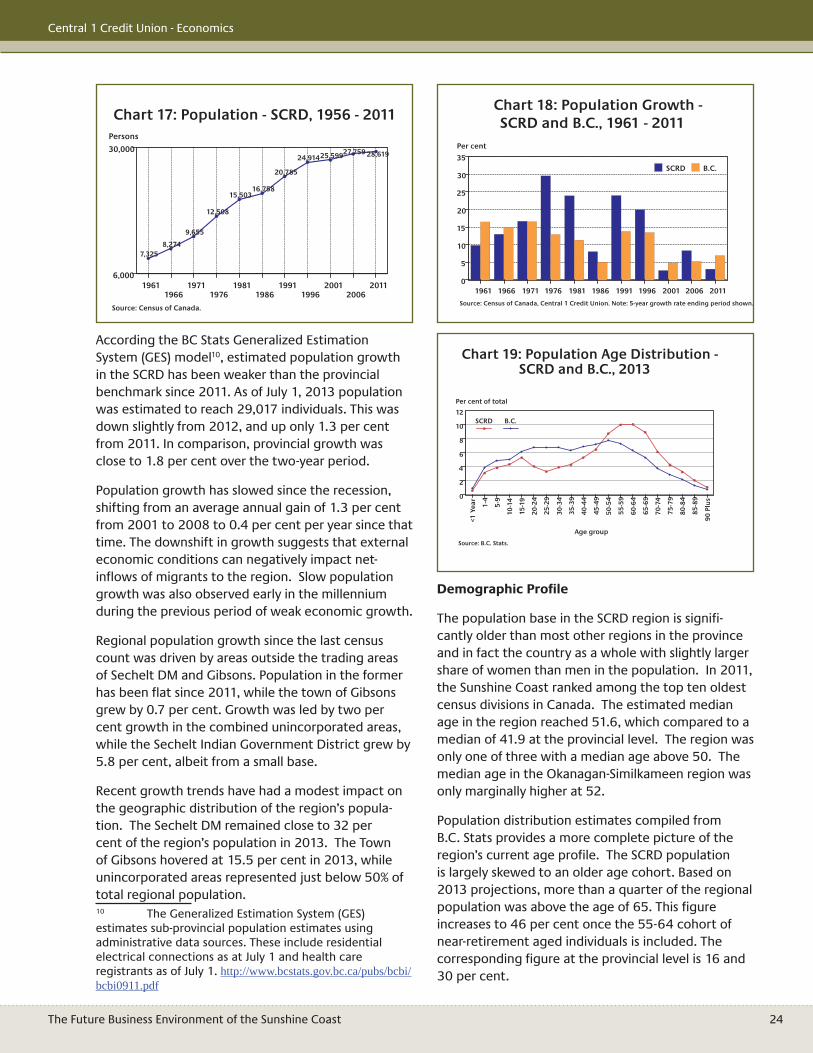
The Future Business Environment of the Sunshine Coast 24
Central 1 Credit Union - Economics
Demographic Profi le
The population base in the SCRD region is signifi -cantly older than most other regions in the province and in fact the country as a whole with slightly larger share of women than men in the population. In 2011, the Sunshine Coast ranked among the top ten oldest census divisions in Canada. The estimated median age in the region reached 51.6, which compared to a median of 41.9 at the provincial level. The region was only one of three with a median age above 50. The median age in the Okanagan-Similkameen region was only marginally higher at 52.
Population distribution estimates compiled from B.C. Stats provides a more complete picture of the region’s current age profi le. The SCRD population is largely skewed to an older age cohort. Based on 2013 projections, more than a quarter of the regional population was above the age of 65. This fi gure increases to 46 per cent once the 55-64 cohort of near-retirement aged individuals is included. The corresponding fi gure at the provincial level is 16 and 30 per cent.
According the BC Stats Generalized Estimation System (GES) model10, estimated population growth in the SCRD has been weaker than the provincial benchmark since 2011. As of July 1, 2013 population was estimated to reach 29,017 individuals. This was down slightly from 2012, and up only 1.3 per cent from 2011. In comparison, provincial growth was close to 1.8 per cent over the two-year period.
Population growth has slowed since the recession, shifting from an average annual gain of 1.3 per cent from 2001 to 2008 to 0.4 per cent per year since that time. The downshift in growth suggests that external economic conditions can negatively impact net-infl ows of migrants to the region. Slow population growth was also observed early in the millennium during the previous period of weak economic growth.
Regional population growth since the last census count was driven by areas outside the trading areas of Sechelt DM and Gibsons. Population in the former has been fl at since 2011, while the town of Gibsons grew by 0.7 per cent. Growth was led by two per cent growth in the combined unincorporated areas, while the Sechelt Indian Government District grew by 5.8 per cent, albeit from a small base.
Recent growth trends have had a modest impact on the geographic distribution of the region’s popula-tion. The Sechelt DM remained close to 32 per cent of the region’s population in 2013. The Town of Gibsons hovered at 15.5 per cent in 2013, while unincorporated areas represented just below 50% of total regional population. 10 The Generalized Estimation System (GES) estimates sub-provincial population estimates using administrative data sources. These include residential electrical connections as at July 1 and health care registrants as of July 1. http://www.bcstats.gov.bc.ca/pubs/bcbi/bcbi0911.pdf
7,3258,274
9,655
12,508
15,50316,758
20,785
24,91425,59927,759 28,619
19611966
19711976
19811986
19911996
20012006
20116,000
30,000
Persons
Source: Census of Canada.
Chart 17: Population - SCRD, 1956 - 2011
1961 1966 1971 1976 1981 1986 1991 1996 2001 2006 20110
5
10
15
20
25
30
35
Per cent
SCRD B.C.
Source: Census of Canada, Central 1 Credit Union. Note: 5-year growth rate ending period shown.
Chart 18: Population Growth -SCRD and B.C., 1961 - 2011
<1 Y
ear
1-4
5-9
10-1
4
15-1
9
20-2
4
25-2
9
30-3
4
35-3
9
40-4
4
45-4
9
50-5
4
55-5
9
60-6
4
65-6
9
70-7
4
75-7
9
80-8
4
85-8
9
90 P
lus
Age group
0
2
4
6
8
10
12
Per cent of total
SCRD B.C.
Source: B.C. Stats.
Chart 19: Population Age Distribution - SCRD and B.C., 2013
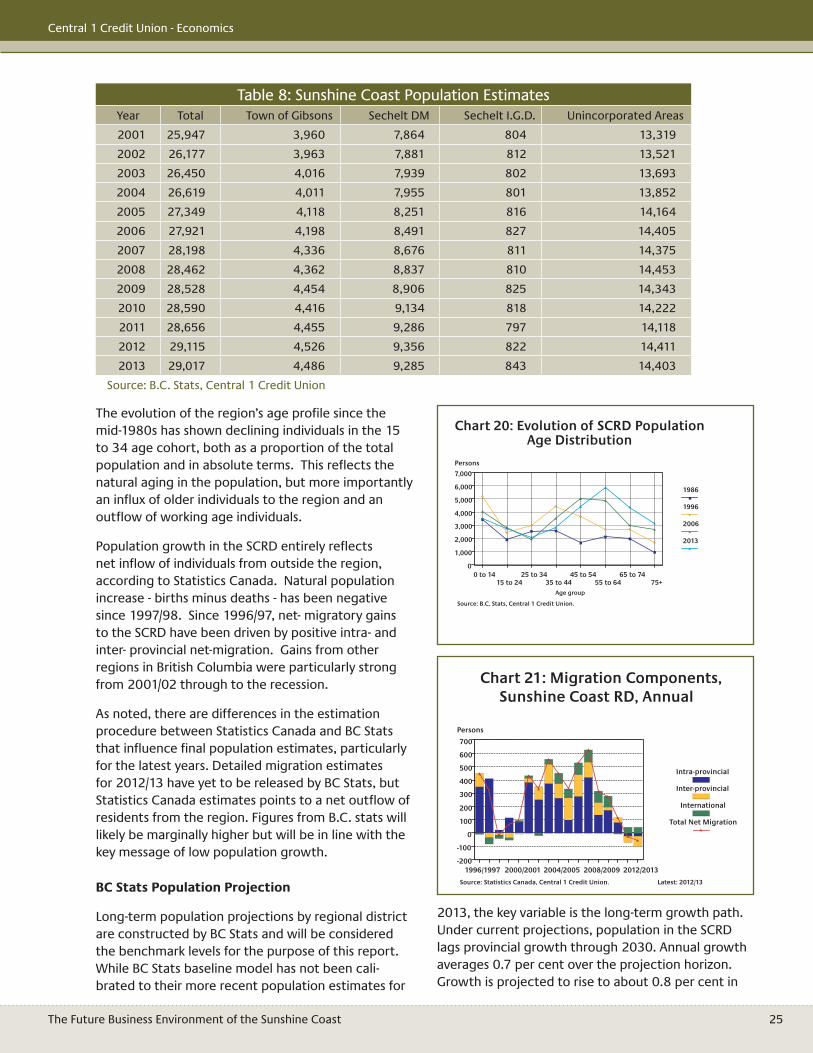
The Future Business Environment of the Sunshine Coast 25
Central 1 Credit Union - Economics
2013, the key variable is the long-term growth path. Under current projections, population in the SCRD lags provincial growth through 2030. Annual growth averages 0.7 per cent over the projection horizon. Growth is projected to rise to about 0.8 per cent in
The evolution of the region’s age profi le since the mid-1980s has shown declining individuals in the 15 to 34 age cohort, both as a proportion of the total population and in absolute terms. This refl ects the natural aging in the population, but more importantly an infl ux of older individuals to the region and an outfl ow of working age individuals.
Population growth in the SCRD entirely refl ects net infl ow of individuals from outside the region, according to Statistics Canada. Natural population increase - births minus deaths - has been negative since 1997/98. Since 1996/97, net- migratory gains to the SCRD have been driven by positive intra- and inter- provincial net-migration. Gains from other regions in British Columbia were particularly strong from 2001/02 through to the recession.
As noted, there are differences in the estimation procedure between Statistics Canada and BC Stats that infl uence fi nal population estimates, particularly for the latest years. Detailed migration estimates for 2012/13 have yet to be released by BC Stats, but Statistics Canada estimates points to a net outfl ow of residents from the region. Figures from B.C. stats will likely be marginally higher but will be in line with the key message of low population growth.
BC Stats Population Projection
Long-term population projections by regional district are constructed by BC Stats and will be considered the benchmark levels for the purpose of this report. While BC Stats baseline model has not been cali-brated to their more recent population estimates for
Table 8: Sunshine Coast Population EstimatesYear Total Town of Gibsons Sechelt DM Sechelt I.G.D. Unincorporated Areas
2001 25,947 3,960 7,864 804 13,319
2002 26,177 3,963 7,881 812 13,521
2003 26,450 4,016 7,939 802 13,693
2004 26,619 4,011 7,955 801 13,852
2005 27,349 4,118 8,251 816 14,164
2006 27,921 4,198 8,491 827 14,405
2007 28,198 4,336 8,676 811 14,375
2008 28,462 4,362 8,837 810 14,453
2009 28,528 4,454 8,906 825 14,343
2010 28,590 4,416 9,134 818 14,222
2011 28,656 4,455 9,286 797 14,118
2012 29,115 4,526 9,356 822 14,411
2013 29,017 4,486 9,285 843 14,403
Source: B.C. Stats, Central 1 Credit Union
0 to 1415 to 24
25 to 3435 to 44
45 to 5455 to 64
65 to 7475+
Age group
0
1,000
2,000
3,000
4,000
5,000
6,000
7,000
Persons
1986
1996
2006
2013
Source: B.C. Stats, Central 1 Credit Union.
Chart 20: Evolution of SCRD Population Age Distribution
1996/1997 2000/2001 2004/2005 2008/2009 2012/2013-200
-100
0
100
200
300
400
500
600
700
Persons
Intra-provincial
Inter-provincial
International
Total Net Migration
Source: Statistics Canada, Central 1 Credit Union. Latest: 2012/13
Chart 21: Migration Components,Sunshine Coast RD, Annual
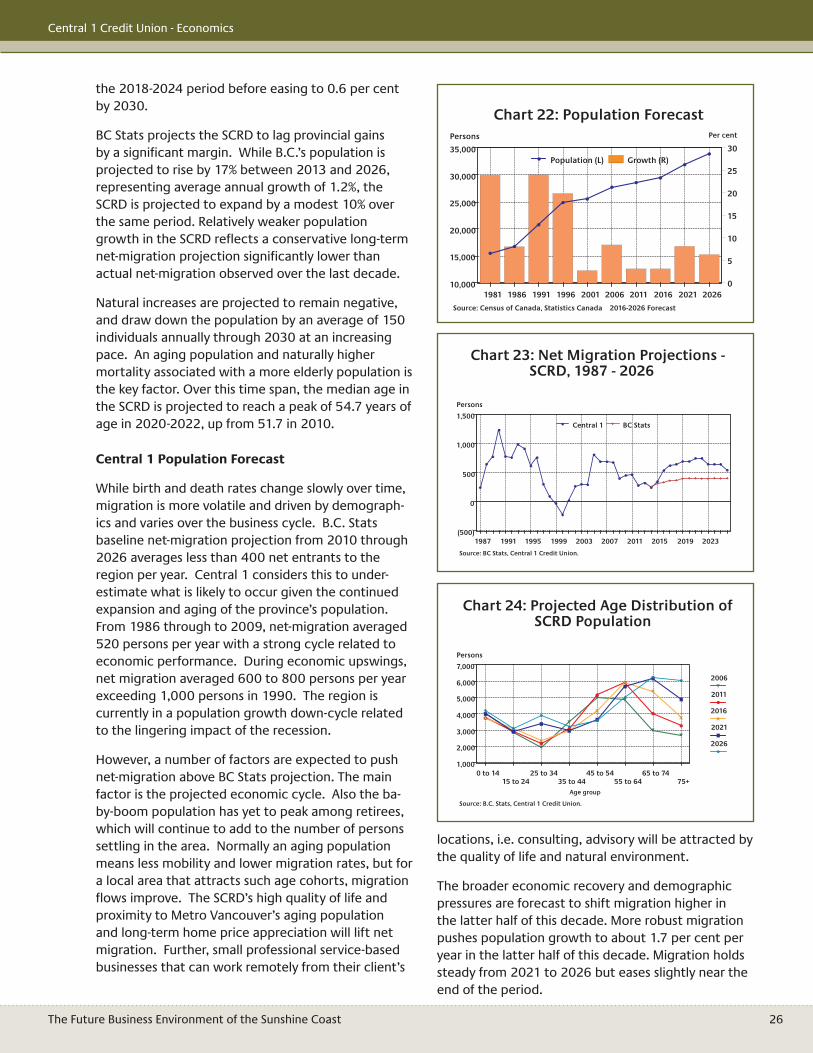
The Future Business Environment of the Sunshine Coast 26
Central 1 Credit Union - Economics
locations, i.e. consulting, advisory will be attracted by the quality of life and natural environment.
The broader economic recovery and demographic pressures are forecast to shift migration higher in the latter half of this decade. More robust migration pushes population growth to about 1.7 per cent per year in the latter half of this decade. Migration holds steady from 2021 to 2026 but eases slightly near the end of the period.
the 2018-2024 period before easing to 0.6 per cent by 2030.
BC Stats projects the SCRD to lag provincial gains by a signifi cant margin. While B.C.’s population is projected to rise by 17% between 2013 and 2026, representing average annual growth of 1.2%, the SCRD is projected to expand by a modest 10% over the same period. Relatively weaker population growth in the SCRD refl ects a conservative long-term net-migration projection signifi cantly lower than actual net-migration observed over the last decade.
Natural increases are projected to remain negative, and draw down the population by an average of 150 individuals annually through 2030 at an increasing pace. An aging population and naturally higher mortality associated with a more elderly population is the key factor. Over this time span, the median age in the SCRD is projected to reach a peak of 54.7 years of age in 2020-2022, up from 51.7 in 2010.
Central 1 Population Forecast
While birth and death rates change slowly over time, migration is more volatile and driven by demograph-ics and varies over the business cycle. B.C. Stats baseline net-migration projection from 2010 through 2026 averages less than 400 net entrants to the region per year. Central 1 considers this to under-estimate what is likely to occur given the continued expansion and aging of the province’s population. From 1986 through to 2009, net-migration averaged 520 persons per year with a strong cycle related to economic performance. During economic upswings, net migration averaged 600 to 800 persons per year exceeding 1,000 persons in 1990. The region is currently in a population growth down-cycle related to the lingering impact of the recession.
However, a number of factors are expected to push net-migration above BC Stats projection. The main factor is the projected economic cycle. Also the ba-by-boom population has yet to peak among retirees, which will continue to add to the number of persons settling in the area. Normally an aging population means less mobility and lower migration rates, but for a local area that attracts such age cohorts, migration fl ows improve. The SCRD’s high quality of life and proximity to Metro Vancouver’s aging population and long-term home price appreciation will lift net migration. Further, small professional service-based businesses that can work remotely from their client’s
1981 1986 1991 1996 2001 2006 2011 2016 2021 202610,000
15,000
20,000
25,000
30,000
35,000
Persons
0
5
10
15
20
25
30
Per cent
Population (L) Growth (R)
Source: Census of Canada, Statistics Canada 2016-2026 Forecast
Chart 22: Population Forecast
1987 1991 1995 1999 2003 2007 2011 2015 2019 2023(500)
0
500
1,000
1,500
Persons
Central 1 BC Stats
Source: BC Stats, Central 1 Credit Union.
Chart 23: Net Migration Projections - SCRD, 1987 - 2026
0 to 1415 to 24
25 to 3435 to 44
45 to 5455 to 64
65 to 7475+
Age group
1,000
2,000
3,000
4,000
5,000
6,000
7,000
Persons
2006
2011
2016
2021
2026
Source: B.C. Stats, Central 1 Credit Union.
Chart 24: Projected Age Distribution of SCRD Population
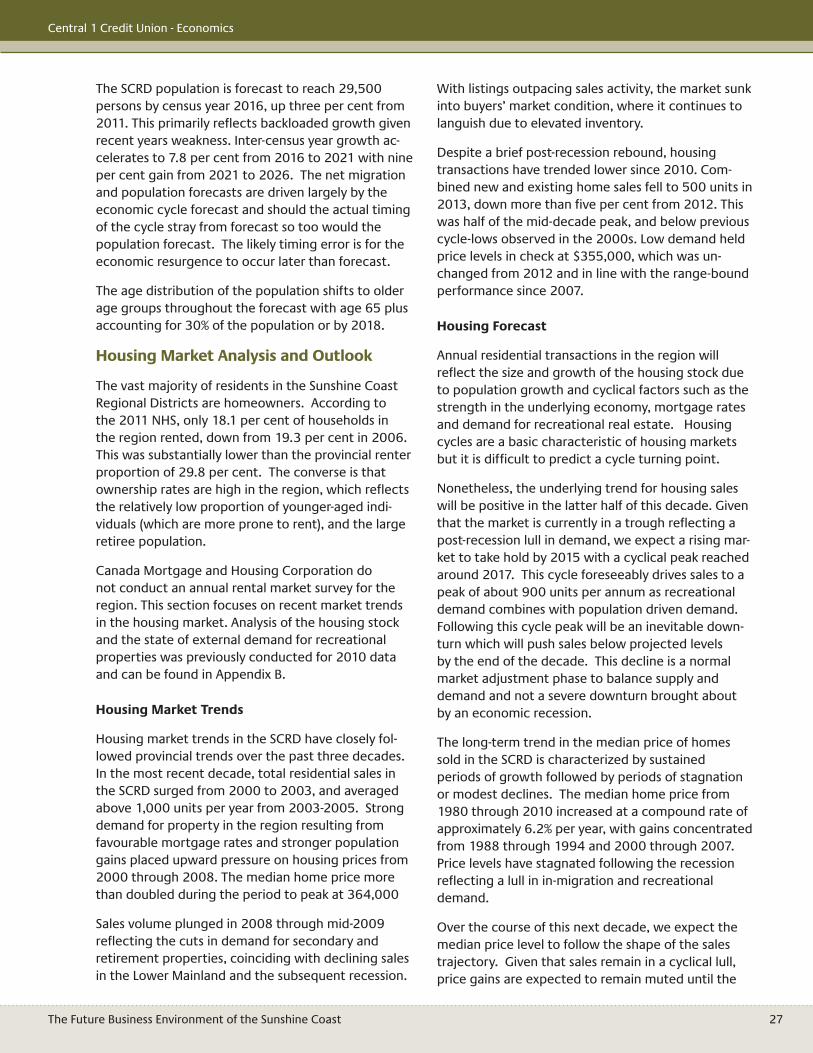
The Future Business Environment of the Sunshine Coast 27
Central 1 Credit Union - Economics
With listings outpacing sales activity, the market sunk into buyers’ market condition, where it continues to languish due to elevated inventory.
Despite a brief post-recession rebound, housing transactions have trended lower since 2010. Com-bined new and existing home sales fell to 500 units in 2013, down more than fi ve per cent from 2012. This was half of the mid-decade peak, and below previous cycle-lows observed in the 2000s. Low demand held price levels in check at $355,000, which was un-changed from 2012 and in line with the range-bound performance since 2007.
Housing Forecast
Annual residential transactions in the region will refl ect the size and growth of the housing stock due to population growth and cyclical factors such as the strength in the underlying economy, mortgage rates and demand for recreational real estate. Housing cycles are a basic characteristic of housing markets but it is diffi cult to predict a cycle turning point.
Nonetheless, the underlying trend for housing sales will be positive in the latter half of this decade. Given that the market is currently in a trough refl ecting a post-recession lull in demand, we expect a rising mar-ket to take hold by 2015 with a cyclical peak reached around 2017. This cycle foreseeably drives sales to a peak of about 900 units per annum as recreational demand combines with population driven demand. Following this cycle peak will be an inevitable down-turn which will push sales below projected levels by the end of the decade. This decline is a normal market adjustment phase to balance supply and demand and not a severe downturn brought about by an economic recession.
The long-term trend in the median price of homes sold in the SCRD is characterized by sustained periods of growth followed by periods of stagnation or modest declines. The median home price from 1980 through 2010 increased at a compound rate of approximately 6.2% per year, with gains concentrated from 1988 through 1994 and 2000 through 2007. Price levels have stagnated following the recession refl ecting a lull in in-migration and recreational demand.
Over the course of this next decade, we expect the median price level to follow the shape of the sales trajectory. Given that sales remain in a cyclical lull, price gains are expected to remain muted until the
The SCRD population is forecast to reach 29,500 persons by census year 2016, up three per cent from 2011. This primarily refl ects backloaded growth given recent years weakness. Inter-census year growth ac-celerates to 7.8 per cent from 2016 to 2021 with nine per cent gain from 2021 to 2026. The net migration and population forecasts are driven largely by the economic cycle forecast and should the actual timing of the cycle stray from forecast so too would the population forecast. The likely timing error is for the economic resurgence to occur later than forecast.
The age distribution of the population shifts to older age groups throughout the forecast with age 65 plus accounting for 30% of the population or by 2018.
Housing Market Analysis and Outlook
The vast majority of residents in the Sunshine Coast Regional Districts are homeowners. According to the 2011 NHS, only 18.1 per cent of households in the region rented, down from 19.3 per cent in 2006. This was substantially lower than the provincial renter proportion of 29.8 per cent. The converse is that ownership rates are high in the region, which refl ects the relatively low proportion of younger-aged indi-viduals (which are more prone to rent), and the large retiree population.
Canada Mortgage and Housing Corporation do not conduct an annual rental market survey for the region. This section focuses on recent market trends in the housing market. Analysis of the housing stock and the state of external demand for recreational properties was previously conducted for 2010 data and can be found in Appendix B.
Housing Market Trends
Housing market trends in the SCRD have closely fol-lowed provincial trends over the past three decades. In the most recent decade, total residential sales in the SCRD surged from 2000 to 2003, and averaged above 1,000 units per year from 2003-2005. Strong demand for property in the region resulting from favourable mortgage rates and stronger population gains placed upward pressure on housing prices from 2000 through 2008. The median home price more than doubled during the period to peak at 364,000
Sales volume plunged in 2008 through mid-2009 refl ecting the cuts in demand for secondary and retirement properties, coinciding with declining sales in the Lower Mainland and the subsequent recession.
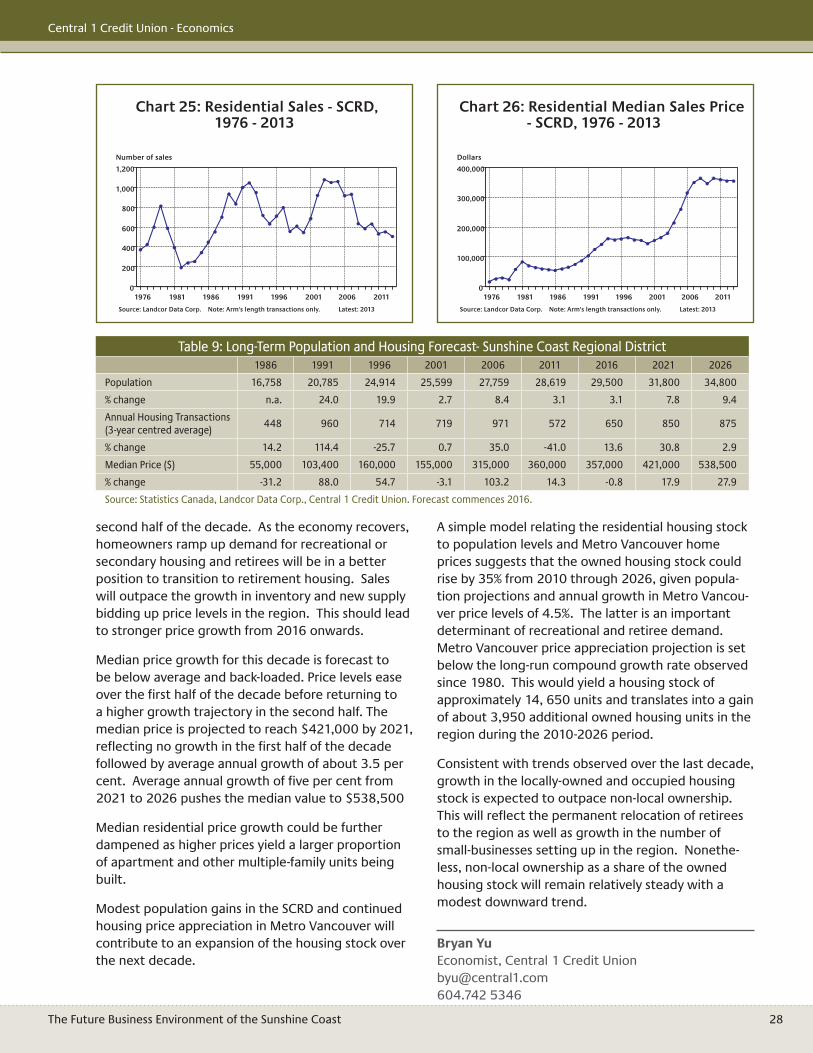
The Future Business Environment of the Sunshine Coast 28
Central 1 Credit Union - Economics
A simple model relating the residential housing stock to population levels and Metro Vancouver home prices suggests that the owned housing stock could rise by 35% from 2010 through 2026, given popula-tion projections and annual growth in Metro Vancou-ver price levels of 4.5%. The latter is an important determinant of recreational and retiree demand. Metro Vancouver price appreciation projection is set below the long-run compound growth rate observed since 1980. This would yield a housing stock of approximately 14, 650 units and translates into a gain of about 3,950 additional owned housing units in the region during the 2010-2026 period.
Consistent with trends observed over the last decade, growth in the locally-owned and occupied housing stock is expected to outpace non-local ownership. This will refl ect the permanent relocation of retirees to the region as well as growth in the number of small-businesses setting up in the region. Nonethe-less, non-local ownership as a share of the owned housing stock will remain relatively steady with a modest downward trend.
Bryan YuEconomist, Central 1 Credit [email protected] 5346
second half of the decade. As the economy recovers, homeowners ramp up demand for recreational or secondary housing and retirees will be in a better position to transition to retirement housing. Sales will outpace the growth in inventory and new supply bidding up price levels in the region. This should lead to stronger price growth from 2016 onwards.
Median price growth for this decade is forecast to be below average and back-loaded. Price levels ease over the fi rst half of the decade before returning to a higher growth trajectory in the second half. The median price is projected to reach $421,000 by 2021, refl ecting no growth in the fi rst half of the decade followed by average annual growth of about 3.5 per cent. Average annual growth of fi ve per cent from 2021 to 2026 pushes the median value to $538,500
Median residential price growth could be further dampened as higher prices yield a larger proportion of apartment and other multiple-family units being built.
Modest population gains in the SCRD and continued housing price appreciation in Metro Vancouver will contribute to an expansion of the housing stock over the next decade.
1976 1981 1986 1991 1996 2001 2006 20110
200
400
600
800
1,000
1,200
Number of sales
Source: Landcor Data Corp. Note: Arm's length transactions only. Latest: 2013
Chart 25: Residential Sales - SCRD, 1976 - 2013
1976 1981 1986 1991 1996 2001 2006 20110
100,000
200,000
300,000
400,000
Dollars
Source: Landcor Data Corp. Note: Arm's length transactions only. Latest: 2013
Chart 26: Residential Median Sales Price - SCRD, 1976 - 2013
Table 9: Long-Term Population and Housing Forecast- Sunshine Coast Regional District1986 1991 1996 2001 2006 2011 2016 2021 2026
Population 16,758 20,785 24,914 25,599 27,759 28,619 29,500 31,800 34,800
% change n.a. 24.0 19.9 2.7 8.4 3.1 3.1 7.8 9.4
Annual Housing Transactions (3-year centred average)
448 960 714 719 971 572 650 850 875
% change 14.2 114.4 -25.7 0.7 35.0 -41.0 13.6 30.8 2.9
Median Price ($) 55,000 103,400 160,000 155,000 315,000 360,000 357,000 421,000 538,500
% change -31.2 88.0 54.7 -3.1 103.2 14.3 -0.8 17.9 27.9
Source: Statistics Canada, Landcor Data Corp., Central 1 Credit Union. Forecast commences 2016.
The Future Business Environment of the Sunshine Coast 29
Central 1 Credit Union - Economics
Shift-share analysis assesses the performance of the sectors of a local economy—typically measured by employment growth—relative to a larger reference economy. This is a relatively simple and effective way to measure the competitiveness of both individual sectors and the local economy. Specifi cally, shift-share analysis calculates how much of the employ-ment growth experienced by a local economy can be accounted for by the economy’s mix of sectors, because different sectors grow at different rates; by the reference economy growth rate since there are similar forces at work; and by local factors since its economy may possess a competitive advantage in certain sectors. If a local area’s employment in a sector is growing at a faster rate than the reference employment growth in that sector would suggest, the local economy is assumed to possess a competi-tive advantage in that sector.
The reference base most often chosen is the province but since the SCRD is more integrated with the LM-SW region than with B.C., it is chosen as the reference base in this study. Both reference base data sets
Appendices
Appendix A: Location Quotients and Shift-Share Techniques
A more technical approach and the standard analysis technique of a local economy is the location quotient and shift-share methods. Location quotient is one of the most widely used measures of specialization and industrial concentration of a local economy.
The location quotient takes the relative size of any sector (usually by employment) and compares it with equivalent rate in a reference economy (usually the provincial level). This calculates how closely the local economy mirrors the structure of the provincial economy and in which sectors the local economy is more or less specialized. Typically, this is the primary tool used to identify where clusters may exist in the local economy and to identify the import and export sectors in the local economy, as a part of an economic base analysis.
Table 10: Components of Employment Growth and Industry Specialization, Sunshine Coast RD, 1996 to 2001
Sources of growth (number of persons) 2001 Location Quotient
SIC Industry Regional share
Industry mix
Local growth
Total growth
Total - Industry 736 -258 -23 455 1.000
Agricultural and related service industries 10 9 36 55 1.127
Fishing and trapping 9 -41 17 -15 13.055
Logging and forestry 36 -97 -15 -75 13.193
Mining (including milling) quarrying and oil industries 10 -37 -13 -40 3.886
Manufacturing 89 -49 -0 40 1.158
Construction 39 -106 -78 -145 1.180
Transportation and storage 32 1 -58 -25 0.835
Communication and other utility industries 11 -4 -16 -10 0.397
Wholesale trade and industries 24 -8 -42 -25 0.465
Retail trade 114 -25 5 95 1.240
Finance and insurance 22 -1 -51 -30 0.529
Real estate operator and insurance agent industries 17 -26 -27 -35 0.701
Business services 34 84 87 205 0.627
Government services 34 -38 -1 -5 0.940
Education services 57 47 -148 -45 0.864
Health and social services 67 54 129 250 1.065
Accommodation, food and beverage service industries 71 -11 -10 50 1.155
Other services 58 -13 165 210 1.217
Source: Statistics Canada, Central 1 Credit Union. Notes: 1. Based on place of work and work activity in 1995 and 2000. 2. SIC 1980 industry defi nition. 3. Regional reference base is lower mainland
The Future Business Environment of the Sunshine Coast 30
Central 1 Credit Union - Economics
were examined and the LM-SW yielded slightly better results than B.C.
Data from three census periods spanning 1996 to 2006 were compiled. One data complication is the shift to the NAICS industry classifi cation in the 2001 Census from the SIC industry classifi cation previously used distorting some industry comparisons, especially in some service industries.
A comparison of 1996 and 2001 Census place of work data suggests that growth in the reference economic region compensated for an unfavourable industry mix in the SCRD during the latter half of the 1990s. While the SCRD gained 455 employed persons during this period, broader regional growth suggested a gain of 736 persons for the SCRD. The area’s larger propor-tion of construction, logging and forestry industries employment which underwent unfavourable condi-tions during the period was a negative factor. Local-area effects were largely neutral at the aggregate level, although the local environment for educational
services was particularly weak, which is possibly due to public funding issues at the time as well as newly emerging growth in private education services in Vancouver. The strongest industry performers with the highest local growth effects were other services and health services. Business services were another outperformer from a low base. Overall, the local economy’s performance during 1996 to 2001 was poor.
In contrast, local area and broader regional fac-tors drove growth from 2001 to 2006. The SCRD’s industry mix did not provide a signifi cant contribution to growth. Total employment gained between census periods was 1,275 persons, with 774 jobs associated with general conditions in the regional economy and 460 jobs attributed to local-area effects or local competitive advantages.
The largest local-area effect was observed in indus-tries related to construction, real estate and related services, and retail trade. Since the economy, migra-
Table 11: Components of Employment Growth and Industry Specialization, Sunshine Coast RD, 2001 to 2006
Sources of growth (number of persons) 2006 Location Quotient
NAICS Industry Regional share
Industry mix Local growth Total growth
Total - Industry 774 41 460 1,275 1.000
Agriculture, forestry, fi shing and hunting 44 -36 -159 -150 1.081
Mining and oil and gas extraction 6 54 -36 25 2.384
Utilities 2 -4 17 15 0.678
Construction 28 86 205 320 1.907
Manufacturing 92 -78 -70 -55 1.019
Wholesale trade 11 3 6 20 0.252
Retail trade 120 -24 154 250 1.344
Transportation and warehousing 29 -42 8 -5 0.637
Information and cultural industries 13 -24 96 85 0.715
Finance and insurance 23 -14 26 35 0.566
Real estate and rental and leasing 15 18 171 205 1.395
Professional, scientifi c and technical services 44 48 48 140 0.670
Management of companies and enterprises 0 0 0 0 1.411
Admin., waste management and remediation services 17 20 88 125 0.878
Educational services 51 19 120 190 0.982
Health care and social assistance 91 -26 -25 40 1.032
Arts, entertainment and recreation 36 19 -70 -15 1.679
Accommodation and food services 70 19 -74 15 0.949
Other services (except public administration) 47 27 -44 30 0.969
Public administration 34 -27 -1 5 0.859
Source: Statistics Canada, Central 1 Credit Union. Notes: 1. Based on place of work and work activity in 2000 and 2005. 2. NAICS 2002 industry defi nition. 3. Regional reference base is lower mainland

The Future Business Environment of the Sunshine Coast 31
Central 1 Credit Union - Economics
tion, and housing markets observed a cyclical upturn during the period, the out-sized growth in those domestic industries affected the results. The SCRD at-tracted in-migrants, retirees and recreational buyers contributing to the signifi cant increase in real estate related, retail trade, and other services employment.
The SCRD economy’s cyclical upturn in the mid-2000s also affected the industry specialization or concen-tration results with the construction, real estate, and retail trade industries at high location quotient values. The forest logging sector remains a source of specialization relative to the LM-SW though on a shrinking basis since 1996.
At the low end of industry concentrations are mostly private service industries such as transportation, wholesale trade, fi nance and insurance, information, communications, and cultural and business services. During 1996 to 2006, these industries remained at low location quotient values, though the information, communications, and cultural industry gained. Shift-share analysis also identifi ed this industry growing from local comparative advantage factors.
Not surprisingly, this analysis of the SCRD economy reveals the same broad trends in the initial scan of labour force changes by industry since 1986 but with some additional insights. Its resource-oriented industries are shrinking in relative and absolute terms while some service industries are growing. The causes behind these trends and their future outlook are examined later in the report.
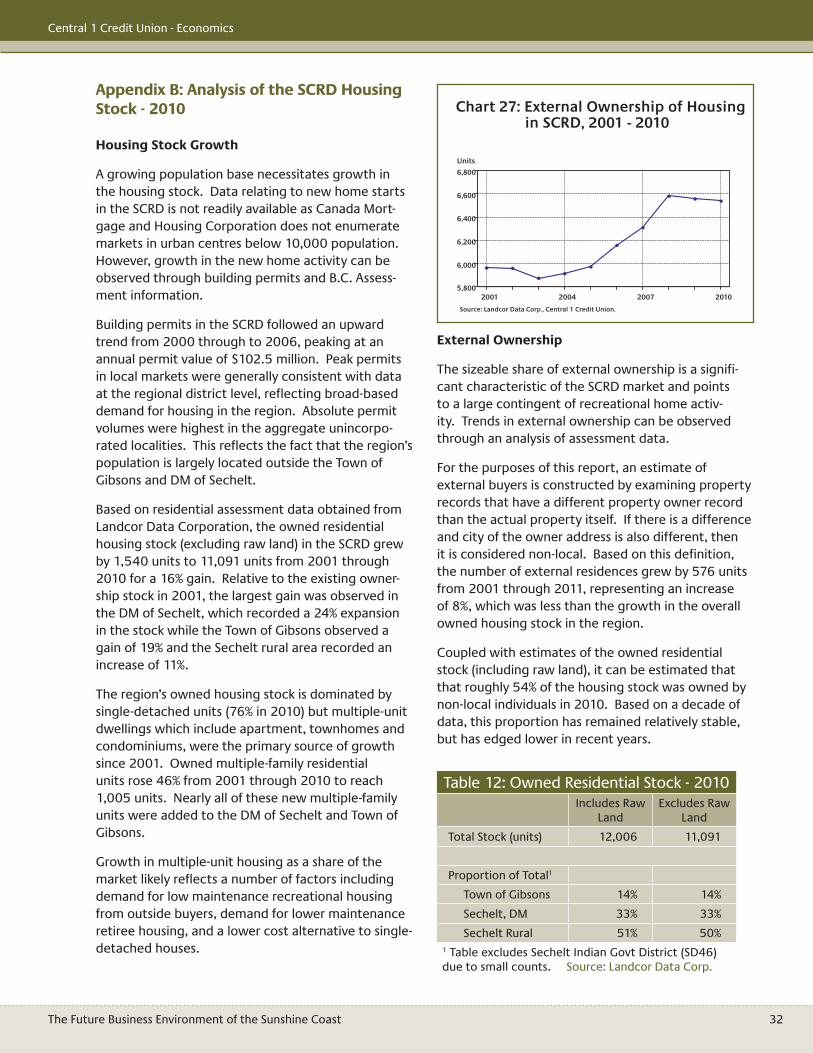
The Future Business Environment of the Sunshine Coast 32
Central 1 Credit Union - Economics
Appendix B: Analysis of the SCRD Housing Stock - 2010
Housing Stock Growth
A growing population base necessitates growth in the housing stock. Data relating to new home starts in the SCRD is not readily available as Canada Mort-gage and Housing Corporation does not enumerate markets in urban centres below 10,000 population. However, growth in the new home activity can be observed through building permits and B.C. Assess-ment information.
Building permits in the SCRD followed an upward trend from 2000 through to 2006, peaking at an annual permit value of $102.5 million. Peak permits in local markets were generally consistent with data at the regional district level, refl ecting broad-based demand for housing in the region. Absolute permit volumes were highest in the aggregate unincorpo-rated localities. This refl ects the fact that the region’s population is largely located outside the Town of Gibsons and DM of Sechelt.
Based on residential assessment data obtained from Landcor Data Corporation, the owned residential housing stock (excluding raw land) in the SCRD grew by 1,540 units to 11,091 units from 2001 through 2010 for a 16% gain. Relative to the existing owner-ship stock in 2001, the largest gain was observed in the DM of Sechelt, which recorded a 24% expansion in the stock while the Town of Gibsons observed a gain of 19% and the Sechelt rural area recorded an increase of 11%.
The region’s owned housing stock is dominated by single-detached units (76% in 2010) but multiple-unit dwellings which include apartment, townhomes and condominiums, were the primary source of growth since 2001. Owned multiple-family residential units rose 46% from 2001 through 2010 to reach 1,005 units. Nearly all of these new multiple-family units were added to the DM of Sechelt and Town of Gibsons.
Growth in multiple-unit housing as a share of the market likely refl ects a number of factors including demand for low maintenance recreational housing from outside buyers, demand for lower maintenance retiree housing, and a lower cost alternative to single-detached houses.
External Ownership
The sizeable share of external ownership is a signifi -cant characteristic of the SCRD market and points to a large contingent of recreational home activ-ity. Trends in external ownership can be observed through an analysis of assessment data.
For the purposes of this report, an estimate of external buyers is constructed by examining property records that have a different property owner record than the actual property itself. If there is a difference and city of the owner address is also different, then it is considered non-local. Based on this defi nition, the number of external residences grew by 576 units from 2001 through 2011, representing an increase of 8%, which was less than the growth in the overall owned housing stock in the region.
Coupled with estimates of the owned residential stock (including raw land), it can be estimated that that roughly 54% of the housing stock was owned by non-local individuals in 2010. Based on a decade of data, this proportion has remained relatively stable, but has edged lower in recent years.
2001 2004 2007 20105,800
6,000
6,200
6,400
6,600
6,800
Units
Source: Landcor Data Corp., Central 1 Credit Union.
Chart 27: External Ownership of Housing in SCRD, 2001 - 2010
Table 12: Owned Residential Stock - 2010Includes Raw
LandExcludes Raw
Land
Total Stock (units) 12,006 11,091
Proportion of Total1
Town of Gibsons 14% 14%
Sechelt, DM 33% 33%
Sechelt Rural 51% 50%1 Table excludes Sechelt Indian Govt District (SD46) due to small counts. Source: Landcor Data Corp.
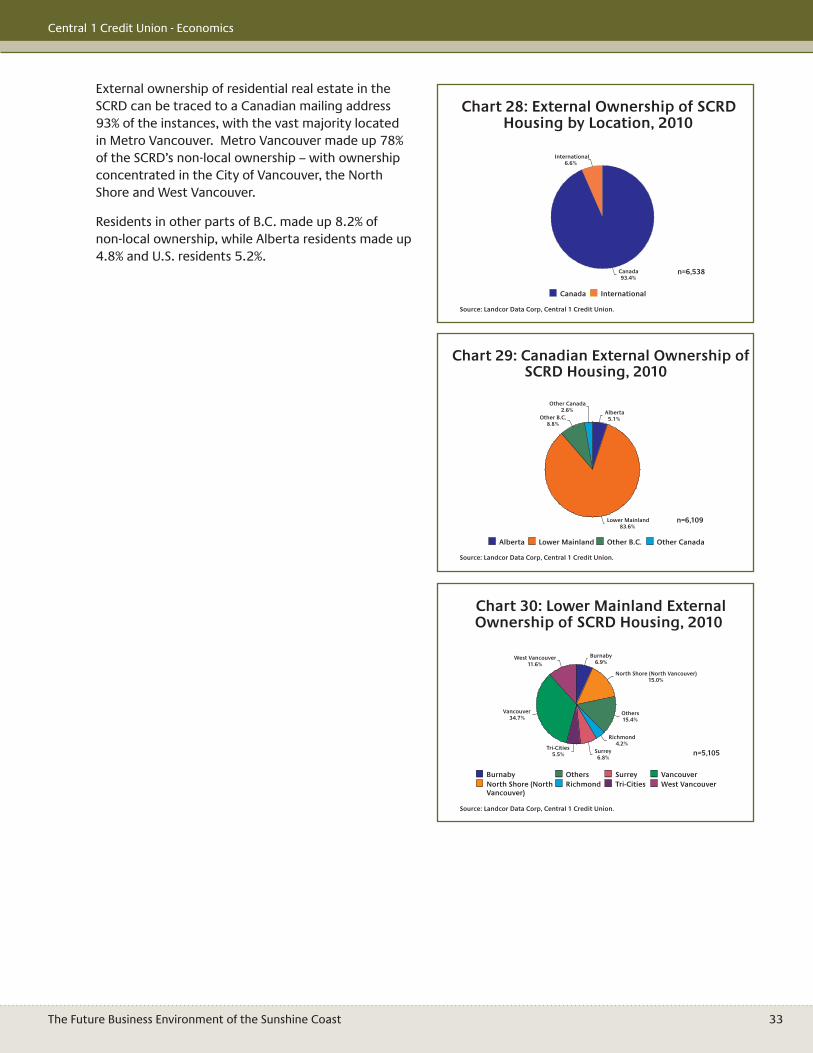
The Future Business Environment of the Sunshine Coast 33
Central 1 Credit Union - Economics
External ownership of residential real estate in the SCRD can be traced to a Canadian mailing address 93% of the instances, with the vast majority located in Metro Vancouver. Metro Vancouver made up 78% of the SCRD’s non-local ownership – with ownership concentrated in the City of Vancouver, the North Shore and West Vancouver.
Residents in other parts of B.C. made up 8.2% of non-local ownership, while Alberta residents made up 4.8% and U.S. residents 5.2%.
Canada 93.4%
International6.6%
Canada International
Source: Landcor Data Corp, Central 1 Credit Union.
Chart 28: External Ownership of SCRD Housing by Location, 2010
n=6,538
Alberta5.1%
Lower Mainland83.6%
Other B.C.8.8%
Other Canada2.6%
Alberta Lower Mainland Other B.C. Other Canada
Source: Landcor Data Corp, Central 1 Credit Union.
Chart 29: Canadian External Ownership of SCRD Housing, 2010
n=6,109
Burnaby6.9%
North Shore (North Vancouver)15.0%
Others15.4%
Richmond4.2%
Surrey6.8%
Tri-Cities5.5%
Vancouver34.7%
West Vancouver11.6%
BurnabyNorth Shore (NorthVancouver)
OthersRichmond
SurreyTri-Cities
VancouverWest Vancouver
Source: Landcor Data Corp, Central 1 Credit Union.
Chart 30: Lower Mainland External Ownership of SCRD Housing, 2010
n=5,105
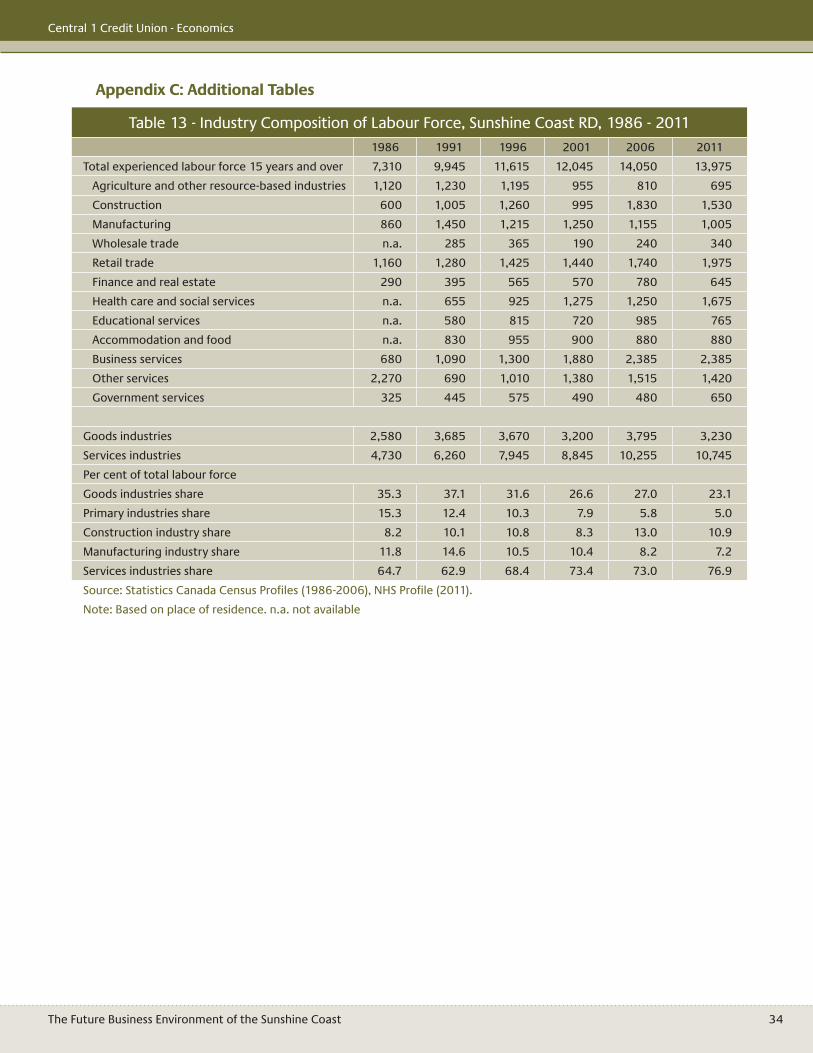
The Future Business Environment of the Sunshine Coast 34
Central 1 Credit Union - Economics
Table 13 - Industry Composition of Labour Force, Sunshine Coast RD, 1986 - 20111986 1991 1996 2001 2006 2011
Total experienced labour force 15 years and over 7,310 9,945 11,615 12,045 14,050 13,975
Agriculture and other resource-based industries 1,120 1,230 1,195 955 810 695
Construction 600 1,005 1,260 995 1,830 1,530
Manufacturing 860 1,450 1,215 1,250 1,155 1,005
Wholesale trade n.a. 285 365 190 240 340
Retail trade 1,160 1,280 1,425 1,440 1,740 1,975
Finance and real estate 290 395 565 570 780 645
Health care and social services n.a. 655 925 1,275 1,250 1,675
Educational services n.a. 580 815 720 985 765
Accommodation and food n.a. 830 955 900 880 880
Business services 680 1,090 1,300 1,880 2,385 2,385
Other services 2,270 690 1,010 1,380 1,515 1,420
Government services 325 445 575 490 480 650
Goods industries 2,580 3,685 3,670 3,200 3,795 3,230
Services industries 4,730 6,260 7,945 8,845 10,255 10,745
Per cent of total labour force
Goods industries share 35.3 37.1 31.6 26.6 27.0 23.1
Primary industries share 15.3 12.4 10.3 7.9 5.8 5.0
Construction industry share 8.2 10.1 10.8 8.3 13.0 10.9
Manufacturing industry share 11.8 14.6 10.5 10.4 8.2 7.2
Services industries share 64.7 62.9 68.4 73.4 73.0 76.9
Source: Statistics Canada Census Profi les (1986-2006), NHS Profi le (2011).
Note: Based on place of residence. n.a. not available
Appendix C: Additional Tables
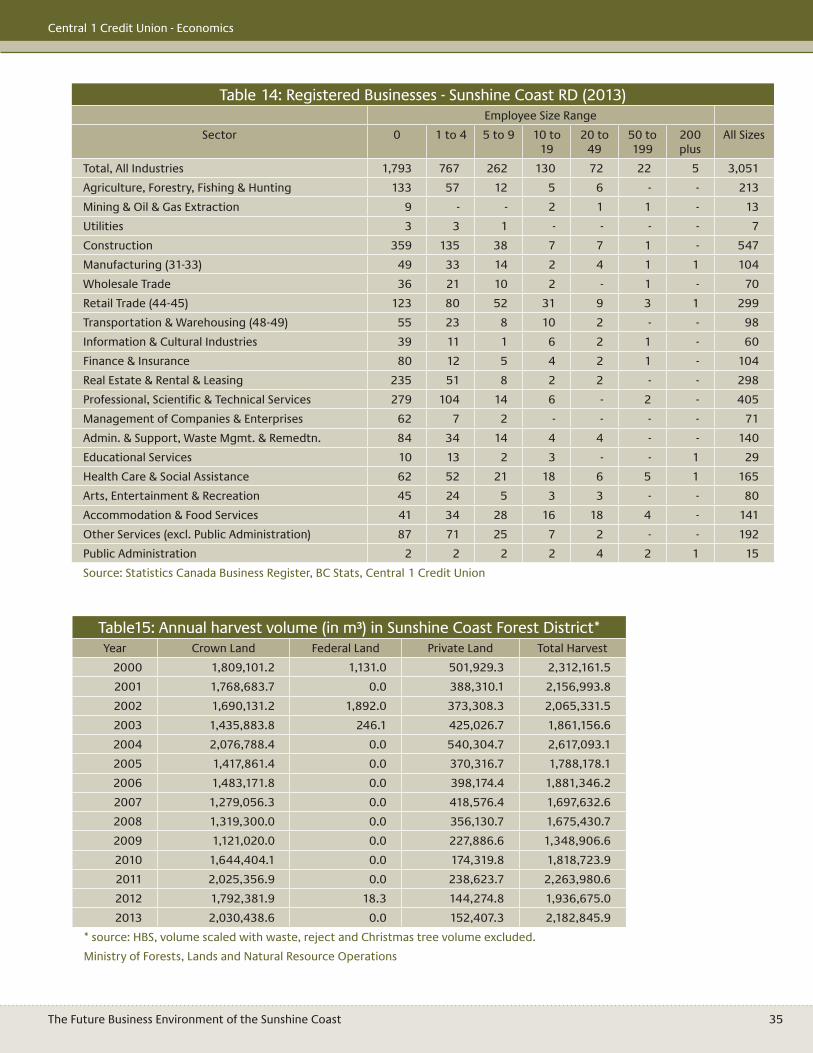
The Future Business Environment of the Sunshine Coast 35
Central 1 Credit Union - Economics
Table 14: Registered Businesses - Sunshine Coast RD (2013)Employee Size Range
Sector 0 1 to 4 5 to 9 10 to 19
20 to 49
50 to 199
200 plus
All Sizes
Total, All Industries 1,793 767 262 130 72 22 5 3,051
Agriculture, Forestry, Fishing & Hunting 133 57 12 5 6 - - 213
Mining & Oil & Gas Extraction 9 - - 2 1 1 - 13
Utilities 3 3 1 - - - - 7
Construction 359 135 38 7 7 1 - 547
Manufacturing (31-33) 49 33 14 2 4 1 1 104
Wholesale Trade 36 21 10 2 - 1 - 70
Retail Trade (44-45) 123 80 52 31 9 3 1 299
Transportation & Warehousing (48-49) 55 23 8 10 2 - - 98
Information & Cultural Industries 39 11 1 6 2 1 - 60
Finance & Insurance 80 12 5 4 2 1 - 104
Real Estate & Rental & Leasing 235 51 8 2 2 - - 298
Professional, Scientifi c & Technical Services 279 104 14 6 - 2 - 405
Management of Companies & Enterprises 62 7 2 - - - - 71
Admin. & Support, Waste Mgmt. & Remedtn. 84 34 14 4 4 - - 140
Educational Services 10 13 2 3 - - 1 29
Health Care & Social Assistance 62 52 21 18 6 5 1 165
Arts, Entertainment & Recreation 45 24 5 3 3 - - 80
Accommodation & Food Services 41 34 28 16 18 4 - 141
Other Services (excl. Public Administration) 87 71 25 7 2 - - 192
Public Administration 2 2 2 2 4 2 1 15
Source: Statistics Canada Business Register, BC Stats, Central 1 Credit Union
Table15: Annual harvest volume (in m³) in Sunshine Coast Forest District*Year Crown Land Federal Land Private Land Total Harvest
2000 1,809,101.2 1,131.0 501,929.3 2,312,161.5
2001 1,768,683.7 0.0 388,310.1 2,156,993.8
2002 1,690,131.2 1,892.0 373,308.3 2,065,331.5
2003 1,435,883.8 246.1 425,026.7 1,861,156.6
2004 2,076,788.4 0.0 540,304.7 2,617,093.1
2005 1,417,861.4 0.0 370,316.7 1,788,178.1
2006 1,483,171.8 0.0 398,174.4 1,881,346.2
2007 1,279,056.3 0.0 418,576.4 1,697,632.6
2008 1,319,300.0 0.0 356,130.7 1,675,430.7
2009 1,121,020.0 0.0 227,886.6 1,348,906.6
2010 1,644,404.1 0.0 174,319.8 1,818,723.9
2011 2,025,356.9 0.0 238,623.7 2,263,980.6
2012 1,792,381.9 18.3 144,274.8 1,936,675.0
2013 2,030,438.6 0.0 152,407.3 2,182,845.9
* source: HBS, volume scaled with waste, reject and Christmas tree volume excluded.
Ministry of Forests, Lands and Natural Resource Operations
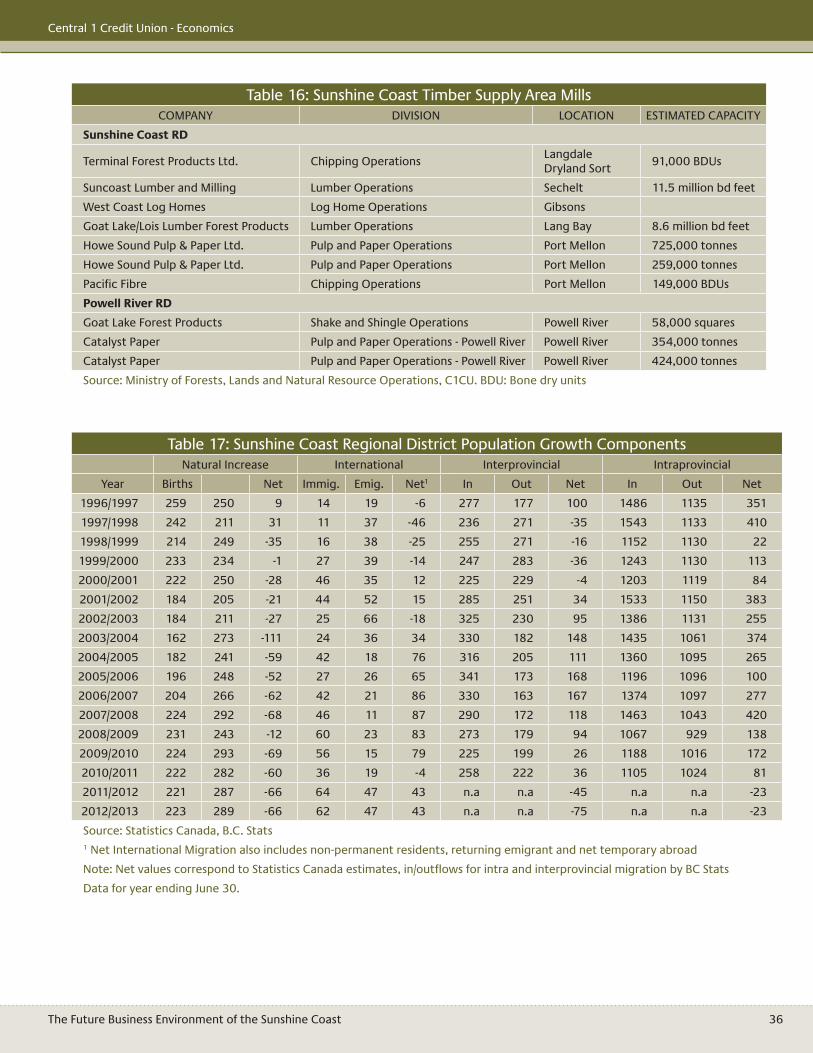
The Future Business Environment of the Sunshine Coast 36
Central 1 Credit Union - Economics
Table 16: Sunshine Coast Timber Supply Area MillsCOMPANY DIVISION LOCATION ESTIMATED CAPACITY
Sunshine Coast RD
Terminal Forest Products Ltd. Chipping OperationsLangdale Dryland Sort
91,000 BDUs
Suncoast Lumber and Milling Lumber Operations Sechelt 11.5 million bd feet
West Coast Log Homes Log Home Operations Gibsons
Goat Lake/Lois Lumber Forest Products Lumber Operations Lang Bay 8.6 million bd feet
Howe Sound Pulp & Paper Ltd. Pulp and Paper Operations Port Mellon 725,000 tonnes
Howe Sound Pulp & Paper Ltd. Pulp and Paper Operations Port Mellon 259,000 tonnes
Pacifi c Fibre Chipping Operations Port Mellon 149,000 BDUs
Powell River RD
Goat Lake Forest Products Shake and Shingle Operations Powell River 58,000 squares
Catalyst Paper Pulp and Paper Operations - Powell River Powell River 354,000 tonnes
Catalyst Paper Pulp and Paper Operations - Powell River Powell River 424,000 tonnes
Source: Ministry of Forests, Lands and Natural Resource Operations, C1CU. BDU: Bone dry units
Table 17: Sunshine Coast Regional District Population Growth ComponentsNatural Increase International Interprovincial Intraprovincial
Year Births Net Immig. Emig. Net1 In Out Net In Out Net
1996/1997 259 250 9 14 19 -6 277 177 100 1486 1135 351
1997/1998 242 211 31 11 37 -46 236 271 -35 1543 1133 410
1998/1999 214 249 -35 16 38 -25 255 271 -16 1152 1130 22
1999/2000 233 234 -1 27 39 -14 247 283 -36 1243 1130 113
2000/2001 222 250 -28 46 35 12 225 229 -4 1203 1119 84
2001/2002 184 205 -21 44 52 15 285 251 34 1533 1150 383
2002/2003 184 211 -27 25 66 -18 325 230 95 1386 1131 255
2003/2004 162 273 -111 24 36 34 330 182 148 1435 1061 374
2004/2005 182 241 -59 42 18 76 316 205 111 1360 1095 265
2005/2006 196 248 -52 27 26 65 341 173 168 1196 1096 100
2006/2007 204 266 -62 42 21 86 330 163 167 1374 1097 277
2007/2008 224 292 -68 46 11 87 290 172 118 1463 1043 420
2008/2009 231 243 -12 60 23 83 273 179 94 1067 929 138
2009/2010 224 293 -69 56 15 79 225 199 26 1188 1016 172
2010/2011 222 282 -60 36 19 -4 258 222 36 1105 1024 81
2011/2012 221 287 -66 64 47 43 n.a n.a -45 n.a n.a -23
2012/2013 223 289 -66 62 47 43 n.a n.a -75 n.a n.a -23
Source: Statistics Canada, B.C. Stats1 Net International Migration also includes non-permanent residents, returning emigrant and net temporary abroad
Note: Net values correspond to Statistics Canada estimates, in/outfl ows for intra and interprovincial migration by BC Stats
Data for year ending June 30.
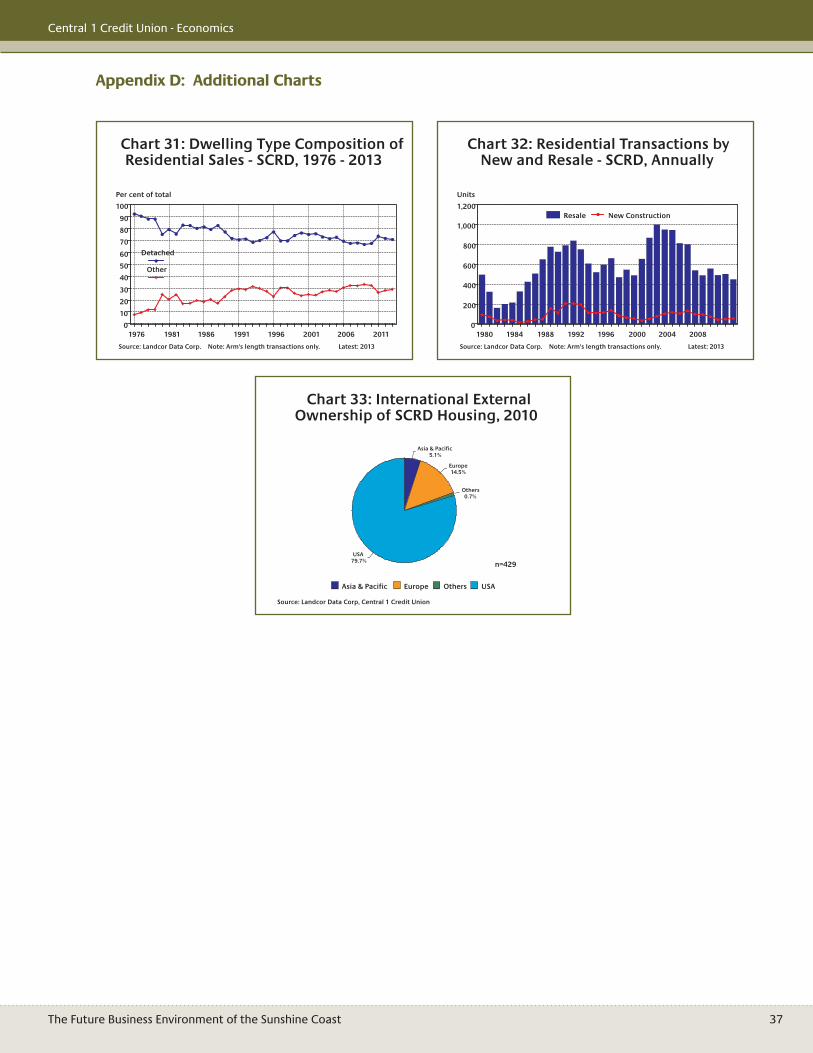
The Future Business Environment of the Sunshine Coast 37
Central 1 Credit Union - Economics
Appendix D: Additional Charts
1976 1981 1986 1991 1996 2001 2006 20110
10
20
30
40
50
60
70
80
90
100
Per cent of total
Detached
Other
Source: Landcor Data Corp. Note: Arm's length transactions only. Latest: 2013
Chart 31: Dwelling Type Composition of Residential Sales - SCRD, 1976 - 2013
1980 1984 1988 1992 1996 2000 2004 20080
200
400
600
800
1,000
1,200
Units
Resale New Construction
Source: Landcor Data Corp. Note: Arm's length transactions only. Latest: 2013
Chart 32: Residential Transactions by New and Resale - SCRD, Annually
Asia & Pacific5.1%
Europe14.5%
Others0.7%
USA79.7%
Asia & Pacific Europe Others USA
Source: Landcor Data Corp, Central 1 Credit Union
Chart 33: International External Ownership of SCRD Housing, 2010
n=429