Embed Size (px)
Citation preview

SRI annual meeting
13 November 2015

Forward-looking statements - cautionary statement
The presentations and the associated slides and discussion contain certain forecasts, projections and forward-looking statements – that is, statements related to future, not past events – with
respect to the financial condition, results of operation and businesses of BP and certain of the plans and objectives of BP with respect to these items. In particular, among other statements, certain
statements regarding future focus on safety and efficiency in operations; with respect to the financial condition, results of operations and business of BP and certain of the expectations, intentions,
plans and objectives of BP with respect to these items, in particular statements regarding future global energy trends and oil price, expectations regarding the settlement of certain claims in the
Gulf of Mexico litigation; BP’s plans and expectations regarding the 'BP Proposition', active portfolio management, future portfolio resilience and the effects of future and current technologies on
BP’s portfolio; expectations regarding BP’s plans to rebalance the financial framework and the future growth of organic free cash flow; plans and expectations regarding the Upstream major project
pipeline and an increasing bias to gas; expectations regarding divestments and the prospects for, expected timing, locations, composition and future production of major projects and growth; plans
and expectations regarding BP’s ability to sustain its dividend, growth of shareholder distributions over the long-term and expected gearing levels; BP’s expectations in respect of future global
demographic and economic trends, expectations regarding future trends in global energy demand and expectations regarding future contributions to global supply from different energy sources;
levels of emissions and temperature, as well as improvements in engine efficiency, and the effect of a carbon price, are all forward looking in nature.
By their nature, forward-looking statements involve risk and uncertainty because they relate to events and depend on circumstances that will or may occur in the future and are outside the control
of BP. Actual results may differ materially from those expressed in such statements, depending on a variety of factors, including the timing of the receipt of relevant third party and/or regulatory
approvals; the timing and level of maintenance and/or turnaround activity; the timing and volume of refinery additions and outages; the timing of bringing new fields onstream; the timing, quantum
and nature of certain divestments; future levels of industry product supply, demand and pricing, including supply growth in North America; OPEC quota restrictions; PSA effects; operational
problems; economic and financial market conditions generally or in various countries and regions; political stability in relevant areas of the world; changes in laws and governmental regulations;
changes in sanctions and other trade restrictions; regulatory or legal actions including the types of enforcement action pursued and the nature of remedies sought or imposed; the actions of
prosecutors, regulatory authorities and courts; the impact on our reputation following the Gulf of Mexico oil spill; the actions of the Claims Administrator appointed under the Economic and Property
Damages Settlement; the actions of all parties to the Gulf of Mexico oil spill-related litigation at various phases of the litigation; exchange rate fluctuations; development and use of new technology;
the success or otherwise of partnering; the actions of competitors, trading partners, creditors, rating agencies and others; decisions by Rosneft’s management and board of directors in respect of
strategy, operations or otherwise; the actions of contractors; natural disasters and adverse weather conditions; changes in public expectations and other changes to business conditions; wars and
acts of terrorism, cyber-attacks or sabotage; and other factors discussed under “Principal risks and uncertainties” in BP’s Stock Exchange Announcement for the period ended 30 June 2015 and
under “Risk factors” in our Annual Report and Form 20-F 2014 as filed with the US Securities and Exchange Commission (SEC).
Cautionary note to US investors – This presentation contains references to non-proved resources and production outlooks based on non-proved resources that the SEC’s rules prohibit us from
including in our filings with the SEC. U.S. investors are urged to consider closely the disclosures in our Form 20-F, SEC File No. 1-06262. This form is available on our website at www.bp.com. You
can also obtain this form from the SEC by calling 1-800-SEC-0330 or by logging on to their website at www.sec.gov.
Tables and projections in this presentation are BP projections unless otherwise stated.
Stock Exchange Announcement: For further information on BP’s results, please see our Stock Exchange Announcement for the period ended 30 September 2015.
November 2015
Cautionary statement

Carl-Henric Svanberg
Chairman
Board context
Dev Sanyal
Executive vice president, strategy and
regions
Industry context and our
priorities

5
• Context for the sector and BP
• Managing operational risk
• Shareholder resolution 25 - our response
• Operating performance
Agenda

5
10
15
20
25
30
35
Current context
6
(1) Source: Thomson Reuters Datastream
(2) Refining Marker Margin based on BP’s portfolio
Brent(1)
$/b
bl
Henry Hub(1)
Refining Marker Margin(2)
$/b
bl
2013 2014
$/m
mb
tu
2015 2014 2015 2013 2014 2015 2013 1
2
3
5
4
6
7
8
20
40
60
100
80
120

The longer term view $/b
bl
7
Money of the day

0
3
6
9
12
15
18
1965 2000 2035
Th
ou
san
ds
OECD
Other
Non-OECD
Asia
0%
10%
20%
30%
40%
50%
1965 2000 2035
0
60
120
180
240
1965 2000 2035
GDP and energy demand growth
8
*Includes biofuels
Shares of primary energy
Oil
Coal
Gas
Hydro
Nuclear Renewables*
Billion toe
Energy consumption by region
Trillion, $2011 PPP
GDP
OECD
Other
Non-
OECD
Asia

Our strategic principles
• Safe and efficient
operations
• Capital and cost
discipline
• Resilience, focused on
value over volume
• Competitive growth
• A focused technology
programme
• Relationships of
mutual advantage
9

1. Capex of $17-19bn per annum over 2015-17
2. Cash costs reduced by over $6bn by 2017 versus
2014
3. Balance organic sources and uses of cash(1)
at
~$60/bbl by 2017; organic free cash flow growth
thereafter
4. Divestments of $9-10bn 2014-15; $3-5bn 2016;
$2-3bn 2017+
5. Gearing managed with flexibility around 20%
6. Commitment to sustaining the dividend
10
Our proposition
(1) Excludes Deepwater Horizon (DWH) payments, includes 100% of dividend.
Organic free cashflow = Operating cash flow excluding DWH payments less organic capex.
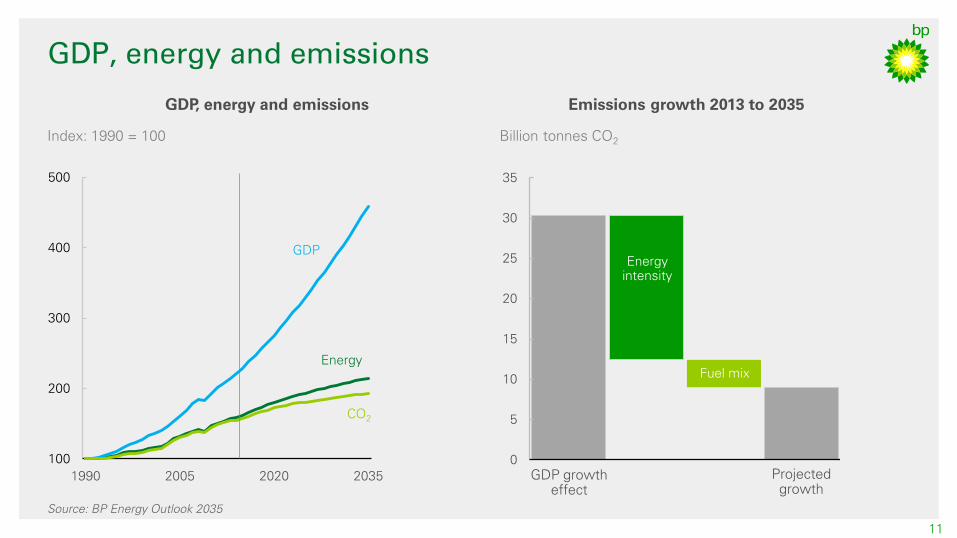
GDP, energy and emissions
11
GDP, energy and emissions Emissions growth 2013 to 2035
Billion tonnes CO2
0
5
10
15
20
25
30
35
GDP growth
effect
Projected
growth
Energy
intensity
Fuel mix
Index: 1990 = 100
100
200
300
400
500
1990 2005 2020 2035
CO2
Energy
GDP
Source: BP Energy Outlook 2035

Partnership
12

Bob Fryar
Executive vice president, safety and
operational risk
Managing operational risk

A safer, stronger BP
BP’s agenda is a multi-year programme with activities risk-prioritized and paced to achieve
enduring and sustainable change. Three principles underpin our efforts:
14
Our goals on safety remains the same:
no accidents, no harm to people and no damage to the environment
To promote deep
capability and a safe
operating culture
Our operating
management system
(OMS) is the way BP
operates
We test our conduct of
operating through self
verification, independent
assurance and audit.

Risk mitigation
15
Mitigation barriers Prevention barriers
Reputation
impact
Toxic release
Environmental
release
Fire or explosion
Financial loss
Corrosion
Erosion
Mechanical
failure
Breaking
containment
Start-up / shut-
down operations
External impact
Operating outside an
operating envelope
Fatigue
Possible causes
Hydrocarbons
LOPC from
onshore process
facility
Possible
consequences
1
2
3
Plant shut down
Leak containment
Spill response
1 2 3
1 2 3
1
2
3 Corrosion prevention
Material protection
Maintain mechanical
integrity
Maintain mechanical
integrity 2
2
LOPC – Loss of primary containment

Risk mitigation
16
Prevention barriers
1 2 3
2 Maintain mechanical integrity 2
2
Routine maintenance on process equipment
(e.g. Rotating Machinery)
Vibration and fatigue assessments of pipework
Cathodic protection surveys
External hull inspection (FPSO)
Visual inspection walk-downs
Inspection pipeline pigging
Maintenance pipeline pigging
Subsea ROV inspection
Advanced non intrusive inspection
Internal vessel inspection
FPSO – Floating production, storage and offloading ROV – Remotely operated vehicle

Safety and environmental performance
Number of Tier 1 & Tier 2 process safety events (T1 &T2 PSE) Number of losses of primary containment (LOPC)
Recordable injury frequency (RIF) Number of oil spills ≥ 1 Barrel
17
• Year on year performance
• Underpinned by our three
principles
• 25 Bly recommendations
complete
• Safety is good business
18
In summary

SRI annual meeting
13 November 2015
Qs and As

SRI annual meeting
13 November 2015

21
Dev Sanyal
Executive vice president, strategy and
regions
Shareholder resolution
Shareholder resolution 25 – our response
22
• The energy transition
• Resolution response
− Emissions
− Portfolio resilience
− Public policy
− Technology and low carbon R&D

23
The energy transition – our point of view
1,700
700
400
Potential CO2 emissions from known
fossil fuel reserves (Gigatonnes)
Oil Gas Coal
Pragmatic action
needed
Access to
affordable and
secure energy
Multiple actors,
multiple actions
Production v
demand
Coal economy v
gas economy
IOCs and NOCs
BP Sustainability Report

24
Dominic Emery
VP long term planning and policy
David Eyton
Group head of technology
BP’s response

Emissions – reporting
25
Direct CO2e by segment
• Upstream
• Downstream
• Other business and corporate (OB&C),
including shipping and alternative
energies
Direct CO2e by GHG type
• CO2
• Methane
0
10
20
30
40
50
60
70
2010 2011 2012 2013 2014
Mte C
O2e
OB&C
Upstream
Downstream
Direct GHG emissions by source
0
10
20
30
40
50
60
70
2010 2011 2012 2013 2014
Mte C
O2e
Methane
CO2
Mte CO2e= Million tonnes CO
2 equivalent
Direct GHG emissions by segment
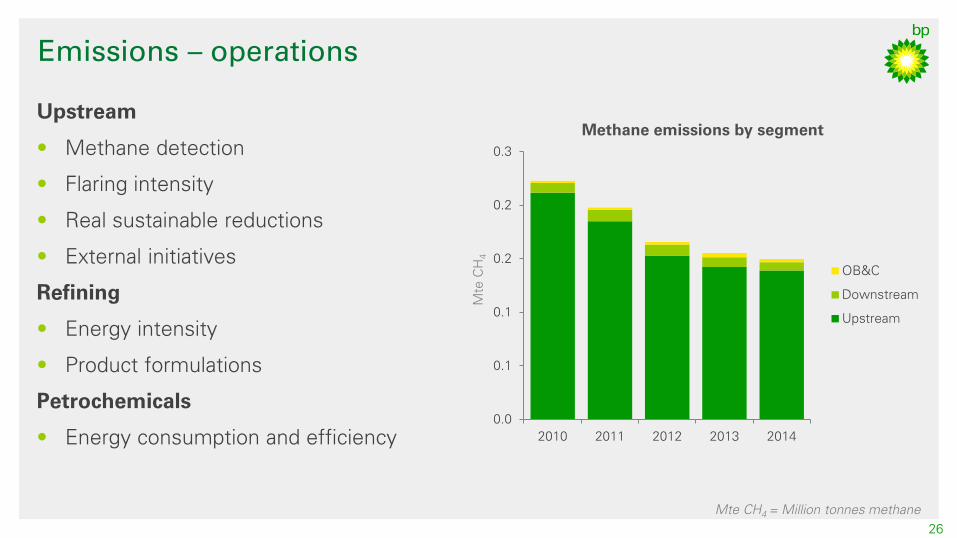
Emissions – operations
26
0.0
0.1
0.1
0.2
0.2
0.3
2010 2011 2012 2013 2014
Mte C
H4
OB&C
Downstream
Upstream
Methane emissions by segment
Mte CH4
= Million tonnes methane
Upstream
• Methane detection
• Flaring intensity
• Real sustainable reductions
• External initiatives
Refining
• Energy intensity
• Product formulations
Petrochemicals
• Energy consumption and efficiency

Emissions – products
27
Lubricants
• 5.2 million tonnes of CO2 avoided using
in the last ten years
Advanced fuels
• New Ultimate fuels range launched in Spain
this year
• Up to 56km / tank better for diesel
• Up to 44km / tank better for gasoline
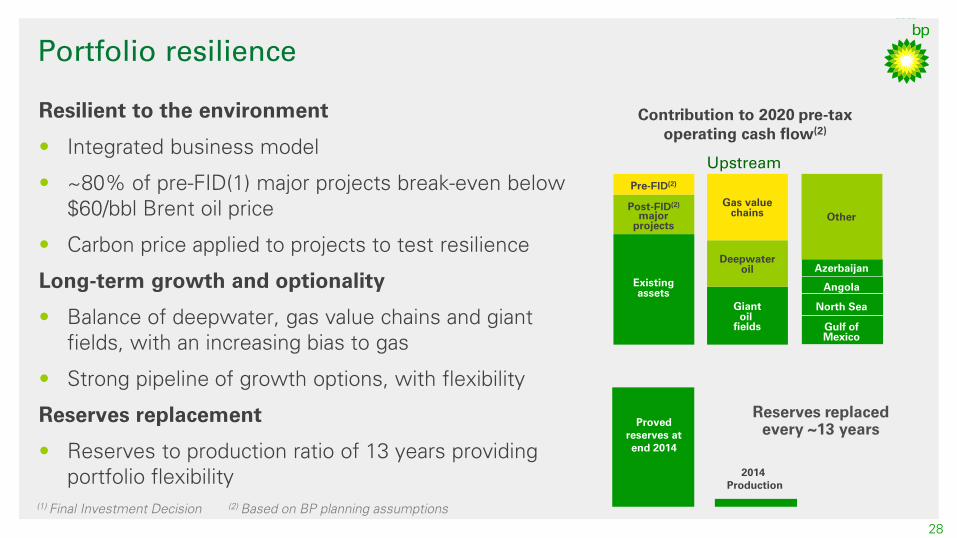
Portfolio resilience
Resilient to the environment
• Integrated business model
• ~80% of pre-FID(1) major projects break-even below
$60/bbl Brent oil price
• Carbon price applied to projects to test resilience
Long-term growth and optionality
• Balance of deepwater, gas value chains and giant
fields, with an increasing bias to gas
• Strong pipeline of growth options, with flexibility
Reserves replacement
• Reserves to production ratio of 13 years providing
portfolio flexibility
Contribution to 2020 pre-tax
operating cash flow(2)
Existing
assets
Post-FID(2)
major
projects
Pre-FID(2)
Giant
oil
fields
Deepwater
oil
Gas value
chains
Angola
North Sea
Azerbaijan
Gulf of
Mexico
Other
(1) Final Investment Decision
(2) Based on BP planning assumptions
Upstream
Proved
reserves at
end 2014
2014
Production
Reserves replaced
every ~13 years
28
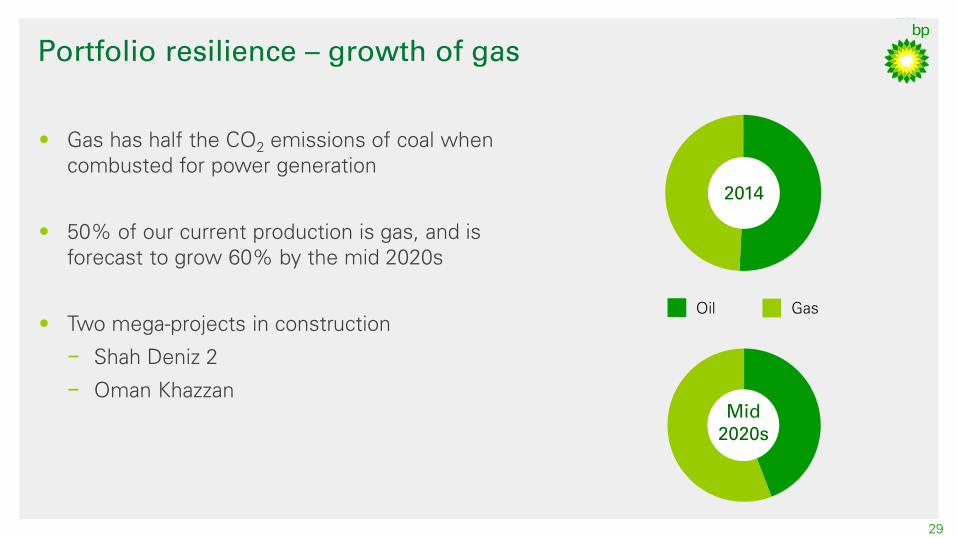
Portfolio resilience – growth of gas
29
• Gas has half the CO2 emissions of coal when
combusted for power generation
• 50% of our current production is gas, and is
forecast to grow 60% by the mid 2020s
• Two mega-projects in construction
− Shah Deniz 2
− Oman Khazzan
Mid
2020s
2014
Gas Oil

Portfolio resilience – major gas projects
30
Shah Deniz 2
• 40TCF, giant resource base
• Pipelines to Europe through 7
countries
• Project under construction
• Gas to Turkey in 2018; to Europe
in 2020
Oman Khazzan
• 100TCF, giant resource base
• 7TCF first phase of development
• 2017 first gas for growing domestic market
• ~300 wells
• Designed to minimise methane leakage
TCF = Trillion cubic feet

Portfolio resilience – renewables businesses
31
• The largest operated renewable business of
supermajors
• ~3 million tonnes avoided CO2 in 2014
Brazilian biofuels: 3 mills, 643 million litres production
• Growing domestic ethanol market
• Cost-advantaged and robust at $45 – 50/bbl
US wind: 16 farms, 4,700 GWh production
• Consistent operational performance
• Power purchase agreements resilient to oil and gas
prices
GWh = Gigawatt hours

Portfolio resilience – asset classes
Source: BP Technology Outlook
Technology
• Grows recoverable volumes
• Reduces cost of supply
• Changes rank
Carbon price
• Increases cost of supply
• Price impact varies by asset class
• Changes rank
32
2012 2050
$80/t carbon price
Deepwater
Ultra-deepwater Onshore extra heavy Shale oil
Onshore heavy Shallow water
Oil sands
Onshore
Tight oil Oil shale
Technically recoverable volume (boe)
Co
st p
er b
arre
l o
f o
il e
qu
ivale
nt ($
/b
oe
)
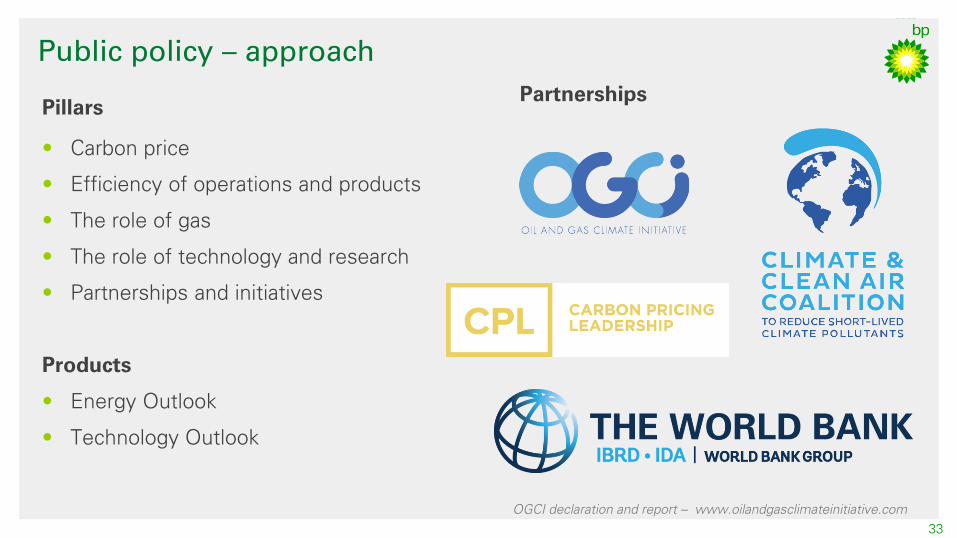
Public policy – approach
33
Pillars
• Carbon price
• Efficiency of operations and products
• The role of gas
• The role of technology and research
• Partnerships and initiatives
Products
• Energy Outlook
• Technology Outlook
Partnerships
OGCI declaration and report – www.oilandgasclimateinitiative.com

Technology – approach
34
• R&D spend of $663m in
2014
• Leading technologies in
− Upstream – seismic
imaging and enhanced
oil recovery
− Downstream –
petrochemicals and
formulated products
• Efficiency of extraction
and conversion
• Low carbon options
Competitor
range
BP
Reported R&D/
capital employed
0
0.2
0.4
0.6
0.8
1.0
1.2
1.4
1.6
2003 2004 2005 2006 2007 2008 2009 2010 2011 2012 2013 2014
1.8
%

Technology – venturing
35
Our venture portfolio
• 38 investments
• Supporting efficiency of
core oil and gas
• Insights into
renewables and
alternatives
• ~1000 opportunities
screened annually
Oil and gas
Renewables & alternatives
Heliex Power – Screw expander that recovers energy from
wet steam or two phase fluids to generate electricity
Biosynthetic Technologies – creates “biosynthetic” oils
from plant fatty acids used in lubricants, speciality
chemicals, and cosmetics
Liquid Light – develops technology that allows efficient
conversions of carbon dioxide to a wide variety of
chemicals, fuels and other compounds
Fo-Tech – Fiber optic Distribution Acoustic Sensing for
monitoring pipelines and downhole operations: fracture
monitoring, production logging and leak detection
Solidia Technologies – developing next generation
building materials that consume, not generate carbon
dioxide in the production process
Skyonic – converts carbon dioxide emissions to solids for
long-term storage

36
Technology – university & public-private partnerships
Energy Biosciences Institute
Energy Sustainability Challenge
BP Institute of Multiphase Flow
BP International Centre for Advanced Materials
Carbon Mitigation Initiative

Technology Outlook – key messages
37
• Energy resources are plentiful
• The power sector offers greatest scope for reducing emissions
• Transport is set to become more fuel efficient
• Some emerging technologies could prove disruptive
BP Technology Outlook – www.bp.com/technology

Bernard Looney
Chief operating officer, production
Operating safely, responsibly
and efficiently

Operating performance
• Latest metrics
• Performance in action
• Looking to the future
Environmental performance
• Flaring reduction
• Methane emission reduction
• Building for the future
39
Agenda
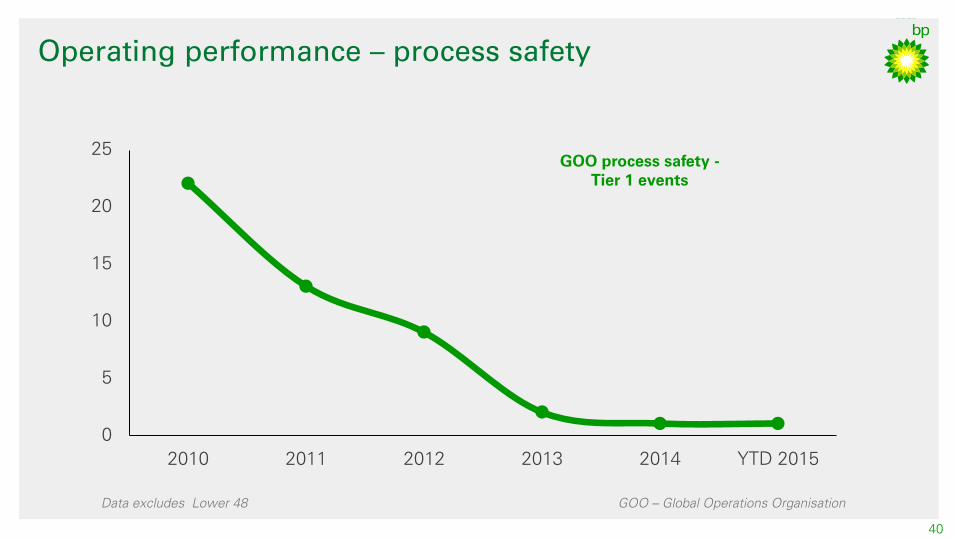
Operating performance – process safety
Data excludes Lower 48
0
5
10
15
20
25
2010 2011 2012 2013 2014 YTD 2015
GOO process safety -
Tier 1 events
40
GOO – Global Operations Organisation

Operating performance – LOPCs
0
20
40
60
80
100
2010 2011 2012 2013 2014 3Q 2015
GOO loss of primary
containment events (A-G)
41
Data excludes Lower 48

Operating performance – plant reliability
42
80%
85%
90%
95%
0
5
10
15
20
25
2010 2011 2012 2013 2014 YTD 2015
Upstream operated
plant reliability
GOO process safety -
tier 1 events
Data excludes Lower 48

Operating performance – today’s technology

Equipment reliability &
availability monitoring
Operating envelope
monitoring Advanced condition
monitoring
Plant operations advisor
Operating performance – the future

Flaring reduction - Azerbaijan

46
Methane reduction – leak detection and repair programme

Building for the future - Oman Khazzan

SRI annual meeting
13 November 2015
Qs and As

49 49
SRI annual meeting
13 November 2015