Embed Size (px)
Citation preview
Upstream SpotlightUnlocking Permian value
This presentation contains forward-looking statements made in our public March 7, 2018 Analyst Meeting presentation, which is separately available on our website. All forward-looking statements included in this presentation and the assumptions made in developing these forward-looking statements speak only as of the date of their original presentation unless specifically noted herein. Inclusion of such forward-looking statements in this material does not represent an update or confirmation of such statements or their assumptions as of any later date.
Clinton, October 2, 2018
Neil ChapmanSenior Vice President, Exxon Mobil Corporation
2ExxonMobil Upstream Permian Spotlight
Cautionary statementForward-Looking Statements. Outlooks, projections, estimates, goals, descriptions of business plans and objectives, market expectations and other statements of future events or conditions in this presentation or the subsequent discussion period are forward-looking statements. Actual future results, including future earnings and other areas of financial and operating performance; demand growth and energy mix; ExxonMobil’s production growth, volumes, development and mix; the amount and mix of capital expenditures; proved and other reserves; reserve and resource additions and recoveries; project plans, completion dates, timing, costs, and capacities; efficiency gains; operating costs and cost savings; integration benefits; product sales and mix; production rates and capacities; and the impact of technology could differ materially due to a number of factors. These include changes in oil or gas demand, supply, prices or other market conditions affecting the oil and gas industries; reservoir performance; timely completion of exploration and development projects; access to adequate and cost-efficient product transportation, war and other political or security disturbances; changes in law, tariffs, taxes or other government regulation, including environmental regulations, taxes, and political sanctions; the outcome of commercial negotiations; the actions of competitors and customers; unexpected technological developments; general economic conditions, including the occurrence and duration of economic recessions; unforeseen technical difficulties; and other factors discussed here, in Item 1A. Risk Factors in our Form 10-K for the year ended December 31, 2017 and under the heading "Factors Affecting Future Results" in the Investorssection of our website at www.exxonmobil.com. The forward-looking statements in this presentation regarding future earnings are based on good faith market projections as of February 2, 2018 included in our Energy Outlook and management’s good faith plans and objectives as of the Company’s March 7, 2018 Analyst Meeting and will only be updated or reaffirmed by a future public disclosure. We assume no duty to update these statements or any other forward-looking statements as of any future date and neither future distribution of this material nor the continued availability of this material in archive form on our website should be deemed to constitute an update or re-affirmation of these figures as of any future date.
Supplemental Information. See the Supplemental Information included on pages 48 through 50 of this presentation for additional important information concerning definitions and assumptions regarding the forward-looking statements included in this presentation, including illustrative assumptions regarding future crude demand and supply; reconciliations and other information required by Regulation G with respect to non-GAAP measures used in this presentation including earnings excluding effects of tax reform and impairments; and definitions and additional information on other terms used including returns and resources.
3ExxonMobil Upstream Permian Spotlight
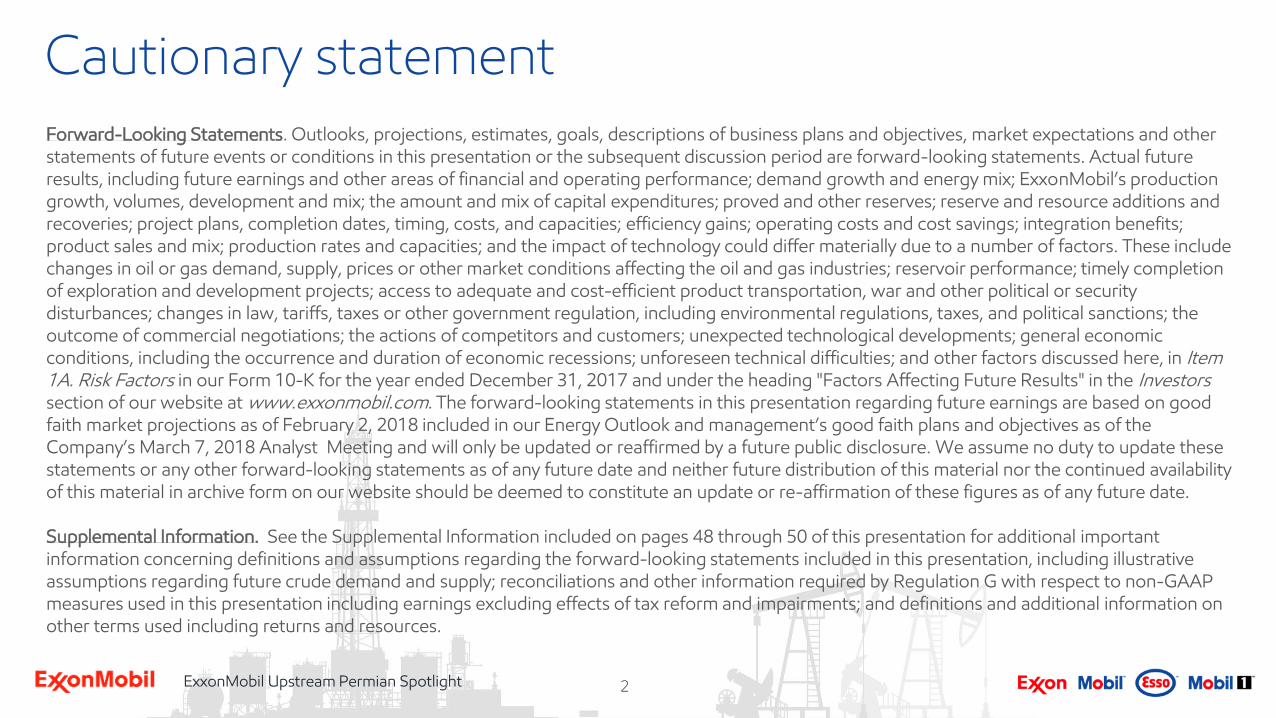
Agenda
• Opening remarks - Neil Chapman, Senior Vice President, Exxon Mobil Corporation
• Permian overview – Sara Ortwein, President, XTO Energy
• Development capabilities – Staale Gjervik, Sr. Vice President, Permian Integrated Development
• Integration – Bryan Milton, President, Fuels & Lubricants
• Technology - Vijay Swarup, Vice President, Research and Development
4ExxonMobil Upstream Permian Spotlight
75
100
125
150
175
2016 204075
100
125
150
175
2016 2040
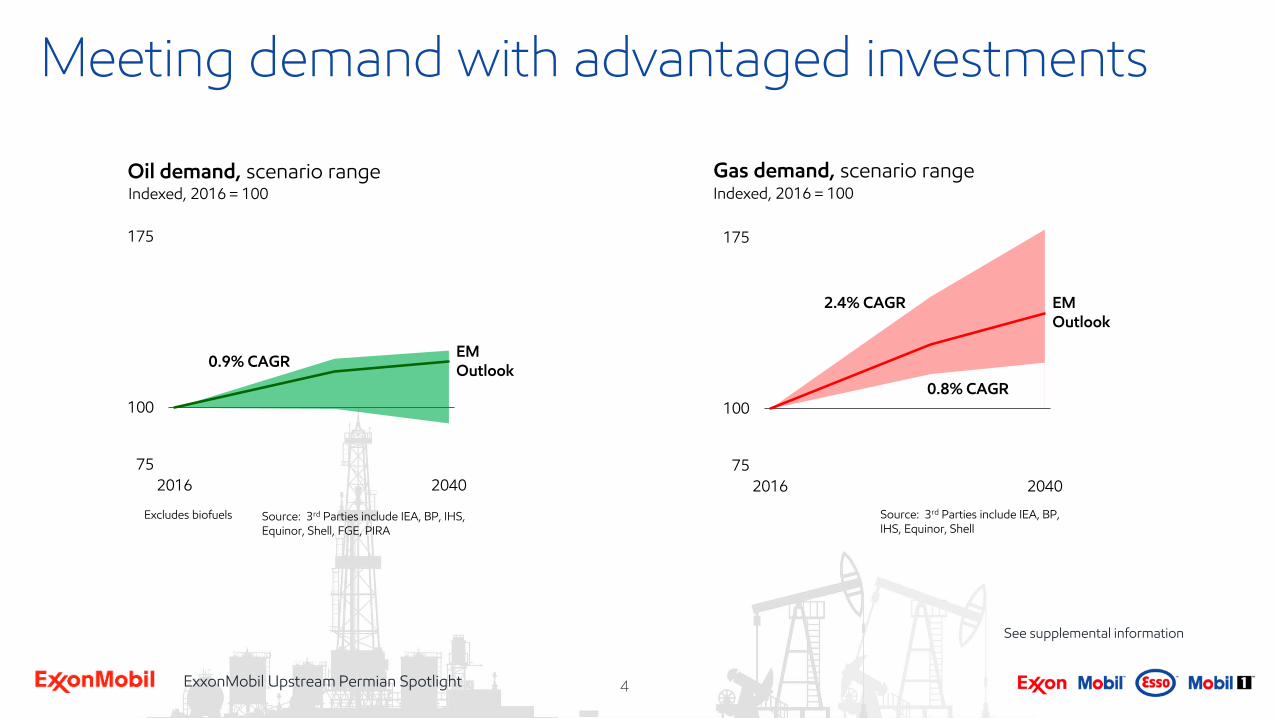
Oil demand, scenario rangeIndexed, 2016 = 100
EM Outlook
Source: 3rd Parties include IEA, BP, IHS, Equinor, Shell
Gas demand, scenario rangeIndexed, 2016 = 100
Source: 3rd Parties include IEA, BP, IHS, Equinor, Shell, FGE, PIRA
Excludes biofuels
EM Outlook
2.4% CAGR
0.8% CAGR
0.9% CAGR
Meeting demand with advantaged investments
See supplemental information
5ExxonMobil Upstream Permian Spotlight
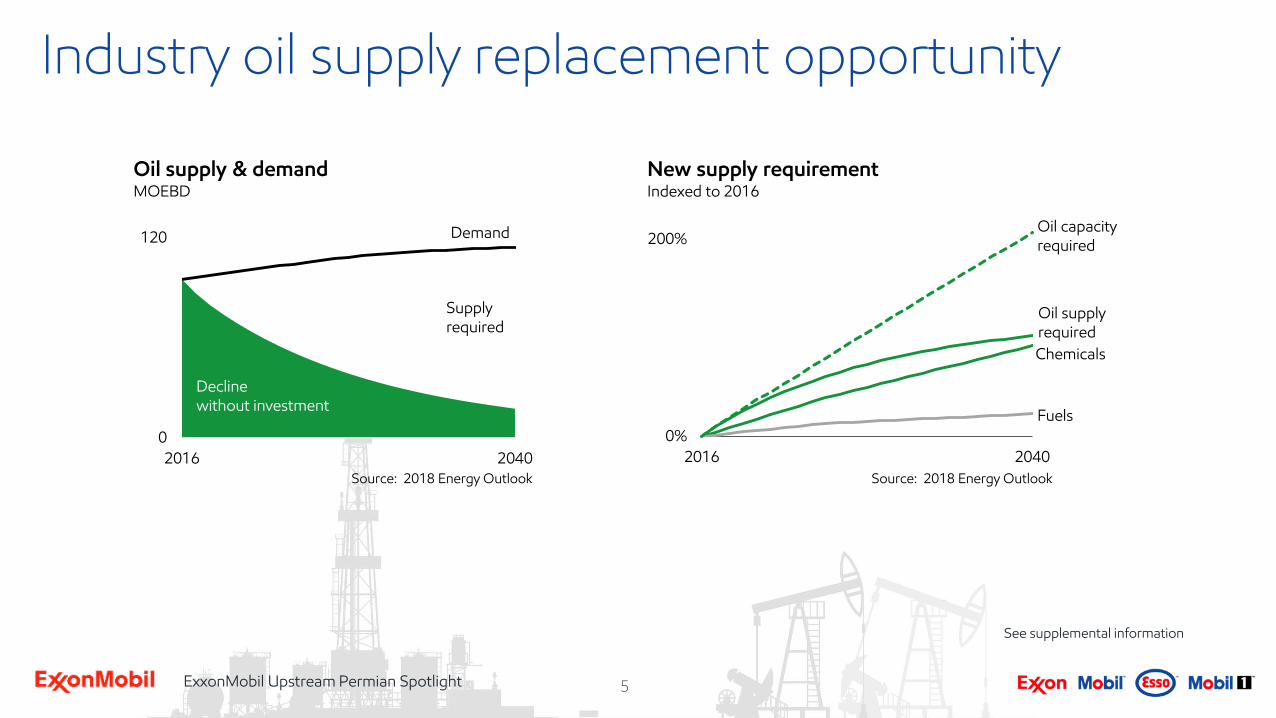
Industry oil supply replacement opportunity
New supply requirementIndexed to 2016
0
120
2016 2040
Oil supply & demandMOEBD
Demand
Supplyrequired
Decline without investment
Oil capacity required
Chemicals
Fuels
Oil supply required
Source: 2018 Energy Outlook
0%
200%
2016 2040
See supplemental information
Source: 2018 Energy Outlook
6ExxonMobil Upstream Permian Spotlight
Winning in the Upstream
• Strength of portfolio
• Project execution
• Operations excellence
• Technology
7ExxonMobil Upstream Permian Spotlight
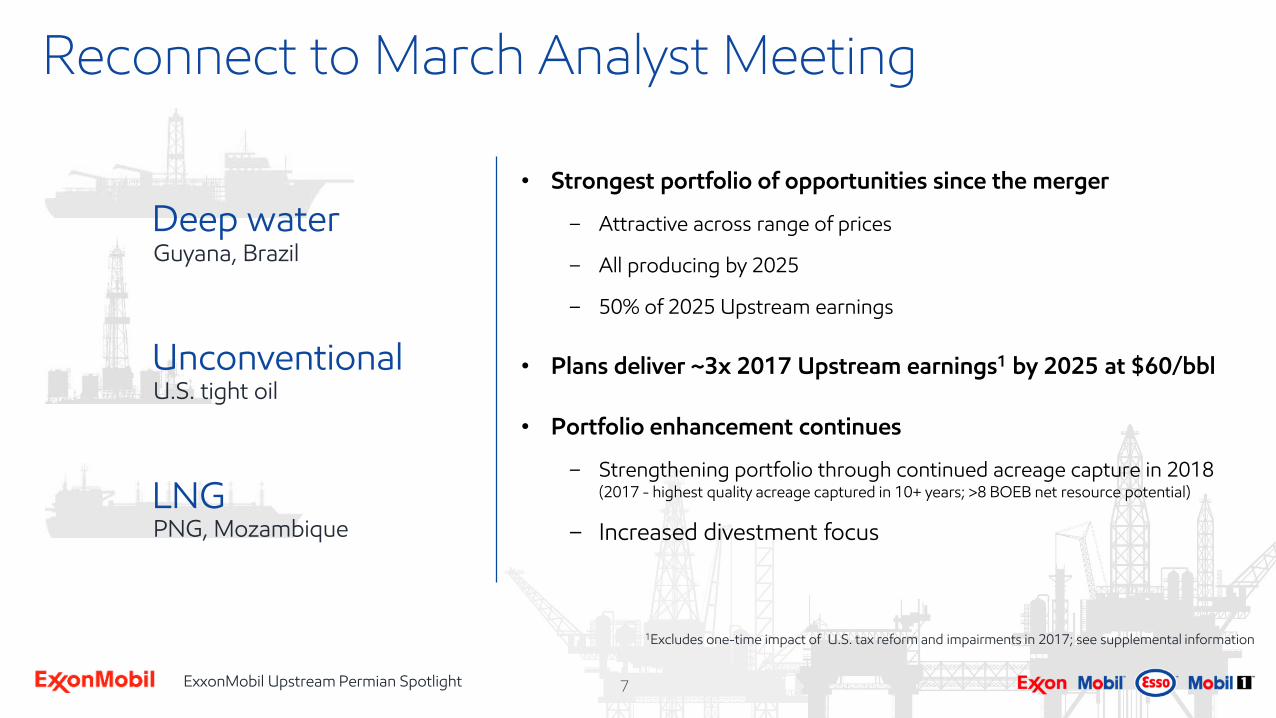
Reconnect to March Analyst Meeting
LNG
Guyana, Brazil
Deep water
UnconventionalU.S. tight oil
PNG, Mozambique
• Strongest portfolio of opportunities since the merger
− Attractive across range of prices
− All producing by 2025
− 50% of 2025 Upstream earnings
• Plans deliver ~3x 2017 Upstream earnings1 by 2025 at $60/bbl
• Portfolio enhancement continues
− Strengthening portfolio through continued acreage capture in 2018 (2017 - highest quality acreage captured in 10+ years; >8 BOEB net resource potential)
− Increased divestment focus
1Excludes one-time impact of U.S. tax reform and impairments in 2017; see supplemental information
Permian overview
Sara OrtweinPresident, XTO Energy
9ExxonMobil Upstream Permian Spotlight
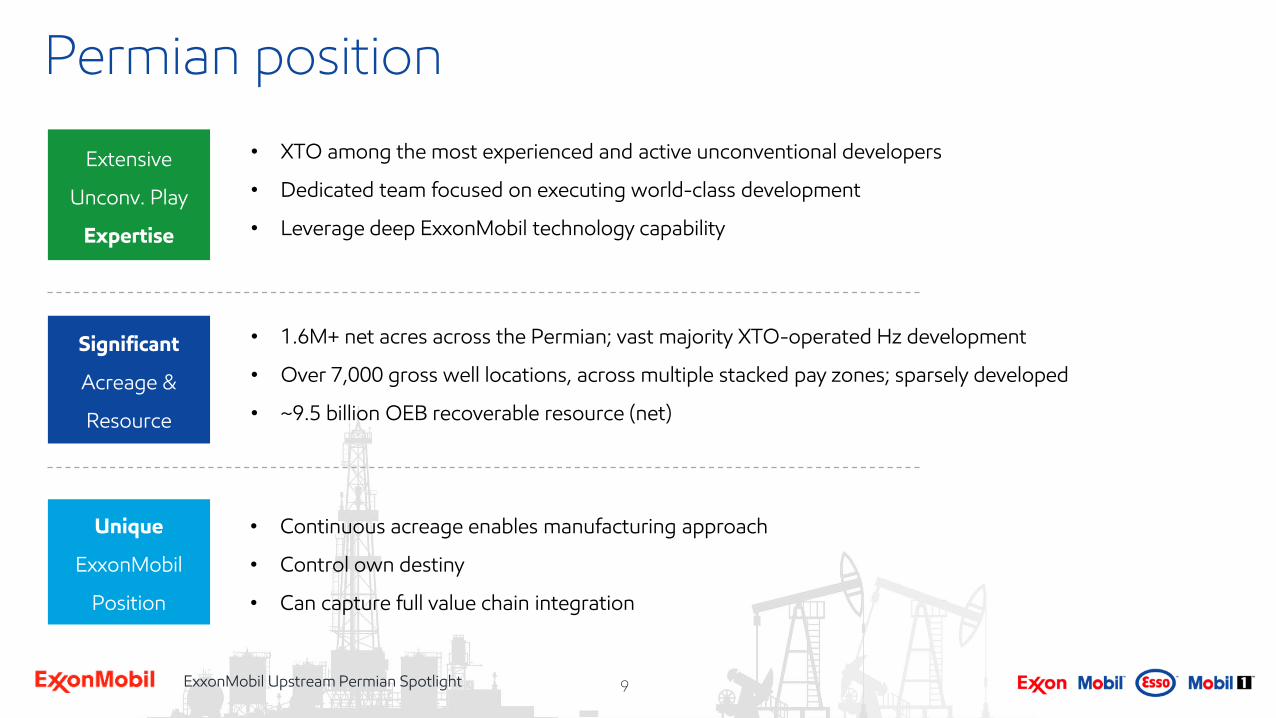
Permian position
• 1.6M+ net acres across the Permian; vast majority XTO-operated Hz development
• Over 7,000 gross well locations, across multiple stacked pay zones; sparsely developed
• ~9.5 billion OEB recoverable resource (net)
Significant
Acreage &
Resource
• Continuous acreage enables manufacturing approach
• Control own destiny
• Can capture full value chain integration
• XTO among the most experienced and active unconventional developers
• Dedicated team focused on executing world-class development
• Leverage deep ExxonMobil technology capability
Unique
ExxonMobil
Position
Extensive
Unconv. Play
Expertise
10ExxonMobil Upstream Permian Spotlight
2017 20252017 2025
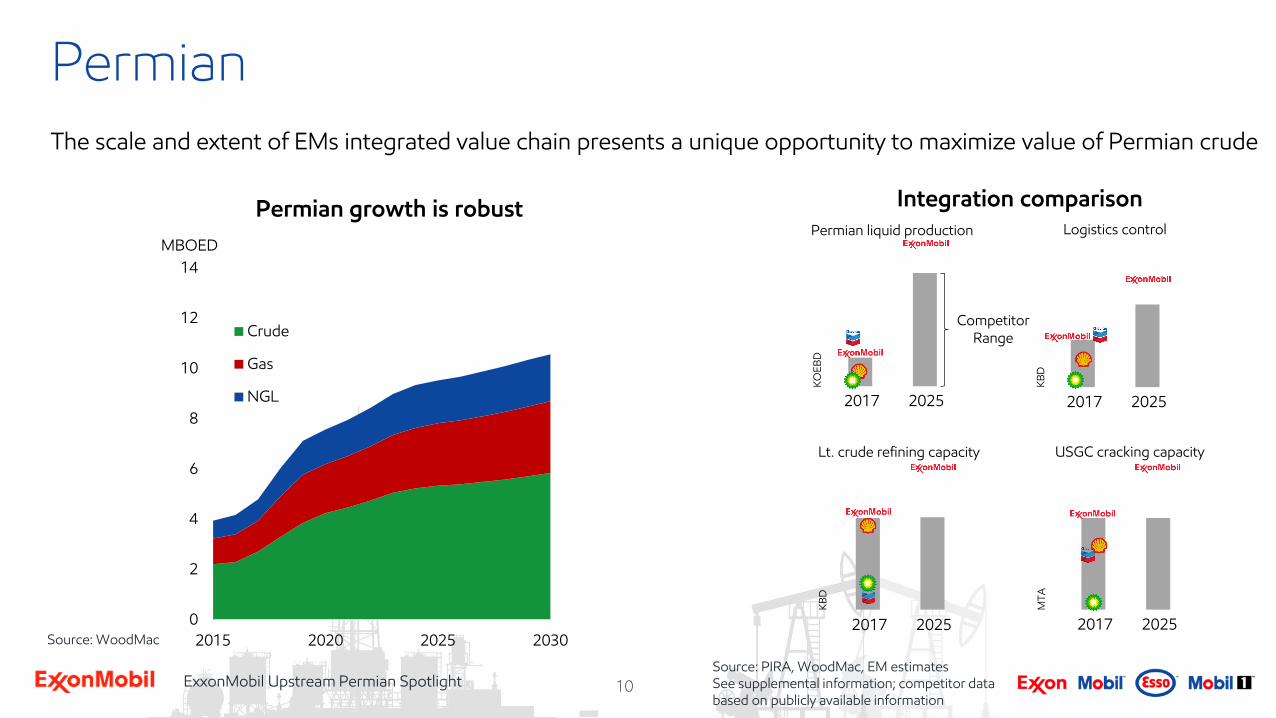
Permian growth is robust Integration comparison
The scale and extent of EMs integrated value chain presents a unique opportunity to maximize value of Permian crude
MBOED
2017 20252017 2025
Permian liquid production
USGC cracking capacityLt. crude refining capacity
Logistics control
Permian
Source: PIRA, WoodMac, EM estimatesSee supplemental information; competitor data based on publicly available information
KO
EB
DK
BD
MT
AK
BD
Competitor Range
0
2
4
6
8
10
12
14
2015 2020 2025 2030
Crude
Gas
NGL
Source: WoodMac
11ExxonMobil Upstream Permian Spotlight
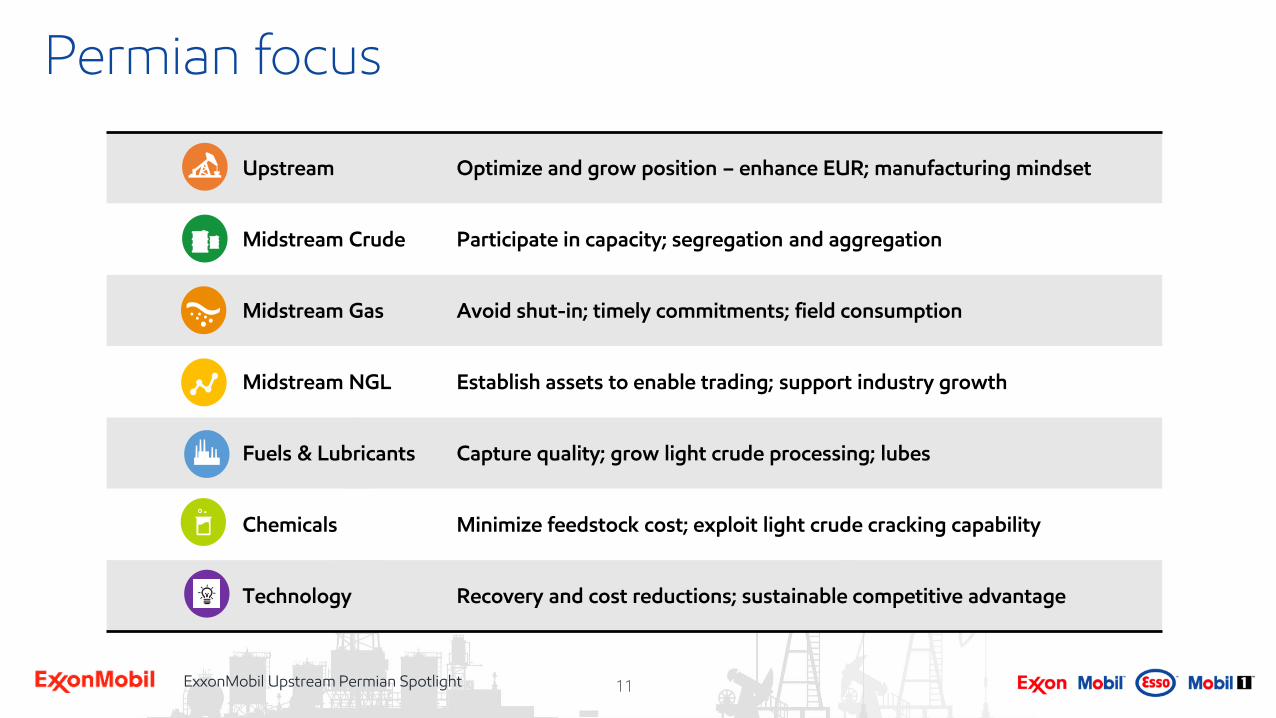
Upstream Optimize and grow position – enhance EUR; manufacturing mindset
Midstream Crude Participate in capacity; segregation and aggregation
Midstream Gas Avoid shut-in; timely commitments; field consumption
Midstream NGL Establish assets to enable trading; support industry growth
Fuels & Lubricants Capture quality; grow light crude processing; lubes
Chemicals Minimize feedstock cost; exploit light crude cracking capability
Technology Recovery and cost reductions; sustainable competitive advantage
Permian focus
12ExxonMobil Upstream Permian Spotlight
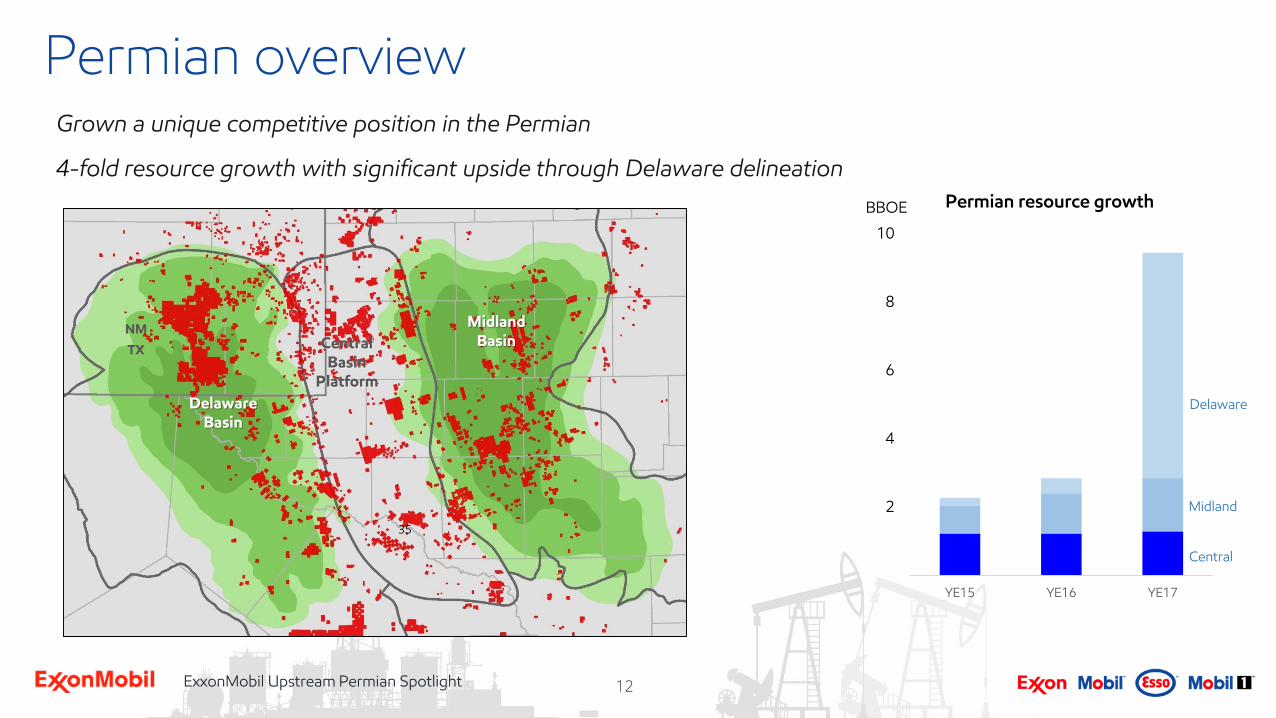
MidlandBasinCentral
BasinPlatform
DelawareBasin
NM
TX
Permian overviewGrown a unique competitive position in the Permian
4-fold resource growth with significant upside through Delaware delineation
2
4
6
8
10
YE15 YE16 YE17
Permian resource growth
Central
Midland
Delaware
35
BBOE
13ExxonMobil Upstream Permian Spotlight
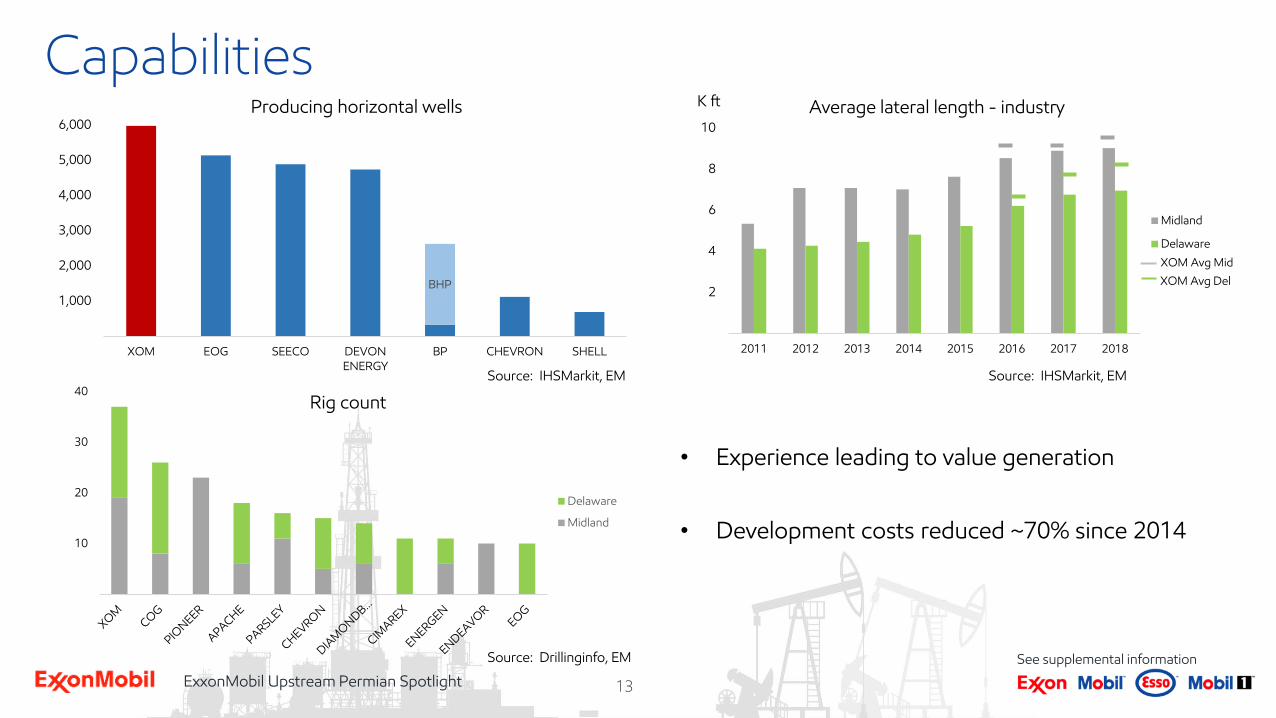
10
20
30
40Rig count
Delaware
Midland
BHP
1,000
2,000
3,000
4,000
5,000
6,000
XOM EOG SEECO DEVONENERGY
BP CHEVRON SHELL
Producing horizontal wells
2
4
6
8
10
2011 2012 2013 2014 2015 2016 2017 2018
Average lateral length - industry
Midland
Delaware
Capabilities
XOM Avg Mid
XOM Avg Del
Source: IHSMarkit, EM Source: IHSMarkit, EM
See supplemental informationSource: Drillinginfo, EM
• Experience leading to value generation
• Development costs reduced ~70% since 2014
K ft
14ExxonMobil Upstream Permian Spotlight
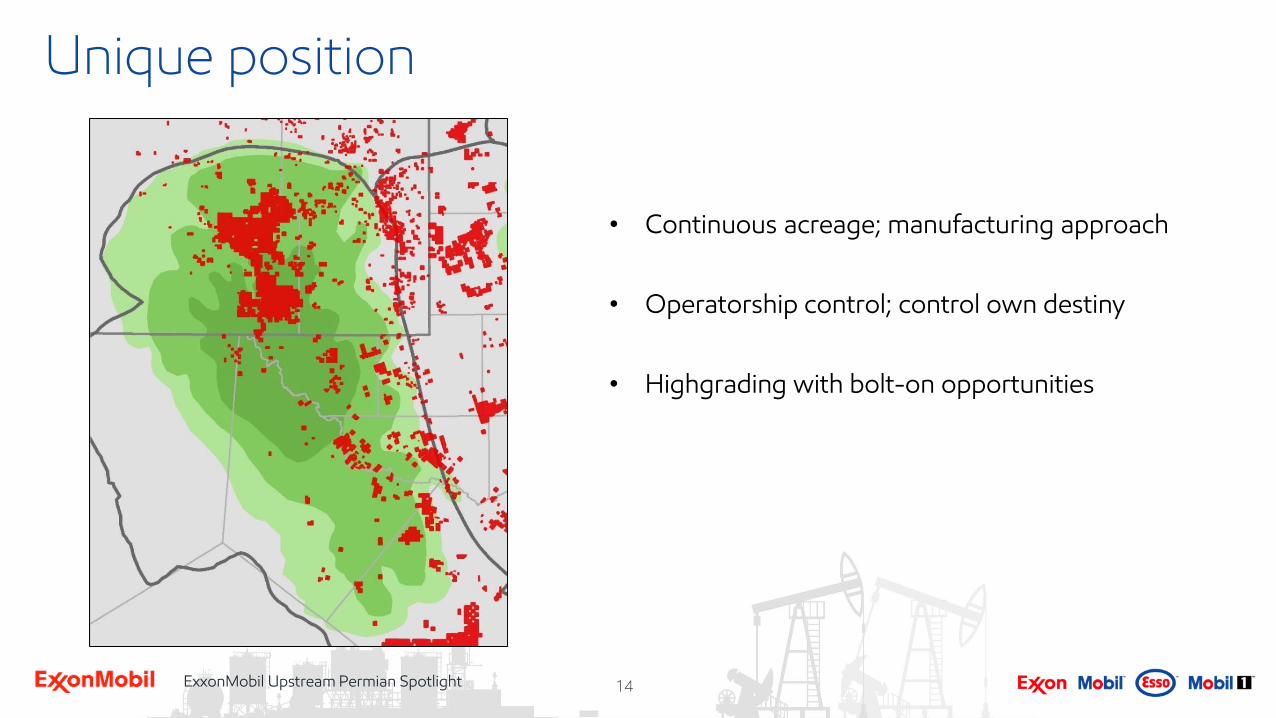
Unique position
• Continuous acreage; manufacturing approach
• Operatorship control; control own destiny
• Highgrading with bolt-on opportunities
15ExxonMobil Upstream Permian Spotlight
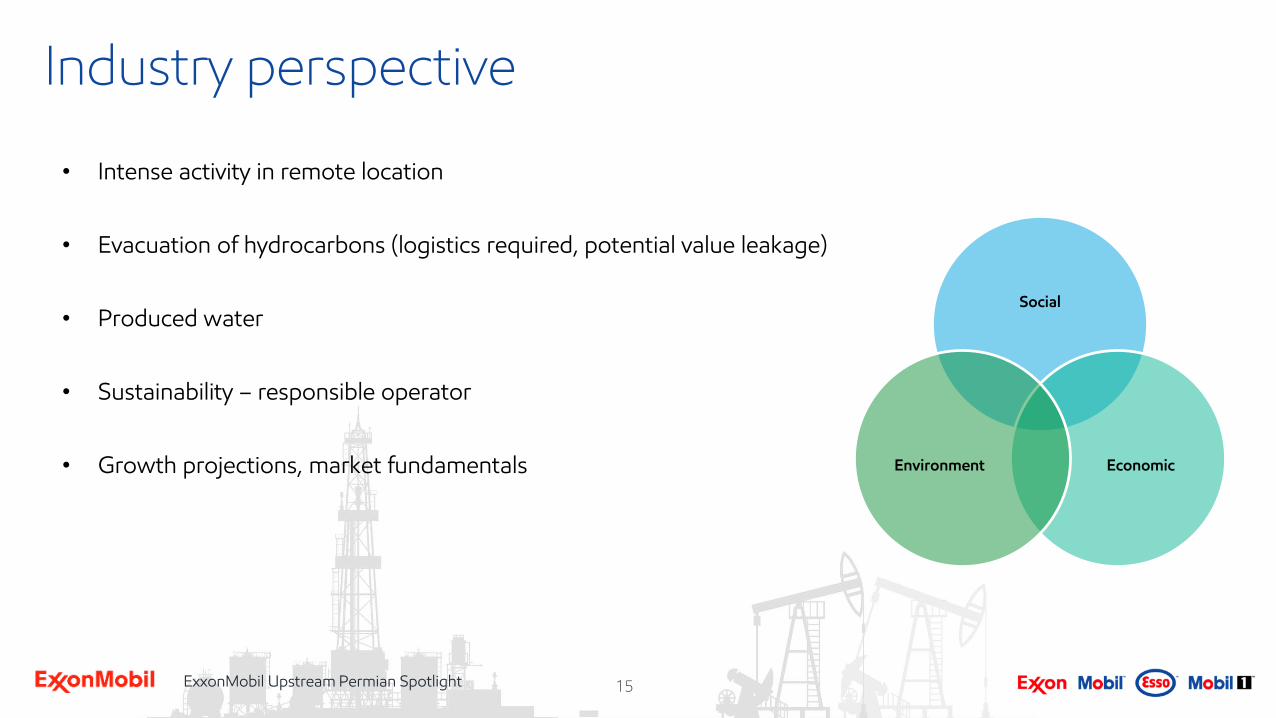
Industry perspective
• Intense activity in remote location
• Evacuation of hydrocarbons (logistics required, potential value leakage)
• Produced water
• Sustainability – responsible operator
• Growth projections, market fundamentals
Social
EconomicEnvironment
16ExxonMobil Upstream Permian Spotlight
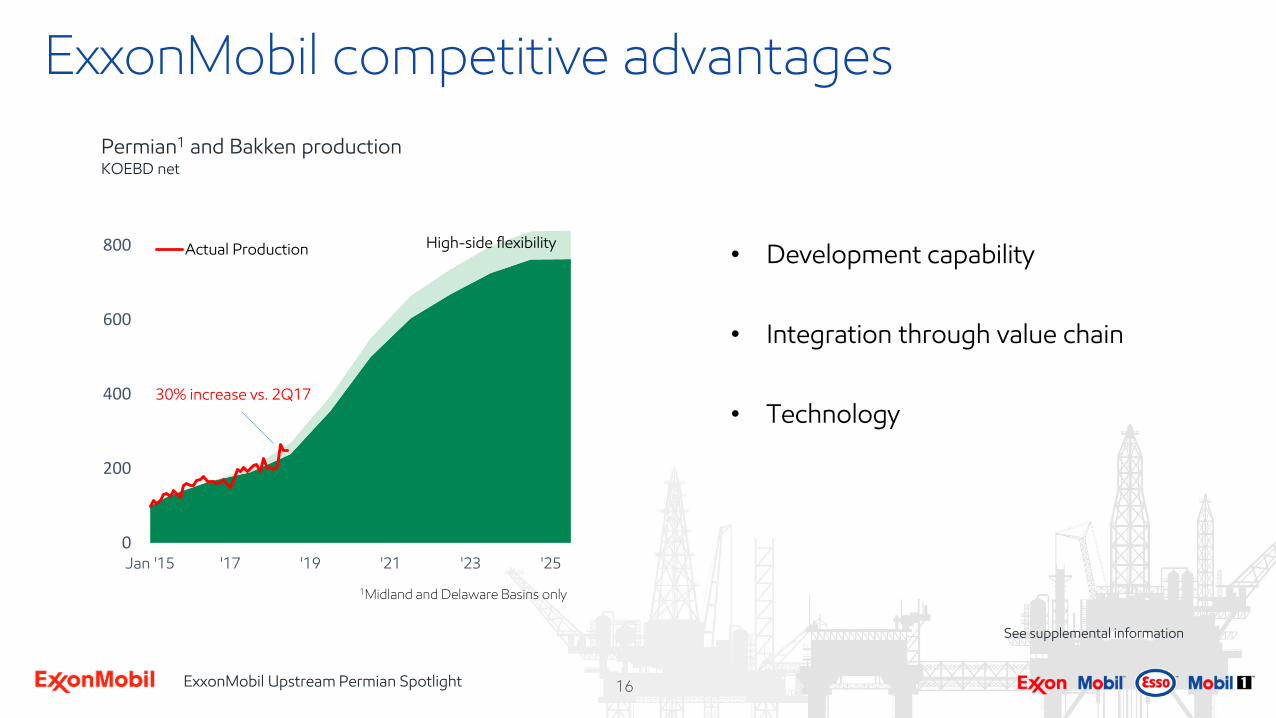
0
200
400
600
800
Jan '15 '17 '19 '21 '23 '25
Actual Production High-side flexibility
30% increase vs. 2Q17
Permian1 and Bakken production KOEBD net
1Midland and Delaware Basins only
• Development capability
• Integration through value chain
• Technology
ExxonMobil competitive advantages
See supplemental information

Development capabilities
Staale GjervikSr. Vice President, Permian Integrated Development
18ExxonMobil Upstream Permian Spotlight
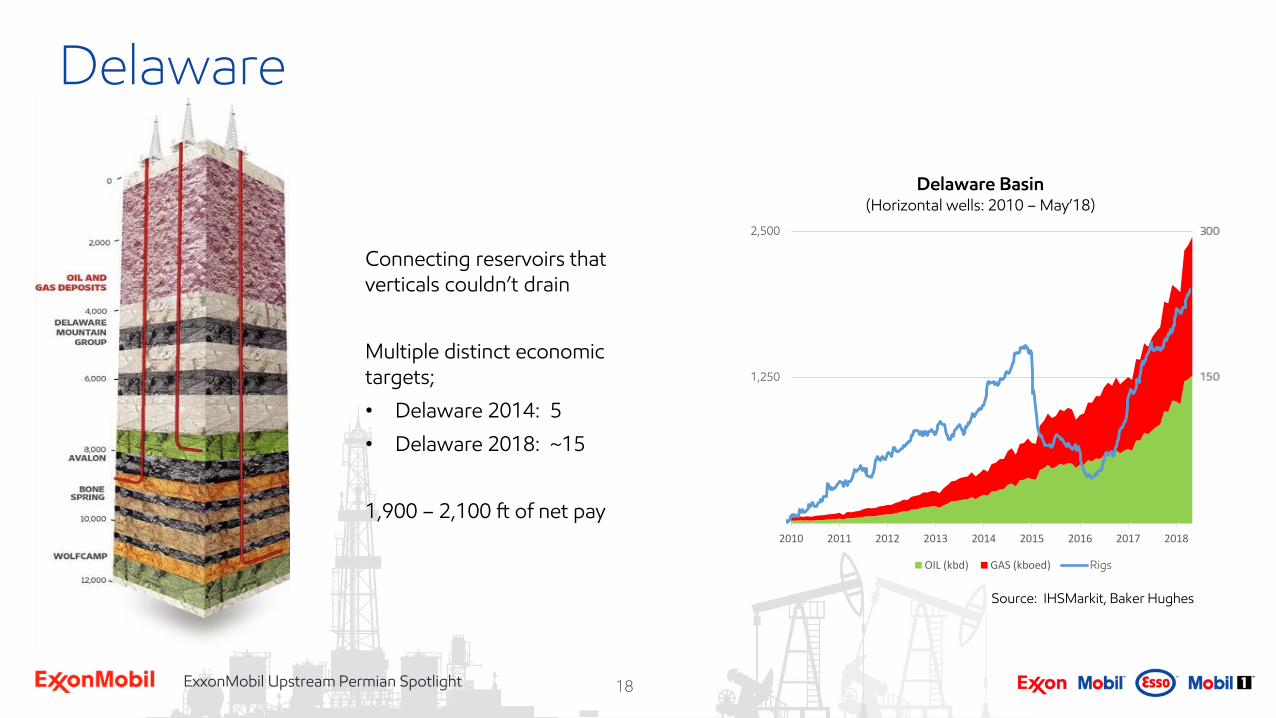
Connecting reservoirs that verticals couldn’t drain
Multiple distinct economic targets;
• Delaware 2014: 5
• Delaware 2018: ~15
1,900 – 2,100 ft of net pay
Delaware
1,250
2,500
2010 2011 2012 2013 2014 2015 2016 2017 2018
Delaware Basin(Horizontal wells: 2010 – May’18)
OIL (kbd) GAS (kboed) Rigs
Source: IHSMarkit, Baker Hughes
19ExxonMobil Upstream Permian Spotlight
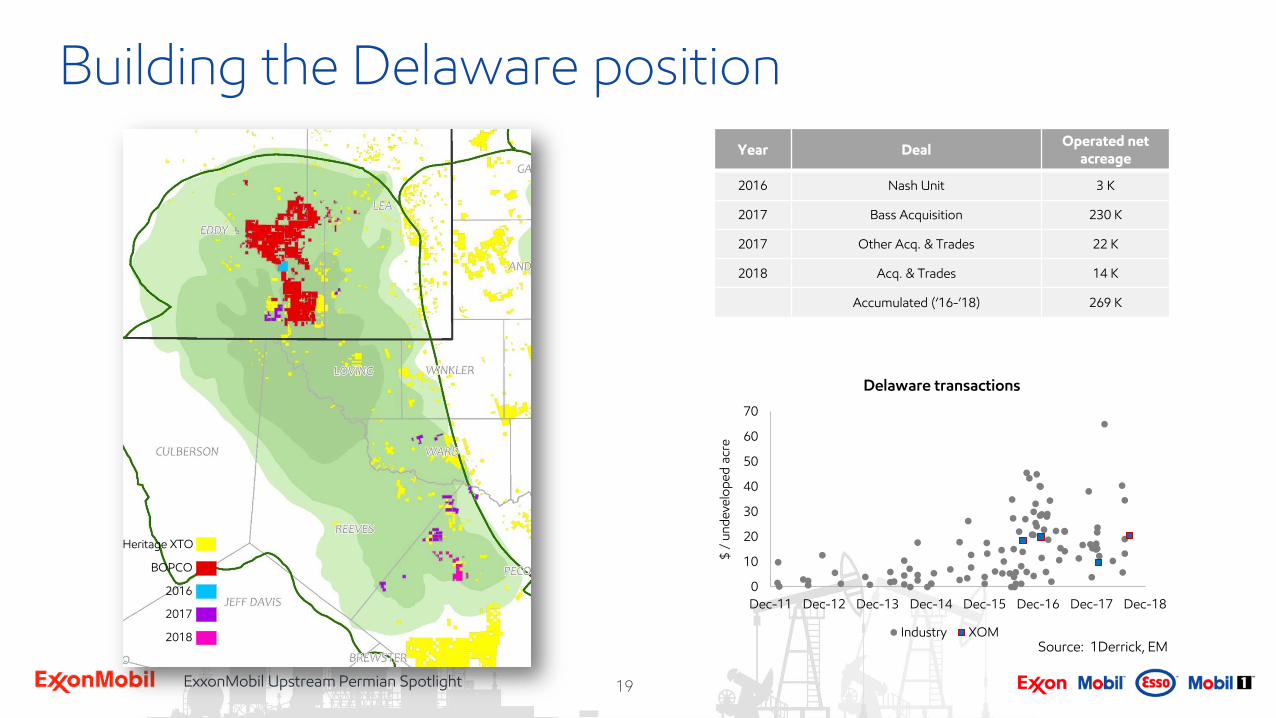
Building the Delaware position
Year DealOperated net
acreage
2016 Nash Unit 3 K
2017 Bass Acquisition 230 K
2017 Other Acq. & Trades 22 K
2018 Acq. & Trades 14 K
Accumulated (‘16-’18) 269 K
0
10
20
30
40
50
60
70
Dec-11 Dec-12 Dec-13 Dec-14 Dec-15 Dec-16 Dec-17 Dec-18
$ /
un
de
velo
pe
d a
cre
Delaware transactions
Industry XOMSource: 1Derrick, EM
BOPCO
2016
2017
2018
Heritage XTO
20ExxonMobil Upstream Permian Spotlight
MidlandBasin
CentralBasin
Platform
DelawareBasin
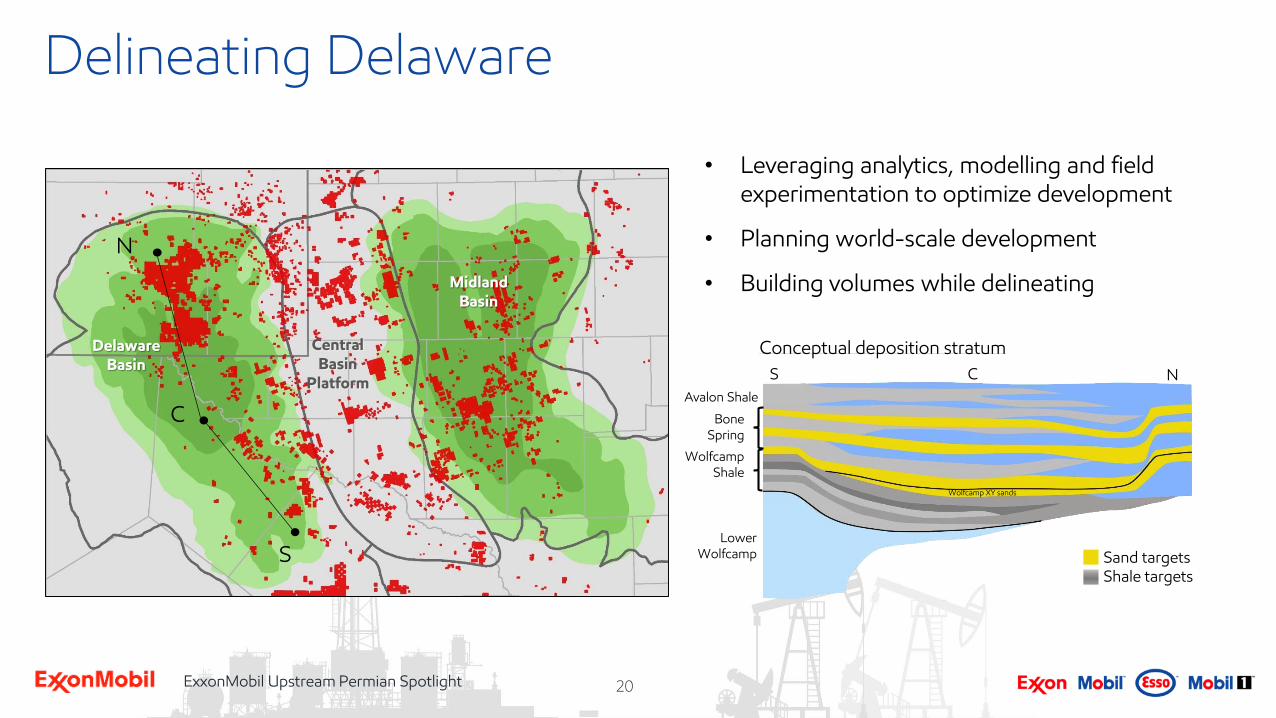
Delineating Delaware
• Leveraging analytics, modelling and field experimentation to optimize development
• Planning world-scale development
• Building volumes while delineating
N
C
S
S C N
WolfcampShale
LowerWolfcamp
Avalon Shale
Bone Spring
Wolfcamp XY sands
Sand targetsShale targets
Conceptual deposition stratum
21ExxonMobil Upstream Permian Spotlight
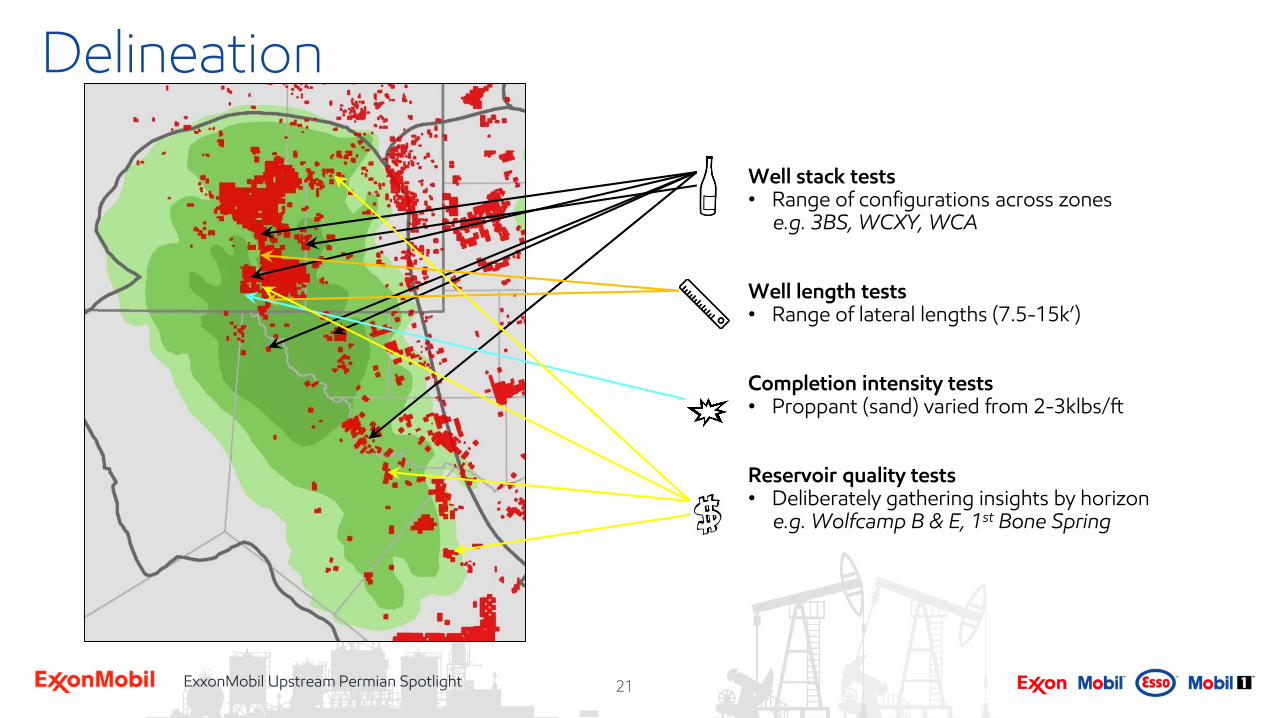
Delineation
Well stack tests • Range of configurations across zones
e.g. 3BS, WCXY, WCA
Well length tests• Range of lateral lengths (7.5-15k’)
Completion intensity tests• Proppant (sand) varied from 2-3klbs/ft
Reservoir quality tests• Deliberately gathering insights by horizon
e.g. Wolfcamp B & E, 1st Bone Spring
22ExxonMobil Upstream Permian Spotlight
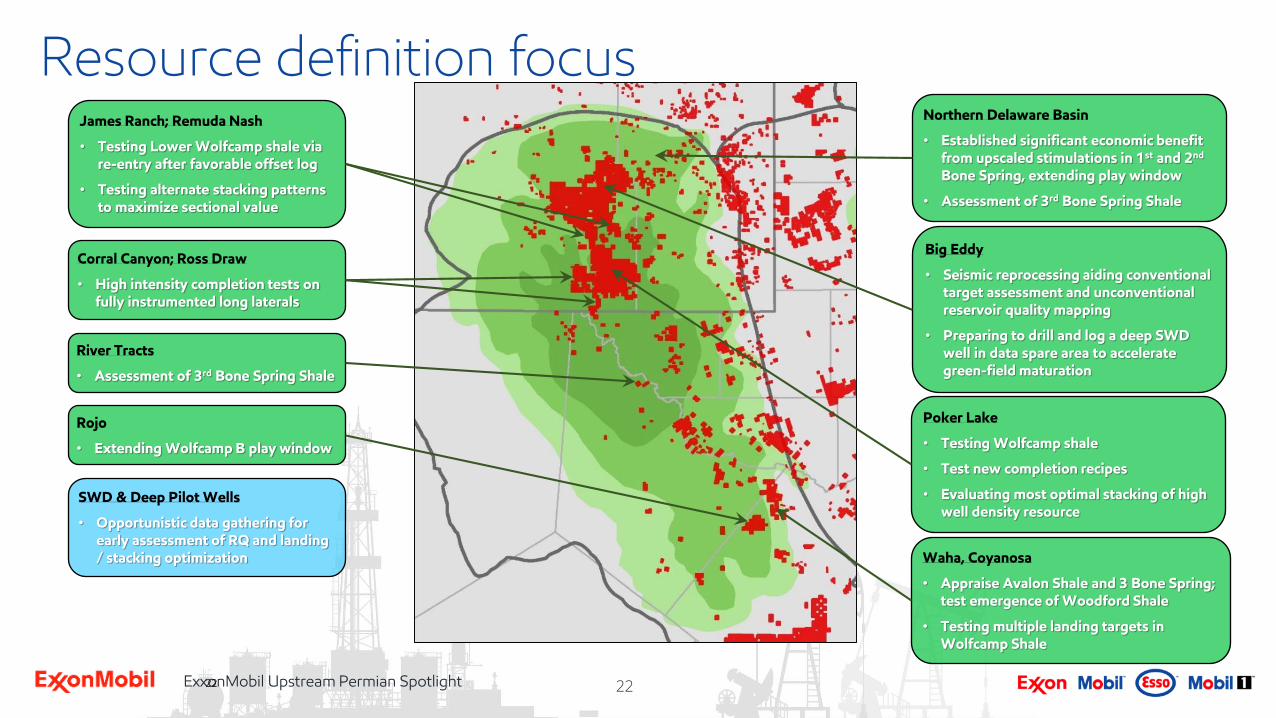
Resource definition focus
22
James Ranch; Remuda Nash
• Testing Lower Wolfcamp shale via re-entry after favorable offset log
• Testing alternate stacking patterns to maximize sectional value
Corral Canyon; Ross Draw
• High intensity completion tests on fully instrumented long laterals
River Tracts
• Assessment of 3rd Bone Spring Shale
Rojo
• Extending Wolfcamp B play window
Northern Delaware Basin
• Established significant economic benefit from upscaled stimulations in 1st and 2nd
Bone Spring, extending play window
• Assessment of 3rd Bone Spring Shale
Big Eddy
• Seismic reprocessing aiding conventional target assessment and unconventional reservoir quality mapping
• Preparing to drill and log a deep SWD well in data spare area to accelerate green-field maturation
Poker Lake
• Testing Wolfcamp shale
• Test new completion recipes
• Evaluating most optimal stacking of high well density resource
Waha, Coyanosa
• Appraise Avalon Shale and 3 Bone Spring; test emergence of Woodford Shale
• Testing multiple landing targets in Wolfcamp Shale
SWD & Deep Pilot Wells
• Opportunistic data gathering for early assessment of RQ and landing / stacking optimization
23ExxonMobil Upstream Permian Spotlight
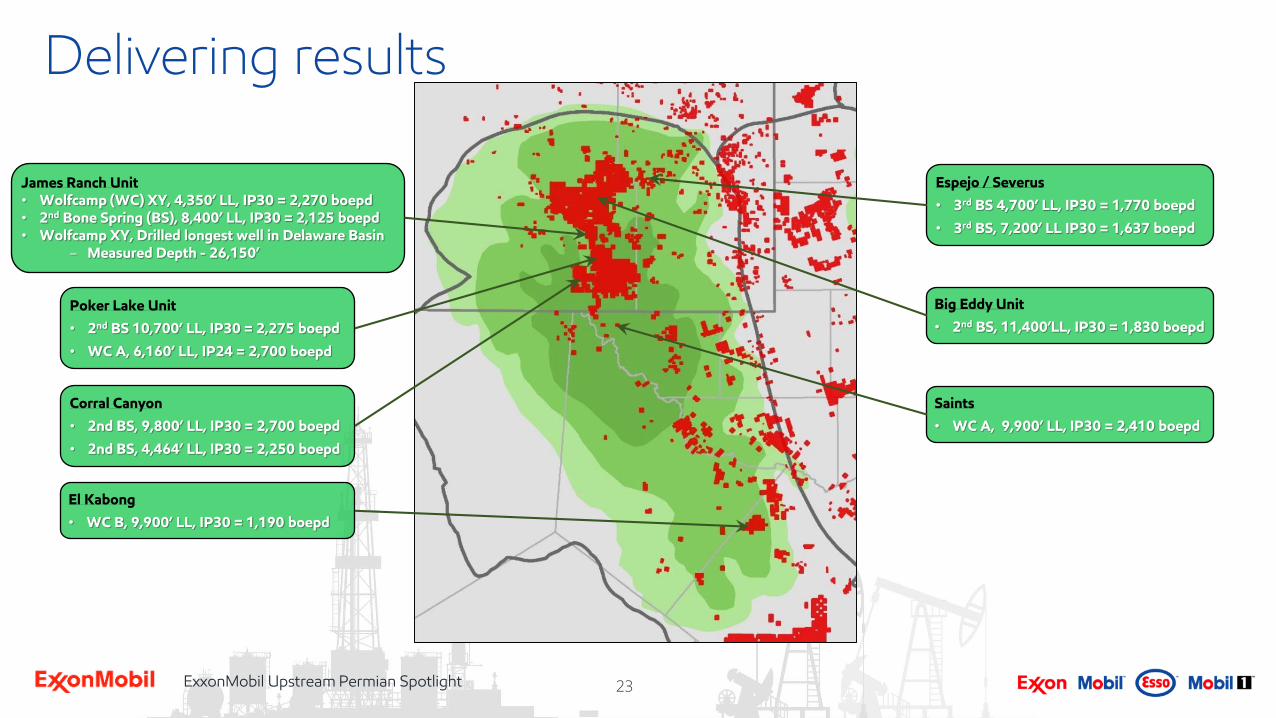
Delivering results
Saints
• WC A, 9,900’ LL, IP30 = 2,410 boepd
Corral Canyon
• 2nd BS, 9,800’ LL, IP30 = 2,700 boepd
• 2nd BS, 4,464’ LL, IP30 = 2,250 boepd
El Kabong
• WC B, 9,900’ LL, IP30 = 1,190 boepd
Espejo / Severus
• 3rd BS 4,700’ LL, IP30 = 1,770 boepd
• 3rd BS, 7,200’ LL IP30 = 1,637 boepd
James Ranch Unit• Wolfcamp (WC) XY, 4,350’ LL, IP30 = 2,270 boepd• 2nd Bone Spring (BS), 8,400’ LL, IP30 = 2,125 boepd• Wolfcamp XY, Drilled longest well in Delaware Basin
– Measured Depth - 26,150’
Poker Lake Unit
• 2nd BS 10,700’ LL, IP30 = 2,275 boepd
• WC A, 6,160’ LL, IP24 = 2,700 boepd
Big Eddy Unit
• 2nd BS, 11,400’LL, IP30 = 1,830 boepd
24ExxonMobil Upstream Permian Spotlight
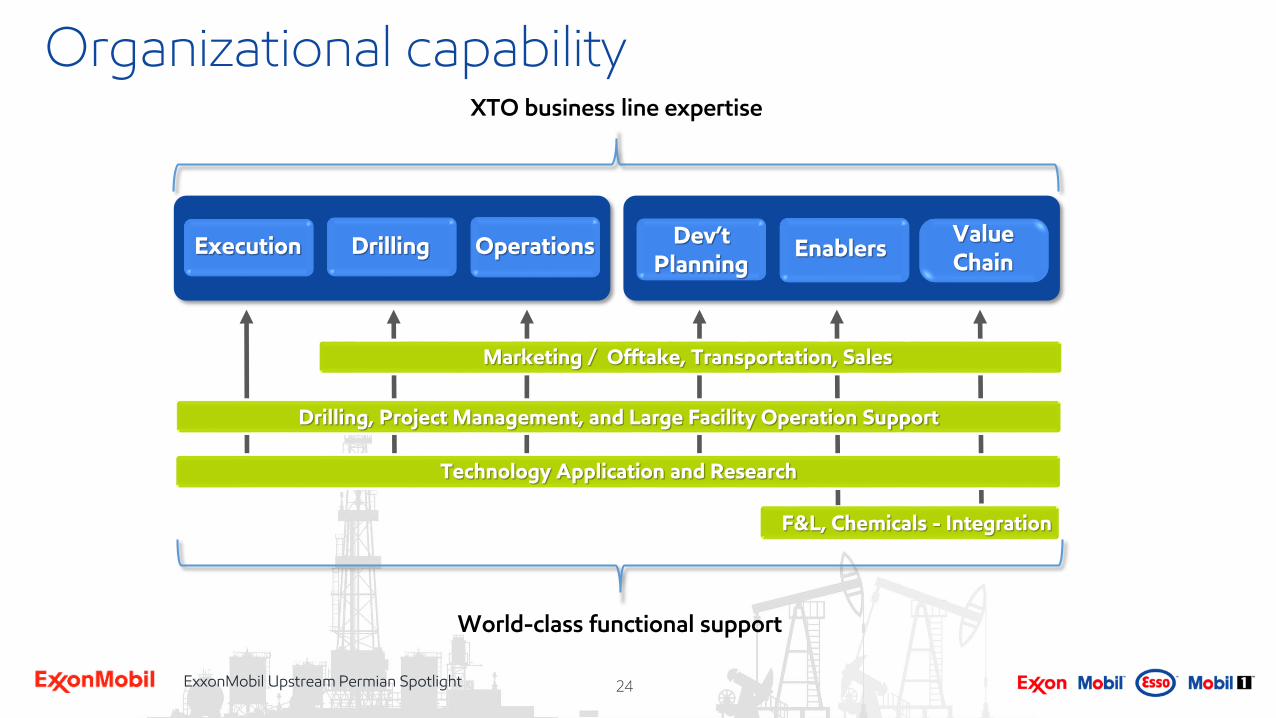
Organizational capability
Dev’tPlanning
Value Chain
Technology Application and Research
F&L, Chemicals - Integration
Execution Drilling Operations Enablers
XTO business line expertise
World-class functional support
Marketing / Offtake, Transportation, Sales
Drilling, Project Management, and Large Facility Operation Support
25ExxonMobil Upstream Permian Spotlight
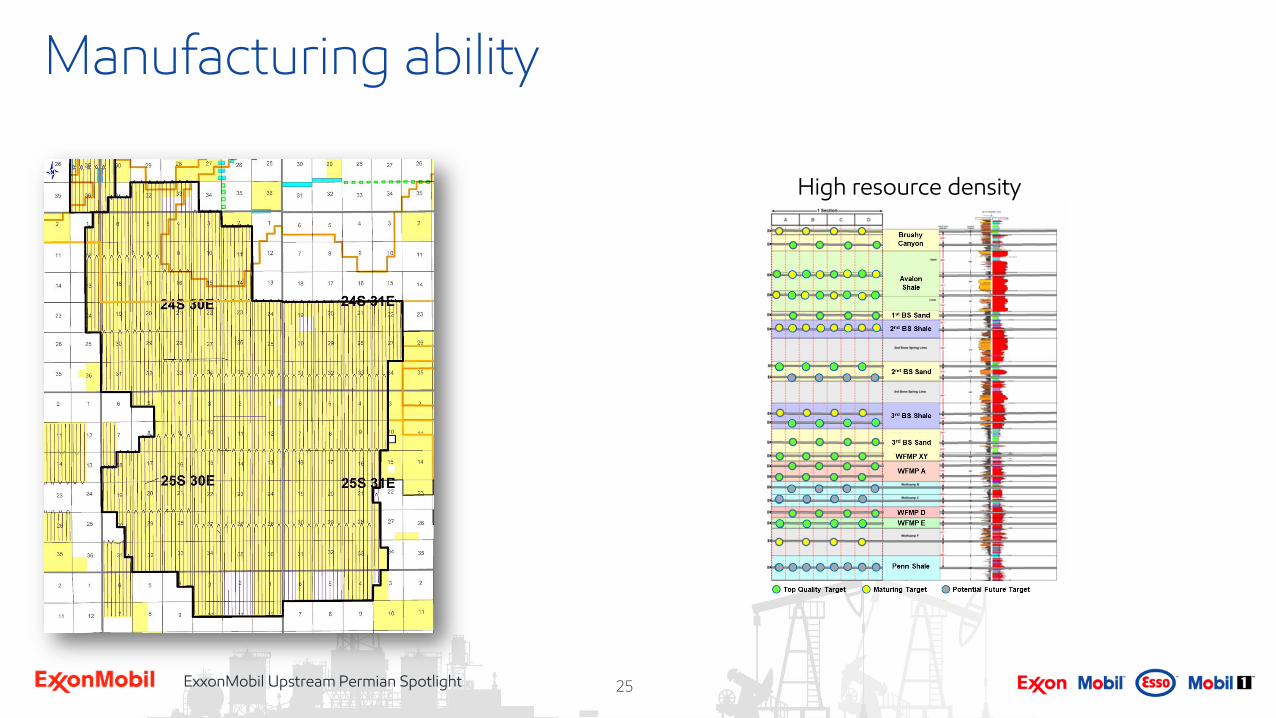
Manufacturing ability
High resource density
26ExxonMobil Upstream Permian Spotlight
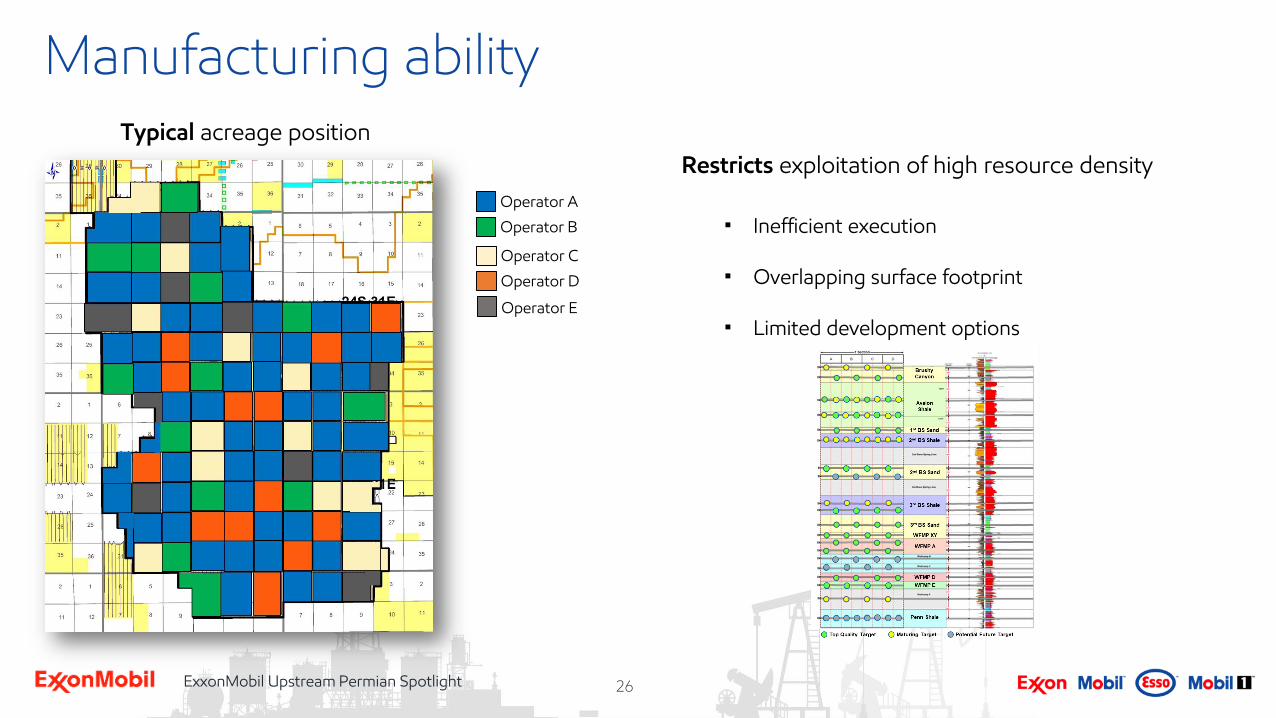
Manufacturing abilityTypical acreage position
• Inefficient execution
• Overlapping surface footprint
• Limited development options
Restricts exploitation of high resource density
Operator A
Operator B
Operator C
Operator D
Operator E
27ExxonMobil Upstream Permian Spotlight
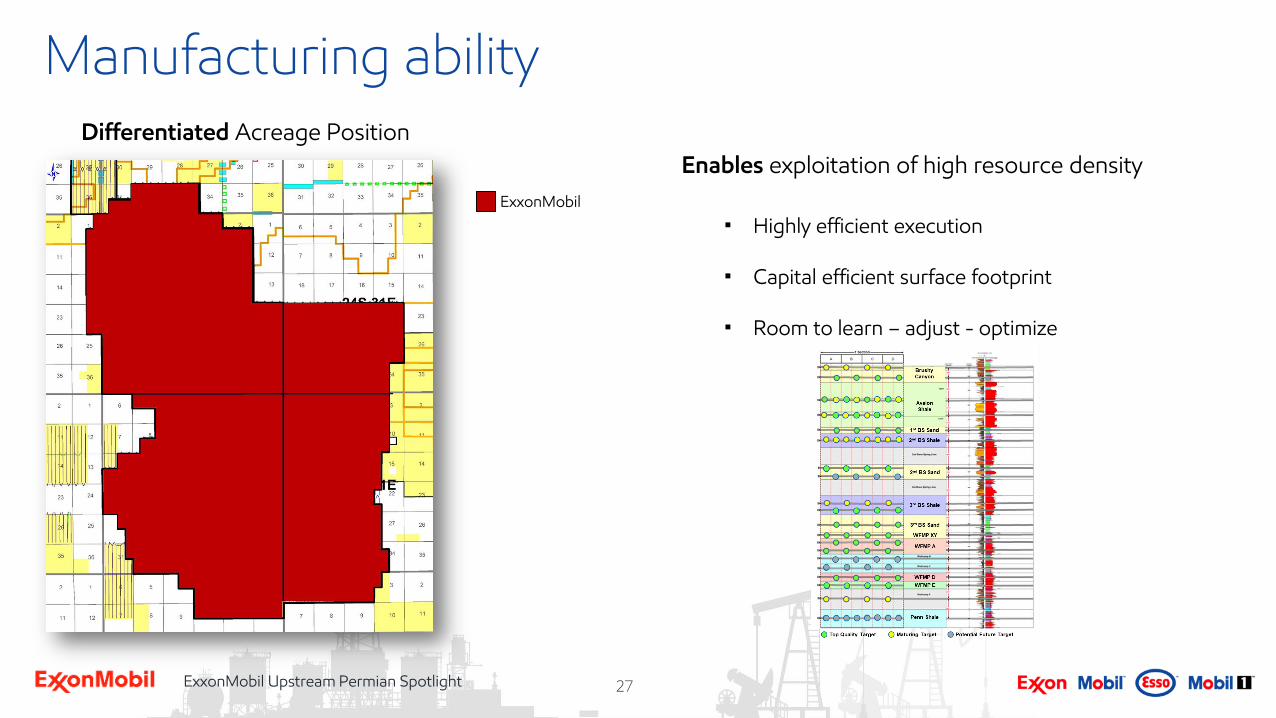
Manufacturing abilityDifferentiated Acreage Position
• Highly efficient execution
• Capital efficient surface footprint
• Room to learn – adjust - optimize
ExxonMobil
Enables exploitation of high resource density
28ExxonMobil Upstream Permian Spotlight
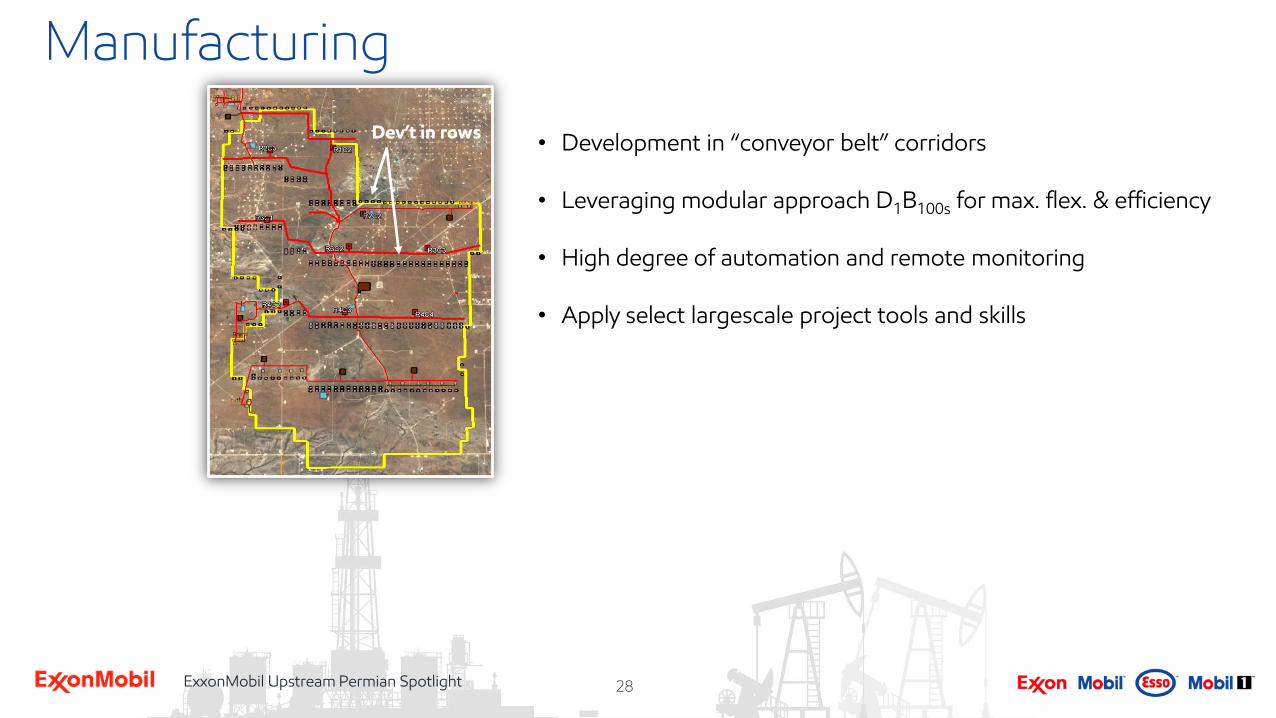
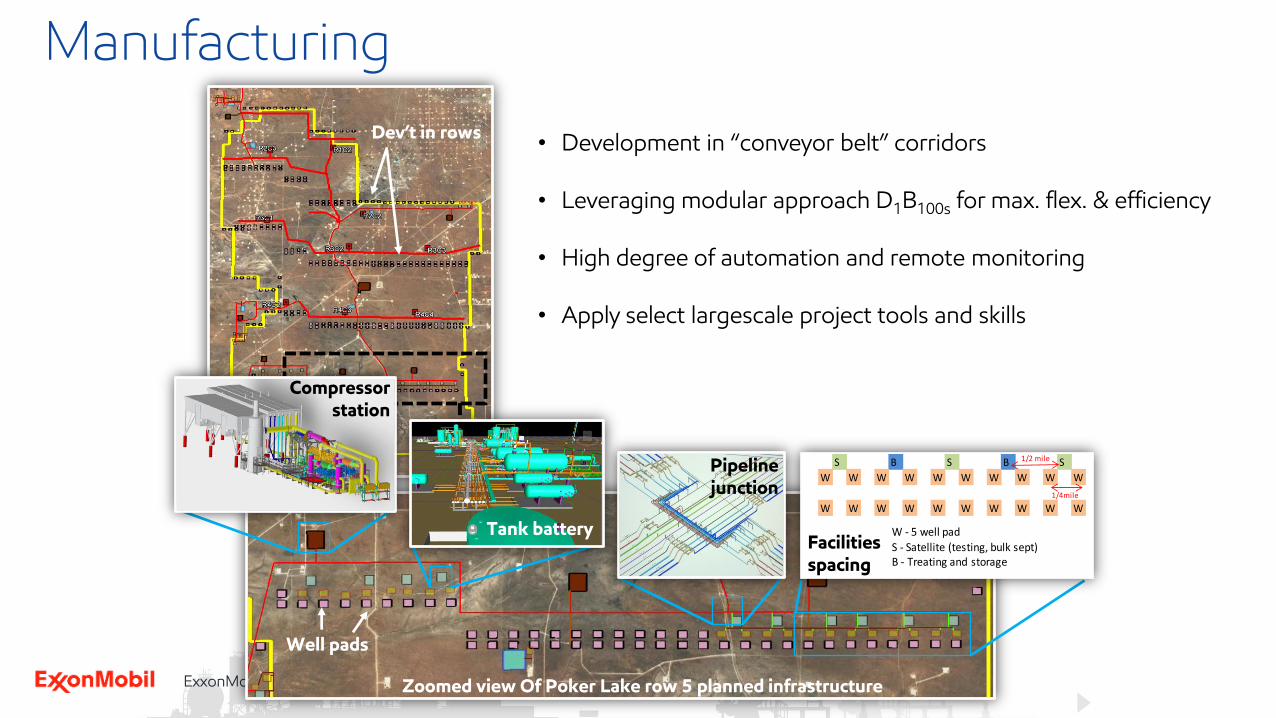
• Development in “conveyor belt” corridors
• Leveraging modular approach D1B100s for max. flex. & efficiency
• High degree of automation and remote monitoring
• Apply select largescale project tools and skills
Dev’t in rows
Manufacturing
29ExxonMobil Upstream Permian Spotlight
• Development in “conveyor belt” corridors
• Leveraging modular approach D1B100s for max. flex. & efficiency
• High degree of automation and remote monitoring
• Apply select largescale project tools and skills
S B S B S
W W W W W W W W W W
W W W W W W W W W W
1/2 mile
1/4mile
W - 5 well padS - Satellite (testing, bulk sept)B - Treating and storage
Well pads
Dev’t in rows
Facilitiesspacing
Pipelinejunction
Compressorstation
Tank battery
Zoomed view Of Poker Lake row 5 planned infrastructure
Manufacturing
30ExxonMobil Upstream Permian Spotlight
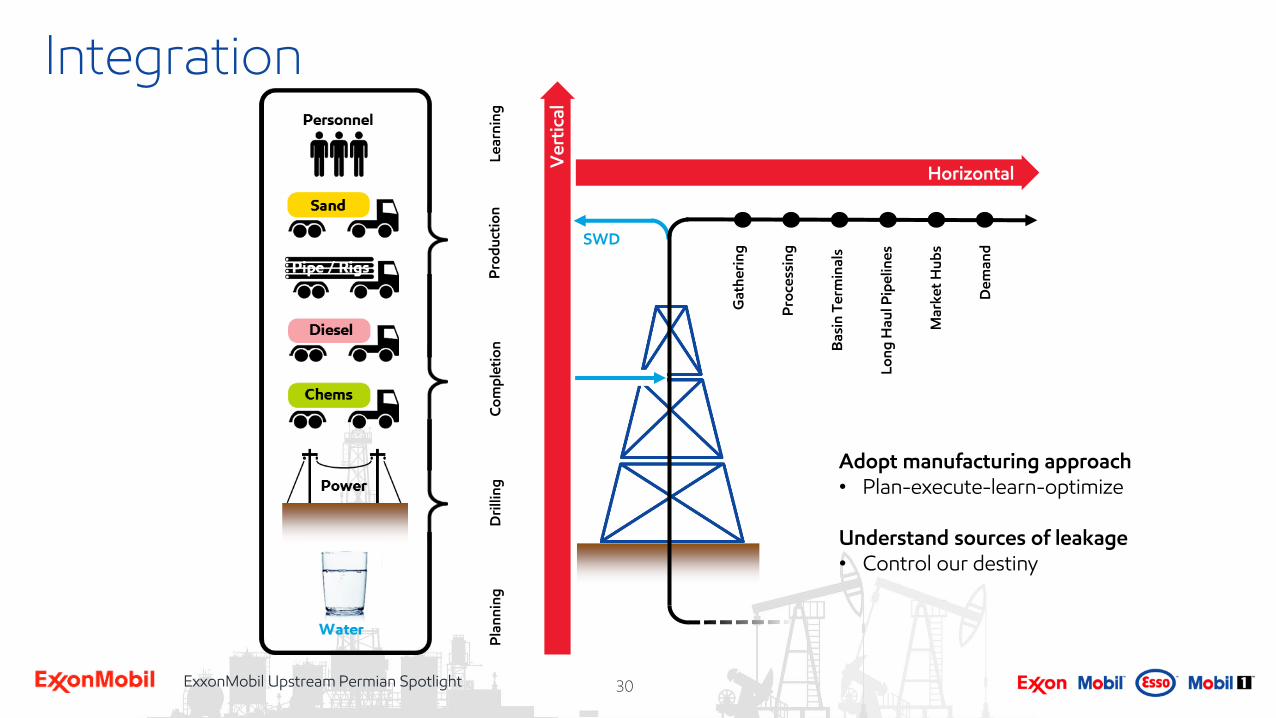
Adopt manufacturing approach• Plan-execute-learn-optimize
Understand sources of leakage• Control our destiny
Horizontal
Ga
the
rin
g
Pro
cess
ing
Lo
ng
Ha
ul P
ipe
line
s
Ba
sin
Te
rmin
als
Ma
rke
t H
ub
s
De
ma
nd
SWD
Pro
du
ctio
nC
om
ple
tio
nD
rilli
ng
Pla
nn
ing
Ve
rtic
al
Le
arn
ing
Integration
31ExxonMobil Upstream Permian Spotlight
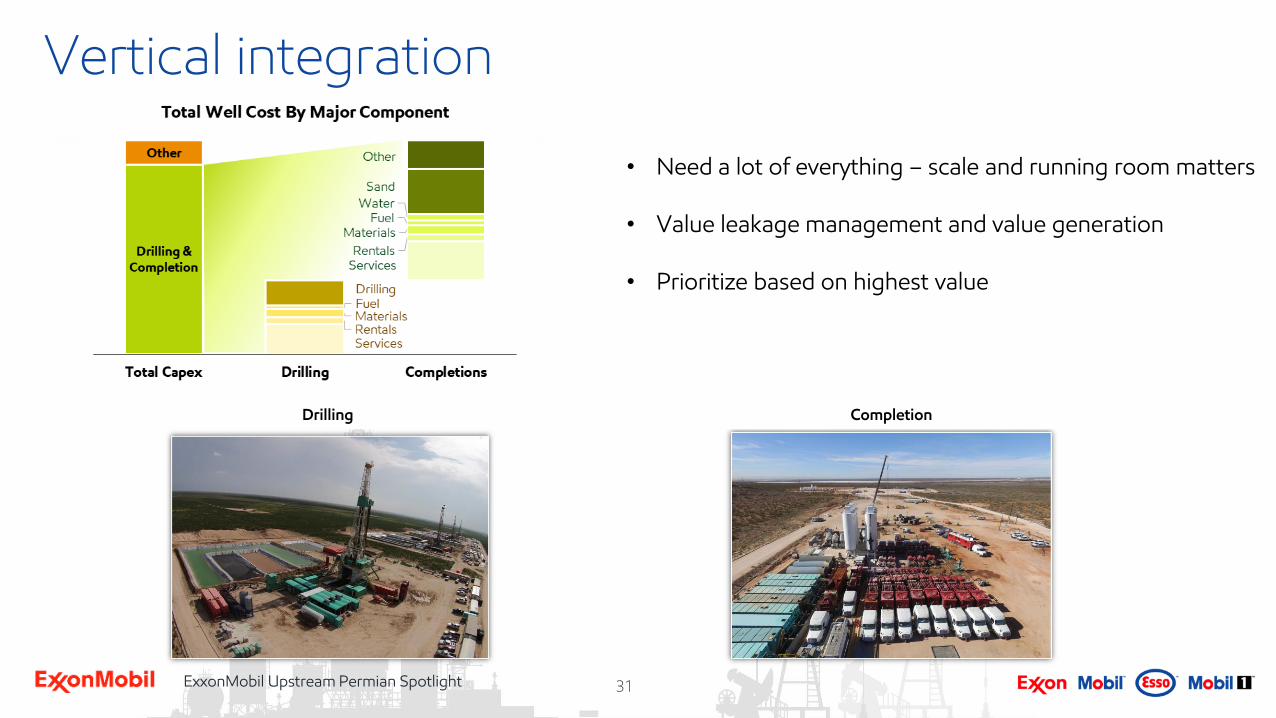
• Need a lot of everything – scale and running room matters
• Value leakage management and value generation
• Prioritize based on highest value
Drilling Completion
Vertical integration
32ExxonMobil Upstream Permian Spotlight
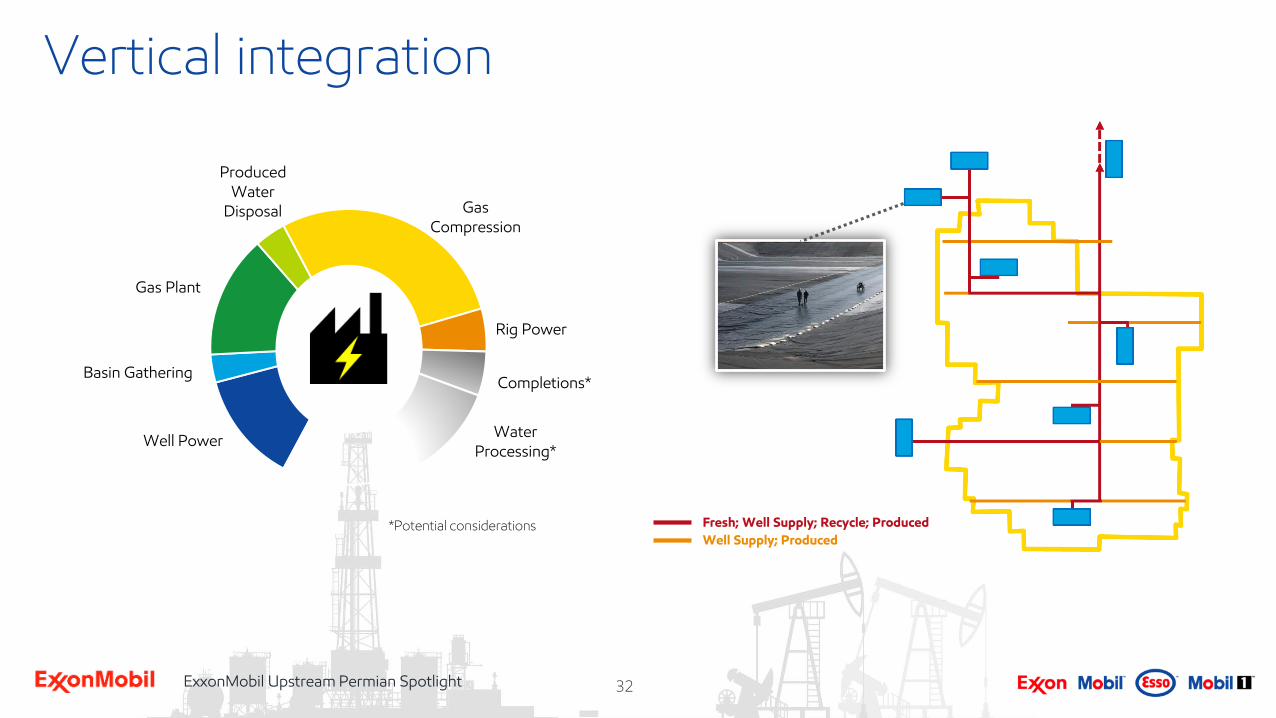
Vertical integration
Well Power
Basin Gathering
Gas Plant
Produced Water
Disposal Gas Compression
Rig Power
Completions*
Water Processing*
Fresh; Well Supply; Recycle; Produced
Well Supply; Produced*Potential considerations
33ExxonMobil Upstream Permian Spotlight
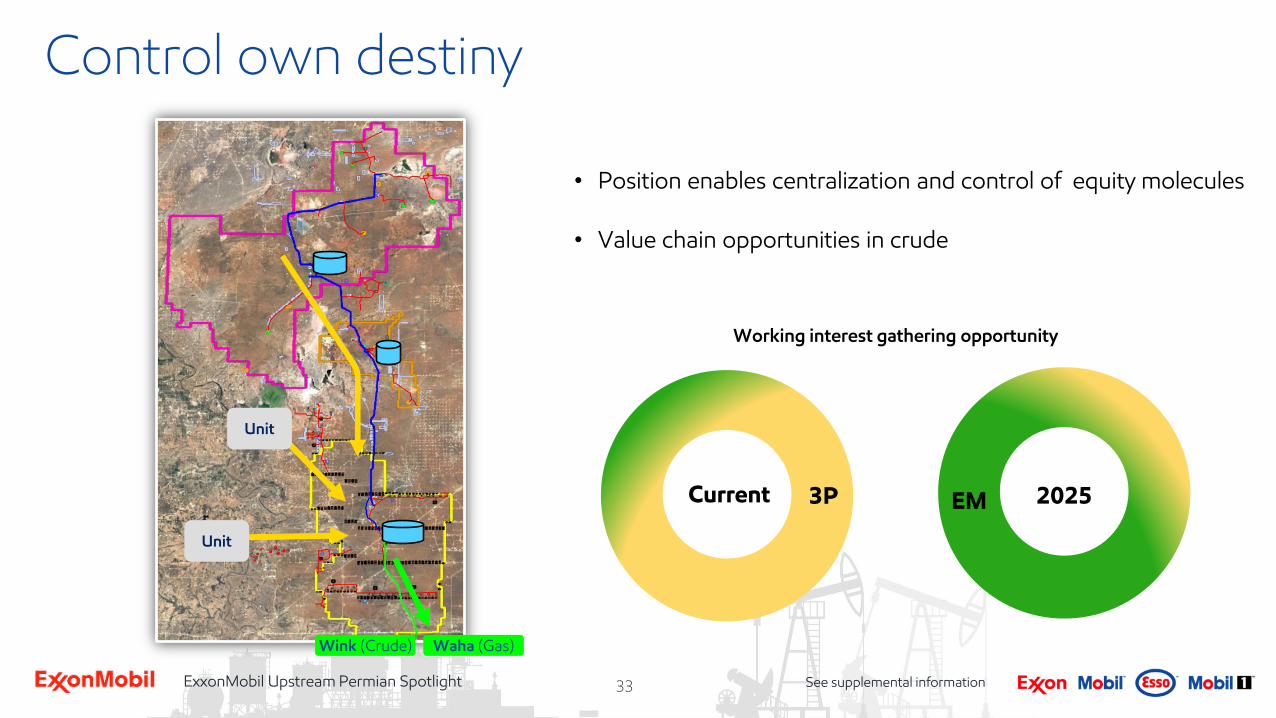
Control own destiny
Unit
Wink (Crude) Waha (Gas)
Unit
• Position enables centralization and control of equity molecules
• Value chain opportunities in crude
3P
Working interest gathering opportunity
EM 2025Current
See supplemental information
34ExxonMobil Upstream Permian Spotlight
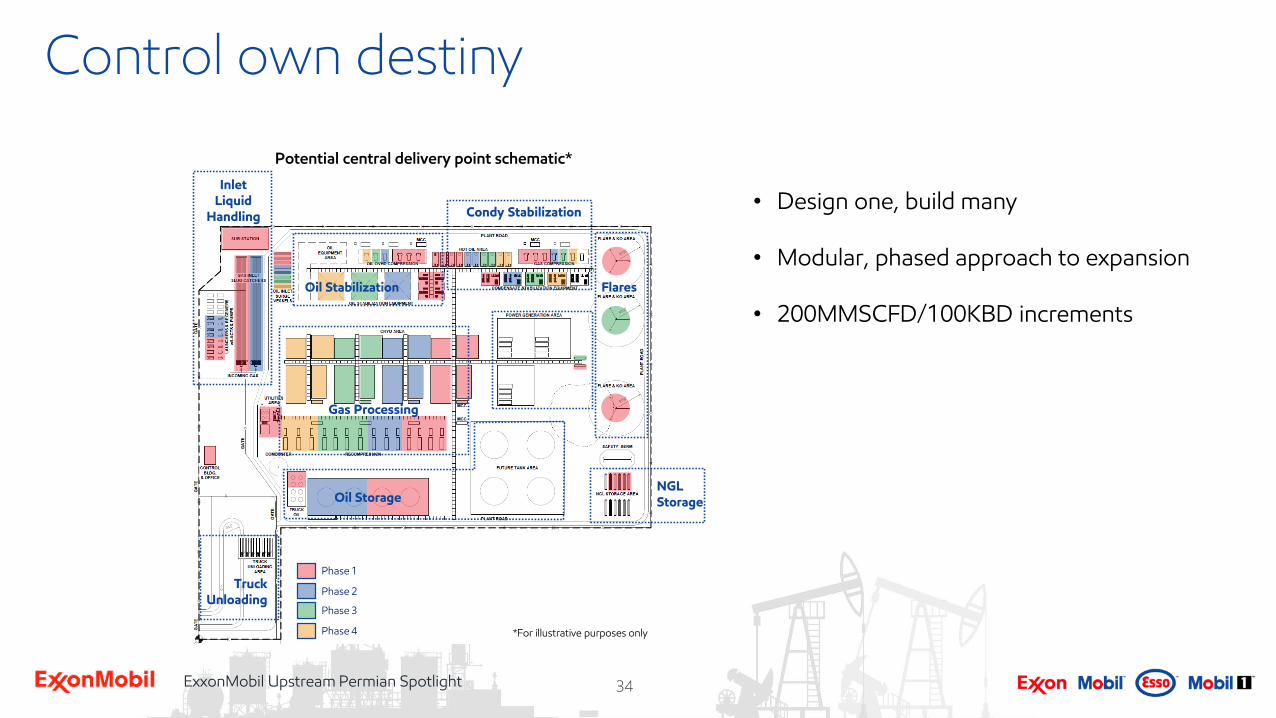
• Design one, build many
• Modular, phased approach to expansion
• 200MMSCFD/100KBD increments
Potential central delivery point schematic*
Phase 1
Phase 2
Phase 3
Phase 4
Condy Stabilization
Inlet Liquid
Handling
Oil Stabilization Flares
NGLStorage
Gas Processing
Oil Storage
TruckUnloading
Control own destiny
*For illustrative purposes only
Integration
Bryan MiltonPresident, Fuels & Lubricants
36ExxonMobil Upstream Permian Spotlight
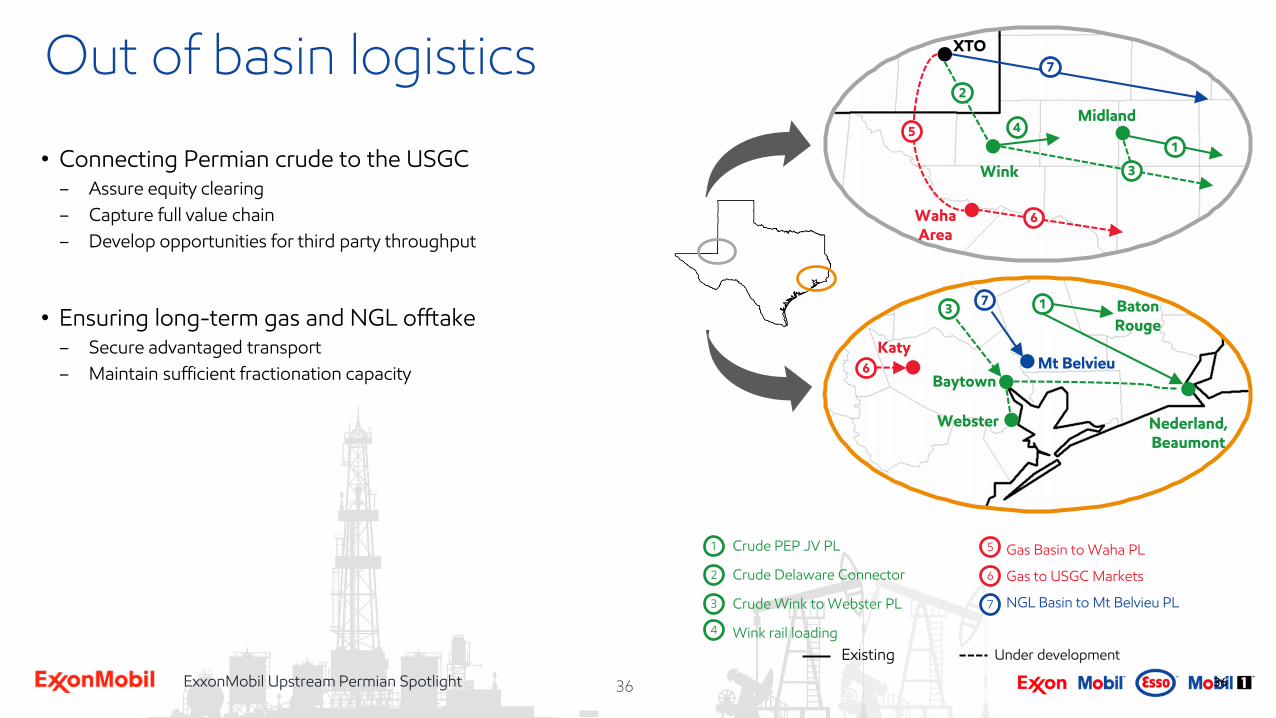
Out of basin logistics
3636
WahaArea
XTO
Wink
Midland
Webster
Baytown
KatyMt Belvieu
Nederland, Beaumont
7
1
2
3
5
6
6
37 1
1
2
3
Crude PEP JV PL
Crude Delaware Connector
Crude Wink to Webster PL
Wink rail loading
BatonRouge
Existing
• Connecting Permian crude to the USGC– Assure equity clearing
– Capture full value chain
– Develop opportunities for third party throughput
• Ensuring long-term gas and NGL offtake– Secure advantaged transport
– Maintain sufficient fractionation capacity
7
5
6
Gas Basin to Waha PL
Gas to USGC Markets
NGL Basin to Mt Belvieu PL
Under development
4
4
37ExxonMobil Upstream Permian Spotlight
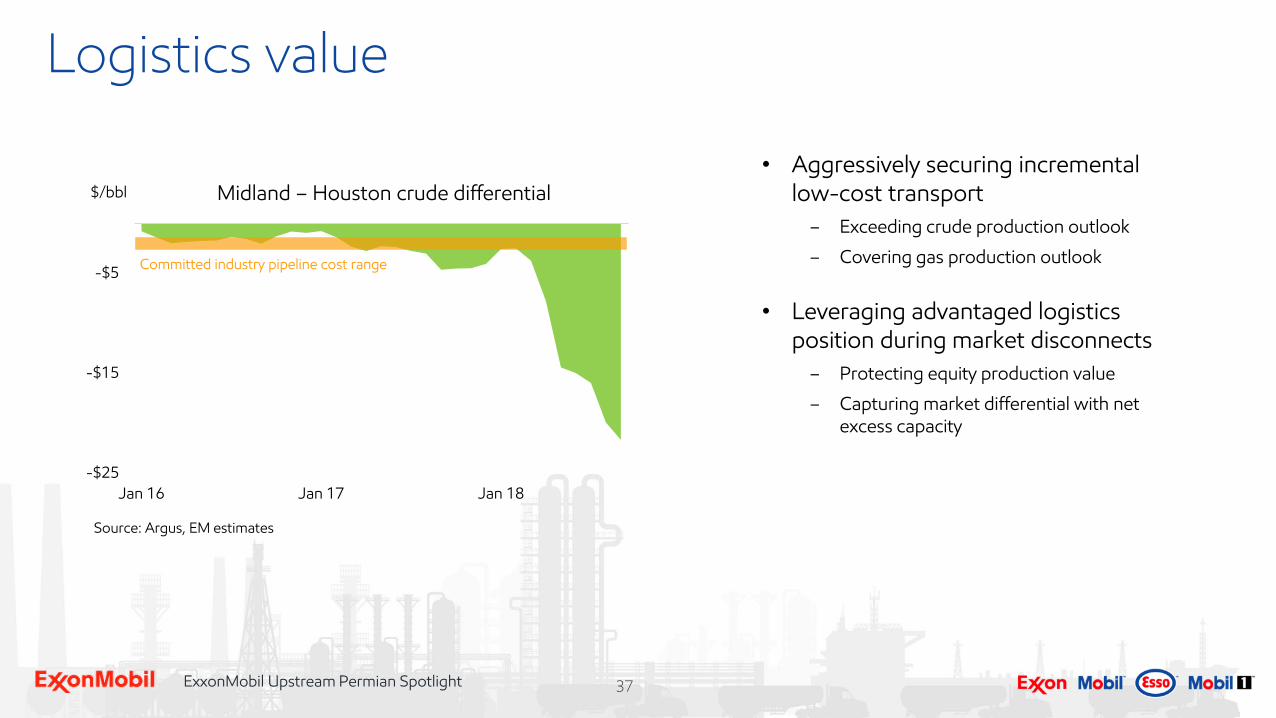
-$25
-$15
-$5
Jan 16 Jan 17 Jan 18
Midland – Houston crude differential
Committed industry pipeline cost range
Source: Argus, EM estimates
Logistics value
• Aggressively securing incremental low-cost transport
– Exceeding crude production outlook
– Covering gas production outlook
• Leveraging advantaged logistics position during market disconnects
– Protecting equity production value
– Capturing market differential with net excess capacity
$/bbl
38ExxonMobil Upstream Permian Spotlight
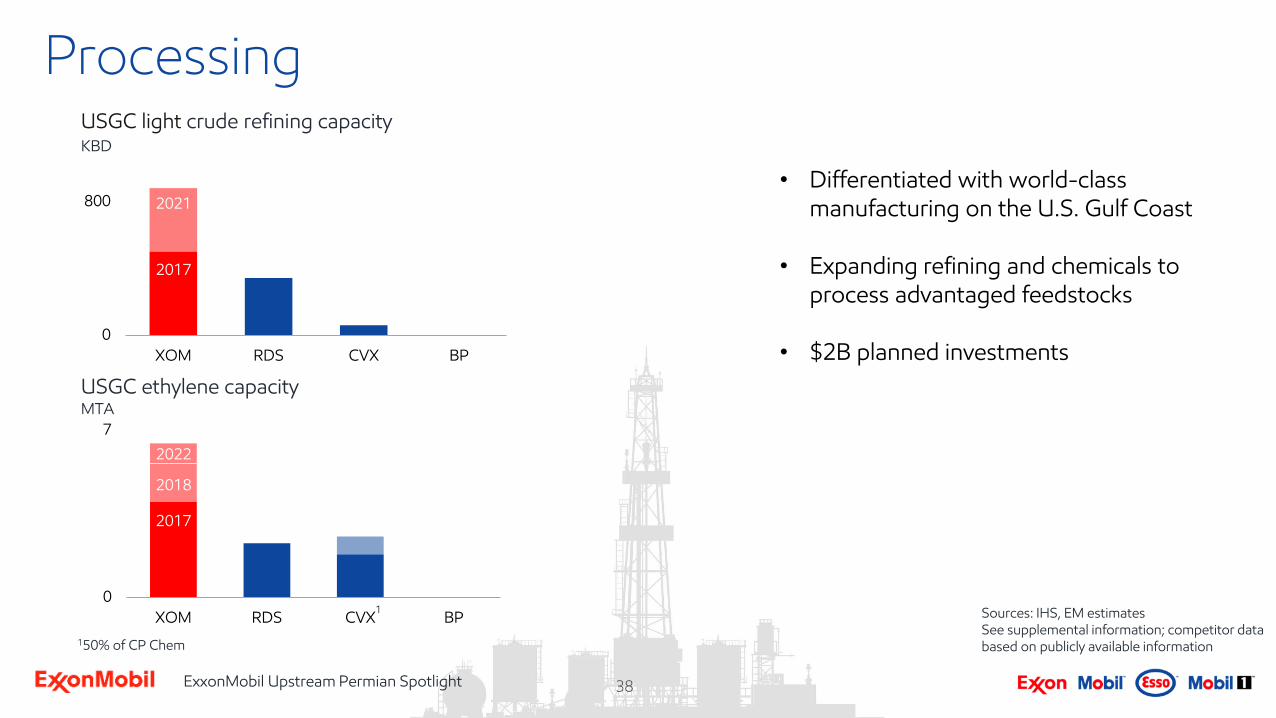
Processing
2025
2017
2025
2017
0
800
XOM RDS CVX BP
0
7
XOM RDS CVX BP
2021
2017
2022
2017
150% of CP Chem
2018
1
USGC light crude refining capacityKBD
USGC ethylene capacityMTA
• Differentiated with world-class manufacturing on the U.S. Gulf Coast
• Expanding refining and chemicals to process advantaged feedstocks
• $2B planned investments
Sources: IHS, EM estimatesSee supplemental information; competitor data based on publicly available information
TechnologyVijay SwarupVice President, Research and Development
40ExxonMobil Upstream Permian Spotlight
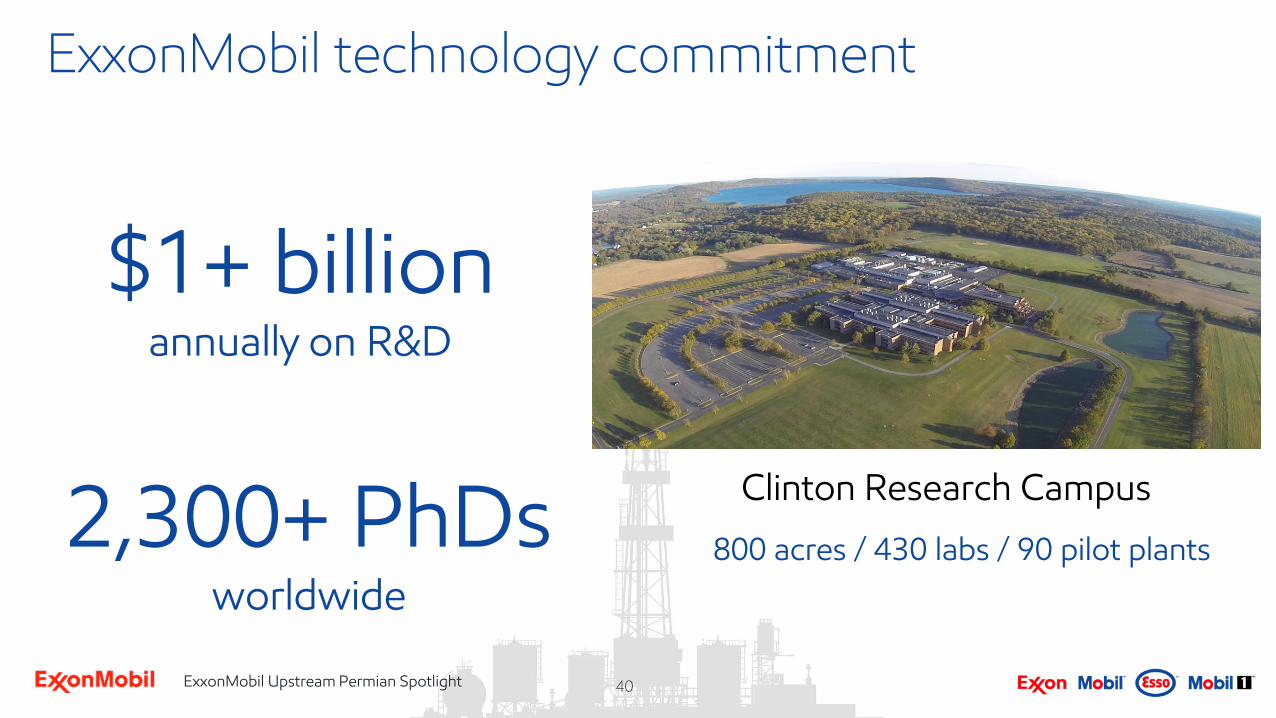
ExxonMobil technology commitment
Clinton Research Campus
800 acres / 430 labs / 90 pilot plants
$1+ billionannually on R&D
2,300+ PhDsworldwide
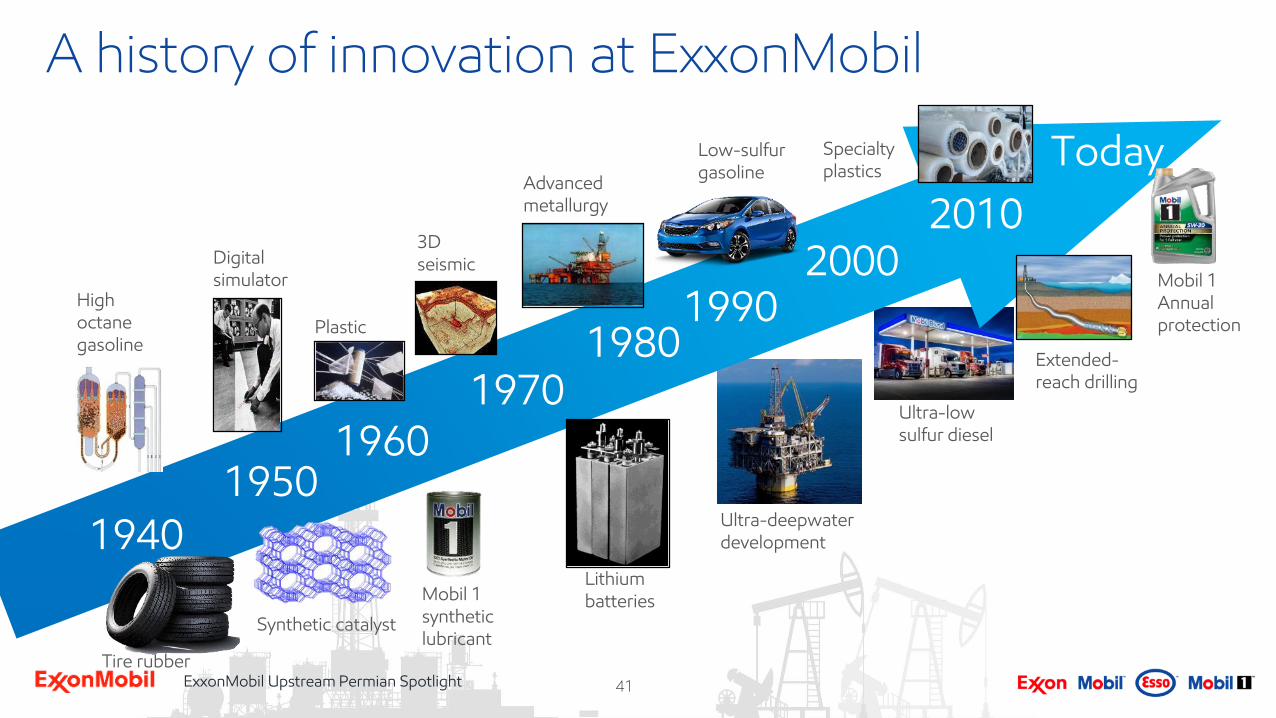
41ExxonMobil Upstream Permian SpotlightTire rubber
A history of innovation at ExxonMobil
1960
1940
19701980
1950
1990
Advancedmetallurgy
Plastic
Ultra-deepwater development
2000
Synthetic catalyst
3DseismicDigital
simulator
Low-sulfur gasoline
High octane gasoline
2010
Mobil 1 synthetic lubricant
Lithium batteries
TodaySpecialty plastics
Ultra-low sulfur diesel
Mobil 1Annual protection
Extended-reach drilling
42ExxonMobil Upstream Permian Spotlight
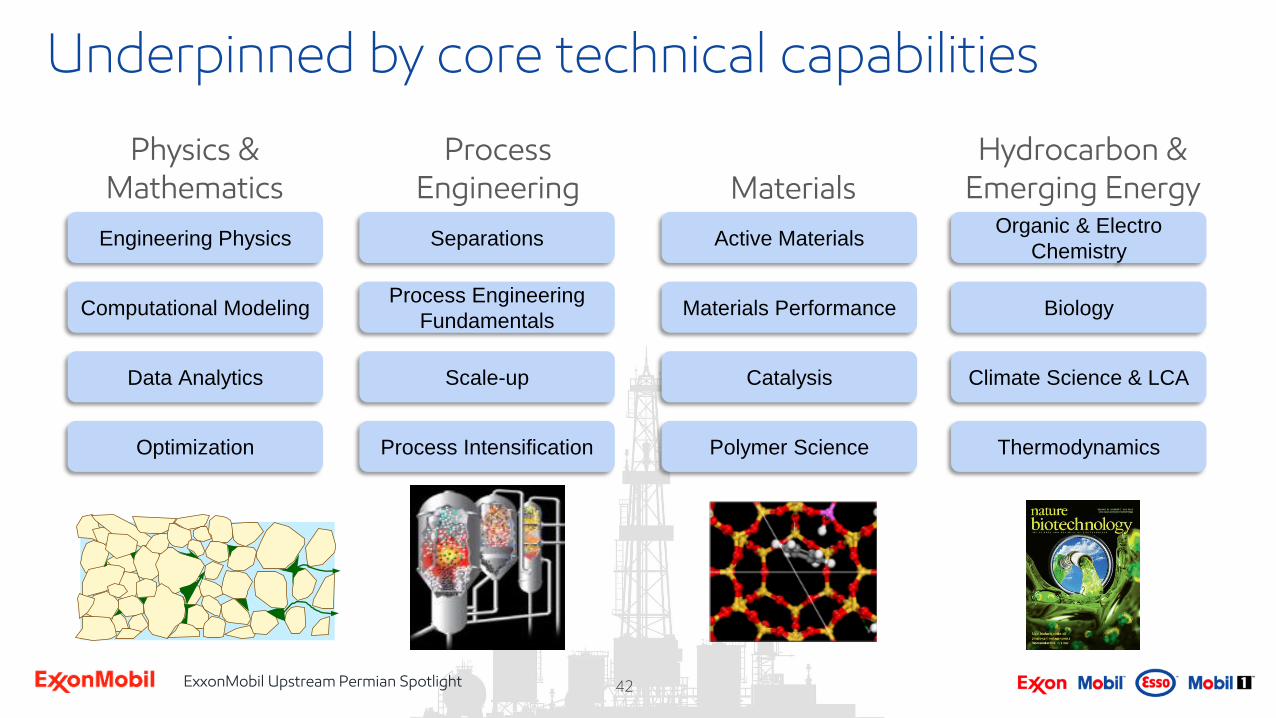
Underpinned by core technical capabilities
Engineering Physics
Computational Modeling
Data Analytics
SeparationsOrganic & Electro
Chemistry
Climate Science & LCA
Biology
Active Materials
Catalysis
Polymer ScienceProcess Intensification
Materials Performance
Physics & Mathematics
Process Engineering Materials
Hydrocarbon & Emerging Energy
Thermodynamics
Scale-up
Process Engineering
Fundamentals
Optimization
43ExxonMobil Upstream Permian Spotlight
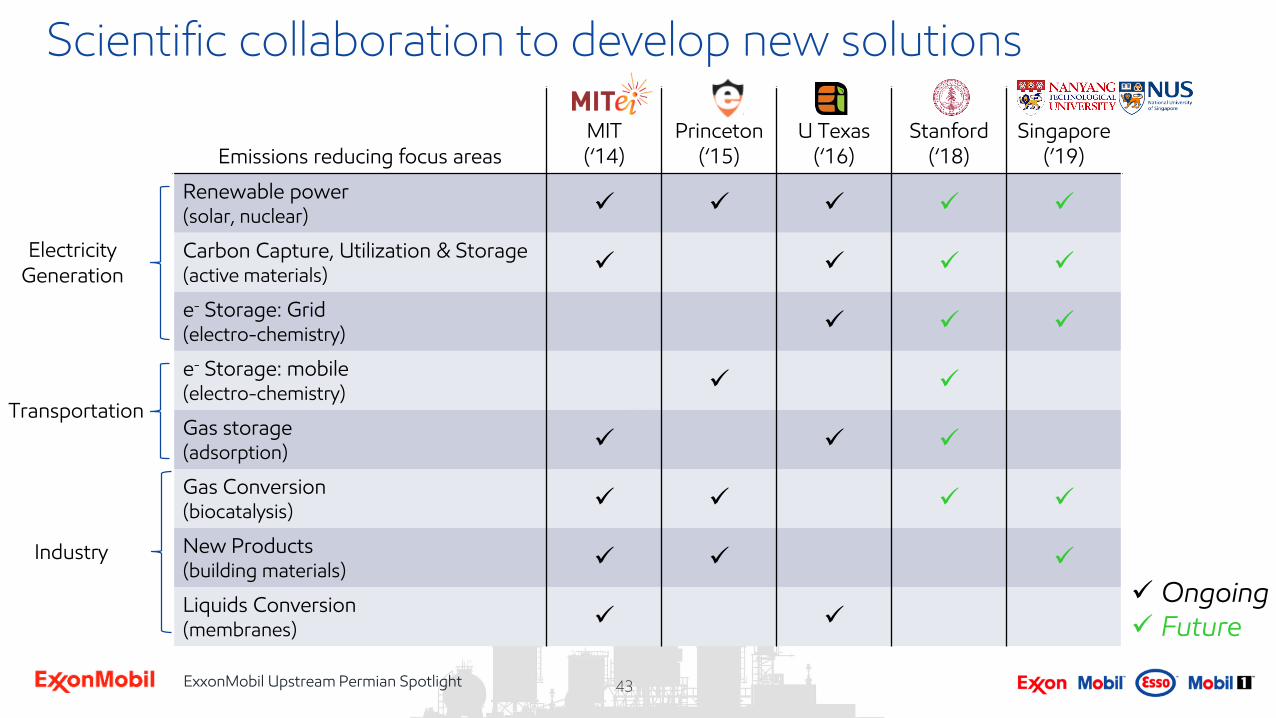
Scientific collaboration to develop new solutions
Emissions reducing focus areasMIT (‘14)
Princeton(‘15)
U Texas(‘16)
Stanford(‘18)
Singapore (’19)
Renewable power(solar, nuclear)
Carbon Capture, Utilization & Storage(active materials)
e- Storage: Grid(electro-chemistry)
e- Storage: mobile(electro-chemistry)
Gas storage(adsorption)
Gas Conversion(biocatalysis)
New Products(building materials)
Liquids Conversion(membranes)
Ongoing Future
Electricity Generation
Transportation
Industry
44ExxonMobil Upstream Permian Spotlight
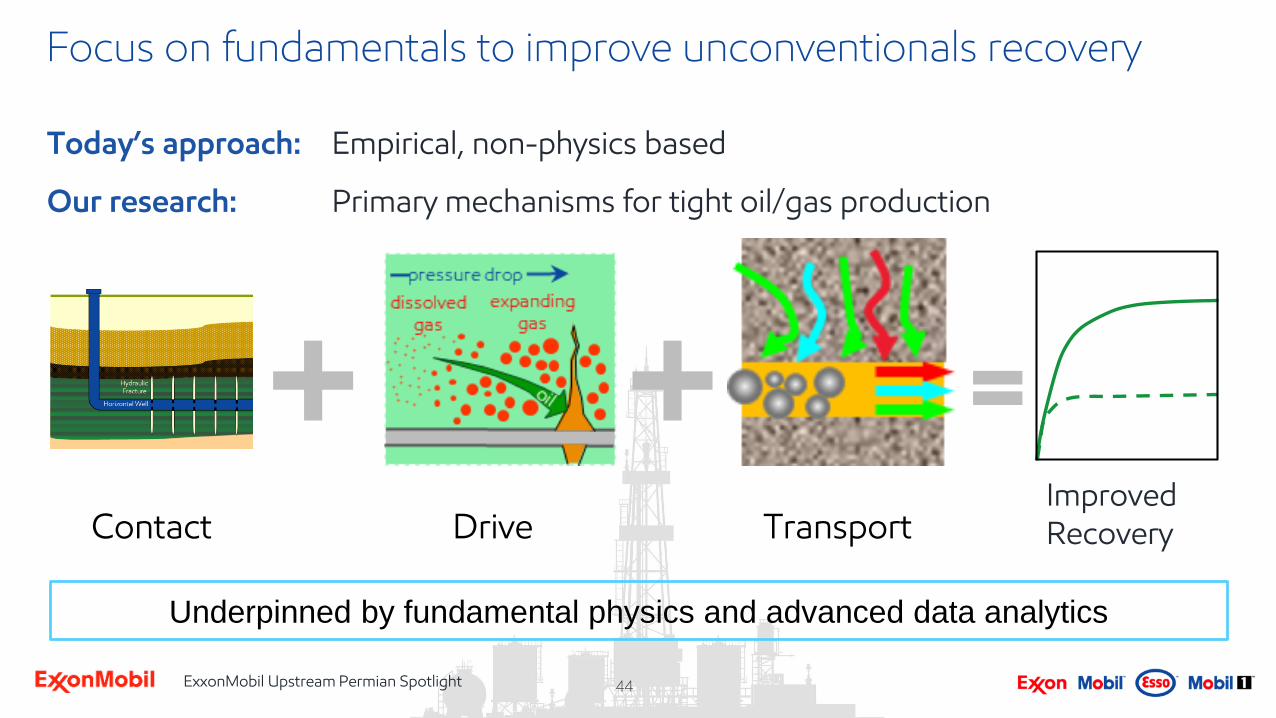
Focus on fundamentals to improve unconventionals recovery
Today’s approach: Empirical, non-physics based
Our research: Primary mechanisms for tight oil/gas production
+Improved Recovery
+Contact Drive Transport
Underpinned by fundamental physics and advanced data analytics
45ExxonMobil Upstream Permian Spotlight
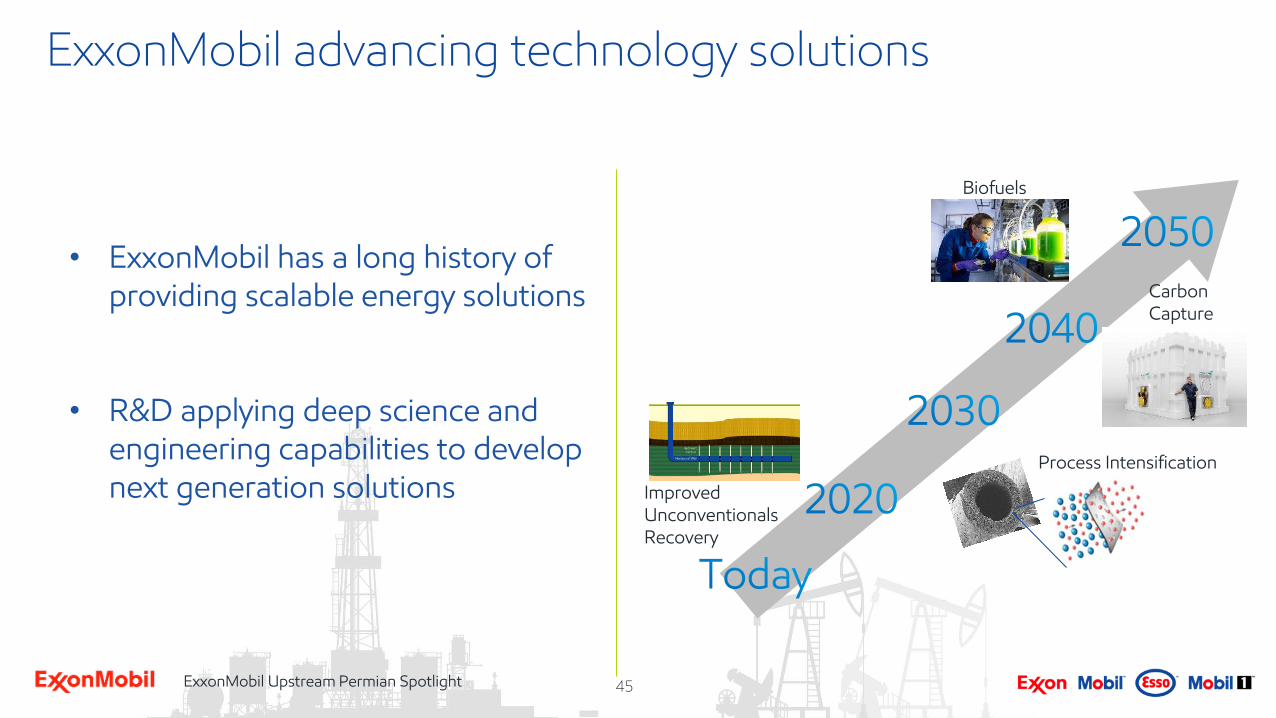
ExxonMobil advancing technology solutions
Improved Unconventionals Recovery
Biofuels
Process Intensification
Carbon Capture
• ExxonMobil has a long history of providing scalable energy solutions
• R&D applying deep science and engineering capabilities to develop next generation solutions
46ExxonMobil Upstream Permian Spotlight
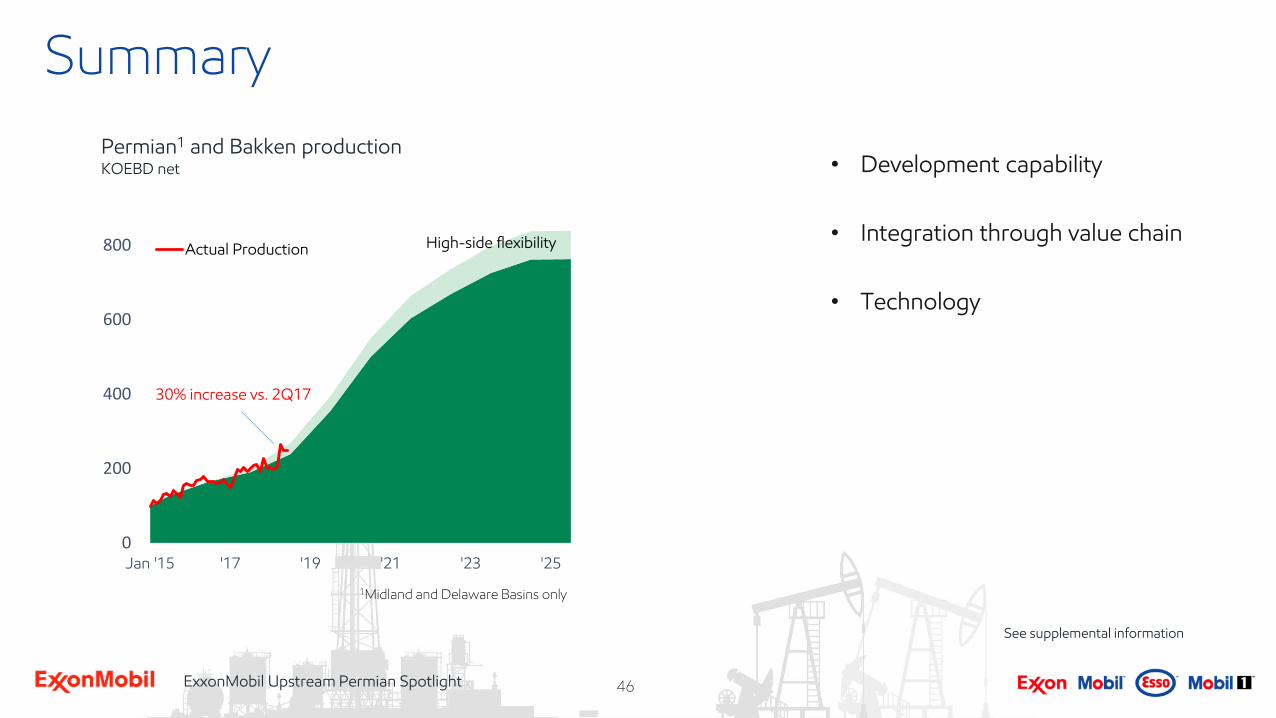
Summary
• Development capability
• Integration through value chain
• Technology
0
200
400
600
800
Jan '15 '17 '19 '21 '23 '25
Actual Production High-side flexibility
30% increase vs. 2Q17
Permian1 and Bakken production KOEBD net
1Midland and Delaware Basins only
See supplemental information
46
47ExxonMobil Upstream Permian Spotlight
Backup
47
48ExxonMobil Upstream Permian Spotlight
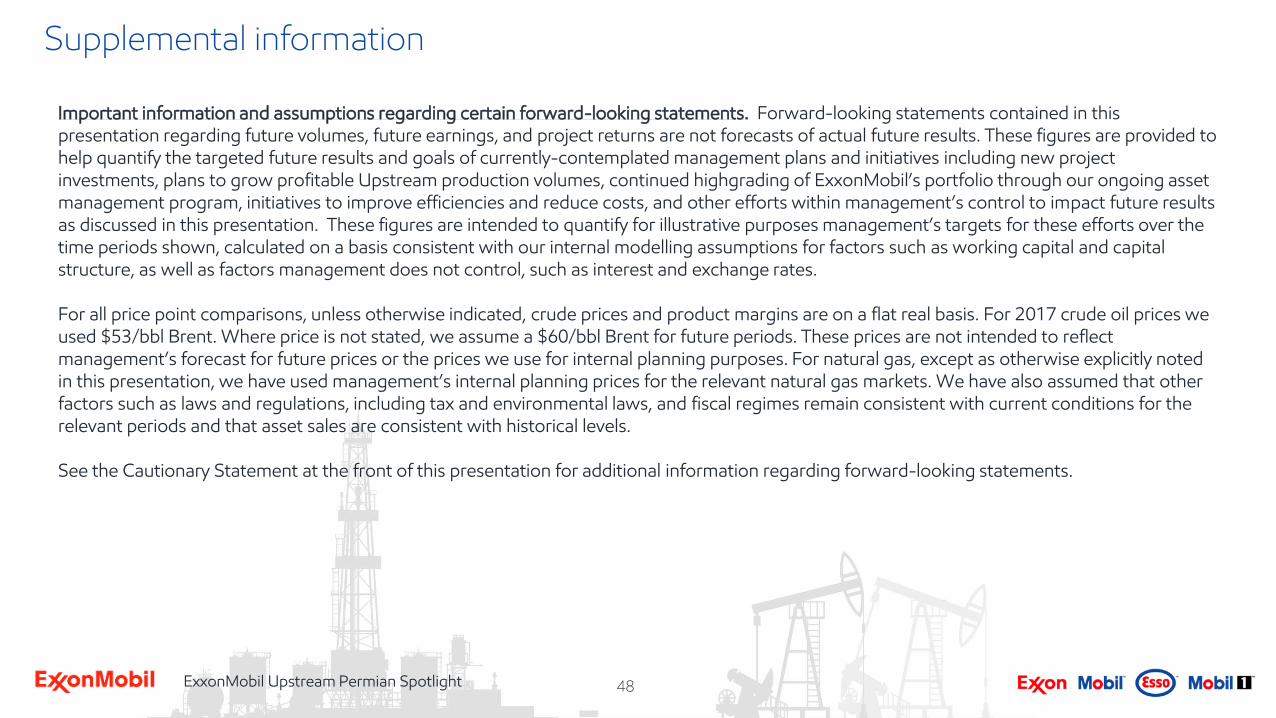
Supplemental information
Important information and assumptions regarding certain forward-looking statements. Forward-looking statements contained in this presentation regarding future volumes, future earnings, and project returns are not forecasts of actual future results. These figures are provided to help quantify the targeted future results and goals of currently-contemplated management plans and initiatives including new project investments, plans to grow profitable Upstream production volumes, continued highgrading of ExxonMobil’s portfolio through our ongoing asset management program, initiatives to improve efficiencies and reduce costs, and other efforts within management’s control to impact future results as discussed in this presentation. These figures are intended to quantify for illustrative purposes management’s targets for these efforts over the time periods shown, calculated on a basis consistent with our internal modelling assumptions for factors such as working capital and capital structure, as well as factors management does not control, such as interest and exchange rates.
For all price point comparisons, unless otherwise indicated, crude prices and product margins are on a flat real basis. For 2017 crude oil prices we used $53/bbl Brent. Where price is not stated, we assume a $60/bbl Brent for future periods. These prices are not intended to reflect management’s forecast for future prices or the prices we use for internal planning purposes. For natural gas, except as otherwise explicitly noted in this presentation, we have used management’s internal planning prices for the relevant natural gas markets. We have also assumed that other factors such as laws and regulations, including tax and environmental laws, and fiscal regimes remain consistent with current conditions for the relevant periods and that asset sales are consistent with historical levels.
See the Cautionary Statement at the front of this presentation for additional information regarding forward-looking statements.
48
49ExxonMobil Upstream Permian Spotlight
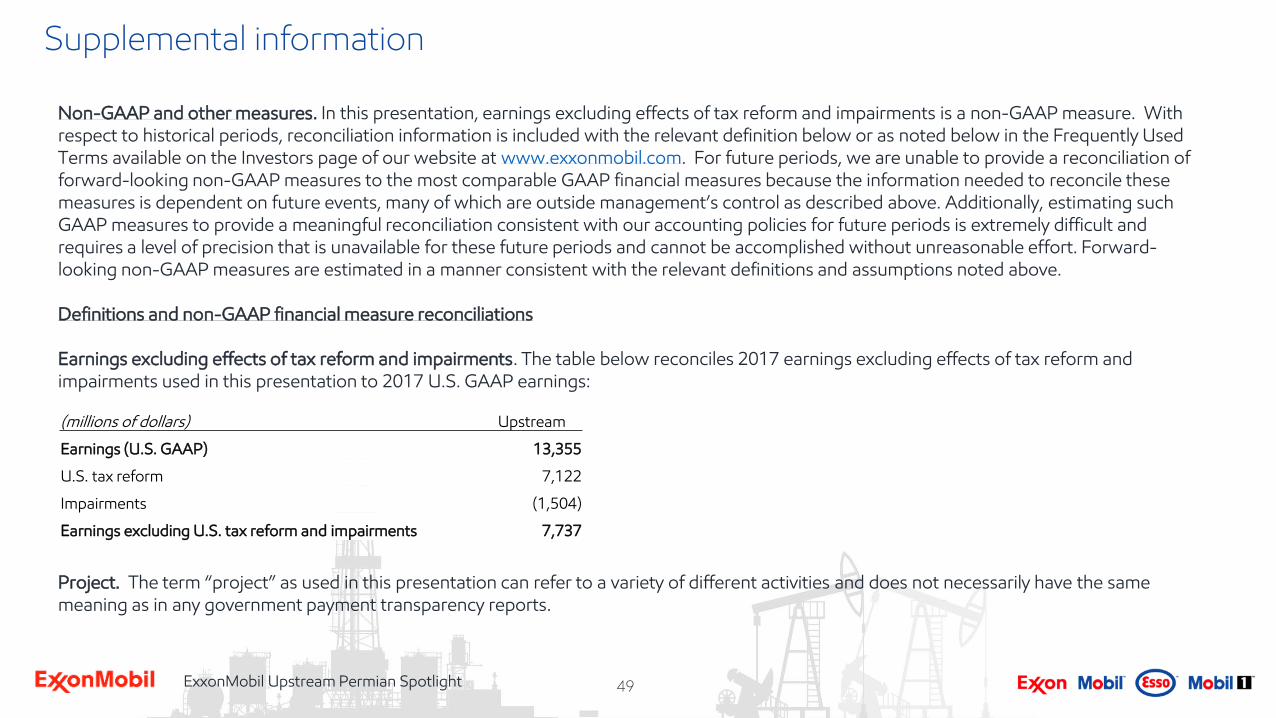
(millions of dollars) Upstream
Earnings (U.S. GAAP) 13,355
U.S. tax reform 7,122
Impairments (1,504)
Earnings excluding U.S. tax reform and impairments 7,737
Supplemental information
Non-GAAP and other measures. In this presentation, earnings excluding effects of tax reform and impairments is a non-GAAP measure. With respect to historical periods, reconciliation information is included with the relevant definition below or as noted below in the Frequently Used Terms available on the Investors page of our website at www.exxonmobil.com. For future periods, we are unable to provide a reconciliation of forward-looking non-GAAP measures to the most comparable GAAP financial measures because the information needed to reconcile these measures is dependent on future events, many of which are outside management’s control as described above. Additionally, estimating such GAAP measures to provide a meaningful reconciliation consistent with our accounting policies for future periods is extremely difficult and requires a level of precision that is unavailable for these future periods and cannot be accomplished without unreasonable effort. Forward-looking non-GAAP measures are estimated in a manner consistent with the relevant definitions and assumptions noted above.
Definitions and non-GAAP financial measure reconciliations
Earnings excluding effects of tax reform and impairments. The table below reconciles 2017 earnings excluding effects of tax reform and impairments used in this presentation to 2017 U.S. GAAP earnings:
Project. The term “project” as used in this presentation can refer to a variety of different activities and does not necessarily have the same meaning as in any government payment transparency reports.
49
50ExxonMobil Upstream Permian Spotlight
Supplemental informationResources, resource base, recoverable resources. These and similar terms include quantities of oil and gas that are not yet classified as proved reserves under SEC definitions but that are expected to be moved into the proved reserves category and produced in the future. Proved reserve figures are determined in accordance with SEC definitions in effect at the end of each applicable year. The term “resource base” or the terms “design / develop” or “evaluating” as used to describe resources are not intended to correspond to SEC definitions such as “probable” or “possible” reserves. The term “in-place” refers to those quantities of oil and gas estimated to be contained in known accumulations and includes recoverable and unrecoverable amounts. “Net resource potential” amounts are not currently included in the resource base.
Returns, investment returns, project returns. Unless referring specifically to ROCE, references to returns, investment returns, project returns, and similar terms mean discounted cash flow returns based on current company estimates. Future investment returns exclude prior exploration and acquisition costs.
Other information
All references to production rates and project capacity are on a gross basis, unless otherwise noted. References to resource size are on a net basis, unless otherwise noted.
Competitor data is based on publicly available information and, where estimated or derived, done so on a consistent basis with ExxonMobil data. We note that certain competitors report financial information under accounting standards other than U.S. GAAP (i.e., IFRS).
Referenced demand scenarios include data taken from BP Energy Outlook; Equinor (Statoil) Reform, Rivalry scenarios; FGE; IEA World Energy Outlook; IHS Rivalry, Vertigo, Autonomy scenarios; PIRA; Shell New Lens scenarios.
Includes data supplied by 1Derrick, its affiliated and subsidiary companies and its data partners; copyright, all rights reserved.
Includes data supplied by Drillinginfo, its affiliated and subsidiary companies and its data partners; copyright, all rights reserved.
Includes data supplied by IHS, its affiliated and subsidiary companies and its data partners; copyright, all rights reserved.
50