Embed Size (px)
Citation preview
T O R A Y I S M
Annual Report 2016April 1, 2015–March 31, 2016
02
Tora
y In
dust
ries,
Inc.
Ann
ual R
epor
t 20
16
Cautionary statement with respect to forward-looking statementsDescriptions of predicted business results, projections and business plans contained in this annual report are based on forecasts and assumptions regarding the future busi-ness environment made at the present time. This annual report is not a guarantee of the Company’s future business performance.
CONTENTS
THIS IS TORAYISM
02-09INTEGRATED VALUE CREATION
10-3310 Toray Group’s vision
12 Consolidated Financial & Non-financial Highlights
14 To Our Stockholders and Investors
24 Special Feature hitoe®: Functional Material that Biosenses Body Signals
26 Toray Group Segments
INTEGRATED VALUE MANAGEMENT
34-5435 R&D and Intellectual Property
41 Sustainable Management
52 Corporate Information
FINANCIAL SECTION
55-9656 Six-Year Summary of Selected Financial Data
57 Management’s Discussion and Analysis
62 Consolidated Balance Sheets
64 Consolidated Statements of Income
64 Consolidated Statements of Comprehensive Income
65 Consolidated Statements of Changes in Net Assets
66 Consolidated Statements of Cash Flows
67 Notes to Consolidated Financial Statements
95 Independent Auditor’s Report
96 Investor Information and Corporate Data
03
Tora
y In
dust
ries,
Inc.
Ann
ual R
epor
t 20
16
PROFILEToray Group is an integrated chemical industry group aiming to be a global top company in advanced materials based on the firm belief that, “as the foundation of products, materials have the power to bring about fundamental transformations in society.” Based on our core technologies of organic synthetic chemistry, polymer chemistry, biotechnology, and nanotechnology as the sources of value creation, we develop the Core Growth Driving Businesses of Fibers & Textiles and Plastics & Chemicals, Strategically Expanding Businesses of IT-related Products and Carbon Fiber Composite Materials, and Intensively Developing and Expanding Businesses of Environment & Engineering and Life Science in 26 countries and regions around the world. Toray aims to be a corporate group with high value for all stakeholders and seeks to use the power of chemistry to ad-dress social issues worldwide guided by our corporate philosophy of “contributing to society through the creation of new
value with innovative ideas, technologies and products.”
CORPORATE PHILOSOPHYContributing to society through the creation of new value with innovative ideas, technologies and products
CORPORATE MISSIONSFor our customers To provide new value to our customers through high-quality products and superior services
For our employees To provide our employees with opportunities for self development in a challenging environment
For our stockholders To provide our stockholders with dependable and trustworthy management
For society To establish ties and develop mutual trust as a responsible corporate citizen
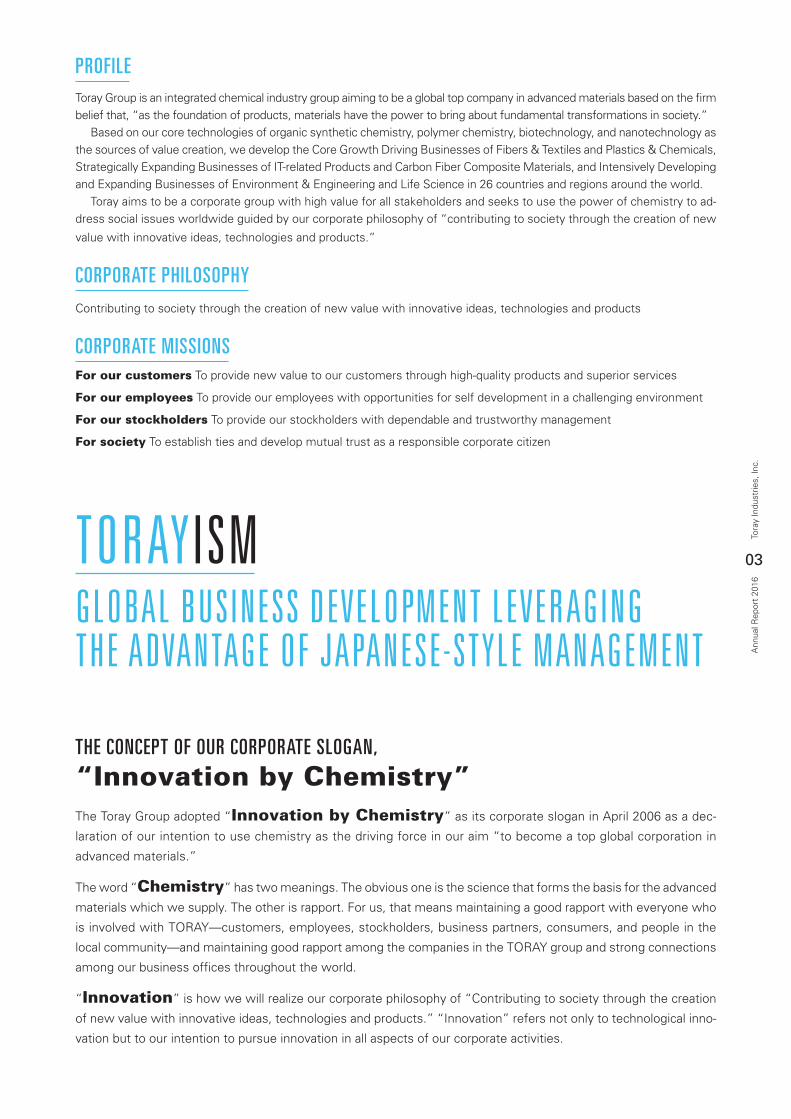
THE CONCEPT OF OUR CORPORATE SLOGAN,
“Innovation by Chemistry”The Toray Group adopted “Innovation by Chemistry” as its corporate slogan in April 2006 as a dec-
laration of our intention to use chemistry as the driving force in our aim “to become a top global corporation in
advanced materials.”
The word “Chemistry” has two meanings. The obvious one is the science that forms the basis for the advanced
materials which we supply. The other is rapport. For us, that means maintaining a good rapport with everyone who
is involved with TORAY—customers, employees, stockholders, business partners, consumers, and people in the
local community—and maintaining good rapport among the companies in the TORAY group and strong connections
among our business offices throughout the world.
“Innovation” is how we will realize our corporate philosophy of “Contributing to society through the creation
of new value with innovative ideas, technologies and products.” “Innovation” refers not only to technological inno-
vation but to our intention to pursue innovation in all aspects of our corporate activities.
TORAYISMGLOBAL BUSINESS DEVELOPMENT LEVERAGING THE ADVANTAGE OF JAPANESE-STYLE MANAGEMENT
04
Tora
y In
dust
ries,
Inc.
Ann
ual R
epor
t 20
16
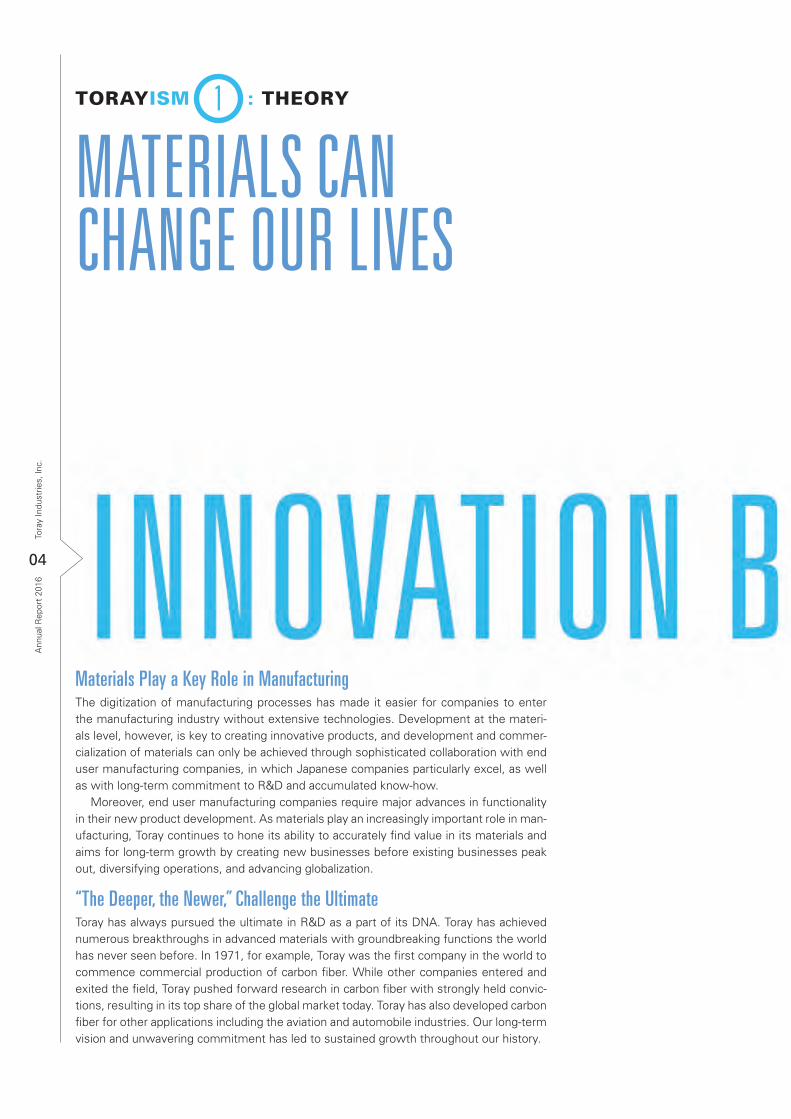
MATERIALS CANCHANGE OUR LIVES
TORAYISM : THEORY1
Materials Play a Key Role in ManufacturingThe digitization of manufacturing processes has made it easier for companies to enter the manufacturing industry without extensive technologies. Development at the materi-als level, however, is key to creating innovative products, and development and commer-cialization of materials can only be achieved through sophisticated collaboration with end user manufacturing companies, in which Japanese companies particularly excel, as well as with long-term commitment to R&D and accumulated know-how. Moreover, end user manufacturing companies require major advances in functionality in their new product development. As materials play an increasingly important role in man-ufacturing, Toray continues to hone its ability to accurately find value in its materials and aims for long-term growth by creating new businesses before existing businesses peak out, diversifying operations, and advancing globalization.
“The Deeper, the Newer,” Challenge the UltimateToray has always pursued the ultimate in R&D as a part of its DNA. Toray has achieved numerous breakthroughs in advanced materials with groundbreaking functions the world has never seen before. In 1971, for example, Toray was the first company in the world to commence commercial production of carbon fiber. While other companies entered and exited the field, Toray pushed forward research in carbon fiber with strongly held convic-tions, resulting in its top share of the global market today. Toray has also developed carbon fiber for other applications including the aviation and automobile industries. Our long-term vision and unwavering commitment has led to sustained growth throughout our history.
05
Tora
y In
dust
ries,
Inc.
Ann
ual R
epor
t 20
16
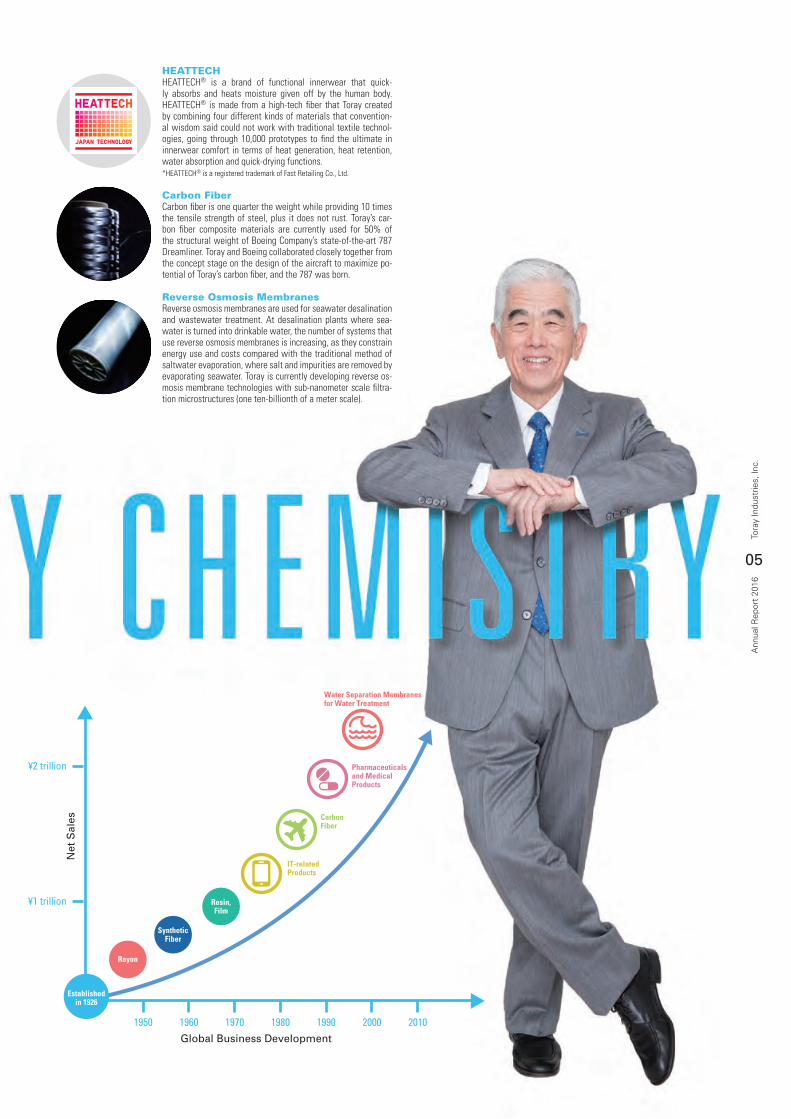
Rayon
SyntheticFiber
Resin,Film
Pharmaceuticalsand MedicalProducts
CarbonFiber
Water Separation Membranes for Water Treatment
IT-relatedProducts
1950 1960 1970 1980 1990 2000 2010Global Business Development
Establishedin 1926
¥2 trillion
¥1 trillion
Net
Sal
esHEATTECHHEATTECH® is a brand of functional innerwear that quick-ly absorbs and heats moisture given off by the human body. HEATTECH® is made from a high-tech fiber that Toray created by combining four different kinds of materials that convention-al wisdom said could not work with traditional textile technol-ogies, going through 10,000 prototypes to find the ultimate in innerwear comfort in terms of heat generation, heat retention, water absorption and quick-drying functions.*HEATTECH® is a registered trademark of Fast Retailing Co., Ltd.
Carbon FiberCarbon fiber is one quarter the weight while providing 10 times the tensile strength of steel, plus it does not rust. Toray’s car-bon fiber composite materials are currently used for 50% of the structural weight of Boeing Company’s state-of-the-art 787 Dreamliner. Toray and Boeing collaborated closely together from the concept stage on the design of the aircraft to maximize po-tential of Toray’s carbon fiber, and the 787 was born.
Reverse Osmosis MembranesReverse osmosis membranes are used for seawater desalination and wastewater treatment. At desalination plants where sea-water is turned into drinkable water, the number of systems that use reverse osmosis membranes is increasing, as they constrain energy use and costs compared with the traditional method of saltwater evaporation, where salt and impurities are removed by evaporating seawater. Toray is currently developing reverse os-mosis membrane technologies with sub-nanometer scale filtra-tion microstructures (one ten-billionth of a meter scale).
J A P A N E S E Q U A L I T Y W O R L D S T A G E06
Tora
y In
dust
ries,
Inc.
Ann
ual R
epor
t 20
16
GLOBAL DEPLOYMENT OF TECHNOLOGIES DEVELOPEDIN JAPAN
TORAYISM : GLOBALIZATION2
Global Management with Respect for DiversitySince Toray commenced local production of textile products in Southeast Asia in the 1960s, global business development has been an engine of growth. Viewing global business development from a long-term perspective, Toray’s basic policy is to contribute to each country’s industrial development, export growth, and techno-logical advancement. We aim to contribute to local communities while respecting diversity and local customs, while at the same time bringing the best aspects of Japanese-style management to our long-term commitment.
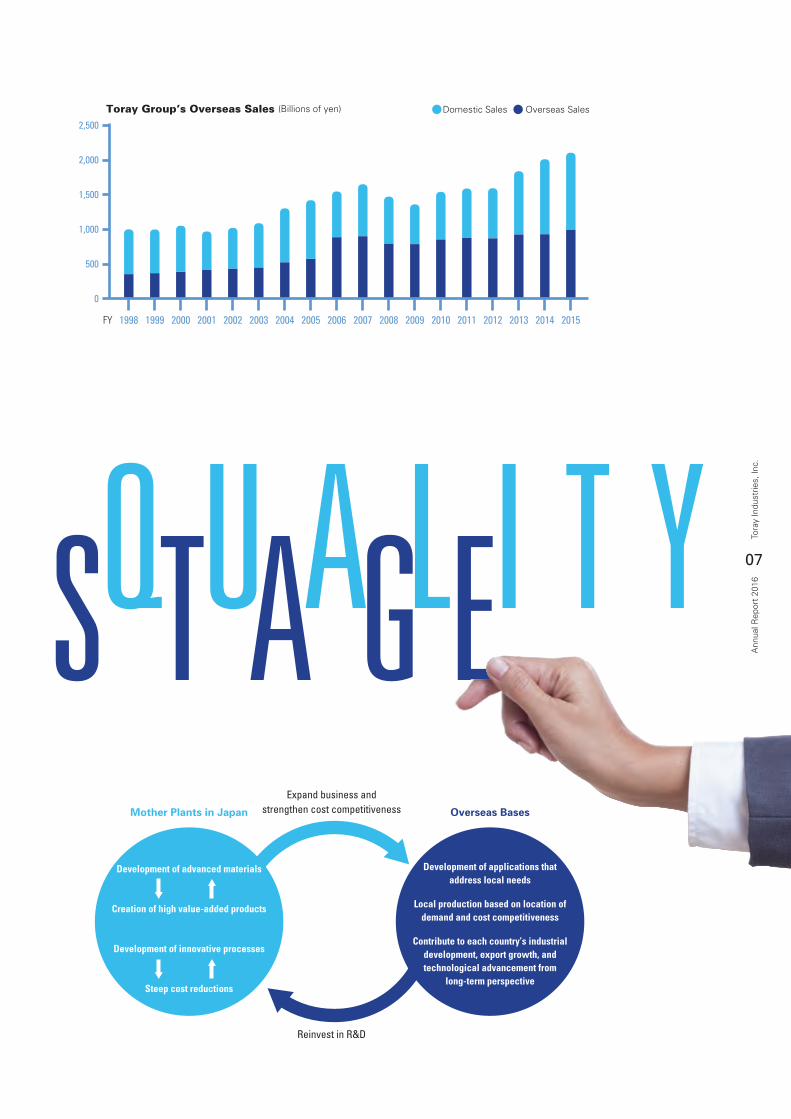
Creating a Sustainable Growth Cycle on a Global ScaleToray conducts cutting-edge R&D in Japan to create advanced materials and high value-added products. The Company strives to develop innovative processes all the way through to the production technology stage in the commercialization of new products. Toray then aims to expand the business further through the devel-opment of applications that address local needs, as well as through the optimal use of its overseas production bases in terms of demand location and cost com-petitiveness. Profits earned are then reinvested in next-generation R&D at our mother plants in Japan. These efforts nurture a long-term sustainable growth cycle on a global scale.
J A P A N E S E Q U A L I T Y W O R L D S T A G E
Toray Group’s Overseas Sales (Billions of yen) Domestic Sales Overseas Sales
1998FY 1999 2000 2001 2002 2003 2004 2005 2006 2007 2008 2009 2010 2011 2012 2013 2014 2015
2,500
2,000
1,500
1,000
500
0
Mother Plants in Japan Overseas Bases
Expand business andstrengthen cost competitiveness
Development of advanced materials
Creation of high value-added products
Development of innovative processes
Steep cost reductions
Reinvest in R&D
Development of applications that address local needs
Local production based on location of demand and cost competitiveness
Contribute to each country’s industrial development, export growth, and technological advancement from
long-term perspective
07
Tora
y In
dust
ries,
Inc.
Ann
ual R
epor
t 20
16
DO THE RIGHT THINGS
ACHIEVE SUSTAINABLE GROWTH AND INCREASE CORPORATE VALUE OVER THE LONGER TERM
08
Tora
y In
dust
ries,
Inc.
Ann
ual R
epor
t 20
16
08
Tora
y In
dust
ries,
Inc.
Ann
ual R
epor
t 20
16
TORAYISM : MANAGEMENT3
Rapid Decision-Making via Board Members withDeep Understanding of Business and Executive ResponsibilitiesToray supplies highly specialized, advanced materials to a broad range of indus-tries. Toray has put in place a system for monitoring the business execution of its Board members, who are given responsibilities for rapid decision-making in busi-ness execution based on their deep knowledge of its business. This governance structure oversees operations through a system in which the management works in tandem with on-site personnel, and, in supervising business management, assesses wide-ranging, varying risks from diverse perspective based on special-ized knowledge of each business. Through the management of its businesses, Toray is expected to exhibit leadership in helping solve social issues through its products and technologies, achieving sustainable growth with society and increas-ing corporate value over the medium- and long-term.
Contributions to All StakeholdersToray does not solely prioritize the pursuit of short-term profits. Toray believes companies are “public institutions” that exist for the benefit of society. We take a long-term perspective on management, based on capitalism in the public interest, emphasizing contributions (i.e., public interest) to all stakeholders including stock-holders, employees, customers, partners and local communities. In this regard, the corporate value of Toray depends on the trust placed in us by all stakeholders over the long term.

DO THE RIGHT THINGS 09
Tora
y In
dust
ries,
Inc.
Ann
ual R
epor
t 20
16
INTEGRATED VALUE CREATION
2000FY 2001 2002 2003 2004 2005 2006 2007 2008 2009 2010 2011 2012 2013 2014 2016(Target)
Around2020
(Image)
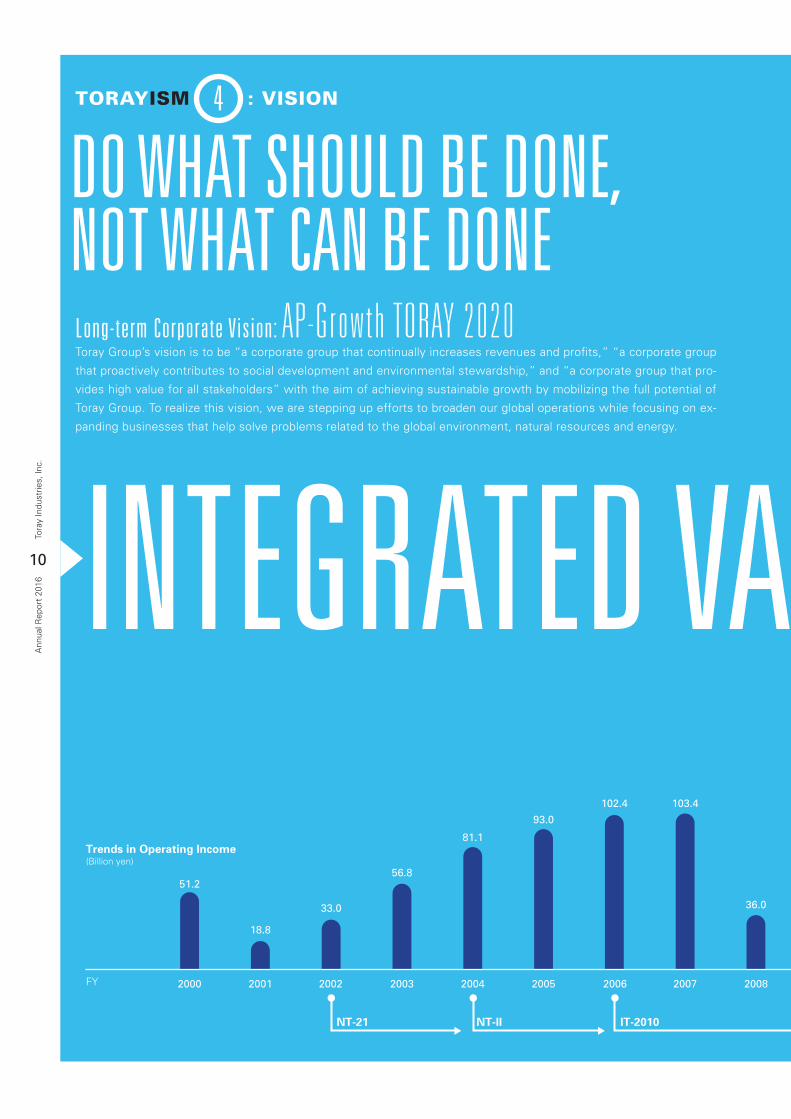
51.2
18.8
33.0
56.8
81.1
93.0
102.4 103.4
36.0 40.1
100.1107.7
83.4
105.3
123.5
2015
154.5
170.0
NT-21
Trends in Operating Income(Billion yen)
NT-II IT-2010 IT-II AP-G 2013 AP-G 2016
10
Tora
y In
dust
ries,
Inc.
Ann
ual R
epor
t 20
16
DO WHAT SHOULD BE DONE, NOT WHAT CAN BE DONE
TORAYISM : VISION4
Long-term Corporate Vision: AP -G rowth TORAY 2020Toray Group’s vision is to be “a corporate group that continually increases revenues and profits,” “a corporate group
that proactively contributes to social development and environmental stewardship,” and “a corporate group that pro-
vides high value for all stakeholders” with the aim of achieving sustainable growth by mobilizing the full potential of
Toray Group. To realize this vision, we are stepping up efforts to broaden our global operations while focusing on ex-
panding businesses that help solve problems related to the global environment, natural resources and energy.
INTEGRATED VALUE CREATION
2000FY 2001 2002 2003 2004 2005 2006 2007 2008 2009 2010 2011 2012 2013 2014 2016(Target)
Around2020
(Image)
51.2
18.8
33.0
56.8
81.1
93.0
102.4 103.4
36.0 40.1
100.1107.7
83.4
105.3
123.5
2015
154.5
170.0
NT-21
Trends in Operating Income(Billion yen)
NT-II IT-2010 IT-II AP-G 2013 AP-G 2016
11
Tora
y In
dust
ries,
Inc.
Ann
ual R
epor
t 20
16
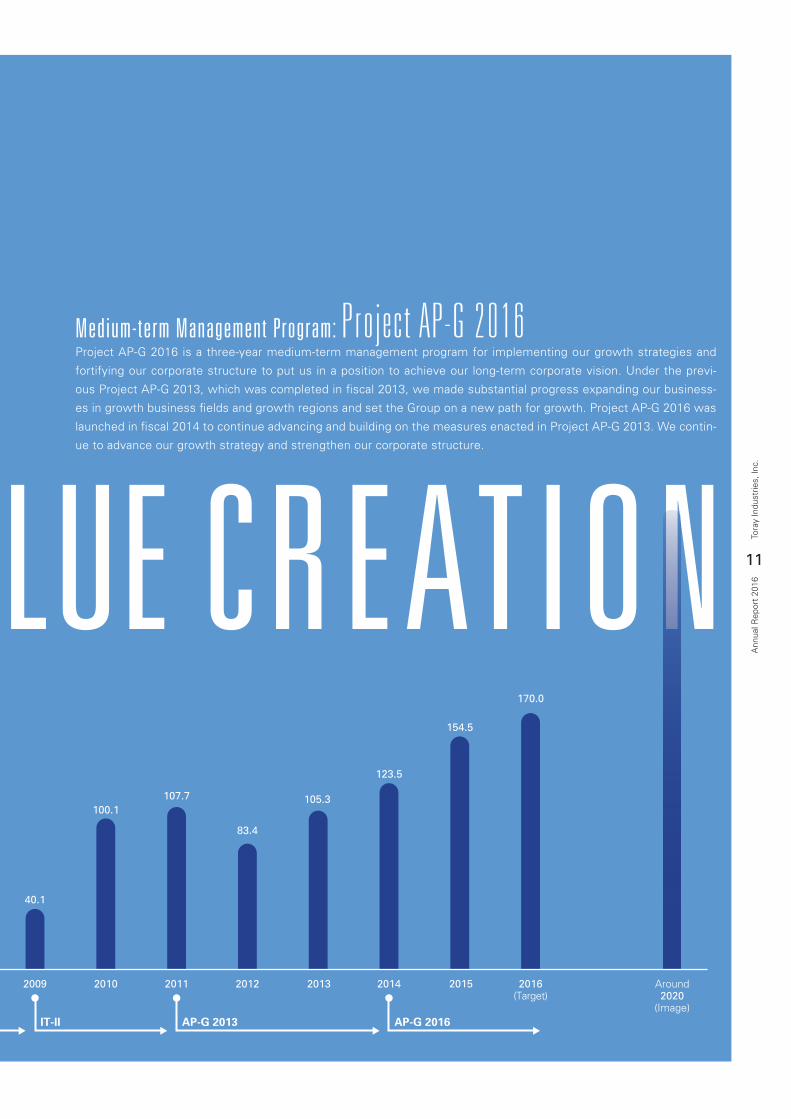
Medium-term Management Program: Pro j e c t AP -G 2016Project AP-G 2016 is a three-year medium-term management program for implementing our growth strategies and
fortifying our corporate structure to put us in a position to achieve our long-term corporate vision. Under the previ-
ous Project AP-G 2013, which was completed in fiscal 2013, we made substantial progress expanding our business-
es in growth business fields and growth regions and set the Group on a new path for growth. Project AP-G 2016 was
launched in fiscal 2014 to continue advancing and building on the measures enacted in Project AP-G 2013. We contin-
ue to advance our growth strategy and strengthen our corporate structure.
12
Tora
y In
dust
ries,
Inc.
Ann
ual R
epor
t 20
16
Millions of yenThousands ofU.S. dollars*1
2016 2015 2014 2013 2012 2016
Financial Highlights
For the year:
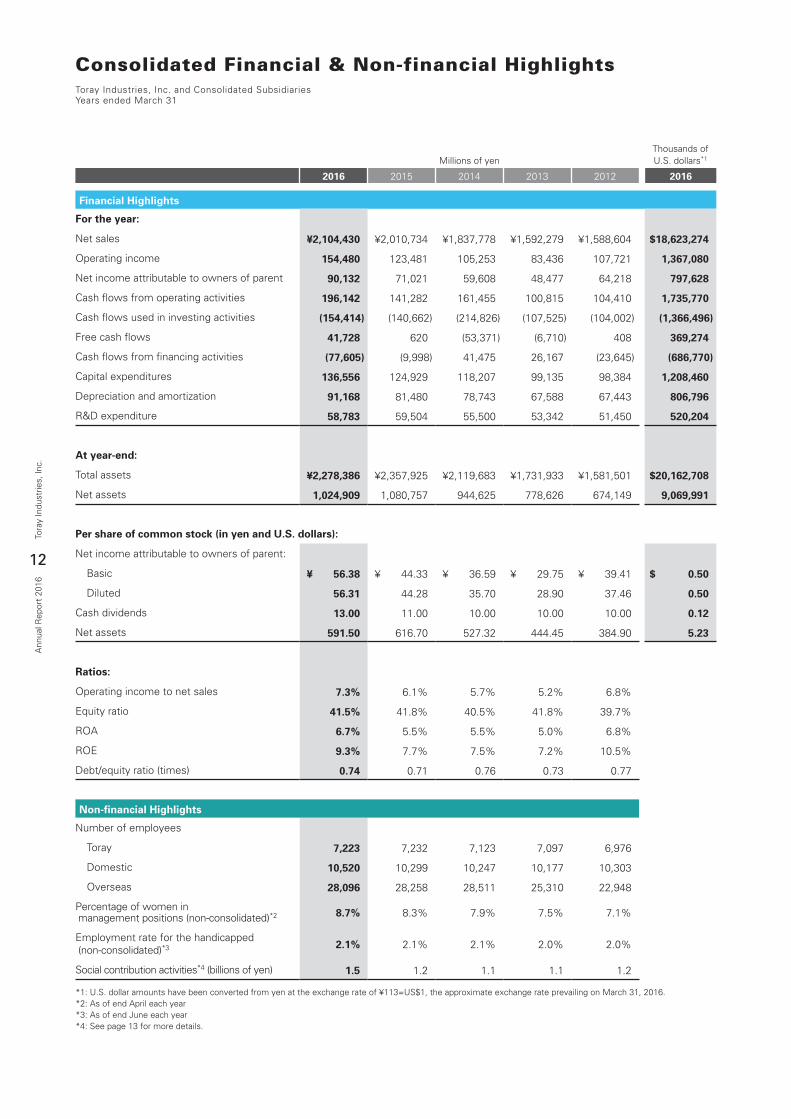
Net sales ¥2,104,430 ¥2,010,734 ¥1,837,778 ¥1,592,279 ¥1,588,604 $18,623,274
Operating income 154,480 123,481 105,253 83,436 107,721 1,367,080
Net income attributable to owners of parent 90,132 71,021 59,608 48,477 64,218 797,628
Cash flows from operating activities 196,142 141,282 161,455 100,815 104,410 1,735,770
Cash flows used in investing activities (154,414) (140,662) (214,826) (107,525) (104,002) (1,366,496)
Free cash flows 41,728 620 (53,371) (6,710) 408 369,274
Cash flows from financing activities (77,605) (9,998) 41,475 26,167 (23,645) (686,770)
Capital expenditures 136,556 124,929 118,207 99,135 98,384 1,208,460
Depreciation and amortization 91,168 81,480 78,743 67,588 67,443 806,796
R&D expenditure 58,783 59,504 55,500 53,342 51,450 520,204
At year-end:
Total assets ¥2,278,386 ¥2,357,925 ¥2,119,683 ¥1,731,933 ¥1,581,501 $20,162,708
Net assets 1,024,909 1,080,757 944,625 778,626 674,149 9,069,991
Per share of common stock (in yen and U.S. dollars):
Net income attributable to owners of parent:
Basic ¥ 56.38 ¥ 44.33 ¥ 36.59 ¥ 29.75 ¥ 39.41 $ 0.50
Diluted 56.31 44.28 35.70 28.90 37.46 0.50
Cash dividends 13.00 11.00 10.00 10.00 10.00 0.12
Net assets 591.50 616.70 527.32 444.45 384.90 5.23
Ratios:
Operating income to net sales 7.3% 6.1% 5.7% 5.2% 6.8%
Equity ratio 41.5% 41.8% 40.5% 41.8% 39.7%
ROA 6.7% 5.5% 5.5% 5.0% 6.8%
ROE 9.3% 7.7% 7.5% 7.2% 10.5%
Debt/equity ratio (times) 0.74 0.71 0.76 0.73 0.77
Non-financial Highlights
Number of employees
Toray 7,223 7,232 7,123 7,097 6,976
Domestic 10,520 10,299 10,247 10,177 10,303
Overseas 28,096 28,258 28,511 25,310 22,948
Percentage of women in management positions (non-consolidated)*2 8.7% 8.3% 7.9% 7.5% 7.1%
Employment rate for the handicapped (non-consolidated)*3 2.1% 2.1% 2.1% 2.0% 2.0%
Social contribution activities*4 (billions of yen) 1.5 1.2 1.1 1.1 1.2
Consolidated Financial & Non-financial HighlightsToray Industries, Inc. and Consolidated SubsidiariesYears ended March 31
*1: U.S. dollar amounts have been converted from yen at the exchange rate of ¥113=US$1, the approximate exchange rate prevailing on March 31, 2016.*2: As of end April each year*3: As of end June each year*4: See page 13 for more details.
13
Tora
y In
dust
ries,
Inc.
Ann
ual R
epor
t 20
16
2,500
1,500
1,000
500
0
2,000
120
60
40
20
0
100
80
200
50
-50
-150
-250
150
100
0
-100
-200
12
9
6
3
0
15
6
3
0
12
9
200
100
50
0
8
6
4
2
0
150
1,000
500
0
60
30
0
250 15
750 45
50,000
40,000
20,000
10,000
0
30,000
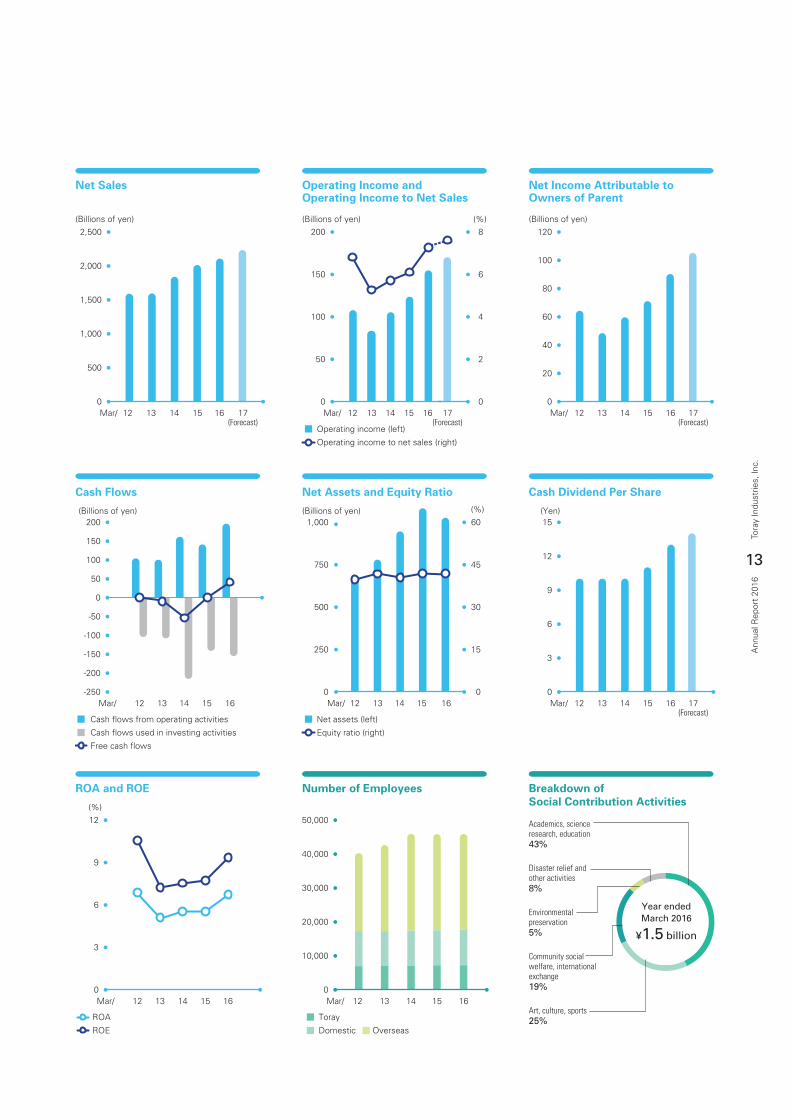
Year endedMarch 2016
¥1.5 billion
Academics, science research, education43%
Disaster relief and other activities8%
Environmentalpreservation5%
Community socialwelfare, internationalexchange19%
Art, culture, sports25%
12Mar/ 13 14 15 16 17(Forecast)
12Mar/ 13 14 15 16 17(Forecast)
12Mar/ 13 14 15 16
12Mar/ 13 14 15 16 12Mar/ 13 14 15 16
12Mar/ 13 14 15 16 17(Forecast)
12Mar/ 13 14 15 16 17(Forecast)
(%)
12Mar/ 13 14 15 16
Operating income (left)
Operating income to net sales (right)
Net assets (left)
Equity ratio (right)
Cash flows from operating activities
Cash flows used in investing activities
Free cash flows
Toray
Domestic Overseas
ROA
ROE
Net Sales
(Billions of yen)
Net Income Attributable toOwners of Parent
(Billions of yen)
Cash Flows
(Billions of yen)
Net Assets and Equity Ratio
ROA and ROE
(%)
Cash Dividend Per Share
(Yen)
Operating Income andOperating Income to Net Sales
(Billions of yen)
(Billions of yen)
(%)
Breakdown of Social Contribution Activities
Number of Employees
14
Tora
y In
dust
ries,
Inc.
Ann
ual R
epor
t 20
16
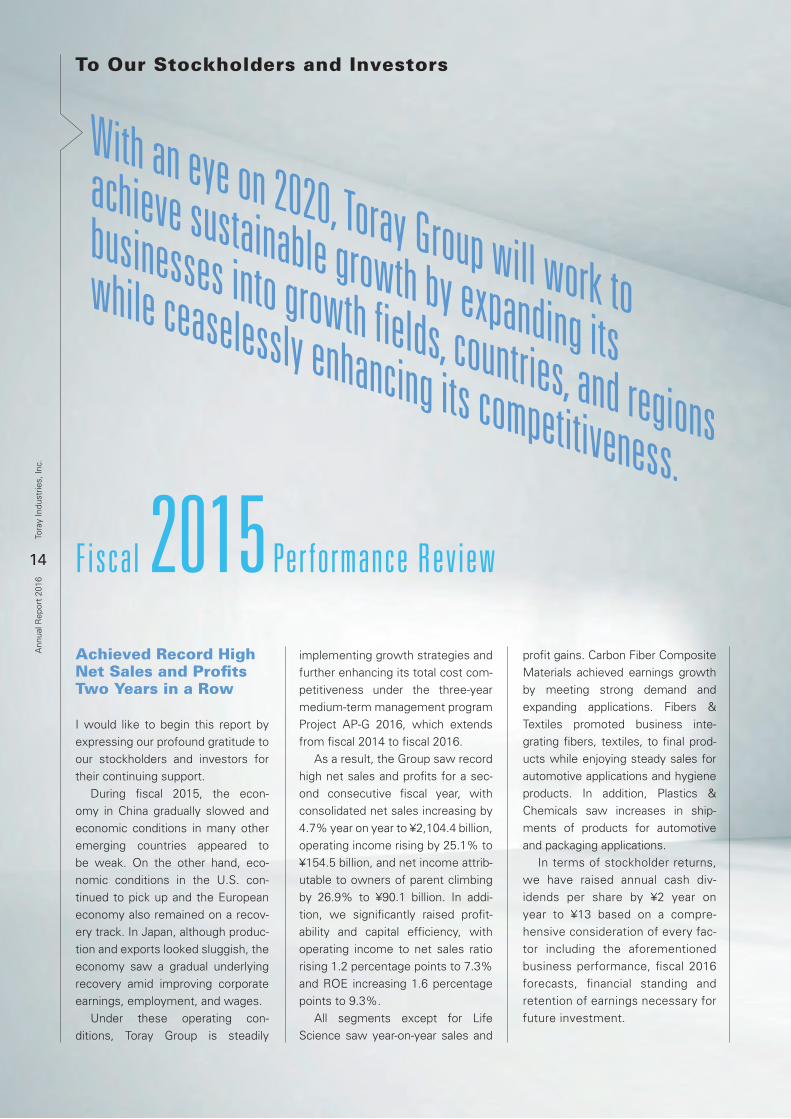
To Our Stockholders and Investors
With an eye on 2020, Toray Group will work to
achieve sustainable growth by expanding its
businesses into growth fields, countries, and regions
while ceaselessly enhancing its competitiveness.
Achieved Record High Net Sales and Profits Two Years in a Row
I would like to begin this report by expressing our profound gratitude to our stockholders and investors for their continuing support. During fiscal 2015, the econ-omy in China gradually slowed and economic conditions in many other emerging countries appeared to be weak. On the other hand, eco-nomic conditions in the U.S. con-tinued to pick up and the European economy also remained on a recov-ery track. In Japan, although produc-tion and exports looked sluggish, the economy saw a gradual underlying recovery amid improving corporate earnings, employment, and wages. Under these operating con-ditions, Toray Group is steadily
implementing growth strategies and further enhancing its total cost com-petitiveness under the three-year medium-term management program Project AP-G 2016, which extends from fiscal 2014 to fiscal 2016. As a result, the Group saw record high net sales and profits for a sec-ond consecutive fiscal year, with consolidated net sales increasing by 4.7% year on year to ¥2,104.4 billion, operating income rising by 25.1% to ¥154.5 billion, and net income attrib-utable to owners of parent climbing by 26.9% to ¥90.1 billion. In addi-tion, we significantly raised profit-ability and capital efficiency, with operating income to net sales ratio rising 1.2 percentage points to 7.3% and ROE increasing 1.6 percentage points to 9.3%. All segments except for Life Science saw year-on-year sales and
profit gains. Carbon Fiber Composite Materials achieved earnings growth by meeting strong demand and expanding applications. Fibers & Textiles promoted business inte-grating fibers, textiles, to final prod-ucts while enjoying steady sales for automotive applications and hygiene products. In addition, Plastics & Chemicals saw increases in ship-ments of products for automotive and packaging applications. In terms of stockholder returns, we have raised annual cash div-idends per share by ¥2 year on year to ¥13 based on a compre-hensive consideration of every fac-tor including the aforementioned business performance, fiscal 2016 forecasts, financial standing and retention of earnings necessary for future investment.
Fiscal 2015 Performance Review
15
Tora
y In
dust
ries,
Inc.
Ann
ual R
epor
t 20
16
Akihiro NikkakuPresident
16
Tora
y In
dust
ries,
Inc.
Ann
ual R
epor
t 20
16
Project AP-G 2016 Basic Strategies
Steadily Implementing Project AP-G 2016 Initiatives to Achieve Our Long-Term Corporate Vision
Toray Group is working to further expand its businesses globally under AP-Growth TORAY 2020, a long-term corporate vision formulated with an eye on 2020. At the same time, the Group will focus on expanding green innovation businesses to become a corporate group that “continually increases revenues and profits,” “proactively contributes to social development and environmental stewardship,” and “offers high val-ues to all stakeholders.” Under the Project AP-G 2016 medi-um-term management program, the second stage of AP-Growth TORAY 2020, we are working to further accel-erate business expansion into fields that display Toray Group’s strengths while formulating and undertak-ing strategies and challenges that will allow the Group to become the
global leader in advanced materials. Based on this policy, we have established eight basic strategies under Project AP-G 2016. As key ini-tiatives within these strategies, this Group-wide project is promoting business expansion in growth fields, countries and regions while bolster-ing competitiveness. Regarding business expansion in growth fields, we are focusing on the development of advanced materials and the creation of new businesses by leveraging the Group’s strong-suit technological prowess and global business foundation in two challeng-ing fields: the “Green Innovation Business Expansion (GR) Project,” which contributes to solving prob-lems in the areas of the environment, resources, and energy, and the “Life Innovation Business Expansion (LI) Project,” which seeks to improve the quality of healthcare, ease burdens on medical institutions, and contrib-ute to health and longevity. Business expansion in growth countries and regions involves
promoting the “Asia, Americas, and Emerging Country Business Expansion (AE-II) Project” in order to capture demand in promising growth countries and regions in Asia, emerging countries in other regions and the Americas. As for bolstering competitiveness, under the “Total Cost Reduction (TC-III) Project,” Toray Group aims to achieve a world-leading level of cost competitiveness by reducing vari-able and fixed costs while pursuing production process innovation and total operational cost reduction. While focusing on these proj-ects, we will actively step up growth investment to a greater extent than before while maintaining financial soundness using a D/E ratio of 1 or below with the aim of steadily rais-ing the dividend payment in line with our earnings performance.
Now, I will provide an explanation of the progress of each project within Project AP-G 2016.
Basic Strategies Group-wide Projects
Green InnovationBusiness Expansion(GR) Project
Life InnovationBusiness Expansion(LI) Project
Asia, Americas andEmerging CountryBusiness Expansion(AE-II) Project
Total Cost Reduction(TC-III) Project
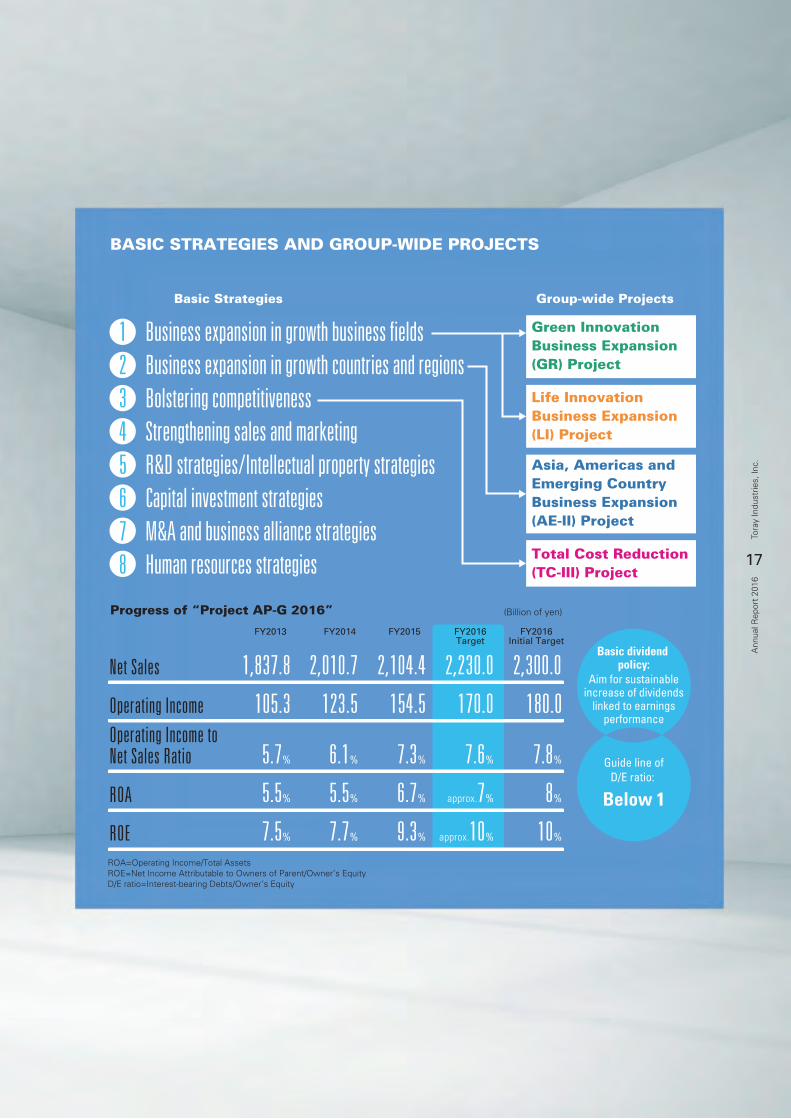
BASIC STRATEGIES AND GROUP-WIDE PROJECTS
Progress of “Project AP-G 2016” (Billion of yen)
1 Business expansion in growth business fields 2 Business expansion in growth countries and regions 3 Bolstering competitiveness 4 Strengthening sales and marketing 5 R&D strategies/Intellectual property strategies 6 Capital investment strategies 7 M&A and business alliance strategies 8 Human resources strategies
Net Sales 1,837.8 2,010.7 2,104.4 2,230.0 2,300.0
Operating Income 105.3 123.5 154.5 170.0 180.0Operating Income toNet Sales Ratio 5.7% 6.1% 7.3% 7.6% 7.8%
ROA 5.5% 5.5% 6.7% approx.7% 8%
ROE 7.5% 7.7% 9.3% approx.10% 10%
FY2013 FY2014 FY2015 FY2016Target
FY2016Initial Target
Basic dividend policy:
Aim for sustainableincrease of dividends
linked to earningsperformance
Guide line ofD/E ratio:
Below 1
ROA=Operating Income/Total AssetsROE=Net Income Attributable to Owners of Parent/Owner’s EquityD/E ratio=Interest-bearing Debts/Owner’s Equity
17
Tora
y In
dust
ries,
Inc.
Ann
ual R
epor
t 20
16
(Billion yen)
1,000
600
200
800
400
0FY 2013
Actual2014
Actual2016
Target2020
Image
463.1(approx.25%)
657.1(approx.31%)
565.5(approx.28%)
approx.700.0(approx.30%)
Green Innovation BusinessExpansion Plan
2015Actual
( ) net sales ratio
18
Tora
y In
dust
ries,
Inc.
Ann
ual R
epor
t 20
16
P r o j e c t A P - G 2 0 1 6Green Innovation Business Expansion(GR) ProjectSuccesses in Carbon Fiber Composite Materials and Water Treatment Membranes
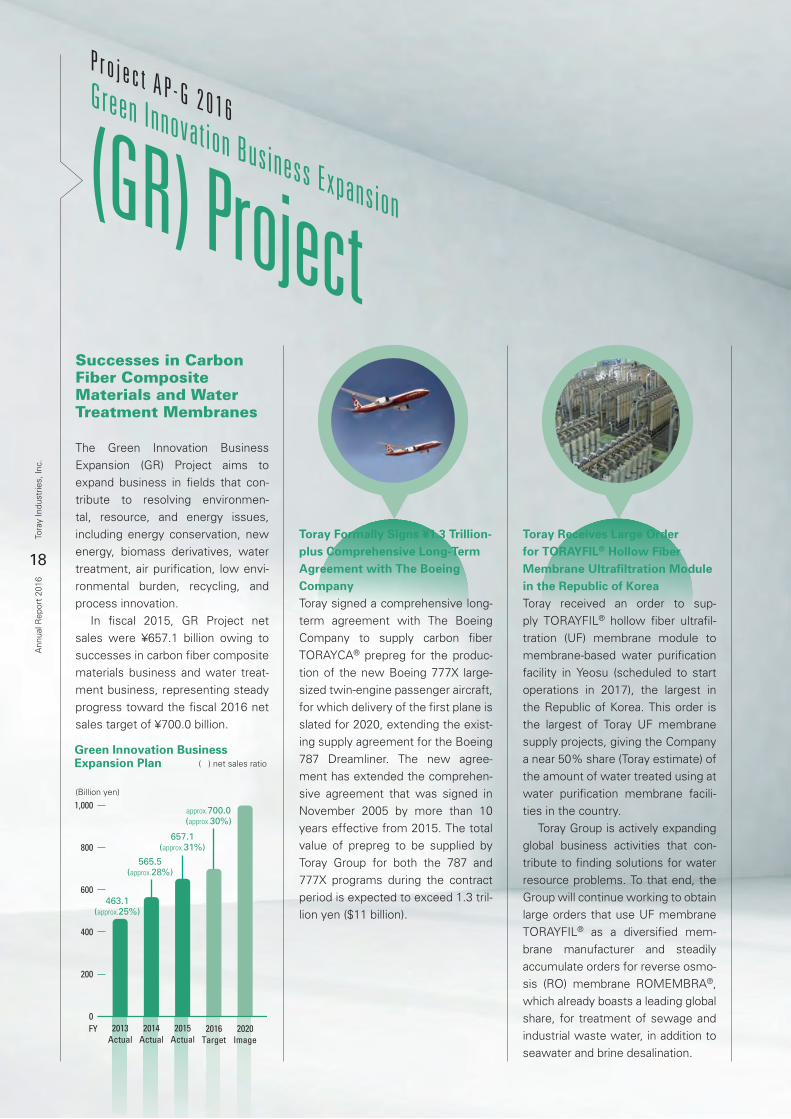
The Green Innovation Business Expansion (GR) Project aims to expand business in fields that con-tribute to resolving environmen-tal, resource, and energy issues, including energy conservation, new energy, biomass derivatives, water treatment, air purification, low envi-ronmental burden, recycling, and process innovation. In fiscal 2015, GR Project net sales were ¥657.1 billion owing to successes in carbon fiber composite materials business and water treat-ment business, representing steady progress toward the fiscal 2016 net sales target of ¥700.0 billion.
Toray Formally Signs ¥1.3 Trillion-plus Comprehensive Long-Term Agreement with The Boeing CompanyToray signed a comprehensive long-term agreement with The Boeing Company to supply carbon fiber TORAYCA® prepreg for the produc-tion of the new Boeing 777X large-sized twin-engine passenger aircraft, for which delivery of the first plane is slated for 2020, extending the exist-ing supply agreement for the Boeing 787 Dreamliner. The new agree-ment has extended the comprehen-sive agreement that was signed in November 2005 by more than 10 years effective from 2015. The total value of prepreg to be supplied by Toray Group for both the 787 and 777X programs during the contract period is expected to exceed 1.3 tril-lion yen ($11 billion).
Toray Receives Large Order for TORAYFIL® Hollow Fiber Membrane Ultrafiltration Module in the Republic of KoreaToray received an order to sup-ply TORAYFIL® hollow fiber ultrafil-tration (UF) membrane module to membrane-based water purification facility in Yeosu (scheduled to start operations in 2017), the largest in the Republic of Korea. This order is the largest of Toray UF membrane supply projects, giving the Company a near 50% share (Toray estimate) of the amount of water treated using at water purification membrane facili-ties in the country. Toray Group is actively expanding global business activities that con-tribute to finding solutions for water resource problems. To that end, the Group will continue working to obtain large orders that use UF membrane TORAYFIL® as a diversified mem-brane manufacturer and steadily accumulate orders for reverse osmo-sis (RO) membrane ROMEMBRA®, which already boasts a leading global share, for treatment of sewage and industrial waste water, in addition to seawater and brine desalination.
(Billion yen)
300
200
100
250
150
50
0FY 2013
Actual2014
Actual2016
Target2020
Image
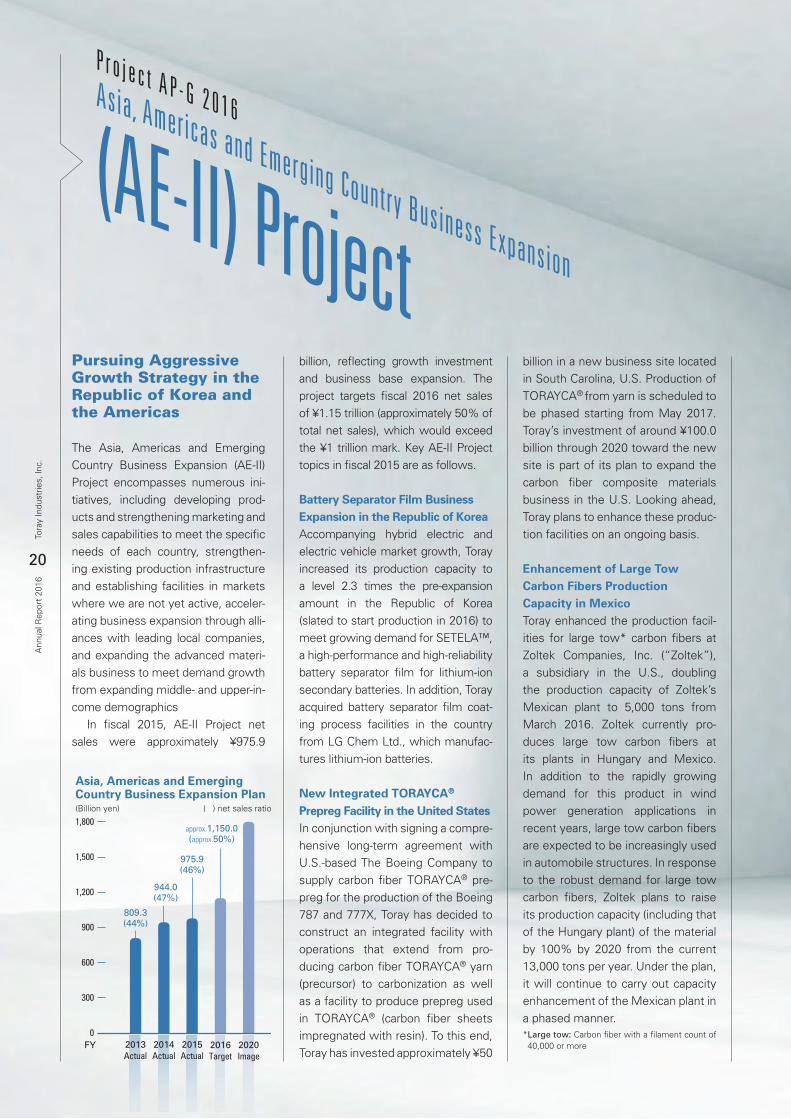
approx.120.0
(approx.6%)
approx.140.0
(approx.7%)
approx.160.0(approx.8%)
approx.170.0(approx.7%)
Life Innovation BusinessExpansion Plan
2015Actual
Advanced Materials in LI Business Pharmaceuticals & Medical
( ) net sales ratio
19
Tora
y In
dust
ries,
Inc.
Ann
ual R
epor
t 20
16
P r o j e c t A P - G 2 0 1 6
Life Innovation Business Expansion
(LI) Project
Expand Medical Device Business and Make Significant Progress in New Business Development
The Life Innovation Business Expansion (LI) Project aims to expand business in our present pharmaceu-tical and medical businesses and apply Toray Group’s advanced mate-rials, core and fundamental technol-ogies, and business foundation to improve the quality of healthcare, ease the burden at medical institu-tions, and contribute to health and longevity. In fiscal 2015, LI Project net sales were approximately ¥160.0 billion, representing steady progress
toward the fiscal 2016 net sales tar-get of ¥170.0 billion. In particular, we are aggressively expanding our lineup of Toray advanced materials in the Life Innovation field while accel-erating new business development.
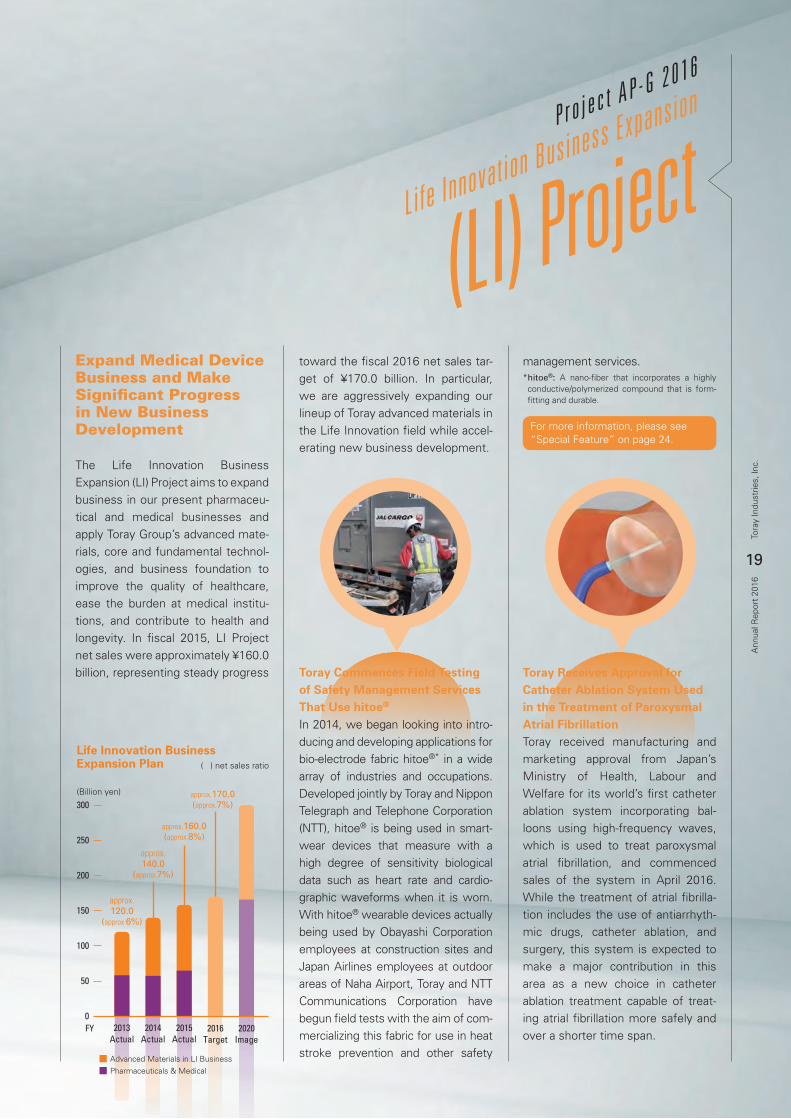
Toray Commences Field Testing of Safety Management Services That Use hitoe®
In 2014, we began looking into intro-ducing and developing applications for bio-electrode fabric hitoe®* in a wide array of industries and occupations. Developed jointly by Toray and Nippon Telegraph and Telephone Corporation (NTT), hitoe® is being used in smart-wear devices that measure with a high degree of sensitivity biological data such as heart rate and cardio-graphic waveforms when it is worn. With hitoe® wearable devices actually being used by Obayashi Corporation employees at construction sites and Japan Airlines employees at outdoor areas of Naha Airport, Toray and NTT Communications Corporation have begun field tests with the aim of com-mercializing this fabric for use in heat stroke prevention and other safety
management services.* hitoe®: A nano-fiber that incorporates a highly conductive/polymerized compound that is form-fitting and durable.
Toray Receives Approval for Catheter Ablation System Used in the Treatment of Paroxysmal Atrial FibrillationToray received manufacturing and marketing approval from Japan’s Ministry of Health, Labour and Welfare for its world’s first catheter ablation system incorporating bal-loons using high-frequency waves, which is used to treat paroxysmal atrial fibrillation, and commenced sales of the system in April 2016. While the treatment of atrial fibrilla-tion includes the use of antiarrhyth-mic drugs, catheter ablation, and surgery, this system is expected to make a major contribution in this area as a new choice in catheter ablation treatment capable of treat-ing atrial fibrillation more safely and over a shorter time span.
For more information, please see “Special Feature” on page 24.
(Billion yen)
1,800
1,200
600
1,500
900
300
0FY 2013
Actual2014Actual
2015Actual
2016Target
2020Image
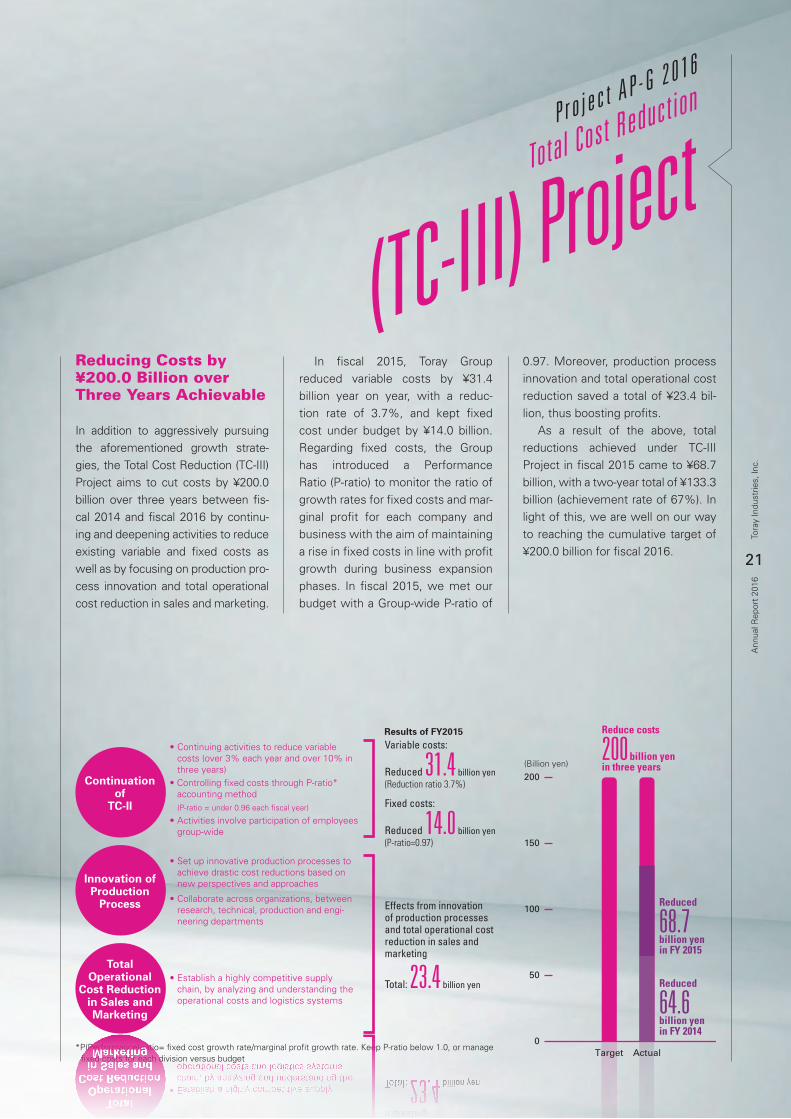
809.3(44%)
944.0(47%)
975.9(46%)
approx.1,150.0(approx.50%)
Asia, Americas and Emerging Country Business Expansion Plan
( ) net sales ratio
20
Tora
y In
dust
ries,
Inc.
Ann
ual R
epor
t 20
16
P r o j e c t A P - G 2 0 1 6Asia, Americas and Emerging Country Business Expansion
(AE-II) ProjectPursuing Aggressive Growth Strategy in the Republic of Korea and the Americas
The Asia, Americas and Emerging Country Business Expansion (AE-II) Project encompasses numerous ini-tiatives, including developing prod-ucts and strengthening marketing and sales capabilities to meet the specific needs of each country, strengthen-ing existing production infrastructure and establishing facilities in markets where we are not yet active, acceler-ating business expansion through alli-ances with leading local companies, and expanding the advanced materi-als business to meet demand growth from expanding middle- and upper-in-come demographics In fiscal 2015, AE-II Project net sales were approximately ¥975.9
billion, reflecting growth investment and business base expansion. The project targets fiscal 2016 net sales of ¥1.15 trillion (approximately 50% of total net sales), which would exceed the ¥1 trillion mark. Key AE-II Project topics in fiscal 2015 are as follows.
Battery Separator Film Business Expansion in the Republic of Korea Accompanying hybrid electric and electric vehicle market growth, Toray increased its production capacity to a level 2.3 times the pre-expansionamount in the Republic of Korea (slated to start production in 2016) to meet growing demand for SETELA™, a high-performance and high-reliability battery separator film for lithium-ion secondary batteries. In addition, Toray acquired battery separator film coat-ing process facilities in the country from LG Chem Ltd., which manufac-tures lithium-ion batteries.
New Integrated TORAYCA® Prepreg Facility in the United StatesIn conjunction with signing a compre-hensive long-term agreement with U.S.-based The Boeing Company to supply carbon fiber TORAYCA® pre-preg for the production of the Boeing 787 and 777X, Toray has decided to construct an integrated facility with operations that extend from pro-ducing carbon fiber TORAYCA® yarn (precursor) to carbonization as well as a facility to produce prepreg used in TORAYCA® (carbon fiber sheets impregnated with resin). To this end, Toray has invested approximately ¥50
billion in a new business site located in South Carolina, U.S. Production of TORAYCA® from yarn is scheduled to be phased starting from May 2017. Toray’s investment of around ¥100.0 billion through 2020 toward the new site is part of its plan to expand the carbon fiber composite materials business in the U.S. Looking ahead, Toray plans to enhance these produc-tion facilities on an ongoing basis.
Enhancement of Large Tow Carbon Fibers Production Capacity in MexicoToray enhanced the production facil-ities for large tow* carbon fibers at Zoltek Companies, Inc. (“Zoltek”), a subsidiary in the U.S., doubling the production capacity of Zoltek’s Mexican plant to 5,000 tons from March 2016. Zoltek currently pro-duces large tow carbon fibers at its plants in Hungary and Mexico. In addition to the rapidly growing demand for this product in wind power generation applications in recent years, large tow carbon fibers are expected to be increasingly used in automobile structures. In response to the robust demand for large tow carbon fibers, Zoltek plans to raise its production capacity (including that of the Hungary plant) of the material by 100% by 2020 from the current 13,000 tons per year. Under the plan, it will continue to carry out capacity enhancement of the Mexican plant in a phased manner.* Large tow: Carbon fiber with a filament count of 40,000 or more
Continuationof
TC-II
• Continuing activities to reduce variable costs (over 3% each year and over 10% in three years)
• Controlling fixed costs through P-ratio* accounting method
(P-ratio = under 0.96 each fiscal year)
• Activities involve participation of employees group-wide
Results of FY2015
Innovation ofProduction
Process
• Set up innovative production processes to achieve drastic cost reductions based on new perspectives and approaches
• Collaborate across organizations, between research, technical, production and engi-neering departments
TotalOperational
Cost Reductionin Sales andMarketing
• Establish a highly competitive supply chain, by analyzing and understanding the operational costs and logistics systems
* P(Performance)-ratio= fixed cost growth rate/marginal profit growth rate. Keep P-ratio below 1.0, or manage fixed costs for each division versus budget
Variable costs:
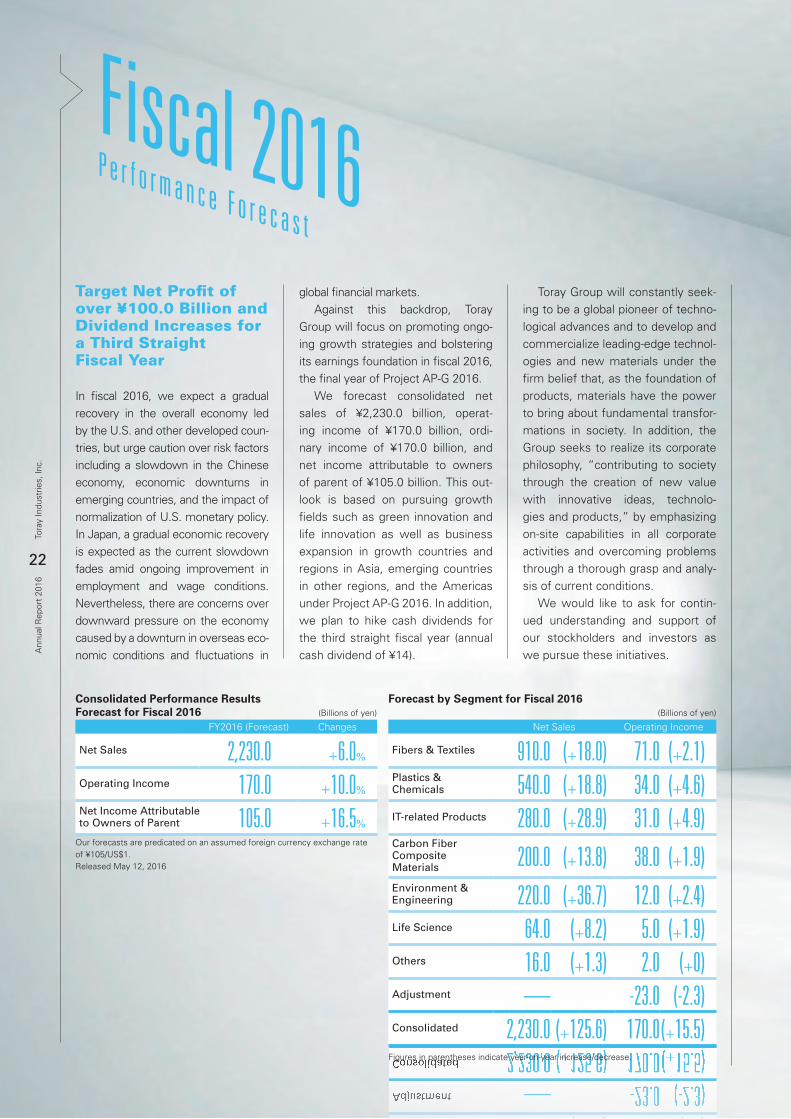
Reduced 31.4 billion yen(Reduction ratio 3.7%)
Fixed costs:
Reduced 14.0 billion yen(P-ratio=0.97)
Effects from innovation of production processes and total operational cost reduction in sales and marketing
Total: 23.4 billion yen
(Billion yen)
200
100
150
50
0Target Actual
Reduced
64.6billion yenin FY 2014
Reduced
68.7billion yenin FY 2015
Reduce costs
200 billion yenin three years
TotalOperational
Cost Reductionin Sales andMarketing
• Establish a highly competitive supply chain, by analyzing and understanding the operational costs and logistics systems
Effects from innovation of production processes and total operational cost reduction in sales and marketing
Total: 23.4 billion yen
21
Tora
y In
dust
ries,
Inc.
Ann
ual R
epor
t 20
16
P r o j e c t A P - G 2 0 1 6
Total Cost Reduction
(TC-III) Project
Reducing Costs by ¥200.0 Billion over Three Years Achievable
In addition to aggressively pursuing the aforementioned growth strate-gies, the Total Cost Reduction (TC-III) Project aims to cut costs by ¥200.0 billion over three years between fis-cal 2014 and fiscal 2016 by continu-ing and deepening activities to reduce existing variable and fixed costs as well as by focusing on production pro-cess innovation and total operational cost reduction in sales and marketing.
In fiscal 2015, Toray Group reduced variable costs by ¥31.4 billion year on year, with a reduc-tion rate of 3.7%, and kept fixed cost under budget by ¥14.0 billion. Regarding fixed costs, the Group has introduced a Performance Ratio (P-ratio) to monitor the ratio of growth rates for fixed costs and mar-ginal profit for each company and business with the aim of maintaining a rise in fixed costs in line with profit growth during business expansion phases. In fiscal 2015, we met our budget with a Group-wide P-ratio of
0.97. Moreover, production process innovation and total operational cost reduction saved a total of ¥23.4 bil-lion, thus boosting profits. As a result of the above, total reductions achieved under TC-III Project in fiscal 2015 came to ¥68.7 billion, with a two-year total of ¥133.3 billion (achievement rate of 67%). In light of this, we are well on our way to reaching the cumulative target of ¥200.0 billion for fiscal 2016.
Forecast by Segment for Fiscal 2016(Billions of yen)
Net Sales Operating Income
Fibers & Textiles910.0 (+18.0) 71.0 (+2.1)
Plastics & Chemicals 540.0 (+18.8) 34.0 (+4.6)IT-related Products
280.0 (+28.9) 31.0 (+4.9)Carbon Fiber Composite Materials 200.0 (+13.8) 38.0 (+1.9)Environment & Engineering 220.0 (+36.7) 12.0 (+2.4)Life Science
64.0 (+8.2) 5.0 (+1.9)Others
16.0 (+1.3) 2.0 (+0)Adjustment
— -23.0 (-2.3)Consolidated
2,230.0 (+125.6) 170.0(+15.5)Figures in parenthesis indicate year-on-year increase/decrease.
22
Tora
y In
dust
ries,
Inc.
Ann
ual R
epor
t 20
16
Fiscal 2016P e r f o r m a n c e F o r e c a s t
Target Net Profit of over ¥100.0 Billion and Dividend Increases for a Third Straight Fiscal Year
In fiscal 2016, we expect a gradual recovery in the overall economy led by the U.S. and other developed coun-tries, but urge caution over risk factors including a slowdown in the Chinese economy, economic downturns in emerging countries, and the impact of normalization of U.S. monetary policy. In Japan, a gradual economic recovery is expected as the current slowdown fades amid ongoing improvement in employment and wage conditions. Nevertheless, there are concerns over downward pressure on the economy caused by a downturn in overseas eco-nomic conditions and fluctuations in
global financial markets. Against this backdrop, Toray Group will focus on promoting ongo-ing growth strategies and bolstering its earnings foundation in fiscal 2016, the final year of Project AP-G 2016. We forecast consolidated net sales of ¥2,230.0 billion, operat-ing income of ¥170.0 billion, ordi-nary income of ¥170.0 billion, and net income attributable to owners of parent of ¥105.0 billion. This out-look is based on pursuing growth fields such as green innovation and life innovation as well as business expansion in growth countries and regions in Asia, emerging countries in other regions, and the Americas under Project AP-G 2016. In addition, we plan to hike cash dividends for the third straight fiscal year (annual cash dividend of ¥14).
Toray Group will constantly seek-ing to be a global pioneer of techno-logical advances and to develop and commercialize leading-edge technol-ogies and new materials under the firm belief that, as the foundation of products, materials have the power to bring about fundamental transfor-mations in society. In addition, the Group seeks to realize its corporate philosophy, “contributing to society through the creation of new value with innovative ideas, technolo-gies and products,” by emphasizing on-site capabilities in all corporate activities and overcoming problems through a thorough grasp and analy-sis of current conditions. We would like to ask for contin-ued understanding and support of our stockholders and investors as we pursue these initiatives.
Consolidated Performance Results Forecast for Fiscal 2016 (Billions of yen)
FY2016 (Forecast) Changes
Net Sales 2,230.0 +6.0%
Operating Income 170.0 +10.0%
Net Income Attributable to Owners of Parent 105.0 +16.5%
Our forecasts are predicated on an assumed foreign currency exchange rate of ¥105/US$1.Released May 12, 2016
Forecast by Segment for Fiscal 2016(Billions of yen)
Net Sales Operating Income
Fibers & Textiles 910.0 (+18.0) 71.0 (+2.1)Plastics & Chemicals 540.0 (+18.8) 34.0 (+4.6)IT-related Products 280.0 (+28.9) 31.0 (+4.9)Carbon Fiber Composite Materials 200.0 (+13.8) 38.0 (+1.9)Environment & Engineering 220.0 (+36.7) 12.0 (+2.4)Life Science 64.0 (+8.2) 5.0 (+1.9)Others 16.0 (+1.3) 2.0 (+0)Adjustment — -23.0 (-2.3)Consolidated 2,230.0 (+125.6) 170.0(+15.5)
Figures in parentheses indicate year-on-year increase/decrease.
(Billion yen)
200
50
150
100
0FY 2014 2015 2016
Forecast
128.5 129.2
175.0
(Billion yen)
100
60
20
80
40
0FY 2014 2015 2016
Forecast
77.5
86.892.0
Depreciation
(Billion yen)
70
50
30
60
40
20
10
0FY 2014 2015 2016
Forecast
59.5 58.8
65.0
R&D Expenses
Consolidated subsidiaries
Toray
Consolidated subsidiaries
Toray
Consolidated subsidiaries
Toray
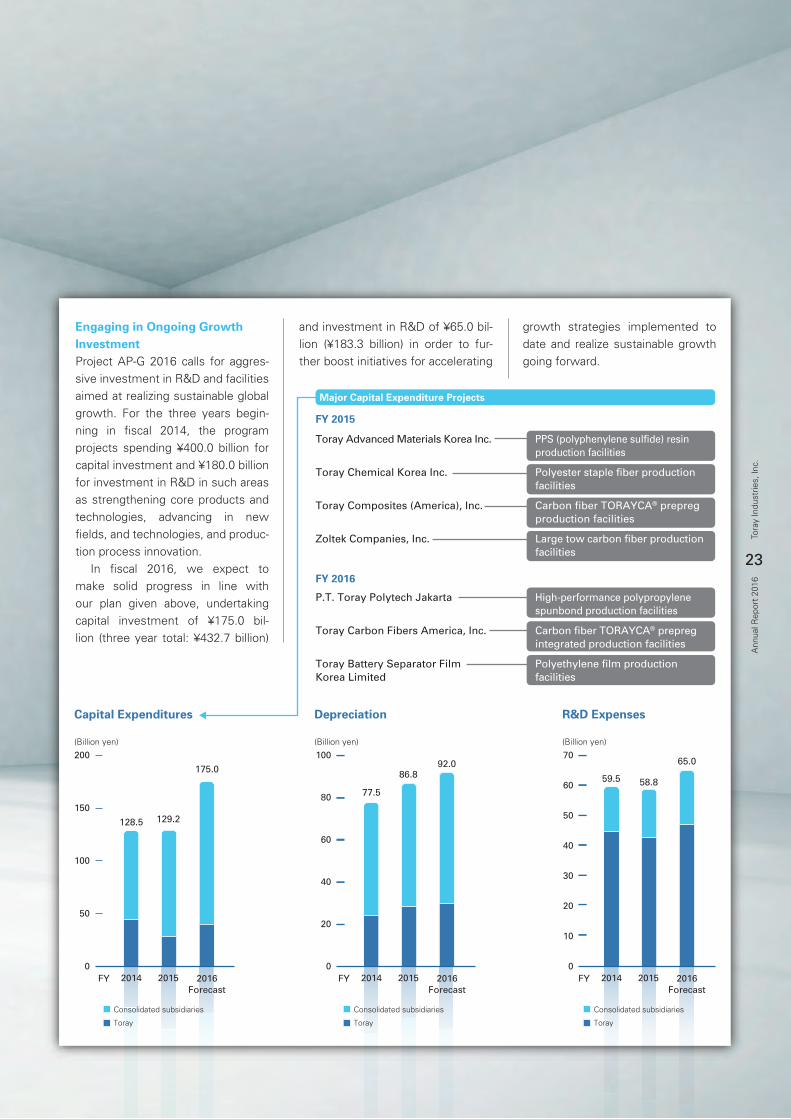
Major Capital Expenditure Projects
FY 2015
Toray Advanced Materials Korea Inc. PPS (polyphenylene sulfide) resin production facilities
Toray Chemical Korea Inc. Polyester staple fiber production facilities
Toray Composites (America), Inc. Carbon fiber TORAYCA® prepreg production facilities
Zoltek Companies, Inc. Large tow carbon fiber production facilities
FY 2016
P.T. Toray Polytech Jakarta High-performance polypropylene spunbond production facilities
Toray Carbon Fibers America, Inc. Carbon fiber TORAYCA® prepreg integrated production facilities
Toray Battery Separator Film Polyethylene film productionKorea Limited facilities
Capital Expenditures
23
Tora
y In
dust
ries,
Inc.
Ann
ual R
epor
t 20
16
Engaging in Ongoing Growth InvestmentProject AP-G 2016 calls for aggres-sive investment in R&D and facilities aimed at realizing sustainable global growth. For the three years begin-ning in fiscal 2014, the program projects spending ¥400.0 billion for capital investment and ¥180.0 billion for investment in R&D in such areas as strengthening core products and technologies, advancing in new fields, and technologies, and produc-tion process innovation. In fiscal 2016, we expect to make solid progress in line with our plan given above, undertaking capital investment of ¥175.0 bil-lion (three year total: ¥432.7 billion)
and investment in R&D of ¥65.0 bil-lion (¥183.3 billion) in order to fur-ther boost initiatives for accelerating
growth strategies implemented to date and realize sustainable growth going forward.
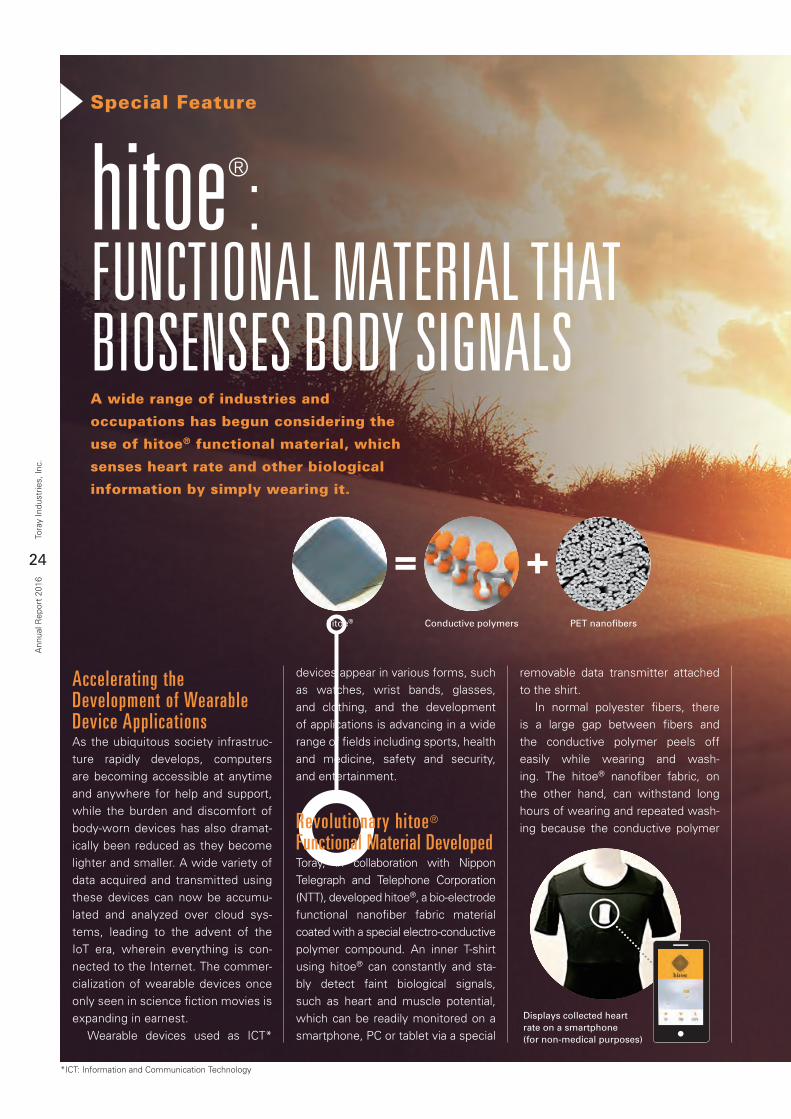
Displays collected heart rate on a smartphone(for non-medical purposes)
24
Tora
y In
dust
ries,
Inc.
Ann
ual R
epor
t 20
16
hitoe®
:FUNCTIONAL MATERIAL THAT BIOSENSES BODY SIGNALS
Special Feature
Accelerating the Development of Wearable Device ApplicationsAs the ubiquitous society infrastruc-ture rapidly develops, computers are becoming accessible at anytime and anywhere for help and support, while the burden and discomfort of body-worn devices has also dramat-ically been reduced as they become lighter and smaller. A wide variety of data acquired and transmitted using these devices can now be accumu-lated and analyzed over cloud sys-tems, leading to the advent of the IoT era, wherein everything is con-nected to the Internet. The commer-cialization of wearable devices once only seen in science fiction movies is expanding in earnest. Wearable devices used as ICT*
devices appear in various forms, such as watches, wrist bands, glasses, and clothing, and the development of applications is advancing in a wide range of fields including sports, health and medicine, safety and security, and entertainment.
Revolutionary hitoe® Functional Material DevelopedToray, in collaboration with Nippon Telegraph and Telephone Corporation (NTT), developed hitoe®, a bio-electrodefunctional nanofiber fabric material coated with a special electro-conductive polymer compound. An inner T-shirt using hitoe® can constantly and sta-bly detect faint biological signals, such as heart and muscle potential, which can be readily monitored on a smartphone, PC or tablet via a special
removable data transmitter attached to the shirt. In normal polyester fibers, there is a large gap between fibers and the conductive polymer peels off easily while wearing and wash-ing. The hitoe® nanofiber fabric, on the other hand, can withstand long hours of wearing and repeated wash-ing because the conductive polymer
A wide range of industries and
occupations has begun considering the
use of hitoe® functional material, which
senses heart rate and other biological
information by simply wearing it.
hitoe® Conductive polymers PET nanofibers
= +
*ICT: Information and Communication Technology
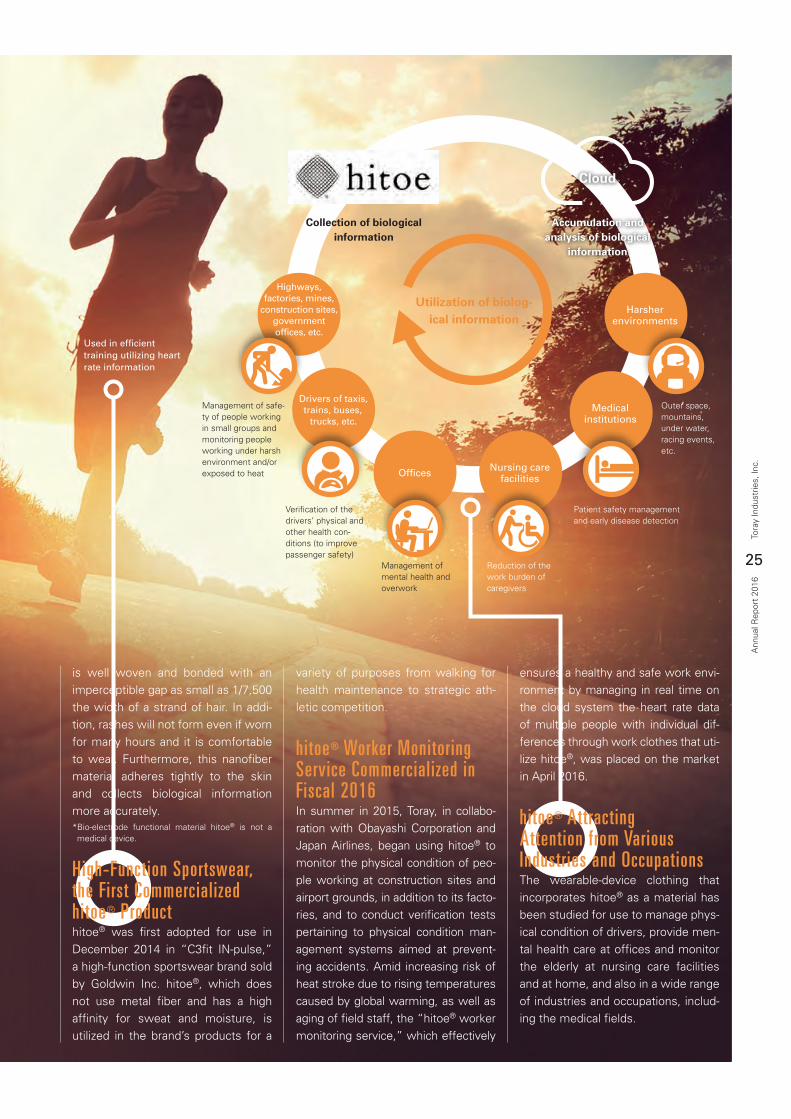
Harsher environments
Drivers of taxis, trains, buses,
trucks, etc.Medical
institutions
Offices Nursing care facilities
Utilization of biolog-ical information
Collection of biological information
Accumulation and analysis of biological
information
Cloud
Highways, factories, mines,
construction sites, government offices, etc.
Management of safe-ty of people working in small groups and monitoring people working under harsh environment and/or exposed to heat
Verification of the drivers’ physical and other health con-ditions (to improve passenger safety)
Management of mental health and overwork
Reduction of the work burden of caregivers
Patient safety management and early disease detection
Outer space, mountains, under water, racing events, etc.
25
Tora
y In
dust
ries,
Inc.
Ann
ual R
epor
t 20
16
hitoe®
:FUNCTIONAL MATERIAL THAT BIOSENSES BODY SIGNALS
is well woven and bonded with an imperceptible gap as small as 1/7,500 the width of a strand of hair. In addi-tion, rashes will not form even if worn for many hours and it is comfortable to wear. Furthermore, this nanofiber material adheres tightly to the skin and collects biological information more accurately.* Bio-electrode functional material hitoe® is not a medical device.
High-Function Sportswear, the First Commercialized hitoe® Product hitoe® was first adopted for use in December 2014 in “C3fit IN-pulse,” a high-function sportswear brand sold by Goldwin Inc. hitoe®, which does not use metal fiber and has a high affinity for sweat and moisture, is utilized in the brand’s products for a
variety of purposes from walking for health maintenance to strategic ath-letic competition.
hitoe® Worker Monitoring Service Commercialized in Fiscal 2016In summer in 2015, Toray, in collabo-ration with Obayashi Corporation and Japan Airlines, began using hitoe® to monitor the physical condition of peo-ple working at construction sites and airport grounds, in addition to its facto-ries, and to conduct verification tests pertaining to physical condition man-agement systems aimed at prevent-ing accidents. Amid increasing risk of heat stroke due to rising temperatures caused by global warming, as well as aging of field staff, the “hitoe® worker monitoring service,” which effectively
ensures a healthy and safe work envi-ronment by managing in real time on the cloud system the heart rate data of multiple people with individual dif-ferences through work clothes that uti-lize hitoe®, was placed on the market in April 2016.
hitoe® Attracting Attention from Various Industries and OccupationsThe wearable-device clothing that incorporates hitoe® as a material has been studied for use to manage phys-ical condition of drivers, provide men-tal health care at offices and monitor the elderly at nursing care facilities and at home, and also in a wide range of industries and occupations, includ-ing the medical fields.
Used in efficient training utilizing heart rate information
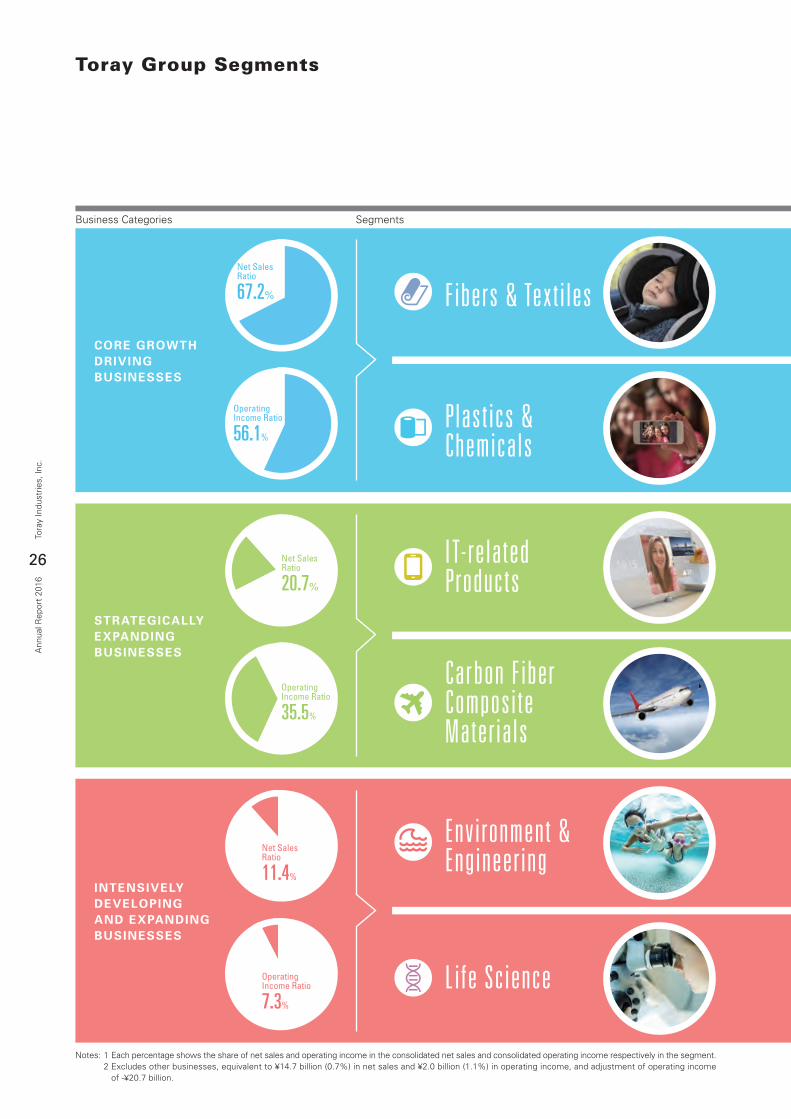
Net SalesRatio
67.2%
OperatingIncome Ratio
56.1%
Net SalesRatio
20.7%
OperatingIncome Ratio
35.5%
Net SalesRatio
11.4%
OperatingIncome Ratio
7.3%
26
Tora
y In
dust
ries,
Inc.
Ann
ual R
epor
t 20
16
Toray Group Segments
SegmentsBusiness Categories
Notes: 1 Each percentage shows the share of net sales and operating income in the consolidated net sales and consolidated operating income respectively in the segment. 2 Excludes other businesses, equivalent to ¥14.7 billion (0.7%) in net sales and ¥2.0 billion (1.1%) in operating income, and adjustment of operating income
of -¥20.7 billion.
CORE GROWTH DRIVING BUSINESSES
Fibers & Texti les
Plastics &Chemicals
IT-relatedProducts
Carbon FiberCompositeMaterials
Environment &Engineering
Life Science
STRATEGICALLY EXPANDING BUSINESSES
INTENSIVELY DEVELOPING AND EXPANDING BUSINESSES
27
Tora
y In
dust
ries,
Inc.
Ann
ual R
epor
t 20
16
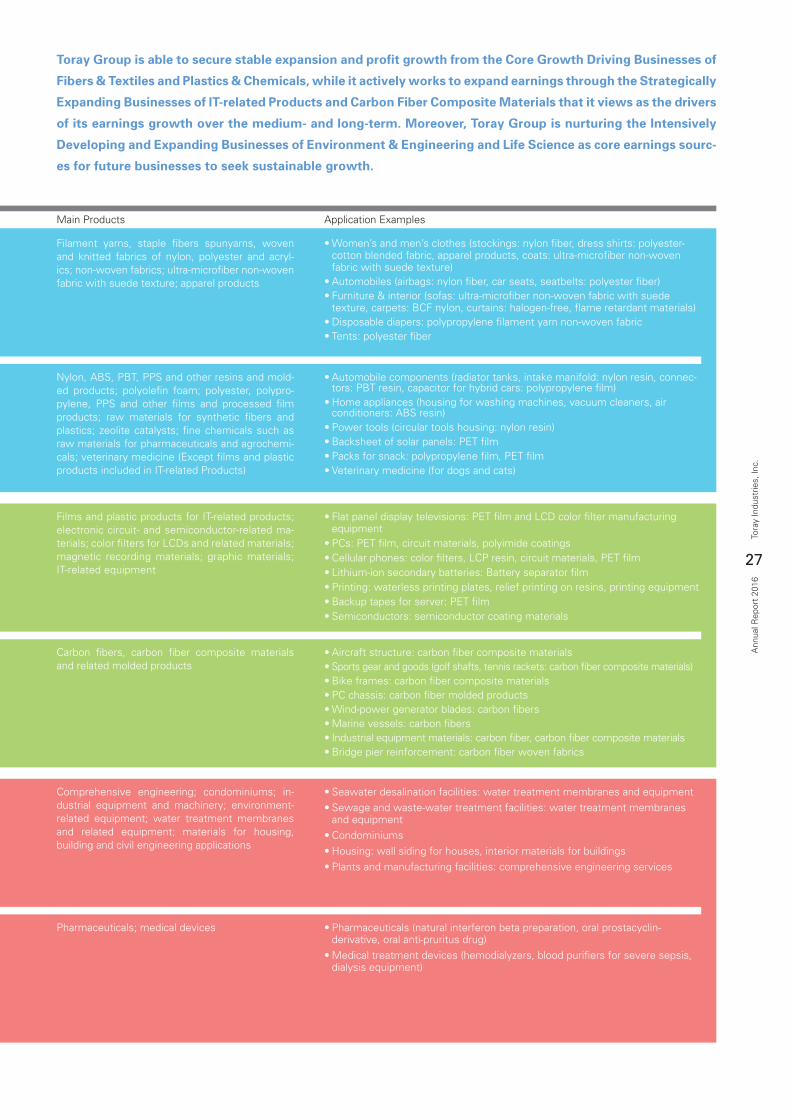
Main Products Application Examples
Filament yarns, staple fibers spunyarns, woven and knitted fabrics of nylon, polyester and acryl-ics; non-woven fabrics; ultra-microfiber non-woven fabric with suede texture; apparel products
Nylon, ABS, PBT, PPS and other resins and mold-ed products; polyolefin foam; polyester, polypro-pylene, PPS and other films and processed film products; raw materials for synthetic fibers and plastics; zeolite catalysts; fine chemicals such as raw materials for pharmaceuticals and agrochemi-cals; veterinary medicine (Except films and plastic products included in IT-related Products)
Films and plastic products for IT-related products; electronic circuit- and semiconductor-related ma-terials; color filters for LCDs and related materials; magnetic recording materials; graphic materials; IT-related equipment
Carbon fibers, carbon fiber composite materials and related molded products
Comprehensive engineering; condominiums; in-dustrial equipment and machinery; environment-related equipment; water treatment membranes and related equipment; materials for housing, building and civil engineering applications
Pharmaceuticals; medical devices
• Women’s and men’s clothes (stockings: nylon fiber, dress shirts: polyester-cotton blended fabric, apparel products, coats: ultra-microfiber non-woven fabric with suede texture)
• Automobiles (airbags: nylon fiber, car seats, seatbelts: polyester fiber)• Furniture & interior (sofas: ultra-microfiber non-woven fabric with suede
texture, carpets: BCF nylon, curtains: halogen-free, flame retardant materials)• Disposable diapers: polypropylene filament yarn non-woven fabric• Tents: polyester fiber
• Automobile components (radiator tanks, intake manifold: nylon resin, connec-tors: PBT resin, capacitor for hybrid cars: polypropylene film)
• Home appliances (housing for washing machines, vacuum cleaners, air conditioners: ABS resin)
• Power tools (circular tools housing: nylon resin)• Backsheet of solar panels: PET film• Packs for snack: polypropylene film, PET film• Veterinary medicine (for dogs and cats)
• Flat panel display televisions: PET film and LCD color filter manufacturing equipment
• PCs: PET film, circuit materials, polyimide coatings• Cellular phones: color filters, LCP resin, circuit materials, PET film• Lithium-ion secondary batteries: Battery separator film• Printing: waterless printing plates, relief printing on resins, printing equipment• Backup tapes for server: PET film• Semiconductors: semiconductor coating materials
• Aircraft structure: carbon fiber composite materials• Sports gear and goods (golf shafts, tennis rackets: carbon fiber composite materials)• Bike frames: carbon fiber composite materials• PC chassis: carbon fiber molded products• Wind-power generator blades: carbon fibers• Marine vessels: carbon fibers• Industrial equipment materials: carbon fiber, carbon fiber composite materials• Bridge pier reinforcement: carbon fiber woven fabrics
• Seawater desalination facilities: water treatment membranes and equipment• Sewage and waste-water treatment facilities: water treatment membranes
and equipment• Condominiums• Housing: wall siding for houses, interior materials for buildings• Plants and manufacturing facilities: comprehensive engineering services
• Pharmaceuticals (natural interferon beta preparation, oral prostacyclin-derivative, oral anti-pruritus drug)
• Medical treatment devices (hemodialyzers, blood purifiers for severe sepsis, dialysis equipment)
Toray Group is able to secure stable expansion and profit growth from the Core Growth Driving Businesses of
Fibers & Textiles and Plastics & Chemicals, while it actively works to expand earnings through the Strategically
Expanding Businesses of IT-related Products and Carbon Fiber Composite Materials that it views as the drivers
of its earnings growth over the medium- and long-term. Moreover, Toray Group is nurturing the Intensively
Developing and Expanding Businesses of Environment & Engineering and Life Science as core earnings sourc-
es for future businesses to seek sustainable growth.
28
Tora
y In
dust
ries,
Inc.
Ann
ual R
epor
t 20
16
CORE GROWTH DRIVING BUSINESSES
Fibers & Texti les
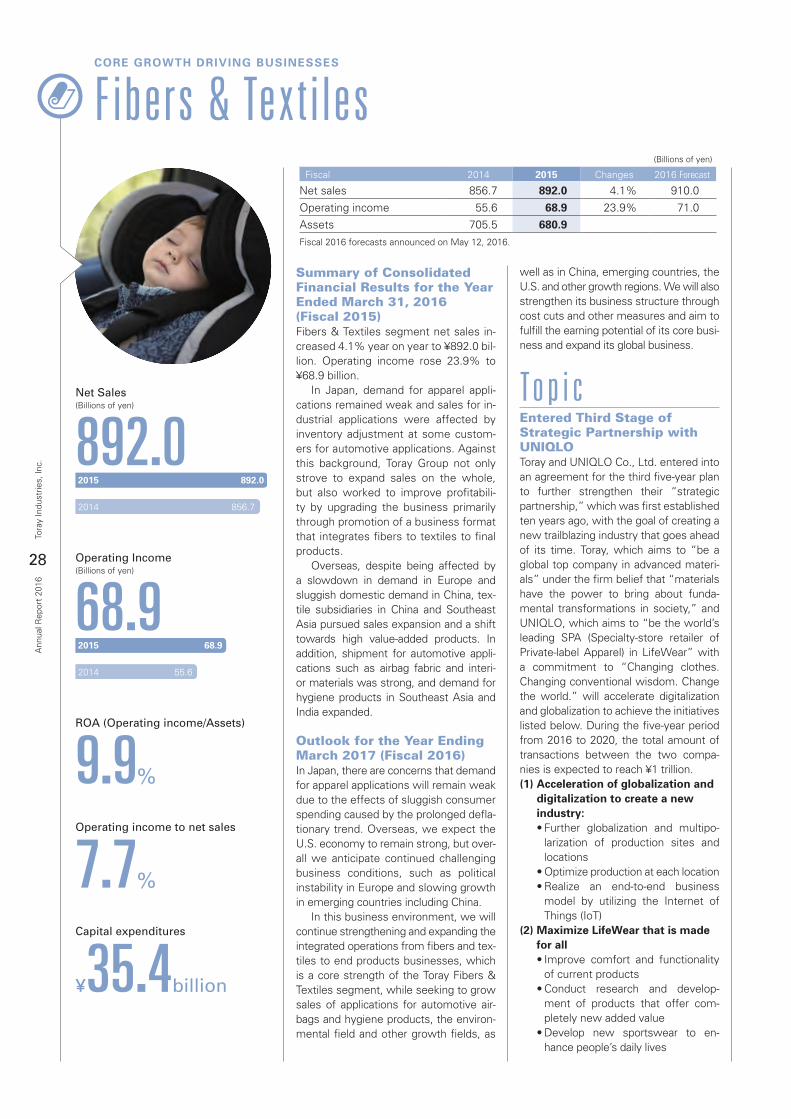
Summary of Consolidated Financial Results for the Year Ended March 31, 2016(Fiscal 2015)Fibers & Textiles segment net sales in-creased 4.1% year on year to ¥892.0 bil-lion. Operating income rose 23.9% to ¥68.9 billion. In Japan, demand for apparel appli-cations remained weak and sales for in-dustrial applications were affected by inventory adjustment at some custom-ers for automotive applications. Against this background, Toray Group not only strove to expand sales on the whole, but also worked to improve profitabili-ty by upgrading the business primarily through promotion of a business format that integrates fibers to textiles to final products. Overseas, despite being affected by a slowdown in demand in Europe and sluggish domestic demand in China, tex-tile subsidiaries in China and Southeast Asia pursued sales expansion and a shift towards high value-added products. In addition, shipment for automotive appli-cations such as airbag fabric and interi-or materials was strong, and demand for hygiene products in Southeast Asia and India expanded.
Outlook for the Year Ending March 2017 (Fiscal 2016)In Japan, there are concerns that demand for apparel applications will remain weak due to the effects of sluggish consumer spending caused by the prolonged defla-tionary trend. Overseas, we expect the U.S. economy to remain strong, but over-all we anticipate continued challenging business conditions, such as political instability in Europe and slowing growth in emerging countries including China. In this business environment, we will continue strengthening and expanding the integrated operations from fibers and tex-tiles to end products businesses, which is a core strength of the Toray Fibers & Textiles segment, while seeking to grow sales of applications for automotive air-bags and hygiene products, the environ-mental field and other growth fields, as
well as in China, emerging countries, the U.S. and other growth regions. We will also strengthen its business structure through cost cuts and other measures and aim to fulfill the earning potential of its core busi-ness and expand its global business.
To p i cEntered Third Stage of Strategic Partnership with UNIQLOToray and UNIQLO Co., Ltd. entered into an agreement for the third five-year plan to further strengthen their “strategic partnership,” which was first established ten years ago, with the goal of creating a new trailblazing industry that goes ahead of its time. Toray, which aims to “be a global top company in advanced materi-als” under the firm belief that “materials have the power to bring about funda-mental transformations in society,” and UNIQLO, which aims to “be the world’s leading SPA (Specialty-store retailer of Private-label Apparel) in LifeWear” with a commitment to “Changing clothes. Changing conventional wisdom. Change the world.” will accelerate digitalization and globalization to achieve the initiatives listed below. During the five-year period from 2016 to 2020, the total amount of transactions between the two compa-nies is expected to reach ¥1 trillion.(1) Acceleration of globalization and
digitalization to create a new industry:
• Further globalization and multipo-larization of production sites and locations
• Optimize production at each location • Realize an end-to-end business
model by utilizing the Internet of Things (IoT)
(2) Maximize LifeWear that is made for all
• Improve comfort and functionality of current products
• Conduct research and develop-ment of products that offer com-pletely new added value
• Develop new sportswear to en-hance people’s daily lives
(Billions of yen)
Fiscal 2014 2015 Changes 2016 Forecast
Net sales 856.7 892.0 4.1% 910.0
Operating income 55.6 68.9 23.9% 71.0Assets 705.5 680.9Fiscal 2016 forecasts announced on May 12, 2016.
ROA (Operating income/Assets)
9.9%
Operating income to net sales
7.7%
Capital expenditures
¥35.4billion
Net Sales(Billions of yen)
892.02015
2014
892.0
856.7
2015
2014
68.9
55.6
2015
2014
521.2
496.4
2015
2014
29.4
23.9
2015
2014
251.1
248.0
2015
2014
26.2
24.5
2015
2014
186.2
158.4
2015
2014
36.1
26.2
2015
2014
183.3
180.0
2015
2014
9.6
8.0
2015
2014
55.8
57.0
2015
2014
3.1
4.1
Operating Income(Billions of yen)
68.92015
2014
892.0
856.7
2015
2014
68.9
55.6
2015
2014
521.2
496.4
2015
2014
29.4
23.9
2015
2014
251.1
248.0
2015
2014
26.2
24.5
2015
2014
186.2
158.4
2015
2014
36.1
26.2
2015
2014
183.3
180.0
2015
2014
9.6
8.0
2015
2014
55.8
57.0
2015
2014
3.1
4.1
29
Tora
y In
dust
ries,
Inc.
Ann
ual R
epor
t 20
16
CORE GROWTH DRIVING BUSINESSES
Plastics & Chemicals
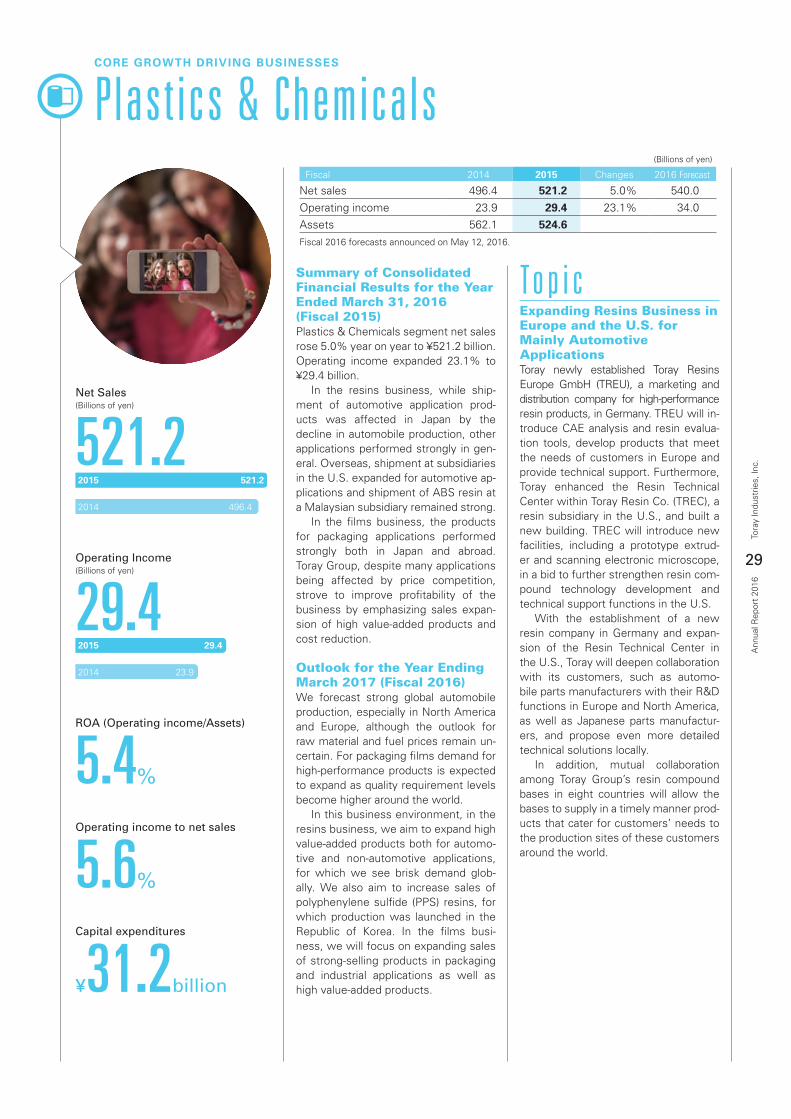
Summary of Consolidated Financial Results for the Year Ended March 31, 2016(Fiscal 2015)Plastics & Chemicals segment net sales rose 5.0% year on year to ¥521.2 billion. Operating income expanded 23.1% to ¥29.4 billion. In the resins business, while ship-ment of automotive application prod-ucts was affected in Japan by the decline in automobile production, other applications performed strongly in gen-eral. Overseas, shipment at subsidiaries in the U.S. expanded for automotive ap-plications and shipment of ABS resin at a Malaysian subsidiary remained strong. In the films business, the products for packaging applications performed strongly both in Japan and abroad. Toray Group, despite many applications being affected by price competition, strove to improve profitability of the business by emphasizing sales expan-sion of high value-added products and cost reduction.
Outlook for the Year Ending March 2017 (Fiscal 2016)We forecast strong global automobile production, especially in North America and Europe, although the outlook for raw material and fuel prices remain un-certain. For packaging films demand for high-performance products is expected to expand as quality requirement levels become higher around the world. In this business environment, in the resins business, we aim to expand high value-added products both for automo-tive and non-automotive applications, for which we see brisk demand glob-ally. We also aim to increase sales of polyphenylene sulfide (PPS) resins, for which production was launched in the Republic of Korea. In the films busi-ness, we will focus on expanding sales of strong-selling products in packaging and industrial applications as well as high value-added products.
To p i cExpanding Resins Business in Europe and the U.S. forMainly Automotive ApplicationsToray newly established Toray Resins Europe GmbH (TREU), a marketing and distribution company for high-performance resin products, in Germany. TREU will in-troduce CAE analysis and resin evalua-tion tools, develop products that meet the needs of customers in Europe and provide technical support. Furthermore, Toray enhanced the Resin Technical Center within Toray Resin Co. (TREC), a resin subsidiary in the U.S., and built a new building. TREC will introduce new facilities, including a prototype extrud-er and scanning electronic microscope, in a bid to further strengthen resin com-pound technology development and technical support functions in the U.S. With the establishment of a new resin company in Germany and expan-sion of the Resin Technical Center in the U.S., Toray will deepen collaboration with its customers, such as automo-bile parts manufacturers with their R&D functions in Europe and North America, as well as Japanese parts manufactur-ers, and propose even more detailed technical solutions locally. In addition, mutual collaboration among Toray Group’s resin compound bases in eight countries will allow the bases to supply in a timely manner prod-ucts that cater for customers’ needs to the production sites of these customers around the world.
(Billions of yen)
Fiscal 2014 2015 Changes 2016 Forecast
Net sales 496.4 521.2 5.0% 540.0
Operating income 23.9 29.4 23.1% 34.0Assets 562.1 524.6Fiscal 2016 forecasts announced on May 12, 2016.
ROA (Operating income/Assets)
5.4%
Operating income to net sales
5.6%
Capital expenditures
¥31.2billion
Net Sales(Billions of yen)
521.2
2015
2014
892.0
856.7
2015
2014
68.9
55.6
2015
2014
521.2
496.4
2015
2014
29.4
23.9
2015
2014
251.1
248.0
2015
2014
26.2
24.5
2015
2014
186.2
158.4
2015
2014
36.1
26.2
2015
2014
183.3
180.0
2015
2014
9.6
8.0
2015
2014
55.8
57.0
2015
2014
3.1
4.1
Operating Income(Billions of yen)
29.4
2015
2014
892.0
856.7
2015
2014
68.9
55.6
2015
2014
521.2
496.4
2015
2014
29.4
23.9
2015
2014
251.1
248.0
2015
2014
26.2
24.5
2015
2014
186.2
158.4
2015
2014
36.1
26.2
2015
2014
183.3
180.0
2015
2014
9.6
8.0
2015
2014
55.8
57.0
2015
2014
3.1
4.1
30
Tora
y In
dust
ries,
Inc.
Ann
ual R
epor
t 20
16
STRATEGICALLY EXPANDING BUSINESSES
IT-related Products
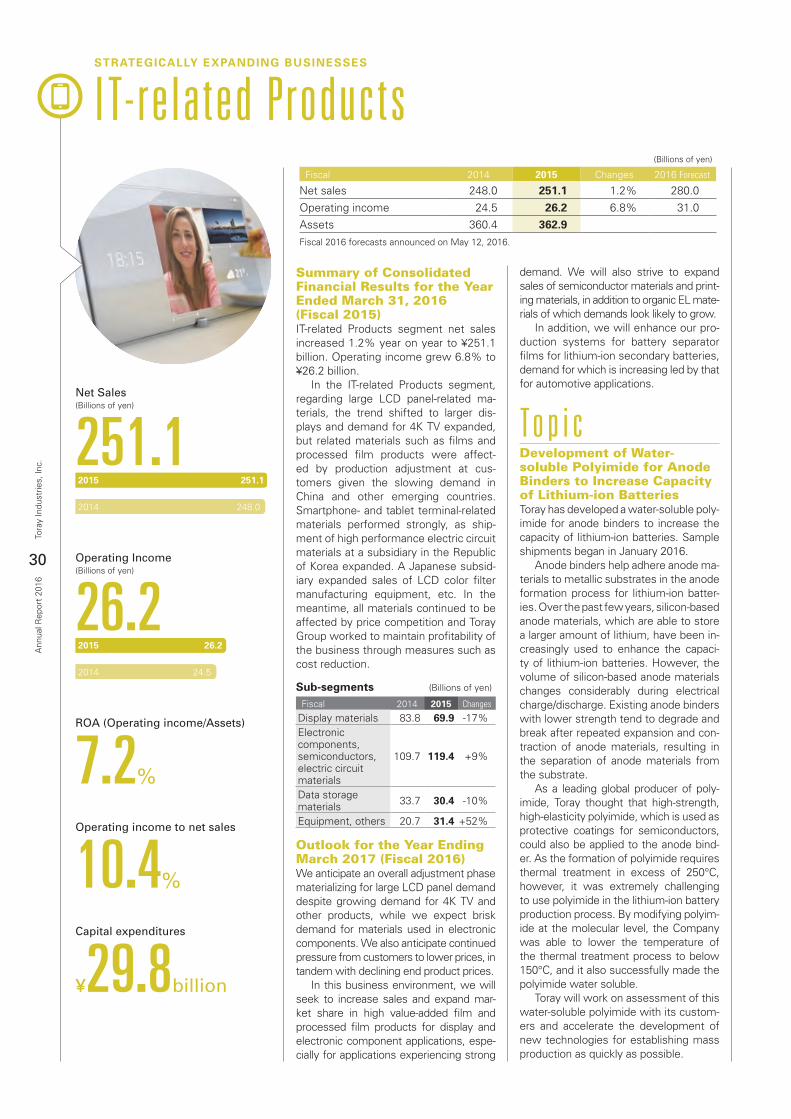
Summary of Consolidated Financial Results for the Year Ended March 31, 2016(Fiscal 2015)IT-related Products segment net sales increased 1.2% year on year to ¥251.1 billion. Operating income grew 6.8% to ¥26.2 billion. In the IT-related Products segment, regarding large LCD panel-related ma-terials, the trend shifted to larger dis-plays and demand for 4K TV expanded, but related materials such as films and processed film products were affect-ed by production adjustment at cus-tomers given the slowing demand in China and other emerging countries. Smartphone- and tablet terminal-related materials performed strongly, as ship-ment of high performance electric circuit materials at a subsidiary in the Republic of Korea expanded. A Japanese subsid-iary expanded sales of LCD color filter manufacturing equipment, etc. In the meantime, all materials continued to be affected by price competition and Toray Group worked to maintain profitability of the business through measures such as cost reduction.
Sub-segments (Billions of yen)
Fiscal 2014 2015 Changes
Display materials 83.8 69.9 -17%Electronic components, semiconductors, electric circuit materials
109.7 119.4 +9%
Data storage materials 33.7 30.4 -10%
Equipment, others 20.7 31.4 +52%
Outlook for the Year Ending March 2017 (Fiscal 2016)We anticipate an overall adjustment phase materializing for large LCD panel demand despite growing demand for 4K TV and other products, while we expect brisk demand for materials used in electronic components. We also anticipate continued pressure from customers to lower prices, in tandem with declining end product prices. In this business environment, we will seek to increase sales and expand mar-ket share in high value-added film and processed film products for display and electronic component applications, espe-cially for applications experiencing strong
demand. We will also strive to expand sales of semiconductor materials and print-ing materials, in addition to organic EL mate-rials of which demands look likely to grow. In addition, we will enhance our pro-duction systems for battery separator films for lithium-ion secondary batteries, demand for which is increasing led by that for automotive applications.
To p i cDevelopment of Water-soluble Polyimide for Anode Binders to Increase Capacity of Lithium-ion BatteriesToray has developed a water-soluble poly-imide for anode binders to increase the capacity of lithium-ion batteries. Sample shipments began in January 2016. Anode binders help adhere anode ma-terials to metallic substrates in the anode formation process for lithium-ion batter-ies. Over the past few years, silicon-based anode materials, which are able to store a larger amount of lithium, have been in-creasingly used to enhance the capaci-ty of lithium-ion batteries. However, the volume of silicon-based anode materials changes considerably during electrical charge/discharge. Existing anode binders with lower strength tend to degrade and break after repeated expansion and con-traction of anode materials, resulting in the separation of anode materials from the substrate. As a leading global producer of poly-imide, Toray thought that high-strength, high-elasticity polyimide, which is used as protective coatings for semiconductors, could also be applied to the anode bind-er. As the formation of polyimide requires thermal treatment in excess of 250°C, however, it was extremely challenging to use polyimide in the lithium-ion battery production process. By modifying polyim-ide at the molecular level, the Company was able to lower the temperature of the thermal treatment process to below 150°C, and it also successfully made the polyimide water soluble. Toray will work on assessment of this water-soluble polyimide with its custom-ers and accelerate the development of new technologies for establishing mass production as quickly as possible.
(Billions of yen)
Fiscal 2014 2015 Changes 2016 Forecast
Net sales 248.0 251.1 1.2% 280.0
Operating income 24.5 26.2 6.8% 31.0Assets 360.4 362.9Fiscal 2016 forecasts announced on May 12, 2016.
ROA (Operating income/Assets)
7.2%
Operating income to net sales
10.4%
Capital expenditures
¥29.8billion
Net Sales(Billions of yen)
251.1
2015
2014
892.0
856.7
2015
2014
68.9
55.6
2015
2014
521.2
496.4
2015
2014
29.4
23.9
2015
2014
251.1
248.0
2015
2014
26.2
24.5
2015
2014
186.2
158.4
2015
2014
36.1
26.2
2015
2014
183.3
180.0
2015
2014
9.6
8.0
2015
2014
55.8
57.0
2015
2014
3.1
4.1
Operating Income(Billions of yen)
26.2
2015
2014
892.0
856.7
2015
2014
68.9
55.6
2015
2014
521.2
496.4
2015
2014
29.4
23.9
2015
2014
251.1
248.0
2015
2014
26.2
24.5
2015
2014
186.2
158.4
2015
2014
36.1
26.2
2015
2014
183.3
180.0
2015
2014
9.6
8.0
2015
2014
55.8
57.0
2015
2014
3.1
4.1
31
Tora
y In
dust
ries,
Inc.
Ann
ual R
epor
t 20
16
STRATEGICALLY EXPANDING BUSINESSES
Carbon Fiber Composite Materials
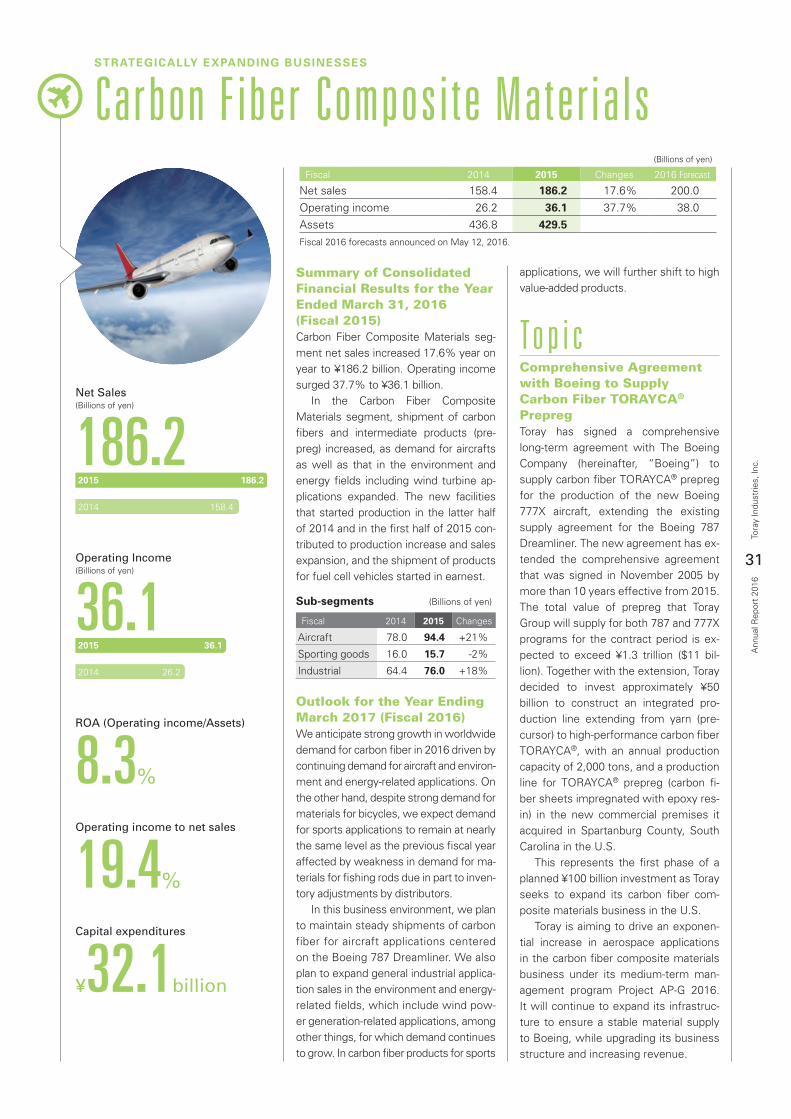
Summary of Consolidated Financial Results for the Year Ended March 31, 2016(Fiscal 2015)Carbon Fiber Composite Materials seg-ment net sales increased 17.6% year on year to ¥186.2 billion. Operating income surged 37.7% to ¥36.1 billion. In the Carbon Fiber Composite Materials segment, shipment of carbon fibers and intermediate products (pre-preg) increased, as demand for aircrafts as well as that in the environment and energy fields including wind turbine ap-plications expanded. The new facilities that started production in the latter half of 2014 and in the first half of 2015 con-tributed to production increase and sales expansion, and the shipment of products for fuel cell vehicles started in earnest.
Sub-segments (Billions of yen)
Fiscal 2014 2015 Changes
Aircraft 78.0 94.4 +21%
Sporting goods 16.0 15.7 -2%
Industrial 64.4 76.0 +18%
Outlook for the Year Ending March 2017 (Fiscal 2016)We anticipate strong growth in worldwide demand for carbon fiber in 2016 driven by continuing demand for aircraft and environ-ment and energy-related applications. On the other hand, despite strong demand for materials for bicycles, we expect demand for sports applications to remain at nearly the same level as the previous fiscal year affected by weakness in demand for ma-terials for fishing rods due in part to inven-tory adjustments by distributors. In this business environment, we plan to maintain steady shipments of carbon fiber for aircraft applications centered on the Boeing 787 Dreamliner. We also plan to expand general industrial applica-tion sales in the environment and energy-related fields, which include wind pow-er generation-related applications, among other things, for which demand continues to grow. In carbon fiber products for sports
applications, we will further shift to high value-added products.
To p i cComprehensive Agreement with Boeing to Supply Carbon Fiber TORAYCA® Prepreg Toray has signed a comprehensive long-term agreement with The Boeing Company (hereinafter, “Boeing”) to supply carbon fiber TORAYCA® prepreg for the production of the new Boeing 777X aircraft, extending the existing supply agreement for the Boeing 787 Dreamliner. The new agreement has ex-tended the comprehensive agreement that was signed in November 2005 by more than 10 years effective from 2015. The total value of prepreg that Toray Group will supply for both 787 and 777X programs for the contract period is ex-pected to exceed ¥1.3 trillion ($11 bil-lion). Together with the extension, Toray decided to invest approximately ¥50 billion to construct an integrated pro-duction line extending from yarn (pre-cursor) to high-performance carbon fiber TORAYCA®, with an annual production capacity of 2,000 tons, and a production line for TORAYCA® prepreg (carbon fi-ber sheets impregnated with epoxy res-in) in the new commercial premises it acquired in Spartanburg County, South Carolina in the U.S. This represents the first phase of a planned ¥100 billion investment as Toray seeks to expand its carbon fiber com-posite materials business in the U.S. Toray is aiming to drive an exponen-tial increase in aerospace applications in the carbon fiber composite materials business under its medium-term man-agement program Project AP-G 2016. It will continue to expand its infrastruc-ture to ensure a stable material supply to Boeing, while upgrading its business structure and increasing revenue.
(Billions of yen)
Fiscal 2014 2015 Changes 2016 Forecast
Net sales 158.4 186.2 17.6% 200.0
Operating income 26.2 36.1 37.7% 38.0Assets 436.8 429.5Fiscal 2016 forecasts announced on May 12, 2016.
ROA (Operating income/Assets)
8.3%
Operating income to net sales
19.4%
Capital expenditures
¥32.1billion
Net Sales(Billions of yen)
186.2
2015
2014
892.0
856.7
2015
2014
68.9
55.6
2015
2014
521.2
496.4
2015
2014
29.4
23.9
2015
2014
251.1
248.0
2015
2014
26.2
24.5
2015
2014
186.2
158.4
2015
2014
36.1
26.2
2015
2014
183.3
180.0
2015
2014
9.6
8.0
2015
2014
55.8
57.0
2015
2014
3.1
4.1
Operating Income(Billions of yen)
36.1
2015
2014
892.0
856.7
2015
2014
68.9
55.6
2015
2014
521.2
496.4
2015
2014
29.4
23.9
2015
2014
251.1
248.0
2015
2014
26.2
24.5
2015
2014
186.2
158.4
2015
2014
36.1
26.2
2015
2014
183.3
180.0
2015
2014
9.6
8.0
2015
2014
55.8
57.0
2015
2014
3.1
4.1
32
Tora
y In
dust
ries,
Inc.
Ann
ual R
epor
t 20
16
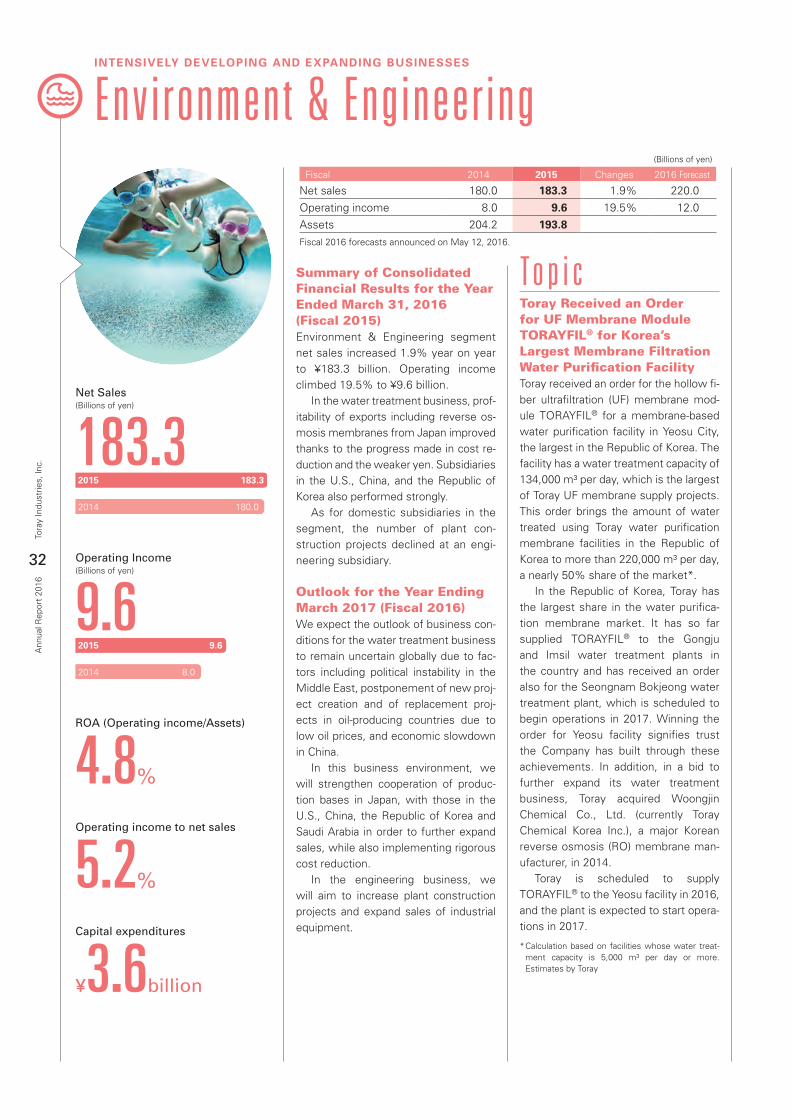
INTENSIVELY DEVELOPING AND EXPANDING BUSINESSES
Environment & Engineering
Summary of Consolidated Financial Results for the Year Ended March 31, 2016(Fiscal 2015)Environment & Engineering segment net sales increased 1.9% year on year to ¥183.3 billion. Operating income climbed 19.5% to ¥9.6 billion. In the water treatment business, prof-itability of exports including reverse os-mosis membranes from Japan improved thanks to the progress made in cost re-duction and the weaker yen. Subsidiaries in the U.S., China, and the Republic of Korea also performed strongly. As for domestic subsidiaries in the segment, the number of plant con-struction projects declined at an engi-neering subsidiary.
Outlook for the Year Ending March 2017 (Fiscal 2016)We expect the outlook of business con-ditions for the water treatment business to remain uncertain globally due to fac-tors including political instability in the Middle East, postponement of new proj-ect creation and of replacement proj-ects in oil-producing countries due to low oil prices, and economic slowdown in China. In this business environment, we will strengthen cooperation of produc-tion bases in Japan, with those in the U.S., China, the Republic of Korea and Saudi Arabia in order to further expand sales, while also implementing rigorous cost reduction. In the engineering business, we will aim to increase plant construction projects and expand sales of industrial equipment.
To p i cToray Received an Order for UF Membrane Module TORAYFIL® for Korea’s Largest Membrane Filtration Water Purification FacilityToray received an order for the hollow fi-ber ultrafiltration (UF) membrane mod-ule TORAYFIL® for a membrane-based water purification facility in Yeosu City, the largest in the Republic of Korea. The facility has a water treatment capacity of 134,000 m³ per day, which is the largest of Toray UF membrane supply projects. This order brings the amount of water treated using Toray water purification membrane facilities in the Republic of Korea to more than 220,000 m³ per day, a nearly 50% share of the market*. In the Republic of Korea, Toray has the largest share in the water purifica-tion membrane market. It has so far supplied TORAYFIL® to the Gongju and Imsil water treatment plants in the country and has received an order also for the Seongnam Bokjeong water treatment plant, which is scheduled to begin operations in 2017. Winning the order for Yeosu facility signifies trust the Company has built through these achievements. In addition, in a bid to further expand its water treatment business, Toray acquired Woongjin Chemical Co., Ltd. (currently Toray Chemical Korea Inc.), a major Korean reverse osmosis (RO) membrane man-ufacturer, in 2014. Toray is scheduled to supply TORAYFIL® to the Yeosu facility in 2016, and the plant is expected to start opera-tions in 2017.
* Calculation based on facilities whose water treat-ment capacity is 5,000 m³ per day or more. Estimates by Toray
(Billions of yen)
Fiscal 2014 2015 Changes 2016 Forecast
Net sales 180.0 183.3 1.9% 220.0
Operating income 8.0 9.6 19.5% 12.0Assets 204.2 193.8Fiscal 2016 forecasts announced on May 12, 2016.
ROA (Operating income/Assets)
4.8%
Operating income to net sales
5.2%
Capital expenditures
¥3.6billion
Net Sales(Billions of yen)
183.3
2015
2014
892.0
856.7
2015
2014
68.9
55.6
2015
2014
521.2
496.4
2015
2014
29.4
23.9
2015
2014
251.1
248.0
2015
2014
26.2
24.5
2015
2014
186.2
158.4
2015
2014
36.1
26.2
2015
2014
183.3
180.0
2015
2014
9.6
8.0
2015
2014
55.8
57.0
2015
2014
3.1
4.1
Operating Income(Billions of yen)
9.6
2015
2014
892.0
856.7
2015
2014
68.9
55.6
2015
2014
521.2
496.4
2015
2014
29.4
23.9
2015
2014
251.1
248.0
2015
2014
26.2
24.5
2015
2014
186.2
158.4
2015
2014
36.1
26.2
2015
2014
183.3
180.0
2015
2014
9.6
8.0
2015
2014
55.8
57.0
2015
2014
3.1
4.1
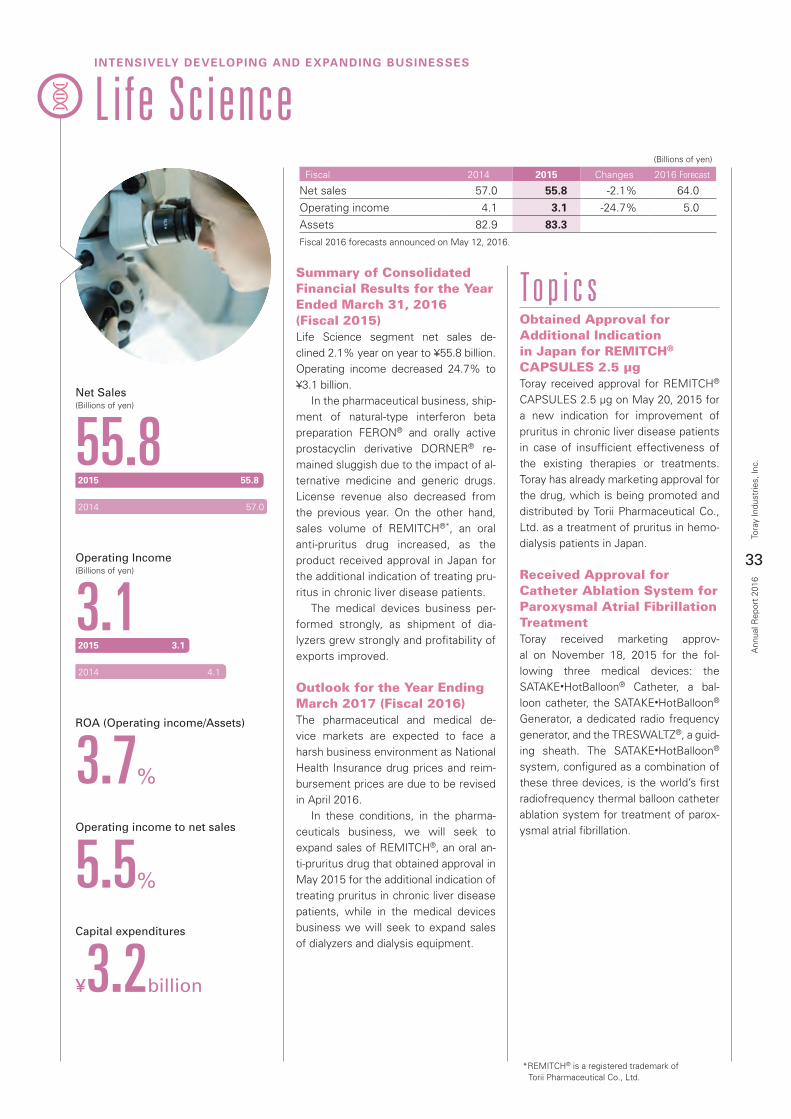
33
Tora
y In
dust
ries,
Inc.
Ann
ual R
epor
t 20
16
INTENSIVELY DEVELOPING AND EXPANDING BUSINESSES
Life Science
Summary of Consolidated Financial Results for the Year Ended March 31, 2016(Fiscal 2015)Life Science segment net sales de-clined 2.1% year on year to ¥55.8 billion. Operating income decreased 24.7% to ¥3.1 billion. In the pharmaceutical business, ship-ment of natural-type interferon beta preparation FERON® and orally active prostacyclin derivative DORNER® re-mained sluggish due to the impact of al-ternative medicine and generic drugs. License revenue also decreased from the previous year. On the other hand, sales volume of REMITCH®*, an oral anti-pruritus drug increased, as the product received approval in Japan for the additional indication of treating pru-ritus in chronic liver disease patients. The medical devices business per-formed strongly, as shipment of dia-lyzers grew strongly and profitability of exports improved.
Outlook for the Year Ending March 2017 (Fiscal 2016)The pharmaceutical and medical de-vice markets are expected to face a harsh business environment as National Health Insurance drug prices and reim-bursement prices are due to be revised in April 2016. In these conditions, in the pharma-ceuticals business, we will seek to expand sales of REMITCH®, an oral an-ti-pruritus drug that obtained approval in May 2015 for the additional indication of treating pruritus in chronic liver disease patients, while in the medical devices business we will seek to expand sales of dialyzers and dialysis equipment.
To p i c sObtained Approval for Additional Indication in Japan for REMITCH®
CAPSULES 2.5 µgToray received approval for REMITCH® CAPSULES 2.5 µg on May 20, 2015 for a new indication for improvement of pruritus in chronic liver disease patients in case of insufficient effectiveness of the existing therapies or treatments. Toray has already marketing approval for the drug, which is being promoted and distributed by Torii Pharmaceutical Co., Ltd. as a treatment of pruritus in hemo-dialysis patients in Japan.
Received Approval for Catheter Ablation System for Paroxysmal Atrial Fibrillation TreatmentToray received marketing approv-al on November 18, 2015 for the fol-lowing three medical devices: the SATAKE•HotBalloon® Catheter, a bal-loon catheter, the SATAKE•HotBalloon® Generator, a dedicated radio frequency generator, and the TRESWALTZ®, a guid-ing sheath. The SATAKE•HotBalloon® system, configured as a combination of these three devices, is the world’s first radiofrequency thermal balloon catheter ablation system for treatment of parox-ysmal atrial fibrillation.
(Billions of yen)
Fiscal 2014 2015 Changes 2016 Forecast
Net sales 57.0 55.8 -2.1% 64.0
Operating income 4.1 3.1 -24.7% 5.0Assets 82.9 83.3Fiscal 2016 forecasts announced on May 12, 2016.
ROA (Operating income/Assets)
3.7%
Operating income to net sales
5.5%
Capital expenditures
¥3.2billion
Net Sales(Billions of yen)
55.8
2015
2014
892.0
856.7
2015
2014
68.9
55.6
2015
2014
521.2
496.4
2015
2014
29.4
23.9
2015
2014
251.1
248.0
2015
2014
26.2
24.5
2015
2014
186.2
158.4
2015
2014
36.1
26.2
2015
2014
183.3
180.0
2015
2014
9.6
8.0
2015
2014
55.8
57.0
2015
2014
3.1
4.1
Operating Income(Billions of yen)
3.1
2015
2014
892.0
856.7
2015
2014
68.9
55.6
2015
2014
521.2
496.4
2015
2014
29.4
23.9
2015
2014
251.1
248.0
2015
2014
26.2
24.5
2015
2014
186.2
158.4
2015
2014
36.1
26.2
2015
2014
183.3
180.0
2015
2014
9.6
8.0
2015
2014
55.8
57.0
2015
2014
3.1
4.1
*REMITCH® is a registered trademark of Torii Pharmaceutical Co., Ltd.
34
Tora
y In
dust
ries,
Inc.
Ann
ual R
epor
t 20
16
To ray G roup aims to be a corporate group that delivers exceptional value to each and every one of
its stakeholders. Based on its corporate philosophy, “contributing to society through the creation of new val-
ue with innovative ideas, technologies and products by creating new value,” the Group advances its global op-
erations through the strategy trinity of business, R&D, and intellectual property. At the same time, the Group
promotes bolstered safety, accident prevention, and environmental preservation, corporate ethics, and legal
compliance to fulfill its corporate social responsibility (CSR) as its top priority management theme to achieve
sustainable growth.
INTEGRATED VALUE MANAGEMENT

Since its founding,
Toray has carried out
R&D on advanced materials
based on the firm conviction
that “research and technical
development provide the key
to building the Toray of
tomorrow.”
35
Tora
y In
dust
ries,
Inc.
Ann
ual R
epor
t 20
16
R&D and Intellectual Property
INTEGRATED VALUE MANAGEMENT
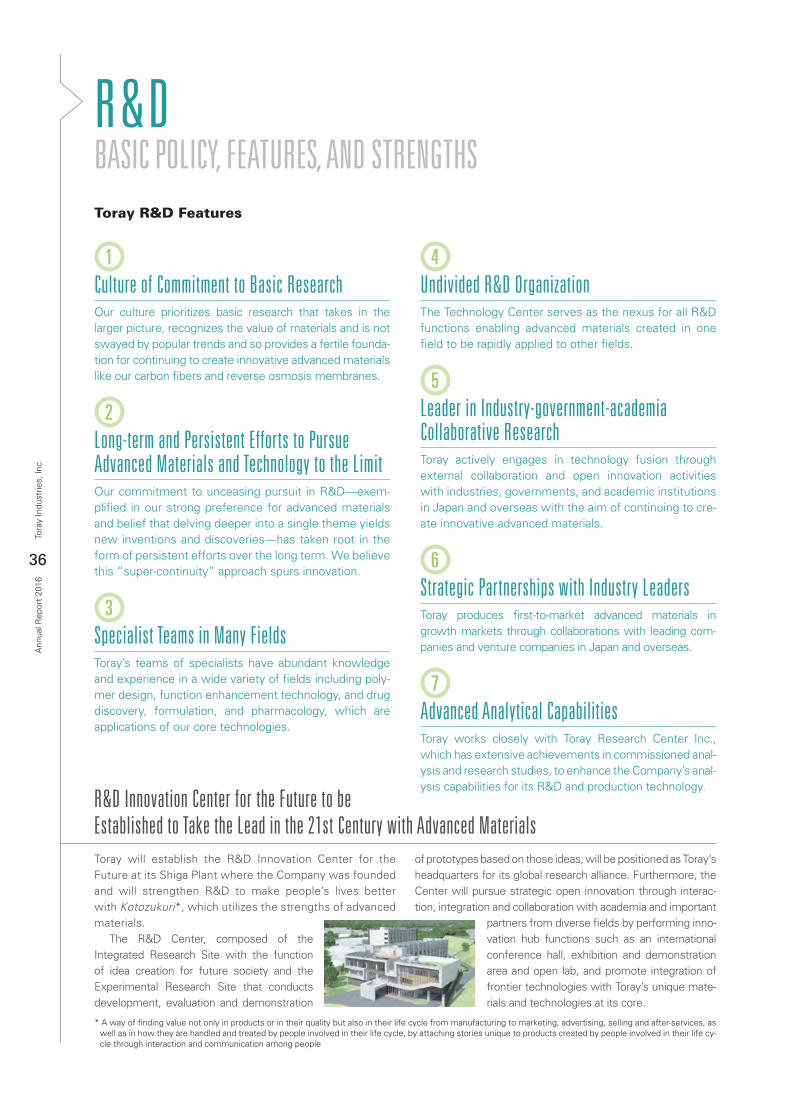
36
Tora
y In
dust
ries,
Inc.
Ann
ual R
epor
t 20
16
R&DBASIC POLICY, FEATURES, AND STRENGTHS
1Culture of Commitment to Basic ResearchOur culture prioritizes basic research that takes in the larger picture, recognizes the value of materials and is not swayed by popular trends and so provides a fertile founda-tion for continuing to create innovative advanced materials like our carbon fibers and reverse osmosis membranes.
2Long-term and Persistent Efforts to Pursue Advanced Materials and Technology to the LimitOur commitment to unceasing pursuit in R&D—exem-plified in our strong preference for advanced materials and belief that delving deeper into a single theme yields new inventions and discoveries—has taken root in the form of persistent efforts over the long term. We believe this “super-continuity” approach spurs innovation.
3Specialist Teams in Many FieldsToray’s teams of specialists have abundant knowledge and experience in a wide variety of fields including poly-mer design, function enhancement technology, and drug discovery, formulation, and pharmacology, which are applications of our core technologies.
4Undivided R&D OrganizationThe Technology Center serves as the nexus for all R&D functions enabling advanced materials created in one field to be rapidly applied to other fields.
5Leader in Industry-government-academia Collaborative ResearchToray actively engages in technology fusion through external collaboration and open innovation activities with industries, governments, and academic institutions in Japan and overseas with the aim of continuing to cre-ate innovative advanced materials.
6Strategic Partnerships with Industry LeadersToray produces first-to-market advanced materials in growth markets through collaborations with leading com-panies and venture companies in Japan and overseas.
7Advanced Analytical CapabilitiesToray works closely with Toray Research Center Inc., which has extensive achievements in commissioned anal-ysis and research studies, to enhance the Company’s anal-ysis capabilities for its R&D and production technology.
Toray R&D Features
R&D Innovation Center for the Future to beEstablished to Take the Lead in the 21st Century with Advanced MaterialsToray will establish the R&D Innovation Center for the Future at its Shiga Plant where the Company was founded and will strengthen R&D to make people’s lives better with Kotozukuri*, which utilizes the strengths of advanced materials. The R&D Center, composed of the Integrated Research Site with the function of idea creation for future society and the Experimental Research Site that conducts development, evaluation and demonstration
of prototypes based on those ideas, will be positioned as Toray’s headquarters for its global research alliance. Furthermore, the Center will pursue strategic open innovation through interac-tion, integration and collaboration with academia and important
partners from diverse fields by performing inno-vation hub functions such as an international conference hall, exhibition and demonstration area and open lab, and promote integration of frontier technologies with Toray’s unique mate-rials and technologies at its core.
* A way of finding value not only in products or in their quality but also in their life cycle from manufacturing to marketing, advertising, selling and after-services, as well as in how they are handled and treated by people involved in their life cycle, by attaching stories unique to products created by people involved in their life cy-cle through interaction and communication among people
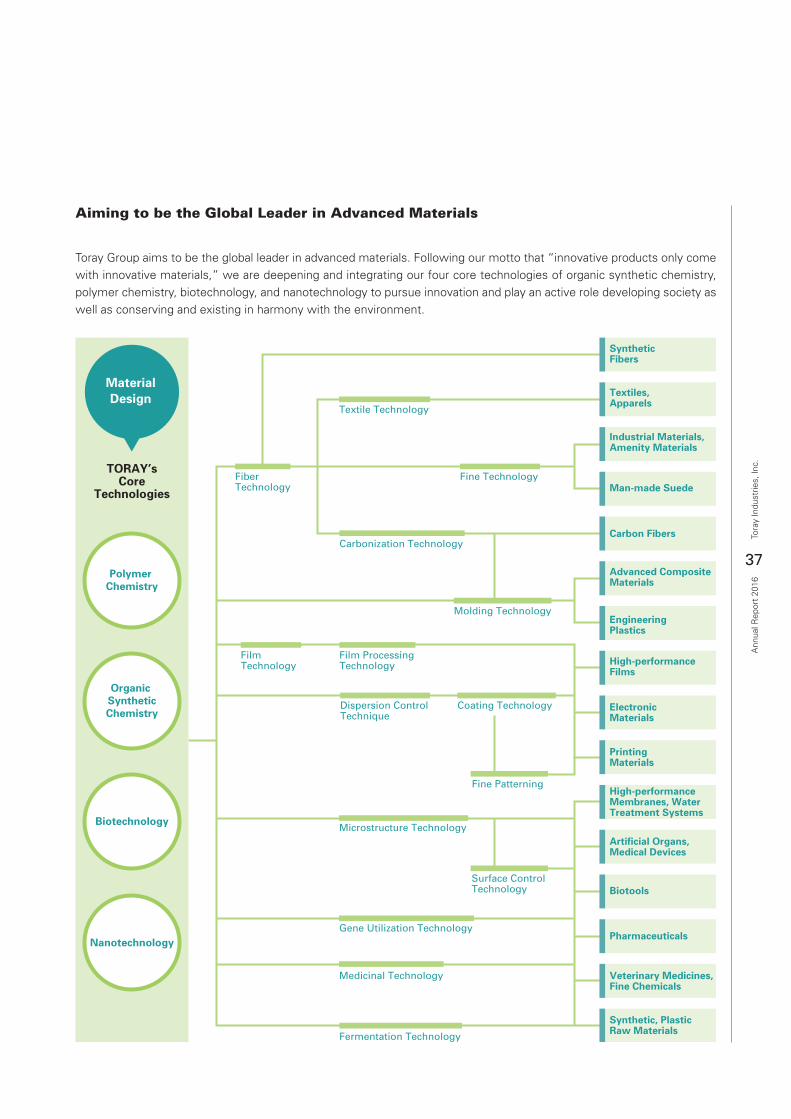
Polymer Chemistry
MaterialDesign
Organic SyntheticChemistry
Biotechnology
Nanotechnology
Microstructure Technology
Dispersion ControlTechnique
Surface ControlTechnology
Fine Patterning
Coating Technology
Medicinal Technology
Gene Utilization Technology
Fermentation Technology
Molding Technology
Fine TechnologyFiber Technology
Film ProcessingTechnology
Carbonization Technology
Textile Technology
FilmTechnology
SyntheticFibers
TORAY’sCore
Technologies
Textiles,Apparels
Industrial Materials,Amenity Materials
Man-made Suede
High-performanceFilms
EngineeringPlastics
ElectronicMaterials
PrintingMaterials
Carbon Fibers
High-performanceMembranes, WaterTreatment Systems
Artificial Organs,Medical Devices
Biotools
Veterinary Medicines,Fine Chemicals
Pharmaceuticals
Synthetic, Plastic Raw Materials
Advanced CompositeMaterials
37
Tora
y In
dust
ries,
Inc.
Ann
ual R
epor
t 20
16
Aiming to be the Global Leader in Advanced Materials
Toray Group aims to be the global leader in advanced materials. Following our motto that “innovative products only come with innovative materials,” we are deepening and integrating our four core technologies of organic synthetic chemistry, polymer chemistry, biotechnology, and nanotechnology to pursue innovation and play an active role developing society as well as conserving and existing in harmony with the environment.
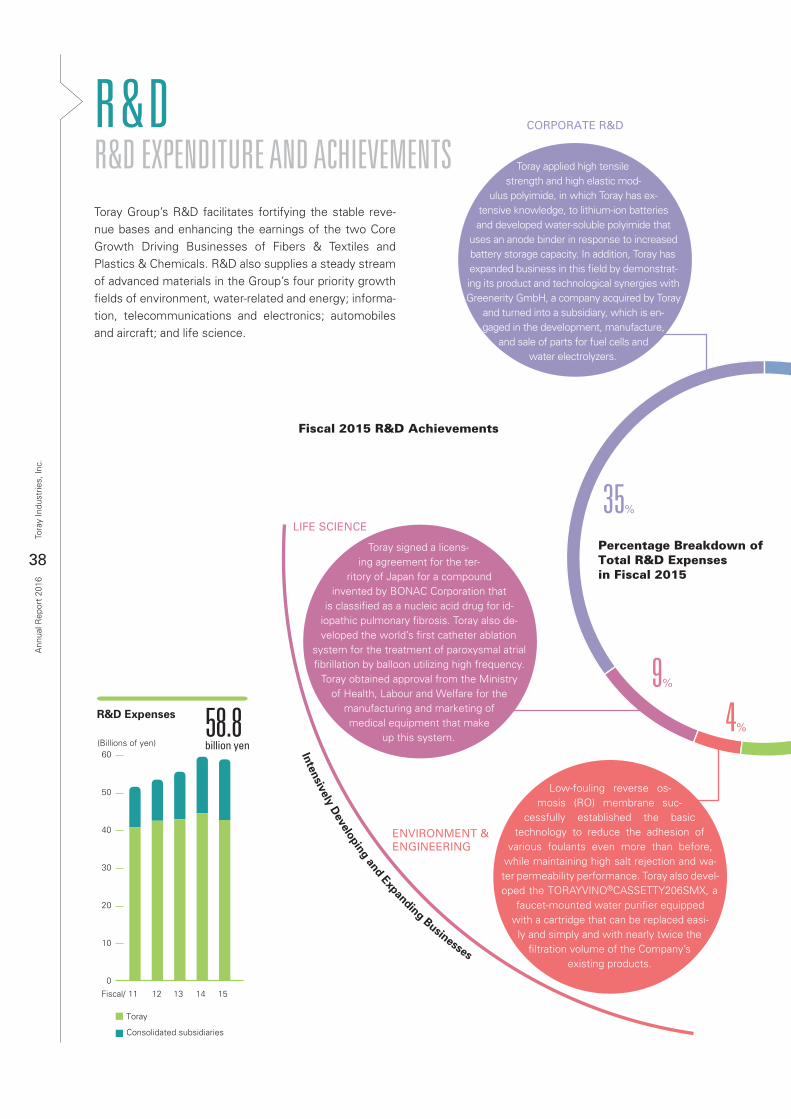
9%
14%
19%
10%4%
9%
35%
Intensively Developing and Expanding Businesses Stra
tegically
E
xpan
ding
Bus
ines
ses
Core Growth Driving Businesses
FIBERS &TEXTILES
PLASTICS &CHEMICALS
IT-RELATEDPRODUCTS
CARBON FIBERCOMPOSITEMATERIALS
ENVIRONMENT &ENGINEERING
LIFE SCIENCE
CORPORATE R&D
Fiscal 2015 R&D Achievements
Percentage Breakdown of Total R&D Expenses in Fiscal 2015
60
30
20
10
0
11 12 13 14 15
40
50
58.8billion yen
R&D Expenses
(Billions of yen)
Fiscal/
Toray
Consolidated subsidiaries
38
Tora
y In
dust
ries,
Inc.
Ann
ual R
epor
t 20
16
R&DR&D EXPENDITURE AND ACHIEVEMENTS
Low-fouling reverse os-mosis (RO) membrane suc-
cessfully established the basic technology to reduce the adhesion of
various foulants even more than before, while maintaining high salt rejection and wa-ter permeability performance. Toray also devel-oped the TORAYVINO®CASSETTY206SMX, a
faucet-mounted water purifier equipped with a cartridge that can be replaced easi-ly and simply and with nearly twice the
filtration volume of the Company’s existing products.
Toray signed a licens-ing agreement for the ter-
ritory of Japan for a compound invented by BONAC Corporation that
is classified as a nucleic acid drug for id-iopathic pulmonary fibrosis. Toray also de-veloped the world’s first catheter ablation
system for the treatment of paroxysmal atrial fibrillation by balloon utilizing high frequency.
Toray obtained approval from the Ministry of Health, Labour and Welfare for the
manufacturing and marketing of medical equipment that make
up this system.
Toray applied high tensile strength and high elastic mod-
ulus polyimide, in which Toray has ex-tensive knowledge, to lithium-ion batteries and developed water-soluble polyimide that
uses an anode binder in response to increased battery storage capacity. In addition, Toray has expanded business in this field by demonstrat-ing its product and technological synergies with Greenerity GmbH, a company acquired by Toray
and turned into a subsidiary, which is en-gaged in the development, manufacture,
and sale of parts for fuel cells and water electrolyzers.
Toray Group’s R&D facilitates fortifying the stable reve-nue bases and enhancing the earnings of the two Core Growth Driving Businesses of Fibers & Textiles and Plastics & Chemicals. R&D also supplies a steady stream of advanced materials in the Group’s four priority growth fields of environment, water-related and energy; informa-tion, telecommunications and electronics; automobiles and aircraft; and life science.
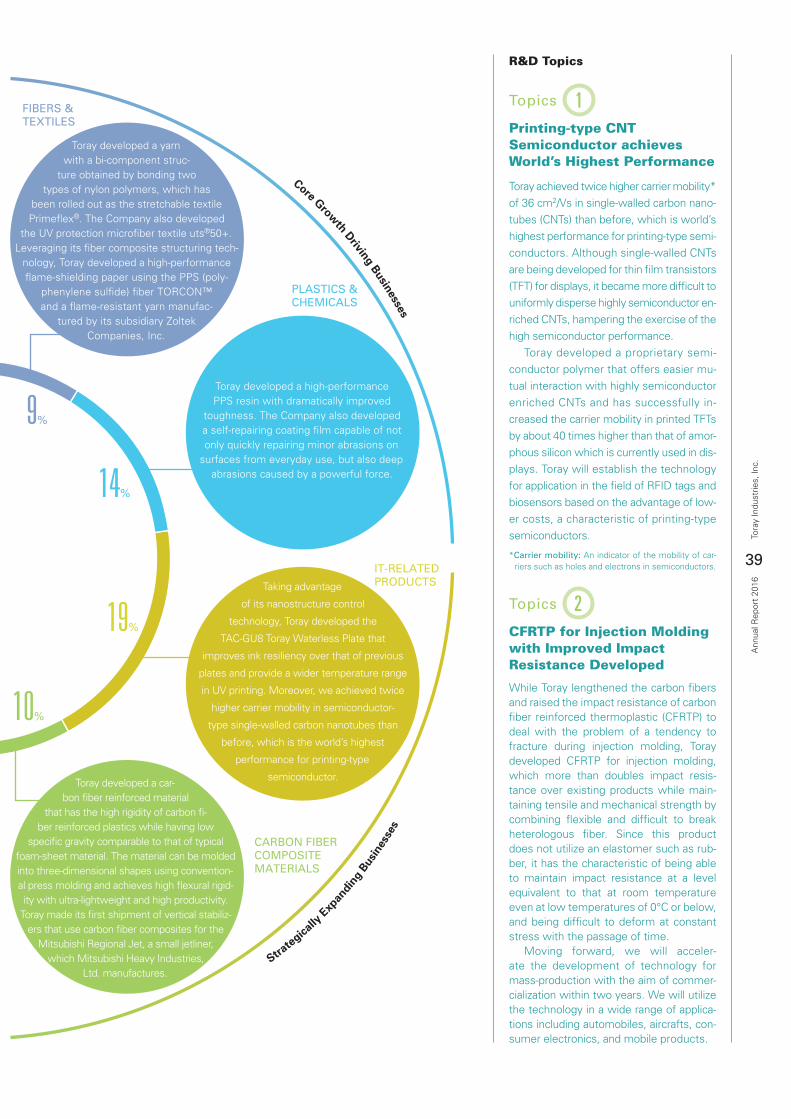
9%
14%
19%
10%4%
9%
35%
Intensively Developing and Expanding Businesses Stra
tegically
E
xpan
ding
Bus
ines
ses
Core Growth Driving Businesses
FIBERS &TEXTILES
PLASTICS &CHEMICALS
IT-RELATEDPRODUCTS
CARBON FIBERCOMPOSITEMATERIALS
ENVIRONMENT &ENGINEERING
LIFE SCIENCE
CORPORATE R&D
Fiscal 2015 R&D Achievements
Percentage Breakdown of Total R&D Expenses in Fiscal 2015
60
30
20
10
0
11 12 13 14 15
40
50
58.8billion yen
R&D Expenses
(Billions of yen)
Fiscal/
Toray
Consolidated subsidiaries
39
Tora
y In
dust
ries,
Inc.
Ann
ual R
epor
t 20
16
Toray developed a yarn with a bi-component struc-
ture obtained by bonding two types of nylon polymers, which has
been rolled out as the stretchable textile Primeflex®. The Company also developed
the UV protection microfiber textile uts®50+. Leveraging its fiber composite structuring tech-
nology, Toray developed a high-performance flame-shielding paper using the PPS (poly-
phenylene sulfide) fiber TORCON™ and a flame-resistant yarn manufac-
tured by its subsidiary Zoltek Companies, Inc.
Toray developed a high-performance PPS resin with dramatically improved
toughness. The Company also developed a self-repairing coating film capable of not only quickly repairing minor abrasions on
surfaces from everyday use, but also deep abrasions caused by a powerful force.
Taking advantage
of its nanostructure control
technology, Toray developed the
TAC-GU8 Toray Waterless Plate that
improves ink resiliency over that of previous
plates and provide a wider temperature range
in UV printing. Moreover, we achieved twice
higher carrier mobility in semiconductor-
type single-walled carbon nanotubes than
before, which is the world’s highest
performance for printing-type
semiconductor. Toray developed a car-bon fiber reinforced material
that has the high rigidity of carbon fi-ber reinforced plastics while having low
specific gravity comparable to that of typical foam-sheet material. The material can be molded into three-dimensional shapes using convention-al press molding and achieves high flexural rigid-ity with ultra-lightweight and high productivity.
Toray made its first shipment of vertical stabiliz-ers that use carbon fiber composites for the
Mitsubishi Regional Jet, a small jetliner, which Mitsubishi Heavy Industries,
Ltd. manufactures.
Topics 2
CFRTP for Injection Molding with Improved Impact Resistance Developed
While Toray lengthened the carbon fibers and raised the impact resistance of carbon fiber reinforced thermoplastic (CFRTP) to deal with the problem of a tendency to fracture during injection molding, Toray developed CFRTP for injection molding, which more than doubles impact resis-tance over existing products while main-taining tensile and mechanical strength by combining flexible and difficult to break heterologous fiber. Since this product does not utilize an elastomer such as rub-ber, it has the characteristic of being able to maintain impact resistance at a level equivalent to that at room temperature even at low temperatures of 0°C or below, and being difficult to deform at constant stress with the passage of time. Moving forward, we will acceler-ate the development of technology for mass-production with the aim of commer-cialization within two years. We will utilize the technology in a wide range of applica-tions including automobiles, aircrafts, con-sumer electronics, and mobile products.
Topics 1
Printing-type CNT Semiconductor achieves World’s Highest Performance
Toray achieved twice higher carrier mobility* of 36 cm2/Vs in single-walled carbon nano-tubes (CNTs) than before, which is world’s highest performance for printing-type semi-conductors. Although single-walled CNTs are being developed for thin film transistors (TFT) for displays, it became more difficult to uniformly disperse highly semiconductor en-riched CNTs, hampering the exercise of the high semiconductor performance. Toray developed a proprietary semi-conductor polymer that offers easier mu-tual interaction with highly semiconductor enriched CNTs and has successfully in-creased the carrier mobility in printed TFTs by about 40 times higher than that of amor-phous silicon which is currently used in dis-plays. Toray will establish the technology for application in the field of RFID tags and biosensors based on the advantage of low-er costs, a characteristic of printing-type semiconductors.
*Carrier mobility: An indicator of the mobility of car-riers such as holes and electrons in semiconductors.
R&D Topics
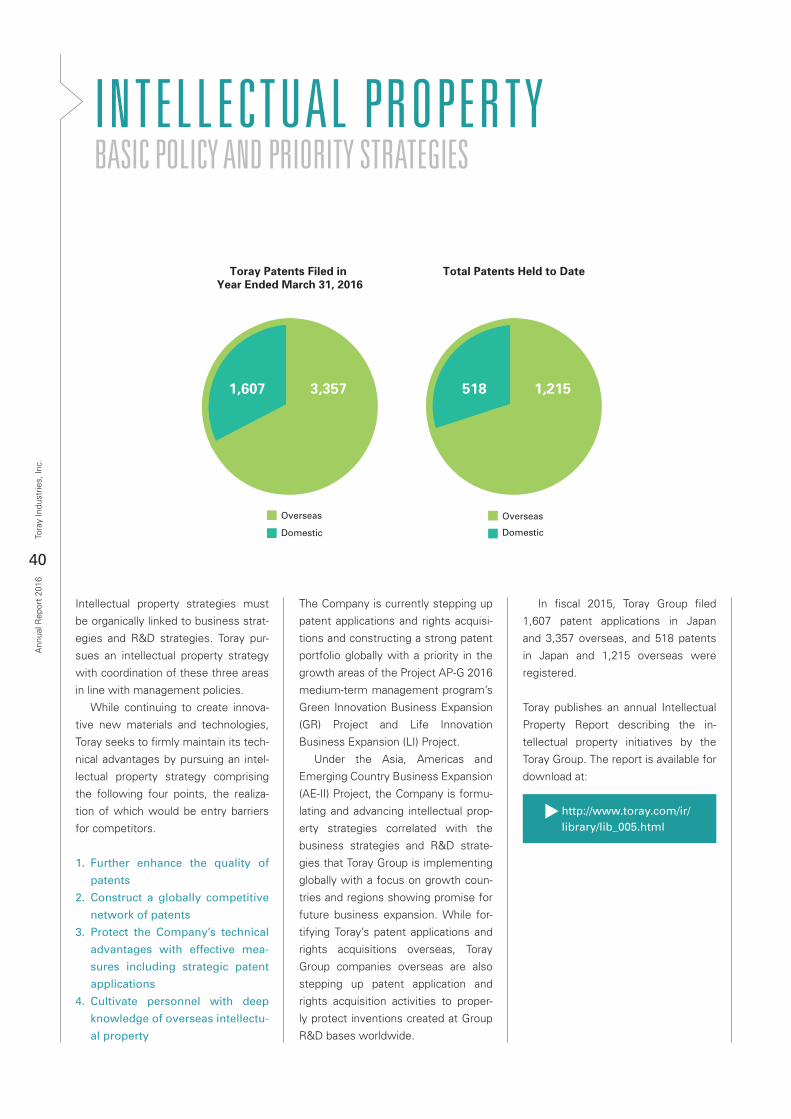
Overseas
Domestic
3,3571,607
Overseas
Domestic
1,215518
Total Patents Held to DateToray Patents Filed in Year Ended March 31, 2016
40
Tora
y In
dust
ries,
Inc.
Ann
ual R
epor
t 20
16
INTELLECTUAL PROPERTYBASIC POLICY AND PRIORITY STRATEGIES
Intellectual property strategies must
be organically linked to business strat-
egies and R&D strategies. Toray pur-
sues an intellectual property strategy
with coordination of these three areas
in line with management policies.
While continuing to create innova-
tive new materials and technologies,
Toray seeks to firmly maintain its tech-
nical advantages by pursuing an intel-
lectual property strategy comprising
the following four points, the realiza-
tion of which would be entry barriers
for competitors.
1. Further enhance the quality of
patents
2. Construct a globally competitive
network of patents
3. Protect the Company’s technical
advantages with effective mea-
sures including strategic patent
applications
4. Cultivate personnel with deep
knowledge of overseas intellectu-
al property
The Company is currently stepping up
patent applications and rights acquisi-
tions and constructing a strong patent
portfolio globally with a priority in the
growth areas of the Project AP-G 2016
medium-term management program’s
Green Innovation Business Expansion
(GR) Project and Life Innovation
Business Expansion (LI) Project.
Under the Asia, Americas and
Emerging Country Business Expansion
(AE-II) Project, the Company is formu-
lating and advancing intellectual prop-
erty strategies correlated with the
business strategies and R&D strate-
gies that Toray Group is implementing
globally with a focus on growth coun-
tries and regions showing promise for
future business expansion. While for-
tifying Toray’s patent applications and
rights acquisitions overseas, Toray
Group companies overseas are also
stepping up patent application and
rights acquisition activities to proper-
ly protect inventions created at Group
R&D bases worldwide.
http://www.toray.com/ir/library/lib_005.html
In fiscal 2015, Toray Group filed
1,607 patent applications in Japan
and 3,357 overseas, and 518 patents
in Japan and 1,215 overseas were
registered.
Toray publishes an annual Intellectual
Property Report describing the in-
tellectual property initiatives by the
Toray Group. The report is available for
download at:
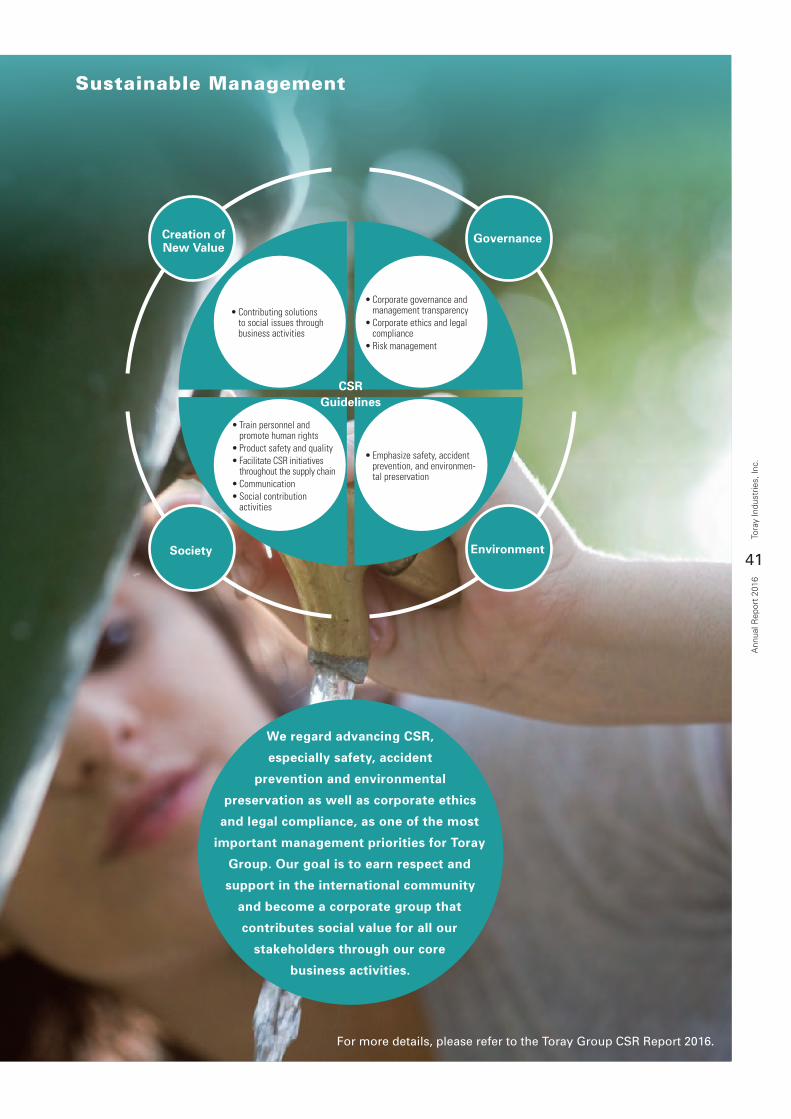
We regard advancing CSR,
especially safety, accident
prevention and environmental
preservation as well as corporate ethics
and legal compliance, as one of the most
important management priorities for Toray
Group. Our goal is to earn respect and
support in the international community
and become a corporate group that
contributes social value for all our
stakeholders through our core
business activities.
41
Tora
y In
dust
ries,
Inc.
Ann
ual R
epor
t 20
16
Sustainable Management
Creation of New Value
Society
Governance
Environment
CSRGuidelines
• Contributing solutions to social issues through business activities
• Train personnel and promote human rights
• Product safety and quality• Facilitate CSR initiatives
throughout the supply chain• Communication• Social contribution
activities
• Corporate governance and management transparency
• Corporate ethics and legal compliance
• Risk management
• Emphasize safety, accident prevention, and environmen-tal preservation
For more details, please refer to the Toray Group CSR Report 2016.
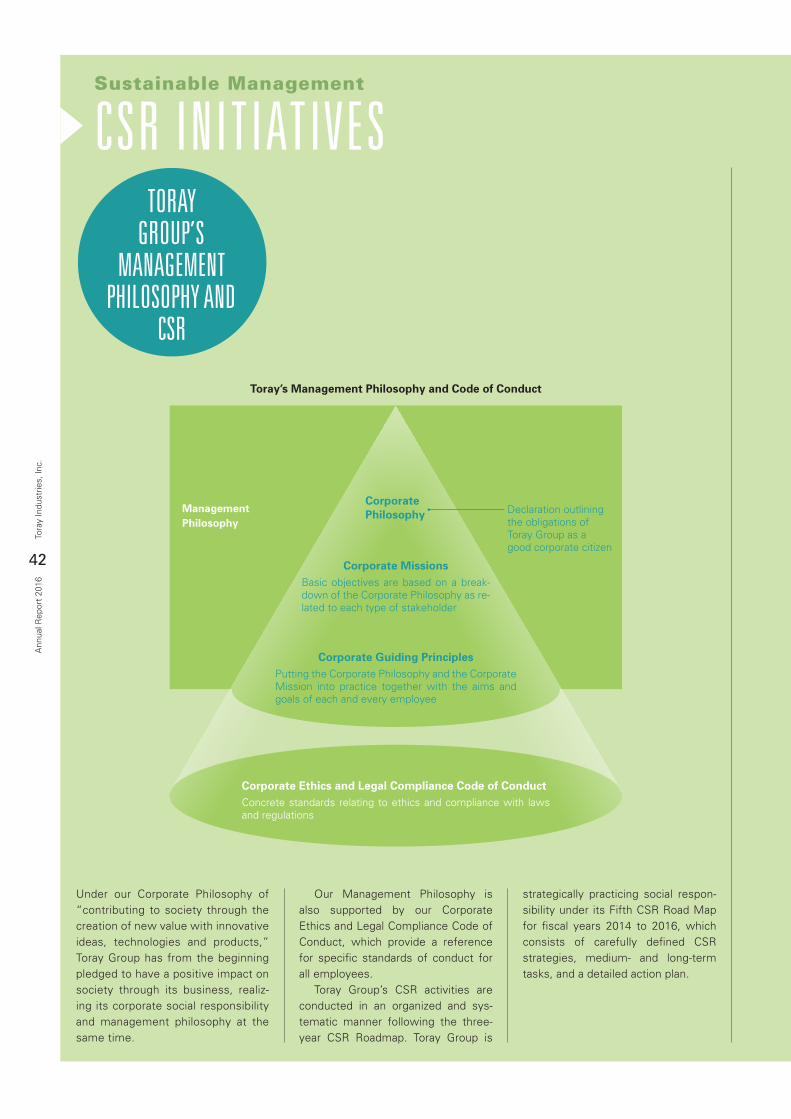
Toray’s Management Philosophy and Code of Conduct
42
Tora
y In
dust
ries,
Inc.
Ann
ual R
epor
t 20
16
Under our Corporate Philosophy of “contributing to society through the creation of new value with innovative ideas, technologies and products,” Toray Group has from the beginning pledged to have a positive impact on society through its business, realiz-ing its corporate social responsibility and management philosophy at the same time.
Our Management Philosophy is also supported by our Corporate Ethics and Legal Compliance Code of Conduct, which provide a reference for specific standards of conduct for all employees. Toray Group’s CSR activities are conducted in an organized and sys-tematic manner following the three-year CSR Roadmap. Toray Group is
Sustainable Management
CSR INITIATIVESTORAY
GROUP’S MANAGEMENT
PHILOSOPHY ANDCSR
strategically practicing social respon-sibility under its Fifth CSR Road Map for fiscal years 2014 to 2016, which consists of carefully defined CSR strategies, medium- and long-term tasks, and a detailed action plan.
CorporatePhilosophy
Corporate MissionsBasic objectives are based on a break-down of the Corporate Philosophy as re-lated to each type of stakeholder
Corporate Guiding PrinciplesPutting the Corporate Philosophy and the Corporate Mission into practice together with the aims and goals of each and every employee
Corporate Ethics and Legal Compliance Code of ConductConcrete standards relating to ethics and compliance with laws and regulations
Declaration outliningthe obligations ofToray Group as agood corporate citizen
ManagementPhilosophy
43
Tora
y In
dust
ries,
Inc.
Ann
ual R
epor
t 20
16
Promotion of LCM-based Environmental ManagementTo solve global environmental prob-lems, it is vital that we address these problems across the entire life cycle of products and services, and reduce our environmental footprint while improving our economic and social value. To this end, Toray Group promotes Lifecycle Management (LCM). This approach is the foundation of Toray’s Green Innovation Businesses. Toray Group has adopted LCA*1 meth-ods and the Toray Eco-Efficiency Analysis (T-E2A)*2 tool to promote and entrench LCM. *1 Life cycle assessment: Assessment of environ-
mental impacts taking into account the entire life cycle of products and services—from resource ex-traction to manufacturing, use, and disposal.
*2 Toray Eco-Efficiency Analysis (T-E2A): Environ-mental analysis tool developed by Toray. It produc-es a map of multiple products plotted along the axes of environmental impact and economic per-formance, enabling users to select the most envi-ronmentally friendly and economical products.
Initiatives to Conserve Energy and Fight Global WarmingToray Group was an early adopter of greenhouse gas (GHG) reduc-tion initiatives with a view to helping realize sustainable, low-carbon soci-eties. Under the Fourth Medium-term Environmental Plan in fiscal 2011, the Group has systematically implemented measures to reduce GHG emissions, including improving its processes to conserve energy and installing gas cogeneration systems. From fiscal 2016 onwards, Toray Group intends to steadily implement initia-tives for reducing GHG emissions in order to achieve its new reduction targets.
ENVIRONMENTAL MANAGEMENT
INITIATIVES
Voluntary Reduction in Atmospheric Emission of Chemical SubstancesEngaged in the chemicals business, Toray Group believes that the reduc-tion of environmental loads, including release of chemical substances into the atmosphere, is one of its most import-ant priorities. We achieved our targets set in the Fourth Medium-term Environmental Plan (from fiscal 2011 to fiscal 2015) for reducing emissions of substances covered by the PRTR law and volatile organic substances (VOCs). While business growth is likely to result in higher production volumes, we are resolutely implementing measures to reduce emissions and achieve our new reduction targets for fiscal 2020.
Initiatives to Prevent Air and Water PollutionToray Group has ongoing environmental protection initiatives in place at its pro-duction facilities. The Group will focus efforts on reducing sulfur oxide (SOx) emissions by installing desulfurization systems and converting to alternative fuels, as well as on lowering chemi-cal oxygen demand (COD) levels by expanding our wastewater treatment facilities and other measures.
Water Resource Management InitiativesToray Group, through its water treatment business, is addressing water resource issues around the world based on the fol-lowing principles. The Group also takes steps to ensure the proper management of water resources used in its business activities, including using recycled water to enhance water usage efficiency.1. Toray Group recognizes that water is
one of the most important resources for humanity, and that people are con-fronting problems related to water resources in many areas of the world.
2. Toray Group is committed to helping to solve global water resources prob-lems through its products, technolo-gies and services.
3. Toray Group continuously monitors the state of regional water resources, and conducts appropriate manage-ment of water resources according to the basic principle of sharing precious water resources with the local com-munities where the Group operates.
Toray Group practices the 3Rs (reduce, reuse, recycle) in consuming water resources, and monitors the qual-ity of water that is released into public bodies of water.
Initiatives to Reduce WasteToray Group recognizes the importance of effectively utilizing resources and facilitating zero emissions in creating a sustainable, recycling-oriented soci-ety. The Group implemented measures to achieve the Fourth Medium-term Environmental Plan’s fiscal 2015 numer-ical targets for simply disposed waste, landfill, and recycling ratios set as indi-cators for measuring progress toward attaining zero emissions.
Biodiversity InitiativesToray Group recognizes the protection of biodiversity as an important theme in its initiatives for reducing green-house gases and confronting global environmental problems. We aim to help realize a sustainable society by analyzing the impact of our business activities on biodiversity. Based on the Toray Group’s Biodi-versity Initiatives, we have been for-mulating three-year road maps and implementing measures in order of pri-ority. In fiscal 2015, the final fiscal year of our second roadmap (fiscal 2013-2015), which focused on the preservation of greenery, we worked on follow-up activ-ities to ensure the achievement of the roadmap goals. The plants of Toray industries, Inc. and its affiliated companies in Japan operate greenery policies and plans through 2020, guided by the Toray Group Basic Policy for Increasing Green Areas. The plans encompass initiatives to conserve green areas, including nat-ural forests*3 that have been protected since the plants began operating. Sustainable greenery conservation ini-tiatives also help to conserve the envi-ronment for communities.*3 Natural forests: Natural groves or forestation by
species based on potential native vegetation
We periodically conduct a survey to determine the usage of bio-based raw materials in product manufacturing. We also incorporated into our management rules a process for checking for impact on biodiversity. We look to conserve bio-diversity through our social contribution activities as well.
44
Tora
y In
dust
ries,
Inc.
Ann
ual R
epor
t 20
16
Respect for Human RightsToray Group believes that respect for human rights is a mandatory principle for corporate management, without which it would not be possible to engage in corpo-rate activities while building positive rela-tionships with stakeholders. Toray Group works to promote and raise awareness of human rights, and, in its Corporate Ethics and Legal Compliance Code of Conduct, outlines the importance of respecting human rights. Discrimination of any kind based on race, creed, skin color, gen-der, religion, nationality, language, phys-ical characteristics, possessions, place of birth, or any other personal charac-teristic is strictly forbidden in every pro-cess —from recruiting and hiring to work placement, compensation, training, and retirement. In fiscal 2014, the Group expanded this commitment to address discrimination based on gender identifi-cation and sexual orientation. Internationally, Toray Group takes stringent measures to comply with the related laws and regulations of each coun-try in which it operates. Furthermore, the Group respects international standards including the United Nations Universal Declaration of Human Rights and the International Labour Organization’s stan-dards prohibiting all forced labor and child labor. Toray Group makes every effort to prevent it from becoming complicit in human rights abuses. Specific measures have been dis-cussed at the human rights risk working group, created in fiscal 2015 as a part of the Risk Management Committee under the CSR Committee, from the standpoint of reducing risks related to human rights, while monitoring
Sustainable Management
CSR INITIATIVES
Toray Group is aware of the impor-tance of CSR procurement in its corpo-rate activities. In its CSR Procurement Guidelines, Toray Group has declared that it will provide environmentally friendly and socially responsible materi-als and products to its customers using environmentally friendly transportation methods. The Group works with suppli-ers and distribution partners to secure socially responsible value chains.
CSR Procurement, Purchasing and DistributionWhile providing materials and products as a manufacturer of advanced materi-als, Toray Group emphasizes the needs of its product users as the starting point for its management of production facil-ities and procured raw materials and resources. Accordingly, the Group has established its Basic Purchasing Policies to emphasize this approach and ensure fair purchasing practices. Toray’s Basic Distribution Policies emphasize environmental preserva-tion and continuous work to improve quality and reduce environmental impact, together with fair and equitable transactions.
PROMOTING CSR IN THE SUPPLY CHAIN
RESPECTING HUMAN RIGHTS AND NURTURING HUMAN
RESOURCES
international trends related to global human rights issues. We hold human rights promotion campaigns annually. In fiscal 2015, the campaign was aimed at fostering a workplace culture that respects the human dignity of others and promoting a better understanding about preventing sexual harassment, power harassment and maternity harassment. The cam-paign also addressed lesbian, gay, bisex-ual, and transgender (LGBT) issues (i.e., sexual minorities).
Retaining and Nurturing Employees who Generate New ValueThe success or failure of a company is decided by its people—employees shape its destiny. Guided by this concept, Toray Group considers securing and develop-ing outstanding human resources as one of its most important tasks and a funda-mental management priority. As part of future global business development, Toray Group will continue to secure and develop human resources that operate on a global level with a strong sense of commitment. Based on the following three goals, Toray Group is promoting human resource development.
•Development of fair-minded individ-uals who act with high ethical stan-dards and a sense of responsibility
•Training of professionals with advanced expertise, technical skills and originality in problem solving
•Development of leaders who act with foresight and a sense of balance
To achieve these goals, Toray Group con-ducts various kinds of training programs tailored to each of the three goals. These programs are systematic and log-ically organized, and they are offered to employees of all levels working in every field in the Group. With a view to strengthening international operations, Toray Group has designed the training to improve management capabilities, sales performance, production technical skills, and specialized skills.
45
Tora
y In
dust
ries,
Inc.
Ann
ual R
epor
t 20
16
Toray Group has established Basic Policies to Promote Dialogue with Stakeholders, designed to ensure that its management gives serious consideration to each type of stake-holder when deciding on basic man-agement objectives. These policies guide Toray Group’s efforts to com-municate with stakeholders across the spectrum of its business activ-ities. A management-led Corporate Communications Committee meets twice a year to regularly report on and discuss communication activities.
Strengthening Communication via Our Global WebsiteToray Group is advancing the Asia, Americas, and Emerging Country Business Expansion (AE-II) Project as a group-wide project. As a part of this project, we are expanding our online presence via the Toray Group global website. As of fiscal 2014, we have launched websites for our operating bases in America, China, Indonesia, Thailand, Malaysia, India and Taiwan. In fiscal 2015, we launched new web-sites for Europe and Brazil, and plan to continue launching websites in coun-tries and regions where we aim to pro-mote business. Toray Group’s websites use responsive design to ensure opti-mum access and viewing across a wide range of devices and screen sizes including smartphones and tab-lets, and we make our websites eas-ier to use for business purposes in all countries and regions.
Stakeholder CommunicationThe Group actively communicates with institutional investors and secu-rities company analysts by providing information materials when requested and holding same-day results brief-ings when quarterly earnings are announced. The Group also provides a wide variety of information about management policy and strategy as well as financial and earnings infor-mation through its annual report and information pages on its website for stockholders and investors. The Group endeavors to provide full and fair infor-mation disclosure by making materi-als used in meetings with institutional investors and English-language ver-sions of all materials promptly available on its website. In fiscal 2015, Toray held four results briefings and held 750 meetings with investors and analysts. Feedback received at investor briefing sessions and through communication with investors and stockholders is reg-ularly reported to the Board of Direc-tors and Corporate Communications Committee, helping to guide manage-ment and business activities. Toray believes that the customer comes first, and we value commu-nications with our customers, which is mainly through our sales depart-ments, and we periodically conduct surveys of customer satisfaction. The results of these surveys are shared internally at Board meetings and in-house newsletters, and feedback is given to specific departments if there are areas needing particular improve-ment to help improve customer sat-isfaction and quality of order-placing and receiving operations. Toray is celebrating the 90th anni-versary of its founding in 2016. As a part of commemorative events that reach out to customers, we will hold the Toray Advanced Materials Symposium 2016 in October. Toray Group holds policy briefings and carries out CSR procurement surveys for business partners to foster mutual understanding and closer collaboration.The Group communicates with employ-ees through in-house newsletters,
Principal SRI indexes in which Toray is included
• DJSI Asia Pacific
• MSCI ESG Index
• Ethibel Pioneer & Excellence Registers
• Euronext Vigeo World 120 Index
• Morningstar Socially Responsible Investment Index
• SNAM Sustainability Indices (as of March 31, 2016)
COMMUNICATIONACTIVITIES
intranet, company-wide bulletin boards and other media. To share information and deepen understanding of man-agement and business topics, mes-sages from the Company president, Japanese, English, and Chinese ver-sions of in-house newsletters, and explanations of management and busi-ness topics and projects are made available via all types of media. Toray recognizes that public rela-tions and corporate communica-tion activities have a role in fulfilling responsibilities for information disclo-sure as well as influencing public opin-ion. Accordingly, Toray’s Corporate Communications Department reports directly to the president, and actively engages with a wide range of media organizations, linking the Company with the public. Based on Toray’s Information Disclosure Principles, the department provides fair and impartial information, even if it may cast the Company in a bad light, in a timely and appropriate manner. In fis-cal 2015, the Company issued 192 press releases and responded to 285 requests for information. Toray Group strives to engage in active dialogue with nearby resi-dents in a variety of settings, includ-ing participating in events sponsored by local governments and inviting local residents onto factory grounds for summer festivals. We also pro-actively engage in CSR activities through NPOs.
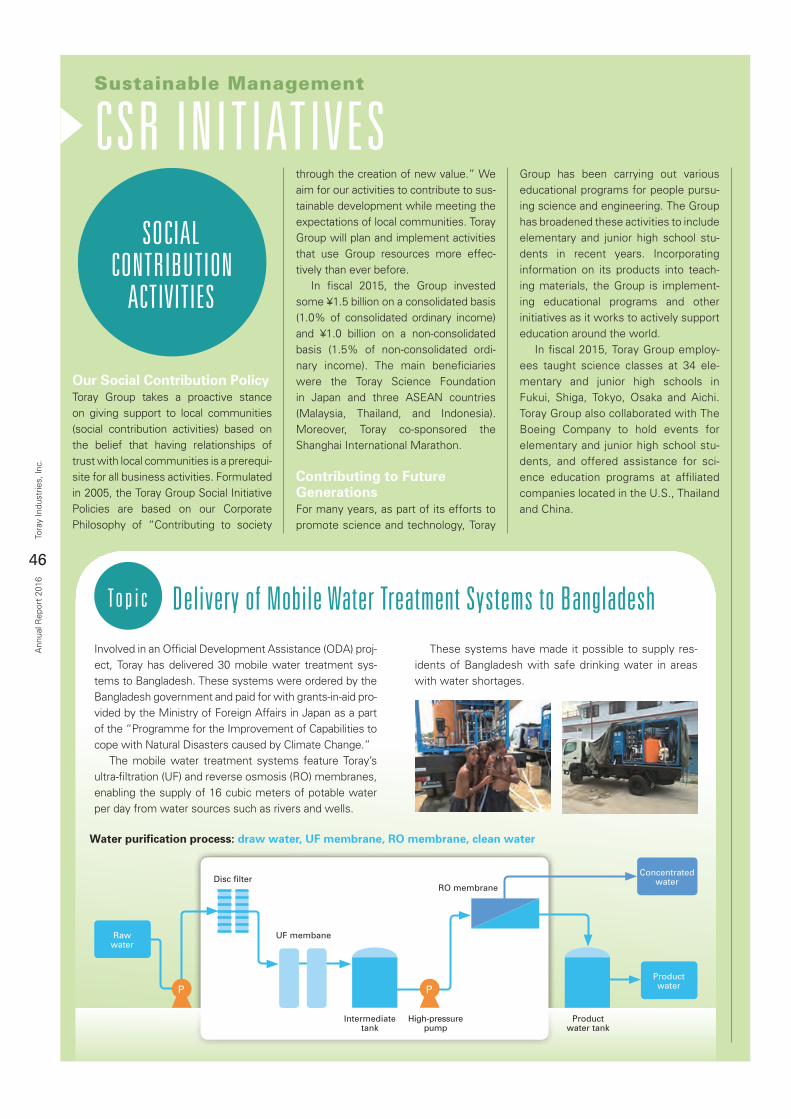
46
Tora
y In
dust
ries,
Inc.
Ann
ual R
epor
t 20
16
Sustainable Management
CSR INITIATIVES
Our Social Contribution PolicyToray Group takes a proactive stance on giving support to local communities (social contribution activities) based on the belief that having relationships of trust with local communities is a prerequi-site for all business activities. Formulated in 2005, the Toray Group Social Initiative Policies are based on our Corporate Philosophy of “Contributing to society
through the creation of new value.” We aim for our activities to contribute to sus-tainable development while meeting the expectations of local communities. Toray Group will plan and implement activities that use Group resources more effec-tively than ever before. In fiscal 2015, the Group invested some ¥1.5 billion on a consolidated basis (1.0% of consolidated ordinary income) and ¥1.0 billion on a non-consolidated basis (1.5% of non-consolidated ordi-nary income). The main beneficiaries were the Toray Science Foundation in Japan and three ASEAN countries (Malaysia, Thailand, and Indonesia). Moreover, Toray co-sponsored the Shanghai International Marathon.
Contributing to Future GenerationsFor many years, as part of its efforts to promote science and technology, Toray
SOCIAL CONTRIBUTION
ACTIVITIES
Group has been carrying out various educational programs for people pursu-ing science and engineering. The Group has broadened these activities to include elementary and junior high school stu-dents in recent years. Incorporating information on its products into teach-ing materials, the Group is implement-ing educational programs and other initiatives as it works to actively support education around the world. In fiscal 2015, Toray Group employ-ees taught science classes at 34 ele-mentary and junior high schools in Fukui, Shiga, Tokyo, Osaka and Aichi. Toray Group also collaborated with The Boeing Company to hold events for elementary and junior high school stu-dents, and offered assistance for sci-ence education programs at affiliated companies located in the U.S., Thailand and China.
To p i c Delivery of Mobile Water Treatment Systems to Bangladesh
Involved in an Official Development Assistance (ODA) proj-ect, Toray has delivered 30 mobile water treatment sys-tems to Bangladesh. These systems were ordered by the Bangladesh government and paid for with grants-in-aid pro-vided by the Ministry of Foreign Affairs in Japan as a part of the “Programme for the Improvement of Capabilities to cope with Natural Disasters caused by Climate Change.” The mobile water treatment systems feature Toray’s ultra-filtration (UF) and reverse osmosis (RO) membranes, enabling the supply of 16 cubic meters of potable water per day from water sources such as rivers and wells.
These systems have made it possible to supply res-idents of Bangladesh with safe drinking water in areas with water shortages.
Raw water
Concentrated water
Product waterP P
Disc filter
Intermediate tank
High-pressure pump
Product water tank
UF membane
RO membrane
Water purification process: draw water, UF membrane, RO membrane, clean water
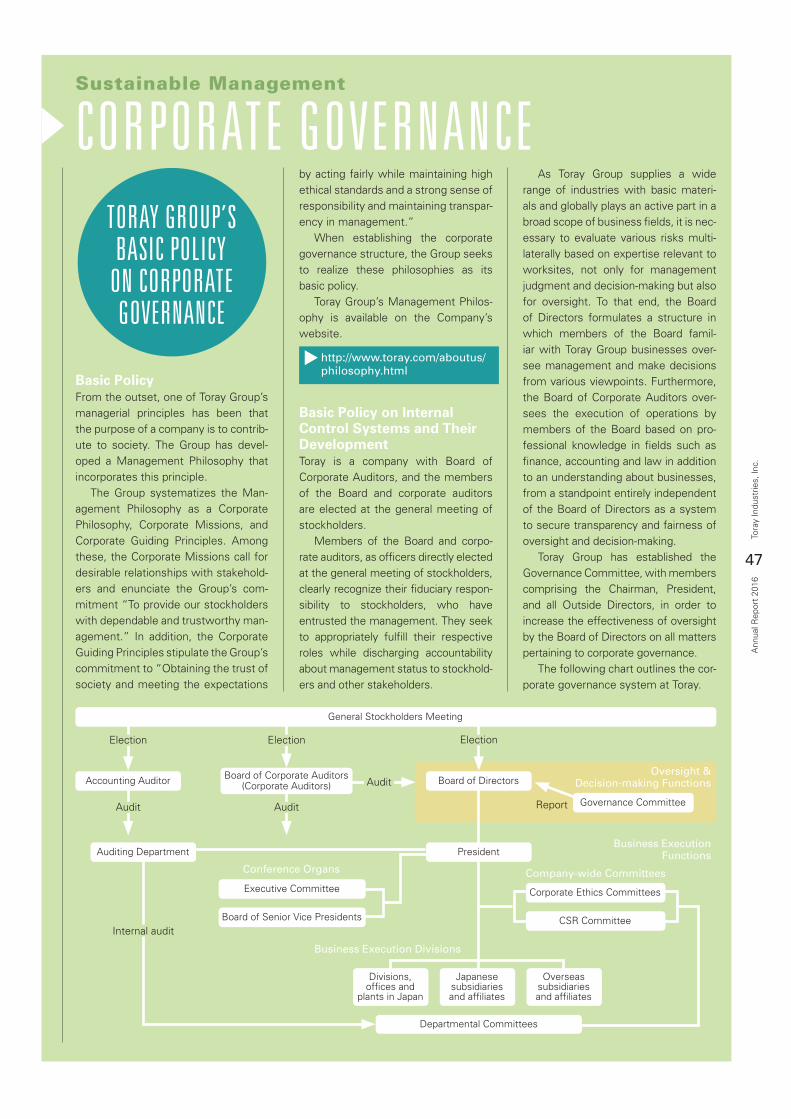
General Stockholders Meeting
Board of Directors
President
Departmental Committees
Governance Committee
Auditing Department
Accounting Auditor
Divisions, offices and
plants in Japan
Japanesesubsidiariesand affiliates
Overseassubsidiariesand affiliates
CSR Committee
Corporate Ethics Committees
Board of Senior Vice Presidents
Executive Committee
ElectionElectionElection
Audit
Internal audit
Conference Organs Company-wide Committees
Audit
Audit
Business Execution Divisions
Business Execution Functions
Oversight &Decision-making Functions
Report
Board of Corporate Auditors(Corporate Auditors)
47
Tora
y In
dust
ries,
Inc.
Ann
ual R
epor
t 20
16
Sustainable Management
CORPORATE GOVERNANCE
Basic PolicyFrom the outset, one of Toray Group’s managerial principles has been that the purpose of a company is to contrib-ute to society. The Group has devel-oped a Management Philosophy that incorporates this principle. The Group systematizes the Man-agement Philosophy as a Corporate Philosophy, Corporate Missions, and Corporate Guiding Principles. Among these, the Corporate Missions call for desirable relationships with stakehold-ers and enunciate the Group’s com-mitment “To provide our stockholders with dependable and trustworthy man-agement.” In addition, the Corporate Guiding Principles stipulate the Group’s commitment to “Obtaining the trust of society and meeting the expectations
by acting fairly while maintaining high ethical standards and a strong sense of responsibility and maintaining transpar-ency in management.” When establishing the corporate governance structure, the Group seeks to realize these philosophies as its basic policy. Toray Group’s Management Philos-ophy is available on the Company’s website.
Basic Policy on Internal Control Systems and Their DevelopmentToray is a company with Board of Corporate Auditors, and the members of the Board and corporate auditors are elected at the general meeting of stockholders. Members of the Board and corpo-rate auditors, as officers directly elected at the general meeting of stockholders, clearly recognize their fiduciary respon-sibility to stockholders, who have entrusted the management. They seek to appropriately fulfill their respective roles while discharging accountability about management status to stockhold-ers and other stakeholders.
TORAY GROUP’S BASIC POLICY
ON CORPORATE GOVERNANCE
As Toray Group supplies a wide range of industries with basic materi-als and globally plays an active part in a broad scope of business fields, it is nec-essary to evaluate various risks multi-laterally based on expertise relevant to worksites, not only for management judgment and decision-making but also for oversight. To that end, the Board of Directors formulates a structure in which members of the Board famil-iar with Toray Group businesses over-see management and make decisions from various viewpoints. Furthermore, the Board of Corporate Auditors over-sees the execution of operations by members of the Board based on pro-fessional knowledge in fields such as finance, accounting and law in addition to an understanding about businesses, from a standpoint entirely independent of the Board of Directors as a system to secure transparency and fairness of oversight and decision-making. Toray Group has established the Governance Committee, with members comprising the Chairman, President, and all Outside Directors, in order to increase the effectiveness of oversight by the Board of Directors on all matters pertaining to corporate governance. The following chart outlines the cor-porate governance system at Toray.
http://www.toray.com/aboutus/philosophy.html
48
Tora
y In
dust
ries,
Inc.
Ann
ual R
epor
t 20
16
Sustainable Management
CORPORATE GOVERNANCE
1. System to ensure that the execution of duties by members of the Board and employees complies with laws and regulations and the Company’s Articles of Incorporation
2. System to ensure the efficient execution of duties by members of the Board
3. System for preserving and managing information pertaining to the execution of duties by the members of the Board
4. Regulations and other systems pertaining to controls over risks of loss
5. System for ensuring appropriate business operations within subsidiaries
6. System for reporting to corporate auditors and systems for ensuring that persons who report to corporate auditors are not treated disadvantageously because of their reporting
7. Items pertaining to the handling of expenses and liabilities arising from the execution of duties by corpo-rate auditors
8. Items pertaining to employees assisting with corporate auditors’ duties, items pertaining to the indepen-dence of said employees from members of the Board, and items pertaining to the assurance of effective-ness of instructions from the corporate auditors to said employees
9. Other systems for ensuring effective implementation of audits by corporate auditors
Toray Group’s Basic Policy on Corporate Governance is available on the Company’s website.
Basic Policy on Internal Control SystemTo realize the Management Philosophy, the Company shall establish a structure to execute its business legally and effectively by improving its internal control system according to the following basic policy as a structure to enable it to appropriately establish organization, formulate regulations, communicate information, and moni-tor the execution of operations.
Details about the basic policy on internal control system are available on the Company’s website.
For information about compliance with the Corporate Governance Code, as well as basic policies concerning and the status of internal control system, please read the Corporate Governance Report.
http://www.toray.com/aboutus/governance/gov_001.html
http://www.toray.com/aboutus/policy.html
http://www.toray.com/ir/pdf/cgo_001.pdf
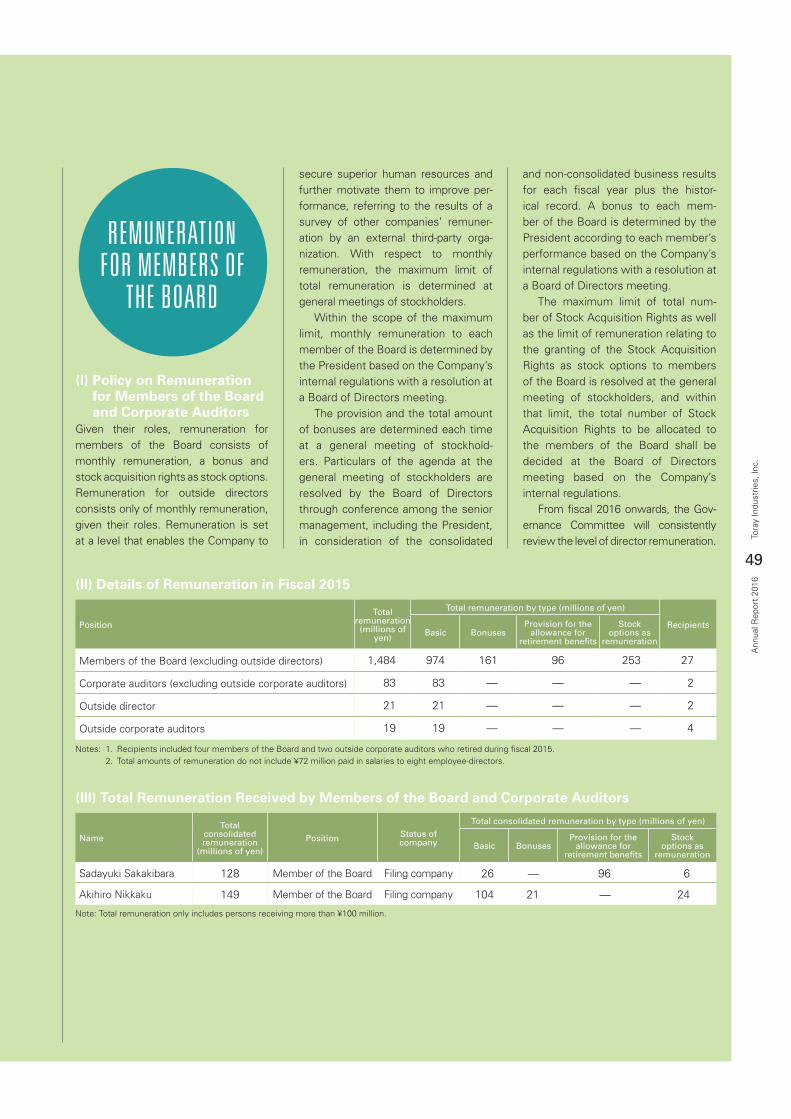
49
Tora
y In
dust
ries,
Inc.
Ann
ual R
epor
t 20
16
(I) Policy on Remuneration for Members of the Board and Corporate Auditors
Given their roles, remuneration for members of the Board consists of monthly remuneration, a bonus and stock acquisition rights as stock options. Remuneration for outside directors consists only of monthly remuneration, given their roles. Remuneration is set at a level that enables the Company to
secure superior human resources and further motivate them to improve per-formance, referring to the results of a survey of other companies’ remuner-ation by an external third-party orga-nization. With respect to monthly remuneration, the maximum limit of total remuneration is determined at general meetings of stockholders. Within the scope of the maximum limit, monthly remuneration to each member of the Board is determined by the President based on the Company’s internal regulations with a resolution at a Board of Directors meeting. The provision and the total amount of bonuses are determined each time at a general meeting of stockhold-ers. Particulars of the agenda at the general meeting of stockholders are resolved by the Board of Directors through conference among the senior management, including the President, in consideration of the consolidated
REMUNERATION FOR MEMBERS OF
THE BOARD
and non-consolidated business results for each fiscal year plus the histor-ical record. A bonus to each mem-ber of the Board is determined by the President according to each member’s performance based on the Company’s internal regulations with a resolution at a Board of Directors meeting. The maximum limit of total num-ber of Stock Acquisition Rights as well as the limit of remuneration relating to the granting of the Stock Acquisition Rights as stock options to members of the Board is resolved at the general meeting of stockholders, and within that limit, the total number of Stock Acquisition Rights to be allocated to the members of the Board shall be decided at the Board of Directors meeting based on the Company’s internal regulations. From fiscal 2016 onwards, the Gov-ernance Committee will consistently review the level of director remuneration.
Name
Totalconsolidatedremuneration
(millions of yen)
Position Status ofcompany
Total consolidated remuneration by type (millions of yen)
Basic BonusesProvision for the
allowance for retirement benefits
Stockoptions as
remuneration
Sadayuki Sakakibara 128 Member of the Board Filing company 26 — 96 6
Akihiro Nikkaku 149 Member of the Board Filing company 104 21 — 24
(III) Total Remuneration Received by Members of the Board and Corporate Auditors
Note: Total remuneration only includes persons receiving more than ¥100 million.
Position
Totalremuneration
(millions of yen)
Total remuneration by type (millions of yen)
RecipientsBasic Bonuses
Provision for the allowance for
retirement benefits
Stockoptions as
remuneration
Members of the Board (excluding outside directors) 1,484 974 161 96 253 27
Corporate auditors (excluding outside corporate auditors) 83 83 — — — 2
Outside director 21 21 — — — 2
Outside corporate auditors 19 19 — — — 4
(II) Details of Remuneration in Fiscal 2015
Notes: 1. Recipients included four members of the Board and two outside corporate auditors who retired during fiscal 2015. 2. Total amounts of remuneration do not include ¥72 million paid in salaries to eight employee-directors.
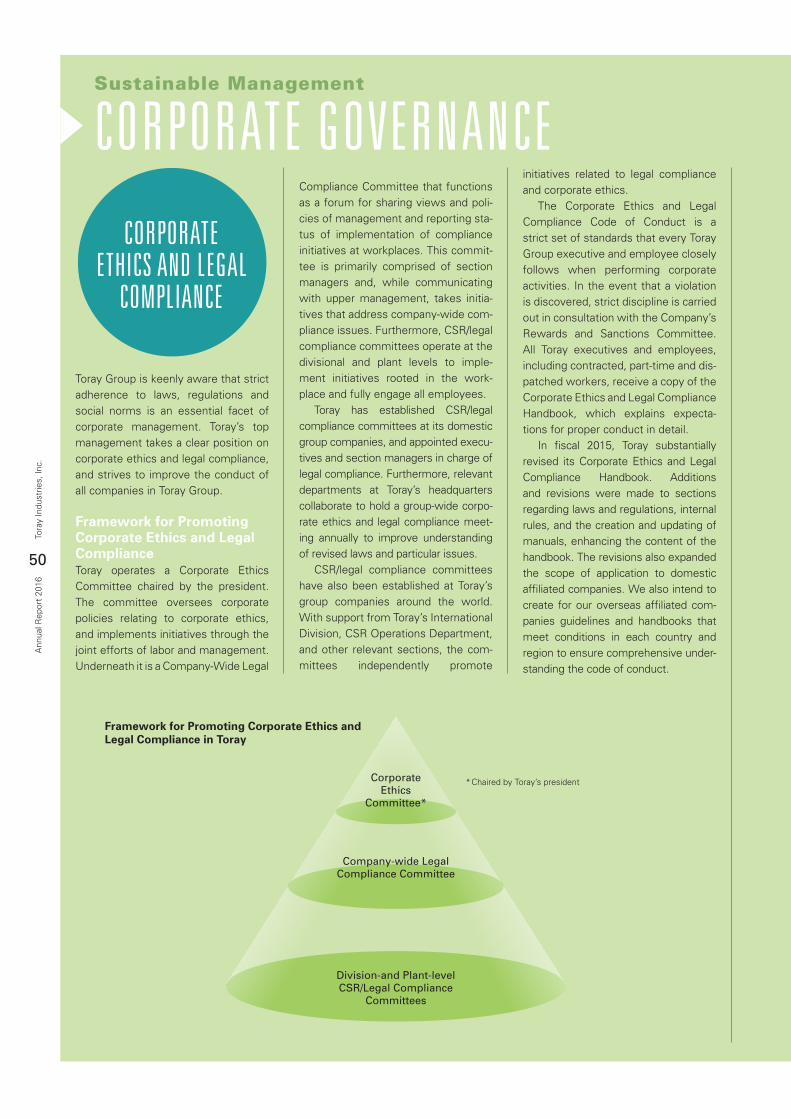
50
Tora
y In
dust
ries,
Inc.
Ann
ual R
epor
t 20
16
Sustainable Management
CORPORATE GOVERNANCE
CORPORATE ETHICS AND LEGAL
COMPLIANCE
Toray Group is keenly aware that strict adherence to laws, regulations and social norms is an essential facet of corporate management. Toray’s top management takes a clear position on corporate ethics and legal compliance, and strives to improve the conduct of all companies in Toray Group.
Framework for Promoting Corporate Ethics and Legal ComplianceToray operates a Corporate Ethics Committee chaired by the president. The committee oversees corporate policies relating to corporate ethics, and implements initiatives through the joint efforts of labor and management. Underneath it is a Company-Wide Legal
Compliance Committee that functions as a forum for sharing views and poli-cies of management and reporting sta-tus of implementation of compliance initiatives at workplaces. This commit-tee is primarily comprised of section managers and, while communicating with upper management, takes initia-tives that address company-wide com-pliance issues. Furthermore, CSR/legal compliance committees operate at the divisional and plant levels to imple-ment initiatives rooted in the work-place and fully engage all employees. Toray has established CSR/legal compliance committees at its domestic group companies, and appointed execu-tives and section managers in charge of legal compliance. Furthermore, relevant departments at Toray’s headquarters collaborate to hold a group-wide corpo-rate ethics and legal compliance meet-ing annually to improve understanding of revised laws and particular issues. CSR/legal compliance committees have also been established at Toray’s group companies around the world. With support from Toray’s International Division, CSR Operations Department, and other relevant sections, the com-mittees independently promote
initiatives related to legal compliance and corporate ethics. The Corporate Ethics and Legal Compliance Code of Conduct is a strict set of standards that every Toray Group executive and employee closely follows when performing corporate activities. In the event that a violation is discovered, strict discipline is carried out in consultation with the Company’s Rewards and Sanctions Committee. All Toray executives and employees, including contracted, part-time and dis-patched workers, receive a copy of the Corporate Ethics and Legal Compliance Handbook, which explains expecta-tions for proper conduct in detail. In fiscal 2015, Toray substantially revised its Corporate Ethics and Legal Compliance Handbook. Additions and revisions were made to sections regarding laws and regulations, internal rules, and the creation and updating of manuals, enhancing the content of the handbook. The revisions also expanded the scope of application to domestic affiliated companies. We also intend to create for our overseas affiliated com-panies guidelines and handbooks that meet conditions in each country and region to ensure comprehensive under-standing the code of conduct.
CorporateEthics
Committee*
Company-wide LegalCompliance Committee
Division-and Plant-levelCSR/Legal Compliance
Committees
Framework for Promoting Corporate Ethics andLegal Compliance in Toray
* Chaired by Toray’s president
51
Tora
y In
dust
ries,
Inc.
Ann
ual R
epor
t 20
16
RISKMANAGEMENT
Toray has established a Risk Man-agement Committee under the CSR Committee to regularly monitor the progress of risk reduction measures across all Group companies and con-duct planning and promotion of risk management measures. Under the Risk Management Committee, local risk management committees have been established at each of Toray’s divi-sions, departments, offices, and plants. Group-wide measures determined by the Risk Management Committee are given to local risk management committees, which then incorporate these measures in their own initia-tives to reduce risks particular to their respective division, department, office or plant, while carrying out coordinated risk management activities. Toray Group has also established a risk management system for group com-panies, led by their presidents. The sys-tem promotes initiatives to reduce the specific risks faced by each company. Each group company reports on the re-sults of these initiatives to the Risk Man-agement Committee every fiscal year. Toray Group regularly evaluates Companywide risks, identifies risks that should be prioritized in light of their potential impact on management of the Group, and is working to reduce these risks through the PDCA cycle.
Addressing Priority RisksOnce every three years, Toray reviews its priority risks. Fiscal 2015 was the first year we implemented mea-sures to address the risks we identi-fied in our third risk priority screening. We endeavored to reduce risk, mainly
through departments in charge of pro-moting risk prevention measures, or working groups created to work across departments. For affiliated companies inside and outside Japan, Toray iden-tified the priority risks that each com-pany should address based on their unique traits, while referring to the pri-ority risks it determined, and advanced with measures to mitigate these risks.
Supply Chain Risk ReductionIn fiscal 2015, Toray revised its sur-vey of CSR procurement and assessed the level of measures taken for global human rights issues throughout the supply chain of Toray Group. Toray Group conducts checks for the use of conflict minerals in all prod-ucts and has been working to make its responses to customers’ requests for surveys quicker and more efficient by integrating data management.
Maintaining Information SecurityToray Group offers education courses on security on an ongoing basis main-ly through e-learning. In fiscal 2015, a total of 12,729 employees at 14 Affili-ated companies inside and outside Ja-pan took courses on data security via our e-learning system. Facing growing risks of Advanced Persistent threat, we revised the Toray Group Electronic Information Security Guidelines based on security guidelines published by the Information Technol-ogy Promotion Agency, Japan (IPA).
Crisis Management SystemIn its Crisis Management Regula-tions, Toray Group has clearly defined the basic principles for a group-wide response to serious risks affecting Toray Group in order to ensure a consistent and comprehensive response in a crisis situation. The regulations are revised as appropriate so as to prepare for new risks that may emerge as a result of change in the social environment.
Preparedness for a Major EarthquakeIdentifying major earthquakes as a
significant risk factor, Toray Group con-tinues to engage in activities based on Major Earthquake Business Continuity Plan. In fiscal 2015, Toray Group contin-ued activities that started in fiscal 2014, such as introduction of a safety confir-mation system covering all domestic affiliated companies, systematic imple-mentation of earthquake-proofing of plant buildings, and verification of our business continuity planning for prod-ucts for which we have a strong respon-sibility to supply to society. Since fiscal 2012, Toray Group has conducted drills to create a tem-porary group-wide headquarters. In fiscal 2015, the Group began conduct-ing drills based on a disaster scenario involving Tonankai and Nankai earth-quakes that cause extensive damage to Group companies and plants situ-ated in parts of Japan from Shizuoka Prefecture to further west. Some drills are designed to increase difficulty lev-els with some parts of the scenario undisclosed to drill participants. In preparation for an earthquake di-rectly hitting the Tokyo metropolitan area, the Group revised the Tokyo busi-ness site’s emergency response plan for a major earthquake (the last revision was three years ago), and distributed the new version of the plan to all em-ployees stationed in Tokyo head office. The Group also added some new functions to the Toray Disaster Map System, a tool that was launched after the Great East Japan Earthquake for rap-idly and accurately grasping the extent of damage caused by an earthquake to Toray Group and at its business partners.
Preparedness for New Influenza PandemicIn June 2015, we revised the Toray Group Countermeasures against Influenza Pandemic to address both strongly and weakly virulent influen-zas. Toray Group’s business offices and plants have revised and begun imple-menting their crisis management sys-tems and measures to prevent the spread of disease in the event that a human-to-human transmission of new influenza occurs in Japan.
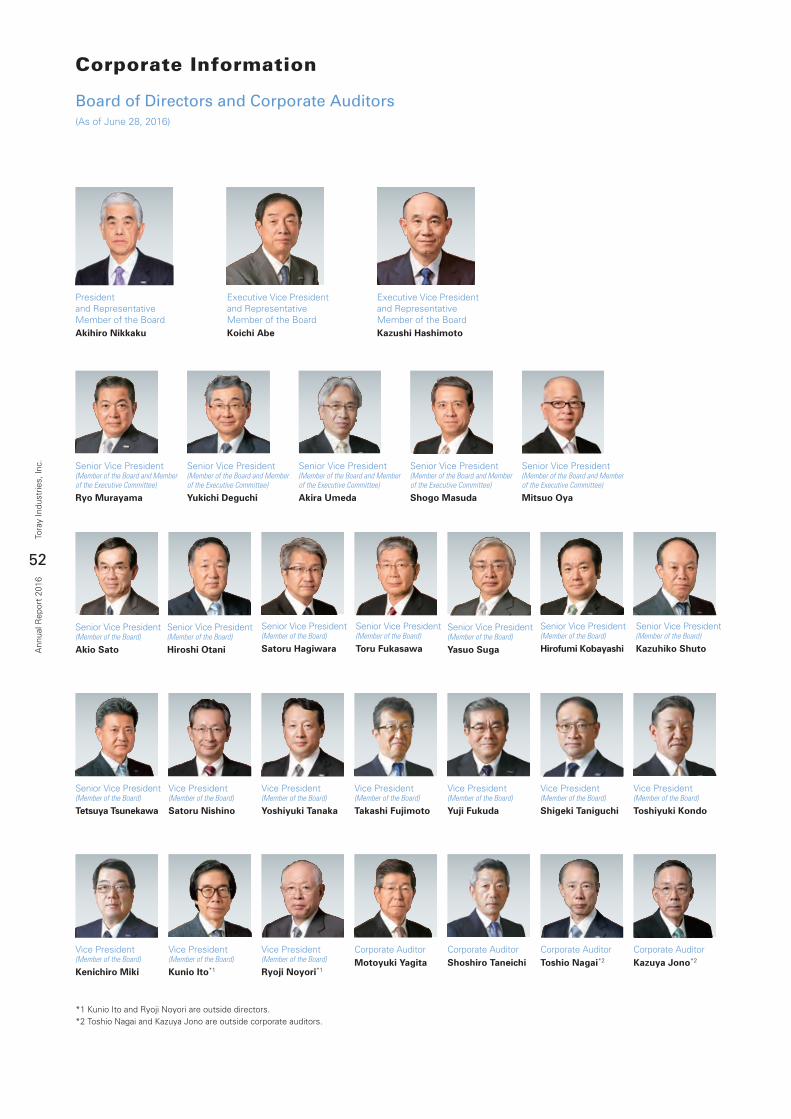
52
Tora
y In
dust
ries,
Inc.
Ann
ual R
epor
t 20
16
Corporate Information
Board of Directors and Corporate Auditors(As of June 28, 2016)
Executive Vice President and Representative Member of the Board
Kazushi Hashimoto
Vice President(Member of the Board)
Kunio Ito*1
Vice President(Member of the Board)
Kenichiro Miki
Vice President(Member of the Board)
Ryoji Noyori*1
Vice President(Member of the Board)
Yoshiyuki Tanaka
Vice President(Member of the Board)
Takashi Fujimoto
Vice President(Member of the Board)
Yuji Fukuda
Vice President(Member of the Board)
Shigeki Taniguchi
Vice President(Member of the Board)
Toshiyuki Kondo
Presidentand Representative Member of the BoardAkihiro Nikkaku
Senior Vice President(Member of the Board and Member of the Executive Committee)
Shogo Masuda
Senior Vice President(Member of the Board and Member of the Executive Committee)
Mitsuo Oya
Senior Vice President(Member of the Board)
Tetsuya Tsunekawa
Vice President(Member of the Board)
Satoru Nishino
Corporate AuditorMotoyuki Yagita
Corporate AuditorShoshiro Taneichi
Executive Vice President and Representative Member of the BoardKoichi Abe
Senior Vice President(Member of the Board and Member of the Executive Committee)
Akira Umeda
Senior Vice President(Member of the Board and Member of the Executive Committee)
Ryo Murayama
Senior Vice President(Member of the Board and Member of the Executive Committee)
Yukichi Deguchi
Senior Vice President(Member of the Board)
Hirofumi Kobayashi
Senior Vice President(Member of the Board)
Akio Sato
Senior Vice President(Member of the Board)
Kazuhiko Shuto
Senior Vice President(Member of the Board)
Yasuo Suga
*1 Kunio Ito and Ryoji Noyori are outside directors.*2 Toshio Nagai and Kazuya Jono are outside corporate auditors.
Senior Vice President(Member of the Board)
Hiroshi Otani
Senior Vice President(Member of the Board)
Satoru Hagiwara
Senior Vice President(Member of the Board)
Toru Fukasawa
Corporate AuditorToshio Nagai*2
Corporate AuditorKazuya Jono*2
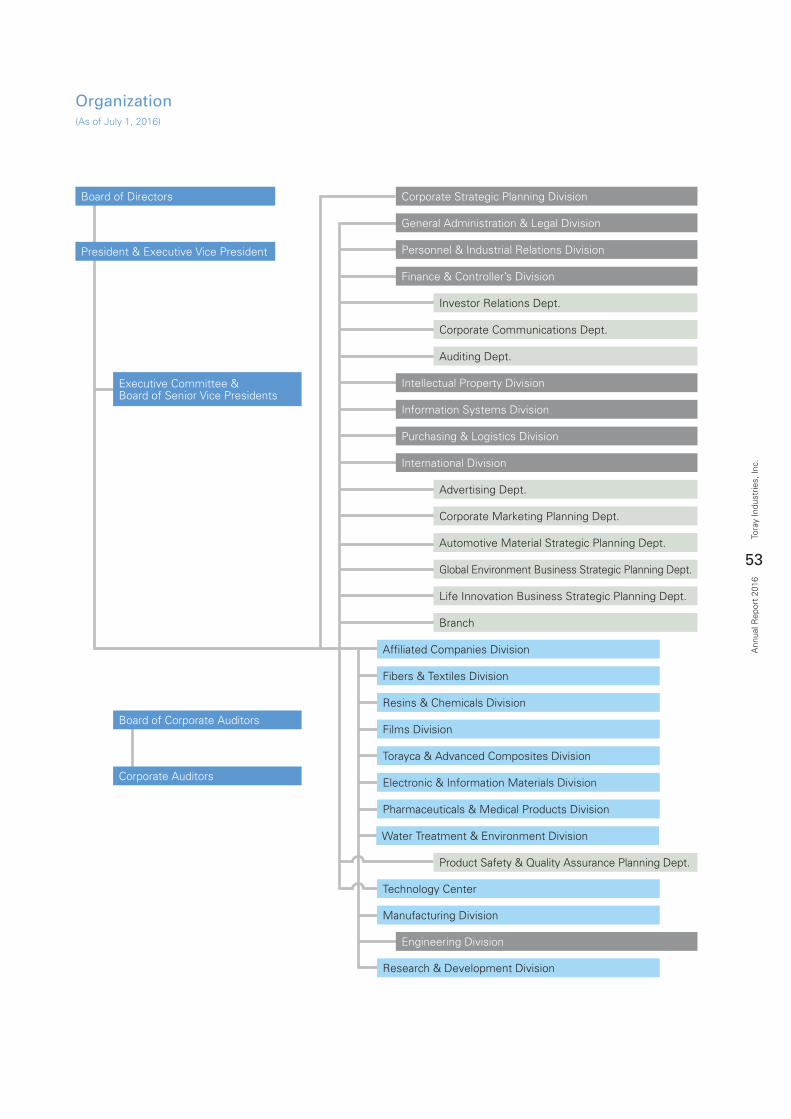
53
Tora
y In
dust
ries,
Inc.
Ann
ual R
epor
t 20
16
Organization(As of July 1, 2016)
Board of Directors
President & Executive Vice President
Board of Corporate Auditors
Corporate Auditors
Executive Committee &Board of Senior Vice Presidents
Corporate Strategic Planning Division
General Administration & Legal Division
Personnel & Industrial Relations Division
Finance & Controller’s Division
Investor Relations Dept.
Corporate Communications Dept.
Auditing Dept.
Intellectual Property Division
Information Systems Division
Purchasing & Logistics Division
International Division
Advertising Dept.
Corporate Marketing Planning Dept.
Automotive Material Strategic Planning Dept.
Global Environment Business Strategic Planning Dept.
Life Innovation Business Strategic Planning Dept.
Branch
Affiliated Companies Division
Fibers & Textiles Division
Resins & Chemicals Division
Films Division
Torayca & Advanced Composites Division
Electronic & Information Materials Division
Pharmaceuticals & Medical Products Division
Water Treatment & Environment Division
Product Safety & Quality Assurance Planning Dept.
Technology Center
Manufacturing Division
Engineering Division
Research & Development Division
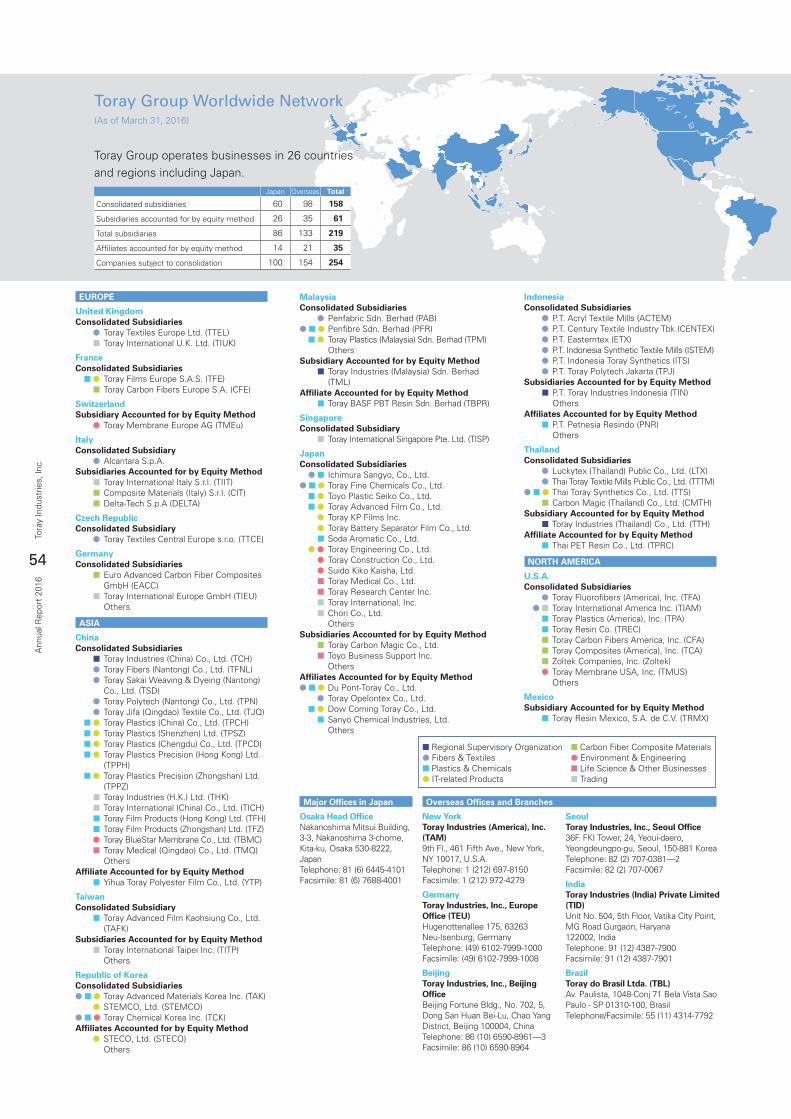
54
Tora
y In
dust
ries,
Inc.
Ann
ual R
epor
t 20
16
Toray Group Worldwide Network(As of March 31, 2016)
EUROPE
United KingdomConsolidated Subsidiaries l Toray Textiles Europe Ltd. (TTEL) n Toray International U.K. Ltd. (TIUK)
FranceConsolidated Subsidiaries nl Toray Films Europe S.A.S. (TFE) n Toray Carbon Fibers Europe S.A. (CFE)
SwitzerlandSubsidiary Accounted for by Equity Method l Toray Membrane Europe AG (TMEu)
ItalyConsolidated Subsidiary l Alcantara S.p.A.Subsidiaries Accounted for by Equity Method n Toray International Italy S.r.l. (TIIT) nComposite Materials (Italy) S.r.l. (CIT) nDelta-Tech S.p.A (DELTA)
Czech RepublicConsolidated Subsidiary l Toray Textiles Central Europe s.r.o. (TTCE)
GermanyConsolidated Subsidiaries nEuro Advanced Carbon Fiber Composites
GmbH (EACC) n Toray International Europe GmbH (TIEU) Others
ASIA
ChinaConsolidated Subsidiaries n Toray Industries (China) Co., Ltd. (TCH) l Toray Fibers (Nantong) Co., Ltd. (TFNL) l Toray Sakai Weaving & Dyeing (Nantong)
Co., Ltd. (TSD) l Toray Polytech (Nantong) Co., Ltd. (TPN) l Toray Jifa (Qingdao) Textile Co., Ltd. (TJQ) nl Toray Plastics (China) Co., Ltd. (TPCH) nl Toray Plastics (Shenzhen) Ltd. (TPSZ) nl Toray Plastics (Chengdu) Co., Ltd. (TPCD) nl Toray Plastics Precision (Hong Kong) Ltd.
(TPPH) nl Toray Plastics Precision (Zhongshan) Ltd.
(TPPZ) n Toray Industries (H.K.) Ltd. (THK) n Toray International (China) Co., Ltd. (TICH) n Toray Film Products (Hong Kong) Ltd. (TFH) n Toray Film Products (Zhongshan) Ltd. (TFZ) l Toray BlueStar Membrane Co., Ltd. (TBMC) nToray Medical (Qingdao) Co., Ltd. (TMQ) OthersAffiliate Accounted for by Equity Method n Yihua Toray Polyester Film Co., Ltd. (YTP)
TaiwanConsolidated Subsidiary n Toray Advanced Film Kaohsiung Co., Ltd.
(TAFK)Subsidiaries Accounted for by Equity Method n Toray International Taipei Inc. (TITP) Others
Republic of KoreaConsolidated Subsidiarieslnl Toray Advanced Materials Korea Inc. (TAK) l STEMCO, Ltd. (STEMCO)lnl Toray Chemical Korea Inc. (TCK)Affiliates Accounted for by Equity Method l STECO, Ltd. (STECO) Others
MalaysiaConsolidated Subsidiaries l Penfabric Sdn. Berhad (PAB)lnl Penfibre Sdn. Berhad (PFR) nl Toray Plastics (Malaysia) Sdn. Berhad (TPM) OthersSubsidiary Accounted for by Equity Method n Toray Industries (Malaysia) Sdn. Berhad
(TML)Affiliate Accounted for by Equity Method n Toray BASF PBT Resin Sdn. Berhad (TBPR)
SingaporeConsolidated Subsidiary n Toray International Singapore Pte. Ltd. (TISP)
JapanConsolidated Subsidiaries ln Ichimura Sangyo, Co., Ltd.lnl Toray Fine Chemicals Co., Ltd. nl Toyo Plastic Seiko Co., Ltd. nl Toray Advanced Film Co., Ltd. l Toray KP Films Inc. l Toray Battery Separator Film Co., Ltd. n Soda Aromatic Co., Ltd. ll Toray Engineering Co., Ltd. l Toray Construction Co., Ltd. l Suido Kiko Kaisha, Ltd. n Toray Medical Co., Ltd. n Toray Research Center Inc. n Toray International, Inc. n Chori Co., Ltd. OthersSubsidiaries Accounted for by Equity Method n Toray Carbon Magic Co., Ltd. n Toyo Business Support Inc. OthersAffiliates Accounted for by Equity Methodlnl Du Pont-Toray Co., Ltd. l Toray Opelontex Co., Ltd. nl Dow Corning Toray Co., Ltd. n Sanyo Chemical Industries, Ltd. Others
IndonesiaConsolidated Subsidiaries l P.T. Acryl Textile Mills (ACTEM) l P.T. Century Textile Industry Tbk (CENTEX) l P.T. Easterntex (ETX) l P.T. Indonesia Synthetic Textile Mills (ISTEM) l P.T. Indonesia Toray Synthetics (ITS) lP.T. Toray Polytech Jakarta (TPJ)Subsidiaries Accounted for by Equity Method n P.T. Toray Industries Indonesia (TIN) OthersAffiliates Accounted for by Equity Method n P.T. Petnesia Resindo (PNR) Others
ThailandConsolidated Subsidiaries l Luckytex (Thailand) Public Co., Ltd. (LTX) l Thai Toray Textile Mills Public Co., Ltd. (TTTM)lnl Thai Toray Synthetics Co., Ltd. (TTS) n Carbon Magic (Thailand) Co., Ltd. (CMTH)Subsidiary Accounted for by Equity Method n Toray Industries (Thailand) Co., Ltd. (TTH)Affiliate Accounted for by Equity Method n Thai PET Resin Co., Ltd. (TPRC)
NORTH AMERICA
U.S.A.Consolidated Subsidiaries l Toray Fluorofibers (America), Inc. (TFA) ln Toray International America Inc. (TIAM) n Toray Plastics (America), Inc. (TPA) n Toray Resin Co. (TREC) n Toray Carbon Fibers America, Inc. (CFA) n Toray Composites (America), Inc. (TCA) n Zoltek Companies, Inc. (Zoltek) l Toray Membrane USA, Inc. (TMUS) Others
MexicoSubsidiary Accounted for by Equity Method n Toray Resin Mexico, S.A. de C.V. (TRMX)
Major Offices in Japan
Osaka Head OfficeNakanoshima Mitsui Building,3-3, Nakanoshima 3-chome,Kita-ku, Osaka 530-8222, JapanTelephone: 81 (6) 6445-4101Facsimile: 81 (6) 7688-4001
Overseas Offices and Branches
New YorkToray Industries (America), Inc. (TAM)9th Fl., 461 Fifth Ave., New York,NY 10017, U.S.A.Telephone: 1 (212) 697-8150Facsimile: 1 (212) 972-4279
GermanyToray Industries, Inc., Europe Office (TEU)Hugenottenallee 175, 63263Neu-Isenburg, GermanyTelephone: (49) 6102-7999-1000Facsimile: (49) 6102-7999-1008
BeijingToray Industries, Inc., Beijing OfficeBeijing Fortune Bldg., No. 702, 5, Dong San Huan Bei-Lu, Chao YangDistrict, Beijing 100004, ChinaTelephone: 86 (10) 6590-8961—3Facsimile: 86 (10) 6590-8964
SeoulToray Industries, Inc., Seoul Office36F. FKI Tower, 24, Yeoui-daero,Yeongdeungpo-gu, Seoul, 150-881 KoreaTelephone: 82 (2) 707-0381—2Facsimile: 82 (2) 707-0067
IndiaToray Industries (India) Private Limited (TID)Unit No. 504, 5th Floor, Vatika City Point, MG Road Gurgaon, Haryana122002, IndiaTelephone: 91 (12) 4387-7900Facsimile: 91 (12) 4387-7901
BrazilToray do Brasil Ltda. (TBL)Av. Paulista, 1048-Conj 71 Bela Vista Sao Paulo - SP 01310-100, BrasilTelephone/Facsimile: 55 (11) 4314-7792
n Regional Supervisory Organizationl Fibers & Textilesn Plastics & Chemicalsl IT-related Products
n Carbon Fiber Composite Materialsl Environment & Engineeringn Life Science & Other Businessesn Trading
Japan Overseas Total
Consolidated subsidiaries 60 98 158
Subsidiaries accounted for by equity method 26 35 61
Total subsidiaries 86 133 219
Affiliates accounted for by equity method 14 21 35
Companies subject to consolidation 100 154 254
Toray Group operates businesses in 26 countries and regions including Japan.
55
Tora
y In
dust
ries,
Inc.
Ann
ual R
epor
t 20
16
C o n t e n t s58 Six-Year Summary of Selected Financial Data
59 Management’s Discussion and Analysis
64 Consolidated Balance Sheets
66 Consolidated Statements of Income
66 Consolidated Statements of Comprehensive Income
67 Consolidated Statements of Changes in Net Assets
68 Consolidated Statements of Cash Flows
69 Notes to Consolidated Financial Statements
97 Independent Auditor’s Report
FINANCIAL SECTION
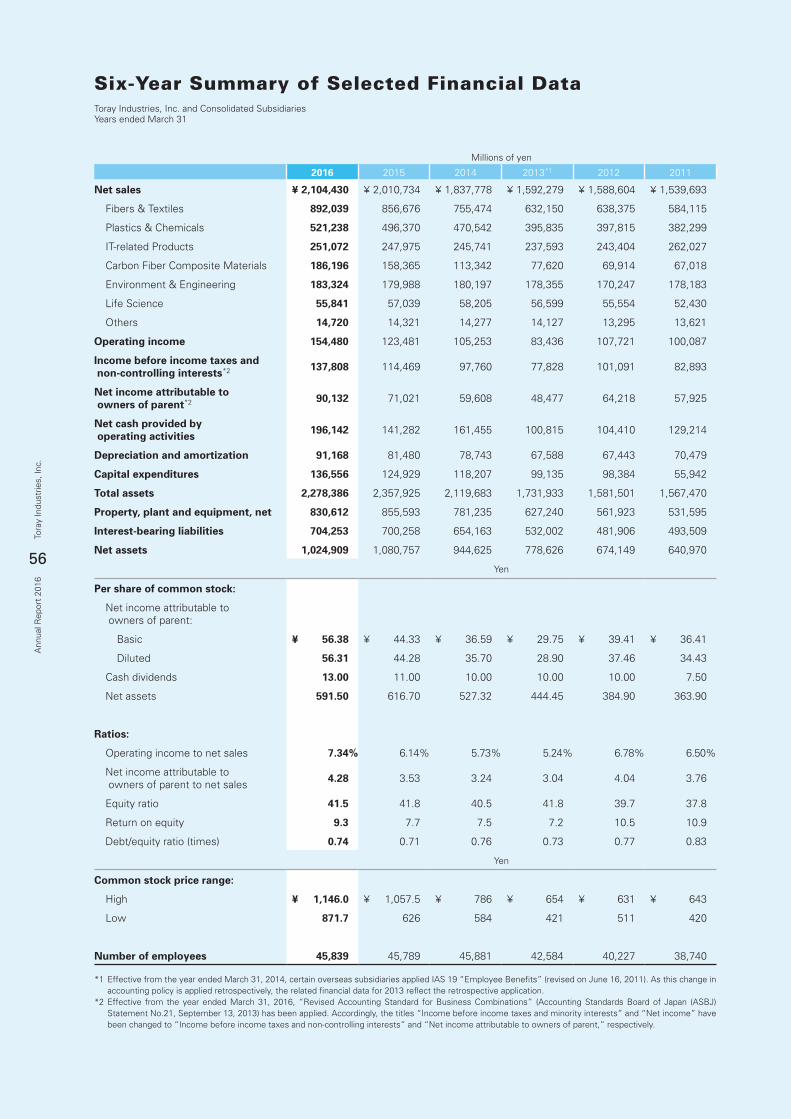
56
Tora
y In
dust
ries,
Inc.
Ann
ual R
epor
t 20
16
Six-Year Summary of Selected Financial DataToray Industries, Inc. and Consolidated SubsidiariesYears ended March 31
Millions of yen
2016 2015 2014 2013*1 2012 2011
Net sales ¥ 2,104,430 ¥ 2,010,734 ¥ 1,837,778 ¥ 1,592,279 ¥ 1,588,604 ¥ 1,539,693
Fibers & Textiles 892,039 856,676 755,474 632,150 638,375 584,115
Plastics & Chemicals 521,238 496,370 470,542 395,835 397,815 382,299
IT-related Products 251,072 247,975 245,741 237,593 243,404 262,027
Carbon Fiber Composite Materials 186,196 158,365 113,342 77,620 69,914 67,018
Environment & Engineering 183,324 179,988 180,197 178,355 170,247 178,183
Life Science 55,841 57,039 58,205 56,599 55,554 52,430
Others 14,720 14,321 14,277 14,127 13,295 13,621
Operating income 154,480 123,481 105,253 83,436 107,721 100,087
Income before income taxes and non-controlling interests*2 137,808 114,469 97,760 77,828 101,091 82,893
Net income attributable to owners of parent*2 90,132 71,021 59,608 48,477 64,218 57,925
Net cash provided by operating activities 196,142 141,282 161,455 100,815 104,410 129,214
Depreciation and amortization 91,168 81,480 78,743 67,588 67,443 70,479
Capital expenditures 136,556 124,929 118,207 99,135 98,384 55,942
Total assets 2,278,386 2,357,925 2,119,683 1,731,933 1,581,501 1,567,470
Property, plant and equipment, net 830,612 855,593 781,235 627,240 561,923 531,595
Interest-bearing liabilities 704,253 700,258 654,163 532,002 481,906 493,509
Net assets 1,024,909 1,080,757 944,625 778,626 674,149 640,970
Yen
Per share of common stock:
Net income attributable to owners of parent:
Basic ¥ 56.38 ¥ 44.33 ¥ 36.59 ¥ 29.75 ¥ 39.41 ¥ 36.41
Diluted 56.31 44.28 35.70 28.90 37.46 34.43
Cash dividends 13.00 11.00 10.00 10.00 10.00 7.50
Net assets 591.50 616.70 527.32 444.45 384.90 363.90
Ratios:
Operating income to net sales 7.34% 6.14% 5.73% 5.24% 6.78% 6.50%
Net income attributable to owners of parent to net sales 4.28 3.53 3.24 3.04 4.04 3.76
Equity ratio 41.5 41.8 40.5 41.8 39.7 37.8
Return on equity 9.3 7.7 7.5 7.2 10.5 10.9
Debt/equity ratio (times) 0.74 0.71 0.76 0.73 0.77 0.83
Yen
Common stock price range:
High ¥ 1,146.0 ¥ 1,057.5 ¥ 786 ¥ 654 ¥ 631 ¥ 643
Low 871.7 626 584 421 511 420
Number of employees 45,839 45,789 45,881 42,584 40,227 38,740
*1 Effective from the year ended March 31, 2014, certain overseas subsidiaries applied IAS 19 “Employee Benefits” (revised on June 16, 2011). As this change in accounting policy is applied retrospectively, the related financial data for 2013 reflect the retrospective application.
*2 Effective from the year ended March 31, 2016, “Revised Accounting Standard for Business Combinations” (Accounting Standards Board of Japan (ASBJ) Statement No.21, September 13, 2013) has been applied. Accordingly, the titles “Income before income taxes and minority interests” and “Net income” have been changed to “Income before income taxes and non-controlling interests” and “Net income attributable to owners of parent,” respectively.
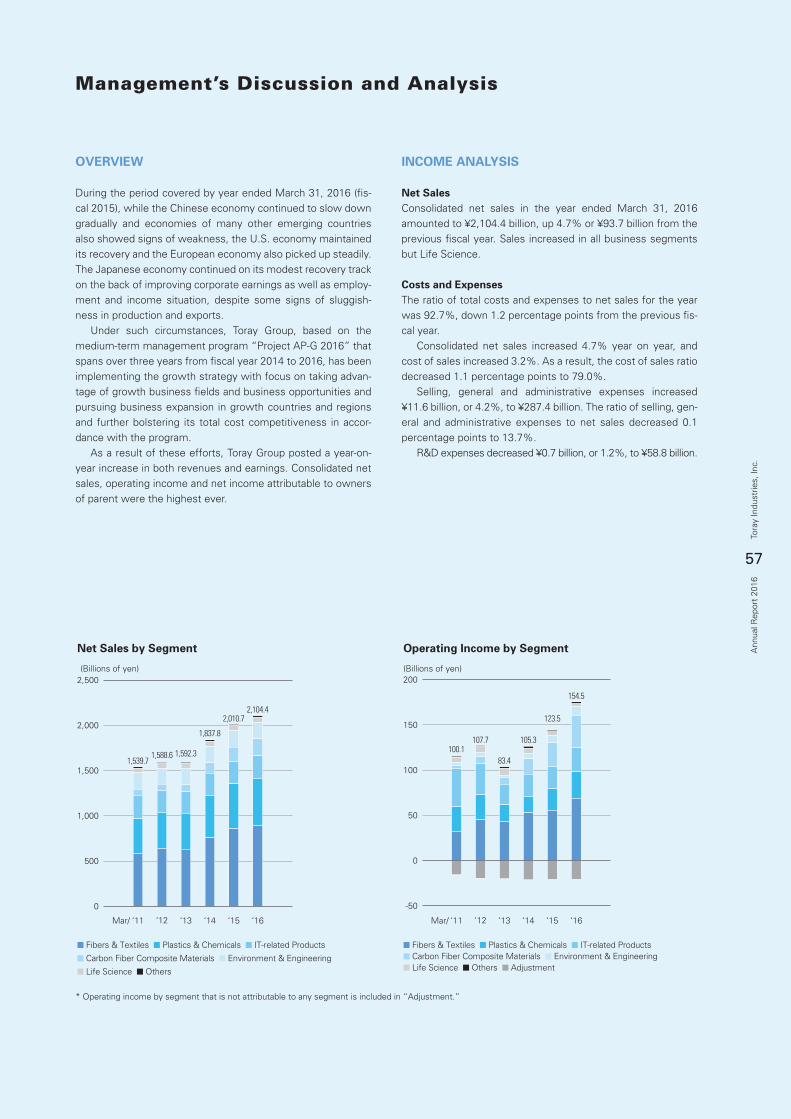
57
Tora
y In
dust
ries,
Inc.
Ann
ual R
epor
t 20
16
Management’s Discussion and Analysis
OVERVIEW During the period covered by year ended March 31, 2016 (fis-cal 2015), while the Chinese economy continued to slow down gradually and economies of many other emerging countries also showed signs of weakness, the U.S. economy maintained its recovery and the European economy also picked up steadily. The Japanese economy continued on its modest recovery track on the back of improving corporate earnings as well as employ-ment and income situation, despite some signs of sluggish-ness in production and exports. Under such circumstances, Toray Group, based on the medium-term management program “Project AP-G 2016” that spans over three years from fiscal year 2014 to 2016, has been implementing the growth strategy with focus on taking advan-tage of growth business fields and business opportunities and pursuing business expansion in growth countries and regions and further bolstering its total cost competitiveness in accor-dance with the program. As a result of these efforts, Toray Group posted a year-on-year increase in both revenues and earnings. Consolidated net sales, operating income and net income attributable to owners of parent were the highest ever.
INCOME ANALYSIS
Net SalesConsolidated net sales in the year ended March 31, 2016 amounted to ¥2,104.4 billion, up 4.7% or ¥93.7 billion from the previous fiscal year. Sales increased in all business segments but Life Science.
Costs and ExpensesThe ratio of total costs and expenses to net sales for the year was 92.7%, down 1.2 percentage points from the previous fis-cal year. Consolidated net sales increased 4.7% year on year, and cost of sales increased 3.2%. As a result, the cost of sales ratio decreased 1.1 percentage points to 79.0%. Selling, general and administrative expenses increased ¥11.6 billion, or 4.2%, to ¥287.4 billion. The ratio of selling, gen-eral and administrative expenses to net sales decreased 0.1 percentage points to 13.7%. R&D expenses decreased ¥0.7 billion, or 1.2%, to ¥58.8 billion.
Net Sales by Segment
0
500
1,000
1,500
2,500(Billions of yen)
2,000
Mar/ ‘11 ‘12 ‘13 ‘14 ‘15 ‘16
■ Fibers & Textiles ■ Plastics & Chemicals ■ IT-related Products
■ Carbon Fiber Composite Materials ■ Environment & Engineering
■ Life Science ■ Others
Operating Income by Segment
(Billions of yen)
Mar/ ‘11 ‘12 ‘13 ‘14 ‘15 ‘16
■ Fibers & Textiles ■ Plastics & Chemicals ■ IT-related Products■ Carbon Fiber Composite Materials ■ Environment & Engineering■ Life Science ■ Others ■ Adjustment
-50
0
50
100
150
200
Total Assets and Net Assets
‘11Mar/ ‘12 ‘13 ‘14 ‘15 ‘16
■ Total Assets ■ Net Assets —Equity Ratio
Cash Flows
‘11Mar/ ‘12 ‘13 ‘14 ‘15 ‘16
■ Cash Flows from Operating Activities
■ Cash Flows from Investing Activities
—Free Cash Flows
Interest-bearing Liabilities and D/E Ratio
(Billions of yen)(Billions of yen)
(Billions of yen)
(%) (Times)
‘11Mar/ ‘12 ‘13 ‘14 ‘15 ‘16
■ Interest-bearing Liabilities
—D/E Ratio
0
600
1,200
1,800
2,400
0
20
40
60
80
-250
-200
-150
-100
-50
0
50
100
150
200
0
200
400
600
800
0.20
0.50
0.80
1.10
1.40
1,539.71,588.6 1,592.3
2,104.42,010.7
1,837.8
100.1107.7
83.4
105.3
123.5
154.5
37.8
39.7 41.8 40.5
641.0 674.1778.6
944.6
1,567.5 1,581.51,731.9
2,119.7
41.8 41.5
1,080.81,024.9
2,357.92.278.4
0.830.77 0.73 0.76
493.5 481.9
532.0
654.2
0.71
0.74
700.3 704.3
78.5
0.4 -6.7
-53.4-50.7
-104.0 -107.5
-214.8
129.2104.4 100.8
161.5
0.6 41.7
-140.7 -154.4
141.3196.1
* Operating income by segment that is not attributable to any segment is included in “Adjustment.”
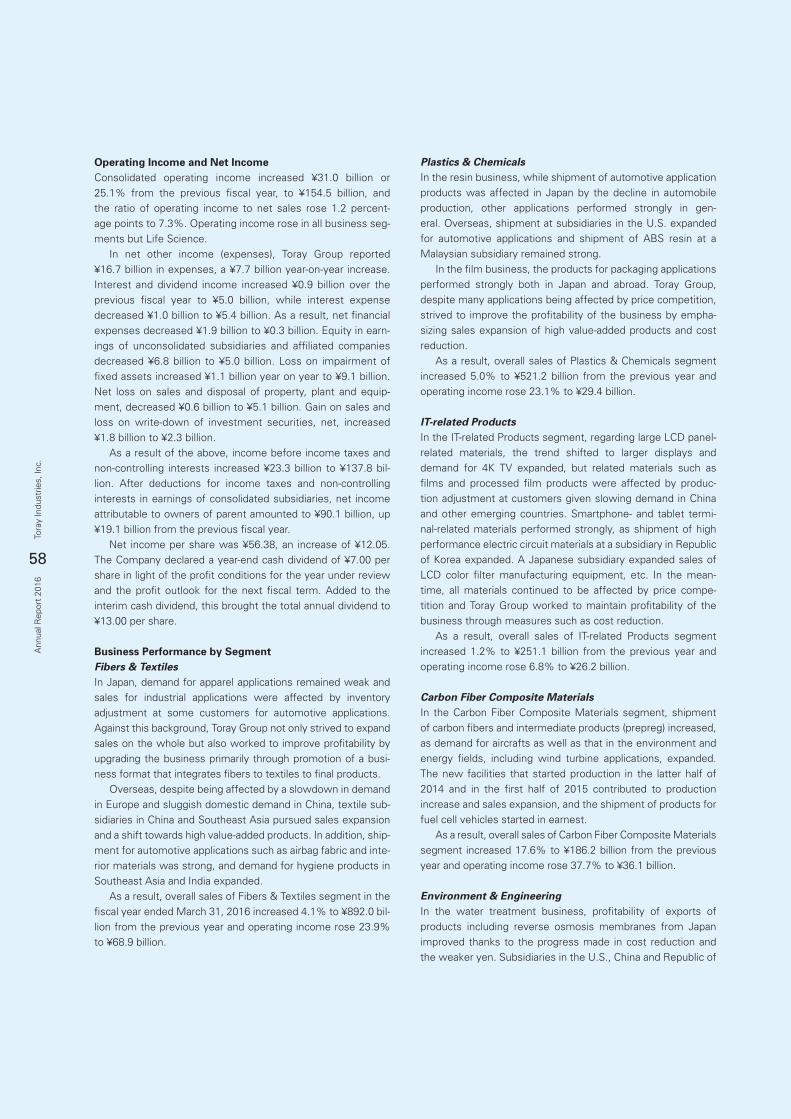
58
Tora
y In
dust
ries,
Inc.
Ann
ual R
epor
t 20
16
Operating Income and Net IncomeConsolidated operating income increased ¥31.0 billion or 25.1% from the previous fiscal year, to ¥154.5 billion, and the ratio of operating income to net sales rose 1.2 percent-age points to 7.3%. Operating income rose in all business seg-ments but Life Science. In net other income (expenses), Toray Group reported ¥16.7 billion in expenses, a ¥7.7 billion year-on-year increase. Interest and dividend income increased ¥0.9 billion over the previous fiscal year to ¥5.0 billion, while interest expense decreased ¥1.0 billion to ¥5.4 billion. As a result, net financial expenses decreased ¥1.9 billion to ¥0.3 billion. Equity in earn-ings of unconsolidated subsidiaries and affiliated companies decreased ¥6.8 billion to ¥5.0 billion. Loss on impairment of fixed assets increased ¥1.1 billion year on year to ¥9.1 billion. Net loss on sales and disposal of property, plant and equip-ment, decreased ¥0.6 billion to ¥5.1 billion. Gain on sales and loss on write-down of investment securities, net, increased ¥1.8 billion to ¥2.3 billion. As a result of the above, income before income taxes and non-controlling interests increased ¥23.3 billion to ¥137.8 bil-lion. After deductions for income taxes and non-controlling interests in earnings of consolidated subsidiaries, net income attributable to owners of parent amounted to ¥90.1 billion, up ¥19.1 billion from the previous fiscal year. Net income per share was ¥56.38, an increase of ¥12.05. The Company declared a year-end cash dividend of ¥7.00 per share in light of the profit conditions for the year under review and the profit outlook for the next fiscal term. Added to the interim cash dividend, this brought the total annual dividend to ¥13.00 per share.
Business Performance by SegmentFibers & TextilesIn Japan, demand for apparel applications remained weak and sales for industrial applications were affected by inventory adjustment at some customers for automotive applications. Against this background, Toray Group not only strived to expand sales on the whole but also worked to improve profitability by upgrading the business primarily through promotion of a busi-ness format that integrates fibers to textiles to final products. Overseas, despite being affected by a slowdown in demand in Europe and sluggish domestic demand in China, textile sub-sidiaries in China and Southeast Asia pursued sales expansion and a shift towards high value-added products. In addition, ship-ment for automotive applications such as airbag fabric and inte-rior materials was strong, and demand for hygiene products in Southeast Asia and India expanded. As a result, overall sales of Fibers & Textiles segment in the fiscal year ended March 31, 2016 increased 4.1% to ¥892.0 bil-lion from the previous year and operating income rose 23.9% to ¥68.9 billion.
Plastics & ChemicalsIn the resin business, while shipment of automotive application products was affected in Japan by the decline in automobile production, other applications performed strongly in gen-eral. Overseas, shipment at subsidiaries in the U.S. expanded for automotive applications and shipment of ABS resin at a Malaysian subsidiary remained strong. In the film business, the products for packaging applications performed strongly both in Japan and abroad. Toray Group, despite many applications being affected by price competition, strived to improve the profitability of the business by empha-sizing sales expansion of high value-added products and cost reduction. As a result, overall sales of Plastics & Chemicals segment increased 5.0% to ¥521.2 billion from the previous year and operating income rose 23.1% to ¥29.4 billion.
IT-related ProductsIn the IT-related Products segment, regarding large LCD panel-related materials, the trend shifted to larger displays and demand for 4K TV expanded, but related materials such as films and processed film products were affected by produc-tion adjustment at customers given slowing demand in China and other emerging countries. Smartphone- and tablet termi-nal-related materials performed strongly, as shipment of high performance electric circuit materials at a subsidiary in Republic of Korea expanded. A Japanese subsidiary expanded sales of LCD color filter manufacturing equipment, etc. In the mean-time, all materials continued to be affected by price compe-tition and Toray Group worked to maintain profitability of the business through measures such as cost reduction. As a result, overall sales of IT-related Products segment increased 1.2% to ¥251.1 billion from the previous year and operating income rose 6.8% to ¥26.2 billion.
Carbon Fiber Composite MaterialsIn the Carbon Fiber Composite Materials segment, shipment of carbon fibers and intermediate products (prepreg) increased, as demand for aircrafts as well as that in the environment and energy fields, including wind turbine applications, expanded. The new facilities that started production in the latter half of 2014 and in the first half of 2015 contributed to production increase and sales expansion, and the shipment of products for fuel cell vehicles started in earnest. As a result, overall sales of Carbon Fiber Composite Materials segment increased 17.6% to ¥186.2 billion from the previous year and operating income rose 37.7% to ¥36.1 billion.
Environment & EngineeringIn the water treatment business, profitability of exports of products including reverse osmosis membranes from Japan improved thanks to the progress made in cost reduction and the weaker yen. Subsidiaries in the U.S., China and Republic of
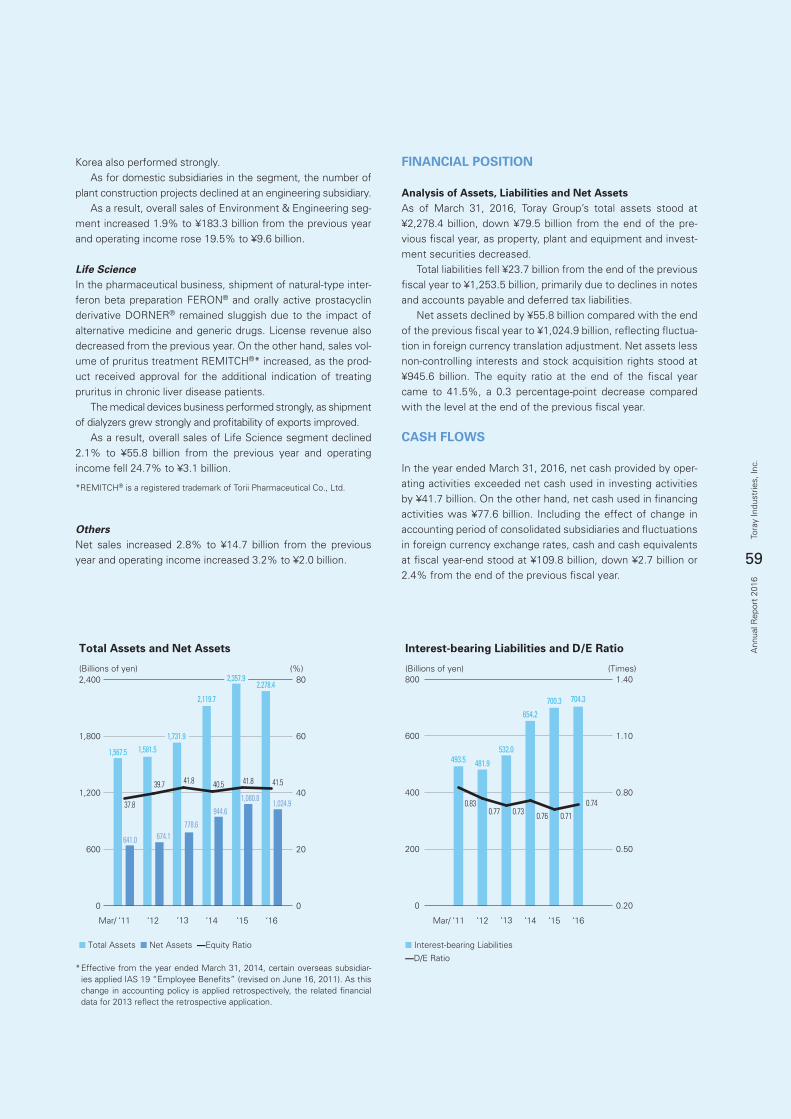
59
Tora
y In
dust
ries,
Inc.
Ann
ual R
epor
t 20
16
Korea also performed strongly. As for domestic subsidiaries in the segment, the number of plant construction projects declined at an engineering subsidiary. As a result, overall sales of Environment & Engineering seg-ment increased 1.9% to ¥183.3 billion from the previous year and operating income rose 19.5% to ¥9.6 billion.
Life ScienceIn the pharmaceutical business, shipment of natural-type inter-feron beta preparation FERON® and orally active prostacyclin derivative DORNER® remained sluggish due to the impact of alternative medicine and generic drugs. License revenue also decreased from the previous year. On the other hand, sales vol-ume of pruritus treatment REMITCH®* increased, as the prod-uct received approval for the additional indication of treating pruritus in chronic liver disease patients. The medical devices business performed strongly, as shipment of dialyzers grew strongly and profitability of exports improved. As a result, overall sales of Life Science segment declined 2.1% to ¥55.8 billion from the previous year and operating income fell 24.7% to ¥3.1 billion.
*REMITCH® is a registered trademark of Torii Pharmaceutical Co., Ltd.
OthersNet sales increased 2.8% to ¥14.7 billion from the previous year and operating income increased 3.2% to ¥2.0 billion.
FINANCIAL POSITION
Analysis of Assets, Liabilities and Net AssetsAs of March 31, 2016, Toray Group’s total assets stood at ¥2,278.4 billion, down ¥79.5 billion from the end of the pre-vious fiscal year, as property, plant and equipment and invest-ment securities decreased. Total liabilities fell ¥23.7 billion from the end of the previous fiscal year to ¥1,253.5 billion, primarily due to declines in notes and accounts payable and deferred tax liabilities. Net assets declined by ¥55.8 billion compared with the end of the previous fiscal year to ¥1,024.9 billion, reflecting fluctua-tion in foreign currency translation adjustment. Net assets less non-controlling interests and stock acquisition rights stood at ¥945.6 billion. The equity ratio at the end of the fiscal year came to 41.5%, a 0.3 percentage-point decrease compared with the level at the end of the previous fiscal year.
CASH FLOWS
In the year ended March 31, 2016, net cash provided by oper-ating activities exceeded net cash used in investing activities by ¥41.7 billion. On the other hand, net cash used in financing activities was ¥77.6 billion. Including the effect of change in accounting period of consolidated subsidiaries and fluctuations in foreign currency exchange rates, cash and cash equivalents at fiscal year-end stood at ¥109.8 billion, down ¥2.7 billion or 2.4% from the end of the previous fiscal year.
Net Sales by Segment
0
500
1,000
1,500
2,500(Billions of yen)
2,000
Mar/ ‘11 ‘12 ‘13 ‘14 ‘15 ‘16
■ Fibers & Textiles ■ Plastics & Chemicals ■ IT-related Products
■ Carbon Fiber Composite Materials ■ Environment & Engineering
■ Life Science ■ Others
Operating Income by Segment
(Billions of yen)
Mar/ ‘11 ‘12 ‘13 ‘14 ‘15 ‘16
■ Fibers & Textiles ■ Plastics & Chemicals ■ IT-related Products■ Carbon Fiber Composite Materials ■ Environment & Engineering■ Life Science ■ Others ■ Adjustment
-50
0
50
100
150
200
Total Assets and Net Assets
‘11Mar/ ‘12 ‘13 ‘14 ‘15 ‘16
■ Total Assets ■ Net Assets —Equity Ratio
Cash Flows
‘11Mar/ ‘12 ‘13 ‘14 ‘15 ‘16
■ Cash Flows from Operating Activities
■ Cash Flows from Investing Activities
—Free Cash Flows
Interest-bearing Liabilities and D/E Ratio
(Billions of yen)(Billions of yen)
(Billions of yen)
(%) (Times)
‘11Mar/ ‘12 ‘13 ‘14 ‘15 ‘16
■ Interest-bearing Liabilities
—D/E Ratio
0
600
1,200
1,800
2,400
0
20
40
60
80
-250
-200
-150
-100
-50
0
50
100
150
200
0
200
400
600
800
0.20
0.50
0.80
1.10
1.40
1,539.71,588.6 1,592.3
2,104.42,010.7
1,837.8
100.1107.7
83.4
105.3
123.5
154.5
37.8
39.7 41.8 40.5
641.0 674.1778.6
944.6
1,567.5 1,581.51,731.9
2,119.7
41.8 41.5
1,080.81,024.9
2,357.92.278.4
0.830.77 0.73 0.76
493.5 481.9
532.0
654.2
0.71
0.74
700.3 704.3
78.5
0.4 -6.7
-53.4-50.7
-104.0 -107.5
-214.8
129.2104.4 100.8
161.5
0.6 41.7
-140.7 -154.4
141.3196.1
* Effective from the year ended March 31, 2014, certain overseas subsidiar-ies applied IAS 19 “Employee Benefits” (revised on June 16, 2011). As this change in accounting policy is applied retrospectively, the related financial data for 2013 reflect the retrospective application.
Net Sales by Segment
0
500
1,000
1,500
2,500(Billions of yen)
2,000
Mar/ ‘11 ‘12 ‘13 ‘14 ‘15 ‘16
■ Fibers & Textiles ■ Plastics & Chemicals ■ IT-related Products
■ Carbon Fiber Composite Materials ■ Environment & Engineering
■ Life Science ■ Others
Operating Income by Segment
(Billions of yen)
Mar/ ‘11 ‘12 ‘13 ‘14 ‘15 ‘16
■ Fibers & Textiles ■ Plastics & Chemicals ■ IT-related Products■ Carbon Fiber Composite Materials ■ Environment & Engineering■ Life Science ■ Others ■ Adjustment
-50
0
50
100
150
200
Total Assets and Net Assets
‘11Mar/ ‘12 ‘13 ‘14 ‘15 ‘16
■ Total Assets ■ Net Assets —Equity Ratio
Cash Flows
‘11Mar/ ‘12 ‘13 ‘14 ‘15 ‘16
■ Cash Flows from Operating Activities
■ Cash Flows from Investing Activities
—Free Cash Flows
Interest-bearing Liabilities and D/E Ratio
(Billions of yen)(Billions of yen)
(Billions of yen)
(%) (Times)
‘11Mar/ ‘12 ‘13 ‘14 ‘15 ‘16
■ Interest-bearing Liabilities
—D/E Ratio
0
600
1,200
1,800
2,400
0
20
40
60
80
-250
-200
-150
-100
-50
0
50
100
150
200
0
200
400
600
800
0.20
0.50
0.80
1.10
1.40
1,539.71,588.6 1,592.3
2,104.42,010.7
1,837.8
100.1107.7
83.4
105.3
123.5
154.5
37.8
39.7 41.8 40.5
641.0 674.1778.6
944.6
1,567.5 1,581.51,731.9
2,119.7
41.8 41.5
1,080.81,024.9
2,357.92.278.4
0.830.77 0.73 0.76
493.5 481.9
532.0
654.2
0.71
0.74
700.3 704.3
78.5
0.4 -6.7
-53.4-50.7
-104.0 -107.5
-214.8
129.2104.4 100.8
161.5
0.6 41.7
-140.7 -154.4
141.3196.1
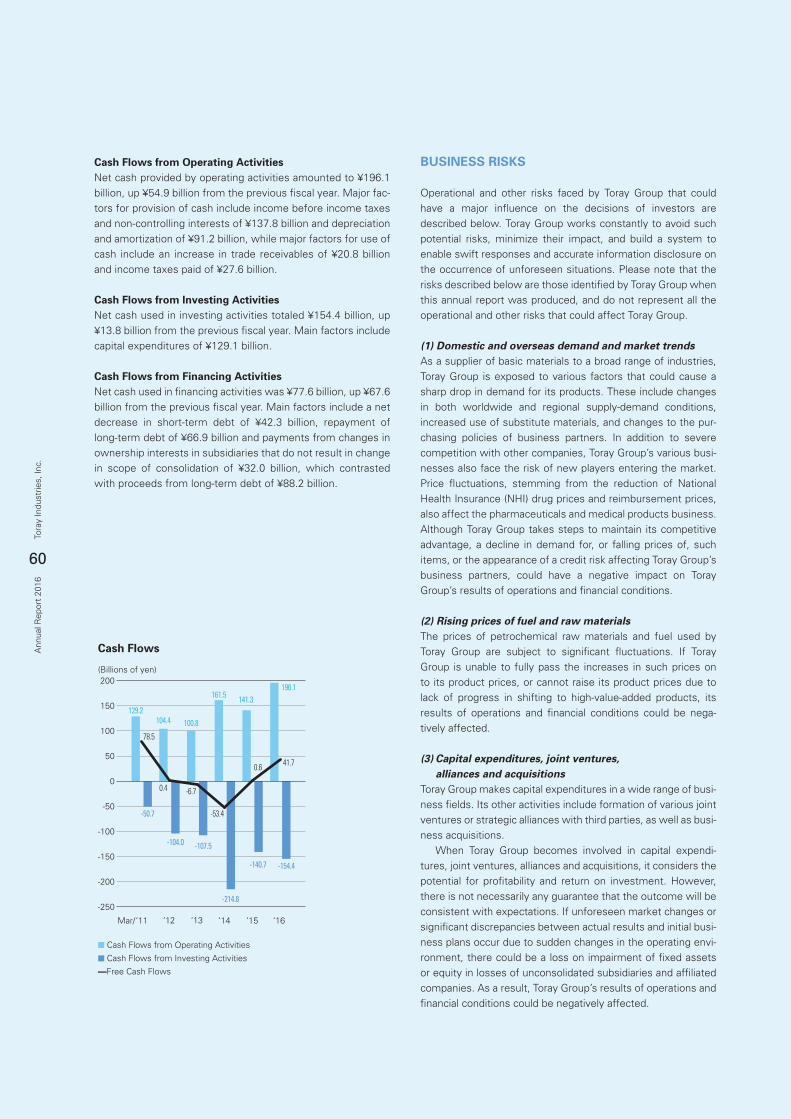
60
Tora
y In
dust
ries,
Inc.
Ann
ual R
epor
t 20
16
Cash Flows from Operating ActivitiesNet cash provided by operating activities amounted to ¥196.1 billion, up ¥54.9 billion from the previous fiscal year. Major fac-tors for provision of cash include income before income taxes and non-controlling interests of ¥137.8 billion and depreciation and amortization of ¥91.2 billion, while major factors for use of cash include an increase in trade receivables of ¥20.8 billion and income taxes paid of ¥27.6 billion.
Cash Flows from Investing ActivitiesNet cash used in investing activities totaled ¥154.4 billion, up ¥13.8 billion from the previous fiscal year. Main factors include capital expenditures of ¥129.1 billion.
Cash Flows from Financing ActivitiesNet cash used in financing activities was ¥77.6 billion, up ¥67.6 billion from the previous fiscal year. Main factors include a net decrease in short-term debt of ¥42.3 billion, repayment of long-term debt of ¥66.9 billion and payments from changes in ownership interests in subsidiaries that do not result in change in scope of consolidation of ¥32.0 billion, which contrasted with proceeds from long-term debt of ¥88.2 billion.
BUSINESS RISKS
Operational and other risks faced by Toray Group that could have a major influence on the decisions of investors are described below. Toray Group works constantly to avoid such potential risks, minimize their impact, and build a system to enable swift responses and accurate information disclosure on the occurrence of unforeseen situations. Please note that the risks described below are those identified by Toray Group when this annual report was produced, and do not represent all the operational and other risks that could affect Toray Group.
(1) Domestic and overseas demand and market trendsAs a supplier of basic materials to a broad range of industries, Toray Group is exposed to various factors that could cause a sharp drop in demand for its products. These include changes in both worldwide and regional supply-demand conditions, increased use of substitute materials, and changes to the pur-chasing policies of business partners. In addition to severe competition with other companies, Toray Group’s various busi-nesses also face the risk of new players entering the market. Price fluctuations, stemming from the reduction of National Health Insurance (NHI) drug prices and reimbursement prices, also affect the pharmaceuticals and medical products business. Although Toray Group takes steps to maintain its competitive advantage, a decline in demand for, or falling prices of, such items, or the appearance of a credit risk affecting Toray Group’s business partners, could have a negative impact on Toray Group’s results of operations and financial conditions.
(2) Rising prices of fuel and raw materialsThe prices of petrochemical raw materials and fuel used by Toray Group are subject to significant fluctuations. If Toray Group is unable to fully pass the increases in such prices on to its product prices, or cannot raise its product prices due to lack of progress in shifting to high-value-added products, its results of operations and financial conditions could be nega-tively affected.
(3) Capital expenditures, joint ventures, alliances and acquisitionsToray Group makes capital expenditures in a wide range of busi-ness fields. Its other activities include formation of various joint ventures or strategic alliances with third parties, as well as busi-ness acquisitions. When Toray Group becomes involved in capital expendi-tures, joint ventures, alliances and acquisitions, it considers the potential for profitability and return on investment. However, there is not necessarily any guarantee that the outcome will be consistent with expectations. If unforeseen market changes or significant discrepancies between actual results and initial busi-ness plans occur due to sudden changes in the operating envi-ronment, there could be a loss on impairment of fixed assets or equity in losses of unconsolidated subsidiaries and affiliated companies. As a result, Toray Group’s results of operations and financial conditions could be negatively affected.
Net Sales by Segment
0
500
1,000
1,500
2,500(Billions of yen)
2,000
Mar/ ‘11 ‘12 ‘13 ‘14 ‘15 ‘16
■ Fibers & Textiles ■ Plastics & Chemicals ■ IT-related Products
■ Carbon Fiber Composite Materials ■ Environment & Engineering
■ Life Science ■ Others
Operating Income by Segment
(Billions of yen)
Mar/ ‘11 ‘12 ‘13 ‘14 ‘15 ‘16
■ Fibers & Textiles ■ Plastics & Chemicals ■ IT-related Products■ Carbon Fiber Composite Materials ■ Environment & Engineering■ Life Science ■ Others ■ Adjustment
-50
0
50
100
150
200
Total Assets and Net Assets
‘11Mar/ ‘12 ‘13 ‘14 ‘15 ‘16
■ Total Assets ■ Net Assets —Equity Ratio
Cash Flows
‘11Mar/ ‘12 ‘13 ‘14 ‘15 ‘16
■ Cash Flows from Operating Activities
■ Cash Flows from Investing Activities
—Free Cash Flows
Interest-bearing Liabilities and D/E Ratio
(Billions of yen)(Billions of yen)
(Billions of yen)
(%) (Times)
‘11Mar/ ‘12 ‘13 ‘14 ‘15 ‘16
■ Interest-bearing Liabilities
—D/E Ratio
0
600
1,200
1,800
2,400
0
20
40
60
80
-250
-200
-150
-100
-50
0
50
100
150
200
0
200
400
600
800
0.20
0.50
0.80
1.10
1.40
1,539.71,588.6 1,592.3
2,104.42,010.7
1,837.8
100.1107.7
83.4
105.3
123.5
154.5
37.8
39.7 41.8 40.5
641.0 674.1778.6
944.6
1,567.5 1,581.51,731.9
2,119.7
41.8 41.5
1,080.81,024.9
2,357.92.278.4
0.830.77 0.73 0.76
493.5 481.9
532.0
654.2
0.71
0.74
700.3 704.3
78.5
0.4 -6.7
-53.4-50.7
-104.0 -107.5
-214.8
129.2104.4 100.8
161.5
0.6 41.7
-140.7 -154.4
141.3196.1
61
Tora
y In
dust
ries,
Inc.
Ann
ual R
epor
t 20
16
(4) Foreign currency, interest rate and securities market fluctuationsForeign currency exchange rate fluctuations affect Toray Group’s consolidated financial statements when the financial statements of the overseas operations presented in local cur-rencies are translated into yen. Toray Group takes measures, such as entering forward exchange contracts, to alleviate risks associated with transactions denominated in foreign curren-cies. However, unforeseen exchange rate fluctuations could have an impact on Toray Group’s results of operations and financial conditions. Moreover, rapid and unforeseen changes in interest rates and other aspects of financial market turmoils, as well as changes in the value of securities and pension assets held by Toray Group, may have an impact on Toray Group’s results of operations and financial conditions.
(5) Changes in assumptions on which forecasts are based that might affect employee retirement benefit obligations and deferred tax assetsToray’s consolidated financial statements contain employee retirement benefit obligations based on future pension pay-ments calculated in accordance with certain criteria, as well as deferred tax assets stated according to likely tax refunds based on taxable income estimates for the future fiscal years. However, if changes in the criteria used to calculate pension payments were to occur, or if fluctuations arose in the esti-mates of future taxable income, Toray Group’s results of opera-tions and financial conditions could be affected.
(6) Overseas operationsToray Group is developing a broad geographical presence, with operations in various countries of Asia, Europe, and the Americas. Some of the major potential risks associated with various regions are summarized below. If such risks were to become reality, Toray Group’s results of operations and finan-cial conditions could be negatively affected.
— Unforeseen introduction, changes or abolition of laws and regulations such as changes in taxation systems
— Unforeseen economic or political events— Social upheaval, including acts of terror or war
(7) Product liability Toray Group strives to supply the world’s best-in-class product quality. However, it cannot always guarantee against a major unforeseen quality problem. If quality-related serious situations were to occur, Toray Group’s results of operations and financial conditions could be negatively affected.
(8) LawsuitsIn the course of conducting its wide range of business activi-ties, Toray Group faces the risk of being targeted by legal action pertaining to various matters such as intellectual property, prod-uct liability, environment, and labor issues. If Toray Group were subject to a major lawsuit, its results of operations and financial conditions could be negatively affected.
(9) Laws and regulations, taxes, competition policies and internal controlsVarious laws and regulations apply in the countries and regions where Toray Group conducts its business. These laws and reg-ulations include regulations related to the environment, com-mercial trading, labor, intellectual property, taxation and foreign exchange, investment approval protocols and import/export controls, and policies on competition based on antitrust laws. Through the establishment and maintenance of internal control systems, Toray Group endeavors to comply with all such laws and regulations. However, changes to such laws and regula-tions, including the introduction of new environmental regula-tions and taxes, as well as changes to the corporate income tax rate could affect Toray Group’s results of operations and finan-cial conditions. Also, if Toray Group is judged as having violated such laws and regulations, is subject to government sanctions initiated by a fair trade commission, receives a notice of correc-tion from tax authorities, has an employee who engages in illicit behavior, or is unable to uphold internal controls pertaining to financial statements, its results of operations and financial con-ditions could be negatively affected.
(10) Natural disasters and accidentsToray Group places top priority on safety, accident prevention, and environmental preservation. To minimize losses caused by the suspension of production, Toray Group conducts regu-lar accident prevention inspections, maintenance of its manu-facturing facilities, and safety activities. However, the advent of a major natural disaster or unprecedented accident could cause damage to Toray Group’s manufacturing facilities, or could cause inadequate supply of raw materials, which could have a negative impact on its results of operations and finan-cial conditions.
(11) Information security riskThe Toray Group’s information systems and networks are fun-damentally essential elements in the execution of the Group’s business operations and every security precaution is taken in their formulation and operation. Unauthorized access, data alteration, theft or deletion, an interruption of system opera-tions that causes a work stoppage or leads to a lost of trust in the Group, or a leak of confidential information outside the Company, or other such incident could negatively impact the Toray Group’s earnings and financial conditions.
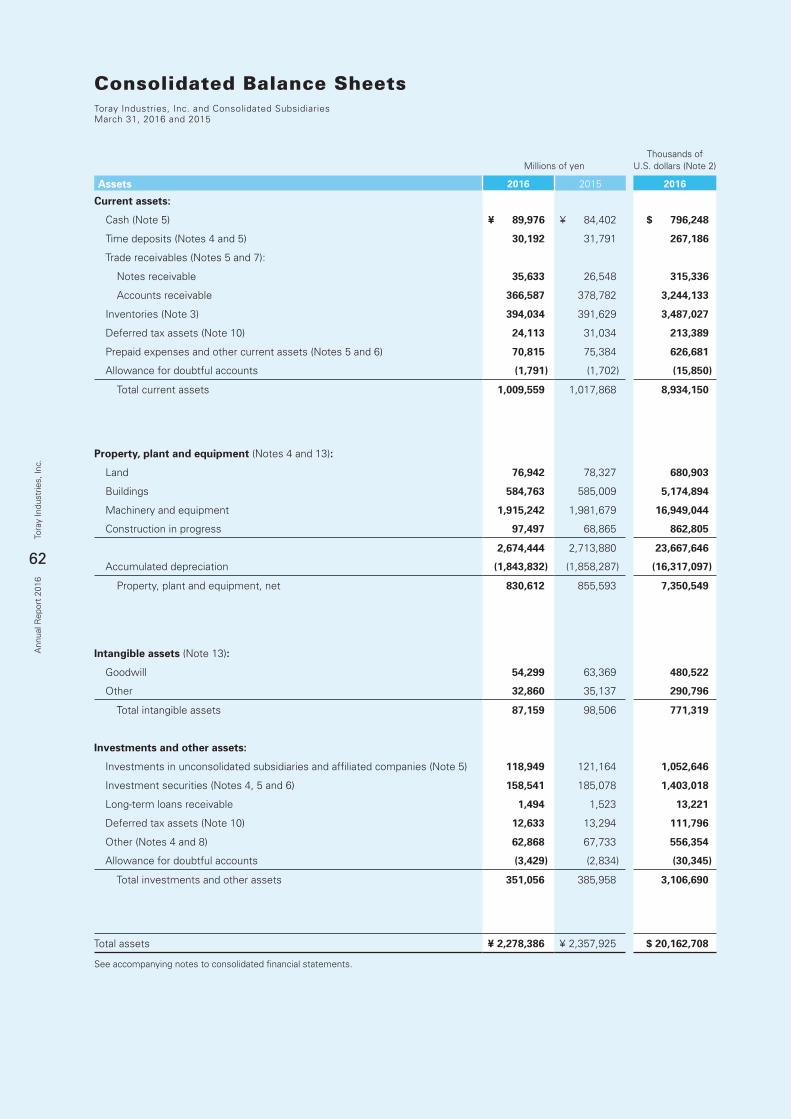
62
Tora
y In
dust
ries,
Inc.
Ann
ual R
epor
t 20
16
Consolidated Balance SheetsToray Industries, Inc. and Consolidated SubsidiariesMarch 31, 2016 and 2015
Millions of yenThousands of
U.S. dollars (Note 2)
Assets 2016 2015 2016
Current assets:
Cash (Note 5) ¥ 89,976 ¥ 84,402 $ 796,248
Time deposits (Notes 4 and 5) 30,192 31,791 267,186
Trade receivables (Notes 5 and 7):
Notes receivable 35,633 26,548 315,336
Accounts receivable 366,587 378,782 3,244,133
Inventories (Note 3) 394,034 391,629 3,487,027
Deferred tax assets (Note 10) 24,113 31,034 213,389
Prepaid expenses and other current assets (Notes 5 and 6) 70,815 75,384 626,681
Allowance for doubtful accounts (1,791) (1,702) (15,850)
Total current assets 1,009,559 1,017,868 8,934,150
Property, plant and equipment (Notes 4 and 13):
Land 76,942 78,327 680,903
Buildings 584,763 585,009 5,174,894
Machinery and equipment 1,915,242 1,981,679 16,949,044
Construction in progress 97,497 68,865 862,805
2,674,444 2,713,880 23,667,646
Accumulated depreciation (1,843,832) (1,858,287) (16,317,097)
Property, plant and equipment, net 830,612 855,593 7,350,549
Intangible assets (Note 13):
Goodwill 54,299 63,369 480,522
Other 32,860 35,137 290,796
Total intangible assets 87,159 98,506 771,319
Investments and other assets:
Investments in unconsolidated subsidiaries and affiliated companies (Note 5) 118,949 121,164 1,052,646
Investment securities (Notes 4, 5 and 6) 158,541 185,078 1,403,018
Long-term loans receivable 1,494 1,523 13,221
Deferred tax assets (Note 10) 12,633 13,294 111,796
Other (Notes 4 and 8) 62,868 67,733 556,354
Allowance for doubtful accounts (3,429) (2,834) (30,345)
Total investments and other assets 351,056 385,958 3,106,690
Total assets ¥ 2,278,386 ¥ 2,357,925 $ 20,162,708
See accompanying notes to consolidated financial statements.
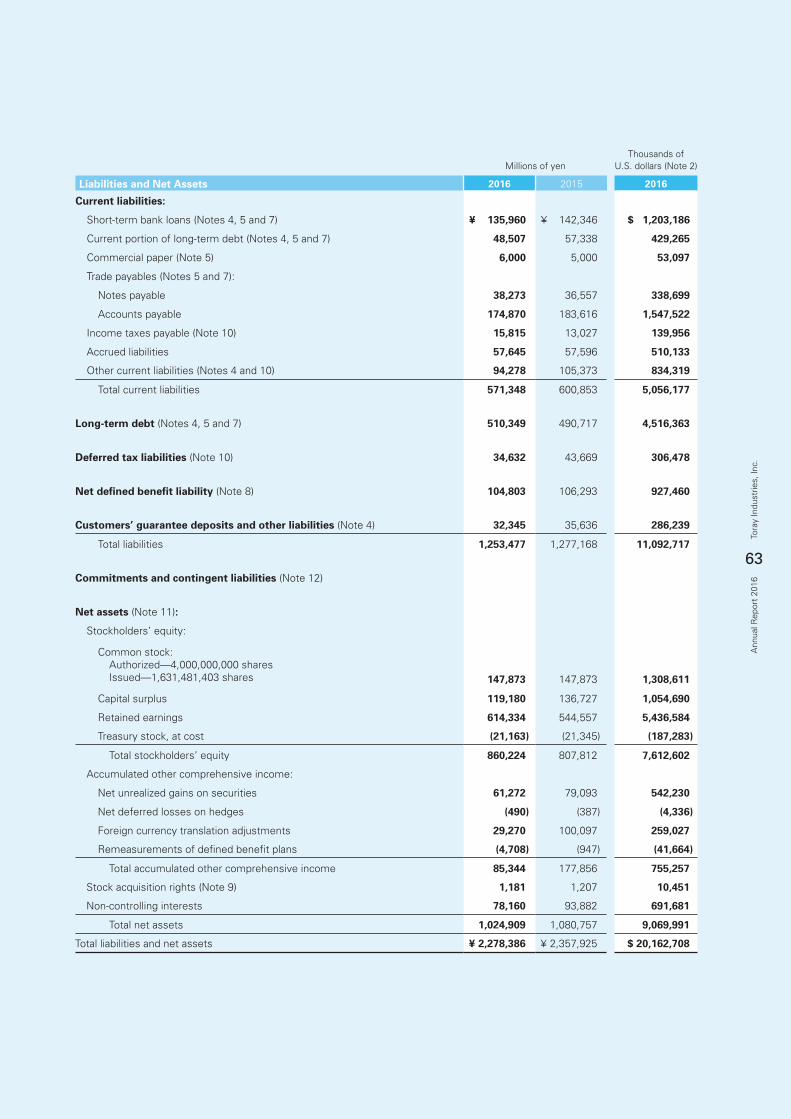
63
Tora
y In
dust
ries,
Inc.
Ann
ual R
epor
t 20
16
Millions of yenThousands of
U.S. dollars (Note 2)
Liabilities and Net Assets 2016 2015 2016
Current liabilities:
Short-term bank loans (Notes 4, 5 and 7) ¥ 135,960 ¥ 142,346 $ 1,203,186
Current portion of long-term debt (Notes 4, 5 and 7) 48,507 57,338 429,265
Commercial paper (Note 5) 6,000 5,000 53,097
Trade payables (Notes 5 and 7):
Notes payable 38,273 36,557 338,699
Accounts payable 174,870 183,616 1,547,522
Income taxes payable (Note 10) 15,815 13,027 139,956
Accrued liabilities 57,645 57,596 510,133
Other current liabilities (Notes 4 and 10) 94,278 105,373 834,319
Total current liabilities 571,348 600,853 5,056,177
Long-term debt (Notes 4, 5 and 7) 510,349 490,717 4,516,363
Deferred tax liabilities (Note 10) 34,632 43,669 306,478
Net defined benefit liability (Note 8) 104,803 106,293 927,460
Customers’ guarantee deposits and other liabilities (Note 4) 32,345 35,636 286,239
Total liabilities 1,253,477 1,277,168 11,092,717
Commitments and contingent liabilities (Note 12)
Net assets (Note 11):
Stockholders’ equity:
Common stock: Authorized—4,000,000,000 shares Issued—1,631,481,403 shares 147,873
147,873 1,308,611
Capital surplus 119,180 136,727 1,054,690
Retained earnings 614,334 544,557 5,436,584
Treasury stock, at cost (21,163) (21,345) (187,283)
Total stockholders’ equity 860,224 807,812 7,612,602
Accumulated other comprehensive income:
Net unrealized gains on securities 61,272 79,093 542,230
Net deferred losses on hedges (490) (387) (4,336)
Foreign currency translation adjustments 29,270 100,097 259,027
Remeasurements of defined benefit plans (4,708) (947) (41,664)
Total accumulated other comprehensive income 85,344 177,856 755,257
Stock acquisition rights (Note 9) 1,181 1,207 10,451
Non-controlling interests 78,160 93,882 691,681
Total net assets 1,024,909 1,080,757 9,069,991
Total liabilities and net assets ¥ 2,278,386 ¥ 2,357,925 $ 20,162,708
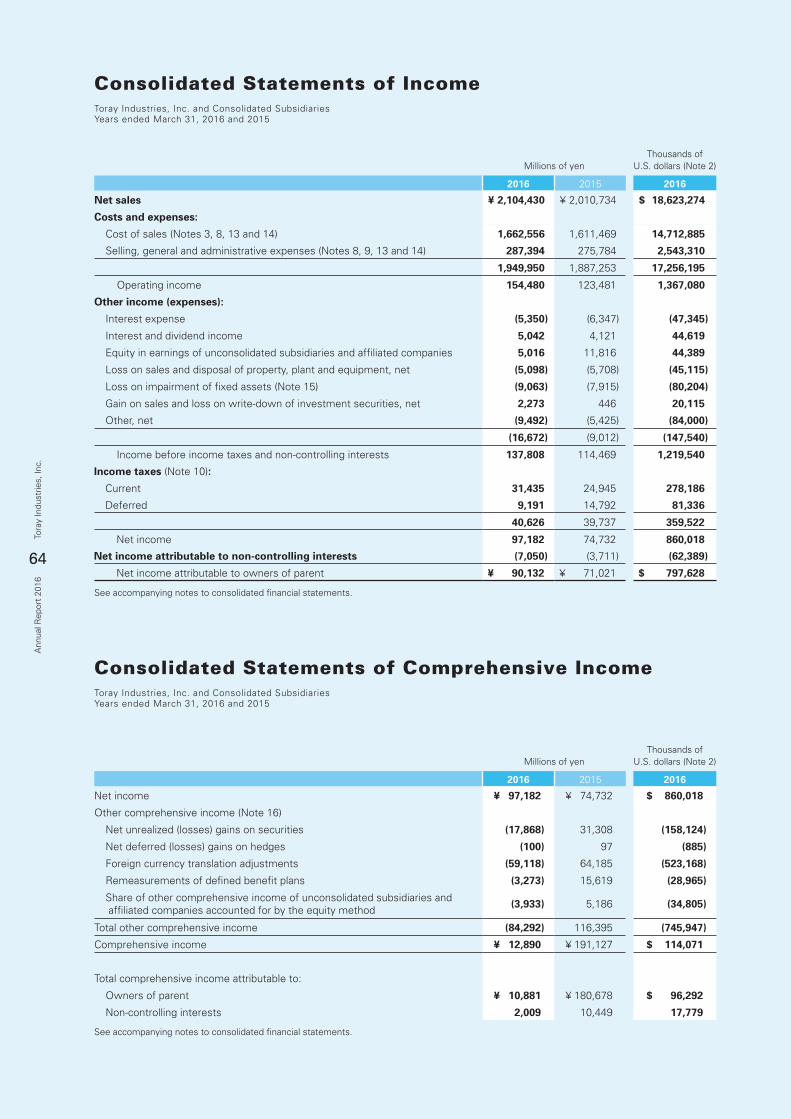
64
Tora
y In
dust
ries,
Inc.
Ann
ual R
epor
t 20
16
Consolidated Statements of IncomeToray Industries, Inc. and Consolidated SubsidiariesYears ended March 31, 2016 and 2015
Consolidated Statements of Comprehensive IncomeToray Industries, Inc. and Consolidated SubsidiariesYears ended March 31, 2016 and 2015
Millions of yenThousands of
U.S. dollars (Note 2)
2016 2015 2016
Net sales ¥ 2,104,430 ¥ 2,010,734 $ 18,623,274
Costs and expenses:
Cost of sales (Notes 3, 8, 13 and 14) 1,662,556 1,611,469 14,712,885
Selling, general and administrative expenses (Notes 8, 9, 13 and 14) 287,394 275,784 2,543,310
1,949,950 1,887,253 17,256,195
Operating income 154,480 123,481 1,367,080
Other income (expenses):
Interest expense (5,350) (6,347) (47,345)
Interest and dividend income 5,042 4,121 44,619
Equity in earnings of unconsolidated subsidiaries and affiliated companies 5,016 11,816 44,389
Loss on sales and disposal of property, plant and equipment, net (5,098) (5,708) (45,115)
Loss on impairment of fixed assets (Note 15) (9,063) (7,915) (80,204)
Gain on sales and loss on write-down of investment securities, net 2,273 446 20,115
Other, net (9,492) (5,425) (84,000)
(16,672) (9,012) (147,540)
Income before income taxes and non-controlling interests 137,808 114,469 1,219,540
Income taxes (Note 10):
Current 31,435 24,945 278,186
Deferred 9,191 14,792 81,336
40,626 39,737 359,522
Net income 97,182 74,732 860,018
Net income attributable to non-controlling interests (7,050) (3,711) (62,389)
Net income attributable to owners of parent ¥ 90,132 ¥ 71,021 $ 797,628
See accompanying notes to consolidated financial statements.
Millions of yenThousands of
U.S. dollars (Note 2)
2016 2015 2016
Net income ¥ 97,182 ¥ 74,732 $ 860,018
Other comprehensive income (Note 16)
Net unrealized (losses) gains on securities (17,868) 31,308 (158,124)
Net deferred (losses) gains on hedges (100) 97 (885)
Foreign currency translation adjustments (59,118) 64,185 (523,168)
Remeasurements of defined benefit plans (3,273) 15,619 (28,965)
Share of other comprehensive income of unconsolidated subsidiaries and affiliated companies accounted for by the equity method (3,933) 5,186 (34,805)
Total other comprehensive income (84,292) 116,395 (745,947)
Comprehensive income ¥ 12,890 ¥ 191,127 $ 114,071
Total comprehensive income attributable to:
Owners of parent ¥ 10,881 ¥ 180,678 $ 96,292
Non-controlling interests 2,009 10,449 17,779
See accompanying notes to consolidated financial statements.
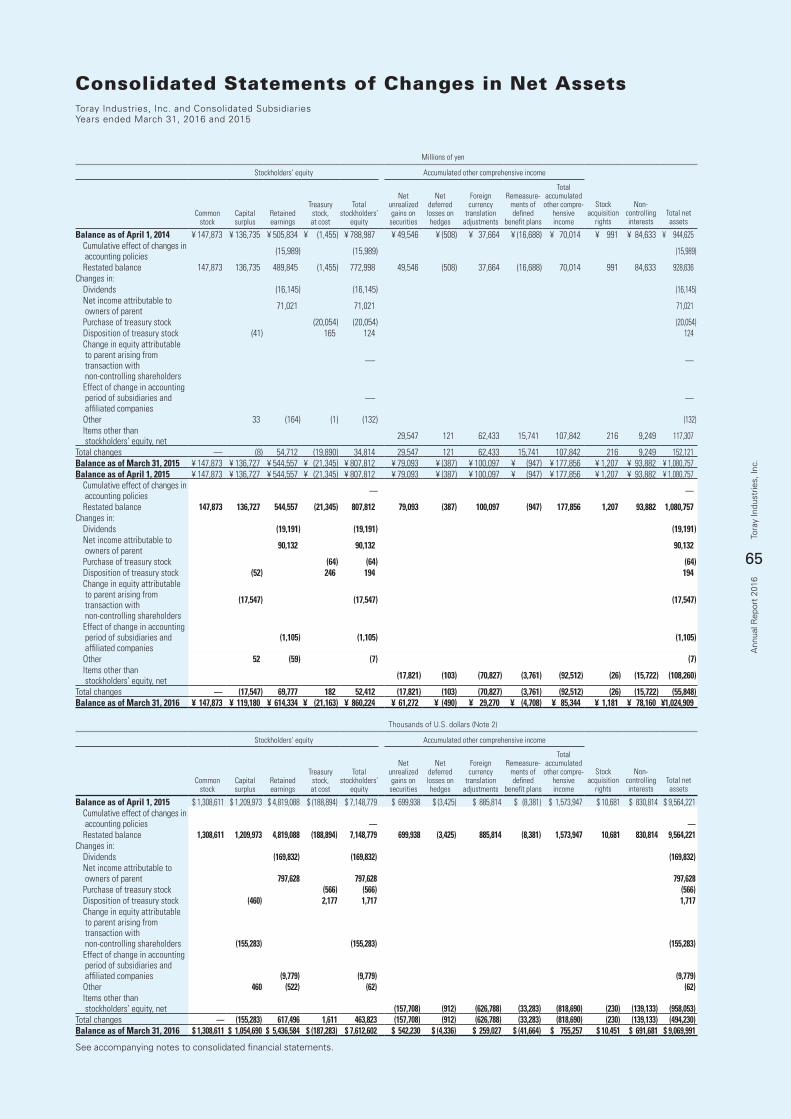
65
Tora
y In
dust
ries,
Inc.
Ann
ual R
epor
t 20
16
Consolidated Statements of Changes in Net AssetsToray Industries, Inc. and Consolidated SubsidiariesYears ended March 31, 2016 and 2015
Millions of yen
Stockholders’ equity Accumulated other comprehensive income
Commonstock
Capitalsurplus
Retainedearnings
Treasurystock,at cost
Totalstockholders’
equity
Netunrealizedgains on
securities
Netdeferredlosses onhedges
Foreigncurrency
translationadjustments
Remeasure-ments of defined
benefit plans
Totalaccumulated
other compre-hensiveincome
Stockacquisition
rights
Non-controllinginterests
Total netassets
Balance as of April 1, 2014 ¥ 147,873 ¥ 136,735 ¥ 505,834 ¥ (1,455) ¥ 788,987 ¥ 49,546 ¥ (508) ¥ 37,664 ¥ (16,688) ¥ 70,014 ¥ 991 ¥ 84,633 ¥ 944,625 Cumulative effect of changes in accounting policies (15,989) (15,989) (15,989)
Restated balance 147,873 136,735 489,845 (1,455) 772,998 49,546 (508) 37,664 (16,688) 70,014 991 84,633 928,636 Changes in: Dividends (16,145) (16,145) (16,145) Net income attributable to owners of parent 71,021 71,021 71,021
Purchase of treasury stock (20,054) (20,054) (20,054) Disposition of treasury stock (41) 165 124 124 Change in equity attributable to parent arising from transaction with non-controlling shareholders
— —
Effect of change in accounting period of subsidiaries and affiliated companies
— —
Other 33 (164) (1) (132) (132) Items other than stockholders’ equity, net 29,547 121 62,433 15,741 107,842 216 9,249 117,307
Total changes — (8) 54,712 (19,890) 34,814 29,547 121 62,433 15,741 107,842 216 9,249 152,121 Balance as of March 31, 2015 ¥ 147,873 ¥ 136,727 ¥ 544,557 ¥ (21,345) ¥ 807,812 ¥ 79,093 ¥ (387) ¥ 100,097 ¥ (947) ¥ 177,856 ¥ 1,207 ¥ 93,882 ¥ 1,080,757 Balance as of April 1, 2015 ¥ 147,873 ¥ 136,727 ¥ 544,557 ¥ (21,345) ¥ 807,812 ¥ 79,093 ¥ (387) ¥ 100,097 ¥ (947) ¥ 177,856 ¥ 1,207 ¥ 93,882 ¥ 1,080,757 Cumulative effect of changes in accounting policies — —
Restated balance 147,873 136,727 544,557 (21,345) 807,812 79,093 (387) 100,097 (947) 177,856 1,207 93,882 1,080,757 Changes in: Dividends (19,191) (19,191) (19,191) Net income attributable to owners of parent 90,132 90,132 90,132
Purchase of treasury stock (64) (64) (64) Disposition of treasury stock (52) 246 194 194 Change in equity attributable to parent arising from transaction with non-controlling shareholders
(17,547) (17,547) (17,547)
Effect of change in accounting period of subsidiaries and affiliated companies
(1,105) (1,105) (1,105)
Other 52 (59) (7) (7) Items other than stockholders’ equity, net (17,821) (103) (70,827) (3,761) (92,512) (26) (15,722) (108,260)
Total changes — (17,547) 69,777 182 52,412 (17,821) (103) (70,827) (3,761) (92,512) (26) (15,722) (55,848)Balance as of March 31, 2016 ¥ 147,873 ¥ 119,180 ¥ 614,334 ¥ (21,163) ¥ 860,224 ¥ 61,272 ¥ (490) ¥ 29,270 ¥ (4,708) ¥ 85,344 ¥ 1,181 ¥ 78,160 ¥1,024,909
Thousands of U.S. dollars (Note 2)
Stockholders’ equity Accumulated other comprehensive income
Commonstock
Capitalsurplus
Retainedearnings
Treasurystock,at cost
Totalstockholders’
equity
Netunrealizedgains on
securities
Netdeferredlosses onhedges
Foreigncurrency
translationadjustments
Remeasure-ments of defined
benefit plans
Totalaccumulated
other compre-hensiveincome
Stockacquisition
rights
Non-controllinginterests
Total netassets
Balance as of April 1, 2015 $ 1,308,611 $ 1,209,973 $ 4,819,088 $ (188,894) $ 7,148,779 $ 699,938 $ (3,425) $ 885,814 $ (8,381) $ 1,573,947 $ 10,681 $ 830,814 $ 9,564,221 Cumulative effect of changes in accounting policies — — Restated balance 1,308,611 1,209,973 4,819,088 (188,894) 7,148,779 699,938 (3,425) 885,814 (8,381) 1,573,947 10,681 830,814 9,564,221 Changes in: Dividends (169,832) (169,832) (169,832) Net income attributable to owners of parent 797,628 797,628 797,628 Purchase of treasury stock (566) (566) (566) Disposition of treasury stock (460) 2,177 1,717 1,717 Change in equity attributable to parent arising from transaction with non-controlling shareholders (155,283) (155,283) (155,283) Effect of change in accounting period of subsidiaries and affiliated companies (9,779) (9,779) (9,779) Other 460 (522) (62) (62) Items other than stockholders’ equity, net (157,708) (912) (626,788) (33,283) (818,690) (230) (139,133) (958,053)Total changes — (155,283) 617,496 1,611 463,823 (157,708) (912) (626,788) (33,283) (818,690) (230) (139,133) (494,230)Balance as of March 31, 2016 $ 1,308,611 $ 1,054,690 $ 5,436,584 $ (187,283) $ 7,612,602 $ 542,230 $ (4,336) $ 259,027 $ (41,664) $ 755,257 $ 10,451 $ 691,681 $ 9,069,991
See accompanying notes to consolidated financial statements.
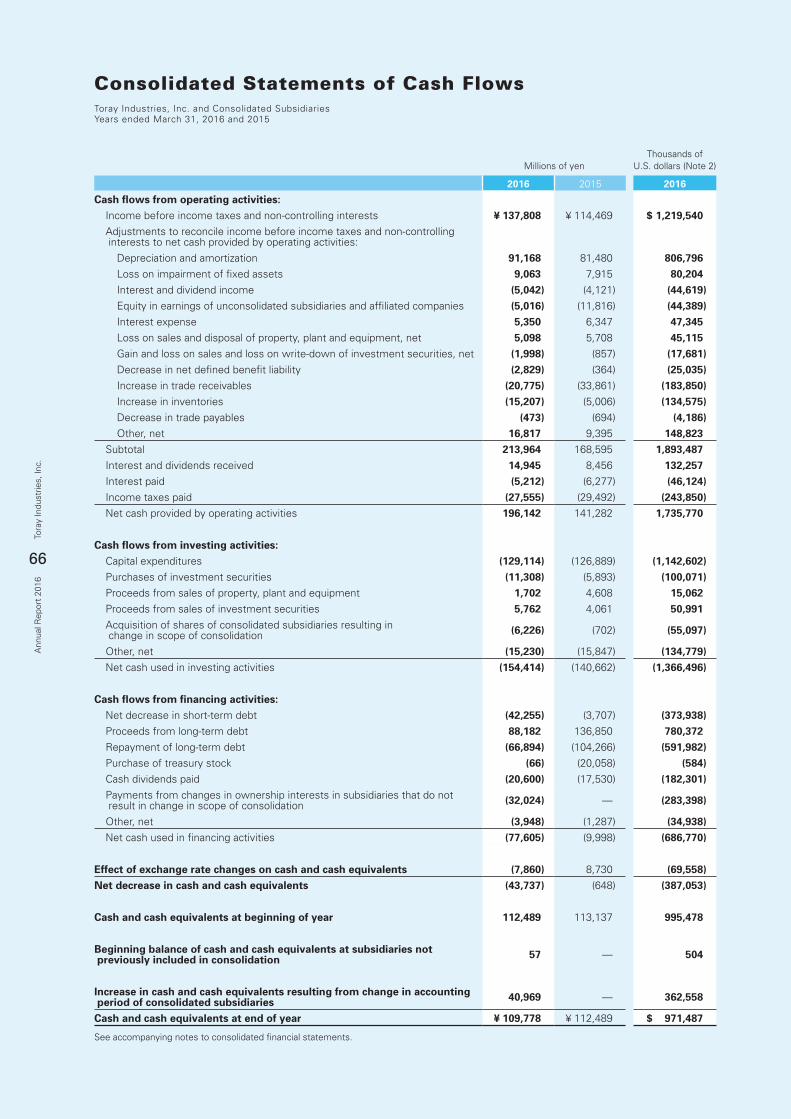
66
Tora
y In
dust
ries,
Inc.
Ann
ual R
epor
t 20
16
Consolidated Statements of Cash FlowsToray Industries, Inc. and Consolidated SubsidiariesYears ended March 31, 2016 and 2015
Millions of yenThousands of
U.S. dollars (Note 2)
2016 2015 2016
Cash flows from operating activities: Income before income taxes and non-controlling interests ¥ 137,808 ¥ 114,469 $ 1,219,540 Adjustments to reconcile income before income taxes and non-controlling interests to net cash provided by operating activities: Depreciation and amortization 91,168 81,480 806,796 Loss on impairment of fixed assets 9,063 7,915 80,204 Interest and dividend income (5,042) (4,121) (44,619) Equity in earnings of unconsolidated subsidiaries and affiliated companies (5,016) (11,816) (44,389) Interest expense 5,350 6,347 47,345 Loss on sales and disposal of property, plant and equipment, net 5,098 5,708 45,115 Gain and loss on sales and loss on write-down of investment securities, net (1,998) (857) (17,681) Decrease in net defined benefit liability (2,829) (364) (25,035) Increase in trade receivables (20,775) (33,861) (183,850) Increase in inventories (15,207) (5,006) (134,575) Decrease in trade payables (473) (694) (4,186) Other, net 16,817 9,395 148,823 Subtotal 213,964 168,595 1,893,487 Interest and dividends received 14,945 8,456 132,257 Interest paid (5,212) (6,277) (46,124) Income taxes paid (27,555) (29,492) (243,850) Net cash provided by operating activities 196,142 141,282 1,735,770
Cash flows from investing activities: Capital expenditures (129,114) (126,889) (1,142,602) Purchases of investment securities (11,308) (5,893) (100,071) Proceeds from sales of property, plant and equipment 1,702 4,608 15,062 Proceeds from sales of investment securities 5,762 4,061 50,991 Acquisition of shares of consolidated subsidiaries resulting in change in scope of consolidation (6,226) (702) (55,097)
Other, net (15,230) (15,847) (134,779) Net cash used in investing activities (154,414) (140,662) (1,366,496)
Cash flows from financing activities: Net decrease in short-term debt (42,255) (3,707) (373,938) Proceeds from long-term debt 88,182 136,850 780,372 Repayment of long-term debt (66,894) (104,266) (591,982) Purchase of treasury stock (66) (20,058) (584) Cash dividends paid (20,600) (17,530) (182,301) Payments from changes in ownership interests in subsidiaries that do not result in change in scope of consolidation (32,024) — (283,398)
Other, net (3,948) (1,287) (34,938) Net cash used in financing activities (77,605) (9,998) (686,770)
Effect of exchange rate changes on cash and cash equivalents (7,860) 8,730 (69,558)Net decrease in cash and cash equivalents (43,737) (648) (387,053)
Cash and cash equivalents at beginning of year 112,489 113,137 995,478
Beginning balance of cash and cash equivalents at subsidiaries not previously included in consolidation 57 — 504
Increase in cash and cash equivalents resulting from change in accounting period of consolidated subsidiaries 40,969 — 362,558
Cash and cash equivalents at end of year ¥ 109,778 ¥ 112,489 $ 971,487
See accompanying notes to consolidated financial statements.
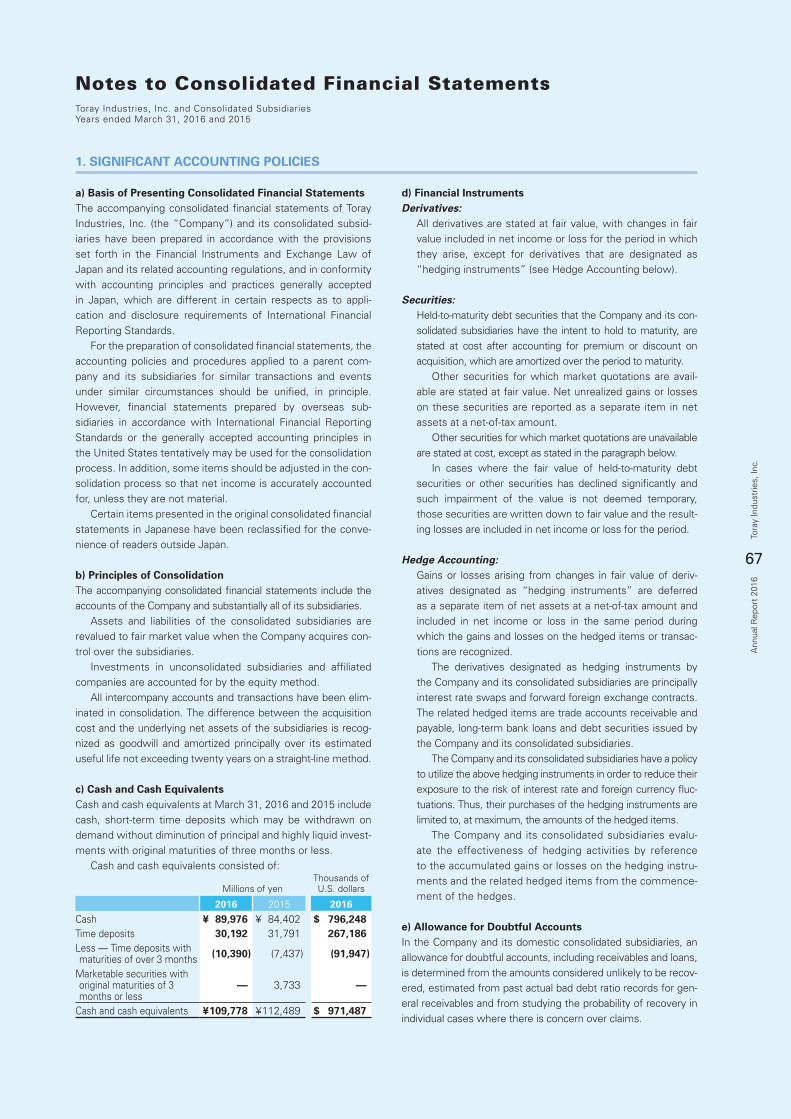
67
Tora
y In
dust
ries,
Inc.
Ann
ual R
epor
t 20
16
Notes to Consolidated Financial StatementsToray Industries, Inc. and Consolidated SubsidiariesYears ended March 31, 2016 and 2015
1. SIGNIFICANT ACCOUNTING POLICIES
a) Basis of Presenting Consolidated Financial StatementsThe accompanying consolidated financial statements of Toray Industries, Inc. (the “Company”) and its consolidated subsid-iaries have been prepared in accordance with the provisions set forth in the Financial Instruments and Exchange Law of Japan and its related accounting regulations, and in conformity with accounting principles and practices generally accepted in Japan, which are different in certain respects as to appli-cation and disclosure requirements of International Financial Reporting Standards. For the preparation of consolidated financial statements, the accounting policies and procedures applied to a parent com-pany and its subsidiaries for similar transactions and events under similar circumstances should be unified, in principle. However, financial statements prepared by overseas sub-sidiaries in accordance with International Financial Reporting Standards or the generally accepted accounting principles in the United States tentatively may be used for the consolidation process. In addition, some items should be adjusted in the con-solidation process so that net income is accurately accounted for, unless they are not material. Certain items presented in the original consolidated financial statements in Japanese have been reclassified for the conve-nience of readers outside Japan.
b) Principles of ConsolidationThe accompanying consolidated financial statements include the accounts of the Company and substantially all of its subsidiaries. Assets and liabilities of the consolidated subsidiaries are revalued to fair market value when the Company acquires con-trol over the subsidiaries. Investments in unconsolidated subsidiaries and affiliated companies are accounted for by the equity method. All intercompany accounts and transactions have been elim-inated in consolidation. The difference between the acquisition cost and the underlying net assets of the subsidiaries is recog-nized as goodwill and amortized principally over its estimated useful life not exceeding twenty years on a straight-line method.
c) Cash and Cash EquivalentsCash and cash equivalents at March 31, 2016 and 2015 include cash, short-term time deposits which may be withdrawn on demand without diminution of principal and highly liquid invest-ments with original maturities of three months or less. Cash and cash equivalents consisted of:
Millions of yenThousands ofU.S. dollars
2016 2015 2016Cash ¥ 89,976 ¥ 84,402 $ 796,248Time deposits 30,192 31,791 267,186Less — Time deposits with maturities of over 3 months (10,390) (7,437) (91,947)
Marketable securities with original maturities of 3 months or less
— 3,733 —
Cash and cash equivalents ¥ 109,778 ¥ 112,489 $ 971,487
d) Financial InstrumentsDerivatives:
All derivatives are stated at fair value, with changes in fair value included in net income or loss for the period in which they arise, except for derivatives that are designated as “hedging instruments” (see Hedge Accounting below).
Securities:Held-to-maturity debt securities that the Company and its con-solidated subsidiaries have the intent to hold to maturity, are stated at cost after accounting for premium or discount on acquisition, which are amortized over the period to maturity. Other securities for which market quotations are avail-able are stated at fair value. Net unrealized gains or losses on these securities are reported as a separate item in net assets at a net-of-tax amount. Other securities for which market quotations are unavailable are stated at cost, except as stated in the paragraph below. In cases where the fair value of held-to-maturity debt securities or other securities has declined significantly and such impairment of the value is not deemed temporary, those securities are written down to fair value and the result-ing losses are included in net income or loss for the period.
Hedge Accounting:Gains or losses arising from changes in fair value of deriv-atives designated as “hedging instruments” are deferred as a separate item of net assets at a net-of-tax amount and included in net income or loss in the same period during which the gains and losses on the hedged items or transac-tions are recognized. The derivatives designated as hedging instruments by the Company and its consolidated subsidiaries are principally interest rate swaps and forward foreign exchange contracts. The related hedged items are trade accounts receivable and payable, long-term bank loans and debt securities issued by the Company and its consolidated subsidiaries. The Company and its consolidated subsidiaries have a policy to utilize the above hedging instruments in order to reduce their exposure to the risk of interest rate and foreign currency fluc-tuations. Thus, their purchases of the hedging instruments are limited to, at maximum, the amounts of the hedged items. The Company and its consolidated subsidiaries evalu-ate the effectiveness of hedging activities by reference to the accumulated gains or losses on the hedging instru-ments and the related hedged items from the commence-ment of the hedges.
e) Allowance for Doubtful AccountsIn the Company and its domestic consolidated subsidiaries, an allowance for doubtful accounts, including receivables and loans, is determined from the amounts considered unlikely to be recov-ered, estimated from past actual bad debt ratio records for gen-eral receivables and from studying the probability of recovery in individual cases where there is concern over claims.
68
Tora
y In
dust
ries,
Inc.
Ann
ual R
epor
t 20
16
f) InventoriesInventories are stated at the lower of acquisition cost, princi-pally determined by the moving average method, or net selling value to reflect any decreased profitability of inventories.
g) Property, Plant and EquipmentProperty, plant and equipment are stated at cost. Depreciation for property, plant and equipment (except leased assets) is principally computed by the straight-line method at rates based on estimated useful lives that are as follows:
Buildings 3–60 years Machinery and equipment 3–15 years
Principally, a depreciation method of leased assets is iden-tical to the method applicable to its own fixed assets. In the Company and its domestic consolidated subsidiaries, finance lease transactions which do not transfer ownership of the leased assets whose lease inceptions are on or before March 31, 2008 are accounted for by a method similar to the method applicable to ordinary operating lease transactions.
h) Income TaxesIncome taxes of the Company and its domestic consolidated subsidiaries consist of corporate income taxes, local inhabitants taxes and enterprise taxes. Deferred income taxes are deter-mined using the asset and liability approach, where deferred tax assets and liabilities are recognized for temporary differences between the tax basis of assets and liabilities and their reported amount in the financial statements. The Company also provides for the anticipated tax effect of future remittances of retained earnings from subsidiaries and affiliated companies. Effective from the year ended March 31, 2016, the Company and some of its domestic consolidated subsidiaries have adopted the consolidated taxation system.
i) Consumption TaxesTransactions subject to consumption taxes are recorded at amounts exclusive of consumption taxes.
j) Retirement BenefitsThe Company and its domestic consolidated subsidiaries have an unfunded lump-sum benefit plan, a funded contributory pen-sion plan and a defined contribution pension plan covering all eligible employees. Under the terms of the unfunded lump-sum benefit plan, eli-gible employees are entitled under most circumstances, upon mandatory retirement or earlier voluntary severance, to indem-nities based on compensation at the time of severance and years of service. The funded contributory pension plan and the defined con-tribution pension plan provide, in general, pension payments for life commencing from age 60. To provide for the payment of retirement benefits to employ-ees, net defined benefit liability is recognized at an amount equal to the expected retirement benefit obligations net of the fair value of pension assets at the end of the period. Past service cost is amortized as incurred using the
straight-line method over a certain period within the employ-ees’ average remaining years of service (primarily 13 years). Actuarial gains and losses are amortized from the following fiscal year after recognition using the straight-line method over a certain period within the employees’ average remaining years of service (primarily 13 years). Unrecognized actuarial gains and losses and unrecognized past service cost are recognized in remeasurements of defined benefit plans in accumulated other comprehensive income under the net assets section, net of deferred taxes. Allowance for retirement benefits for members of the Board and corporate auditors (“executives”) of the Company and cer-tain of its domestic consolidated subsidiaries is provided based on the companies’ pertinent rules and is calculated as the esti-mated amount which would be payable if all executives were to retire at the balance sheet date. Any amounts payable to exec-utives upon retirement are subject to approval at the annual stockholders’ meeting. The amount is included in “customers’ guarantee deposits and other liabilities” on the consolidated balance sheets.
k) Appropriation of Retained EarningsCash dividends are recorded in the fiscal year when the pro-posed appropriation of retained earnings is approved by the Board of Directors and/or stockholders.
l) Foreign Currency TransactionsAll monetary assets and liabilities denominated in foreign cur-rencies, whether long-term or short-term, are translated into Japanese yen at the exchange rates prevailing at the balance sheet date. Resulting gains and losses are included in net income or loss for the period.
m) Translation of Foreign Currency Financial StatementsTranslation of foreign currency financial statements of overseas subsidiaries into Japanese yen for consolidation purposes is made by using the current exchange rates prevailing at their balance sheet dates, with the exception that the translation of stockholders’ equity is made by using historical rates. Revenue and expense accounts are principally translated at the average exchange rates during the year. Differences in yen amounts arising from the use of different rates are presented as “for-eign currency translation adjustments” in net assets except for the portion belonging to non-controlling shareholders, which is included in “non-controlling interests” in net assets.
n) Changes in Accounting PolicyEffective from the year ended March 31, 2016, the Company has adopted the “Revised Accounting Standard for Business Combinations” (the Accounting Standards Board of Japan (ASBJ) Statement No. 21, September 13, 2013, hereinafter “Business Combinations Accounting Standard”), “Revised Accounting Standard for Consolidated Financial Statements” (ASBJ Statement No. 22, September 13, 2013, hereinaf-ter “Consolidation Accounting Standard”) and “Revised Accounting Standard for Business Divestitures” (ASBJ Statement No. 7, September 13, 2013, hereinafter “Business Divestitures Accounting Standard”). Accordingly, the Company
69
Tora
y In
dust
ries,
Inc.
Ann
ual R
epor
t 20
16
records differences arising from changes in its equity interest in subsidiaries that remain under its control as capital surplus and charges acquisition-related costs for business combinations to expenses in the period when such costs are incurred. With regard to any business combination made on or after April 1, 2015, any adjustment of an allocated amount of acquisition costs arising from a determination of provisional treatment is reflected in the consolidated financial statements for the period when the business combination occurs. Furthermore, the Company has changed the presentation of net income, etc. and the presenta-tion of “minority interests” to “non-controlling interests.” When applying the accounting standards, the Company fol-lows the transitional treatment set forth in Section 58-2 (4) of the Business Combinations Accounting Standard, Section 44-5 (4) of the Consolidation Accounting Standard and Section 57-4 (4) of the Business Divestitures Accounting Standard. The accounting standards are applied to periods from April 1, 2015 onward. As a result, capital surplus at the end of the year ended March 31, 2016 decreased by ¥17,547 million ($155,283 thou-sand). The impact on the consolidated statement of income for the year ended March 31, 2016 was insignificant. In the consolidated statement of cash flows for the year ended March 31, 2016, cash flows from the acquisition or dis-posal of the shares of subsidiaries with no changes in the scope of consolidation were included in “Cash flows from financing activities” and cash flows from acquisition-related costs of the shares of subsidiaries with changes in the scope of consolida-tion or costs related to the acquisition or disposal of the shares of subsidiaries with no changes in the scope of consolidation were included in “Cash flows from operating activities.” In the consolidated statement of changes in net assets for the year ended March 31, 2016, capital surplus at the end of the year ended March 31, 2016 decreased by ¥17,547 million ($155,283 thousand). Net assets per share decreased by ¥9.99 ($0.09) while the impact on net income per share and diluted net income per share was insignificant.
o) Standards Issued but Not Yet AdoptedImplementation Guidance on Recoverability of Deferred Tax Assets On March 28, 2016, the ASBJ issued “Revised Implementation Guidance on Recoverability of Deferred Tax Assets” (ASBJ Guidance No. 26).
(1) OverviewRegarding the treatment of the recoverability of deferred tax assets, a review was conducted following the framework of the Japanese Institute of Certified Public Accountants Audit Committee Report No. 66 “Audit Treatment on Determining the Recoverability of Deferred Tax Assets,” whereby com-panies are categorized into five categories and deferred tax assets are calculated based on each of these categories.(i) Treatment of companies that do not satisfy any of the cat-
egory requirements for (Category 1) through (Category 5) (ii) Category requirements for (Category 2) and (Category 3) (iii) Treatment related to future deductible temporary dif-
ferences which cannot be scheduled in companies that
qualify as (Category 2)(iv) Treatment related to the reasonable estimable period
of future pre-adjusted taxable income in companies that qualify as (Category 3)
(v) Treatment in cases that companies that satisfy the category requirements for (Category 4) but qualify as (Category 2) or (Category 3)
(2) Scheduled Date of AdoptionThe Company expects to adopt the revised implementation guidance from the beginning of the year ending March 31, 2017.
(3) Impact of Adopting Revised Implementation GuidanceThe impact of adopting the revised implementation guid-ance on the consolidated financial statements is currently under evaluation.
p) Changes in Accounting EstimateWhen accounting for retirement benefits, actuarial gains and losses and past service costs were previously amortized pri-marily over 14 years but are now amortized primarily over 13 years, effective from the year ended March 31, 2016, due to a decrease in the employees’ average remaining years of service. The impact of this change on the consolidated statement of income for the year ended March 31, 2016 was insignificant.
q) Changes in Accounting Period of Consolidated Subsidiaries
For consolidated subsidiaries having a year-end date of December 31, the relevant computations in previous fis-cal years were made on the basis of the subsidiaries‘ year-end date, while their major transactions carried out during the period between such date and the Company’s year-end date were addressed with necessary adjustments for the purpose of consolidation in preparing the consolidated financial state-ments. From among these subsidiaries, however, effective from the year ended March 31, 2016, Toray Advanced Materials Korea Inc. and 33 subsidiaries have changed their year-end date to March 31, and the relevant computations have been made for Toray Fibers (Nantong) Co., Ltd. and 18 subsidiaries on the basis of a provisional settlement of accounts as of the Company’s year-end date equivalent to a regular settlement of accounts. For consolidated subsidiaries having a year-end date of September 30, the relevant computations in previous fiscal years were made on the basis of a provisional settle-ment of accounts as of December 31 equivalent to a regular settlement of accounts, while their major transactions carried out during the period between such date and the Company’s year-end date were addressed with necessary adjustments for the purpose of consolidation in preparing the consolidated financial statements. Effective from the year ended March 31, 2016, however, Zoltek Companies, Inc. and 7 subsidiaries have changed their year-end date to March 31. Net income or loss of these subsidiaries during the period between January 1, 2015 and March 31, 2015 was adjusted on a net basis as a decrease in retained earnings in the consoli-dated financial statements for the year ended March 31, 2016.
70
Tora
y In
dust
ries,
Inc.
Ann
ual R
epor
t 20
16
3. INVENTORIES
At March 31, 2016 and 2015, inventories consisted of the following:Millions of yen
Thousands ofU.S. dollars
2016 2015 2016
Merchandise and finished goods ¥ 229,199 ¥ 220,763 $ 2,028,310
Work in process 75,992 78,606 672,496
Raw materials and supplies 88,843 92,260 786,221
¥ 394,034 ¥ 391,629 $ 3,487,027
Millions of yenThousands ofU.S. dollars
2016 2015 2016
Loans principally from banks and insurance companies with interest rates primarily from 0.04% to 11.50%, maturing serially through 2026:
Unsecured ¥ 418,581 ¥ 408,025 $ 3,704,257
Secured 255 — 2,257
Lease obligations maturing serially through 2028:
Unsecured 3,437 4,857 30,416
Yen notes with an interest rate of 0.42% due 2018 20 30 177
Yen notes with an interest rate of 0.93% due 2022 20,000 20,000 176,991
Yen notes with an interest rate of 1.01% due 2023 20,000 20,000 176,991
Zero coupon convertible bonds due 2019 50,000 50,000 442,478
Zero coupon convertible bonds due 2021 50,000 50,000 442,478
562,293 552,912 4,976,044
Less amounts due within one year 49,558 58,608 438,566
¥ 512,735 ¥ 494,304 $ 4,537,478
Losses recognized and charged to cost of sales as a result of valuation at March 31, 2016 and 2015 were ¥6,443 million ($57,018 thousand) and ¥2,193 million, respectively.
4. SHORT-TERM BANK LOANS, LONG-TERM DEBT AND LEASE OBLIGATIONS
Short-term bank loans at March 31, 2016 and 2015 represented bank overdrafts and short-term notes. The Company is not required to pay commitment fees on unused balances of the bank overdraft agreements.
Long-term debt and lease obligations at March 31, 2016 and 2015 were as follows:
At March 31, 2016, assets pledged as collateral were as follows:
Millions of yenThousands ofU.S. dollars
Time deposits ¥ 774 $ 6,850
Property, plant and equipment, net 7,072 62,584
Investment securities 799 7,071
Others 512 4,531
¥ 9,157 $ 81,035
2. U.S. DOLLAR AMOUNTS
The Company and its domestic consolidated subsidiaries maintain their accounting records in yen. The U.S. dollar amounts included in the accompanying consolidated financial statements and notes thereto represent the arithmetic results of translating yen into U.S. dollars at the rate of ¥113 to $1.00, the approximate exchange
rate prevailing on March 31, 2016. The inclusion of such U.S. dol-lar amounts is solely for the convenience of readers outside Japan and is not intended to imply that yen amounts and assets and liabil-ities that originated in yen have been or could be readily converted, realized or settled in U.S. dollars at this or at any other rate.
71
Tora
y In
dust
ries,
Inc.
Ann
ual R
epor
t 20
16
Millions of yenThousands ofU.S. dollars
Years ending March 31:
2017 ¥ 49,558 $ 438,566
2018 113,013 1,000,115
2019 48,914 432,867
2020 57,803 511,531
2021 60,642 536,655
2022 and thereafter 232,363 2,056,310
¥ 562,293 $ 4,976,044
The annual maturities of long-term debt and lease obligations subsequent to March 31, 2016 were as follows:
5. FINANCIAL INSTRUMENTS
Conditions of Financial Instrumentsa) Policy in Relation to Financial InstrumentsThe policy of the Company and its consolidated subsidiaries is to manage funds only by short-term deposits, etc. and to raise funds by borrowing from banks and issuing corporate bonds. The Company and its consolidated subsidiaries use derivatives to hedge risks associated with foreign currency exchange rates and fluctuations of borrowing interest rates and do not enter into derivative transactions for speculative or trading purposes.
b) Contents and Risk of Financial Instruments and Risk Management System
Trade receivables are operating receivables and therefore are exposed to customer credit risk. Under its internal regulations, the Company carefully manages the payment periods for receiv-ables and outstanding balances of all customers and regularly monitors the credit standing of major clients. Consolidated sub-sidiaries also monitor and manage the credit standings of their clients. Operating receivables and payables denominated in foreign currencies that arise from the global business opera-tions are also exposed to foreign currency exchange risk. The Company and its consolidated subsidiaries hedge this risk mainly through the use of forward exchange contracts against positions after netting receivables and payables denominated in the same foreign currencies. Likewise, the Company and its consolidated subsidiaries mainly use currency swaps to hedge the foreign currency exchange risk of bank loans denominated in foreign currencies. Investment securities are mostly the shares of corpora-tions with which the Group has business relationships and are exposed to the risk of market price fluctuations. The fair value of the investment securities and financial positions of the issuing entities (clients) are regularly monitored. Trade payables are operating payables, most of which are due and payable within one year.
Short-term bank loans and commercial paper are financing instruments mainly for operating transactions, while long-term bank loans and bonds (due within ten years, in principle) are primarily for capital expenditures. Bank loans and bonds are exposed to the risk of interest rate fluctuation. Bank loans and bonds at floating interest rates carry the risk of higher inter-est expenses when rates rise, while bank loans and bonds at fixed interest rates carry the risk of higher interest expenses when rates fall. The Company and its consolidated subsidiar-ies use derivative transactions (interest rate swap transactions) to minimize the risk of interest rate fluctuation, taking into con-sideration the balance between fixed interest rates and floating interest rates. Hedging instruments, hedged items, the policy for uti-lizing such hedging instruments and the method for evalu-ating the effectiveness of hedging activities are described in Note 1. SIGNIFICANT ACCOUNTING POLICIES d) Financial Instruments, Hedge Accounting in the Notes to the Consolidated Financial Statements. Derivative transactions are executed and managed in accor-dance with the internal regulations prescribing the authorization for transactions. To mitigate credit risk, the Company and its consolidated subsidiaries carry out derivative transactions only with highly rated financial institutions.
c) Supplemental Explanation on Fair Value of Financial Instruments
The fair value of financial instruments is based on market prices, or reasonable estimate of fair value for instruments for which market prices are not available. Estimates of fair value are subject to fluctuation because they employ various factors and assumptions. In addition, the contract amount of deriva-tives in Note 7. DERIVATIVES in the Notes to the Consolidated Financial Statements is not an indicator of market risk associ-ated with derivative transactions.
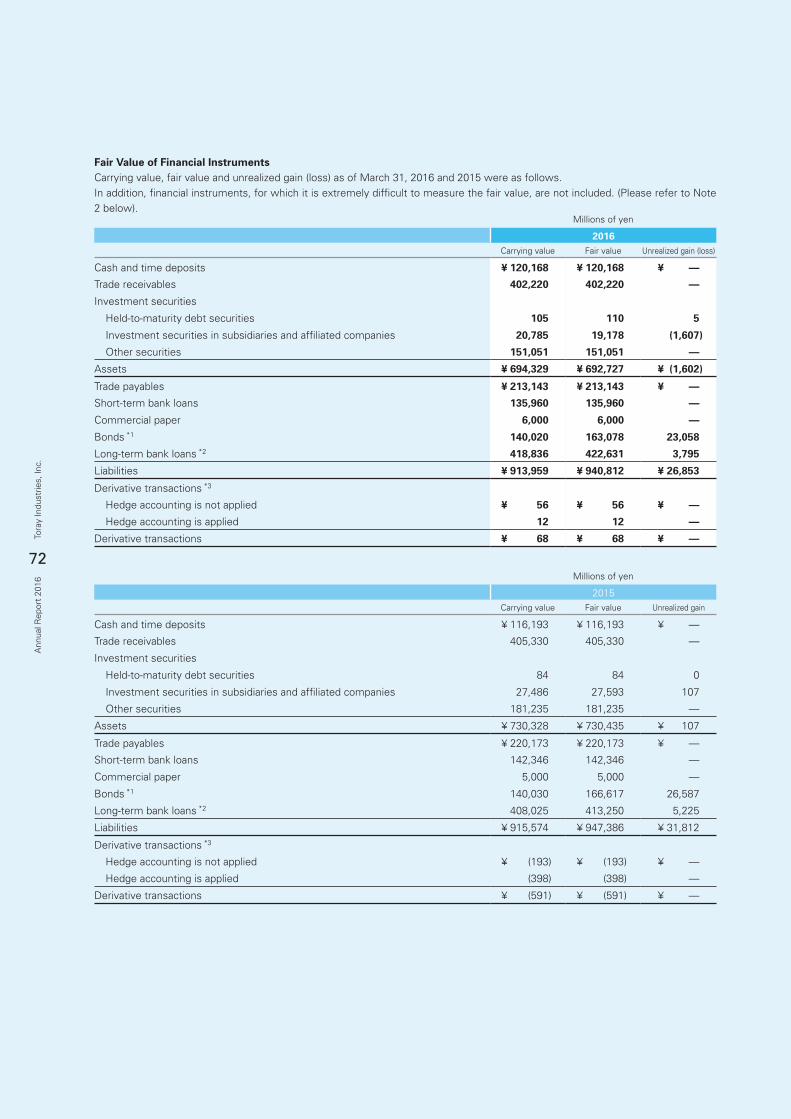
72
Tora
y In
dust
ries,
Inc.
Ann
ual R
epor
t 20
16
Fair Value of Financial InstrumentsCarrying value, fair value and unrealized gain (loss) as of March 31, 2016 and 2015 were as follows.In addition, financial instruments, for which it is extremely difficult to measure the fair value, are not included. (Please refer to Note 2 below).
Millions of yen
2016Carrying value Fair value Unrealized gain (loss)
Cash and time deposits ¥ 120,168 ¥ 120,168 ¥ —
Trade receivables 402,220 402,220 —
Investment securities
Held-to-maturity debt securities 105 110 5
Investment securities in subsidiaries and affiliated companies 20,785 19,178 (1,607)
Other securities 151,051 151,051 —
Assets ¥ 694,329 ¥ 692,727 ¥ (1,602)
Trade payables ¥ 213,143 ¥ 213,143 ¥ —
Short-term bank loans 135,960 135,960 —
Commercial paper 6,000 6,000 —
Bonds *1 140,020 163,078 23,058
Long-term bank loans *2 418,836 422,631 3,795
Liabilities ¥ 913,959 ¥ 940,812 ¥ 26,853
Derivative transactions *3
Hedge accounting is not applied ¥ 56 ¥ 56 ¥ —
Hedge accounting is applied 12 12 —
Derivative transactions ¥ 68 ¥ 68 ¥ —
Millions of yen
2015Carrying value Fair value Unrealized gain
Cash and time deposits ¥ 116,193 ¥ 116,193 ¥ —
Trade receivables 405,330 405,330 —
Investment securities
Held-to-maturity debt securities 84 84 0
Investment securities in subsidiaries and affiliated companies 27,486 27,593 107
Other securities 181,235 181,235 —
Assets ¥ 730,328 ¥ 730,435 ¥ 107
Trade payables ¥ 220,173 ¥ 220,173 ¥ —
Short-term bank loans 142,346 142,346 —
Commercial paper 5,000 5,000 —
Bonds *1 140,030 166,617 26,587
Long-term bank loans *2 408,025 413,250 5,225
Liabilities ¥ 915,574 ¥ 947,386 ¥ 31,812
Derivative transactions *3
Hedge accounting is not applied ¥ (193) ¥ (193) ¥ —
Hedge accounting is applied (398) (398) —
Derivative transactions ¥ (591) ¥ (591) ¥ —
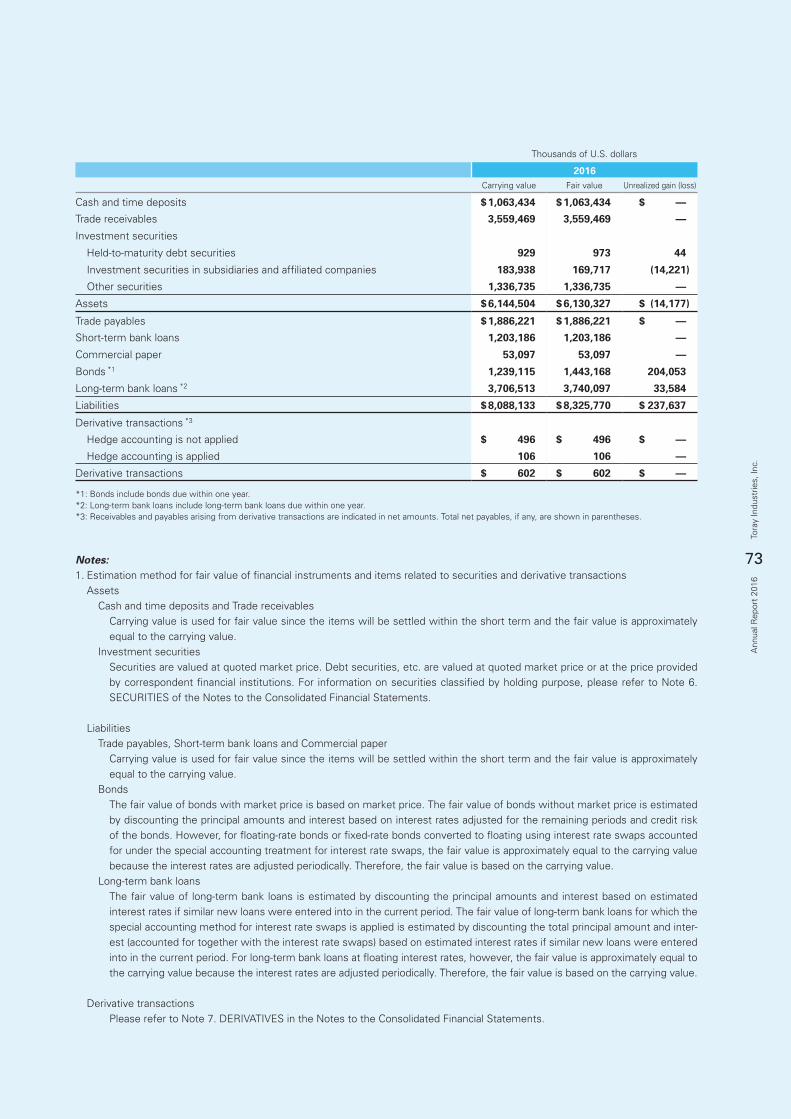
73
Tora
y In
dust
ries,
Inc.
Ann
ual R
epor
t 20
16
Thousands of U.S. dollars
2016Carrying value Fair value Unrealized gain (loss)
Cash and time deposits $ 1,063,434 $ 1,063,434 $ —
Trade receivables 3,559,469 3,559,469 —
Investment securities
Held-to-maturity debt securities 929 973 44
Investment securities in subsidiaries and affiliated companies 183,938 169,717 (14,221)
Other securities 1,336,735 1,336,735 —
Assets $ 6,144,504 $ 6,130,327 $ (14,177)
Trade payables $ 1,886,221 $ 1,886,221 $ —
Short-term bank loans 1,203,186 1,203,186 —
Commercial paper 53,097 53,097 —
Bonds *1 1,239,115 1,443,168 204,053
Long-term bank loans *2 3,706,513 3,740,097 33,584
Liabilities $ 8,088,133 $ 8,325,770 $ 237,637
Derivative transactions *3
Hedge accounting is not applied $ 496 $ 496 $ —
Hedge accounting is applied 106 106 —
Derivative transactions $ 602 $ 602 $ —
*1: Bonds include bonds due within one year.*2: Long-term bank loans include long-term bank loans due within one year.*3: Receivables and payables arising from derivative transactions are indicated in net amounts. Total net payables, if any, are shown in parentheses.
Notes:1. Estimation method for fair value of financial instruments and items related to securities and derivative transactions Assets Cash and time deposits and Trade receivables
Carrying value is used for fair value since the items will be settled within the short term and the fair value is approximately equal to the carrying value.
Investment securitiesSecurities are valued at quoted market price. Debt securities, etc. are valued at quoted market price or at the price provided by correspondent financial institutions. For information on securities classified by holding purpose, please refer to Note 6. SECURITIES of the Notes to the Consolidated Financial Statements.
Liabilities Trade payables, Short-term bank loans and Commercial paper
Carrying value is used for fair value since the items will be settled within the short term and the fair value is approximately equal to the carrying value.
BondsThe fair value of bonds with market price is based on market price. The fair value of bonds without market price is estimated by discounting the principal amounts and interest based on interest rates adjusted for the remaining periods and credit risk of the bonds. However, for floating-rate bonds or fixed-rate bonds converted to floating using interest rate swaps accounted for under the special accounting treatment for interest rate swaps, the fair value is approximately equal to the carrying value because the interest rates are adjusted periodically. Therefore, the fair value is based on the carrying value.
Long-term bank loansThe fair value of long-term bank loans is estimated by discounting the principal amounts and interest based on estimated interest rates if similar new loans were entered into in the current period. The fair value of long-term bank loans for which the special accounting method for interest rate swaps is applied is estimated by discounting the total principal amount and inter-est (accounted for together with the interest rate swaps) based on estimated interest rates if similar new loans were entered into in the current period. For long-term bank loans at floating interest rates, however, the fair value is approximately equal to the carrying value because the interest rates are adjusted periodically. Therefore, the fair value is based on the carrying value.
Derivative transactions Please refer to Note 7. DERIVATIVES in the Notes to the Consolidated Financial Statements.
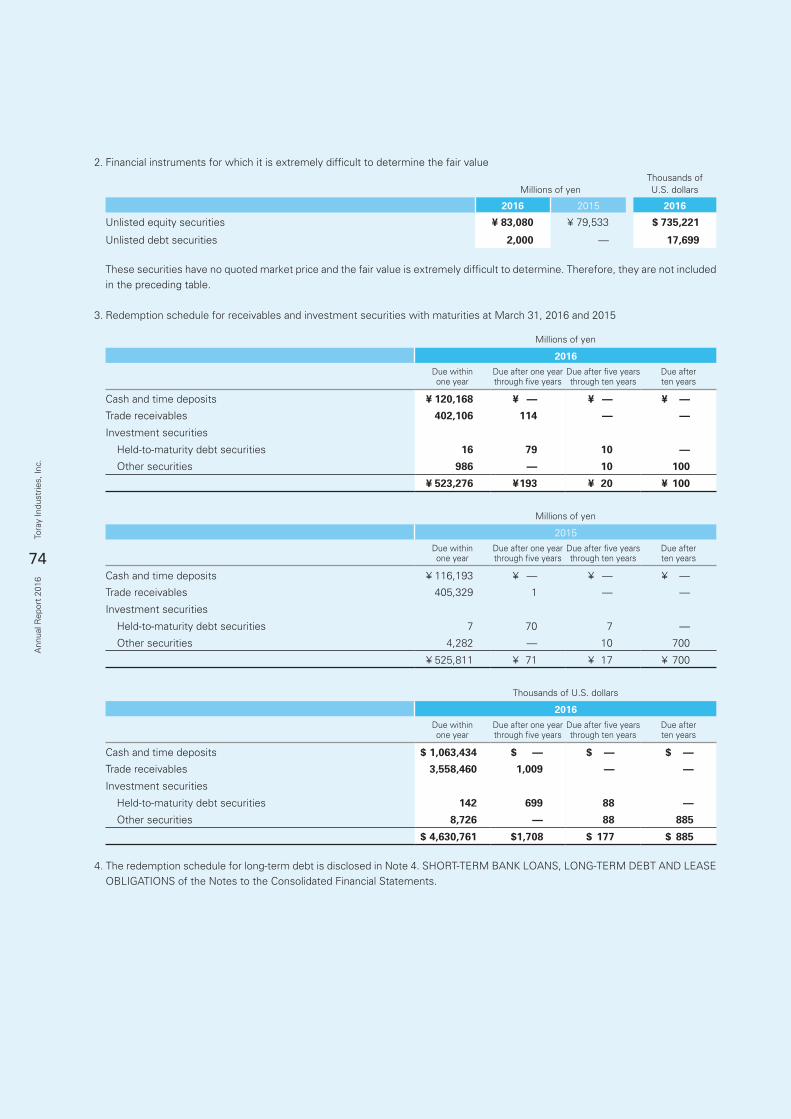
74
Tora
y In
dust
ries,
Inc.
Ann
ual R
epor
t 20
16
2. Financial instruments for which it is extremely difficult to determine the fair value
Millions of yenThousands ofU.S. dollars
2016 2015 2016
Unlisted equity securities ¥ 83,080 ¥ 79,533 $ 735,221
Unlisted debt securities 2,000 — 17,699
These securities have no quoted market price and the fair value is extremely difficult to determine. Therefore, they are not included in the preceding table.
3. Redemption schedule for receivables and investment securities with maturities at March 31, 2016 and 2015
Millions of yen
2016Due withinone year
Due after one year through five years
Due after five yearsthrough ten years
Due afterten years
Cash and time deposits ¥ 120,168 ¥ — ¥ — ¥ —
Trade receivables 402,106 114 — —
Investment securities
Held-to-maturity debt securities 16 79 10 —
Other securities 986 — 10 100
¥ 523,276 ¥ 193 ¥ 20 ¥ 100
Thousands of U.S. dollars
2016Due withinone year
Due after one year through five years
Due after five yearsthrough ten years
Due afterten years
Cash and time deposits $ 1,063,434 $ — $ — $ —
Trade receivables 3,558,460 1,009 — —
Investment securities
Held-to-maturity debt securities 142 699 88 —
Other securities 8,726 — 88 885
$ 4,630,761 $ 1,708 $ 177 $ 885
Millions of yen
2015Due withinone year
Due after one year through five years
Due after five yearsthrough ten years
Due afterten years
Cash and time deposits ¥ 116,193 ¥ — ¥ — ¥ —
Trade receivables 405,329 1 — —
Investment securities
Held-to-maturity debt securities 7 70 7 —
Other securities 4,282 — 10 700
¥ 525,811 ¥ 71 ¥ 17 ¥ 700
4. The redemption schedule for long-term debt is disclosed in Note 4. SHORT-TERM BANK LOANS, LONG-TERM DEBT AND LEASE OBLIGATIONS of the Notes to the Consolidated Financial Statements.
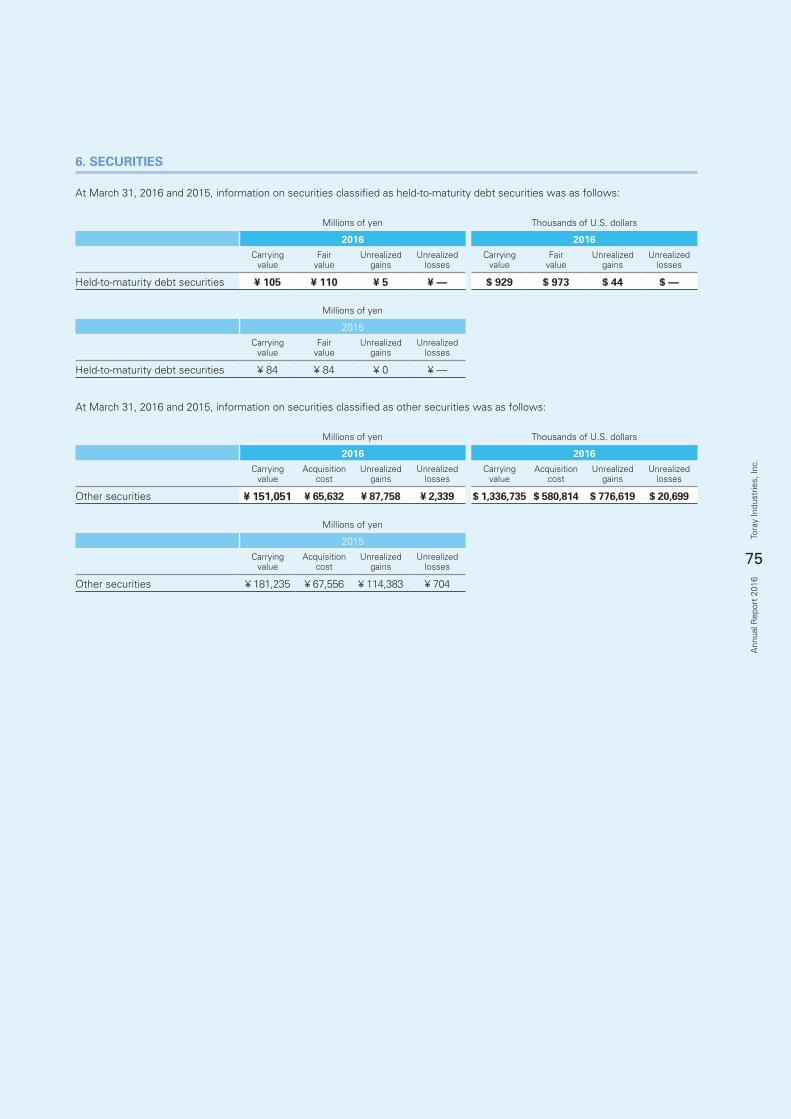
75
Tora
y In
dust
ries,
Inc.
Ann
ual R
epor
t 20
16
6. SECURITIES
At March 31, 2016 and 2015, information on securities classified as held-to-maturity debt securities was as follows:
Millions of yen Thousands of U.S. dollars
2016 2016Carrying
valueFair
valueUnrealized
gainsUnrealized
lossesCarrying
valueFair
valueUnrealized
gainsUnrealized
losses
Held-to-maturity debt securities ¥ 105 ¥ 110 ¥ 5 ¥ — $ 929 $ 973 $ 44 $ —
Millions of yen Thousands of U.S. dollars
2016 2016Carrying
valueAcquisition
costUnrealized
gainsUnrealized
lossesCarrying
valueAcquisition
costUnrealized
gainsUnrealized
losses
Other securities ¥ 151,051 ¥ 65,632 ¥ 87,758 ¥ 2,339 $ 1,336,735 $ 580,814 $ 776,619 $ 20,699
Millions of yen
2015Carrying
valueFair
valueUnrealized
gainsUnrealized
losses
Held-to-maturity debt securities ¥ 84 ¥ 84 ¥ 0 ¥ —
Millions of yen
2015Carrying
valueAcquisition
costUnrealized
gainsUnrealized
losses
Other securities ¥ 181,235 ¥ 67,556 ¥ 114,383 ¥ 704
At March 31, 2016 and 2015, information on securities classified as other securities was as follows:
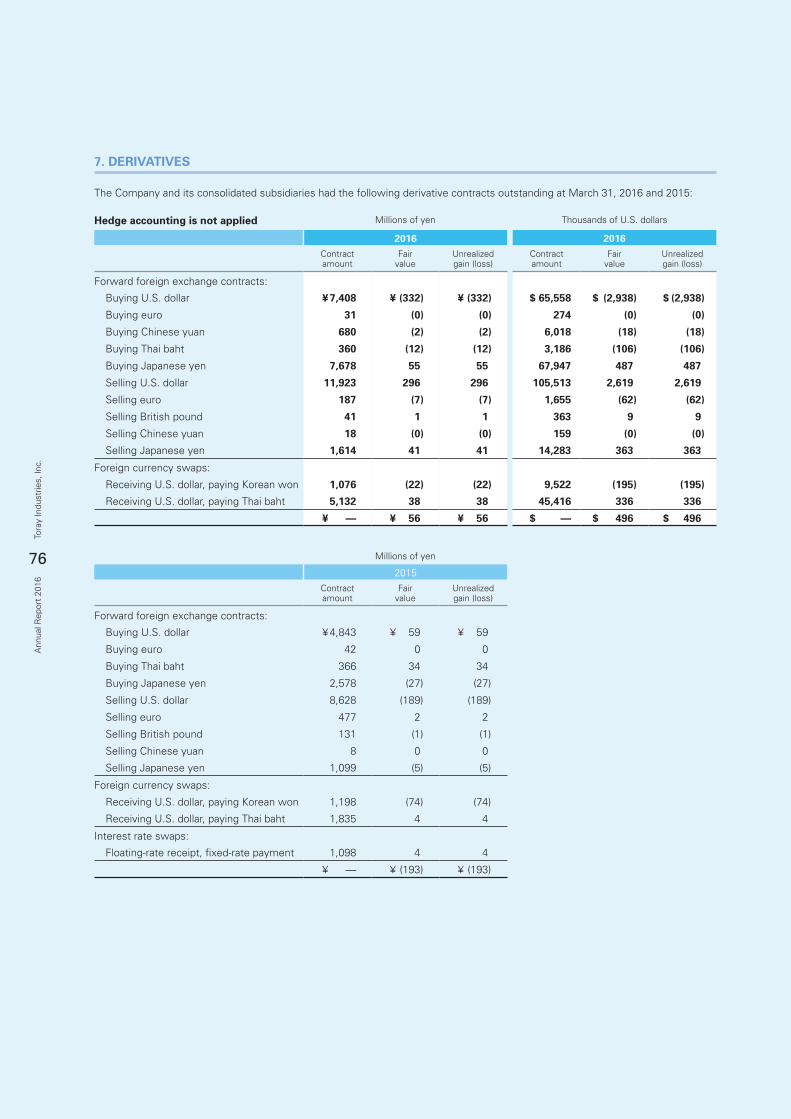
76
Tora
y In
dust
ries,
Inc.
Ann
ual R
epor
t 20
16
Hedge accounting is not applied Millions of yen Thousands of U.S. dollars
2016 2016Contractamount
Fairvalue
Unrealizedgain (loss)
Contractamount
Fairvalue
Unrealizedgain (loss)
Forward foreign exchange contracts:
Buying U.S. dollar ¥ 7,408 ¥ (332) ¥ (332) $ 65,558 $ (2,938) $ (2,938)
Buying euro 31 (0) (0) 274 (0) (0)
Buying Chinese yuan 680 (2) (2) 6,018 (18) (18)
Buying Thai baht 360 (12) (12) 3,186 (106) (106)
Buying Japanese yen 7,678 55 55 67,947 487 487
Selling U.S. dollar 11,923 296 296 105,513 2,619 2,619
Selling euro 187 (7) (7) 1,655 (62) (62)
Selling British pound 41 1 1 363 9 9
Selling Chinese yuan 18 (0) (0) 159 (0) (0)
Selling Japanese yen 1,614 41 41 14,283 363 363
Foreign currency swaps:
Receiving U.S. dollar, paying Korean won 1,076 (22) (22) 9,522 (195) (195)
Receiving U.S. dollar, paying Thai baht 5,132 38 38 45,416 336 336
¥ — ¥ 56 ¥ 56 $ — $ 496 $ 496
Millions of yen
2015Contractamount
Fairvalue
Unrealizedgain (loss)
Forward foreign exchange contracts:
Buying U.S. dollar ¥ 4,843 ¥ 59 ¥ 59
Buying euro 42 0 0
Buying Thai baht 366 34 34
Buying Japanese yen 2,578 (27) (27)
Selling U.S. dollar 8,628 (189) (189)
Selling euro 477 2 2
Selling British pound 131 (1) (1)
Selling Chinese yuan 8 0 0
Selling Japanese yen 1,099 (5) (5)
Foreign currency swaps:
Receiving U.S. dollar, paying Korean won 1,198 (74) (74)
Receiving U.S. dollar, paying Thai baht 1,835 4 4
Interest rate swaps:
Floating-rate receipt, fixed-rate payment 1,098 4 4
¥ — ¥ (193) ¥ (193)
7. DERIVATIVES
The Company and its consolidated subsidiaries had the following derivative contracts outstanding at March 31, 2016 and 2015:
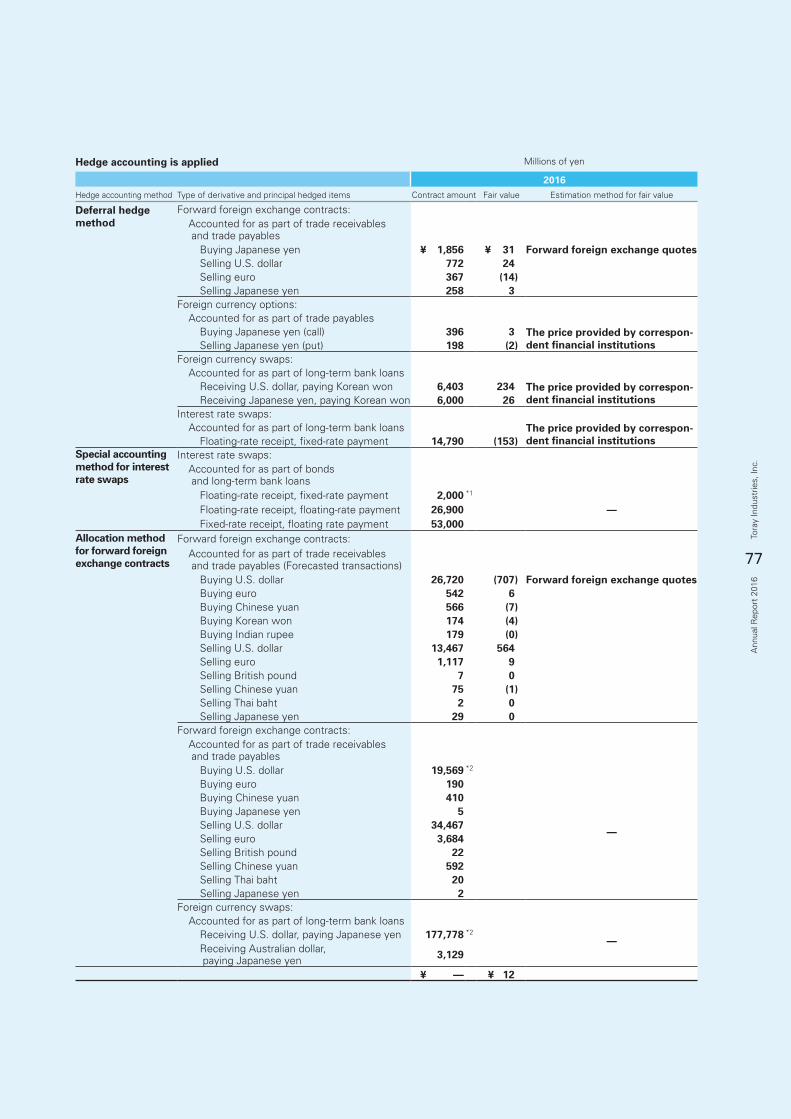
77
Tora
y In
dust
ries,
Inc.
Ann
ual R
epor
t 20
16
Hedge accounting is applied Millions of yen
2016Hedge accounting method Type of derivative and principal hedged items Contract amount Fair value Estimation method for fair value
Deferral hedgemethod
Forward foreign exchange contracts: Accounted for as part of trade receivables and trade payables Buying Japanese yen ¥ 1,856 ¥ 31 Forward foreign exchange quotes Selling U.S. dollar 772 24 Selling euro 367 (14) Selling Japanese yen 258 3 Foreign currency options: Accounted for as part of trade payables Buying Japanese yen (call) 396 3 The price provided by correspon-
dent financial institutions Selling Japanese yen (put) 198 (2)Foreign currency swaps: Accounted for as part of long-term bank loans Receiving U.S. dollar, paying Korean won 6,403 234 The price provided by correspon-
dent financial institutions Receiving Japanese yen, paying Korean won 6,000 26 Interest rate swaps: Accounted for as part of long-term bank loans The price provided by correspon-
dent financial institutions Floating-rate receipt, fixed-rate payment 14,790 (153)Special accountingmethod for interestrate swaps
Interest rate swaps: Accounted for as part of bonds and long-term bank loans Floating-rate receipt, fixed-rate payment 2,000 *1
— Floating-rate receipt, floating-rate payment 26,900 Fixed-rate receipt, floating rate payment 53,000
Allocation methodfor forward foreignexchange contracts
Forward foreign exchange contracts: Accounted for as part of trade receivables and trade payables (Forecasted transactions) Buying U.S. dollar 26,720 (707) Forward foreign exchange quotes Buying euro 542 6 Buying Chinese yuan 566 (7) Buying Korean won 174 (4) Buying Indian rupee 179 (0) Selling U.S. dollar 13,467 564 Selling euro 1,117 9 Selling British pound 7 0 Selling Chinese yuan 75 (1) Selling Thai baht 2 0 Selling Japanese yen 29 0 Forward foreign exchange contracts: Accounted for as part of trade receivables and trade payables Buying U.S. dollar 19,569 *2
—
Buying euro 190 Buying Chinese yuan 410 Buying Japanese yen 5 Selling U.S. dollar 34,467 Selling euro 3,684 Selling British pound 22 Selling Chinese yuan 592 Selling Thai baht 20 Selling Japanese yen 2Foreign currency swaps: Accounted for as part of long-term bank loans
— Receiving U.S. dollar, paying Japanese yen 177,778 *2
Receiving Australian dollar, paying Japanese yen 3,129
¥ — ¥ 12
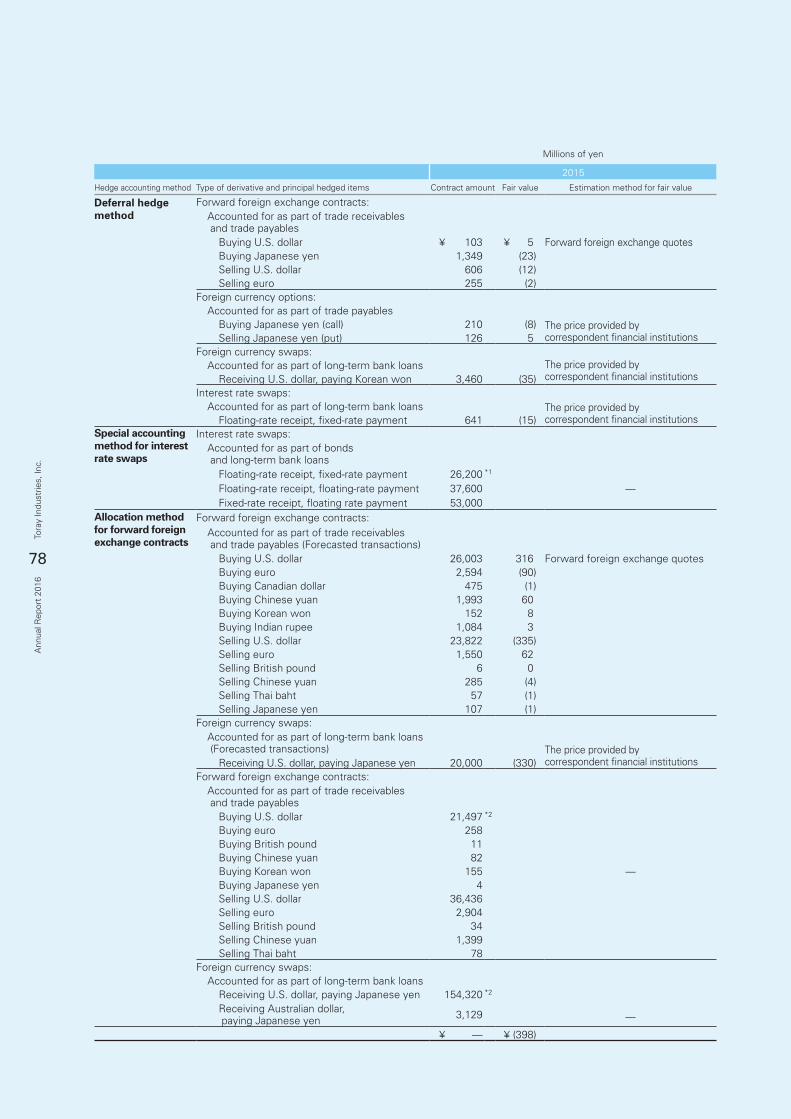
78
Tora
y In
dust
ries,
Inc.
Ann
ual R
epor
t 20
16
Millions of yen
2015Hedge accounting method Type of derivative and principal hedged items Contract amount Fair value Estimation method for fair value
Deferral hedgemethod
Forward foreign exchange contracts: Accounted for as part of trade receivables and trade payables Buying U.S. dollar ¥ 103 ¥ 5 Forward foreign exchange quotes Buying Japanese yen 1,349 (23) Selling U.S. dollar 606 (12) Selling euro 255 (2)Foreign currency options: Accounted for as part of trade payables Buying Japanese yen (call) 210 (8) The price provided by
correspondent financial institutions Selling Japanese yen (put) 126 5Foreign currency swaps: Accounted for as part of long-term bank loans The price provided by
correspondent financial institutions Receiving U.S. dollar, paying Korean won 3,460 (35)Interest rate swaps: Accounted for as part of long-term bank loans The price provided by
correspondent financial institutions Floating-rate receipt, fixed-rate payment 641 (15)Special accountingmethod for interestrate swaps
Interest rate swaps: Accounted for as part of bonds and long-term bank loans Floating-rate receipt, fixed-rate payment 26,200 *1
Floating-rate receipt, floating-rate payment 37,600 — Fixed-rate receipt, floating rate payment 53,000
Allocation methodfor forward foreignexchange contracts
Forward foreign exchange contracts: Accounted for as part of trade receivables and trade payables (Forecasted transactions) Buying U.S. dollar 26,003 316 Forward foreign exchange quotes Buying euro 2,594 (90) Buying Canadian dollar 475 (1) Buying Chinese yuan 1,993 60 Buying Korean won 152 8 Buying Indian rupee 1,084 3 Selling U.S. dollar 23,822 (335) Selling euro 1,550 62 Selling British pound 6 0 Selling Chinese yuan 285 (4) Selling Thai baht 57 (1) Selling Japanese yen 107 (1)Foreign currency swaps: Accounted for as part of long-term bank loans (Forecasted transactions) The price provided by
correspondent financial institutions Receiving U.S. dollar, paying Japanese yen 20,000 (330)Forward foreign exchange contracts: Accounted for as part of trade receivables and trade payables Buying U.S. dollar 21,497 *2
Buying euro 258 Buying British pound 11 Buying Chinese yuan 82 Buying Korean won 155 — Buying Japanese yen 4 Selling U.S. dollar 36,436 Selling euro 2,904 Selling British pound 34 Selling Chinese yuan 1,399 Selling Thai baht 78Foreign currency swaps: Accounted for as part of long-term bank loans Receiving U.S. dollar, paying Japanese yen 154,320 *2
Receiving Australian dollar, paying Japanese yen 3,129 —
¥ — ¥ (398)
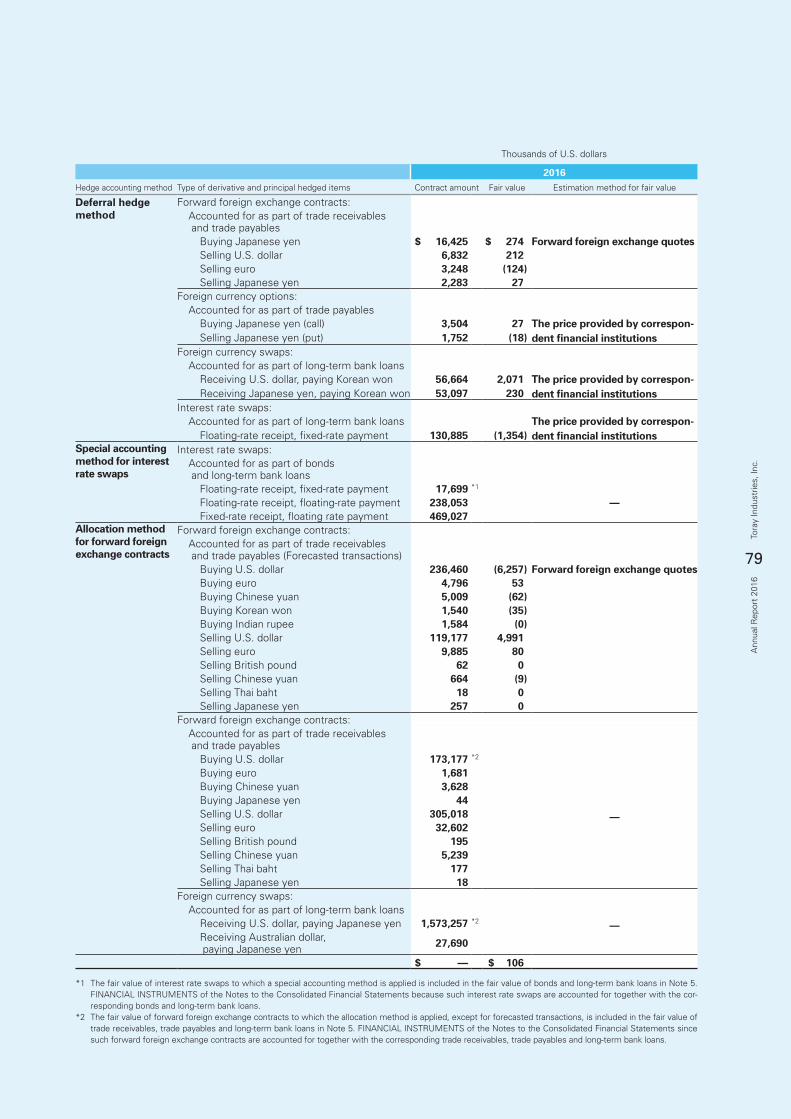
79
Tora
y In
dust
ries,
Inc.
Ann
ual R
epor
t 20
16
*1 The fair value of interest rate swaps to which a special accounting method is applied is included in the fair value of bonds and long-term bank loans in Note 5. FINANCIAL INSTRUMENTS of the Notes to the Consolidated Financial Statements because such interest rate swaps are accounted for together with the cor-responding bonds and long-term bank loans.
*2 The fair value of forward foreign exchange contracts to which the allocation method is applied, except for forecasted transactions, is included in the fair value of trade receivables, trade payables and long-term bank loans in Note 5. FINANCIAL INSTRUMENTS of the Notes to the Consolidated Financial Statements since such forward foreign exchange contracts are accounted for together with the corresponding trade receivables, trade payables and long-term bank loans.
Thousands of U.S. dollars
2016Hedge accounting method Type of derivative and principal hedged items Contract amount Fair value Estimation method for fair value
Deferral hedgemethod
Forward foreign exchange contracts: Accounted for as part of trade receivables and trade payables Buying Japanese yen $ 16,425 $ 274 Forward foreign exchange quotes Selling U.S. dollar 6,832 212 Selling euro 3,248 (124) Selling Japanese yen 2,283 27 Foreign currency options: Accounted for as part of trade payables Buying Japanese yen (call) 3,504 27 The price provided by correspon-
dent financial institutions Selling Japanese yen (put) 1,752 (18)Foreign currency swaps: Accounted for as part of long-term bank loans Receiving U.S. dollar, paying Korean won 56,664 2,071 The price provided by correspon-
dent financial institutions Receiving Japanese yen, paying Korean won 53,097 230 Interest rate swaps: Accounted for as part of long-term bank loans The price provided by correspon-
dent financial institutions Floating-rate receipt, fixed-rate payment 130,885 (1,354)Special accountingmethod for interestrate swaps
Interest rate swaps: Accounted for as part of bonds and long-term bank loans Floating-rate receipt, fixed-rate payment 17,699 *1
— Floating-rate receipt, floating-rate payment 238,053 Fixed-rate receipt, floating rate payment 469,027
Allocation methodfor forward foreignexchange contracts
Forward foreign exchange contracts: Accounted for as part of trade receivables and trade payables (Forecasted transactions) Buying U.S. dollar 236,460 (6,257) Forward foreign exchange quotes Buying euro 4,796 53 Buying Chinese yuan 5,009 (62) Buying Korean won 1,540 (35) Buying Indian rupee 1,584 (0) Selling U.S. dollar 119,177 4,991 Selling euro 9,885 80 Selling British pound 62 0 Selling Chinese yuan 664 (9) Selling Thai baht 18 0 Selling Japanese yen 257 0 Forward foreign exchange contracts: Accounted for as part of trade receivables and trade payables Buying U.S. dollar 173,177 *2
—
Buying euro 1,681 Buying Chinese yuan 3,628 Buying Japanese yen 44 Selling U.S. dollar 305,018 Selling euro 32,602 Selling British pound 195 Selling Chinese yuan 5,239 Selling Thai baht 177 Selling Japanese yen 18Foreign currency swaps: Accounted for as part of long-term bank loans
— Receiving U.S. dollar, paying Japanese yen 1,573,257 *2
Receiving Australian dollar, paying Japanese yen 27,690
$ — $ 106
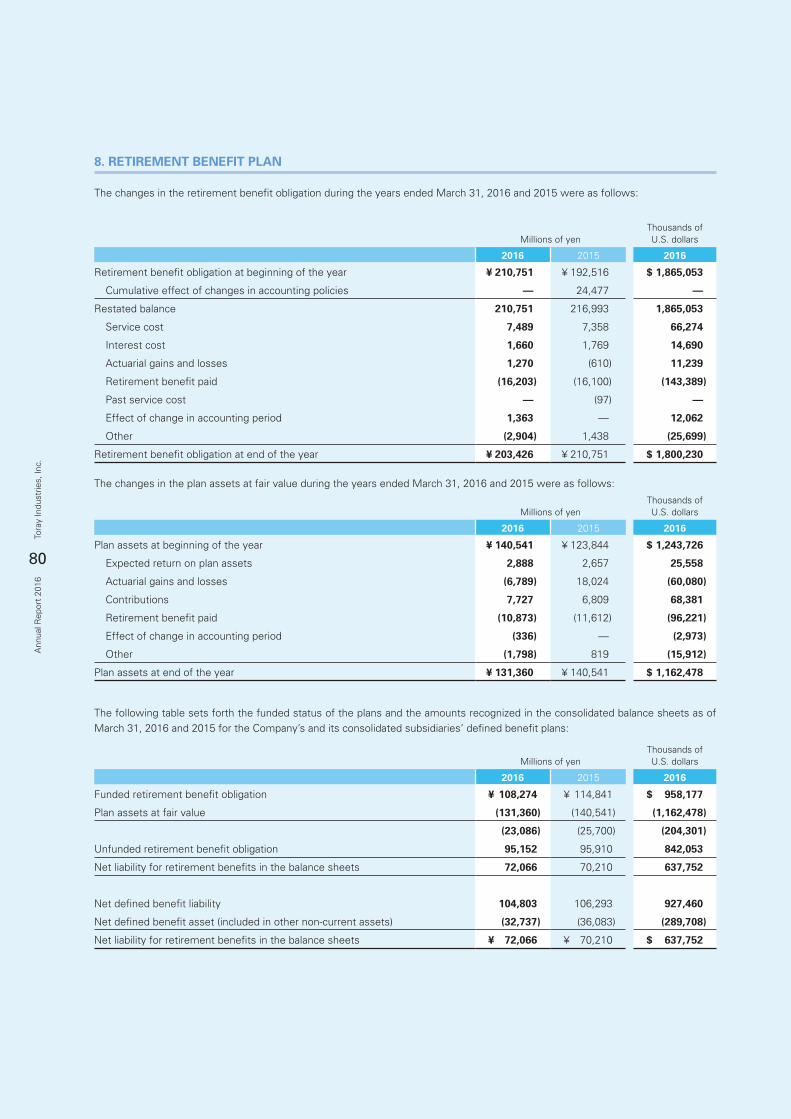
80
Tora
y In
dust
ries,
Inc.
Ann
ual R
epor
t 20
16
8. RETIREMENT BENEFIT PLAN
The changes in the retirement benefit obligation during the years ended March 31, 2016 and 2015 were as follows:
Millions of yenThousands ofU.S. dollars
2016 2015 2016
Retirement benefit obligation at beginning of the year ¥ 210,751 ¥ 192,516 $ 1,865,053
Cumulative effect of changes in accounting policies — 24,477 —
Restated balance 210,751 216,993 1,865,053
Service cost 7,489 7,358 66,274
Interest cost 1,660 1,769 14,690
Actuarial gains and losses 1,270 (610) 11,239
Retirement benefit paid (16,203) (16,100) (143,389)
Past service cost — (97) —
Effect of change in accounting period 1,363 — 12,062
Other (2,904) 1,438 (25,699)
Retirement benefit obligation at end of the year ¥ 203,426 ¥ 210,751 $ 1,800,230
Millions of yenThousands ofU.S. dollars
2016 2015 2016
Plan assets at beginning of the year ¥ 140,541 ¥ 123,844 $ 1,243,726
Expected return on plan assets 2,888 2,657 25,558
Actuarial gains and losses (6,789) 18,024 (60,080)
Contributions 7,727 6,809 68,381
Retirement benefit paid (10,873) (11,612) (96,221)
Effect of change in accounting period (336) — (2,973)
Other (1,798) 819 (15,912)
Plan assets at end of the year ¥ 131,360 ¥ 140,541 $ 1,162,478
Millions of yenThousands ofU.S. dollars
2016 2015 2016
Funded retirement benefit obligation ¥ 108,274 ¥ 114,841 $ 958,177
Plan assets at fair value (131,360) (140,541) (1,162,478)
(23,086) (25,700) (204,301)
Unfunded retirement benefit obligation 95,152 95,910 842,053
Net liability for retirement benefits in the balance sheets 72,066 70,210 637,752
Net defined benefit liability 104,803 106,293 927,460
Net defined benefit asset (included in other non-current assets) (32,737) (36,083) (289,708)
Net liability for retirement benefits in the balance sheets ¥ 72,066 ¥ 70,210 $ 637,752
The changes in the plan assets at fair value during the years ended March 31, 2016 and 2015 were as follows:
The following table sets forth the funded status of the plans and the amounts recognized in the consolidated balance sheets as of March 31, 2016 and 2015 for the Company’s and its consolidated subsidiaries’ defined benefit plans:
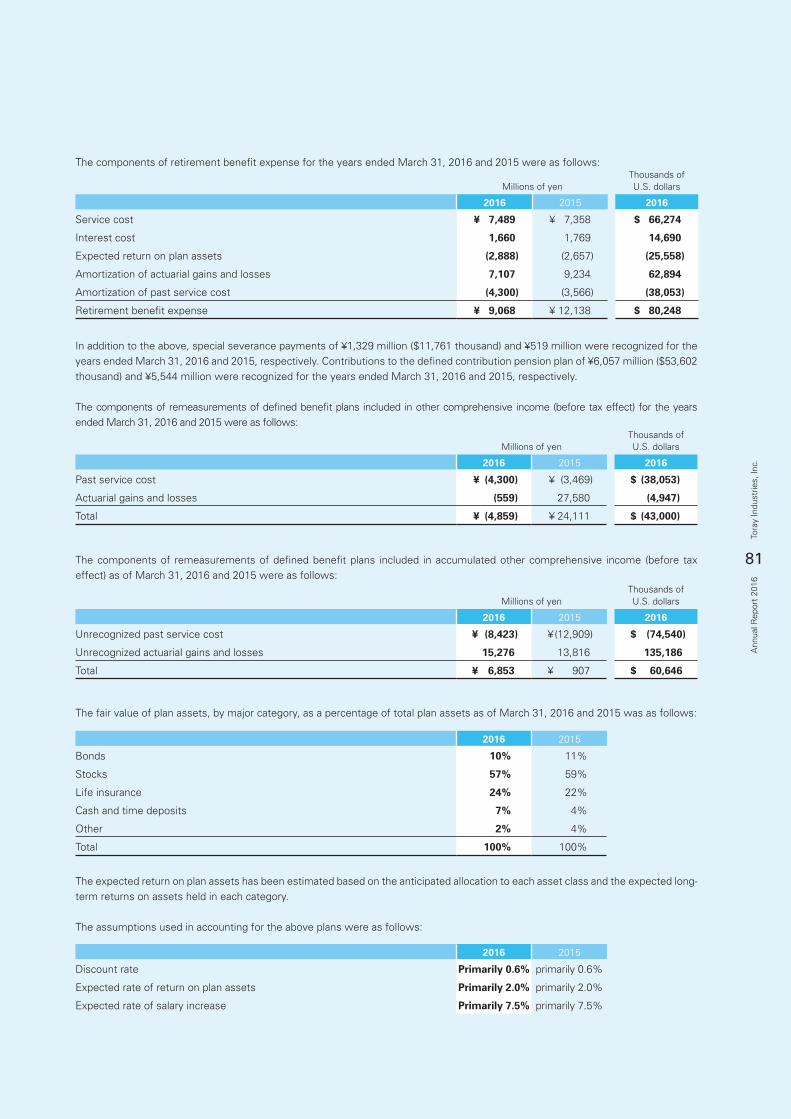
81
Tora
y In
dust
ries,
Inc.
Ann
ual R
epor
t 20
16
Millions of yenThousands ofU.S. dollars
2016 2015 2016
Past service cost ¥ (4,300) ¥ (3,469) $ (38,053)
Actuarial gains and losses (559) 27,580 (4,947)
Total ¥ (4,859) ¥ 24,111 $ (43,000)
Millions of yenThousands ofU.S. dollars
2016 2015 2016
Unrecognized past service cost ¥ (8,423) ¥ (12,909) $ (74,540)
Unrecognized actuarial gains and losses 15,276 13,816 135,186
Total ¥ 6,853 ¥ 907 $ 60,646
2016 2015
Bonds 10% 11%
Stocks 57% 59%
Life insurance 24% 22%
Cash and time deposits 7% 4%
Other 2% 4%
Total 100% 100%
2016 2015
Discount rate Primarily 0.6% primarily 0.6%
Expected rate of return on plan assets Primarily 2.0% primarily 2.0%
Expected rate of salary increase Primarily 7.5% primarily 7.5%
The components of remeasurements of defined benefit plans included in accumulated other comprehensive income (before tax effect) as of March 31, 2016 and 2015 were as follows:
The fair value of plan assets, by major category, as a percentage of total plan assets as of March 31, 2016 and 2015 was as follows:
The expected return on plan assets has been estimated based on the anticipated allocation to each asset class and the expected long-term returns on assets held in each category.
The assumptions used in accounting for the above plans were as follows:
The components of retirement benefit expense for the years ended March 31, 2016 and 2015 were as follows:
Millions of yenThousands ofU.S. dollars
2016 2015 2016
Service cost ¥ 7,489 ¥ 7,358 $ 66,274
Interest cost 1,660 1,769 14,690
Expected return on plan assets (2,888) (2,657) (25,558)
Amortization of actuarial gains and losses 7,107 9,234 62,894
Amortization of past service cost (4,300) (3,566) (38,053)
Retirement benefit expense ¥ 9,068 ¥ 12,138 $ 80,248
In addition to the above, special severance payments of ¥1,329 million ($11,761 thousand) and ¥519 million were recognized for the years ended March 31, 2016 and 2015, respectively. Contributions to the defined contribution pension plan of ¥6,057 million ($53,602 thousand) and ¥5,544 million were recognized for the years ended March 31, 2016 and 2015, respectively.
The components of remeasurements of defined benefit plans included in other comprehensive income (before tax effect) for the years ended March 31, 2016 and 2015 were as follows:
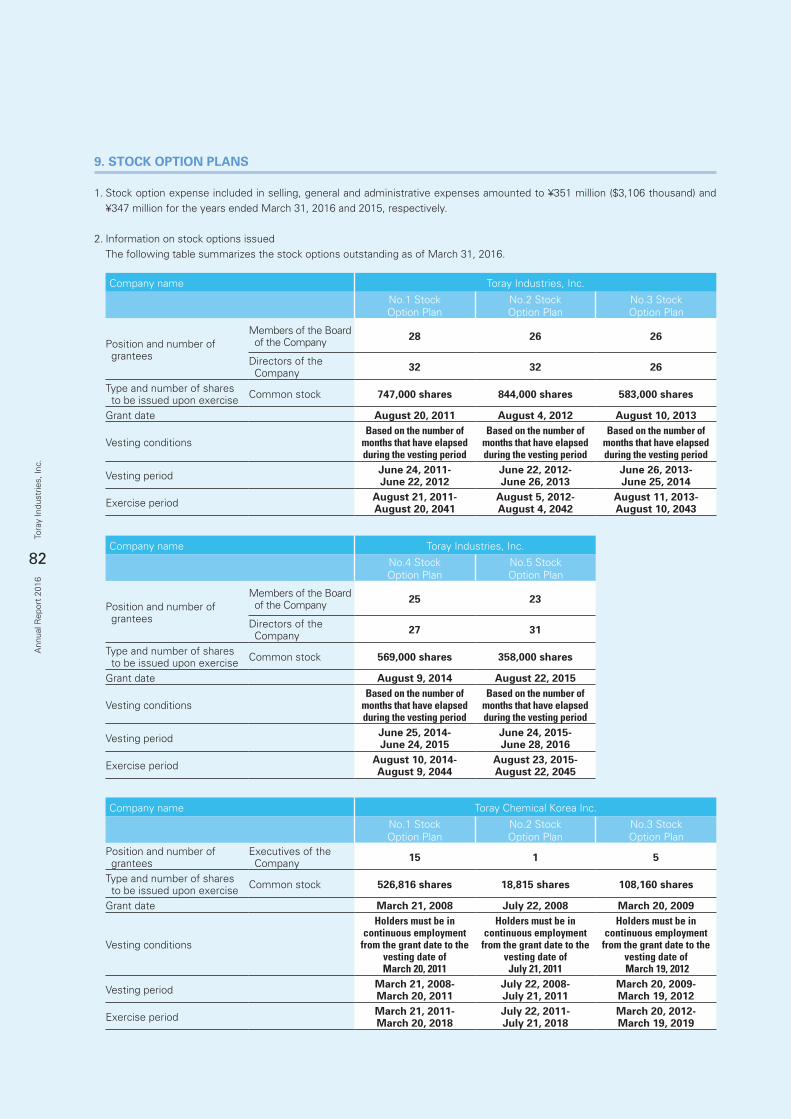
82
Tora
y In
dust
ries,
Inc.
Ann
ual R
epor
t 20
16
Company name Toray Chemical Korea Inc.
No.1 StockOption Plan
No.2 StockOption Plan
No.3 StockOption Plan
Position and number of grantees
Executives of the Company 15 1 5
Type and number of shares to be issued upon exercise Common stock 526,816 shares 18,815 shares 108,160 shares
Grant date March 21, 2008 July 22, 2008 March 20, 2009
Vesting conditions
Holders must be in continuous employment
from the grant date to the vesting date of March 20, 2011
Holders must be in continuous employment
from the grant date to the vesting date of
July 21, 2011
Holders must be in continuous employment
from the grant date to the vesting date of March 19, 2012
Vesting period March 21, 2008- March 20, 2011
July 22, 2008- July 21, 2011
March 20, 2009- March 19, 2012
Exercise period March 21, 2011- March 20, 2018
July 22, 2011- July 21, 2018
March 20, 2012- March 19, 2019
9. STOCK OPTION PLANS
1. Stock option expense included in selling, general and administrative expenses amounted to ¥351 million ($3,106 thousand) and ¥347 million for the years ended March 31, 2016 and 2015, respectively.
2. Information on stock options issued The following table summarizes the stock options outstanding as of March 31, 2016.
Company name Toray Industries, Inc.
No.1 StockOption Plan
No.2 StockOption Plan
No.3 StockOption Plan
Position and number of grantees
Members of the Board of the Company 28 26 26
Directors of the Company 32 32 26
Type and number of shares to be issued upon exercise Common stock 747,000 shares 844,000 shares 583,000 shares
Grant date August 20, 2011 August 4, 2012 August 10, 2013
Vesting conditionsBased on the number of
months that have elapsed during the vesting period
Based on the number of months that have elapsed during the vesting period
Based on the number of months that have elapsed during the vesting period
Vesting period June 24, 2011- June 22, 2012
June 22, 2012- June 26, 2013
June 26, 2013- June 25, 2014
Exercise period August 21, 2011- August 20, 2041
August 5, 2012- August 4, 2042
August 11, 2013- August 10, 2043
Company name Toray Industries, Inc.
No.4 StockOption Plan
No.5 StockOption Plan
Position and number of grantees
Members of the Board of the Company 25 23
Directors of the Company 27 31
Type and number of shares to be issued upon exercise Common stock 569,000 shares 358,000 shares
Grant date August 9, 2014 August 22, 2015
Vesting conditionsBased on the number of
months that have elapsed during the vesting period
Based on the number of months that have elapsed during the vesting period
Vesting period June 25, 2014- June 24, 2015
June 24, 2015- June 28, 2016
Exercise period August 10, 2014- August 9, 2044
August 23, 2015- August 22, 2045
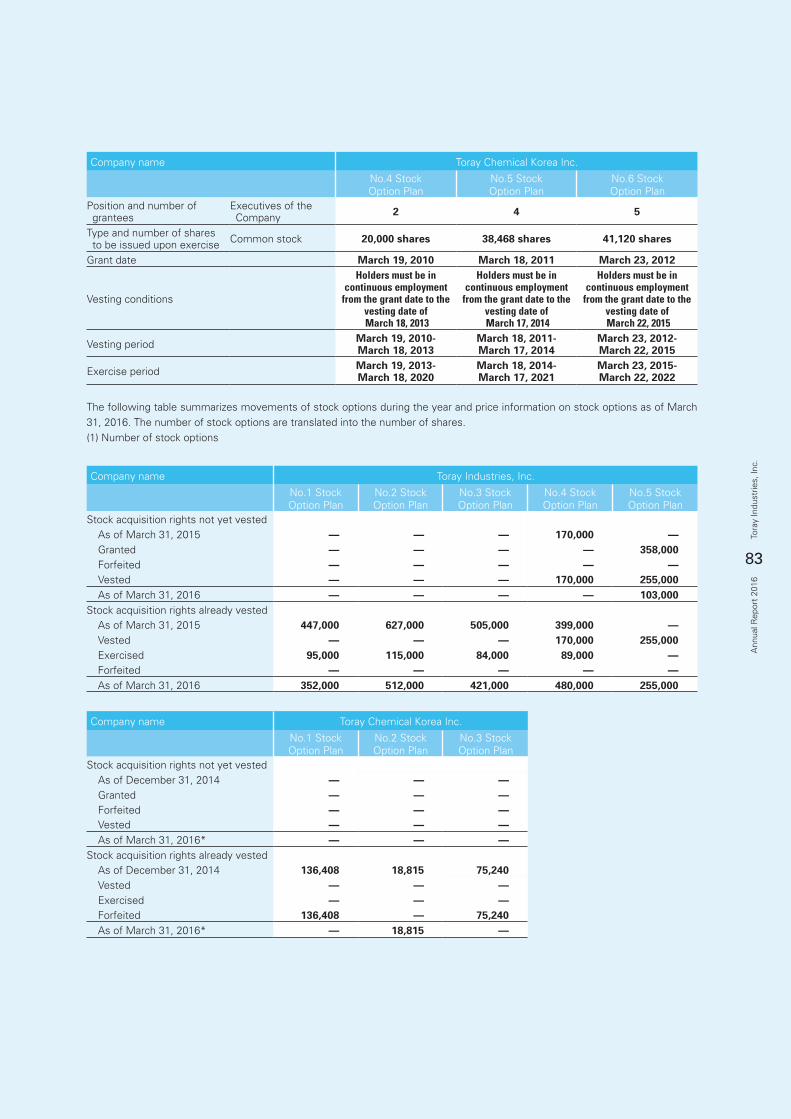
83
Tora
y In
dust
ries,
Inc.
Ann
ual R
epor
t 20
16
Company name Toray Chemical Korea Inc.
No.4 StockOption Plan
No.5 StockOption Plan
No.6 StockOption Plan
Position and number of grantees
Executives of the Company 2 4 5
Type and number of shares to be issued upon exercise Common stock 20,000 shares 38,468 shares 41,120 shares
Grant date March 19, 2010 March 18, 2011 March 23, 2012
Vesting conditions
Holders must be in continuous employment
from the grant date to the vesting date of March 18, 2013
Holders must be in continuous employment
from the grant date to the vesting date of March 17, 2014
Holders must be in continuous employment
from the grant date to the vesting date of March 22, 2015
Vesting period March 19, 2010- March 18, 2013
March 18, 2011- March 17, 2014
March 23, 2012- March 22, 2015
Exercise period March 19, 2013- March 18, 2020
March 18, 2014- March 17, 2021
March 23, 2015- March 22, 2022
Company name Toray Chemical Korea Inc.
No.1 StockOption Plan
No.2 StockOption Plan
No.3 StockOption Plan
Stock acquisition rights not yet vested As of December 31, 2014 — — — Granted — — — Forfeited — — — Vested — — — As of March 31, 2016* — — —Stock acquisition rights already vested As of December 31, 2014 136,408 18,815 75,240 Vested — — — Exercised — — — Forfeited 136,408 — 75,240 As of March 31, 2016* — 18,815 —
The following table summarizes movements of stock options during the year and price information on stock options as of March 31, 2016. The number of stock options are translated into the number of shares.(1) Number of stock options
Company name Toray Industries, Inc.
No.1 StockOption Plan
No.2 StockOption Plan
No.3 StockOption Plan
No.4 StockOption Plan
No.5 StockOption Plan
Stock acquisition rights not yet vested As of March 31, 2015 — — — 170,000 — Granted — — — — 358,000 Forfeited — — — — — Vested — — — 170,000 255,000 As of March 31, 2016 — — — — 103,000 Stock acquisition rights already vested As of March 31, 2015 447,000 627,000 505,000 399,000 — Vested — — — 170,000 255,000 Exercised 95,000 115,000 84,000 89,000 — Forfeited — — — — — As of March 31, 2016 352,000 512,000 421,000 480,000 255,000
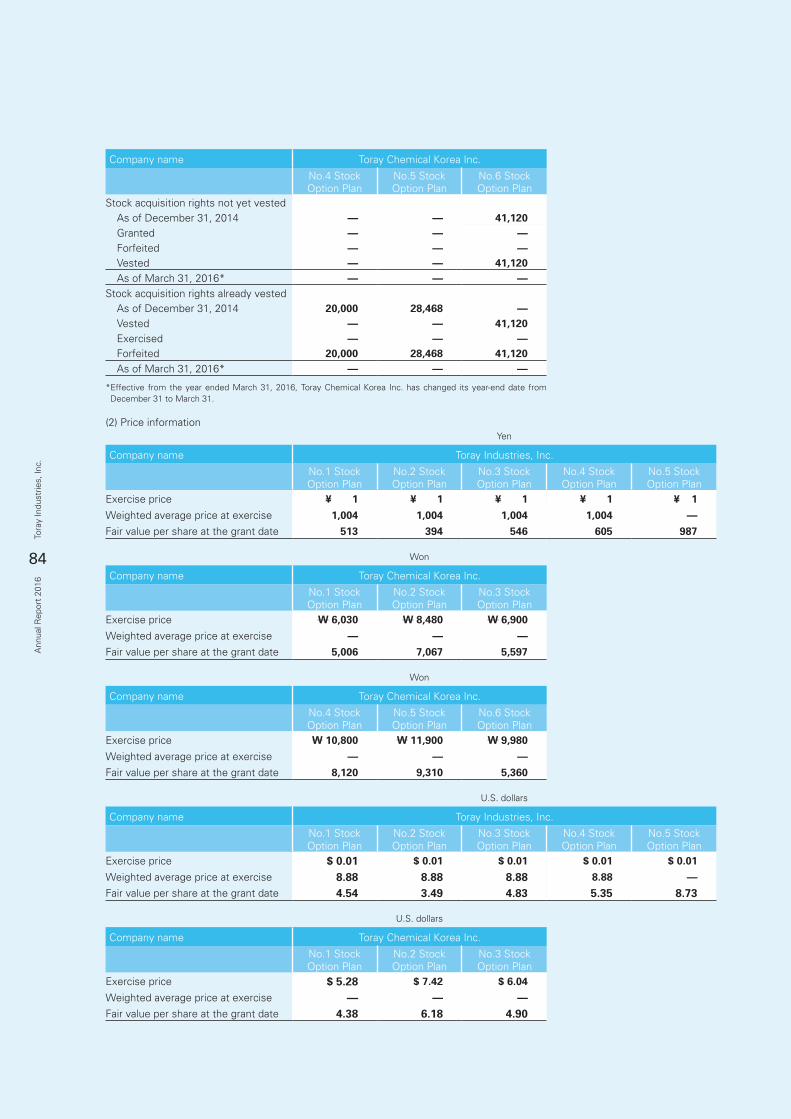
84
Tora
y In
dust
ries,
Inc.
Ann
ual R
epor
t 20
16
Won
Company name Toray Chemical Korea Inc.
No.4 StockOption Plan
No.5 StockOption Plan
No.6 StockOption Plan
Exercise price W 10,800 W 11,900 W 9,980
Weighted average price at exercise — — —Fair value per share at the grant date 8,120 9,310 5,360
U.S. dollars
Company name Toray Industries, Inc.
No.1 StockOption Plan
No.2 StockOption Plan
No.3 StockOption Plan
No.4 StockOption Plan
No.5 StockOption Plan
Exercise price $ 0.01 $ 0.01 $ 0.01 $ 0.01 $ 0.01
Weighted average price at exercise 8.88 8.88 8.88 8.88 —Fair value per share at the grant date 4.54 3.49 4.83 5.35 8.73
U.S. dollars
Company name Toray Chemical Korea Inc.
No.1 StockOption Plan
No.2 StockOption Plan
No.3 StockOption Plan
Exercise price $ 5.28 $ 7.42 $ 6.04
Weighted average price at exercise — — —Fair value per share at the grant date 4.38 6.18 4.90
(2) Price information
Company name Toray Chemical Korea Inc.
No.4 StockOption Plan
No.5 StockOption Plan
No.6 StockOption Plan
Stock acquisition rights not yet vested As of December 31, 2014 — — 41,120 Granted — — — Forfeited — — — Vested — — 41,120 As of March 31, 2016* — — —Stock acquisition rights already vested As of December 31, 2014 20,000 28,468 — Vested — — 41,120 Exercised — — — Forfeited 20,000 28,468 41,120 As of March 31, 2016* — — —
Yen
Company name Toray Industries, Inc.
No.1 StockOption Plan
No.2 StockOption Plan
No.3 StockOption Plan
No.4 StockOption Plan
No.5 StockOption Plan
Exercise price ¥ 1 ¥ 1 ¥ 1 ¥ 1 ¥ 1
Weighted average price at exercise 1,004 1,004 1,004 1,004 —Fair value per share at the grant date 513 394 546 605 987
Won
Company name Toray Chemical Korea Inc.
No.1 StockOption Plan
No.2 StockOption Plan
No.3 StockOption Plan
Exercise price W 6,030 W 8,480 W 6,900
Weighted average price at exercise — — —Fair value per share at the grant date 5,006 7,067 5,597
* Effective from the year ended March 31, 2016, Toray Chemical Korea Inc. has changed its year-end date from December 31 to March 31.
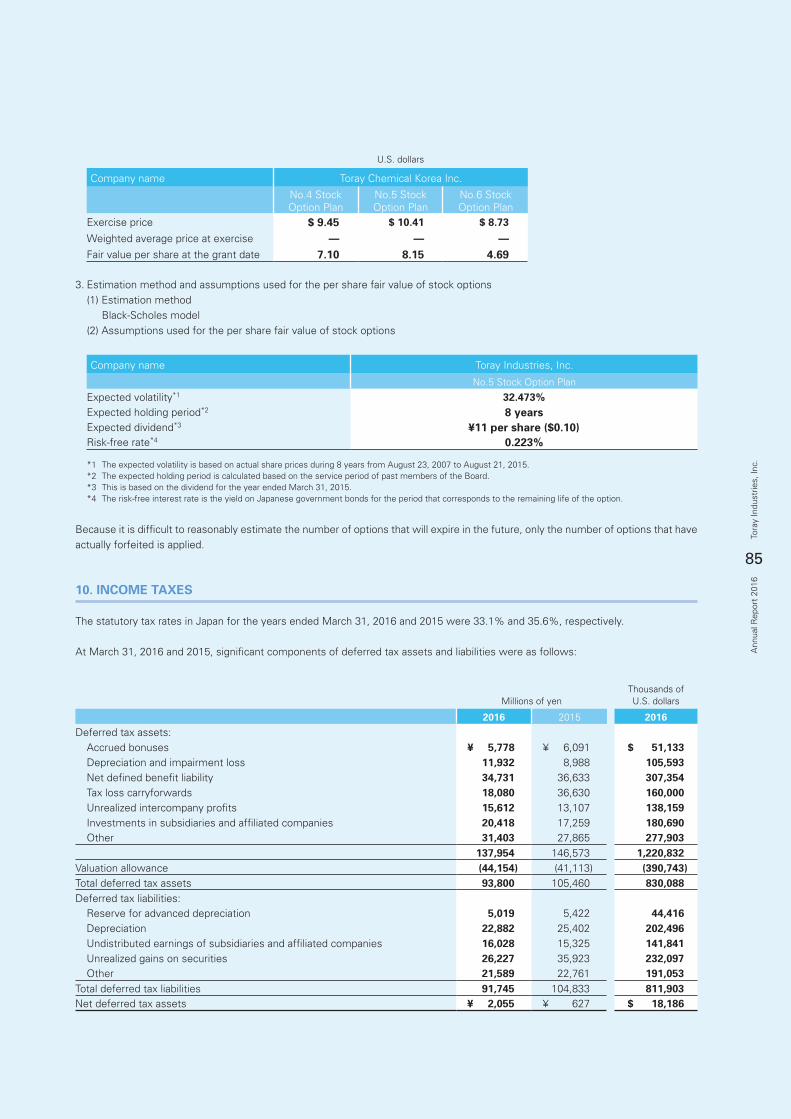
85
Tora
y In
dust
ries,
Inc.
Ann
ual R
epor
t 20
16
U.S. dollars
Company name Toray Chemical Korea Inc.
No.4 StockOption Plan
No.5 StockOption Plan
No.6 StockOption Plan
Exercise price $ 9.45 $ 10.41 $ 8.73
Weighted average price at exercise — — —Fair value per share at the grant date 7.10 8.15 4.69
3. Estimation method and assumptions used for the per share fair value of stock options (1) Estimation method Black-Scholes model (2) Assumptions used for the per share fair value of stock options
Company name Toray Industries, Inc.
No.5 Stock Option Plan
Expected volatility*1 32.473%Expected holding period*2 8 yearsExpected dividend*3 ¥11 per share ($0.10)Risk-free rate*4 0.223%
*1 The expected volatility is based on actual share prices during 8 years from August 23, 2007 to August 21, 2015.*2 The expected holding period is calculated based on the service period of past members of the Board.*3 This is based on the dividend for the year ended March 31, 2015.*4 The risk-free interest rate is the yield on Japanese government bonds for the period that corresponds to the remaining life of the option.
Because it is difficult to reasonably estimate the number of options that will expire in the future, only the number of options that have actually forfeited is applied.
10. INCOME TAXES
The statutory tax rates in Japan for the years ended March 31, 2016 and 2015 were 33.1% and 35.6%, respectively.
At March 31, 2016 and 2015, significant components of deferred tax assets and liabilities were as follows:
Millions of yenThousands ofU.S. dollars
2016 2015 2016
Deferred tax assets: Accrued bonuses ¥ 5,778 ¥ 6,091 $ 51,133 Depreciation and impairment loss 11,932 8,988 105,593 Net defined benefit liability 34,731 36,633 307,354 Tax loss carryforwards 18,080 36,630 160,000 Unrealized intercompany profits 15,612 13,107 138,159 Investments in subsidiaries and affiliated companies 20,418 17,259 180,690 Other 31,403 27,865 277,903
137,954 146,573 1,220,832Valuation allowance (44,154) (41,113) (390,743)Total deferred tax assets 93,800 105,460 830,088Deferred tax liabilities: Reserve for advanced depreciation 5,019 5,422 44,416 Depreciation 22,882 25,402 202,496 Undistributed earnings of subsidiaries and affiliated companies 16,028 15,325 141,841 Unrealized gains on securities 26,227 35,923 232,097 Other 21,589 22,761 191,053Total deferred tax liabilities 91,745 104,833 811,903Net deferred tax assets ¥ 2,055 ¥ 627 $ 18,186
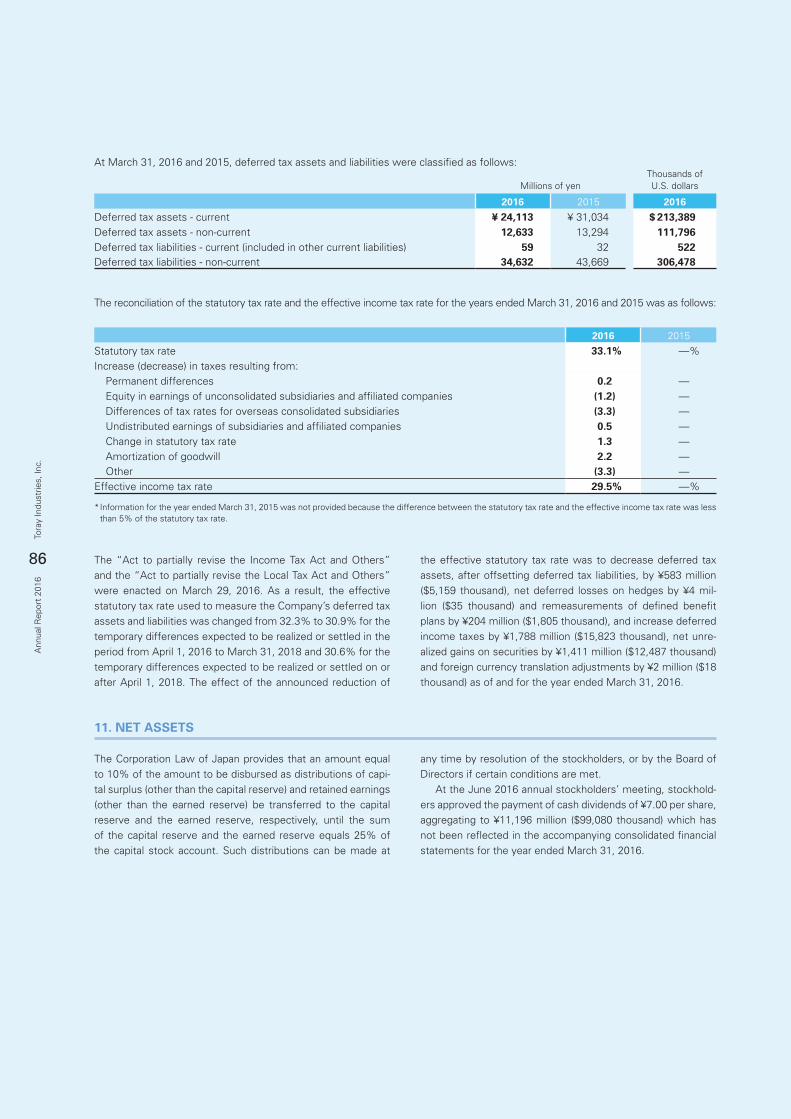
86
Tora
y In
dust
ries,
Inc.
Ann
ual R
epor
t 20
16
The “Act to partially revise the Income Tax Act and Others” and the “Act to partially revise the Local Tax Act and Others” were enacted on March 29, 2016. As a result, the effective statutory tax rate used to measure the Company’s deferred tax assets and liabilities was changed from 32.3% to 30.9% for the temporary differences expected to be realized or settled in the period from April 1, 2016 to March 31, 2018 and 30.6% for the temporary differences expected to be realized or settled on or after April 1, 2018. The effect of the announced reduction of
11. NET ASSETS
The Corporation Law of Japan provides that an amount equal to 10% of the amount to be disbursed as distributions of capi-tal surplus (other than the capital reserve) and retained earnings (other than the earned reserve) be transferred to the capital reserve and the earned reserve, respectively, until the sum of the capital reserve and the earned reserve equals 25% of the capital stock account. Such distributions can be made at
any time by resolution of the stockholders, or by the Board of Directors if certain conditions are met. At the June 2016 annual stockholders’ meeting, stockhold-ers approved the payment of cash dividends of ¥7.00 per share, aggregating to ¥11,196 million ($99,080 thousand) which has not been reflected in the accompanying consolidated financial statements for the year ended March 31, 2016.
the effective statutory tax rate was to decrease deferred tax assets, after offsetting deferred tax liabilities, by ¥583 million ($5,159 thousand), net deferred losses on hedges by ¥4 mil-lion ($35 thousand) and remeasurements of defined benefit plans by ¥204 million ($1,805 thousand), and increase deferred income taxes by ¥1,788 million ($15,823 thousand), net unre-alized gains on securities by ¥1,411 million ($12,487 thousand) and foreign currency translation adjustments by ¥2 million ($18 thousand) as of and for the year ended March 31, 2016.
At March 31, 2016 and 2015, deferred tax assets and liabilities were classified as follows:
Millions of yenThousands ofU.S. dollars
2016 2015 2016
Deferred tax assets - current ¥ 24,113 ¥ 31,034 $ 213,389Deferred tax assets - non-current 12,633 13,294 111,796Deferred tax liabilities - current (included in other current liabilities) 59 32 522Deferred tax liabilities - non-current 34,632 43,669 306,478
The reconciliation of the statutory tax rate and the effective income tax rate for the years ended March 31, 2016 and 2015 was as follows:
2016 2015
Statutory tax rate 33.1% —%Increase (decrease) in taxes resulting from: Permanent differences 0.2 — Equity in earnings of unconsolidated subsidiaries and affiliated companies (1.2) — Differences of tax rates for overseas consolidated subsidiaries (3.3) — Undistributed earnings of subsidiaries and affiliated companies 0.5 — Change in statutory tax rate 1.3 — Amortization of goodwill 2.2 — Other (3.3) —Effective income tax rate 29.5% —%
* Information for the year ended March 31, 2015 was not provided because the difference between the statutory tax rate and the effective income tax rate was less than 5% of the statutory tax rate.
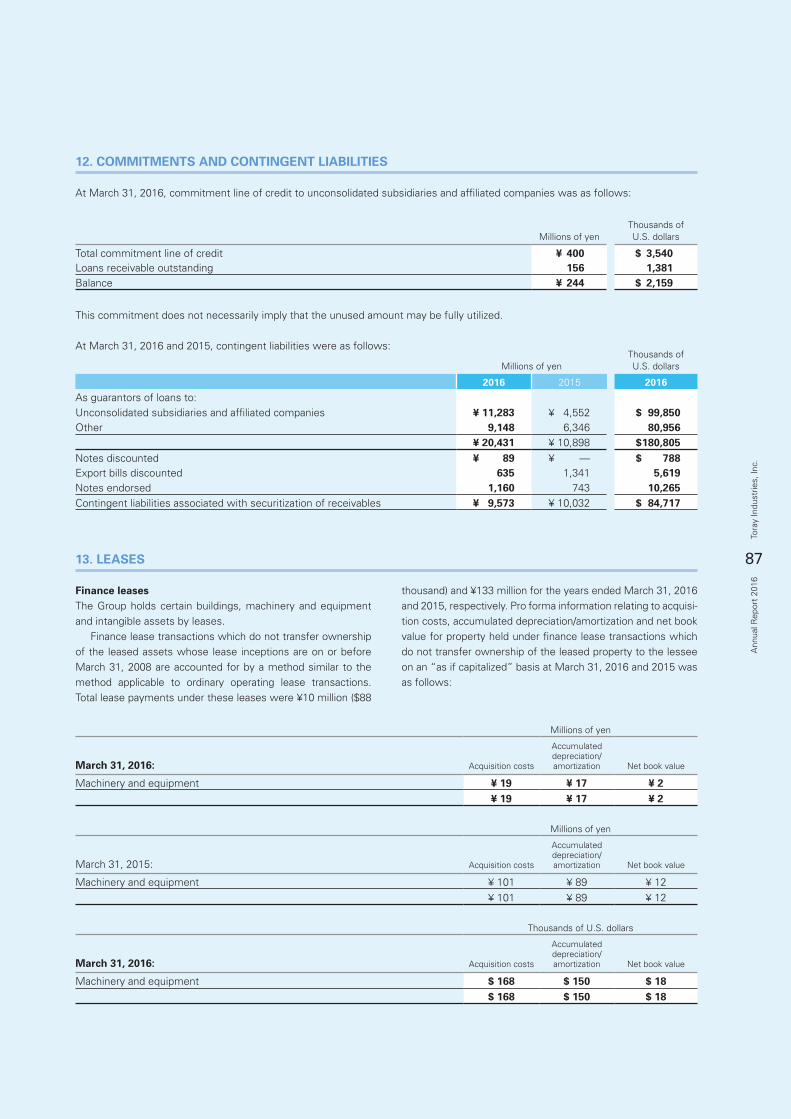
87
Tora
y In
dust
ries,
Inc.
Ann
ual R
epor
t 20
16
12. COMMITMENTS AND CONTINGENT LIABILITIES
At March 31, 2016, commitment line of credit to unconsolidated subsidiaries and affiliated companies was as follows:
Millions of yenThousands ofU.S. dollars
Total commitment line of credit ¥ 400 $ 3,540Loans receivable outstanding 156 1,381Balance ¥ 244 $ 2,159
This commitment does not necessarily imply that the unused amount may be fully utilized.
At March 31, 2016 and 2015, contingent liabilities were as follows:
Millions of yenThousands ofU.S. dollars
2016 2015 2016
As guarantors of loans to:Unconsolidated subsidiaries and affiliated companies ¥ 11,283 ¥ 4,552 $ 99,850Other 9,148 6,346 80,956
¥ 20,431 ¥ 10,898 $ 180,805Notes discounted ¥ 89 ¥ — $ 788Export bills discounted 635 1,341 5,619Notes endorsed 1,160 743 10,265Contingent liabilities associated with securitization of receivables ¥ 9,573 ¥ 10,032 $ 84,717
13. LEASES
Finance leasesThe Group holds certain buildings, machinery and equipment and intangible assets by leases. Finance lease transactions which do not transfer ownership of the leased assets whose lease inceptions are on or before March 31, 2008 are accounted for by a method similar to the method applicable to ordinary operating lease transactions. Total lease payments under these leases were ¥10 million ($88
thousand) and ¥133 million for the years ended March 31, 2016 and 2015, respectively. Pro forma information relating to acquisi-tion costs, accumulated depreciation/amortization and net book value for property held under finance lease transactions which do not transfer ownership of the leased property to the lessee on an “as if capitalized” basis at March 31, 2016 and 2015 was as follows:
Millions of yen
March 31, 2016: Acquisition costs
Accumulateddepreciation/amortization Net book value
Machinery and equipment ¥ 19 ¥ 17 ¥ 2¥ 19 ¥ 17 ¥ 2
Thousands of U.S. dollars
March 31, 2016: Acquisition costs
Accumulateddepreciation/amortization Net book value
Machinery and equipment $ 168 $ 150 $ 18$ 168 $ 150 $ 18
Millions of yen
March 31, 2015: Acquisition costs
Accumulateddepreciation/amortization Net book value
Machinery and equipment ¥ 101 ¥ 89 ¥ 12¥ 101 ¥ 89 ¥ 12
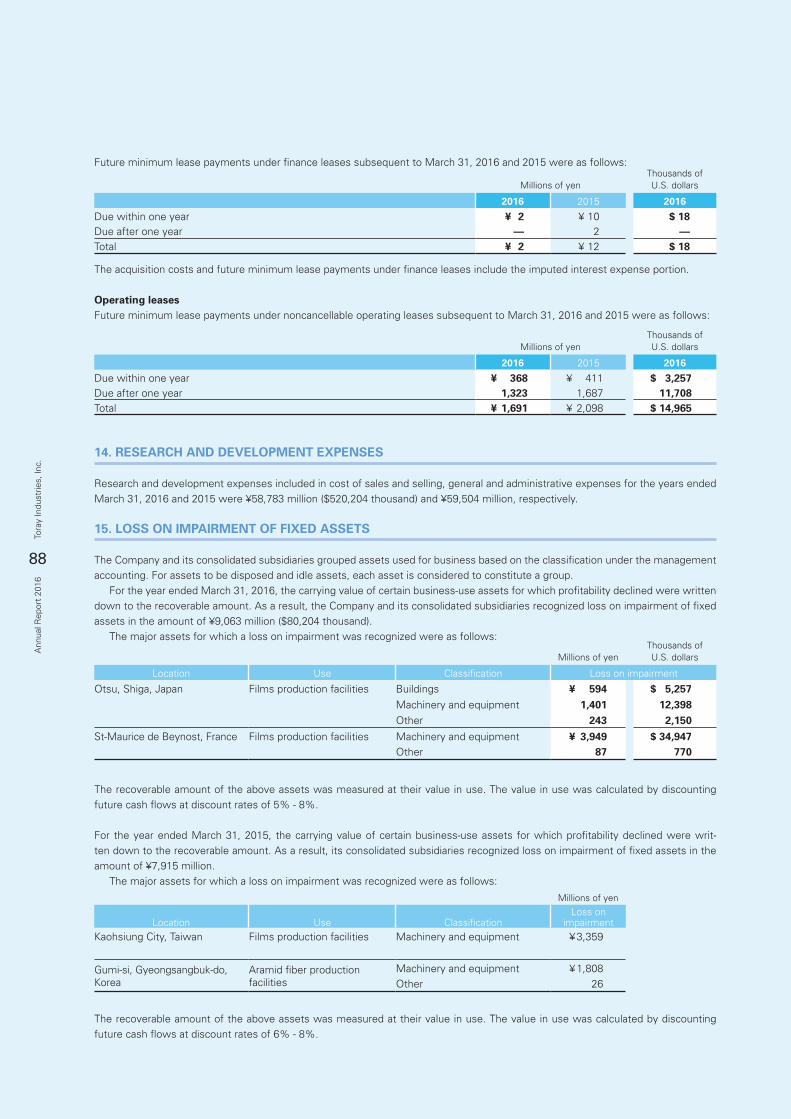
88
Tora
y In
dust
ries,
Inc.
Ann
ual R
epor
t 20
16
Millions of yenThousands ofU.S. dollars
Location Use Classification Loss on impairment
Otsu, Shiga, Japan Films production facilities Buildings ¥ 594 $ 5,257Machinery and equipment 1,401 12,398Other 243 2,150
St-Maurice de Beynost, France Films production facilities Machinery and equipment ¥ 3,949 $ 34,947Other 87 770
The recoverable amount of the above assets was measured at their value in use. The value in use was calculated by discounting future cash flows at discount rates of 5% - 8%.
For the year ended March 31, 2015, the carrying value of certain business-use assets for which profitability declined were writ-ten down to the recoverable amount. As a result, its consolidated subsidiaries recognized loss on impairment of fixed assets in the amount of ¥7,915 million. The major assets for which a loss on impairment was recognized were as follows:
15. LOSS ON IMPAIRMENT OF FIXED ASSETS
The Company and its consolidated subsidiaries grouped assets used for business based on the classification under the management accounting. For assets to be disposed and idle assets, each asset is considered to constitute a group. For the year ended March 31, 2016, the carrying value of certain business-use assets for which profitability declined were written down to the recoverable amount. As a result, the Company and its consolidated subsidiaries recognized loss on impairment of fixed assets in the amount of ¥9,063 million ($80,204 thousand). The major assets for which a loss on impairment was recognized were as follows:
Future minimum lease payments under finance leases subsequent to March 31, 2016 and 2015 were as follows:
Millions of yenThousands ofU.S. dollars
2016 2015 2016
Due within one year ¥ 2 ¥ 10 $ 18Due after one year — 2 —Total ¥ 2 ¥ 12 $ 18
Millions of yenThousands ofU.S. dollars
2016 2015 2016
Due within one year ¥ 368 ¥ 411 $ 3,257Due after one year 1,323 1,687 11,708Total ¥ 1,691 ¥ 2,098 $ 14,965
The acquisition costs and future minimum lease payments under finance leases include the imputed interest expense portion.
Operating leasesFuture minimum lease payments under noncancellable operating leases subsequent to March 31, 2016 and 2015 were as follows:
14. RESEARCH AND DEVELOPMENT EXPENSES
Research and development expenses included in cost of sales and selling, general and administrative expenses for the years ended March 31, 2016 and 2015 were ¥58,783 million ($520,204 thousand) and ¥59,504 million, respectively.
Millions of yen
Location Use ClassificationLoss on
impairmentKaohsiung City, Taiwan Films production facilities Machinery and equipment ¥ 3,359
Gumi-si, Gyeongsangbuk-do, Korea
Aramid fiber production facilities
Machinery and equipment ¥ 1,808Other 26
The recoverable amount of the above assets was measured at their value in use. The value in use was calculated by discounting future cash flows at discount rates of 6% - 8%.
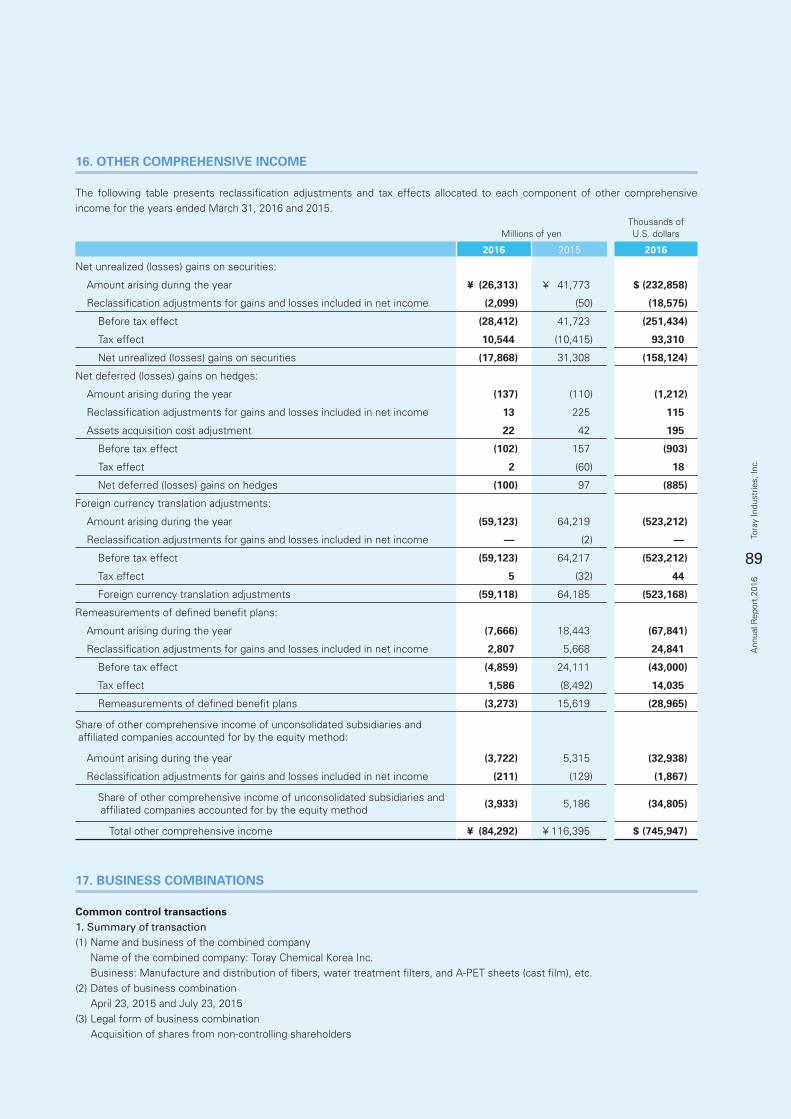
89
Tora
y In
dust
ries,
Inc.
Ann
ual R
epor
t 20
16
16. OTHER COMPREHENSIVE INCOME
The following table presents reclassification adjustments and tax effects allocated to each component of other comprehensive income for the years ended March 31, 2016 and 2015.
Millions of yenThousands ofU.S. dollars
2016 2015 2016
Net unrealized (losses) gains on securities:
Amount arising during the year ¥ (26,313) ¥ 41,773 $ (232,858)
Reclassification adjustments for gains and losses included in net income (2,099) (50) (18,575)
Before tax effect (28,412) 41,723 (251,434)
Tax effect 10,544 (10,415) 93,310
Net unrealized (losses) gains on securities (17,868) 31,308 (158,124)
Net deferred (losses) gains on hedges:
Amount arising during the year (137) (110) (1,212)
Reclassification adjustments for gains and losses included in net income 13 225 115
Assets acquisition cost adjustment 22 42 195
Before tax effect (102) 157 (903)
Tax effect 2 (60) 18
Net deferred (losses) gains on hedges (100) 97 (885)
Foreign currency translation adjustments:
Amount arising during the year (59,123) 64,219 (523,212)
Reclassification adjustments for gains and losses included in net income — (2) —
Before tax effect (59,123) 64,217 (523,212)
Tax effect 5 (32) 44
Foreign currency translation adjustments (59,118) 64,185 (523,168)
Remeasurements of defined benefit plans:
Amount arising during the year (7,666) 18,443 (67,841)
Reclassification adjustments for gains and losses included in net income 2,807 5,668 24,841
Before tax effect (4,859) 24,111 (43,000)
Tax effect 1,586 (8,492) 14,035
Remeasurements of defined benefit plans (3,273) 15,619 (28,965)
Share of other comprehensive income of unconsolidated subsidiaries and affiliated companies accounted for by the equity method:
Amount arising during the year (3,722) 5,315 (32,938)
Reclassification adjustments for gains and losses included in net income (211) (129) (1,867)
Share of other comprehensive income of unconsolidated subsidiaries and affiliated companies accounted for by the equity method (3,933) 5,186 (34,805)
Total other comprehensive income ¥ (84,292) ¥ 116,395 $ (745,947)
17. BUSINESS COMBINATIONS
Common control transactions1. Summary of transaction(1) Name and business of the combined company Name of the combined company: Toray Chemical Korea Inc. Business: Manufacture and distribution of fibers, water treatment filters, and A-PET sheets (cast film), etc.(2) Dates of business combination April 23, 2015 and July 23, 2015(3) Legal form of business combination Acquisition of shares from non-controlling shareholders
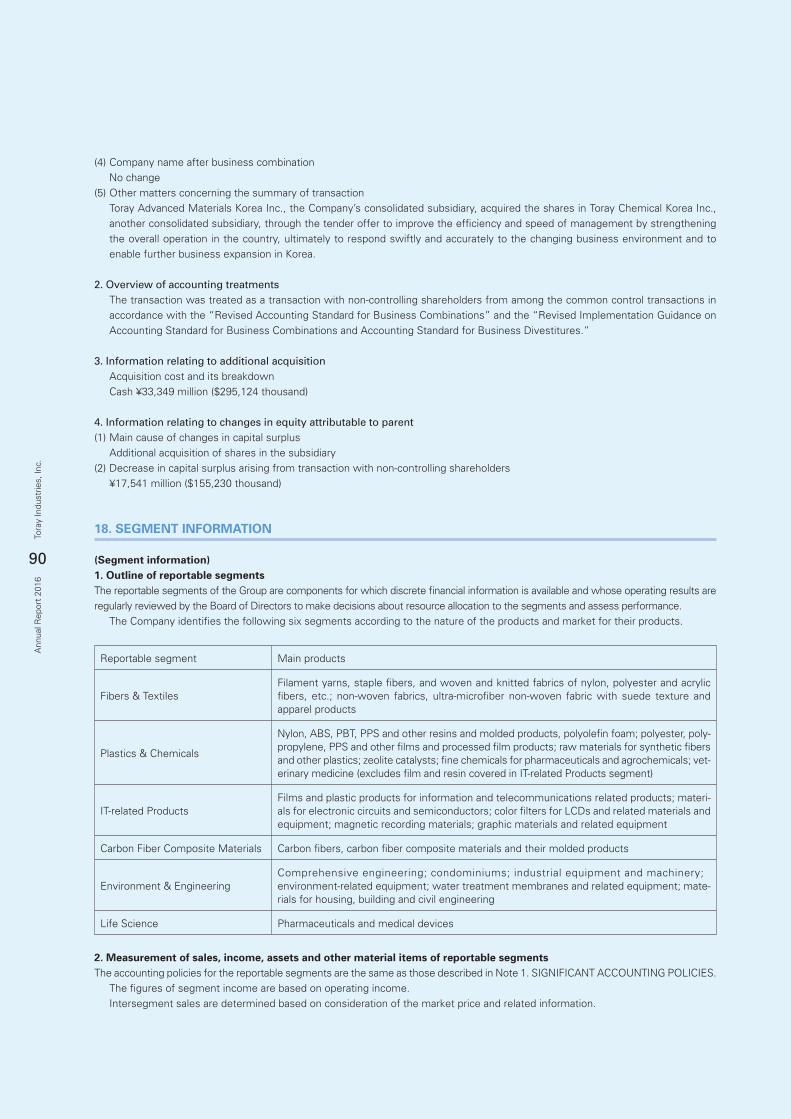
90
Tora
y In
dust
ries,
Inc.
Ann
ual R
epor
t 20
16
Reportable segment Main products
Fibers & TextilesFilament yarns, staple fibers, and woven and knitted fabrics of nylon, polyester and acrylic fibers, etc.; non-woven fabrics, ultra-microfiber non-woven fabric with suede texture and apparel products
Plastics & Chemicals
Nylon, ABS, PBT, PPS and other resins and molded products, polyolefin foam; polyester, poly-propylene, PPS and other films and processed film products; raw materials for synthetic fibers and other plastics; zeolite catalysts; fine chemicals for pharmaceuticals and agrochemicals; vet-erinary medicine (excludes film and resin covered in IT-related Products segment)
IT-related ProductsFilms and plastic products for information and telecommunications related products; materi-als for electronic circuits and semiconductors; color filters for LCDs and related materials and equipment; magnetic recording materials; graphic materials and related equipment
Carbon Fiber Composite Materials Carbon fibers, carbon fiber composite materials and their molded products
Environment & EngineeringComprehensive engineering; condominiums; industrial equipment and machinery;environment-related equipment; water treatment membranes and related equipment; mate-rials for housing, building and civil engineering
Life Science Pharmaceuticals and medical devices
18. SEGMENT INFORMATION
(Segment information)1. Outline of reportable segmentsThe reportable segments of the Group are components for which discrete financial information is available and whose operating results are regularly reviewed by the Board of Directors to make decisions about resource allocation to the segments and assess performance. The Company identifies the following six segments according to the nature of the products and market for their products.
2. Measurement of sales, income, assets and other material items of reportable segmentsThe accounting policies for the reportable segments are the same as those described in Note 1. SIGNIFICANT ACCOUNTING POLICIES. The figures of segment income are based on operating income. Intersegment sales are determined based on consideration of the market price and related information.
(4) Company name after business combination No change (5) Other matters concerning the summary of transaction
Toray Advanced Materials Korea Inc., the Company’s consolidated subsidiary, acquired the shares in Toray Chemical Korea Inc., another consolidated subsidiary, through the tender offer to improve the efficiency and speed of management by strengthening the overall operation in the country, ultimately to respond swiftly and accurately to the changing business environment and to enable further business expansion in Korea.
2. Overview of accounting treatmentsThe transaction was treated as a transaction with non-controlling shareholders from among the common control transactions in accordance with the “Revised Accounting Standard for Business Combinations” and the “Revised Implementation Guidance on Accounting Standard for Business Combinations and Accounting Standard for Business Divestitures.”
3. Information relating to additional acquisitionAcquisition cost and its breakdownCash ¥33,349 million ($295,124 thousand)
4. Information relating to changes in equity attributable to parent (1) Main cause of changes in capital surplus Additional acquisition of shares in the subsidiary(2) Decrease in capital surplus arising from transaction with non-controlling shareholders ¥17,541 million ($155,230 thousand)
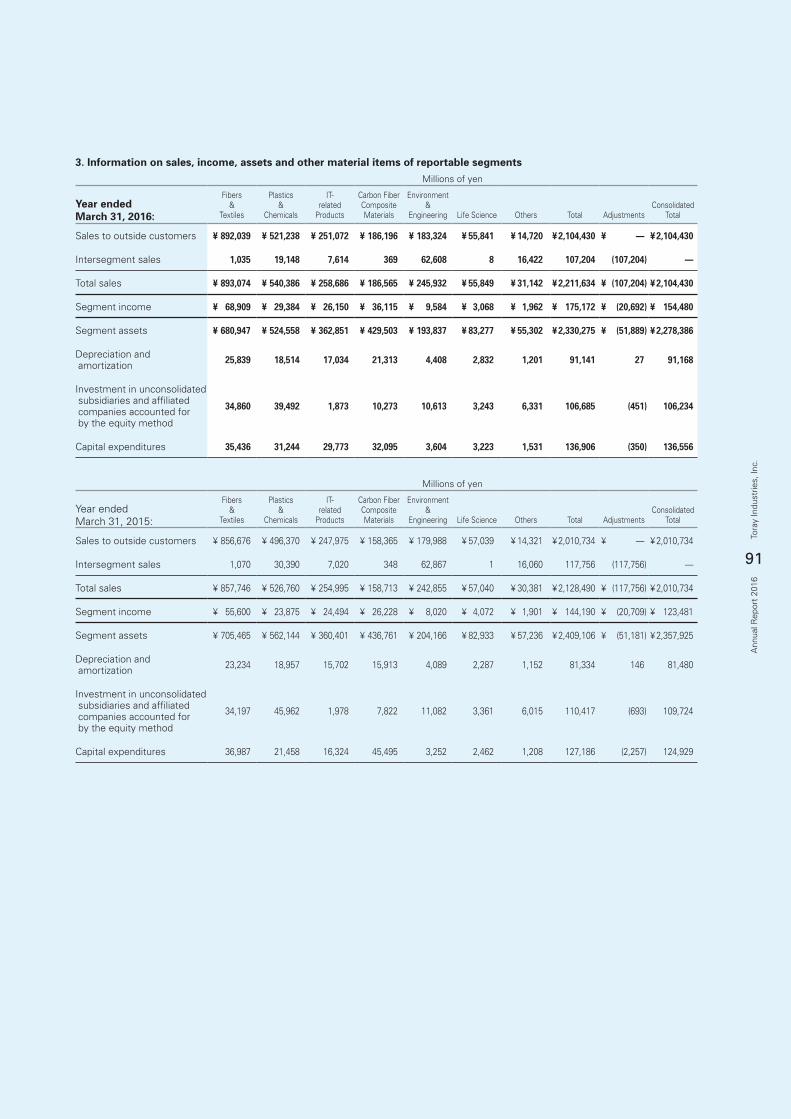
91
Tora
y In
dust
ries,
Inc.
Ann
ual R
epor
t 20
16
Millions of yen
Year endedMarch 31, 2015:
Fibers&
Textiles
Plastics&
Chemicals
IT-related
Products
Carbon FiberCompositeMaterials
Environment&
Engineering Life Science Others Total AdjustmentsConsolidated
Total
Sales to outside customers ¥ 856,676 ¥ 496,370 ¥ 247,975 ¥ 158,365 ¥ 179,988 ¥ 57,039 ¥ 14,321 ¥ 2,010,734 ¥ — ¥ 2,010,734
Intersegment sales 1,070 30,390 7,020 348 62,867 1 16,060 117,756 (117,756) —
Total sales ¥ 857,746 ¥ 526,760 ¥ 254,995 ¥ 158,713 ¥ 242,855 ¥ 57,040 ¥ 30,381 ¥ 2,128,490 ¥ (117,756) ¥ 2,010,734
Segment income ¥ 55,600 ¥ 23,875 ¥ 24,494 ¥ 26,228 ¥ 8,020 ¥ 4,072 ¥ 1,901 ¥ 144,190 ¥ (20,709) ¥ 123,481
Segment assets ¥ 705,465 ¥ 562,144 ¥ 360,401 ¥ 436,761 ¥ 204,166 ¥ 82,933 ¥ 57,236 ¥ 2,409,106 ¥ (51,181) ¥ 2,357,925
Depreciation and amortization 23,234 18,957 15,702 15,913 4,089 2,287 1,152 81,334 146 81,480
Investment in unconsolidated subsidiaries and affiliated companies accounted for by the equity method
34,197 45,962 1,978 7,822 11,082 3,361 6,015 110,417 (693) 109,724
Capital expenditures 36,987 21,458 16,324 45,495 3,252 2,462 1,208 127,186 (2,257) 124,929
Millions of yen
Year endedMarch 31, 2016:
Fibers&
Textiles
Plastics&
Chemicals
IT-related
Products
Carbon FiberCompositeMaterials
Environment&
Engineering Life Science Others Total AdjustmentsConsolidated
Total
Sales to outside customers ¥ 892,039 ¥ 521,238 ¥ 251,072 ¥ 186,196 ¥ 183,324 ¥ 55,841 ¥ 14,720 ¥ 2,104,430 ¥ — ¥ 2,104,430
Intersegment sales 1,035 19,148 7,614 369 62,608 8 16,422 107,204 (107,204) —
Total sales ¥ 893,074 ¥ 540,386 ¥ 258,686 ¥ 186,565 ¥ 245,932 ¥ 55,849 ¥ 31,142 ¥ 2,211,634 ¥ (107,204) ¥ 2,104,430
Segment income ¥ 68,909 ¥ 29,384 ¥ 26,150 ¥ 36,115 ¥ 9,584 ¥ 3,068 ¥ 1,962 ¥ 175,172 ¥ (20,692) ¥ 154,480
Segment assets ¥ 680,947 ¥ 524,558 ¥ 362,851 ¥ 429,503 ¥ 193,837 ¥ 83,277 ¥ 55,302 ¥ 2,330,275 ¥ (51,889) ¥ 2,278,386
Depreciation and amortization 25,839 18,514 17,034 21,313 4,408 2,832 1,201 91,141 27 91,168
Investment in unconsolidated subsidiaries and affiliated companies accounted for by the equity method
34,860 39,492 1,873 10,273 10,613 3,243 6,331 106,685 (451) 106,234
Capital expenditures 35,436 31,244 29,773 32,095 3,604 3,223 1,531 136,906 (350) 136,556
3. Information on sales, income, assets and other material items of reportable segments
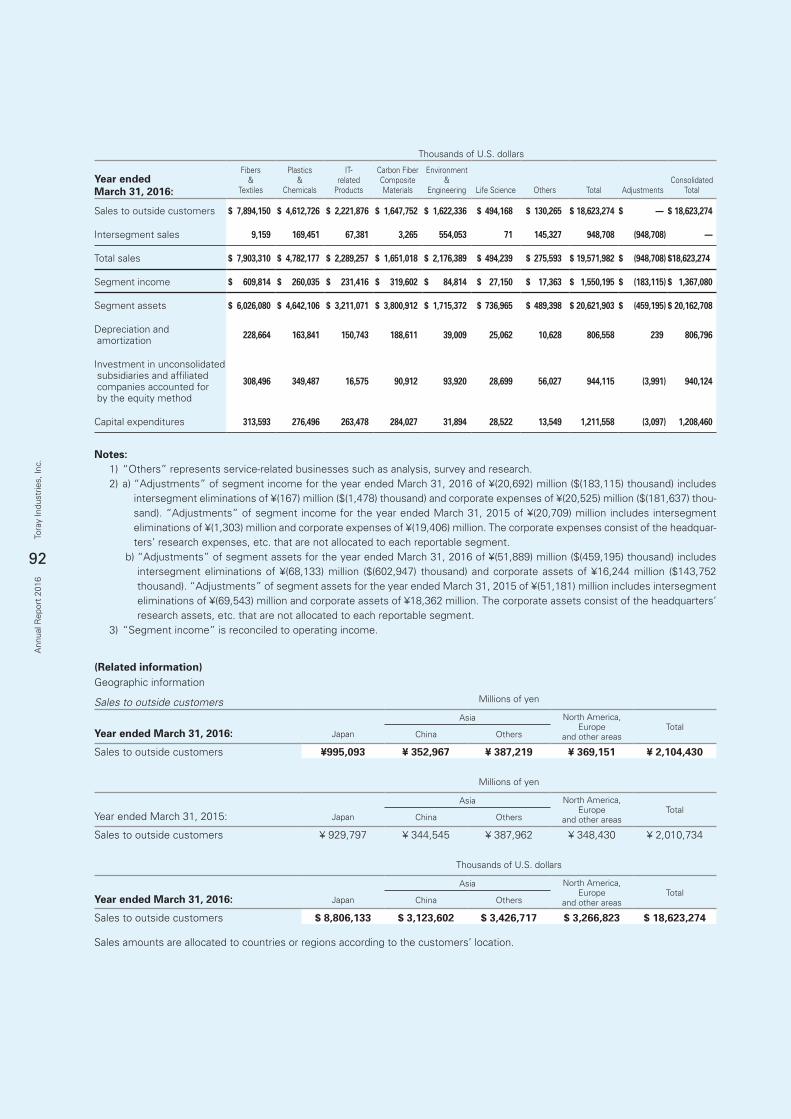
92
Tora
y In
dust
ries,
Inc.
Ann
ual R
epor
t 20
16
Thousands of U.S. dollars
Year endedMarch 31, 2016:
Fibers&
Textiles
Plastics&
Chemicals
IT-related
Products
Carbon FiberCompositeMaterials
Environment&
Engineering Life Science Others Total AdjustmentsConsolidated
Total
Sales to outside customers $ 7,894,150 $ 4,612,726 $ 2,221,876 $ 1,647,752 $ 1,622,336 $ 494,168 $ 130,265 $ 18,623,274 $ — $ 18,623,274
Intersegment sales 9,159 169,451 67,381 3,265 554,053 71 145,327 948,708 (948,708) —
Total sales $ 7,903,310 $ 4,782,177 $ 2,289,257 $ 1,651,018 $ 2,176,389 $ 494,239 $ 275,593 $ 19,571,982 $ (948,708) $18,623,274
Segment income $ 609,814 $ 260,035 $ 231,416 $ 319,602 $ 84,814 $ 27,150 $ 17,363 $ 1,550,195 $ (183,115) $ 1,367,080
Segment assets $ 6,026,080 $ 4,642,106 $ 3,211,071 $ 3,800,912 $ 1,715,372 $ 736,965 $ 489,398 $ 20,621,903 $ (459,195) $ 20,162,708
Depreciation and amortization 228,664 163,841 150,743 188,611 39,009 25,062 10,628 806,558 239 806,796
Investment in unconsolidated subsidiaries and affiliated companies accounted for by the equity method
308,496 349,487 16,575 90,912 93,920 28,699 56,027 944,115 (3,991) 940,124
Capital expenditures 313,593 276,496 263,478 284,027 31,894 28,522 13,549 1,211,558 (3,097) 1,208,460
Notes: 1) “Others” represents service-related businesses such as analysis, survey and research. 2) a) “Adjustments” of segment income for the year ended March 31, 2016 of ¥(20,692) million ($(183,115) thousand) includes
intersegment eliminations of ¥(167) million ($(1,478) thousand) and corporate expenses of ¥(20,525) million ($(181,637) thou-sand). “Adjustments” of segment income for the year ended March 31, 2015 of ¥(20,709) million includes intersegment eliminations of ¥(1,303) million and corporate expenses of ¥(19,406) million. The corporate expenses consist of the headquar-ters’ research expenses, etc. that are not allocated to each reportable segment.
b) “Adjustments” of segment assets for the year ended March 31, 2016 of ¥(51,889) million ($(459,195) thousand) includes intersegment eliminations of ¥(68,133) million ($(602,947) thousand) and corporate assets of ¥16,244 million ($143,752 thousand). “Adjustments” of segment assets for the year ended March 31, 2015 of ¥(51,181) million includes intersegment eliminations of ¥(69,543) million and corporate assets of ¥18,362 million. The corporate assets consist of the headquarters’ research assets, etc. that are not allocated to each reportable segment.
3) “Segment income” is reconciled to operating income.
Sales amounts are allocated to countries or regions according to the customers’ location.
(Related information)Geographic information
Thousands of U.S. dollars
Year ended March 31, 2016:
Asia North America, Europe
and other areasTotal
Japan China Others
Sales to outside customers $ 8,806,133 $ 3,123,602 $ 3,426,717 $ 3,266,823 $ 18,623,274
Millions of yen
Year ended March 31, 2015:
Asia North America, Europe
and other areasTotal
Japan China Others
Sales to outside customers ¥ 929,797 ¥ 344,545 ¥ 387,962 ¥ 348,430 ¥ 2,010,734
Sales to outside customers Millions of yen
Year ended March 31, 2016:
Asia North America, Europe
and other areasTotal
Japan China Others
Sales to outside customers ¥995,093 ¥ 352,967 ¥ 387,219 ¥ 369,151 ¥ 2,104,430
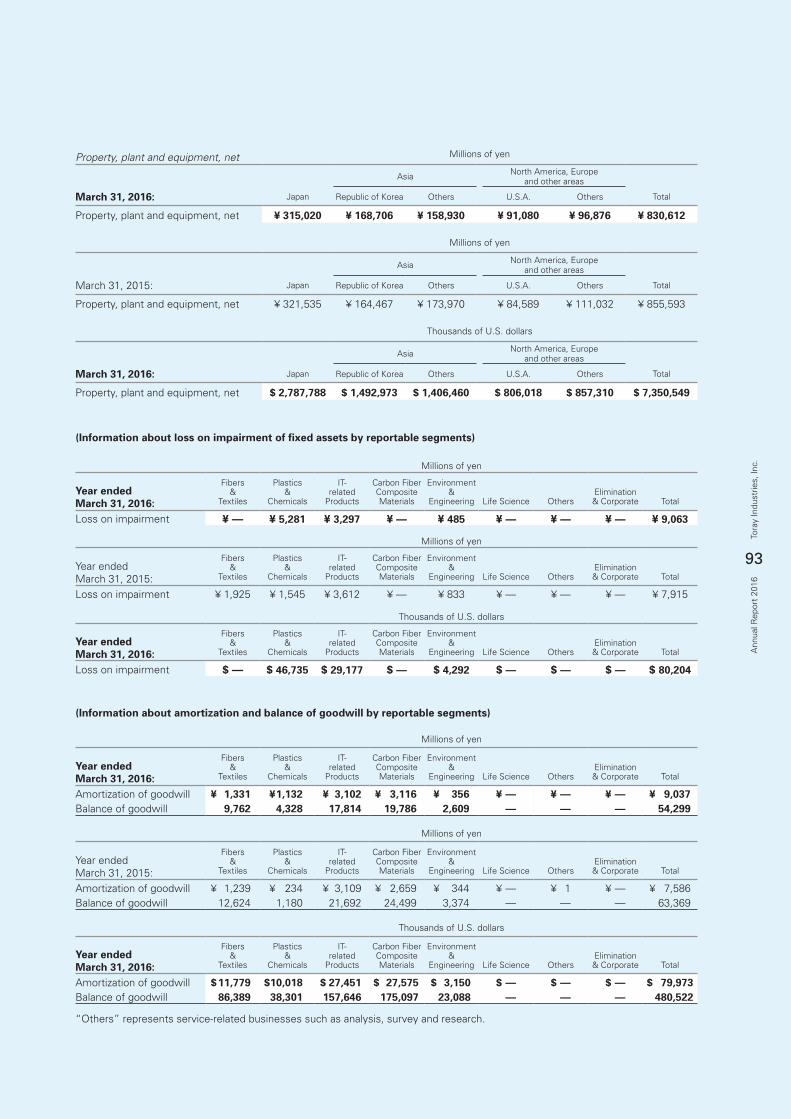
93
Tora
y In
dust
ries,
Inc.
Ann
ual R
epor
t 20
16
(Information about amortization and balance of goodwill by reportable segments)
“Others” represents service-related businesses such as analysis, survey and research.
Millions of yen
Year endedMarch 31, 2016:
Fibers&
Textiles
Plastics&
Chemicals
IT-related
Products
Carbon FiberCompositeMaterials
Environment&
Engineering Life Science OthersElimination& Corporate Total
Amortization of goodwill ¥ 1,331 ¥ 1,132 ¥ 3,102 ¥ 3,116 ¥ 356 ¥ — ¥ — ¥ — ¥ 9,037Balance of goodwill 9,762 4,328 17,814 19,786 2,609 — — — 54,299
Millions of yen
Year endedMarch 31, 2015:
Fibers&
Textiles
Plastics&
Chemicals
IT-related
Products
Carbon FiberCompositeMaterials
Environment&
Engineering Life Science OthersElimination& Corporate Total
Amortization of goodwill ¥ 1,239 ¥ 234 ¥ 3,109 ¥ 2,659 ¥ 344 ¥ — ¥ 1 ¥ — ¥ 7,586Balance of goodwill 12,624 1,180 21,692 24,499 3,374 — — — 63,369
Thousands of U.S. dollars
Year endedMarch 31, 2016:
Fibers&
Textiles
Plastics&
Chemicals
IT-related
Products
Carbon FiberCompositeMaterials
Environment&
Engineering Life Science OthersElimination& Corporate Total
Amortization of goodwill $ 11,779 $ 10,018 $ 27,451 $ 27,575 $ 3,150 $ — $ — $ — $ 79,973Balance of goodwill 86,389 38,301 157,646 175,097 23,088 — — — 480,522
(Information about loss on impairment of fixed assets by reportable segments)
Thousands of U.S. dollars
Year endedMarch 31, 2016:
Fibers&
Textiles
Plastics&
Chemicals
IT-related
Products
Carbon FiberCompositeMaterials
Environment&
Engineering Life Science OthersElimination& Corporate Total
Loss on impairment $ — $ 46,735 $ 29,177 $ — $ 4,292 $ — $ — $ — $ 80,204
Millions of yen
Year endedMarch 31, 2016:
Fibers&
Textiles
Plastics&
Chemicals
IT-related
Products
Carbon FiberCompositeMaterials
Environment&
Engineering Life Science OthersElimination& Corporate Total
Loss on impairment ¥ — ¥ 5,281 ¥ 3,297 ¥ — ¥ 485 ¥ — ¥ — ¥ — ¥ 9,063
Millions of yen
Year endedMarch 31, 2015:
Fibers&
Textiles
Plastics&
Chemicals
IT-related
Products
Carbon FiberCompositeMaterials
Environment&
Engineering Life Science OthersElimination& Corporate Total
Loss on impairment ¥ 1,925 ¥ 1,545 ¥ 3,612 ¥ — ¥ 833 ¥ — ¥ — ¥ — ¥ 7,915
Property, plant and equipment, net Millions of yen
Asia North America, Europeand other areas
March 31, 2016: Japan Republic of Korea Others U.S.A. Others Total
Property, plant and equipment, net ¥ 315,020 ¥ 168,706 ¥ 158,930 ¥ 91,080 ¥ 96,876 ¥ 830,612
Millions of yen
Asia North America, Europeand other areas
March 31, 2015: Japan Republic of Korea Others U.S.A. Others Total
Property, plant and equipment, net ¥ 321,535 ¥ 164,467 ¥ 173,970 ¥ 84,589 ¥ 111,032 ¥ 855,593
Thousands of U.S. dollars
Asia North America, Europeand other areas
March 31, 2016: Japan Republic of Korea Others U.S.A. Others Total
Property, plant and equipment, net $ 2,787,788 $ 1,492,973 $ 1,406,460 $ 806,018 $ 857,310 $ 7,350,549
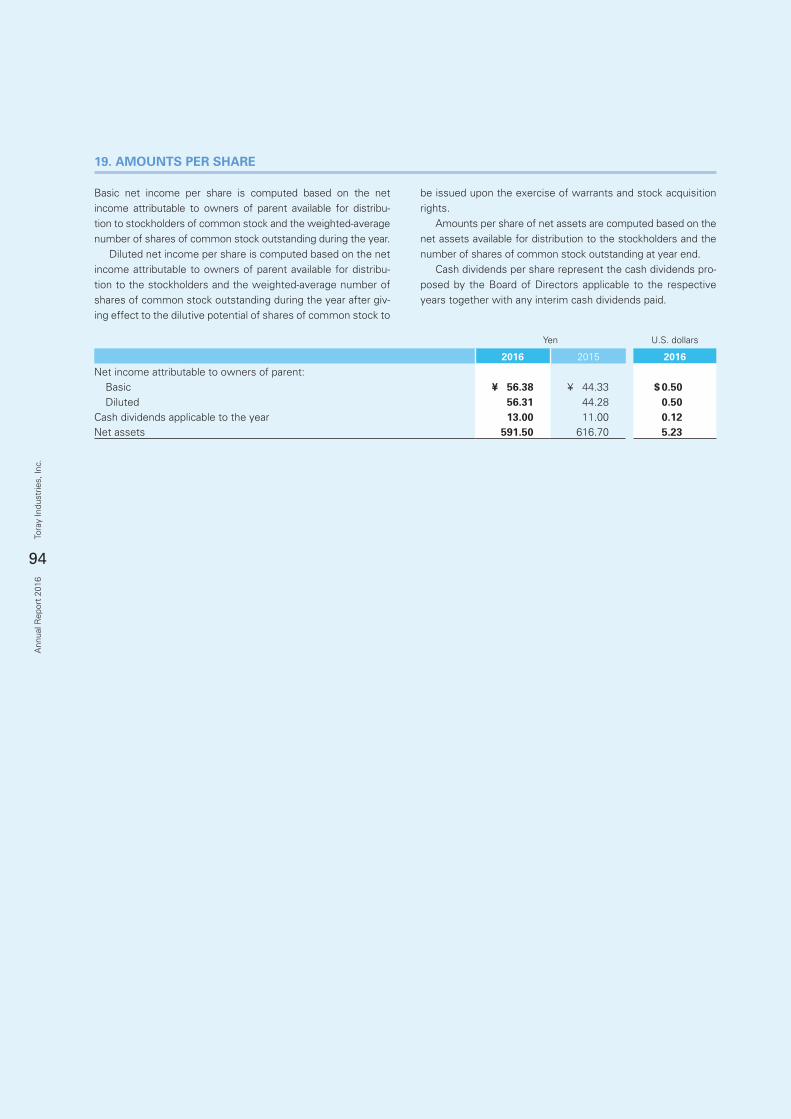
94
Tora
y In
dust
ries,
Inc.
Ann
ual R
epor
t 20
16
19. AMOUNTS PER SHARE
Basic net income per share is computed based on the net income attributable to owners of parent available for distribu-tion to stockholders of common stock and the weighted-average number of shares of common stock outstanding during the year. Diluted net income per share is computed based on the net income attributable to owners of parent available for distribu-tion to the stockholders and the weighted-average number of shares of common stock outstanding during the year after giv-ing effect to the dilutive potential of shares of common stock to
be issued upon the exercise of warrants and stock acquisition rights. Amounts per share of net assets are computed based on the net assets available for distribution to the stockholders and the number of shares of common stock outstanding at year end. Cash dividends per share represent the cash dividends pro-posed by the Board of Directors applicable to the respective years together with any interim cash dividends paid.
Yen U.S. dollars
2016 2015 2016
Net income attributable to owners of parent: Basic ¥ 56.38 ¥ 44.33 $ 0.50 Diluted 56.31 44.28 0.50Cash dividends applicable to the year 13.00 11.00 0.12Net assets 591.50 616.70 5.23
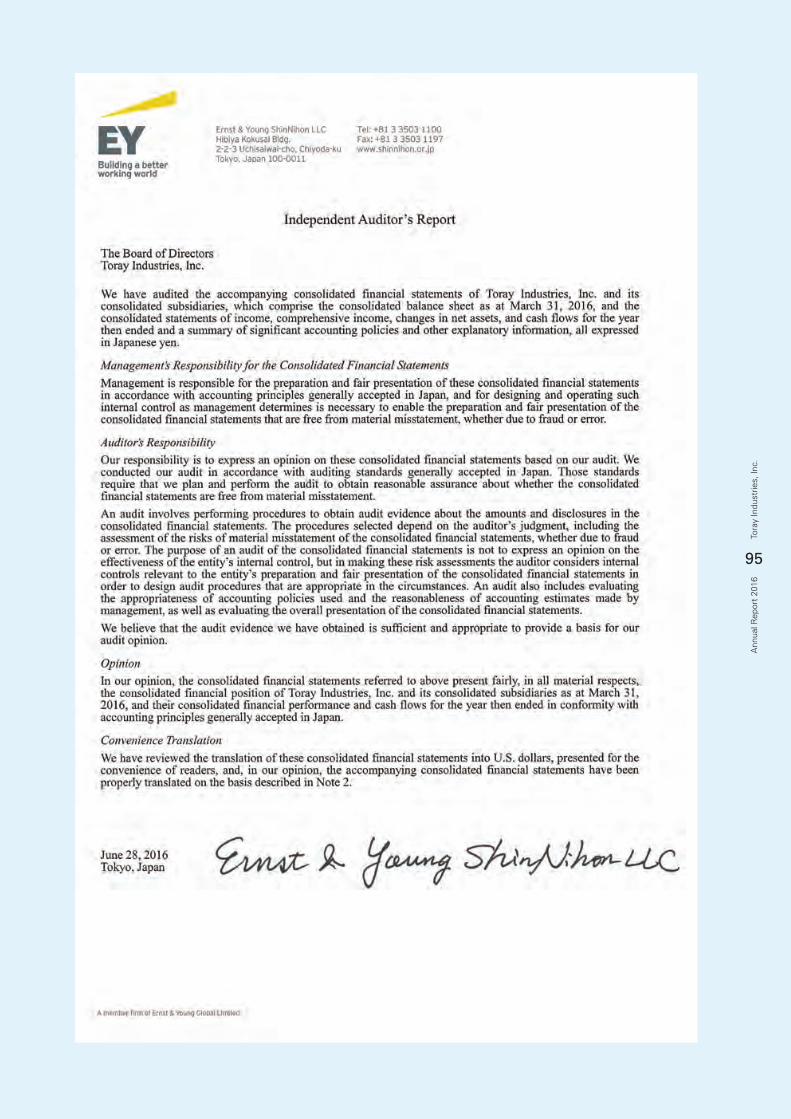
95
Tora
y In
dust
ries,
Inc.
Ann
ual R
epor
t 20
16
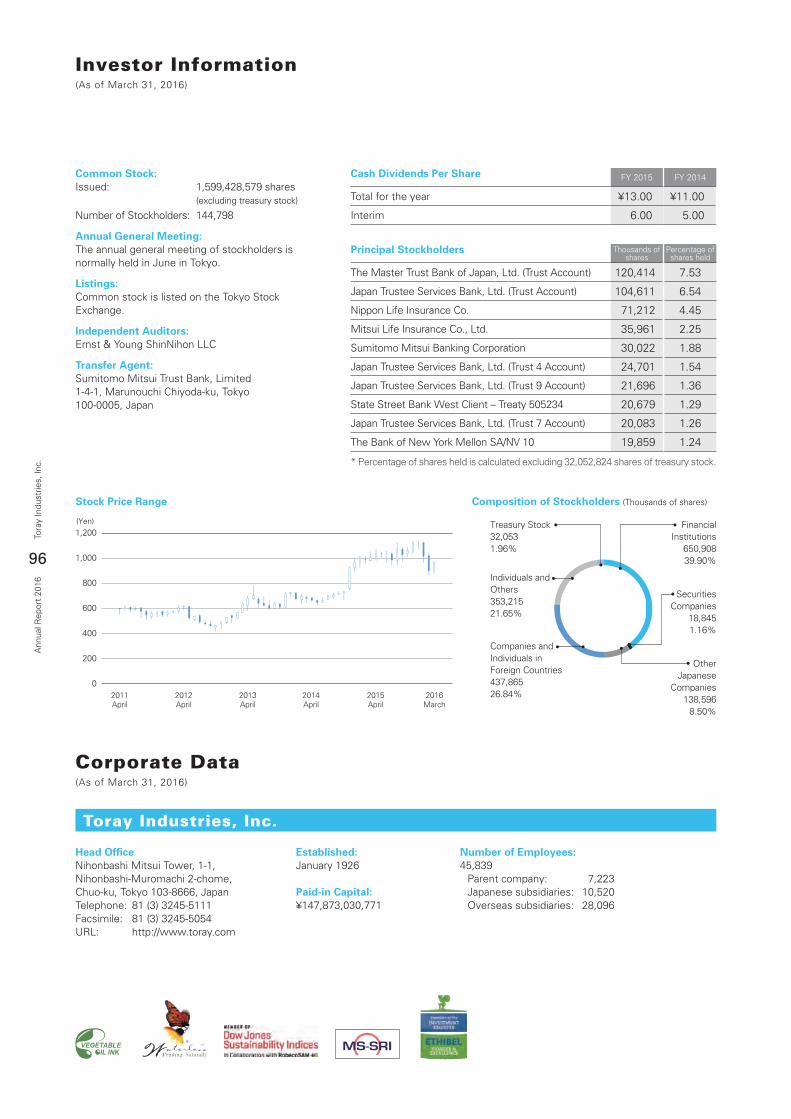
96
Tora
y In
dust
ries,
Inc.
Ann
ual R
epor
t 20
16
Investor Information(As of March 31, 2016)
Corporate Data(As of March 31, 2016)
Common Stock:Issued: 1,599,428,579 shares (excluding treasury stock)
Number of Stockholders: 144,798
Annual General Meeting:The annual general meeting of stockholders isnormally held in June in Tokyo.
Listings:Common stock is listed on the Tokyo Stock Exchange.
Independent Auditors:Ernst & Young ShinNihon LLC
Transfer Agent:Sumitomo Mitsui Trust Bank, Limited1-4-1, Marunouchi Chiyoda-ku, Tokyo100-0005, Japan
Cash Dividends Per Share FY 2015 FY 2014
Total for the year ¥13.00 ¥11.00
Interim 6.00 5.00
Principal Stockholders Thousands ofshares
Percentage ofshares held
The Master Trust Bank of Japan, Ltd. (Trust Account) 120,414 7.53
Japan Trustee Services Bank, Ltd. (Trust Account) 104,611 6.54
Nippon Life Insurance Co. 71,212 4.45
Mitsui Life Insurance Co., Ltd. 35,961 2.25
Sumitomo Mitsui Banking Corporation 30,022 1.88
Japan Trustee Services Bank, Ltd. (Trust 4 Account) 24,701 1.54
Japan Trustee Services Bank, Ltd. (Trust 9 Account) 21,696 1.36
State Street Bank West Client – Treaty 505234 20,679 1.29
Japan Trustee Services Bank, Ltd. (Trust 7 Account) 20,083 1.26
The Bank of New York Mellon SA/NV 10 19,859 1.24
Stock Price Range Composition of Stockholders (Thousands of shares)
1,200(Yen)
1,000
800
600
200
400
02011April
2012April
2013April
2014April
2015April
2016March
FinancialInstitutions
650,90839.90%
Individuals andOthers353,21521.65%
Treasury Stock32,0531.96%
Companies andIndividuals inForeign Countries437,86526.84%
SecuritiesCompanies
18,8451.16%
OtherJapanese
Companies138,596
8.50%
* Percentage of shares held is calculated excluding 32,052,824 shares of treasury stock.
Head OfficeNihonbashi Mitsui Tower, 1-1,Nihonbashi-Muromachi 2-chome,Chuo-ku, Tokyo 103-8666, JapanTelephone: 81 (3) 3245-5111Facsimile: 81 (3) 3245-5054URL: http://www.toray.com
Established:January 1926
Paid-in Capital:¥147,873,030,771
Number of Employees:45,839 Parent company: 7,223 Japanese subsidiaries: 10,520 Overseas subsidiaries: 28,096
Toray Industries, Inc.

97
Tora
y In
dust
ries,
Inc.
Ann
ual R
epor
t 20
16
T O R A Y I S M
Toray Industries, Inc.
1-1, Nihonbashi-Muromachi 2-chome,Chuo-ku, Tokyo 103-8666, JapanTelephone: 81(3)3245-5111Facsimile: 81(3)3245-5054URL: http://www.toray.com
For questions about this report:Contact IR Dept.Telephone: 81(3)3245-5113Facsimile: 81(3)3245-5459e-mail: [email protected]
Printed in JapanIssued: September 2016