Embed Size (px)
Citation preview
Springtime Airmass Transport Pathways to the US
Prepared by:Bret A. Schichtel and Rudolf B. Husar
Center for Air Pollution Impact and Trend Analysis (CAPITA)Washington University
Saint Louis, Missouri 63130
Submitted to:Chris Saint, Project Officer
U.S. Environmental Protection AgencyResearch Triangle Park, NC 27711
Cooperative Agreement No. CR 825211Subcontract from MCNC
Contract No. C00-7050-840
January 7, 2000
Final Report

Introduction
• Anthropogenic and natural pollutants generated in one country are regularly transported to other countries adding to their air quality burden.
• Generally, the concentration of transboundary pollutants impacting the US is a small addition to the natural background. However, under the proper combination of high emissions and favorable meteorological conditions transboundary pollutants can significantly add to the U.S. air quality burden.
• This work is a first step toward assessing the transboundary transport of pollutants to the US. The global scale transport pathways to the borders of the United States are explored during the Spring (February, March, April) 1999.
• The transport analysis is conducted using airmass histories.
• This analysis compliments the analysis “Modeling the Episodic Transport of Air Pollutants from Asia to North America” by Hanna et al., 1999

Airmass History Definition
•An airmass history is an estimate of the 3-D transport pathway (trajectory) of an airmass prior to arriving at a specific receptor location and arrival time.
•Meteorological state variables, e.g. temperature and humidity, are saved along the airmass trajectory.
•Multiple particles are used to simulate each airmass. Horizontal and vertical mixing are included in the airmass history calculation causing particles emitted at the same time to follow different trajectories.
The history of an airmass arriving at Acadia NP, ME on 7/19/95 noon
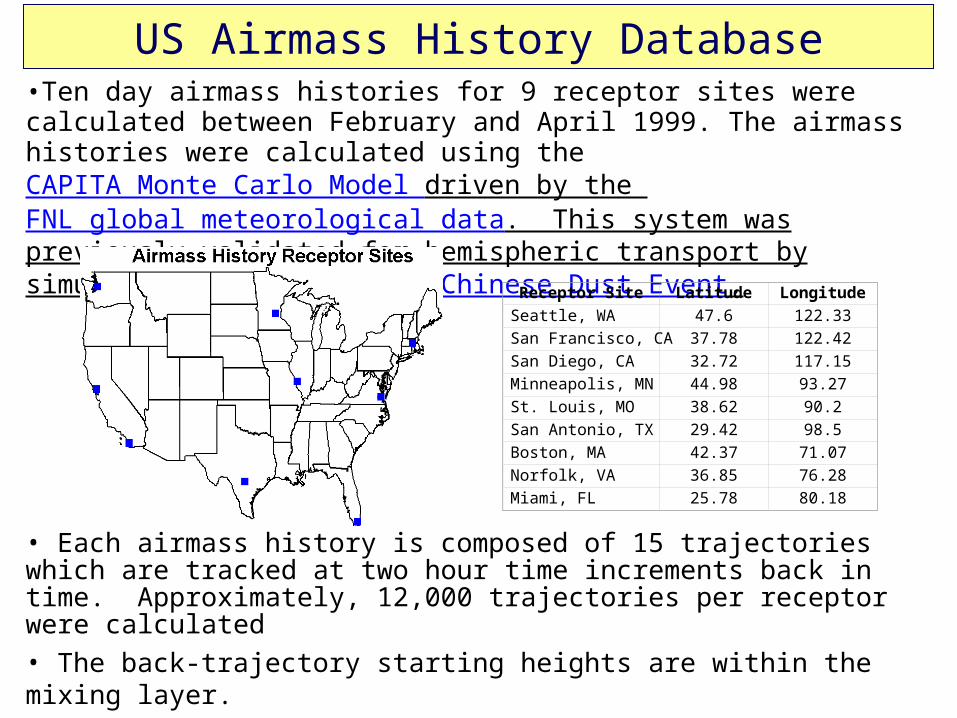
US Airmass History Database•Ten day airmass histories for 9 receptor sites were calculated between February and April 1999. The airmass histories were calculated using the CAPITA Monte Carlo Model driven by the FNL global meteorological data. This system was previously validated for hemispheric transport by simulating the April 1998 Chinese Dust Event.
Receptor Site Latitude Longitude
Seattle, WA 47.6 122.33
San Francisco, CA 37.78 122.42
San Diego, CA 32.72 117.15
Minneapolis, MN 44.98 93.27
St. Louis, MO 38.62 90.2
San Antonio, TX 29.42 98.5
Boston, MA 42.37 71.07
Norfolk, VA 36.85 76.28
Miami, FL 25.78 80.18
• Each airmass history is composed of 15 trajectories which are tracked at two hour time increments back in time. Approximately, 12,000 trajectories per receptor were calculated
• The back-trajectory starting heights are within the mixing layer.• Temperature, Relative Humidity, Cloud coverage, Precipitation rate, and Mixing height are also saved out along each trajectory.
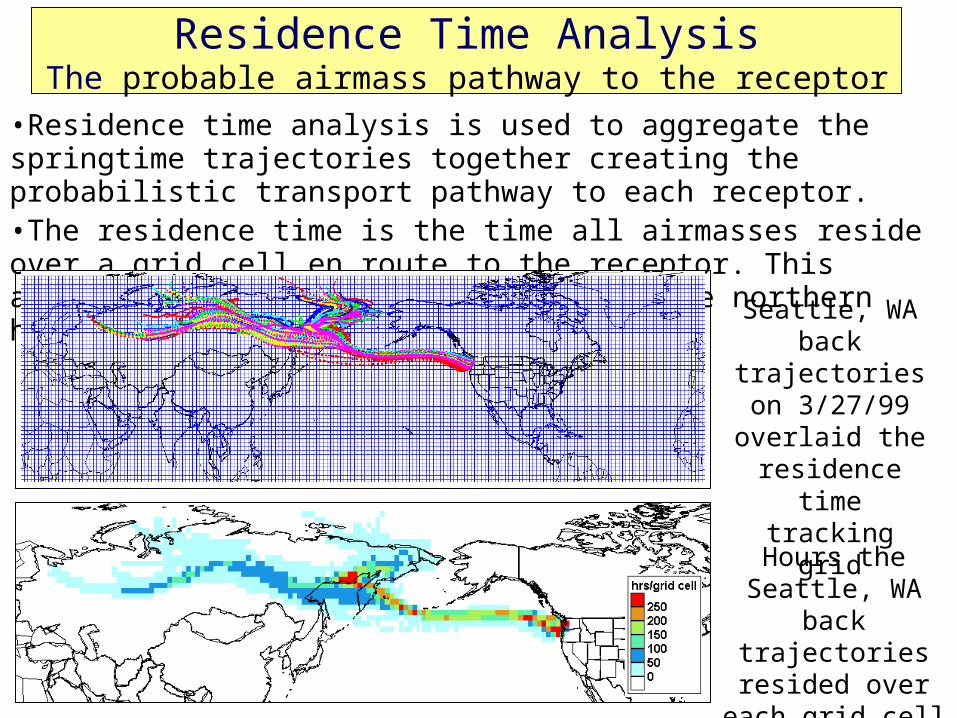
Residence Time AnalysisThe probable airmass pathway to the receptor
•Residence time analysis is used to aggregate the springtime trajectories together creating the probabilistic transport pathway to each receptor.•The residence time is the time all airmasses reside over a grid cell en route to the receptor. This analysis used a 1.8o X 1.3o grid over the northern hemisphere.
Seattle, WA back trajectories on
3/27/99 overlaid the residence time
tracking grid
Hours the Seattle, WA back trajectories
resided over each grid cell

Airmass Probabilistic Transport Pathways•The grid level residence times hours are divided by the total time the airmasses reside over the entire domain and the area of the grid cell. •The resulting probability density function identifies the probability of an airmass traversing a given area prior to impacting the receptor.•The residence time probability fields are displayed as isopleth plots where the boundary of each shaded region is along a line of constant probability. The red shaded areas have the highest probability of airmass traversal and the light blue areas have the smallest probability. •The most probable pathways of airmass transport to the receptor are along the “ridges” of the isopleth plot.
Seattle, WA residence time probability field on 3/27/99
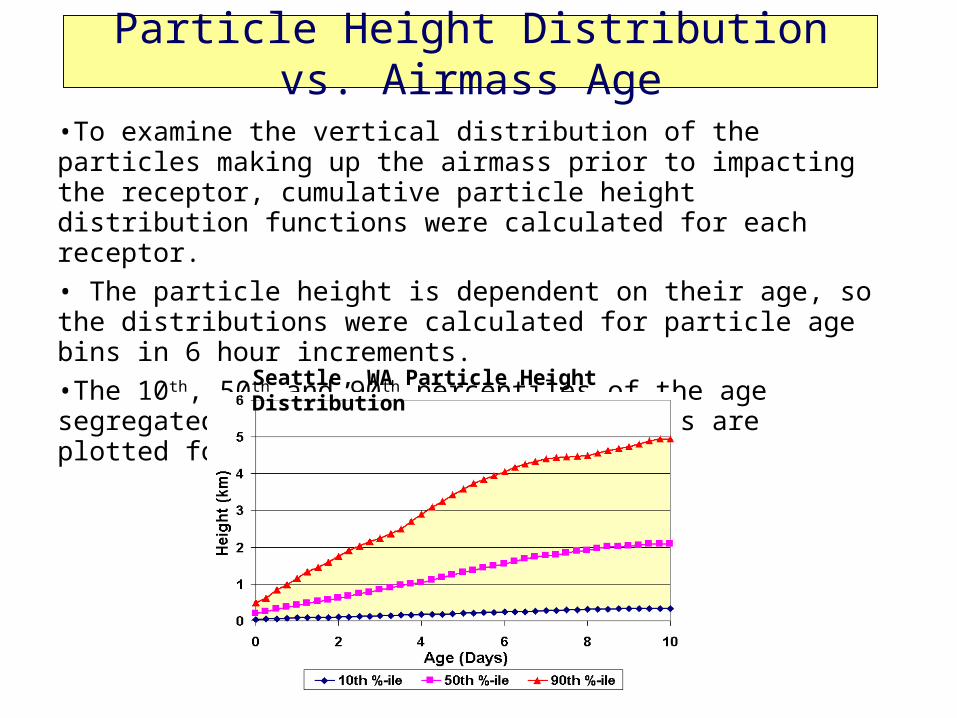
Particle Height Distribution vs. Airmass Age
•To examine the vertical distribution of the particles making up the airmass prior to impacting the receptor, cumulative particle height distribution functions were calculated for each receptor.
• The particle height is dependent on their age, so the distributions were calculated for particle age bins in 6 hour increments.
•The 10th, 50th and 90th percentiles of the age segregated particle height distributions are plotted for each receptor site.
Seattle, WA Particle Height Distribution
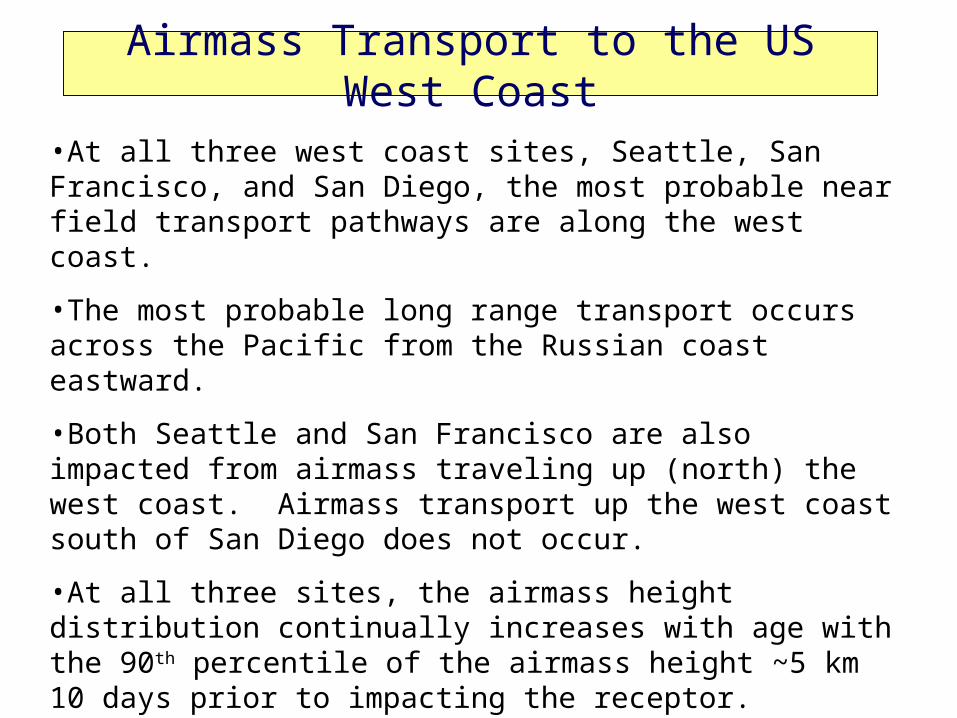
Airmass Transport to the US West Coast
•At all three west coast sites, Seattle, San Francisco, and San Diego, the most probable near field transport pathways are along the west coast.
•The most probable long range transport occurs across the Pacific from the Russian coast eastward.
•Both Seattle and San Francisco are also impacted from airmass traveling up (north) the west coast. Airmass transport up the west coast south of San Diego does not occur.
•At all three sites, the airmass height distribution continually increases with age with the 90th percentile of the airmass height ~5 km 10 days prior to impacting the receptor.

Airmass History Transport to the West CoastProbabilistic Transport Pathways to:
Seattle, WA
San Francisco, CA
San Diego, CA
Particle Height Distribution
Prob. of Airmass Traversing Asia = 0.08
Prob. of Airmass Traversing Asia = 0.08
Prob. of Airmass Traversing Asia = 0.045

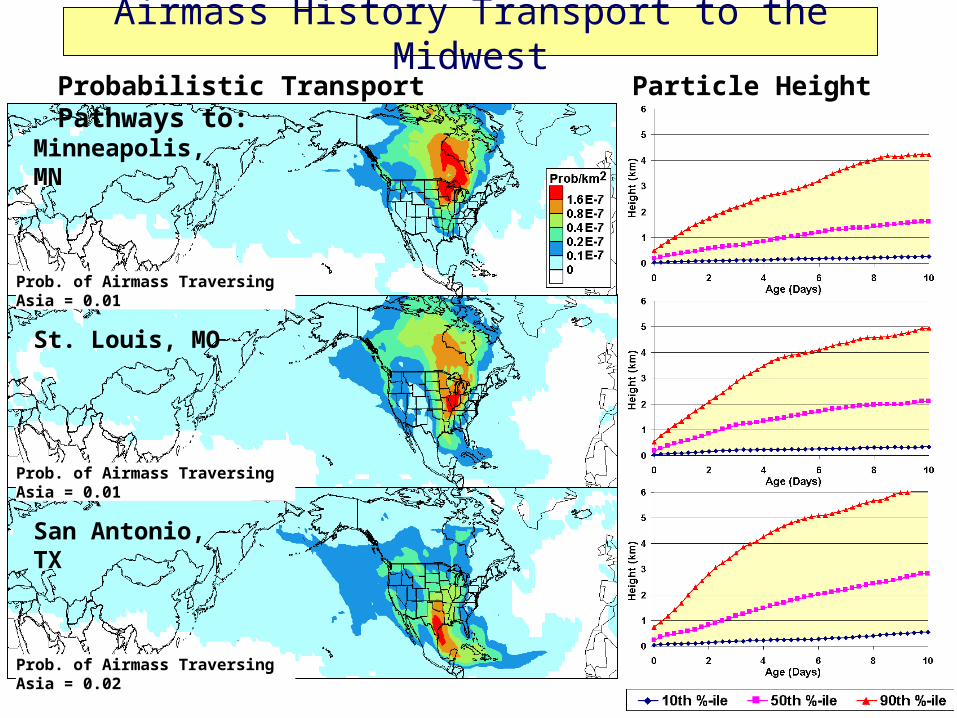
Airmass Transport to the Midwest
•At Minneapolis, the most probable transport occurs from the north over Canada.
•Airmass transport to St. Louis is most likely to come from the north. However, transport from the south also occurs a significant fraction of the time.
•In the south at San Antonia, the most probable transport pathways are from the Gulf of Mexico and along the coast of Central America and Mexico. This receptor is also likely to be impacted by airmasses from the north traversing the Great Plains and the west from the Pacific Ocean
•At all sites, the particle height distributions continually increase with age. However, the vertical distribution increases to the south with a maximum particle 90th percentile height of 4 km at Minneapolis and 6 km at San Antonio.
Airmass History Transport to the MidwestProbabilistic Transport Pathways to:
Minneapolis, MN
St. Louis, MO
San Antonio, TX
Particle Height Distribution
Prob. of Airmass Traversing Asia = 0.01
Prob. of Airmass Traversing Asia = 0.01
Prob. of Airmass Traversing Asia = 0.02

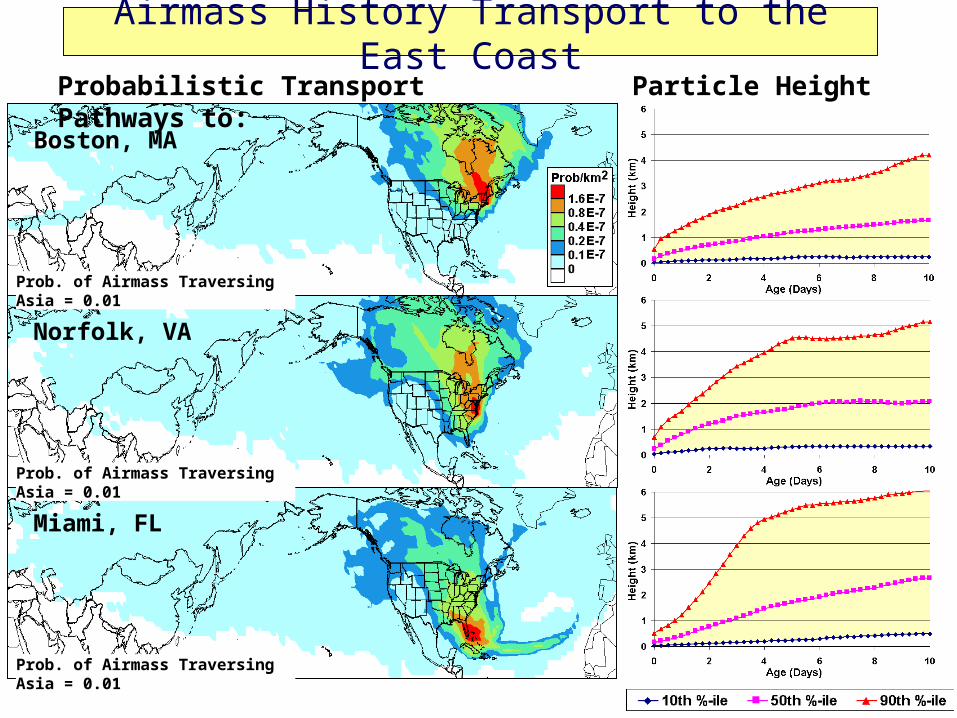
Airmass History Transport to the East Coast
• At Boston, the most probable transport occurs from the north, similar to Minneapolis.
• Airmass transport to Norfolk mostly likely comes from the north but transport from the south is also likely to occur.
• The most probable transport pathways to Miami occurs from the east over the Atlantic Ocean. Significant airmass transport also occurs over the Eastern US prior to impacting Miami.
• The particle height distributions increase to the south with the maximum particle 90th percentile height of 4 and 8 km at Boston and Miami respectively. The particle height distributions at Norfolk and Miami leveled out at airmass ages of 5 to 7 days.
Airmass History Transport to the East CoastProbabilistic Transport Pathways to:
Boston, MA
Norfolk, VA
Miami, FL
Particle Height Distribution
Prob. of Airmass Traversing Asia = 0.01
Prob. of Airmass Traversing Asia = 0.01
Prob. of Airmass Traversing Asia = 0.01

Conclusions
• The analysis examined the most probable airmass transport pathways to the US using 10 day airmass histories from receptors along the US borders during the spring of 1999.
• The transboundary transport pattern is geographically dependent such that:
•The west coast is most likely to be impacted by airmasses that had traversed Russia and Northern China and the west coast of Canada.
•Airmasses impacting the north and central US east of the Rocky Mnts likely traversed Canada.
•Airmasses impacting Texas likely traversed Central America and Texas.
Desirable Future Analysis and Refinements
•Some back-trajectories never pass through the mixing layer but descend from high altitudes without being exposed to surface-based emissions. Subsequent analyses will need to examine separately the high and low elevation airmass transport.
•Quantifying the airmass elevation is critical to understanding the long range transport. The particle height distributions vs age used in this analysis is only a crude method for exploring the airmass elevation. For example, this analysis provides no indication of the geographic variability in elevation. New methods for quantifying and displaying the airmass elevation need to be devised.

![arXiv:0904.2020v2 [astro-ph.SR] 8 May 2009 · after sunset at airmass 1.93 (4.1 hours east of the meridian, so the initially large airmass decreased quickly) when it was magnified](https://img.pdfslide.us/doc/110x75/5e1b71ce16c33b7e110de503/arxiv09042020v2-astro-phsr-8-may-2009-after-sunset-at-airmass-193-41-hours.jpg)