Embed Size (px)
Citation preview
Dependence of Light Extinction on Relative Humidity Derived from Ambient Monitoring Data
Bret A. Schichtel and Rudolf B. Husar
Center for Air Pollution Impact and Trend Analysis (CAPITA)Washington University
Saint Louis, Missouri 63130
Background
•As hygroscopic aerosols are humidified, their light extinction increases due to the uptake of water increasing the particle sizes.
•Hygroscopic aerosols that have past the deliquescent point retain water as they are dried. Therefore, the light scattering to relative humidity (RH) relationship depends on whether wet aerosol is being dried, decreasing RH, or dry aerosol is being humidified, increasing RH.
•The light extinction to RH relationship also depends on the aerosol composition. The aerosol composition varies with time and space so it is expected that changes in light extinction will vary accordingly.
•This analysis examines the light extinction to RH relationship using measured light scattering from nephelometers and light extinction from airport visibility data. The dependence of the relationship on increasing and decrease RH curves and different airmasses is also investigated.
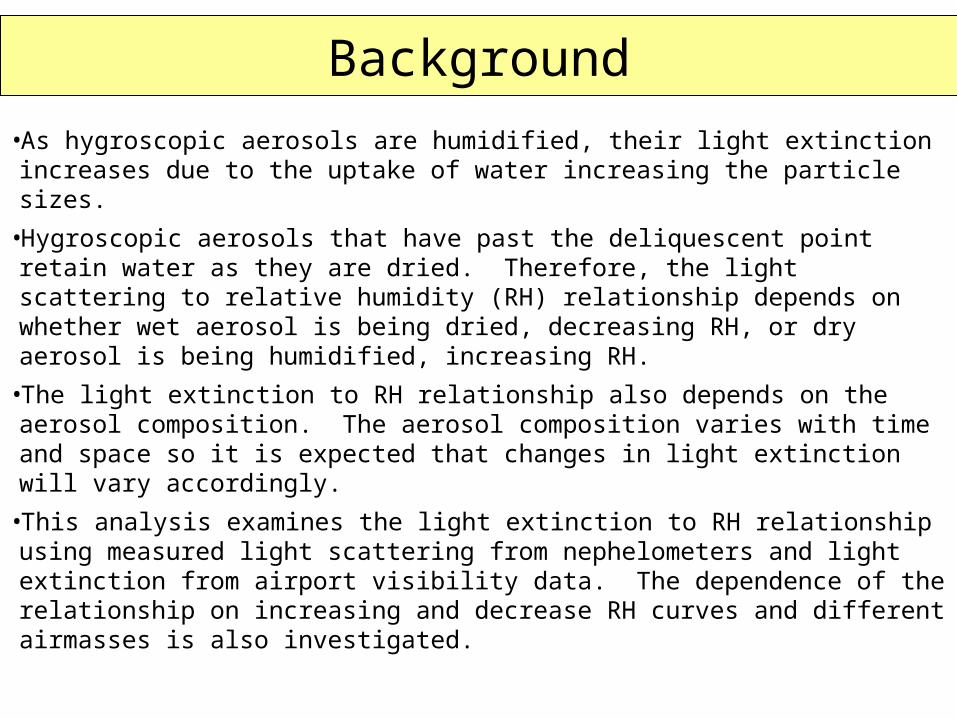
IMPROVE Light Scattering Data
•The analysis used nephelometer light scattering data from the IMPROVE network during the summer time, June, July and August, from 1993 – 98.
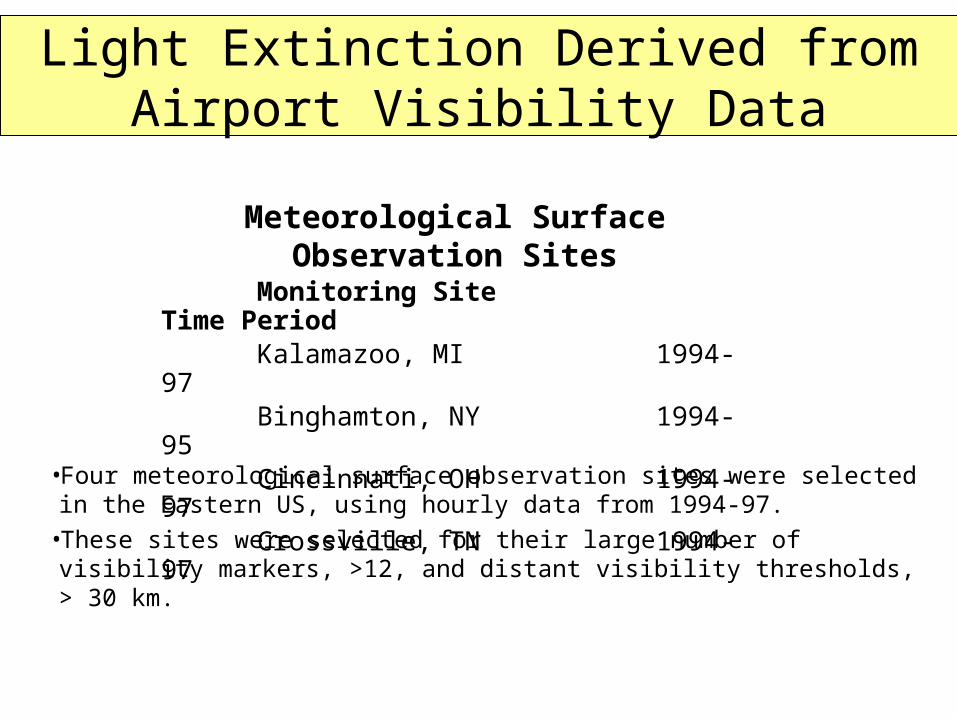
Light Extinction Derived from Airport Visibility Data
•Four meteorological surface observation sites were selected in the Eastern US, using hourly data from 1994-97.
•These sites were selected for their large number of visibility markers, >12, and distant visibility thresholds, > 30 km.
Meteorological Surface Observation Sites Monitoring Site Time Period Kalamazoo, MI 1994-97 Binghamton, NY 1994-95 Cincinnati, OH 1994-97 Crossville, TN 1994-97
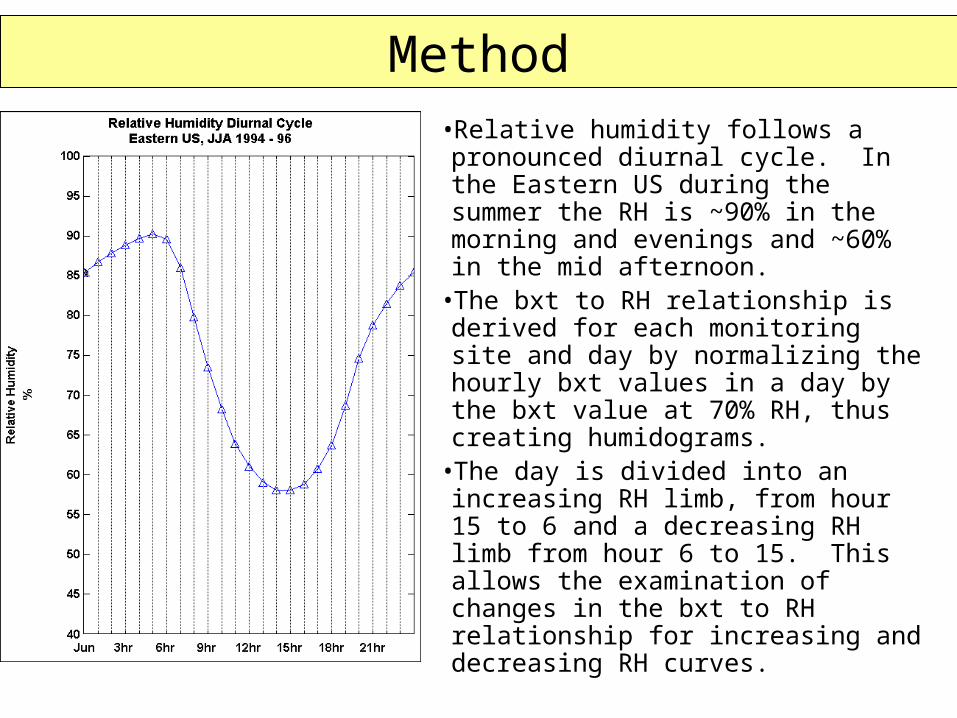
Method•Relative humidity follows a pronounced diurnal cycle. In the Eastern US during the summer the RH is ~90% in the morning and evenings and ~60% in the mid afternoon.
•The bxt to RH relationship is derived for each monitoring site and day by normalizing the hourly bxt values in a day by the bxt value at 70% RH, thus creating humidograms.
•The day is divided into an increasing RH limb, from hour 15 to 6 and a decreasing RH limb from hour 6 to 15. This allows the examination of changes in the bxt to RH relationship for increasing and decreasing RH curves.
Airmass Segregation by Dew Point Temperature
•The history of an airmass at a receptor changes dramatically from one day to another changing the aerosol composition.
•The dew point temperature can be used as an airmass tracer.
•To account for the dependence of the humidogram on the airmass history separate humidograms were developed for days with low humidity, Dew Pt. < 15 oc, mid humidity 15 oc < Dew Pt. < 20 oc and high humidity, Dew Pt. > 20 oc
Picture on its way(Maybe)
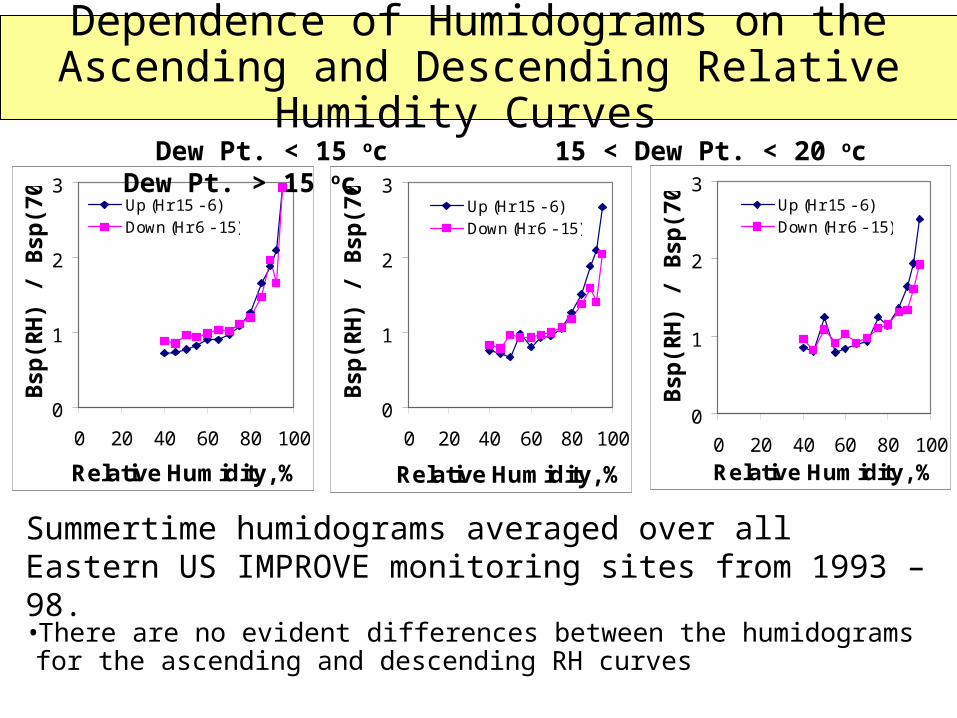
Dependence of Humidograms on the Ascending and Descending Relative Humidity Curves
•There are no evident differences between the humidograms for the ascending and descending RH curves
0
1
2
3
0 20 40 60 80 100
Relative Humidity, %
Bs
p(R
H)
/ Bs
p(7
0) Up (Hr 15 - 6)
Down (Hr 6 - 15)
0
1
2
3
0 20 40 60 80 100
Relative Humidity, %
Bs
p(R
H)
/ Bs
p(7
0) Up (Hr 15 - 6)
Down (Hr 6 - 15)
0
1
2
3
0 20 40 60 80 100
Relative Humidity, %
Bs
p(R
H)
/ Bs
p(7
0) Up (Hr 15 - 6)
Down (Hr 6 - 15)
Dew Pt. < 15 oc 15 < Dew Pt. < 20 oc Dew Pt. > 15 oc
Summertime humidograms averaged over all Eastern US IMPROVE monitoring sites from 1993 – 98.
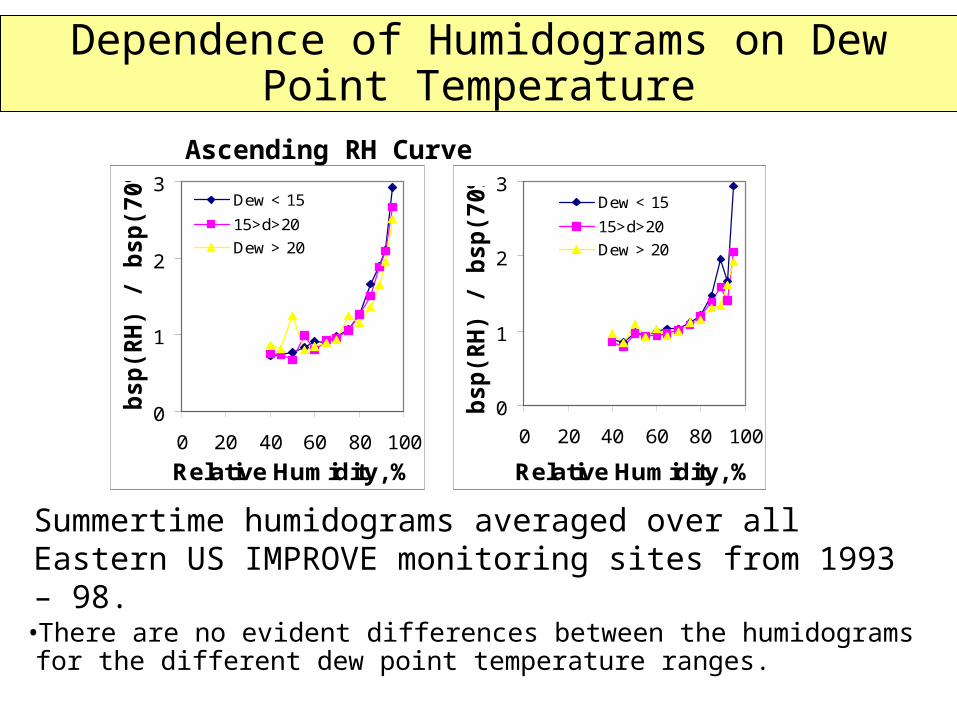
Dependence of Humidograms on Dew Point Temperature
•There are no evident differences between the humidograms for the different dew point temperature ranges.
Ascending RH Curve Descending RH Curve
Summertime humidograms averaged over all Eastern US IMPROVE monitoring sites from 1993 – 98.
0
1
2
3
0 20 40 60 80 100
Relative Humidity, %
bs
p(R
H)
/ bs
p(7
0%
)
Dew < 15
15>d>20
Dew > 20
0
1
2
3
0 20 40 60 80 100
Relative Humidity, %b
sp
(RH
) / b
sp
(70
%)
Dew < 15
15>d>20
Dew > 20
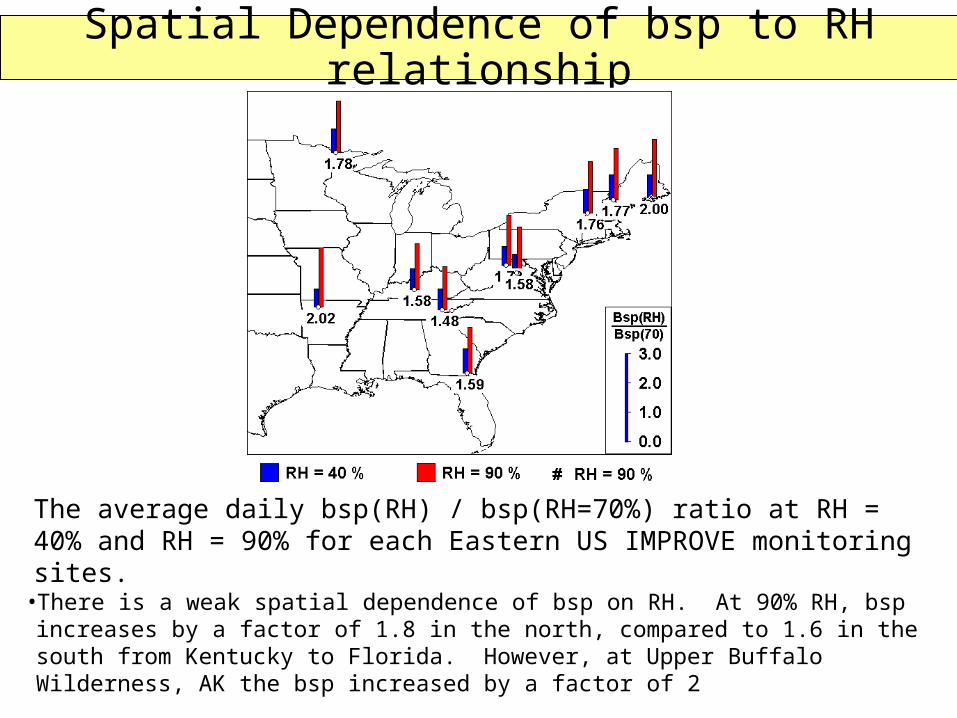
Spatial Dependence of bsp to RH relationship
•There is a weak spatial dependence of bsp on RH. At 90% RH, bsp increases by a factor of 1.8 in the north, compared to 1.6 in the south from Kentucky to Florida. However, at Upper Buffalo Wilderness, AK the bsp increased by a factor of 2
The average daily bsp(RH) / bsp(RH=70%) ratio at RH = 40% and RH = 90% for each Eastern US IMPROVE monitoring sites.

Average Summertime Humidogram
Mammoth Cave, KT Humidogram
0
1
2
3
4
5
6
7
8
0 20 40 60 80 100Relative Humidity, %
Bsp
(RH
) /
Bsp
(RH
=70
)
One Hour Values
Average
Hourly summertime data from the ascending RH curve, hours 15 –6, at Mammoth Cave, KT
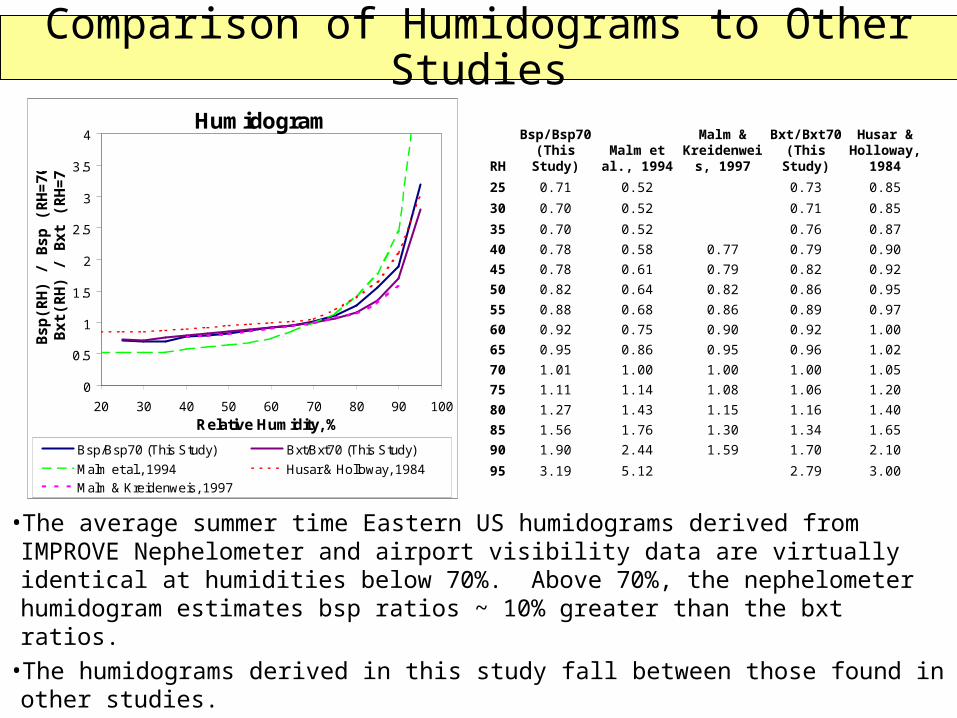
Comparison of Humidograms to Other Studies
•The average summer time Eastern US humidograms derived from IMPROVE Nephelometer and airport visibility data are virtually identical at humidities below 70%. Above 70%, the nephelometer humidogram estimates bsp ratios ~ 10% greater than the bxt ratios.
•The humidograms derived in this study fall between those found in other studies.
Humidogram
0
0.5
1
1.5
2
2.5
3
3.5
4
20 30 40 50 60 70 80 90 100
Relative Humidity, %
Bsp
(RH
) / B
sp (
RH
=70
)B
xt(R
H)
/ Bxt
(R
H=
70)
Bsp/Bsp70 (This Study) Bxt/Bxt70 (This Study)
Malm et al., 1994 Husar & Holloway, 1984
Malm & Kreidenweis, 1997
RHBsp/Bsp70
(This Study)Malm et al.,
1994
Malm & Kreidenweis,
1997Bxt/Bxt70
(This Study)
Husar & Holloway,
1984
25 0.71 0.52 0.73 0.85
30 0.70 0.52 0.71 0.85
35 0.70 0.52 0.76 0.87
40 0.78 0.58 0.77 0.79 0.90
45 0.78 0.61 0.79 0.82 0.92
50 0.82 0.64 0.82 0.86 0.95
55 0.88 0.68 0.86 0.89 0.97
60 0.92 0.75 0.90 0.92 1.00
65 0.95 0.86 0.95 0.96 1.02
70 1.01 1.00 1.00 1.00 1.05
75 1.11 1.14 1.08 1.06 1.20
80 1.27 1.43 1.15 1.16 1.40
85 1.56 1.76 1.30 1.34 1.65
90 1.90 2.44 1.59 1.70 2.10
95 3.19 5.12 2.79 3.00
Conclusions
•The humidograms derived from the measured data were insensitive to changes in dew point temperature and the ascending and descending limbs of the diurnal RH curve.
•The spatial dependence of the humidograms is mixed. The North had larger increases in bsp with increase RH than the South from Kentucky to Florida. However, the humidogram in Arkansas was similar to the North’s. Further investigation is needed to verify any spatial dependence.
•Similar humidograms were derived from the nephelometer scattering data and and airport visibility data.
•The humidograms derived in this study fall between those found in other studies.
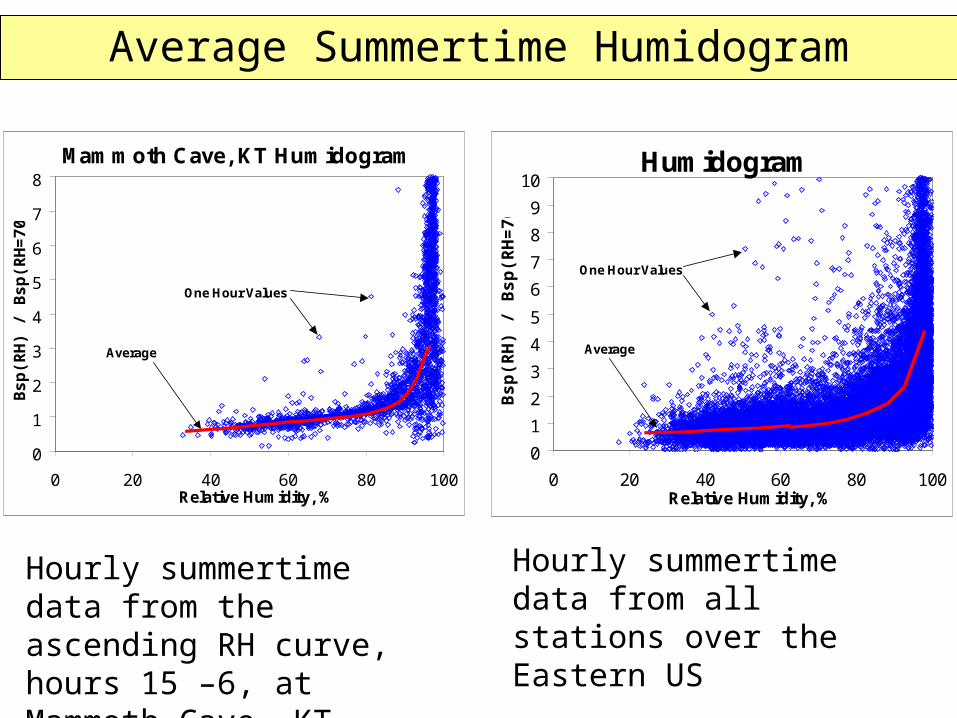
Average Summertime Humidogram
Humidogram
0
1
2
3
4
5
6
7
8
9
10
0 20 40 60 80 100Relative Humidity, %
Bs
p(R
H)
/ B
sp
(RH
=7
0)
One Hour Values
Average
Mammoth Cave, KT Humidogram
0
1
2
3
4
5
6
7
8
0 20 40 60 80 100Relative Humidity, %
Bsp
(RH
) /
Bsp
(RH
=70
)
One Hour Values
Average
Hourly summertime data from all stations over the Eastern US
Hourly summertime data from the ascending RH curve, hours 15 –6, at Mammoth Cave, KT