Embed Size (px)
Citation preview

Springer Handbooks of Computational Statistics
Series Editors
James E. Gentle Wolfgang K. Härdle Yuichi Mori
For further volumes:http://www.springer.com/series/7286
Vincenzo Esposito Vinzi Wynne W. Chin Jörg Henseler Huiwen Wang
Editors
Handbook of Partial Least Squares
Concepts, Methods and Applications
123

Editor-in-Chief
ESSEC Business School of Paris and Singapore Department of Information Systems & Decision Sciences Avenue Bernard Hirsch - B.P. 50105 95021 Cergy-Pontoise Cedex France [email protected]
Nijmegen School of Management Institute for Management Research Radboud Universiteit Nijmegen 6500 HK Nijmegen The Netherlands [email protected]
Editors
Bauer Faculty Fellow Department of Decision and Information Sciences C.T. Bauer College of Business 334 Melcher Hall, room 280D University of Houston Houston, Texas 77204-6282 [email protected]
School of Economic Management BeiHang University 37, XueYuan Road, HaiDian District Beijing 100191 P. R. China [email protected]
ISBN 978-3-540-32825-4 e-ISBN 978-3-540-32827-8 DOI 10.1007/978-3-540-32827-8
Printed on acid-free paper
Springer is part of Springer Science+Business Media (www.springer.com)
Springer Heidelberg Dordrecht London New York
Vincenzo Esposito Vinzi Jörg Henseler
Huiwen Wang Wynne W. Chin
Cover design: deblik, Berlin, Germany
Library of Congress Control Number: 2009943435
©Springer-Verlag Berlin Heidelberg 2010This work is subject to copyright. All rights are reserved, whether the whole or part of the material is concerned, specifically the rights of translation, reprinting, reuse of illustrations, recitation, broadcasting,reproduction on microfilm or in any other way, and storage in data banks. Duplication of this publication
The use of general descriptive names, registered names, trademarks, etc. in this publication does not imply,
or parts thereof is permitted only under the provisions of the German Copyright Law of September 9, 1965,in its current version, and permission for use must always be obtained from Springer. Violations are liableto prosecution under the German Copyright Law.
even in the absence of a specific statement, that such names are exempt from the relevant protective lawsand regulations and therefore free for general use.
Contents
Editorial: Perspectives on Partial Least Squares . . . . . . . . . . . . . . . . . . . . . . . . . . . . . . . 1Vincenzo Esposito Vinzi, Wynne W. Chin, Jorg Henseler,and Huiwen Wang
Part I Methods
PLS Path Modeling: Concepts, Model Estimation and Assessment
1 Latent Variables and Indices: Herman Wold’s BasicDesign and Partial Least Squares . . . . . . . . . . . . . . . . . . . . . . . . . . . . . . . . . . . . . . . . . . . 23Theo K. Dijkstra
2 PLS Path Modeling: From Foundations to RecentDevelopments and Open Issues for Model Assessmentand Improvement . . . . . . . . . . . . . . . . . . . . . . . . . . . . . . . . . . . . . . . . . . . . . . . . . . . . . . . . . . . . . 47Vincenzo Esposito Vinzi, Laura Trinchera, and Silvano Amato
3 Bootstrap Cross-Validation Indices for PLS Path ModelAssessment . . . . . . . . . . . . . . . . . . . . . . . . . . . . . . . . . . . . . . . . . . . . . . . . . . . . . . . . . . . . . . . . . . . . 83Wynne W. Chin
PLS Path Modeling: Extensions
4 A Bridge Between PLS Path Modelingand Multi-Block Data Analysis . . . . . . . . . . . . . . . . . . . . . . . . . . . . . . . . . . . . . . . . . . . . . 99Michel Tenenhaus and Mohamed Hanafi
5 Use of ULS-SEM and PLS-SEM to Measure a GroupEffect in a Regression Model Relating Two Blocksof Binary Variables . . . . . . . . . . . . . . . . . . . . . . . . . . . . . . . . . . . . . . . . . . . . . . . . . . . . . . . . . . .125Michel Tenenhaus, Emmanuelle Mauger,and Christiane Guinot
v
vi Contents
6 A New Multiblock PLS Based Method to Estimate CausalModels: Application to the Post-Consumption Behaviorin Tourism . . . . . . . . . . . . . . . . . . . . . . . . . . . . . . . . . . . . . . . . . . . . . . . . . . . . . . . . . . . . . . . . . . . . .141Francisco Arteaga, Martina G. Gallarza, and Irene Gil
7 An Introduction to a Permutation Based Procedurefor Multi-Group PLS Analysis: Results of Testsof Differences on Simulated Data and a Cross CulturalAnalysis of the Sourcing of Information System ServicesBetween Germany and the USA . . . . . . . . . . . . . . . . . . . . . . . . . . . . . . . . . . . . . . . . . . . .171Wynne W. Chin and Jens Dibbern
PLS Path Modeling with Classification Issues
8 Finite Mixture Partial Least Squares Analysis:Methodology and Numerical Examples . . . . . . . . . . . . . . . . . . . . . . . . . . . . . . . . . . . .195Christian M. Ringle, Sven Wende, and Alexander Will
9 Prediction Oriented Classification in PLS Path Modeling . . . . . . . . . . . . . . .219Silvia Squillacciotti
10 Conjoint Use of Variables Clustering and PLS StructuralEquations Modeling . . . . . . . . . . . . . . . . . . . . . . . . . . . . . . . . . . . . . . . . . . . . . . . . . . . . . . . . . .235Valentina Stan and Gilbert Saporta
PLS Path Modeling for Customer Satisfaction Studies
11 Design of PLS-Based Satisfaction Studies . . . . . . . . . . . . . . . . . . . . . . . . . . . . . . . . .247Kai Kristensen and Jacob Eskildsen
12 A Case Study of a Customer Satisfaction Problem:Bootstrap and Imputation Techniques . . . . . . . . . . . . . . . . . . . . . . . . . . . . . . . . . . . . .279Clara Cordeiro, Alexandra Machas, and Maria Manuela Neves
13 Comparison of Likelihood and PLS Estimatorsfor Structural Equation Modeling: A Simulationwith Customer Satisfaction Data . . . . . . . . . . . . . . . . . . . . . . . . . . . . . . . . . . . . . . . . . . .289Manuel J. Vilares, Maria H. Almeida, and Pedro S. Coelho
14 Modeling Customer Satisfaction: A ComparativePerformance Evaluation of Covariance Structure AnalysisVersus Partial Least Squares . . . . . . . . . . . . . . . . . . . . . . . . . . . . . . . . . . . . . . . . . . . . . . . .307John Hulland, Michael J. Ryan, and Robert K. Rayner

Contents vii
PLS Regression
15 PLS in Data Mining and Data Integration . . . . . . . . . . . . . . . . . . . . . . . . . . . . . . . .327Svante Wold, Lennart Eriksson, and Nouna Kettaneh
16 Three-Block Data Modeling by Endo- and Exo-LPLSRegression . . . . . . . . . . . . . . . . . . . . . . . . . . . . . . . . . . . . . . . . . . . . . . . . . . . . . . . . . . . . . . . . . . . . .359Solve Sæbø, Magni Martens, and Harald Martens
17 Regression Modelling Analysis on Compositional Data . . . . . . . . . . . . . . . . . .381
Part II Applications to Marketing and Related Areas
18 PLS and Success Factor Studies in Marketing . . . . . . . . . . . . . . . . . . . . . . . . . . . .409Sonke Albers
19 Applying Maximum Likelihood and PLS on DifferentSample Sizes: Studies on SERVQUAL Modeland Employee Behavior Model. . . . . . . . . . . . . . . . . . . . . . . . . . . . . . . . . . . . . . . . . . . . . .427Carmen Barroso, Gabriel Cepeda Carrion, and Jose L. Roldan
20 A PLS Model to Study Brand Preference: An Applicationto the Mobile Phone Market . . . . . . . . . . . . . . . . . . . . . . . . . . . . . . . . . . . . . . . . . . . . . . . . .449Paulo Alexandre O. Duarte and Mario Lino B. Raposo
21 An Application of PLS in Multi-Group Analysis:The Need for Differentiated Corporate-Level Marketingin the Mobile Communications Industry . . . . . . . . . . . . . . . . . . . . . . . . . . . . . . . . . .487Markus Eberl
22 Modeling the Impact of Corporate Reputationon Customer Satisfaction and Loyalty Using Partial LeastSquares . . . . . . . . . . . . . . . . . . . . . . . . . . . . . . . . . . . . . . . . . . . . . . . . . . . . . . . . . . . . . . . . . . . . . . . .515Sabrina Helm, Andreas Eggert, and Ina Garnefeld
23 Reframing Customer Value in a Service-BasedParadigm: An Evaluation of a Formative Measurein a Multi-industry, Cross-cultural Context . . . . . . . . . . . . . . . . . . . . . . . . . . . . . . .535David MartKın Ruiz, Dwayne D. Gremler, Judith H. Washburn,and Gabriel Cepeda Carrion
24 Analyzing Factorial Data Using PLS: Applicationin an Online Complaining Context . . . . . . . . . . . . . . . . . . . . . . . . . . . . . . . . . . . . . . . . .567Sandra Streukens, Martin Wetzels, Ahmad Daryanto,and Ko de Ruyter
Huiwen Wang, Jie Meng, and Michel Tenenhaus

viii Contents
25 Application of PLS in Marketing: Content Strategieson the Internet . . . . . . . . . . . . . . . . . . . . . . . . . . . . . . . . . . . . . . . . . . . . . . . . . . . . . . . . . . . . . . . .589Silvia Boßow-Thies and Sonke Albers
26 Use of Partial Least Squares (PLS) in TQM Research:TQM Practices and Business Performance in SMEs . . . . . . . . . . . . . . . . . . . . .605Ali Turkyilmaz, Ekrem Tatoglu, Selim Zaim,and Coskun Ozkan
27 Using PLS to Investigate Interaction Effects BetweenHigher Order Branding Constructs . . . . . . . . . . . . . . . . . . . . . . . . . . . . . . . . . . . . . . . .621Bradley Wilson
Part III Tutorials
28 How to Write Up and Report PLS Analyses. . . . . . . . . . . . . . . . . . . . . . . . . . . . . . .655Wynne W. Chin
29 Evaluation of Structural Equation Models Usingthe Partial Least Squares (PLS) Approach . . . . . . . . . . . . . . . . . . . . . . . . . . . . . . . .691Oliver Gotz, Kerstin Liehr-Gobbers, and Manfred Krafft
30 Testing Moderating Effects in PLS Path Models:An Illustration of Available Procedures . . . . . . . . . . . . . . . . . . . . . . . . . . . . . . . . . . . .713Jorg Henseler and Georg Fassott
31 A Comparison of Current PLS Path Modeling Software:Features, Ease-of-Use, and Performance . . . . . . . . . . . . . . . . . . . . . . . . . . . . . . . . . . .737Dirk Temme, Henning Kreis, and Lutz Hildebrandt
32 Introduction to SIMCA-P and Its Application . . . . . . . . . . . . . . . . . . . . . . . . . . . .757
33 Interpretation of the Preferences of AutomotiveCustomers Applied to Air Conditioning Supportsby Combining GPA and PLS Regression . . . . . . . . . . . . . . . . . . . . . . . . . . . . . . . . . .775Laure Nokels, Thierry Fahmy, and Sebastien Crochemore
Index . . . . . . . . . . . . . . . . . . . . . . . . . . . . . . . . . . . . . . . . . . . . . . . . . . . . . . . . . . . . . . . . . . . . . . . . . . . . . . . . .791
Zaibin Wu, Dapeng Li, Jie Meng, and Huiwen Wang

List of Contributors
Sonke Albers Institute of Innovation Research, Christian-Albrechts-Universityat Kiel, Westring 425, 24098 Kiel, Germany, [email protected]
Maria H. Almeida Faculty of Economics, New University of Lisbon, Campus deCampolide, 1099-032 Lisbon, Portugal, [email protected]
Silvano Amato Dipartimento di Matematica e Statistica, Universita degli Studi diNapoli “Federico II”, Via Cintia 26, Complesso Monte S. Angelo, 80126 Napoli,Italy, [email protected]
Francisco Arteaga Department of Statistics, Universidad Catolica de ValenciaSan Vicente Martir, Guillem de Castro, 175, Valencia 46008, Spain,[email protected]
Carmen Barroso Management and Marketing Department, University of Seville,Ramon y Cajal, 1, 41018 Sevilla, Spain, [email protected]
Silvia Boßow-Thies Capgemini Telecom Media and Networks DeutschlandGmbH, Neues Kanzler Eck 21, 10719 Berlin, Germany,[email protected]
Gabriel Cepeda Carrion Departamento de Administracion de Empresas yMarketing, Universidad de Sevilla, Ramon y Cajal, 1, 41018 Sevilla, Spain,[email protected]
Wynne W. Chin Department of Decision and Information Sciences, BauerCollege of Business, University of Houston, TX, USA, [email protected]
Pedro S. Coelho ISEGI – New University of Lisbon, Campus de Campolide,1070-032 Lisbon, Portugal, [email protected]
Clara Cordeiro Department of Mathematics, FCT, University of Algarve,Campus de Gambelas, 8005-139 Faro, Portugal, [email protected]
Sebastien Crochemore Materials Engineering Department, TechnocentreRenault 1, avenue du Golf, API TCR LAB 252, 78 288 Guyancourt Cedex,France, [email protected]
ix

x List of Contributors
Ahmad Daryanto Department of Business Analysis, Systems and Informa-tion Management, Newcastle Business School, City Campus East,Northumbria University, Newcastle upon Tyne, NE1 8ST, UK,[email protected]
Ko de Ruyter Department of Marketing and Marketing Research, MaastrichtUniversity, P.O. Box 616 6200 MD, The Netherlands, [email protected]
Jens Dibbern Department of Information Engineering, Institute of InformationSystems, University of Bern, Engehaldenstr. 8, Room 204, 3012 Bern, Switzerland,[email protected]
Theo K. Dijkstra SNS Asset Management, Research and Development,Pettelaarpark 120, P.O. Box 70053, 5201 DZ ’s-Hertogenbosch, The Netherlands,[email protected] of Groningen, Economics and Econometrics, Zernike Complex, P.O.Box 800, 9700 AV, Groningen, The Netherlands, [email protected]
Paulo Alexandre de Oliveira Duarte Departamento de Gestao e Economia,Universidade da Beira Interior, Estrada do Sineiro, 6200-209 Covilha, Portugal,[email protected]
Markus Eberl Senior Consultant Models and Methods, TNS Infratest ForschungGmbH, Landsberger Straße 338, 80687 Munchen, Germany,[email protected]
Andreas Eggert University of Paderborn, Warburger Str. 100, 33098 Paderborn,Germany, [email protected]
Lennart Eriksson Umetrics Inc, 17 Kiel Ave, Kinnelon, NJ 07405, USA,[email protected]
Jacob Eskildsen School of Business, University of Aarhus, Haslegaardsvej 10,8210 Aarhus V, Denmark, [email protected]
Vincenzo Esposito Vinzi Dept. of Information Systems and Decision SciencesESSEC Business School of Paris,Avenue Bernard Hirsch – B.P. 50105, 95021 Cergy-Pontoise, Cedex, France,[email protected]
Thierry Fahmy Addinsoft, 40 rue Damremont, 75018 Paris, France,[email protected]
Georg Fassott Department of Marketing, University of Kaiserslautern, Postfach30 49, 67653 Kaiserslautern, Germany, [email protected]
Martina Gonzalez Gallarza Faculty of Economics, Department of Marketing,Universitat de Valencia, Avenida de los Naranjos s/n, Valencia 46022, Spain,[email protected]
Ina Garnefeld University of Paderborn, Warburger Str. 100, 33098 Paderborn,Germany, [email protected]

List of Contributors xi
Irene Gil Department of Marketing, Universitat de Valencia, Avenida de losNaranjos s/n, Valencia 46022, Spain, [email protected]
Oliver Gotz University of Munster, Marketing Centrum Munster, Instituteof Marketing, Am Stadtgraben 13-15, 48143 Munster, Germany,[email protected]
Dwayne D. Gremler Department of Marketing, College of BusinessAdministration, Bowling Green State University, Bowling Green, OH 43403,USA, [email protected]
Christiane Guinot Biometrics and Epidemiology unit, C.E.R.I.E.S, 20 rue VictorNoir, 92521 Neuilly sur Seine, France, [email protected] Science Laboratory, Ecole Polytechnique, University of Tours, France
Mohamed Hanafi Unite Mixte de Recherche (ENITIAA-INRA) en Sensometrieet Chimiometrie, ENITIAA, Rue de la Geraudiere – BP 82225, Nantes 44322,Cedex 3, France, [email protected]
Sabrina Helm University of Arizona, John and Doris Norton School of Family and
USA, [email protected]
Jorg Henseler Nijmegen School of Management, Radboud University Nijmegen,P.O. Box 9108, 6500 HK Nijmegen, The Netherlands, [email protected]
Lutz Hildebrandt Institute of Marketing, Humboldt University Berlin, Unter denLinden 6, 10099 Berlin, Germany, [email protected]
John Hulland Katz Business School, University of Pittsburgh, Pittsburgh,PA 15260, USA, [email protected]
Nouna Kettaneh NNS Consulting, 42 Pine Hill Rd, Hollis, NH 03049, USA,[email protected]
Manfred Krafft University of Munster, Marketing Centrum Munster,Institute of Marketing, Am Stadtgraben 13-15, 48143 Munster, Germany,[email protected]
Henning Kreis Marketing-Department, Freie Universitat Berlin, Schoolof Business and Economics, Otto-von-Simson-Str. 19, 14195 Berlin, Germany,[email protected]
Kai Kristensen School of Business, University of Aarhus, Haslegaardsvej 10,8210 Aarhus V, Denmark, [email protected]
Dapeng Li Agricultural Bank of China, Beijing 100036, China,[email protected]
Kerstin Liehr-Gobbers Hering Schuppener Consulting, Kreuzstraße 60, 40210Dusseldorf, Germany, [email protected]
Consumer Sciences, 650 N. Park Ave, P.O. Box 210078, Tucson, AZ 85721-0078,

xii List of Contributors
Alexandra Machas Polytechnic Institute of Lisbon, Escola Superior deComunicacao Social Campus de Benfica do IPL, 1549-014 Lisboa, Portugal,[email protected]
Harald Martens Norwegian Food Research Institute, Matforsk, 1430 As, Norway,[email protected] of Life Sciences, Department of Food Science, University of Copenhagen,Rolighedsvej 30, 1958 Frederiksberg C, DenmarkandNorwegian University of Life Sciences, IKBM/CIGENE, P.O. Box 5003, 1432 As,Norway
Magni Martens Norwegian Food Research Institute, Matforsk, 1430 As, Norway,[email protected] of Life Sciences, Department of Food Science, University of Copenhagen,Rolighedsvej 30, 1958 Frederiksberg C, Denmark
Emmanuelle Mauger Biometrics and Epidemiology unit, C.E.R.I.E.S, 20 rueVictor Noir, 92521 Neuilly sur Seine, France, [email protected]
Maria Manuela Neves Department of Mathematics, Instituto Superior deAgronomia, Technical University of Lisbon (TULisbon), Tapada da Ajuda,1349-017 Lisboa, Portugal, [email protected]
School of Statistics, Central University of Finance and Economics,Beijing 100081, China, [email protected]
Laure Nokels Materials Engineering Department, Technocentre Renault, 1,avenue du Golf, API TCR LAB 2 52, 78 288 Guyancourt Cedex, France,[email protected]
Coskun Ozkan Department of Industrial Engineering, Kocaeli University,Veziroglu Yerleskesi, 41040 Kocaeli, Turkey, coskun [email protected]
Mario Lino Barata Raposo Departamento de Gestao e Economia, Universidadeda Beira Interior, Estrada do Sineiro, 6200-209 Covilha, Portugal, [email protected]
Robert K. Rayner Market Strategies International, 20255 Victor Parkway, Suite400, Livonia, MI 48152, USA, bob [email protected]
Christian M. Ringle University of Hamburg, Institute for Industrial Managementand Organizations, Von-Melle-Park 5, 20146 Hamburg, Germany,[email protected] of Technology Sydney, Centre for Management and Organization
Jose L. Roldan Management and Marketing Department, University of Seville,Ramon y Cajal, 1, 41018 Sevilla, Spain, [email protected]
Meng Jie
Studies, P.O. Box 123, Broadway NSW 2007, Australia

List of Contributors xiii
David Martın Ruiz Escuela Universitaria de Estudios Empresariales, 41012Sevilla, Spain, [email protected]
Michael J. Ryan Ross School of Business, University of Michigan, P.O. Box 105,Bass Harbor, ME 04653, USA, [email protected]
Solve Sæbø Department of Chemistry, Biotechnology and Food Science (IKBM),Norwegian University of Life Sciences, P.O. Box 5003, 1432 As, Norway,[email protected]
Gilbert Saporta Conservatoire National des Arts et Metiers, Chaire de StatistiqueAppliquee, case 441, 292 rue Saint Martin, 75141 Paris, Cedex 03, France,[email protected]
Silvia Squillacciotti EDF R&D, Departement ICAME, 1 avenue du General deGaulle, 92141 Clamart, France, [email protected]
Valentina Stan Groupe ESSCA Angers, 1 Rue Lakanal – BP 40348, 49003Angers, Cedex 01, France, valentina [email protected]
Sandra Streukens Department of Marketing and Strategy, Universiteit Hasselt,Campus Diepenbeek, Agoralaan Gebouw DBE 3590 Diepenbeek, Belgium,[email protected]
Ekrem Tatoglu Faculty of Economics and Administrative Sciences, Chair ofInternational Trade and Business, Bahcesehir University, Besiktas, Istanbul, Turkey,[email protected]
Dirk Temme Chair of Retailing and Service Management, Schumpeter Schoolof Business and Economics, Bergische Universitat Wuppertal, Gaußstr. 20, 42097Wuppertal, Germany, [email protected]
Michel Tenenhaus Department of SIAD, HEC School of Management, 1 rue dela Liberation, 78351 Jouy-en-Josas, France, [email protected]
Laura Trinchera Dipartimento di Matematica e Statistica, Universita degli Studidi Napoli “Federico II”, Via Cintia, 26 – Complesso Monte S. Angelo, 80126Napoli, Italy, [email protected]
Ali Turkyilmaz Department of Industrial Engineering, Fatih University,Buyukcekmece, 34500 Istanbul, Turkey, [email protected]
Manuel J. Vilares ISEGI – New University of Lisbon, Campus de Campolide,1070-032 Lisbon, Portugal, [email protected]
School of Economics and Management, Beihang University, 37Xueyuan Road, Haidian District, Beijing 100083, China, [email protected]
Judith H. Washburn John H. Sykes College of Business, University of Tampa,401 W. Kennedy Blvd., UT Box 48F, Tampa, FL 33606, USA, [email protected]
Sven Wende University of Hamburg, Institute for Industrial Managementand Organizations, Von-Melle-Park 5, 20146 Hamburg, Germany,[email protected]
Wang Huiwen

xiv List of Contributors
Martin Wetzels Department of Marketing and Marketing Research, MaastrichtUniversity, P.O. Box 616 6200 MD, The Netherlands, [email protected]
Alexander Will University of Hamburg, Institute for Industrial Management andOrganizations, Von-Melle-Park 5, 20146 Hamburg, Germany,[email protected]
Bradley Wilson School of Media and Communication, RMIT University, 124LaTrobe Street, GPO Box 2476V, Melbourne, Victoria 3000, Australia,[email protected]
Svante Wold NNS Consulting, 42 Pine Hill Rd, Hollis, NH 03049, USA,[email protected]
School of Economics and Management, Beihang University, 37Xueyuan Road, Haidian District, Beijing 100083, China, [email protected]
Selim Zaim Department of Management, Fatih University, Buyukcekmece,Istanbul 34500, Turkey, [email protected]
Wu Zaibin
Editorial: Perspectives on Partial Least Squares
Vincenzo Esposito Vinzi, Wynne W. Chin, Jorg Henseler, and Huiwen Wang
1 Partial Least Squares: A Success Story
This Handbook on Partial Least Squares (PLS) represents a comprehensive presen-tation of the current, original and most advanced research in the domain of PLSmethods with specific reference to their use in Marketing-related areas and with adiscussion of the forthcoming and most challenging directions of research and per-spectives. The Handbook covers the broad area of PLS Methods from Regressionto Structural Equation Modeling, from methods to applications, from software tointerpretation of results. This work features papers on the use and the analysis oflatent variables and indicators by means of the PLS Path Modeling approach fromthe design of the causal network to the model assessment and improvement. More-over, within the PLS framework, the Handbook addresses, among others, specialand advanced topics such as the analysis of multi-block, multi-group and multi-structured data, the use of categorical indicators, the study of interaction effects,the integration of classification issues, the validation aspects and the comparisonbetween the PLS approach and the covariance-based Structural Equation Modeling.
V. Esposito VinziESSEC Business School of Paris, Avenue Bernard Hirsch – B.P. 50105,95021 Cergy-Pontoise, Francee-mail: [email protected]
W.W. ChinDepartment of Decision and Information Sciences, Bauer College of Business, University ofHouston, TX, USAe-mail: [email protected]
J. HenselerNijmegen School of Management, Radboud University Nijmegen, P.O. Box 9108, 6500 HKNijmegen, The Netherlandse-mail: [email protected]
H. WangSchool of Economics and Management, Beihang University, 37 Xueyuan Road, Haidian District,Beijing 100083, Chinae-mail: [email protected]
V. Esposito Vinzi et al. (eds.), Handbook of Partial Least Squares, Springer Handbooksof Computational Statistics, DOI 10.1007/978-3-540-32827-8 1,c Springer-Verlag Berlin Heidelberg 2010
1

2 V. Esposito Vinzi et al.
Most chapters comprise a thorough discussion of applications to problems fromMarketing and related areas. Furthermore, a few tutorials focus on some key aspectsof PLS analysis with a didactic approach. This Handbook serves as both an intro-duction for those without prior knowledge of PLS but also as a comprehensivereference for researchers and practitioners interested in the most recent advancesin PLS methodology.
Different Partial Least Squares (PLS) cultures seem to have arisen followingthe original work by Herman Wold (1982): PLS regression models (PLS-R, Woldet al. 1983; Tenenhaus 1998) and PLS Path Modeling (PLS-PM, Lohmoller 1989;Tenenhaus et al. 2005). As a matter of fact, up to now, the two cultures are somehoworiented to different application fields: chemometrics and related fields for PLS-R; econometrics and social sciences for PLS-PM. While experiencing this internaldiversity, most often the PLS community has to cope also with external diversitiesdue to other communities that, grown up under the classical culture of statisticalinference, seem to be quite reluctant in accepting the PLS approach to data analysisas a well-grounded statistical approach.
Generally speaking, PLS-PM is a statistical approach for modeling complex mul-tivariable relationships among observed and latent variables. In the past few years,this approach has been enjoying increasing popularity in several sciences. Struc-tural Equation Models include a number of statistical methodologies allowing theestimation of a causal theoretical network of relationships linking latent complexconcepts, each measured by means of a number of observable indicators. From thestandpoint of structural equation modeling, PLS-PM is a component-based approachwhere the concept of causality is formulated in terms of linear conditional expec-tation. Herman Wold (1969, 1973, 1975b, 1980, 1982, 1985, 1988) developed PLSas an alternative to covariance-based structural equation modeling as representedby LISREL-type models (Joreskog, 1978) with, preferably, maximum likelihoodestimation. He introduced PLS as a soft modeling technique in order to emphasizethe difference in methodology for estimating structural equation models (Fornelland Bookstein, 1982; Schneeweiß, 1991). Soft modeling refers to the ability ofPLS to exhibit greater flexibility in handling various modeling problems in situ-ations where it is difficult or impossible to meet the hard assumptions of moretraditional multivariate statistics. Within this context, ”soft” is only attributed todistributional assumptions and not to the concepts, the models or the estimationtechniques (Lohmoller, 1989). As an alternative to the classical covariance-basedapproach, PLS-PM is claimed to seek for optimal linear predictive relationshipsrather than for causal mechanisms thus privileging a prediction-relevance orienteddiscovery process to the statistical testing of causal hypotheses. From the stand-point of data analysis, PLS-PM may be also viewed as a very flexible approachto multi-block (or multiple table) analysis. Multi-block situations arise when afew sets of variables are available for the same set of samples. Tenenhaus andHanafi (2007) show direct relationships between PLS-PM and several techniquesfor multi-block analysis obtained by properly specifying relationships in the struc-tural model and by mixing the different estimation options available in PLS-PM.This approach clearly shows how the data-driven tradition of multiple table analysis
Editorial 3
can be merged in the theory-driven tradition of structural equation modeling toallow running analysis of multi-block data in light of current knowledge on con-ceptual relationships between tables. In both structural equation modeling andmulti-block data analysis, PLS-PM may enhance even further its potentialities,and provide effective added value, when exploited in the case of formative epis-temic relationships between manifest variables and their respective latent variables.In PLS-PM latent variables are estimated as linear combinations of the manifestvariables and thus they are more naturally defined as emergent constructs (withformative indicators) rather than latent constructs (with reflective indicators). Asa matter of fact, formative relationships are more and more commonly used in theapplications, especially in the marketing domain, but pose a few problems for thestatistical estimation. This mode is based on multiple OLS regressions betweeneach latent variable and its own formative indicators. As known, OLS regressionmay yield unstable results in presence of important correlations between explana-tory variables, it is not feasible when the number of statistical units is smaller thanthe number of variables nor when missing data affect the dataset. Thus, it seemsquite natural to introduce a PLS-R external estimation mode inside the PLS-PMalgorithm so as to overcome the mentioned problems, preserve the formative rela-tionships and remain coherent with the component-based and prediction-orientednature of PLS-PM. Apart from the external estimation module, the implementationof PLS-R within PLS-PM may be extended also to the internal estimation mod-ule (as an alternative OLS regression) and to the estimation of path coefficientsfor the structural model upon convergence of the PLS-PM algorithm and estima-tion of the latent variable scores. Such an extensive implementation, that mightwell represent a playground towards the merging of the two PLS cultures, opensa wide range of new possibilities and further developments: different dimensionscan be chosen for each block of latent variables; the number of retained compo-nents can be chosen by referring to the PLS-R criteria; the well established PLS-Rvalidation and interpretation tools can be finally imported in PLS-PM; new opti-mizing criteria are envisaged for multi-block analyses; mutual causality with theso-called feedback relationships may be more naturally estimated and so on soforth.
Each chapter of this Handbook focuses on statistical methodology but also onselected applications from real world problems that highlight the usefulness ofPLS Methods in Marketing-related areas and their feasibility to different situa-tions. Beside presenting the most recent developments related to the statisticalmethodology of the PLS-PM approach, this Handbook addresses quite a few openissues that, also due to their relevance in several applications, are of major impor-tance for improving and assessing models estimated by PLS-PM. This work finallywishes to convey the idea that, when exploring and modeling complex data struc-tures, PLS-PM has the promising role of being the basis for merging the twoPLS cultures while also benefiting those external cultures traditionally groundedon either data-driven or theory-driven approaches. There are several reasons forthe increasing popularity of PLS Path Modeling. They are mainly related to theflexible methodological framework provided by this approach that well adapts
4 V. Esposito Vinzi et al.
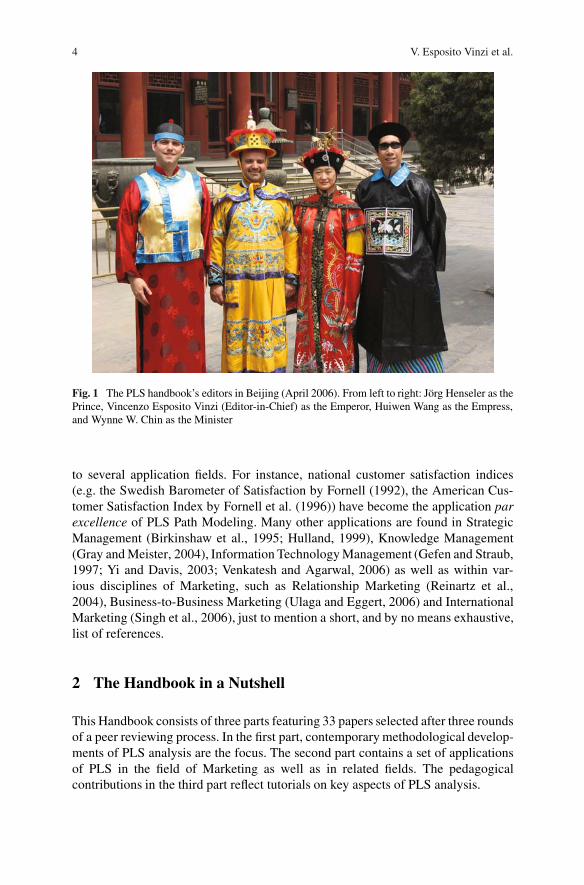
Fig. 1 The PLS handbook’s editors in Beijing (April 2006). From left to right: Jorg Henseler as thePrince, Vincenzo Esposito Vinzi (Editor-in-Chief) as the Emperor, Huiwen Wang as the Empress,and Wynne W. Chin as the Minister
to several application fields. For instance, national customer satisfaction indices(e.g. the Swedish Barometer of Satisfaction by Fornell (1992), the American Cus-tomer Satisfaction Index by Fornell et al. (1996)) have become the application parexcellence of PLS Path Modeling. Many other applications are found in StrategicManagement (Birkinshaw et al., 1995; Hulland, 1999), Knowledge Management(Gray and Meister, 2004), Information Technology Management (Gefen and Straub,1997; Yi and Davis, 2003; Venkatesh and Agarwal, 2006) as well as within var-ious disciplines of Marketing, such as Relationship Marketing (Reinartz et al.,2004), Business-to-Business Marketing (Ulaga and Eggert, 2006) and InternationalMarketing (Singh et al., 2006), just to mention a short, and by no means exhaustive,list of references.
2 The Handbook in a Nutshell
This Handbook consists of three parts featuring 33 papers selected after three roundsof a peer reviewing process. In the first part, contemporary methodological develop-ments of PLS analysis are the focus. The second part contains a set of applicationsof PLS in the field of Marketing as well as in related fields. The pedagogicalcontributions in the third part reflect tutorials on key aspects of PLS analysis.

Editorial 5
2.1 Part I: Methods of Partial Least Squares
2.1.1 PLS Path Modeling: Concepts, Model Estimation, and Assessment
Theo K. Dijkstra: Latent Variables and Indices – Herman Wold’s Basic Design andPartial Least Squares
In this chapter it is shown that the PLS-algorithms typically converge if the covari-ance matrix of the indicators satisfies (approximately) the ‘basic design’, a factoranalysis type of model. The algorithms produce solutions to fixed point equations;the solutions are smooth functions of the sample covariance matrix of the indicators.If the latter matrix is asymptotically normal, the PLS estimators will share thisproperty. The probability limits, under the basic design, of the PLS-estimators forloadings, correlations, multiple R2’s, coefficients of structural equations et ceterawill differ from the true values. But the difference is decreasing, tending to zero,in the ‘quality’ of the PLS estimators for the latent variables. It is indicated how tocorrect for the discrepancy between true values and the probability limits. The con-tribution deemphasizes the ‘normality’-issue in discussions about PLS versus ML:in employing either method one is not required to subscribe to normality; they are‘just’ different ways of extracting information from second-order moments.
Dijkstra also proposes a new ‘back-to-basics’ research program, moving awayfrom factor analysis models and returning to the original object of constructingindices that extract information from high-dimensional data in a predictive, usefulway. For the generic case one would construct informative linear compounds, whoseconstituent indicators have non-negative weights as well as non-negative loadings,satisfying constraints implied by the path diagram. Cross-validation could settlethe choice between various competing specifications. In short: it is argued for anupgrade of principal components and canonical variables analysis.
Vincenzo Esposito Vinzi, Laura Trinchera, and Silvano Amato: PLS PathModeling: From Foundations to Recent Developments and Open Issues for ModelAssessment and Improvement
In this chapter the Authors first present the basic algorithm of PLS Path Modeling bydiscussing some recently proposed estimation options. Namely they introduce thedevelopment of new estimation modes and schemes for multidimensional (forma-tive) constructs, i.e. the use of PLS Regression for formative indicators, and the useof path analysis on latent variable scores to estimate path coefficients Furthermore,they focus on the quality indexes classically used to assess the performance of themodel in terms of explained variances. They also present some recent developmentsin PLS Path Modeling framework for model assessment and improvement, includ-ing a non-parametric GoF-based procedure for assessing the statistical significanceof path coefficients. Finally, they discuss the REBUS-PLS algorithm that enablesto improve the prediction performance of the model by capturing unobserved

6 V. Esposito Vinzi et al.
heterogeneity. The chapter ends with a brief sketch of open issues in the area that,in the Authors’ opinion, currently represent major research challenges.
Wynne W. Chin: Bootstrap Cross-validation Indices for PLS Path ModelAssessment
The goal of PLS path modeling is primarily to estimate the variance of endogenousconstructs and in turn their respective manifest variables (if reflective). Models withsignificant jackknife or bootstrap parameter estimates may still be considered invalidin a predictive sense. In this paper, Chin attempts to reorient researchers from thecurrent emphasis of assessing the significance of parameter estimates (e.g., loadingsand structural paths) to that of predictive validity. Specifically, his paper examineshow predictive indicator weights estimated for a particular PLS structural model arewhen applied on new data from the same population. Bootstrap resampling is usedto create new data sets where new R-square measures are obtained for each endoge-nous construct in a model. Chin introduces the weighted summed (WSD) R-squarerepresenting how predictive the original sample weights are in a new data context(i.e., a new bootstrap sample). In contrast, the Simple Summed (SSD) R-squareexamines the predictiveness using the simpler approach of unit weights. From this,Chin develops his Relative Performance Index (RPI) representing the degree towhich the PLS weights yield better predictiveness for endogenous constructs thanthe simpler procedure of performing regression after simple summing of indicators.Chin also introduces a Performance from Optimized Summed Index (PFO) to con-trast the WSD R-squares to the R-squares obtained when the PLS algorithm is usedon each new bootstrap data set. Results from 2 simulation studies are presented.Overall, in contrast to Q-square which examines predictive relevance at the indica-tor level, the RPI and PFO indices are shown to provide additional information toassess predictive relevance of PLS estimates at the construct level. Moreover, it isargued that this approach can be applied to other same set data indices such as AVE(Fornell and Larcker, 1981) and GoF (Tenenhaus, Amato, and Esposito Vinzi, 2004)to yield RPI-AVE, PFO-AVE. RPI-GoF, and PFO-GoF indices.
2.1.2 PLS Path Modeling: Extensions
Michel Tenenhaus and Mohamed Hanafi: A Bridge Between PLS Path Modelingand Multiblock Data Analysis
A situation where J blocks of variables X1; : : : ; XJ are observed on the same setof individuals is considered in this paper. A factor analysis approach is applied toblocks instead of variables. The latent variables (LV’s) of each block should wellexplain their own block and at the same time the latent variables of same ordershould be as highly correlated as possible (positively or in absolute value). Two pathmodels can be used in order to obtain the first order latent variables. The first one
Editorial 7
is related to confirmatory factor analysis: each LV related to one block is connectedto all the LV’s related to the other blocks. Then, PLS Path Modeling is used withmode A and centroid scheme. Use of mode B with centroid and factorial schemesis also discussed. The second model is related to hierarchical factor analysis. Acausal model is built by relating the LV’s of each block Xj to the LV of the super-block XJ C1 obtained by concatenation of X1; : : : ; XJ . Using PLS estimation ofthis model with mode A and path-weighting scheme gives an adequate solution forfinding the first order latent variables. The use of mode B with centroid and factorialschemes is also discussed. The higher order latent variables are found by using thesame algorithms on the deflated blocks. The first approach is compared with theMAXDIFF/MAXBET Van de Geer’s algorithm (1984) and the second one with theACOM algorithm (Chessel and Hanafi, 1996). Sensory data describing Loire winesare used to illustrate these methods.
Michel Tenenhaus, Emmanuelle Mauger, and Christiane Guinot: Use of ULS-SEMand PLS-SEM to Measure a Group Effect in a Regression Model Relating TwoBlocks of Binary Variables
The objective of this constribution is to describe the use of unweighted leastsquares structural equation modelling and partial least squares path modelling ina regression model relating two blocks of binary variables when a group effect caninfluence the relationship. These methods were applied on the data of a question-naire investigating sun exposure behaviour addressed to a cohort of French adultin the context of the SU.VI.MAX epidemiological study. Sun protection and expo-sure behaviours were described according to gender and class of age (less than 50at inclusion in the study versus more than 49). Significant statistical differenceswere found between men and women, and between classes of age. This paper illus-trates the various stages in the construction of latent variables or scores, based onqualitative data. These kind of scores is widely used in marketing to provide a quan-titative measure of the phenomenon studied before proceeding to a more detailedanalysis.
Arteaga Francisco, Martina G. Gallarza, and Irene Gil: A New Multiblock PLSBased Method to Estimate Causal Models. Application to the Post-consumptionBehavior in Tourism
This chapter presents a new method to estimate causal models based on the Multi-block PLS method (MBPLS) from Wangen and Kowalski (1988). The new methodis compared with the classical LVPLS algorithm from Lohmoller (1989), using anacademic investigation on the post-consumption behaviour of a particular profile ofuniversity students. The results for both methods are quite similar, but the explainedpercentage of variance for the endogenous latent variables is slightly higher forthe MBPLS based method. Bootstrap analysis shows that confidence intervals areslightly smaller for the MBPLS based method.
8 V. Esposito Vinzi et al.
Wynne W. Chin and Jens Dibbern: A Permutation Based Procedure forMulti-Group PLS Analysis – Results of Tests of Differences on Simulated Data anda Cross Cultural Analysis of the Sourcing of Information System Services BetweenGermany and the USA
This paper presents a distribution free procedure for performing multi-group PLSanalysis. To date, multi-group comparison of PLS models where differences inpath estimates for different sampled populations have been relatively naive. Often,researchers simply examine and discuss the difference in magnitude of particularmodel path estimates for two or more data sets. Problems can occur if the assump-tion of normal population distribution or similar sample size is not tenable. Thispaper by Chin and Dibbern presents an alternative distribution free approach via anapproximate randomization test - where a subset of all possible data permutationsbetween sample groups is made. The performance of this permutation procedure isapplied on both simulated data and a study exploring the differences of factors thatimpact outsourcing between the countries of US and Germany.
2.1.3 PLS Path Modeling with Classification Issues
Christian M. Ringle, Sven Wende, and Alexander Will: Finite Mixture Partial LeastSquares Analysis: Methodology and Numerical Examples
In a wide range of applications for empirical data analysis, the assumption thatdata is collected from a single homogeneous population is often unrealistic. Inparticular, the identification of different groups of consumers and their appropri-ate consideration in partial least squares (PLS) path modeling constitutes a criticalissue in marketing. The authors introduce a finite mixture PLS software imple-mentation, which separates data on the basis of the estimates’ heterogeneity inthe inner path model. Numerical examples using experimental as well as empiricaldata allow the verification of the methodology’s effectiveness and usefulness. Theapproach permits a reliable identification of distinctive customer segments alongwith characteristic estimates for relationships between latent variables. Researchersand practitioners can employ this method as a model evaluation technique andthereby assure that results on the aggregate data level are not affected by unobservedheterogeneity in the inner path model estimates. Otherwise, the analysis providesfurther indications on how to treat that problem by forming groups of data in orderto perform a multi-group path analysis.
Silvia Squillacciotti: Prediction oriented classification in PLS Path Modeling
Structural Equation Modeling methods traditionally assume the homogeneity of allthe units on which a model is estimated. In many cases, however, this assumptionmay turn to be false; the presence of latent classes not accounted for by the globalmodel may lead to biased or erroneous results in terms of model parameters and
Editorial 9
model quality. The traditional multi-group approach to classification is often unsat-isfying for several reasons; above all because it leads to classes homogeneous onlywith respect to external criteria and not to the theoretical model itself.
In this paper, a prediction-oriented classification method in PLS Path Modellingis proposed. Following PLS Typological Regression, the proposed methodologyaims at identifying classes of units showing the lowest distance from the modelsin the space of the dependent variables, according to PLS predictive oriented logic.Hence, the obtained groups are homogeneous with respect to the defined path model.An application to real data in the study of customers’ satisfaction and loyalty willbe shown.
Valentina Stan and Gilbert Saporta: Conjoint use of variables clustering and PLSstructural equations modeling
In the PLS approach, it is frequently assumed that the blocks of variables satisfy theassumption of unidimensionality. In order to fulfill at best this assumption, this con-tribution uses clustering methods of variables. illustrate the conjoint use of variablesclustering and PLS path modeling on data provided by PSA Company (PeugeotCitroen) on customer satisfaction. The data are satisfaction scores on 32 manifestvariables given by 2922 customers.
2.1.4 PLS Path Modeling for Customer Satisfaction Studies
Kai Kristensen and Jacob K. Eskildsen: Design of PLS-based Satisfaction Studies
This chapter focuses on the design of PLS structural equation models with respectto satisfaction studies. The authors summarize the findings of previous studies,which have found the PLS technique to be affected by aspects as the skewnessof manifest variables, multicollinearity between latent variables, misspecification,question order, sample size as well as the size of the path coefficients. Moreover,the authors give recommendations based on an empirical PLS project conductedat the Aarhus School of Business. Within this project five different studies havebeen conducted, covering a variety of aspects of designing PLS-based satisfactionstudies.
Clara Cordeiro, Alexandra Machas, and Maria Manuela Neves: A Case Study of aCustomer Satisfaction Problem – Bootstrap and Imputation Techniques
Bootstrap is a resampling technique proposed by Efron. It has been used in manyfields, but in case of missing data studies one can find only a few references. Moststudies in marketing research are based in questionnaires, that, for several reasonspresent missing responses. The missing data problem is a common issue in marketresearch. Here, a customer satisfaction model following the ACSI barometer from
10 V. Esposito Vinzi et al.
Fornell will be considered. Sometimes, not all customer experience all services orproducts. Therefore, one may have to deal with missing data, taking the risk ofreaching non-significant impacts of these drivers on CS and resulting in inaccurateinferences. To estimate the main drivers of Customer Satisfaction, Structural Equa-tion Models methodology is applied. For a case study in mobile telecommunicationsseveral missing data imputation techniques were reviewed and used to complete thedata set. Bootstrap methodology was also considered jointly with imputation tech-niques to complete the data set. Finally, using Partial Least Squares (PLS) algorithm,the authors could compare the above procedures. It suggests that bootstrappingbefore imputation can be a promising idea.
Manuel J. Vilares, Maria H. Almeida, and Pedro Simoes Coelho: Comparison ofLikelihood and PLS Estimators for Structural Equation Modeling – A Simulationwith Customer Satisfaction Data
Although PLS is a well established tool to estimate structural equation models,more work is still needed in order to better understand its relative merits when com-pared to likelihood methods. This paper aims to contribute to a better understandingof PLS and likelihood estimators’ properties, through the comparison and evalua-tion of these estimation methods for structural equation models based on customersatisfaction data. A Monte Carlo simulation is used to compare the two estima-tion methods. The model used in the simulation is the ECSI (European CustomerSatisfaction Index) model, constituted by 6 latent variables (image, expectations,perceived quality, perceived value, customer satisfaction and customer loyalty). Thesimulation is conducted in the context of symmetric and skewed response data andformative blocks, which constitute the typical framework of customer satisfactionmeasurement. In the simulation we analyze the ability of each method to adequatelyestimate the inner model coefficients and the indicator loadings. The estimators areanalyzed both in terms of bias and precision. Results have shown that globally PLSestimates are generally better than covariance-based estimates both in terms of biasand precision. This is particularly true when estimating the model with skewedresponse data or a formative block, since for the model based on symmetric datathe two methods have shown a similar performance.
John Hulland, M.J. Ryan, and R.K. Rayner: Modeling Customer Satisfaction: AComparative Performance Evaluation of Covariance Structure Analysis versusPartial Least Squares
Partial least squares (PLS) estimates of structural equation model path coefficientsare believed to produce more accurate estimates than those obtained with covari-ance structure analysis (CVA) using maximum likelihood estimation (MLE) whenone or more of the MLE assumptions are not met. However, there exists no empir-ical support for this belief or for the specific conditions under which it will occur.
Editorial 11
MLE-based CVA will also break down or produce improper solutions whereas PLSwill not. This study uses simulated data to estimate parameters for a model with 5independent latent variables and 1 dependent latent variable under various assump-tion conditions. Data from customer satisfaction studies were used to identify theform of typical field-based survey distributions. Our results show that PLS producesmore accurate path coefficients estimates when sample sizes are less than 500, inde-pendent latent variables are correlated, and measures per latent variable are lessthan 4. Method accuracy does not vary when the MLE multinormal distributionassumption is violated or when the data do not fit the theoretical structure very well.Both procedures are more accurate when the independent variables are uncorrelated,but MLE estimations break down more frequently under this condition, especiallywhen combined with sample sizes of less than 100 and only two measures per latentvariable.
2.1.5 PLS Regression
Swante Wold, Lennart Eriksson, and Nouna Kettaneh-Wold: PLS in Data Miningand Data Integration
Data mining by means of projection methods such as PLS (projection to latent struc-tures), and their extensions is discussed. The most common data analytical questionsin data mining are covered, and illustrated with examples.
1. Clustering, i. e., finding and interpreting “natural” groups in the data,2. Classification and identification, e. g., biologically active compounds vs. inactive,3. Quantitative relationships between different sets of variables, e. g., finding vari-
ables related to quality of a product, or related to time, seasonal or/and geograph-ical change.
Sub-problems occurring in both (1) to (3) are discussed.
1. Identification of outliers and their aberrant data profiles,2. Finding the dominating variables and their joint relationships, and3. Making predictions for new samples.
The use of graphics for the contextual interpretation of results is emphasized. Withmany variables and few observations – a common situation in data mining – the riskto obtain spurious models is substantial. Spurious models look great for the trainingset data, but give miserable predictions for new samples. Hence, the validation ofthe data analytical results is essential, and approaches for that are discussed.
Solve Sæbø, Harald Martens, and Magni Martens: Three-block Data Modeling byEndo- and Exo-LPLS Regression
In consumer science it is common to study how various products are liked orranked by various consumers. In this context, it is important to check if there are
12 V. Esposito Vinzi et al.
different consumer groups with different product preference patterns. If systematicconsumer grouping is detected, it is necessary to determine the person character-istics, which differentiate between these consumer segments, so that they can bereached selectively. Likewise it is important to determine the product characteristicsthat consumer segments seem to respond differently to.
Consumer preference data are usually rather noisy. The productspersons datatable (X1) usually produced in consumer preference studies may therefore be sup-plemented with two types of background information: a productsproduct-propertydata table (X2) and a personperson-property data table (X3). These additionaldata may be used for stabilizing the data modelling of the preference data X1 sta-tistically. Moreover, they can reveal the product-properties that are responded todifferently by the different consumer segment, and the person-properties that char-acterize these different segments. The present chapter outlines a recent approach toanalyzing the three types of data tables in an integrated fashion and presents newmodelling methods in this context.
on Compositional Data
In data analysis of social, economic and technical fields, compositional data iswidely used in problems of proportions to the whole. This paper develops regres-sion modelling methods of compositional data, discussing the relationships of onecompositional data to one or more than one compositional data and the interrelation-ship of multiple compositional data. By combining centered logratio transformationproposed by Aitchison (1986) with Partial Least Squares (PLS) related techniques,that is PLS regression, hierarchical PLS and PLS path modelling, respectively, par-ticular difficulties in compositional data regression modelling such as sum to unitconstraint, high multicollinearity of the transformed compositional data and hier-archical relationships of multiple compositional data, are all successfully resolved;moreover, the modelling results rightly satisfies the theoretical requirement of log-contrast. Accordingly, case studies of employment structure analysis of Beijing’sthree industries also illustrate high goodness-of-fit and powerful explainability ofthe models.
2.2 Part II: Applications to Marketing and Related Areas
Sonke Albers: PLS and Success Factor Studies in Marketing
While in consumer research the “Cronbachs ˛ - LISREL”-paradigm has emerged fora better separation of measurement errors and structural relationships, it is shownin this chapter that studies which involve an evaluation of the effectiveness of mar-keting instruments require the application of PLS. This is because one no longer
Huiwen Wang, Jie Meng, and Michel Tenenhaus: Regression Modelling Analysis
Editorial 13
distinguishes between constructs and their reflecting measures but rather betweenabstract marketing policies (constructs) and their forming detailed marketing instru-ments (indicators). It is shown with the help of examples from literature that manystudies of this type applying LISREL have been misspecified and had better madeuse of the PLS approach. The author also demonstrates the appropriate use of PLSin a study of success factors for e-businesses. He concludes with recommendationson the appropriate design of success factor studies including the use of higher-orderconstructs and the validation of such studies.
Carmen Barroso, Gabriel Cepeda Carrion, and Jose L. Roldan: ApplyingMaximum Likelihood and PLS on Different Sample Sizes – Studies on ServqualModel and Emloyee Behaviour Model
Structural equation modeling (SEM) has been increasingly utilized in marketingand management areas. This rising deployment of SEM suggests addressing com-parisons between different SEM approaches. This would help researchers to choosewhich SEM approach is more appropriate for their studies. After a brief reviewof the SEM theoretical background, this study analyzes two models with differ-ent sample sizes by employing two different SEM techniques to the same set ofdata. The two SEM techniques compared are: Covariance-based SEM (CBSEM),specifically maximum likelihood (ML) estimation, and Partial Least Square (PLS).After the study findings, the paper provides insights in order to suggest to theresearchers when to analyze models with CBSEM or PLS. Finally, practical sug-gestions about PLS use are added and we discuss whether they are considered byresearchers.
Paulo Alexandre O. Duarte and Mario Lino B. Raposo: A PLS Model to StudyBrand Preference – An Application to the Mobile Phone Market
Brands play an important role in consumers’ daily life and can represent a big assetfor companies owning them. Due to the very close relationship between brands andconsumers, and the specific nature of branded products as an element of consumerlife style, the branded goods industry needs to extend its knowledge of the pro-cess of brand preference formation in order to enhance brand equity. This chaptershows how Partial Least Squares (PLS) path modeling can be used to successfullytest complex models where other approaches would fail due to the high number ofrelationships, constructs and indicators, here with an application to brand preferenceformation for mobile phones. With a wider set of explanatory factors than prior stud-ies, this one explores the factors that contribute to the formation of brand preferenceusing a PLS model to understand the relationship between those and consumer pref-erence on mobile phone brands. The results reveal that brand identity, personality,and image, together with self-image congruence have the highest impact on brandpreference. Some other factors linked to the consumer and the situation also affectpreference, but in a lower degree.

14 V. Esposito Vinzi et al.
Markus Eberl: An Application of PLS in Multi-group Analysis – The Need forDifferentiated Corporate-level Marketing in the Mobile Communications Industry
The paper focuses on the application of a very common research issue in marketing:the analysis of the differences between groups’ structural relations. Although PLSpath modeling has some advantages over covariance-based structural equation mod-eling (CBSEM) regarding this type of research issue – especially in the presence offormative indicators – few publications employ this method. This paper thereforepresents an exemplary model that examines the effects of corporate-level marketingactivities on corporate reputation as a mediating construct and, finally, on customerloyalty. PLS multi-group analysis is used to empirically test for differences betweenstakeholder groups in a sample from Germany’s mobile communications industry.
Sabrina Helm, Andreas Eggert, and Ina Garnefeld: Modelling the Impact ofCorporate Reputation on Customer Satisfaction and Loyalty Using PLS
Reputation is one of the most important intangible assets of a firm. For the mostpart, recent articles have investigated its impact on firm profitability whereas itseffects on individual customers have been neglected. Using data from consumersof an international consumer goods producer, this paper (1) focuses on measuringand discussing the relationships between corporate reputation, consumer satisfac-tion, and consumer loyalty and (2) examines possible moderating and mediatingeffects among the constructs. We find that reputation is an antecedent of satisfac-tion and loyalty that has hitherto been neglected by management. Furthermore, wefind that more than half of the effect of reputation onto loyalty is mediated by sat-isfaction. This means that reputation can only partially be considered a substitutefor a consumer’s own experiences with a firm. In order to achieve consumer loyalty,organizations need to create both, a good reputation and high satisfaction.
David Martın Ruız, Dwayne D. Gremler, Judith H. Washburn, and Gabriel CepedaCarrion: Reframing Customer Value in a Service-based Paradigm: An Evaluationof a Formative Measure in a Multi-industry, Cross-cultural Context
Customer value has received much attention in the recent marketing literature, butrelatively little research has specifically focused on inclusion of service componentswhen defining and operationalizing customer value. The purpose of this study is togain a deeper understanding of customer value by examining several service ele-ments, namely service quality, service equity, and relational benefits, as well asperceived sacrifice, in customers’ assessments of value. A multiple industry, cross-cultural setting is used to substantiate our inclusion of service components and toexamine whether customer value is best modeled using formative or reflective mea-sures. Our results suggest conceptualizing customer value with service componentscan be supported empirically, the use of formative components of service value can
Editorial 15
be supported both theoretically and empirically and is superior to a reflective oper-ationalization of the construct, and that our measure is a robust one that works wellacross multiple service contexts and cultures.
Sandra Streukens, Martin Wetzels, Ahmad Daryanto, and Ko de Ruyter: AnalyzingFactorial Data Using PLS: Application in an Online Complaining Context
Structural equation modeling (SEM) can be employed to emulate more traditionalanalysis techniques, such as MANOVA, discriminant analysis, and canonical corre-lation analysis. Recently, it has been realized that this emulation is not restricted tocovariance-based SEM, but can easily be extended to components-based SEM, orpartials least squares (PLS) path analysis. This chapter presents a PLS path mod-eling apllication to a fixed-effects, between-subjects factorial design in an onlinecomplaint context.
Silvia Thies and Sonke Albers: Application of PLS in Marketing: ContentStrategies in the Internet
In an empirical study the strategies are investigated that content providers follow intheir compensation policy with respect to their customers. The choice of the policycan be explained by the resource-based view and may serve as recommendations.The authors illustrate how a strategy study in marketing can be analyzed with thehelp of PLS thereby providing more detailed and actionable results. Firstly, complexmeasures have to be operationalized by more specific indicators, marketing instru-ments in this case, which proved to be formative in the most cases. Only by usingPLS it was possible to extract the influence of every single formative indicator on thefinal constructs, i. e. the monetary form of the partnerships. Secondly, PLS allowsfor more degrees of freedom so that a complex model could be estimated with anumber of cases that would not be sufficient for ML-LISREL. Thirdly, PLS doesnot work with distributional assumptions while significance tests can still be car-ried out with the help of bootstrapping. The use of PLS is recommended for futurestrategy studies in marketing because it is possible to extract the drivers at the indi-cator level so that detailed recommendations can be given for managing marketinginstruments.
Ali Turkyilmaz, Ekrem Tatoglu, Selim Zaim, and Coskun Ozkan: Use of PLS inTQM Research – TQM Practices and Business Performance in SMEs
Advances in structural equation modeling (SEM) techniques have made it possiblefor management researchers to simultaneously examine theory and measures. Whenusing sophisticated SEM techniques such as covariance based structural equationmodeling (CBSEM) and partial least squares (PLS), researchers must be aware of
16 V. Esposito Vinzi et al.
their underlying assumptions and limitations. SEM models such as PLS can helptotal quality management (TQM) researchers to achieve new insights. Researchersin the area of TQM need to apply this technique properly in order to better under-stand the complex relationships proposed in their models. This paper makes anattempt to apply PLS in the area of TQM research. In doing that special emphasiswas placed on identifying the relationships between the most prominent TQM con-structs and business performance based on a sample of SMEs operating in Turkishtextile industry. The analysis of PLS results indicated that a good deal of support hasbeen found for the proposed model where a satisfactory percentage of the variancein the dependent constructs is explained by the independent constructs.
Bradley Wilson: Using PLS to Investigate Interaction Effects Between HigherOrder Branding Constructs
This chapter illustrates how PLS can be used when investigating causal models withmoderators at a higher level of abstraction. This is accomplished with the presen-tation of a marketing example. This example specifically investigates the influenceof brand personality on brand relationship quality with involvement being a mod-erator. The literature is reviewed on how to analyse moderational hypotheses withPLS. Considerable work is devoted to the process undertaken to analyse higher orderstructures. The results indicate that involvement does moderate the main effectsrelationship between brand personality and brand relationship quality.
2.3 Part III: Tutorials
Wynne W. Chin: How to Write Up and Report PLS analyses
The objective of this paper is to provide a basic framework for researchers inter-ested in reporting the results of their PLS analyses. Since the dominant paradigmin reporting Structural Equation Modeling results is covariance based, this paperbegins by providing a discussion of key differences and rationale that researcherscan use to support their use of PLS. This is followed by two examples from thediscipline of Information Systems. The first consists of constructs with reflectiveindicators (mode A). This is followed up with a model that includes a constructwith formative indicators (mode B).
Oliver Gotz, Kerstin Liehr-Gobbers, and Manfred Krafft: Evaluation of StructuralEquation Models using the Partial Least Squares Approach
This paper gives a basic comprehension of the partial least squares approach. In thiscontext, the aim of this paper is to develop a guide for the evaluation of structural

Editorial 17
equation models, using the current statistical methods methodological knowledge byspecifically considering the Partial-Least-Squares (PLS) approach’s requirements.As an advantage, the PLS method demands significantly fewer requirements com-pared to that of covariance structure analyses, but nevertheless delivers consistentestimation results. This makes PLS a valuable tool for testing theories. Anotherasset of the PLS approach is its ability to deal with formative as well as reflec-tive indicators, even within one structural equation model. This indicates that thePLS approach is appropriate for explorative analysis of structural equation models,too, thus offering a significant contribution to theory development. However, littleknowledge is available regarding the evaluating of PLS structural equation models.To overcome this research gap a broad and detailed guideline for the assessmentof reflective and formative measurement models as well as of the structural modelhad been developed. Moreover, to illustrate the guideline, a detailed application ofthe evaluation criteria had been conducted to an empirical model explaining repeatpurchasing behaviour.
Jorg Henseler and Georg Fassott: Testing Moderating Effects in PLS Path Models:An Illustration of Available Procedures
Along with the development of scientific disciplines, namely social sciences, hypoth-esized relationships become more and more complex. Besides the examination ofdirect effects, researchers are more and more interested in moderating effects. Mod-erating effects are evoked by variables, whose variation influences the strength orthe direction of a relationship between an exogenous and an endogenous variable.Investigators using partial least squares path modeling need appropriate means totest their models for such moderating effects. Henseler and Fassott illustrate theidentification and quantification of moderating effects in complex causal structuresby means of Partial Least Squares Path Modeling. They also show that group com-parisons, i.e. comparisons of model estimates for different groups of observations,represent a special case of moderating effects, having the grouping variable as acategorical moderator variable. In their contribution, Henseler and Fassott provideprofound answers to typical questions related to testing moderating effects withinPLS path models:
1. How can a moderating effect be drawn in a PLS path model, taking into accountthat available software only permits direct effects?
2. How does the type of measurement model of the independent and the moderatorvariables influence the detection of moderating effects?
3. Before the model estimation, should the data be prepared in a particular manner?Should the indicators be centered (having a mean of zero), standardized (havinga mean of zero and a standard deviation of one), or manipulated in any otherway?
4. How can the coefficients of moderating effects be estimated and interpreted?And, finally,
5. How can the significance of moderating effects be determined?


![2016 [Springer Protocols Handbooks] Animal Coronaviruses __ Reverse Genetics of Avian Coronavirus Infectious Bronchitis](https://img.pdfslide.us/doc/110x75/613ca6d09cc893456e1e875c/2016-springer-protocols-handbooks-animal-coronaviruses-reverse-genetics-of.jpg)


![2016 [Springer Protocols Handbooks] Animal Coronaviruses __](https://img.pdfslide.us/doc/110x75/613ca6cf9cc893456e1e8751/2016-springer-protocols-handbooks-animal-coronaviruses-.jpg)