Embed Size (px)
Citation preview
Spontaneous Imbibition Processes in Hele-Shaw Cells
JosC A. Hayashi and Albert0 Soria Dept. de Ingenieria de Procesos e Hidraulica, Universidad Aut6noma Metropolitana, Unidad Iztapalapa,
Col. Vicentina, CP 09340, Mixico, D.F.
Experiments on spontaneous imbibition processes in Hele-Shaw cells were carried out in squared cells (20 cm x 20 cm) with separations of 0.00.5, 0.015 and 0.075 cm using twice-distilled water and Soltrol 1 70 as the displacing and displaced fluids, respectiuely. The experiments indicated that it was possible to repeat the main features of the sponta- neous imbibition process using a procedure for wettability restoration of the glass sheets. The best sweep efficiency was achieued for the 0.015 cm cell gap. Two or three consecu- tive stages occurred depended on the cell gap, as euidenced by a characteristic speed and a characteristic aduancing front structure. The initial stage speed/deuelopment stage speed ratio and the oil total area/water-oil total intefacial length ratio as functions of time were gap-dependent. The capillary number and inteifkial power density estima- tions indicated that at about 0.033 cm gap there was a flow pattern transition from slightly uniform displacement to fingering flow.
Introduction
Spontaneous imbibition is defined as the immiscible dis- placement process by which a wetting fluid displaces a non- wetting fluid that initially saturates a porous or capillary medium, driven only by capillary forces. In the oil industry spontaneous imbibition plays a very important role, particu- larly in naturally fractured reservoirs and in water-wet rocks. The exchange of water from the fractures and oil towards the fractures is one kind of the matrix-fracture interactions. The more useful modeling expressions are based mainly on global field tests (Aronofsky, 1958; Kazemi et al., 1976) and a lack of the fundamental knowledge of the capillary processes in- volved is evident. Several authors use the Aronofsky equation in order to simulate the matrix-fracture interaction (de Swaan, 1978; Rodriguez, 1988; Kazemi et al., 1989; Reis and Cil, 1999; Reis and Haq, 1999; Terez and Firoozabadi, 1999). Others benefit from the Kazemi shape factor (Rossen and Shen, 1989; Bech et al., 1991). Others have constructed their own func- tions (Kleppe and Morse, 1974; Saidi, 1983; Beckner et al., 1987; de Swaan, 1990, 1998).
Thc experimental research on spontaneous imbibition has been devoted to study this process in reservoir rock samples.
Corrcspondcncc coliccrning this article hhould hc addressed to A. Soria. Currcnt ,iddrc\\ o f J. A. Hayashi: lnstituto Mexicano dcl Pctrhlco, Ejc Central
LBraru C'irdcnaa N o . 152. Col. Sen Bartolo Ateprhuecan, 07730, Mexico, D.F.
Most of the studies have been conducted to obtain informa- tion about displacement rates and sweep efficiencies (Brownscombe and Dyes, 1952; Bobek et al., 1958; Mattax and Kyte, 1962; Kleppe and Morse, 1974; Jacquin and Legait, 1984; Cuiec et al., 1990; Zhang et al., 1996). More informa- tion has been provided using new techniques for fluid dis- placement visualization, like gamma-ray absorption (Lefebvre du Prey, 19781, X-ray computerized tomography scanning methods (Bourbiaux and Kalaydjian, 1990; Ramirez, 1998; Akin et al., 2000). Nevertheless, there are still several aspects where research is demanded in order to understand the mechanisms acting in the spontaneous imbibition processes, which determine that a nonwetting fluid may be displaced or left trapped inside the capillary or porous media, especially for the improvement of secondary oil recovery technologies.
Visualization of spontaneous imbibition process is an im- portant tool to study the behavior of the fluid displacement mechanisms inside the capillary or porous media. However, real porous media present many difficulties for in situ obser- vation of fluid motion. Taking them as the initial system may be an inconvenient starting point for a basic research study on the governing mechanisms of these processes. Notwith- standing this fact, it is possible that simple models of capil- lary media may provide relevant basic information that con- tributes to the understanding of these processes in real porous media (Chatzis and Dullien, 1983; Kalaydjian and Legait, 1988
AIChE Journal July 2001 Vol. 47, No. 7 1513

and Spildo and Buckley, 1999). Furthermore, more informa- tion is still needed on spontaneous imbibition in 2-D capil- lary media (Hayashi and P6reL-Rosales, 1992; Hayashi and Soria, 1995). An approach to remedy this drawback may be by designing ad hoc experimental models for the study of the spontaneous displacement characteristics and mechanisms (Hayashi, 2001). For this reason, in this work a 2-D experi- mental model was built, in order to visualize the spontaneous displacement of oil by water. These simple physical models are known as Hele-Shaw cells and are constructed using two flat parallel transparent sheets with a thin gap between them.
The experimental procedurc is described considering (1) the method of wettability restoration; (2) the evaluation of the waviness distribution in Hele-Shaw cells and ( 3 ) the cx- perimental development and the fluid properties. Then, (1) studies on the phase motion and the identification of the generated structures by the displacement process are re- ported; (2) the repeatability of experiments is analyzed through the displacement pattern and the displacement rate; ( 3 ) the natural waviness of the system, which might have an influence on fluid displacement, is evaluated; (4) the inter- face dynamics and its relationship to the displacement speed and the oil-water interfacial length are characterized; and ( 5 ) the capillary number and the interfacial power density are found for the characteristic stages of the spontaneous imbibi- tion.
Experimental Method Hele-Shaw cell
The repeatability of the main features of spontaneous im- bibition in Hele-Shaw cells needs care on (1) the assembling procedure; (2) the techniques to determine the microstruc- ture gap due to the glass sheets internal surface waviness and (3) the cleanliness and restitution of chemical properties.
The Hele-Shaw cell consisted of two trans- parent flat parallel glass plates, with a small gap between them (Figure 1). The Hele-Shaw cell was built with 0.9 cm thick glass sheets and dimensions of 20 cm x 20 cm for the upper sheet and of 30 c m x 4 0 cm for the lower sheet. Both glass sheets were used for the whole set of experiments, assem- bling the cell for two G = 0.015 (G being the gap in cm) ex- periments at first, then for two G = 0.075 experiments, and, finally, for two G = 0.005 experiments, consecutively. The gap between glass sheets was set using nylon thread of several diameters. The upper glass was fixed to the lower one using epoxy glue on two of the upper glass opposite edges and as- sembling in the identical position as in previous experiments. The cells built in this manner had an inlet and an outlet o n opposite sides of a square, as may be appreciated in Figure 1, where the 2-D capillary system is formed by the space bc- tween the glass sheets.
Intevference Pattern. The glass sheets were used as re- ceived from the factory. The only treatment performed was that of cleaning, as described below. However, an optical method was used to obtain information on the magnitude and distribution of the irregularities in the internal surfaces of the cells (waviness). A Fizeau’s interferometer, typically used to verify the lens and mirror curvatures, was used for this purpose. Upon placing one glass sheet onto another, as oc- curs in a Helc-Shaw cell, it is possible to observe the interfer-
Construction.
Epoxi glue
63
l x Glass Bell Water supply
Hele-Shaw cell I 1 Fans
J x Heaters r L~gth dispersing screens
. ... ....... ........ . ............ ..... ..... , ........ ... ... ... ...................... ,,..... ....
Fluorescent lamps
Figure 1. Experimental setup.
ence map drawn by the gap differences between the internal surfaces. This pattern is a measure of the upper sheet irregu- larities with respect to the lower sheet irregularities. Thus, the surface waviness of the glass sheets is superposed to a basic gap value, set by a nylon thread with a known diameter. Interference patterns were obtained for G = 0.015 and G = 0.005. It was not possible to define an interference pattern for G = 0.075 due to the apparatus resolution.
Glass Surface Cleaning and Restoration of Chemical Proper- ties. The glass sheets cleaning was one of the most sensitive aspects of this work since it is directly related to the internal surface wettability of the cells. In thermostatics, wettability is defined by the static contact angle between two immiscible phases with a solid surface. However, this concept may be notoriously different for a displacement process (Dussan et al., 1991) since the contact angle should become a dynamic concept, with a dynamic contact line where interfacial ten- sion forces, as well as a line tension force, are balanced. The spontaneous displacement generates complex interfaces that cannot be reproduced in further experiments. Similarity de- pends on the fact that the capillary structure and the wetta- bility could be accurately restored in order to obtain repeat- able conditions at a global level for further experiments. For this reason, the recovery of the geometric and chemical char- acteristics of the surface was attempted by reconstruction of the 2-D capillary space. This was accomplished by setting the same glass sheets at the same position each time that the cell was assembled and developing a rigorous cleaning procedure to recover the chemical characteristics of the surfaces. This procedure was partially taken from experiences reported by Dussan et al. (1991) for the cleaning of Pyrex glass pipes. First, the glass sheets were submerged for 12 h in a Thinner
July 2001 Vol. 47, No. 7 AIChE Journal 1514
solvent bath in order to eliminate fats and oil remains, then the glass sheets were introduced into a diluted Extran M 01 Alkaline (Merck) bath at 20%w, with twice-distilled water to 60"C, for 12 h. Thereinafter, the sheets were rinsed and sponged over with twice-distilled water, after which they were submerged in chromic acid for 12 h, at a concentration of 100 mL of water and 900 mL of sulfuric acid by each 100 g of potassium dichromate. The glass sheets were then rinsed with twice-distilled water and introduced into 50% hydrochloric acid in water for 12 h. In order to restore the surface pH, the sheets were then submerged in a 20% Extran bath at room temperature for 12 h and rinsed and submerged in twice-dis- tilled water for another 12 h after which the glass sheets were again rinsed, rubbed with a wet sponge, and finally dried with nitrogen gas. This procedure had the objective to standard- ized the chemical properties of the glass sheets.
Experimental Studies Fluids and their properties
Twice-distilled water was used as the displacing fluid and Phillips Petroleum Soltrol 170 as the displaced fluid. Due to
Figure 2. Captured images from Experiments C (a) and D (b) (G=0.075).
the fact that the Soltrol-water interface is difficult to distin- guish at simple sight, an oil soluble pigment was used (Oil Red 0 BDA from Merck) to emphasize the phase difference, in a concentration of 0.2 g/L. The pigmented oil was filtered with a 0.2 p m pore size micropore filter. The relevant fluid properties such as density, viscosity and interfacial tension, were measured at the temperature of the experiments (25°C). The water viscosity was p = 1 .OO f 0.005 cp and the colored Soltrol viscosity was p = 3.80 f 0.005 cp. The interfacial ten- sion between twice-distilled water and colored Soltrol, mea- sured with a Kruss tensiometer, K10 model, was (T = 25.85 k 0.005 dyne/cm. The densities were p = 1.0002 f 0.00005 g/cm3 for the water and p = 0.7735 f 0.00005 g/cm3 for the colored Soltrol.
Experimental setup and development A constant temperature air bath was built to conduct the
experiments a t controlled temperature, 25 + 0.5"C. The cell was covered with a glass bell to prevent the disturbances from the circulating air and to reduce the evaporation of liquids, but it was not closed hermetically. Therefore, the experi- ments were conducted at atmospheric pressure. A Panasonic M9000 video-camera with Super-VHS format was fixed above the cell. Thc cell lighting was made up by fluorcscent lamps set below the cell, and two paper screens were used to gener- ate a dispersed and uniform lighting (Figure 1). A set of rep- resentative images from each experiment was selected, cap- tured, and digitally processed with help of a Matrox card and Visiolab 2000 software from Biocom. The experimental setup is shown in Figure 1. Before the experiment started, the cap- illary space was saturated with colored Soltrol; then, the cell was set horizontally in order to neglect gravity effects and the glass bell was coupled. The experiment started when water was dispensed continuously from the water supply. As the water was flowing into the cell, the water supply provided the required amount of water, in order to maintain the whole inlet in contact with a water film at atmospheric pressure. Since the beginning of the experiment, the whole outlet was in contact with an oil film which was extending on the lower glass sheet, as the Soltrol was being expelled. This oil film was also at atmospheric pressure. As the imbibition process continued, water gradually invaded the capillary space dis- placing the Soltrol towards the cell outlet.
A first experiment was needed in order to set the initial conditions of the glass surface wettability distribution within the cell, The experiments with a separation of G = 0.075, identified with the letters C and D, are shown in Figure 2. They were performed after two experiments with G = 0.015, identified with the letters A and B, whose sequential advance is shown in Figure 3. The experiments with a separation of G = 0.005 and identified by letters E and F were finally car- ried out and their sequential advance is shown in the Figure 4. The total time for each experiment is the time interval from the initial water contact with the inlet edge to the final time, when no further configuration changes were observed.
Analysis and Results Waviness evaluation
The interference pattern, obtained from a Fizeau's inter- ferometer, is a map of the Hele-Shaw cell with iso-lines of
AIChE Journal July 2001 Vol. 47, No. 7 1515
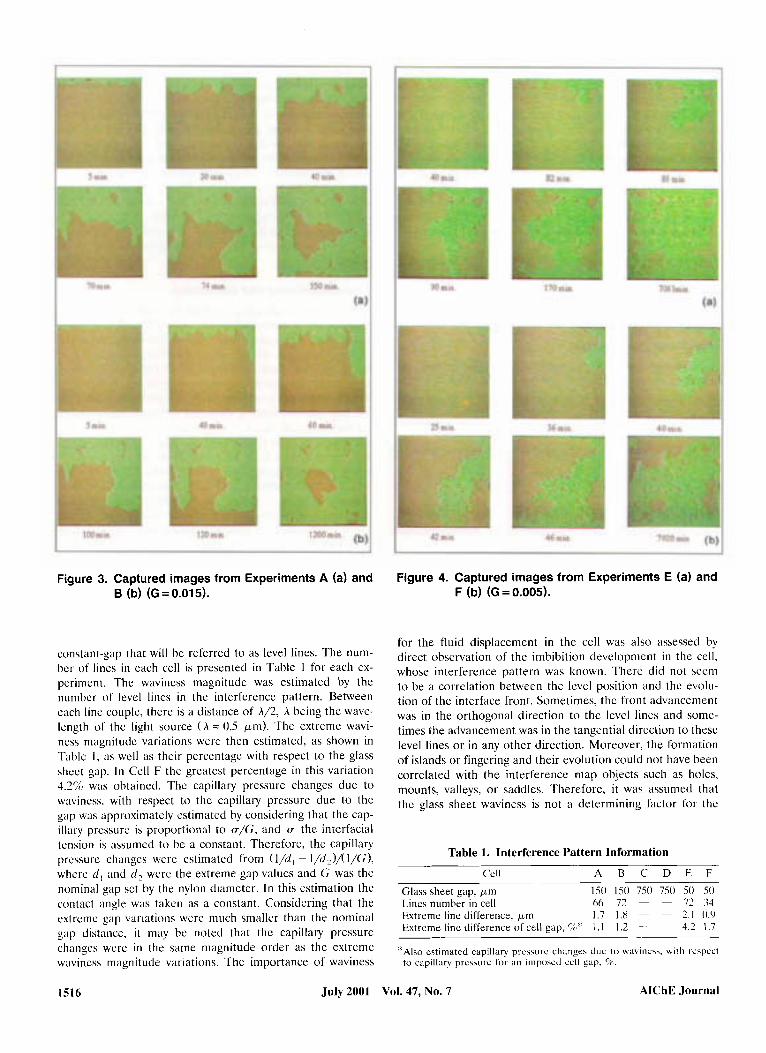
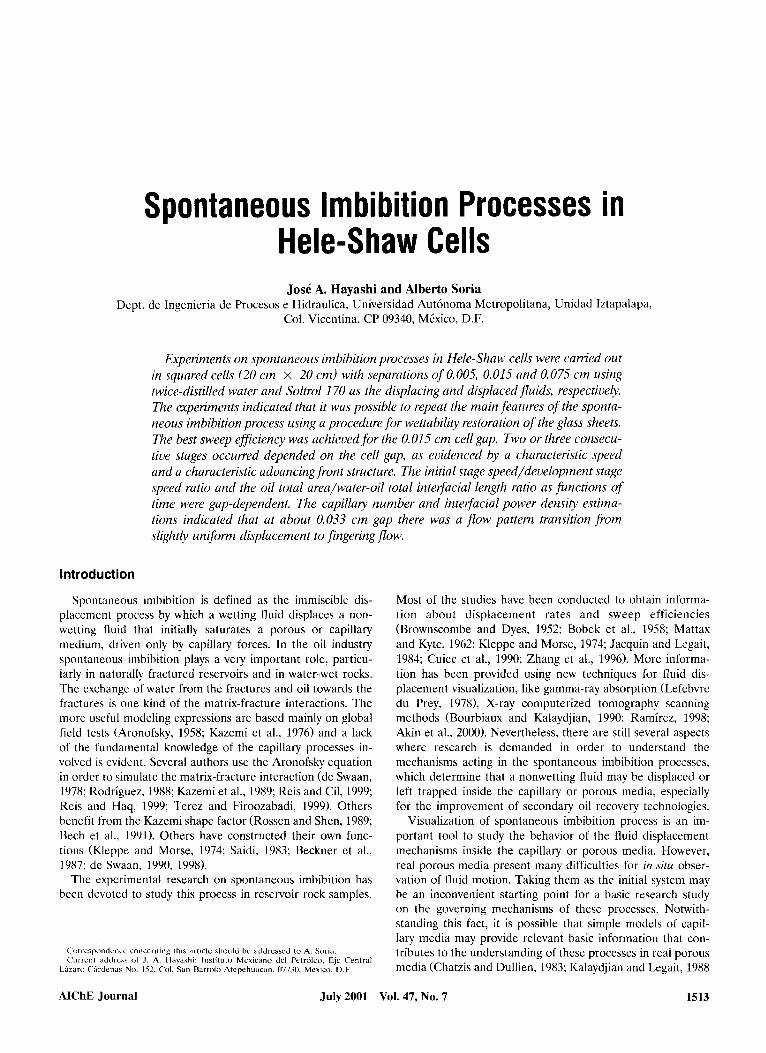
Figure 3. Captured images from Experiments A (a) and B (b) (G = 0.015).
constant-gap that will bc referred to as level lines. The num- ber of lines in each cell is presented in Table 1 for each ex- periment. The waviness magnitude was estimated by the number of level lines in thc interference pattern. Between each linc couple, there is a distance of A/2, A being the wave- length of the light source ( A = 0.5 pm). The extreme wavi- ness magnitude variations were then estimated, as shown in Tablc I , :is well as their percentage with respect to the glass sheet gap. In Ccll F the greatest percentage in this variation 4.2% was obtained. The capillary pressure changes due to waviness, with respect to the capillary pressure due to the gap was approximately estimated by considering that the cap- illary pressure is proportional to q/G, and (r the interfacial tension is assumed to bc a constant. Therefore, the capillary pressure changes wcrc estimated from (l/d, - l/d2)/(l/G), where d , and d 2 wcrc the extreme gap values and G was the nominal gap sct by the nylon diameter. In this estimation the contact angle was taken as a constant. Considering that the extrcme gap variations were much smaller than the nominal gap distancc, it may be noted that the capillary pressure changes wcrc in the same magnitude order as the extreme waviness magnitude variations. The importance of waviness
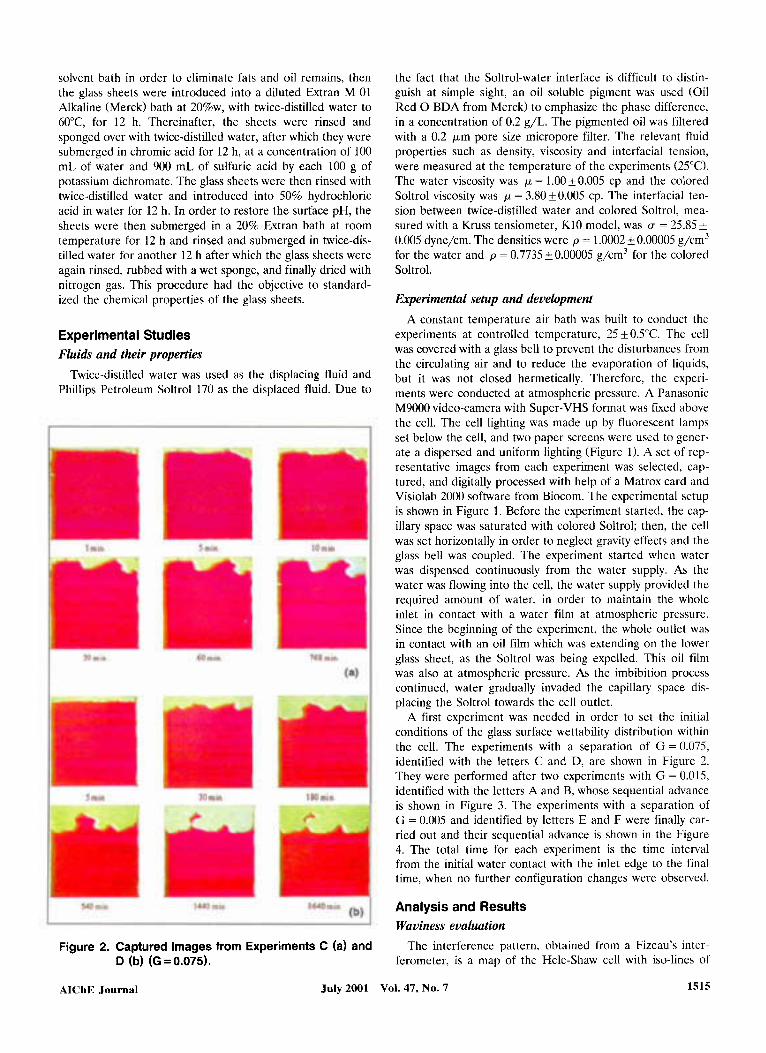
Figure 4. Captured images from Experiments E (a) and F (b) (G = 0.005).
for the fluid displacement in the cell was also assessed by direct observation of the imbibition development in the cell, whose interference pattern was known. There did not seem to be a correlation between the level position and the evolu- tion of the interface front. Sometimes, the front advancement was in the orthogonal direction to the level lines and some- times the advancement was in the tangential direction to these level lines or in any other direction. Moreover, the formation of islands or fingering and their evolution could not have been correlated with the interference map objects such as holes, mounts, valleys, or saddles. Therefore, i t was assumed that the glass sheet waviness is not a determining factor for the
Table 1. Interference Pattern Information
Cell A B C D E F
Glass sheet gap, p m 150 I S 0 750 750 50 50 Lines number in cell 66 72 ~ - 77 34 Extreme line difference, p n i I .7 1.8 ~ ~ 2.1 0 . c ) Extreme linc difference o f cell gap, %" 1. I 1.2 - ~ 4.2 1.7
"Also cstimated capillary pressure changes due t o *iivinchh, with respect to capillary pressure l o r :in imposed cell gap, %.
1516 July 2001 Vol. 47, No. 7 AIChE Journal
spontaneous imbibition process reported here. A significant change in the displacement pattern was generated only by a significant change in the glass sheet gap.
Fluid motion and configuration structures The water-oil interfacial motion generated an advancing
front that initially ran throughout the inlet and evolved in time, sometimes leaving in its way fragments of residual oil that remained trapped as islands. These islands could stay fixed, be distorted, coalesce, migrate, or even shrink and dis- appear, depending on the local wetting conditions and on their sizes, shapes and positions within the cell.
Even though the Hele-Shaw cells are 3-D experimental models, the information obtained from the sequential images of the spontaneous oil displacement by water is 2-D. It was possible to determine perimeter and area for the islands, while for the advancing front, it was better to measure its interface lcngth and the area occupied by oil. The perimeter and the interface length are the loci of the water-oil interface and give information about the magnitude and evolution of capillary forces. The time evolution of water and oil areas gives information to quantify the bulk transportation dynam- ics in the cell, such as the oil expulsion rate (or water-flood- ing rate) in the cell and the evaluation of the residual oil trapped in the cell at the end of the experiment. The area and the perimeter of the islands left by the advancing front were quantified. as well as the area occupied by oil and the interfacial length at the advancing front in each one of the images. I t was assumed that an oil island was formed when the oil phase is fragmented by the surrounding water, leaving it isolated from the rest of the oily phase which continued advancing until it was expelled at the outlet.
At the beginning of the G = 0.005 and G = 0.015 experi- ments, it could be observed that the water-oil interface was slightly uniform and advanced slowly. However, once this stage was surpassed, the displacement speed was greater and the advancement was through fingering, as occurred in Ex- periments A, B, E and F (Figures 3 and 4). In cells with the smallest gap G = 0.005, the fingering advance was the fastest and could even increase the fragmentation of the oily phase, with formation of islands, as in Experiments E and F (Figure 4). A different condition was also observed, when the finger- ing stage did not occur as in Experiments C and D (Figure 2). In this case, after an initial front advancement, the front speed became even slower and finally completely stopped. Under this condition local capillary forces were not able to over- come the viscous resistance.
Two main kinds of oily structures could be identified: (a) a continuous region, defined as the oily phase with connection to the cell outlet and (b) an insular region, constituted by the fragments of the oily phase left behind as the continuous re- gion advanced toward the outlet. The continuous region was considered to have been disappeared once the outlet had been saturated totally with water, regardless of large islands that may he present inside the cell. This region may be frag- mented at the outlet, but each one of the fragments must be in touch with the cell outlet; otherwise, those fragments be- come part of the insular region.
In the insular region, islands do not have connection with the ccll outlet. It was observed that some fragments close to
the inlet, to the outlet, or to a closed edge could be distorted and adhered to these sites, re-shaping themselves or even al- lowing oil to flow outside the cell. For those reasons, the in- sular region could be characterized as dynamic or stationary, according to its evolution. The dynamic insular sub-region is the set of islands whose area and perimeter are modified with time. This change may be important since a fragment, consid- ered isolated at a given time, can eventualli experience changes in its oil content. This particular situation was ob- served to occur when the water pushed the fragments that were formed near the inlet, to the outlet or to the closed edges of the cell, helping the fragment to flow outside the cell. The stationary insular sub-region is the set of islands whose area is not modified as time elapses. The oil contained in these islands does not vary since the islands are not close to the inlet or the outlet or because a closed edge does not allow oil expulsion. The perimeter of the fragment may be changed with time, but not its area, only a re-shaping of frag- ments is produced. Two behaviors of these fragments could be observed in the stationary insular sub-region: (a) static fragments, whose shape and placement do not change, and whose perimeter and area remain without change. For (b) migrantfiagments that are mobilized from one site to another within the cell, without oil expulsion, their perimeter, but not their area, changes. Some migrant fragments may eventually be split or coalesced within the cell, re-shaping the stationary sub-region.
Repeatability features analysis In Experiments E
and F a similar displacement pattern was observed. On the cell righthand side, a quickly growing and advancing finger was developed, crossing the cell in a few minutes ( - 10) and leaving behind a cloud of small scattered oil islands (Figure 4). The final maps of Experiments E are shown in the last slide of each one. There are many islands whose similarities in size and position are apparent. Both experiments were recorded for almost 4 days (7,061 min for Experiment E, and 7,020 min for Experiment F). It was also observed, that when the outlet was water-flooded in both experiments, the oily phase flowed countercurrently towards the inlet, placing a large oil fragment in contact with the inlet edge of the cell. This event may be understood as a large size entrance effect and observations with larger cells should improve or reject this hypothesis.
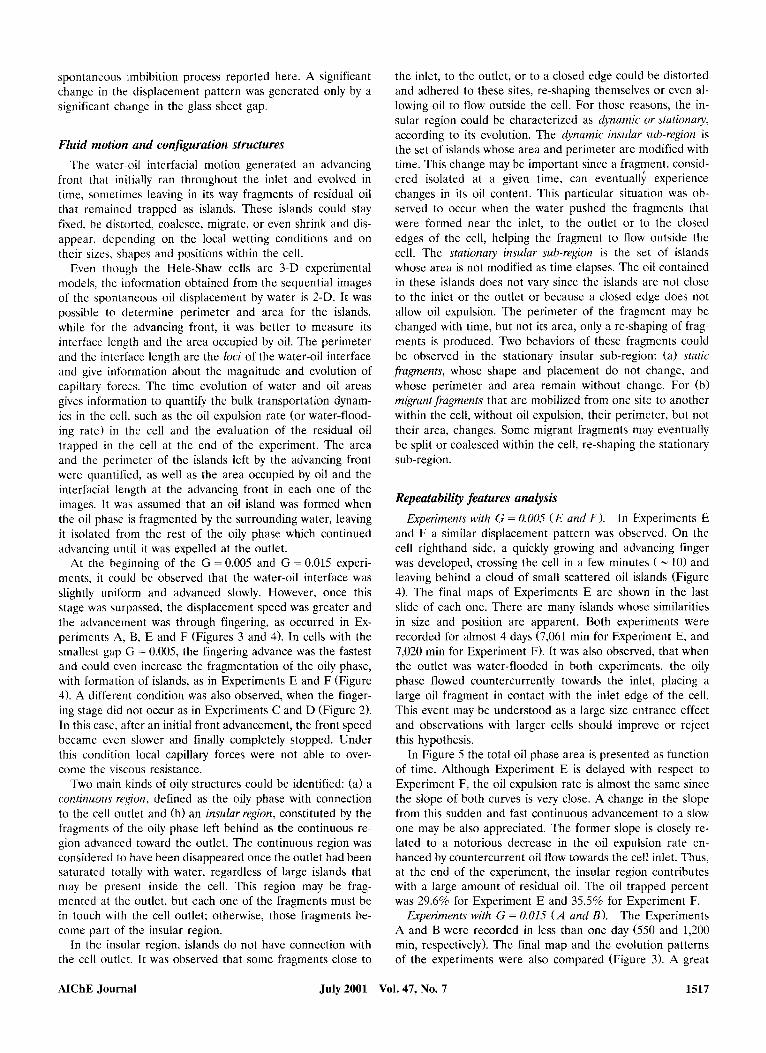
In Figure 5 the total oil phase area is presented as function of time. Although Experiment E is delayed with respect to Experiment F, the oil expulsion rate is almost the same since the slope of both curves is very close. A change in the slope from this sudden and fast continuous advancement to a slow one may be also appreciated. The former slope is closely re- lated to a notorious decrease in the oil expulsion rate en- hanced by countercurrent oil flow towards the cell inlet. Thus, at the end of the experiment, the insular region contributes with a large amount of residual oil. The oil trapped percent was 29.6% for Experiment E and 35.5% for Experiment F.
The Experiments A and B were recorded in less than one day (550 and 1,200 min, respectively). The final map and the evolution patterns of the experiments were also compared (Figure 3). A great
Experiments with G = 0.005 ( E and F ) .
Experiments with G = 0.015 ( A and B).
AIChE Journal July 2001 Vol. 47, No. 7 1517
350
300 1 250 200 1
i 0.1 1 10 100 1000 10000
Time, minutes
Figure 5. Total oil area for all experiments.
island was apparent in the cell center at the end of the exper- iments. A fast advancing finger was observed on the right- hand side of the cell in both experiments, which were joined later on another finger that advanced on the lefthand side of the cell.
The behavior of the total oily phase area as a function of time is also shown in Figure 5. The slope of this curve is similar for both Experiments A and B. Towards the end of the experiments, the great island appearing in the Experi- ment A is almost 30 cm' larger than the island in the Experi- ment B. This is the main reason, because the final trappcd oil percent was different; 22.3% for Experiment A and 13.3% for Experiment B.
In Experiments C and D (Figure 2) the oil-water interface did not reach the outlet at the final stage. This particular behavior may be re- lated to smaller capillary forces and higher static pressure head due to a larger gap than that in previous experiments; therefore, the water-oil interface did not reach the cell outlet in spite of the enough elapsed time for each experiment.
The behavior of the total oily phase area is shown in Fig- ure 5 for Experiments C and D. In both experiments, islands were hardly formed. Although the experiments had certain similarity in the first 10 min, their subsequent behavior was different. In Experiment C the displacement after 10 min be- came slower than in D, as may be appreciated in the slope of the curve. A notorious difference in the trapped oil percent towards the end of the experiments might be appreciated: 92.2% for the Experiment C and 72.8% for the Experiment D.
Sweep Efjciency Obserued in All of the Experiments. Higher oil recovery percentages were obtained in the Experiments A and B, for G = 0.015 (77.7% and 86.796, respectively), fol- lowed by Experiments E and F with G = 0.005 (70.4% and 64.596, respectively). Although the displacement for G =
0.005 was faster than the displacement for G = 0.015, more scattered oil drops were left trapped behind and a counter- current oil flow took place, expelling the oil trapped close to the inlet. This was observed to happen after the outlet was water-flooded (Figure 4, last slide of each experiment). A similar behavior is observed in porous models by Chatzis et
Experiments with G = 0.075 ( C and D) .
350
300
"5
50
0 1 I 10 100 1000
Time, minutes
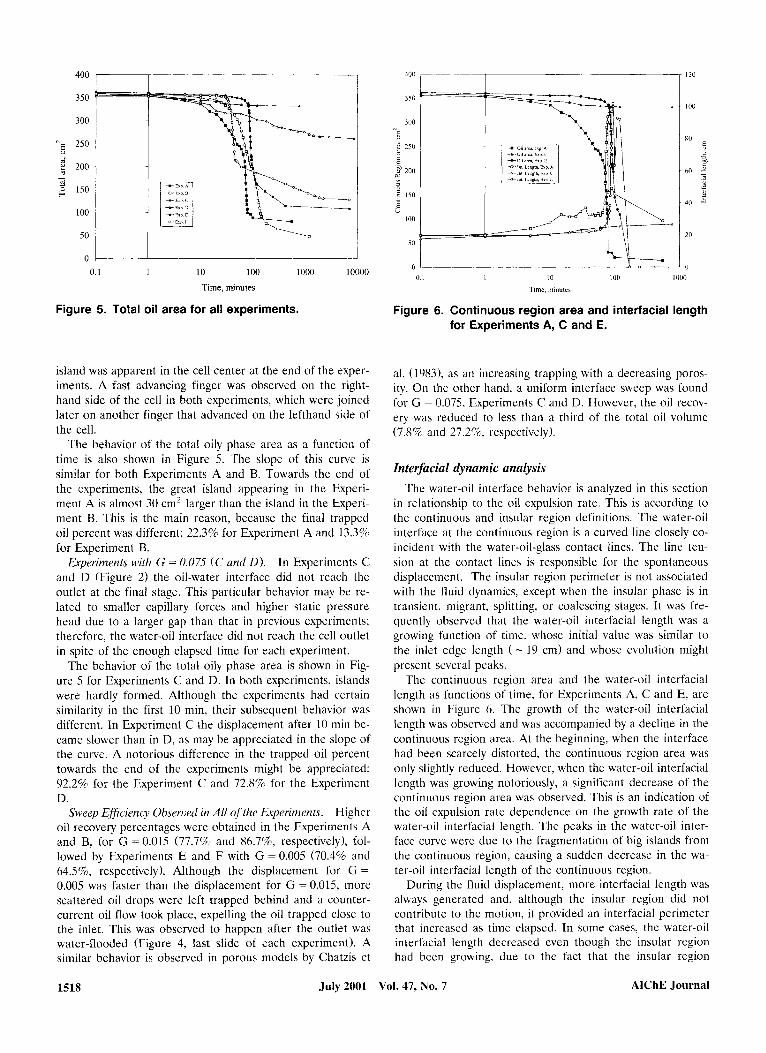
Figure 6. Continuous region area and interfacial length for Experiments A, C and E.
al. (19831, as an increasing trapping with a decreasing poros- ity. On the other hand, a uniform interface sweep was found for G = 0.075, Experiments C and D. However, the oil recov- ery was reduced to less than a third of the total oil volume (7.8% and 27.256, respectively).
Interfacial dynamic analysis The water-oil interface behavior is analyzed in this section
in relationship to the oil expulsion rate. This is according to the continuous and insular region dcfinitions. The water-oil interface at the continuous region is a curved line closely co- incident with the water-oil-glass contact lines. The line ten- sion at the contact lines is responsible for the spontaneous displacement. The insular region perimeter is not associated with the fluid dynamics, except when the insular phase is in transient, migrant, splitting, or coalescing stages. It was fre- quently observed that the water-oil interfacial length was a growing function of time, whose initial value was similar to the inlet edge length ( - 19 cm) and whose evolution might present several peaks.
The continuous region area and the water-oil interfacial length as functions of time, for Expcriments A, C and E, are shown in Figure 6. The growth of the water-oil interfacial length was observed and was accompanied by a decline in the continuous region area. At the beginning, when the interface had been scarcely distorted, the continuous region area was only slightly reduced. However, when the water-oil interfacial length was growing notoriously, a significant decrease of the continuous region area was observed. This is an indication of the oil expulsion rate dependence on the growth rate of the water-oil interfacial length. The peaks in the water-oil inter- face curve were due to the fragmentation of big islands from the continuous region, causing a sudden decrease in the wa- ter-oil interfacial length of the continuous region.
During the fluid displacement, more interfacial length was always generated and, although the insular region did not contribute to the motion, it provided an interfacial perimeter that increased as time elapsed. In some cases, thc water-oil interfacial length decreased even though the insular region had been growing, due to the fact that the insular region
AlChE Journal 1518 July 2001 Vol. 47, No. 7
0. I t 10 I00 1000 10000
Time, minutes
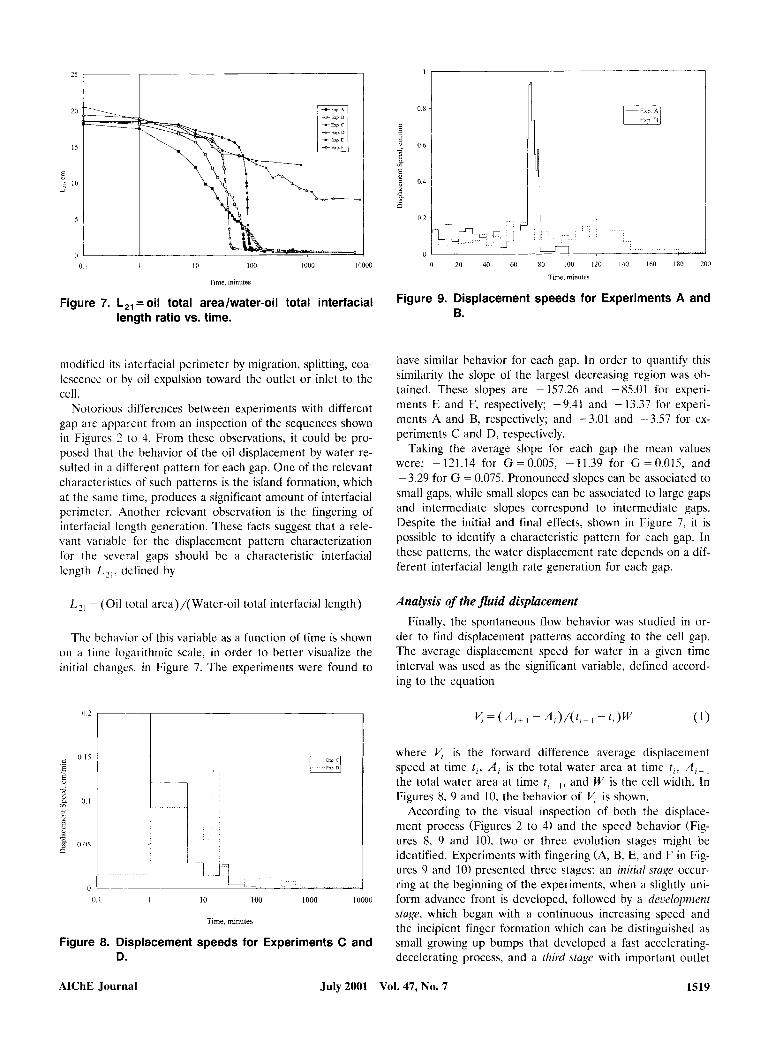
Figure 7. L,, = oil total area/water-oil total interfacial length ratio vs. time.
modified its interfacial perimeter by migration, splitting, coa- lescence or by oil expulsion toward the outlet or inlet to the cell.
Notorious differences between experiments with different gap arc apparent from an inspection of the sequences shown in Figures 2 to 4. From these observations, it could be pro- posed that the behavior of the oil displacement by water re- sulted in a different pattern for each gap. One of the relevant characteristics of such patterns is the island formation, which at the same time, produces a significant amount of interfacial perimeter. Another relevant observation is the fingering of interfacial lcngth generation. These facts suggest that a rele- vant variable for the displacement pattern characterization for the several gaps should be a characteristic interfacial length L ? , , defined by
L,, = (Oil total area)/(Water-oil total interfacial length)
The behavior of this variable as a function of time is shown on a time logarithmic scale, in order to better visualize the initial changes, in Figure 7. The experiments were found to
( I 2 i- --r I
1 0. I I 10 100 1000 I0000
Time, minutes
Figure 8. Displacement speeds for Experiments C and D.
0 8
0.6 f c m -
0.4 - B
0 2
0 0 20 40 60 80 100 120 140 IhO 180 200
Time. minuleb
Figure 9. Displacement speeds for Experiments A and B.
have similar behavior for each gap. In order to quantify this similarity the slope of the largest decreasing region was ob- tained. These slopes are - 157.26 and - 85.01 for experi- ments E and F, respectively; -9.41 and - 13.37 for experi- ments A and B, respectively; and -3.01 and -3.57 for ex- periments C and D, respectively.
Taking the average slope for each gap the mean values were: - 121.14 for G = 0.005, - 11.39 for G = 0.015, and - 3.29 for G = 0.075. Pronounced slopes can be associated to small gaps, while small slopes can be associated to large gaps and intermediate slopes correspond to intermediate gaps. Despite the initial and final effects, shown in Figure 7, it is possible to identify a characteristic pattern for each gap. In these patterns, the water displacement rate depends on a dif- ferent interfacial length rate generation for each gap
Analysis of the fluid displacement Finally, the spontaneous flow behavior was studied in or-
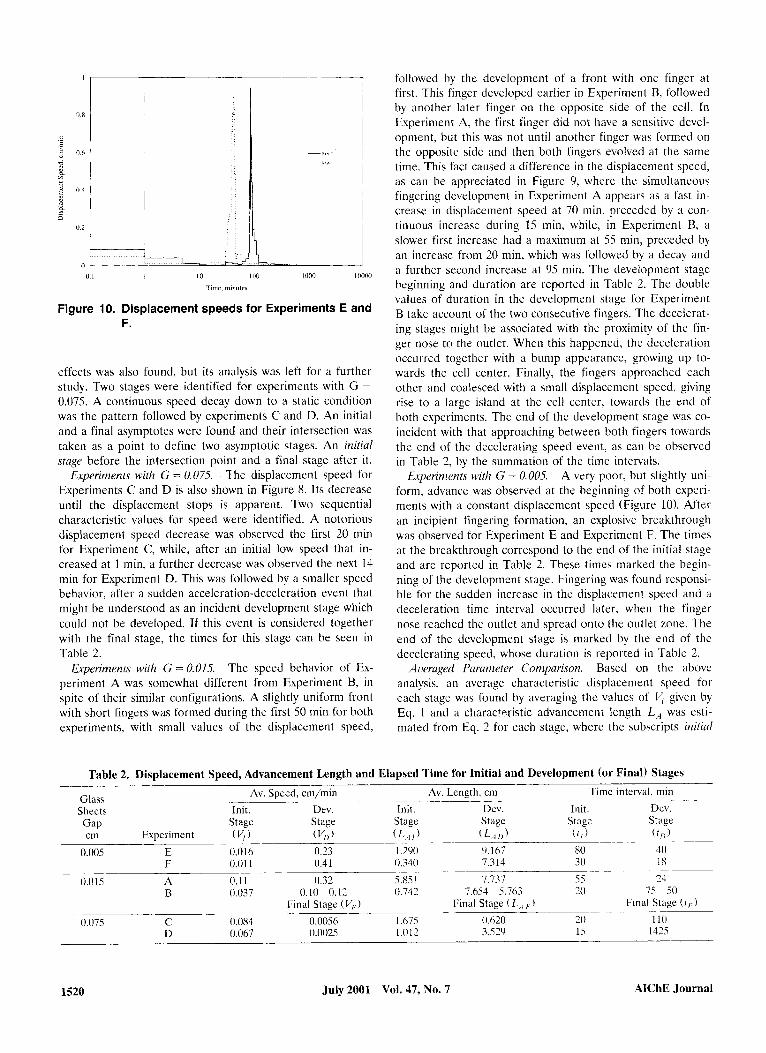
der to find displacement patterns according to the cell gap. The average displacement speed for water in a given time interval was used as the significant variable, defined accord- ing to the equation
where is the forward difference average dispiaccment speed at time t , , A, is the total water area at time t , , A , , , the total water area at time t ,+ I, and W is the cell width. In Figures 8. 9 and 10. the behavior of V, is shown.
According to the visual inspection of both the displace- ment process (Figures 2 to 4) and the speed behavior (Fig- ures 8, 9 and lo), two or three evolution stages might be identified. Experiments with fingering (A, B, E, and F in Fig- ures 9 and 10) presented three stages: an initial stage occur- ring at the beginning of the experiments, when a slightly uni- form advance front is developed, followed by a development stage, which began with a continuous increasing speed and the incipient finger formation which can be distinguished as small growing up bumps that developed a fast accelerating- decelerating process, and a third stage with important outlet
AIChE Journal July 2001 Vol. 47, No. 7 1519
0 1 I 10 I00 In00
Time. minule~
L, loo00
Figure 10. Displacement speeds for Experiments E and F.
effects was also found, but its analysis was left for a further study. Two stages were identified for experiments with G =
0.075. A continuous speed decay down to a static condition was the pattern followed by experiments C and D. An initial and a final asymptotes were found and their intersection was taken as a point to define two asymptotic stages. An initial stage before the intersection point and a final stage after it.
The displacement speed for Experiments C and D is also shown in Figure 8. Its decrease until the displacement stops is apparent. Two sequential characteristic values for speed were identified. A notorious displacement speed decrease was observed the first 20 min for Experiment C. while, after an initial low speed that in- creased at 1 min, a further decrease was observed the next 14 min for Experiment D. This was followed by a smaller speed behavior, after a sudden acceleration-deceleration event that might be understood as an incident development stage which could not be developed. If this event is considered together with the final stage, the times for this stage can be seen in Table 2.
The speed behavior of Ex- periment A was somewhat different from Experiment B, in spite of their similar configurations. A slightly uniform front with short fingers was formed during the first 50 min for both experiments, with small values of the displacement speed,
Experiments with G = 0.075.
Experiments with G = 0.015.
followed by the development of a front with one finger at first. This finger developed earlier in Experiment B, followed by another later finger on the opposite side of the cell. In Experiment A, the first finger did not have a sensitive devei- opment, but this was not until another finger was formed on the opposite side and then both fingers evolved at the same time. This fact caused a difference in the displacement speed, as can be appreciated in Figure 9, where the simultaneous fingering development in Experiment A appears as a fast in- crease in displacement speed at 70 min, preceded by a con- tinuous increase during 15 min, while, in Experiment €3, a slower first increase had a maximum at 55 min, preceded by an increase from 20 min, which was followed by a decay and a further second increase at 95 min. The development stage beginning and duration arc reported in Table 2. The double values of duration in the development stage for Experiment B take account of the two consecutive fingers. The decelerat- ing stages might be associated with the proximity of the fin- ger nose to the outlet. When this happened, the deceleration occurred together with a bump appearance, growing up to- wards the cell center. Finally, the fingers approached each other and coalesced with a small displacement speed, giving rise to a large island at the cell center, towards the end of both experiments. The end of the development stage was co- incident with that approaching between both fingers towards the end of the decelerating speed event, as can be observed in Table 2, by the summation of the time intervals.
A very poor, but slightly uni- form, advance was observed at the beginning of both experi- ments with a constant displacement speed (Figure 10). After an incipient fingering formation, an explosive breakthrough was observed for Experiment E and Experiment F. The times at the breakthrough correspond to the end of the initial stage and are reported in Table 2. These times marked the begin- ning of the development stage. Fingering was found responsi- ble for the sudden increase in the displacement speed and a deceleration time interval occurred later. when the finger nose reached the outlet and spread onto the outlet zone. The end of the development stage is marked by the end of the decelerating speed, whose duration is reported in Table 2.
Averaged Parameter Comparison. Based on the above analysis, an average characteristic displacement speed for each stage was found by averaging the values of I/; given by Eq. 1 and a characteristic advancement length LA was esti- mated from Eq. 2 for each stage, where the subscripts initia!
Experiments with G = 0.005.
Table 2. Displacement Speed, Advancement Length and Elapsed Time for Initial and Development (or Final) Stages Time interval, min
~ . ~ -~ - Av. Length, cm
~ ~- ~ ~
Av. Speed, cm/min Glass ~ . ~~ ~~~ ~~
Sheets Init. Dev. Init. DW. Init. DW. Stage Stage Stage Stage Stage Stage
cm Experiment (5) ( V/l ) ( L , < / ) ( LA / I ) ( t , ) ( t , ) Gap
0.005 E 0.016 0.23 1.290 9.167 80 40 F 0.01 1 0.41 0.340 7.3 14 31) 18
0.015 A 0.11 0.32 5.851 7.737 55 24 B 0.037 0.10 0.12 0.742 7.054 5.763 20 75 50
0.075 C 0.084 0.0056 I ,675 0.620 20 I 1 0 D 0.067 0.0025 1.012 3.52Y 15 1425
_ _
Final Stage ( L,,l ) Final Stage ( I I ; ) _~ Final Stage (V,)
~~
1520 July 2001 Vol. 47, No. 7 AIChE Journal
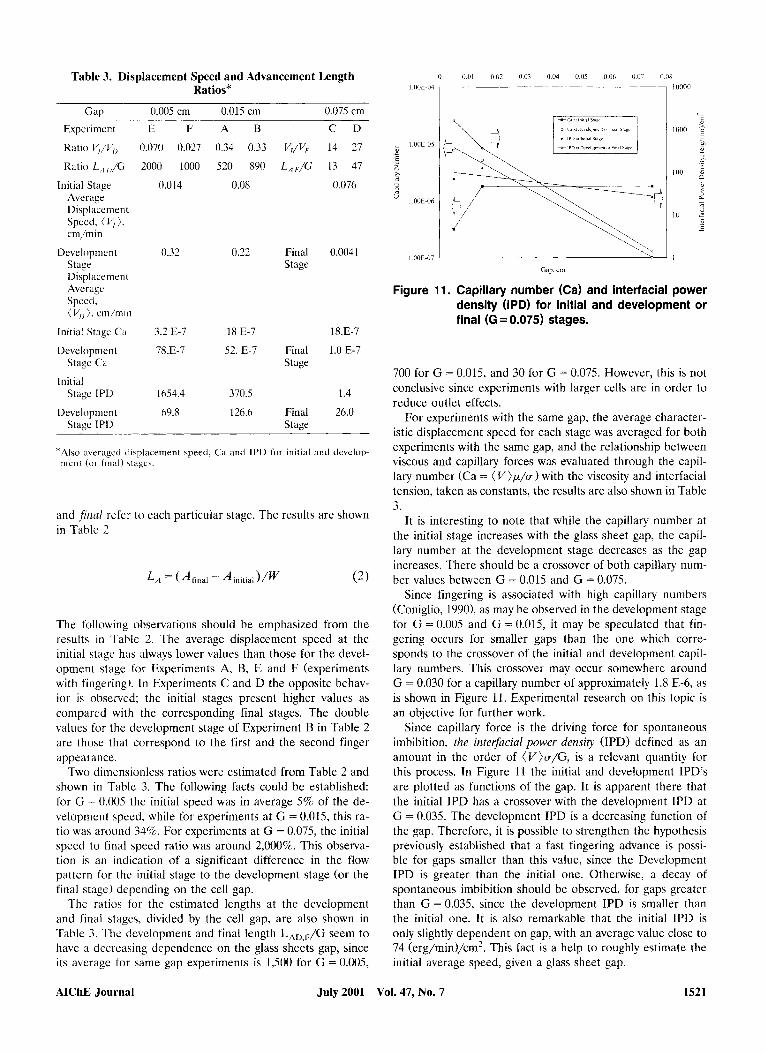
Table 3. Displacement Speed and Advancement Length Ratios*
Gap 0.005 cm 0.015 cm 0.075 cm Experiment E F A B C D
Ratio V,/",l 0 070 0.027 0.34 0.33 V,/V, 14 27
Ratio I- f,,/G 2000 1000 520 890 L,,/G 13 47
Initial Stage Average Displacement
cm/min
1)eveloprnent
Spccd. (I.', ).
Stage Displacement Average Speed. (V , ) ) . cm/min
Initial Stage C;i
Development Stage Ca
Initial Stage IPD
Development Stage IPD
0.014 0.08 0.076
0.32 0.22 Final 0.0041 Stage
3.2 E-7 18 E-7 18.E-7
78.E-7 52. E-7 Final 1.0 E-7 Stage
1654.4 370.5 1.4
69.8 126.6 Final 26.0 Stage
Y - *Also averagcd displacement speed. Ca and IPD for initial and develop-
m a i t ( o r final) \tages.
and f i n d refer to each particular stage. The results are shown in Table 2
The following observations should be emphasized from the results in Table 2. The average displacement speed at the initial stage has always lower values than those for the devel- opment stage for Experiments A, B, E and F (experiments with fingering). I n Experiments C and D the opposite behav- ior is observed; the initial stages present higher values as compared with the corresponding final stages. The double values for the development stage of Experiment B in Table 2 are those that correspond to the first and the second finger appearance.
Two dimensionless ratios were estimated from Table 2 and shown in Table 3. The following facts could be established: for G = 0.005 the initial speed was in average 5% of the de- velopment speed. while for experiments at G = 0.015, this ra- tio was around 34%. For experiments at G = 0.075, the initial speed to final speed ratio was around 2,000%. This observa- tion is an indication of a significant difference in the flow pattern for the initial stage to the development stage (or the final stage) depending on the cell gap.
The ratios for the estimated lengths at the development and final stages, divided by the cell gap, are also shown in Table 3. The development and final length L,,,,/G seem to have a decreasing dependence on the glass sheets gap, since its average for same gap experiments is 1,500 for G = 0.005,
Figure 11. Capillary number (Ca) and interfacial power density (IPD) for initial and development or final (G = 0.075) stages.
700 for G = 0.015, and 30 for G = 0.075. However, this is not conclusive since experiments with larger cells are in order to reduce outlet effects.
For experiments with the same gap, the average character- istic displacement speed for each stage was averaged for both experiments with the same gap, and the relationship between viscous and capillary forces was evaluated through the capil- lary number (Ca = ( V > p / v ) with the viscosity and interfacial tension, taken as constants, the results are also shown in Table 3.
It is interesting to note that while the capillary number at the initial stage increases with the glass sheet gap, the capil- lary number at the development stage decreases as the gap increases. There should be a crossover of both capillary num- ber values between G = 0.015 and G = 0.075.
Since fingering is associated with high capillary numbers (Coniglio, 19901, as may be observed in the development stage for G = 0.005 and G = 0.015, it may be speculated that fin- gering occurs for smaller gaps than the one which corre- sponds to the crossover of the initial and development capil- lary numbers. This crossover may occur somewhere around G = 0.030 for a capillary number of approximately 1.8 E-6, as is shown in Figure 11. Experimental research on this topic is an objective for further work.
Since capillary force is the driving force for spontaneous imbibition, the interfacial power density (IPD) defined as an amount in the order of (V>v/G, is a relevant quantity for this process. In Figure 11 the initial and development IPD's are plotted as functions of the gap. It is apparent there that the initial JPD has a crossover with the development IPD at G = 0.035. The development IPD is a decreasing function of the gap. Therefore, it is possible to strengthen the hypothesis previously established that a fast fingering advance is possi- ble for gaps smaller than this value, since the Development IPD is greater than the initial one. Otherwise, a decay of spontaneous imbibition should be observed, for gaps greater than G = 0.035, since the development IPD is smaller than the initial one. It is also remarkable that the initial IPD is only slightly dependent on gap, with an average value close to 74 (erg/min)/cm2. This fact is a help to roughly estimate the initial average speed, given a glass sheet gap.
AIChE Journal July 2001 Vol. 47, No. 7 1521
The experimental findings of this study allow us to set that the maximum recovery in Hele-Shaw cells is not only due to the separation. but also to the dynamic hehavior of the island formation and to the fingers evolution. Therefore, it should not be considered that the greater the capillary force. the better the oil recovery, since the formation of many islands could prevent the efficiency recovery to be as much as it might be expected. It also should be noted that the fast finger ad- vancing could block the outlet early, generating a backwards oil flow and oil entrapment that should drop down the oil recovery efficiency. Moreover, for greater sheet separations. the capillary forcc is very weak and forced imbibition should be the only way to drive water into the medium after a short spontaneous imbibition process took place, leaving the spon- taneous imbibition as the main mechanism at the porous medium only. These conclusions might be useful for the sec- ondary recovery processes in fractured water-wet reservoirs. However, we acknowledge that many specific studies are yet needed. It should be pointed out that although the reported results are not scalable to naturally fractured reservoir condi- tions, it is yet possible to determine the governing mecha- nisms and behavior in spontaneous imbibition processes. These mechanisms should be considered in the matrix-frac- ture interaction models in order to obtain better predictions and make contributions to the optimization of secondary oil recovery processes.
Conclusions Repeatability
The spontaneous displacement process of oil (Soltrol 170) by twice-distilled water can approximately be repeated. A scrupulous cleaning procedure was able to restore the glass sheets original wettability. The displacement pattern and rate for every experiment and its repetition has a similar behavior that depended on the cell gap. The optimum oil recovery was achieved for a G = 0.015.
Waviness Natural glass surface waviness is too small, as comparcd to
the cell gap, in order to make significant contributions to the spontaneouy imbibition flow patterns. A significant change in the displacement pattern can be generated only by a signifi- cant change in the glass sheet gap.
Water-oil interface length For each gap, a defined behavior of the (oil total
area)/(water-oil total interfacial length) ratio was found. For a G = 0.005. the slope was - 121.14 cm. For a G = 0.015, the slope was -11.39 em, and for a G = 0.075 the slope was -3.29 cm. The interfacial length growth is the mechanism for spontaneous displacement of oil by water, because it oc- curred with a continuous interfacial length generation hefore outlet effects could be detected. This is an indication of the oil expulsion rate dependence on the growth rate of watcr-oil interfacial length. Neglecting the outlet effects, i t seems that there is no way for the interface to advance without increas- ing its magnitude.
Types of flow The spontaneous displacement speed showed three con-
secutive stages for G = 0.015 and for ti = 0.005: a first one was named the initial stage with a slightly uniform front in- terface displaccment, a second one was named the devclop- ment stage with fingering displacement. and a third one was named the final stage with outlet interaction. Two stages were observed for thc displacement speed for G = 0.075: a first one or the initial stagc. fastcr than a second one or the final stage. The initial stagc speed t o thc development stage speed ratio was evaluated for each gap: For G = 0.005, the ratio was approximately 5%; for G = 0.015. i t was around 34% and, for G = 0.075, it was around 2,00OC4.
Capi lhy number The avcragc displacement speed at the development stage
for each gap was 0.22 cm/min for G = 0.005, 0.32 cm/min for G = 0.015, and 0.0041 cm/min for ti = 0.075. A fingering dis- placement i n the development stage appeared for G = 0.015 and smaller. For G = 0.075, the displacement is slightly uni- form and the speed decreases until static equilibrium is reached. The capillary number at the initial stage increases with the glass sheet gap for smaller gap values and stays con- stant for G >_ 0.015. At thc dcvelopment and final stages, the capillary number decreases as thc gap increases. There should be a crossover around G = 0.030 for both capillary number values.
Interfacial power density The initial interfacial power density is only slightly depen-
dent on gap, with an average value close to 74 (crg/min)/cm'. while the dcvelopment interfacial power density is a decreas- ing function of the gap. A fast fingering advance is possible for gaps smaller than 0.035 cm. otherwise a decay of sponta- neous imbibition should be observed after the Initial stage.
Acknowledgments This research was supported by lnstituto Mexicano del Petr6leo
through the research projects FIES 05-92-1 and 97-07-1. The authors are also indebted to the Thermodynamic\ Lahoratory group a t the Universidad A u t h o m a Metropolitana. Unidad Iztapalapa. Special acknowledgments are due to Dr. Francisco Guzman L6pez-Figueroa who allowed us the use of laboratory facilities for this research pro- ject and inany fruitful discussions on the cxperimental setup. Also we greatly benefit from the review and discussions of Dr. Gretchen Lapidus. The authors also benefited fi-om a Negromex financial aid at the former stage of the project.
Literature Cited Akin. S., J. M. Schenibre. S. K. Bhat. and A. R. Kovscck. "Spontci-
neous Imbibition Characteristics of Diatomite," .I. (!/'Pet. %i. mid EHR., 25. 14c) (March 2000).
Aronofsky, J. S.. L. Mashi, and S. G. Natanson. "A Model for the Mechankm o f Oil Recovery from the Porous Matrix Due to Water Invasion in Fi-acturcd Rescrvoirs," Pel. Trm7.s. AZME, 213. 17 (1958).
Bech. N., 0. K. Jensen, ;ind 8. Nielsen. "Modeling o f Gravity-Im- bibition and Gravity-Drainage Proc Analytic and Numerical Solutions."SI'E'KE. I29 (Fcb., 1991 ).
1522 July 2001 Vol. 47, No. 7 AIChE Journal
Beckner, B. L., K. Ishimoto, S. Yamaguchi. A. Firoozabadi, and K. Azizet. “ Imbibition-Dominated Matrix-Fracture Fluid Transfer in Dual Poroyity Simulators,” Technical Conf. and Exhibition of SPE Proc., Dallas. p. 509 (Sept. 27-30, 1987).
Bohek, J. E., C. C. Mattax, and M. 0. Denekas, “Reservoir Rock Wettability-Its Significance and Evaluation,” Pet. Trans. AIME, 213, 155 (1958).
Bourbiaux, B. J.. and F. J. Kalaydjian, “Experimental Study of Cocurrent and Countercurrent Flows in Natural Porous Media,” SPE Keseriloir Eng., 361 (Aug., 1990).
Brownscombe, E. R., and A. B. Dyes, “ Water-Imbibition Displace- ment ... Can it Release Reluctant Spraberry Oil,” Oil and Gas J . , 264 (Nov. 17, 1952).
Cuiec, L. E.. B. Bourbiaux, and F. Kalaydjian,“Imbibition in Low- Permeability Porous Media: Understanding and Improvement of Oil Recovery,” S-ymp. on EOR Proc., Tulsa, OK, SPE/DOE No. 20259, 833 (Apr. 22-25, 1990).
Chatzis. I.. N. Morrow, and H. T. Lim, “Magnitude and Detailed Structure of Residual Oil Saturation,” SPEI, 311 (Apr., 1983).
Chatis, I . , and t . A. L. Dullien, “Dynamic Immiscible Displacement Mechanism in Pore Doublets: Theory versus Experiment,” .I. of Colloid unti hzterjhce Sci., 91, 199 (1983).
de Swaan, A,. “Theory of Water-Flooding in Fractured Reservoirs,” Soc. 01‘ Per. b i g . SOC. J . , 265, 117 (Apr., 1978).
de Swaan, A,. and M. Ramirez, “Functions of Flow from Porous-Rock Blocks.” Unsolicited paper, SPE No. 20173 (1990).
de Swaan. A., ”Simple Models of Water Imbibition and Gravita- tional Drainage of Oil in Rock Blocks,” SPE Int. Petroleum Conf and Exhihition of M&xico Proc., Villahermosa, MCxico, SPE No. 39829 (Mar. 3-5. 1998).
Dussan. E. B., E. RamC, and S. Garoff, “On-Identifying the Appro- priate Boundary Conditions at a Moving Contact Line: an Experi- mental Investigation,” JFM, 230, 97 (1991).
Hayashi. 3 . A,. “Procesos de Imhibici6n Espontinea en Celdas Hele-Shaw,” PhD Diss., Universidad Autonoma Metropolitana- Iztapalapa (2001 ),
Hayashi, J. A., and C. PCrez-Rosales, “Visual Investigation of Imbi- hition Processes.”LAPEC SPE Proc., Caracas, Venezuela, SPE No. 23745, 353 (Apr. 5-7, 1992).
Hayashi, J. A., and A. Soria, “Estudio Experimental del Flujo a Co- corriente y a Contracorriente en Procesos de Imbibicion Esponthnea, Utilizando Celdas Porosas Bidimensionales,” Auances en Ingenieria Quimica, 5, 272 (1995).
Jacquin, Ch.. and B. Legait. “Influence of Capillarity and Viscosity
During Spontaneous Imbibition in Porous Media and in Capillar- ies,” PCH PhysicoChemical Hydrodyn., 5, 307 (1984).
Kalaydjian, F., and B. Legait, “Effects de la GComCtrie des Pores et de la MouillabilitC sur le DCplacement Diphasique 2 Contre- courant en Capillaire et en Milleu Poreux,” Reurce Phys. Appl., 23, 1071 (1988).
Kazemi, H., L. S. Merril, K. L. Porterfield, and P. R. Zeman, “Numerical Simulation of Water-Oil Flow in Natural Fractured Reservoirs,”SPE J . , 317 (Dec., 1976).
Kleppe, J., and R. A. Morse, “Oil Production from Fractured Reser- voirs by Water Displacements,” 49th Ann. Fall Meeting SPE-AIME Proc., Houston, TX, SPE No. 5084 (Oct. 6-9, 1974).
Lefebvre du Prey, “Gravity and Capillary Effects on Imbibition Porous Media,”SPEJ., SPE No. 6192. 195 (June, 1978).
Mattax, C. C., and J. R. Kyte, “Imbibition Oil Recovery from Frac- tured, Water-Drive Reservoir,” SPE J . , 177 (June, 1962).
Ramirez, M. A., “Estudio Experimental de la Imbibici6n Espontinea en Medios Capilares,” MSc. Diss., ESIQIE, IPN (Dec., 1998).
Reis, J. C., and M. Cil, “Analytical Models for Capillary Imbihition: One Dimensional Matrix Blocks,” IN SITU, 23, 265 (1999).
Reis, J. C., and S. A. Haq, “Water Advance in a Single Fracture in the Presence of Capillary Imbibition into Adjacent Matrix Blocks,” IN SITU, 23, 271 (1999).
Rodriguez, F., “Modelo Analitico del Desplazamiento Lineal de Aceite por Inyecci6n de Agua en Yacimientos Naturalmente Frac- turados,” Ingenienu Petrolera, 20 (June, 1988).
Rossen, R. H., and E. I. C. Shen, “Simulation of Gas/Oil Drainage and Water/Oil Imbibition in Naturally Fractured Reservoirs,”SPE Reservoir Eng., 464 (Nov., 1989).
Saidi. A. M., “Simulation of Naturally Fractured Reservoirs,” SPE 12270, Proc. Reservoir Simulation Symp. Proc., San Francisco, CA. 361 (Nov. 15-18, 1983).
Spildo, K., and J. S. Buckley, “Uniform and Mixed Wetting in Square Capillaries,” J . of Petroleum Sci. and Eng., 24, 145 (1999).
Terez, I. A,, and A. Firoozabadi, “Water Injection in Water-Wet Fractured Porous Media: Experiments and a New Model with Modified Buckley-Leverett Theory,” SPE J . , 4, 134 (June. 1999).
Zhang, X., N. R. Morrow, and S. Ma, “Experimental Verification of a Modified Scaling Group for Spontaneous Imbibition.” SPERE, 280 (Nov.. 1996).
Manuscript receiued Ocr. 12. 1999, and reuision receiued Ocr. 17. 2000.
AIChE Journal July 2001 Vol. 47, No. 7 1523