Embed Size (px)
Citation preview
Molecular Phylogenetics and Evolution 36 (2005) 42–57
www.elsevier.com/locate/ympev
Speciation history of the North American funnel web spiders, Agelenopsis (Araneae: Agelenidae): Phylogenetic inferences
at the population–species interface
Nadia A. Ayoub a,¤, Susan E. Riechert a, Randall L. Small b
a Department of Ecology and Evolutionary Biology, University of Tennessee, 569 Dabney Hall, Knoxville, TN 37996, USAb Department of Botany, 437 Hesler Biology Building, University of Tennessee, Knoxville, TN 37996, USA
Received 24 July 2004; revised 11 March 2005Available online 22 April 2005
Abstract
Intra- and interspeciWc relationships of 12 out of 13 described species as well as a potential new species in the spider genus Agelen-opsis (Araneae: Agelenidae) were analyzed using sequence data from two mitochondrial genes, cytochrome oxidase I (COI) and 16Sribosomal RNA. Approximately half of the species examined formed well-supported monophyletic groups, whereas the rest of thespecies were part of well-supported monophyletic species groups. Rather than viewing cases where species were not identiWed asbeing monophyletic as poor taxonomy, these cases more likely represent recent speciation and oVer insights into the process of speci-ation. The clade with the lowest levels of interspeciWc sequence divergence was found in eastern North America, whereas western spe-cies displayed much higher levels of interspeciWc divergence. These patterns appear to extend below the species level as well, withsouthwestern species exhibiting the highest levels of intraspeciWc sequence divergence and geographic structuring. The relationshipbetween Agelenopsis and Barronopsis, a genus once considered a sub-genus of Agelenopsis, was also examined. The two genera arereciprocally monophyletic but more generic level sampling is needed to conWrm an apparent sister relationship between the two. 2005 Elsevier Inc. All rights reserved.
Keywords: Mitochondrial DNA; Barronopsis; Bayesian inference; Data partitions; Cytochrome oxidase I; 16S ribosomal RNA; Agelenidae
1. Introduction
One of the major objectives of evolutionary biology isto understand the process of speciation. InterspeciWcphylogenies oVer a record of speciation events and canbe used in combination with geographical or ecologicaldata to indirectly explore the causes of speciation withina particular group (Barraclough and Nee, 2001). WhenintraspeciWc data are also available, we have the addedinsight of being able to explore speciation across a con-
* Corresponding author. Present address: Department of Biology,University of California, Riverside, CA 92521, USA. Fax: +1 951 8274286.
E-mail address: [email protected] (N.A. Ayoub).
1055-7903/$ - see front matter 2005 Elsevier Inc. All rights reserved.doi:10.1016/j.ympev.2005.03.017
tinuum of population divergence to species divergence(Avise, 1994, 2000; Templeton, 2001). Application ofpopulation sampling to interspeciWc phylogenetic studiesis essential for addressing a number of questions aboutspeciation. One of the most basic of such questions iswhether or not taxonomic species actually representevolutionary units (i.e., monophyletic groups; Morandoet al., 2003). Population based sampling is also impor-tant in identifying geographic zones of hybridizationbetween closely related species and in determining thegeographic context of speciation. For instance, did speci-ation occur through the split of one ancestral speciesinto two allopatric units or did a daughter species arisein a small subset of the geographic range of a parent spe-cies. Applying population sampling to an entire group of
N.A. Ayoub et al. / Molecular Phylogenetics and Evolution 36 (2005) 42–57 43
species, such as a genus, also allows us to determine ifpatterns seen at the intraspeciWc level translate into pat-terns at the interspeciWc level, such as whether levels ofpopulation divergence correspond to speciation rates.The use of molecular data has become increasinglyimportant in exploring this “population–species” inter-face (Templeton, 2001) because other character systems(i.e., morphological) often lack intraspeciWc variability(Avise, 1994; Avise et al., 1987).
Many groups of spiders display negligible intraspe-ciWc morphological variation. Even spider genera typi-cally contain little morphological variation and speciesare described on the basis of genitalic characters of malepalpal organs involved in sperm transfer and female epi-gyna (Eberhard, 1983). Variable morphological charac-ters, though suYcient to describe species, are often toofew in number to create phylogenies. The advent ofmolecular methods has thus become increasingly usefulin phylogenetic and phylogeographic studies of spiders(e.g., Bond et al., 2001; Croucher et al., 2004; Garb et al.,2004; Gillespie, 2004; Hedin, 1997, 2001; Hedin andMaddison, 2001a,b; Hedin and Wood, 2002; Huberet al., 1993; Johannesen et al., 2002; Masta, 2000a; Pieland Nutt, 1997, 2000; Smith and Bond, 2003; Tan et al.,1999; Zehothofer and Sturmbauer, 1998). However, onlya few studies have attempted population sampling formost members of a genus (e.g., Hedin, 1997, 2001), mak-ing additional phylogenetic studies at the population–species interface necessary to identify general patterns ofspeciation in spiders.
An ideal group of spiders in which to examine pat-terns of speciation is a genus of funnel web spiders, Age-lenopsis Geibel (Araneae: Agelenidae). Agelenopsis iswidely distributed in North America and generallyabundant where found (Chamberlin and Ivie, 1941; per-sonal observations by NAA and SER). The dispersalability of these spiders is thought to be restricted becausethey are not known to disperse aerially through balloon-ing. Agelenids have not been collected during the courseof ballooning studies of spiders (e.g., Bishop, 1990;Weyman et al., 1995). We, further, have personally neverobserved Agelenopsis species to disperse via ballooning.Despite this likely restricted mode of dispersal, most spe-cies are widely distributed (Paison, 1997; Platnick, 2005).This combination of large ranges and restricted dispersalmay lead to high levels of geographic diVerentiationwithin species, since organisms with limited dispersaltend to retain historical patterns of divergence (Avise,1994). Additionally, because Agelenopsis is distributedthroughout North America, a phylogenetic analysis ofthe genus should oVer important insights into thebiogeography of the continent, such as whether specia-tion rates relate to speciWc geographic regions. Only afew morphological characters found in the male andfemale genitalia distinguish the 13 described species(Chamberlin and Ivie, 1941), precluding phylogenetic
analysis based solely on morphology. Thus, molecularanalysis is critical to clarifying the species and popula-tion relationships within this group.
The only attempt at inferring historical relationshipsamong Agelenopsis species was based on a crude branch-ing diagram of a few genitalic characters discussed in anunpublished Master’s thesis (Paison, 1997). However,questions have surfaced from morphological analysis ofthe genus. One interesting hypothesis proposed byPaison (1997) was that one of the described species,A. aleenae, is a rare Wrst generation hybrid between twoother species, A. aperta and A. spatula. This hypothesiswas based on the observation that the male genitalia ofA. aleenae are intermediate between the other two spe-cies and that the single A. aleenae individual recorded atthe time was found in a region where the ranges ofA. aperta and A. spatula overlap. Another question con-cerns the removal of two species from Agelenopsis to anew sub-genus, Barronopsis, by Chamberlin and Ivie(1941). Lehtinen (1967) later elevated Barronopsis togeneric level but the monophyly of these two genera hasnot been assessed. Currently, seven species of Barronopsishave been described (Platnick, 2005).
The main objective of this paper is to uncover withinand among species relationships of Agelenopsis toexplore patterns of speciation. We use sequence datafrom the mitochondrial genome to assess monophyly ofdescribed species with special attention to the status ofA. aleenae, the putative hybrid species. Because mito-chondrial DNA is typically maternally inherited in ani-mals, A. aleenae should exhibit identical mitochondrialsequence to the maternal species, either A. aperta orA. spatula, if it is a Wrst generation hybrid. In addition toassessing monophyly of described species, we examinegeographic patterns of variation at both the inter- andintraspeciWc levels. Finally, we assess whether Barronop-sis is monophyletic, and if so, what its relationship is toAgelenopsis.
2. Methods
2.1. Sampling
Taxon sampling for this study included 12 of the 13described Agelenopsis species (Table 1). We also col-lected two Agelenopsis individuals that could not beidentiWed to any previously described species and proba-bly constitute a new species, which we will refer to as “A.sp. nov.” throughout this paper. Most specimens werecollected live in the Weld but specimens of A. potteri andA. oregonensis from Oregon, California, and Canadawere sent to us preserved in 95 or 100% ethanol (seeTable 2 for list of sampling localities). We included mul-tiple individuals of each species from multiple popula-tions when possible.
44 N.A. Ayoub et al. / Molecular Phylogenetics and Evolution 36 (2005) 42–57
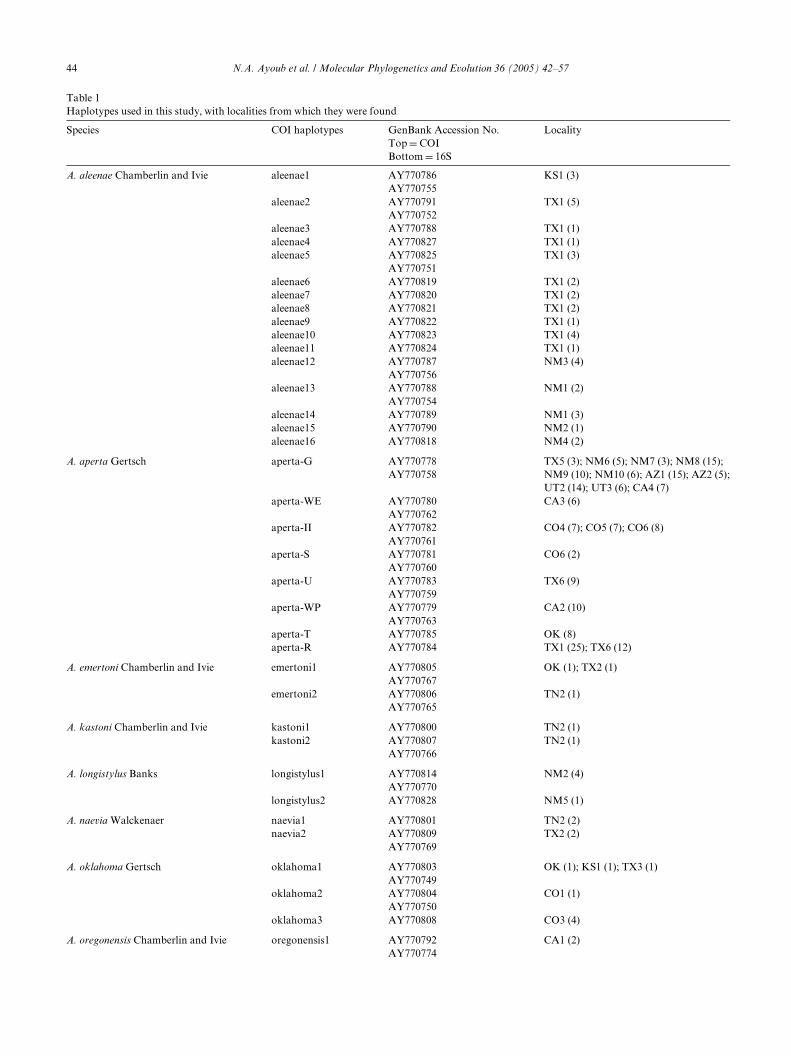
Table 1Haplotypes used in this study, with localities from which they were found
Species COI haplotypes GenBank Accession No.Top D COIBottom D 16S
Locality
A. aleenae Chamberlin and Ivie aleenae1 AY770786 KS1 (3)AY770755
aleenae2 AY770791 TX1 (5)AY770752
aleenae3 AY770788 TX1 (1)aleenae4 AY770827 TX1 (1)aleenae5 AY770825 TX1 (3)
AY770751aleenae6 AY770819 TX1 (2)aleenae7 AY770820 TX1 (2)aleenae8 AY770821 TX1 (2)aleenae9 AY770822 TX1 (1)aleenae10 AY770823 TX1 (4)aleenae11 AY770824 TX1 (1)aleenae12 AY770787 NM3 (4)
AY770756aleenae13 AY770788 NM1 (2)
AY770754aleenae14 AY770789 NM1 (3)aleenae15 AY770790 NM2 (1)aleenae16 AY770818 NM4 (2)
A. aperta Gertsch aperta-G AY770778 TX5 (3); NM6 (5); NM7 (3); NM8 (15);NM9 (10); NM10 (6); AZ1 (15); AZ2 (5);UT2 (14); UT3 (6); CA4 (7)
AY770758
aperta-WE AY770780 CA3 (6)AY770762
aperta-II AY770782 CO4 (7); CO5 (7); CO6 (8)AY770761
aperta-S AY770781 CO6 (2)AY770760
aperta-U AY770783 TX6 (9)AY770759
aperta-WP AY770779 CA2 (10)AY770763
aperta-T AY770785 OK (8)aperta-R AY770784 TX1 (25); TX6 (12)
A. emertoni Chamberlin and Ivie emertoni1 AY770805 OK (1); TX2 (1)AY770767
emertoni2 AY770806 TN2 (1)AY770765
A. kastoni Chamberlin and Ivie kastoni1 AY770800 TN2 (1)kastoni2 AY770807 TN2 (1)
AY770766
A. longistylus Banks longistylus1 AY770814 NM2 (4)AY770770
longistylus2 AY770828 NM5 (1)
A. naevia Walckenaer naevia1 AY770801 TN2 (2)naevia2 AY770809 TX2 (2)
AY770769
A. oklahoma Gertsch oklahoma1 AY770803 OK (1); KS1 (1); TX3 (1)AY770749
oklahoma2 AY770804 CO1 (1)AY770750
oklahoma3 AY770808 CO3 (4)
A. oregonensis Chamberlin and Ivie oregonensis1 AY770792 CA1 (2)AY770774
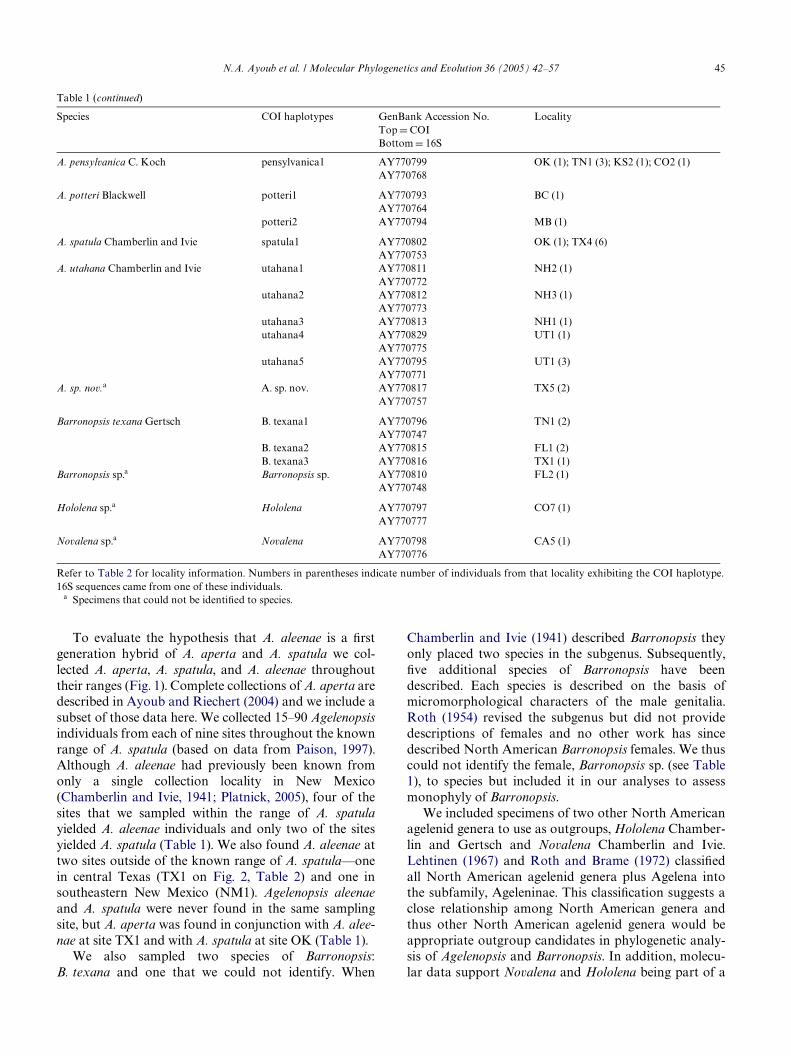
N.A. Ayoub et al. / Molecular Phylogenetics and Evolution 36 (2005) 42–57 45
To evaluate the hypothesis that A. aleenae is a Wrstgeneration hybrid of A. aperta and A. spatula we col-lected A. aperta, A. spatula, and A. aleenae throughouttheir ranges (Fig. 1). Complete collections of A. aperta aredescribed in Ayoub and Riechert (2004) and we include asubset of those data here. We collected 15–90 Agelenopsisindividuals from each of nine sites throughout the knownrange of A. spatula (based on data from Paison, 1997).Although A. aleenae had previously been known fromonly a single collection locality in New Mexico(Chamberlin and Ivie, 1941; Platnick, 2005), four of thesites that we sampled within the range of A. spatulayielded A. aleenae individuals and only two of the sitesyielded A. spatula (Table 1). We also found A. aleenae attwo sites outside of the known range of A. spatula—onein central Texas (TX1 on Fig. 2, Table 2) and one insoutheastern New Mexico (NM1). Agelenopsis aleenaeand A. spatula were never found in the same samplingsite, but A. aperta was found in conjunction with A. alee-nae at site TX1 and with A. spatula at site OK (Table 1).
We also sampled two species of Barronopsis:B. texana and one that we could not identify. When
Chamberlin and Ivie (1941) described Barronopsis theyonly placed two species in the subgenus. Subsequently,Wve additional species of Barronopsis have beendescribed. Each species is described on the basis ofmicromorphological characters of the male genitalia.Roth (1954) revised the subgenus but did not providedescriptions of females and no other work has sincedescribed North American Barronopsis females. We thuscould not identify the female, Barronopsis sp. (see Table1), to species but included it in our analyses to assessmonophyly of Barronopsis.
We included specimens of two other North Americanagelenid genera to use as outgroups, Hololena Chamber-lin and Gertsch and Novalena Chamberlin and Ivie.Lehtinen (1967) and Roth and Brame (1972) classiWedall North American agelenid genera plus Agelena intothe subfamily, Ageleninae. This classiWcation suggests aclose relationship among North American genera andthus other North American agelenid genera would beappropriate outgroup candidates in phylogenetic analy-sis of Agelenopsis and Barronopsis. In addition, molecu-lar data support Novalena and Hololena being part of a
Table 1 (continued)
Refer to Table 2 for locality information. Numbers in parentheses indicate number of individuals from that locality exhibiting the COI haplotype.16S sequences came from one of these individuals.
a Specimens that could not be identiWed to species.
Species COI haplotypes GenBank Accession No.Top D COIBottom D 16S
Locality
A. pensylvanica C. Koch pensylvanica1 AY770799 OK (1); TN1 (3); KS2 (1); CO2 (1)AY770768
A. potteri Blackwell potteri1 AY770793 BC (1)AY770764
potteri2 AY770794 MB (1)
A. spatula Chamberlin and Ivie spatula1 AY770802 OK (1); TX4 (6)AY770753
A. utahana Chamberlin and Ivie utahana1 AY770811 NH2 (1)AY770772
utahana2 AY770812 NH3 (1)AY770773
utahana3 AY770813 NH1 (1)utahana4 AY770829 UT1 (1)
AY770775utahana5 AY770795 UT1 (3)
AY770771A. sp. nov.a A. sp. nov. AY770817 TX5 (2)
AY770757
Barronopsis texana Gertsch B. texana1 AY770796 TN1 (2)AY770747
B. texana2 AY770815 FL1 (2)B. texana3 AY770816 TX1 (1)
Barronopsis sp.a Barronopsis sp. AY770810 FL2 (1)AY770748
Hololena sp.a Hololena AY770797 CO7 (1)AY770777
Novalena sp.a Novalena AY770798 CA5 (1)AY770776
46 N.A. Ayoub et al. / Molecular Phylogenetics and Evolution 36 (2005) 42–57
clade that is sister to a clade containing Agelenopsis andBarronopsis (personal communication with J. Spagnaand R. Gillespie).
Spiders collected as juveniles were reared in our lab-oratory to maturity, at which time species determina-tion was made using genitalic characters. Legs wereremoved and stored at ¡80 °C until DNA extraction;the remainder of each specimen was preserved in 75%ethanol, and voucher specimens were deposited in theArachnid Collection at the California Academy, SanFrancisco.
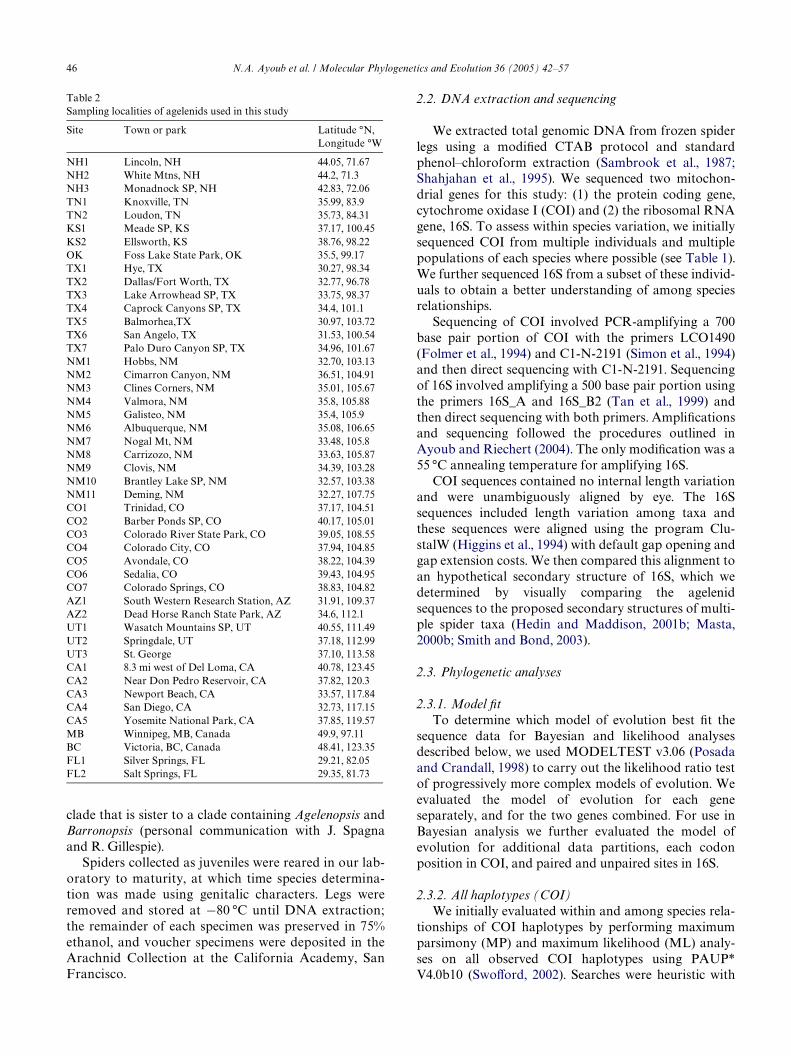
Table 2Sampling localities of agelenids used in this study
Site Town or park Latitude °N,Longitude °W
NH1 Lincoln, NH 44.05, 71.67NH2 White Mtns, NH 44.2, 71.3NH3 Monadnock SP, NH 42.83, 72.06TN1 Knoxville, TN 35.99, 83.9TN2 Loudon, TN 35.73, 84.31KS1 Meade SP, KS 37.17, 100.45KS2 Ellsworth, KS 38.76, 98.22OK Foss Lake State Park, OK 35.5, 99.17TX1 Hye, TX 30.27, 98.34TX2 Dallas/Fort Worth, TX 32.77, 96.78TX3 Lake Arrowhead SP, TX 33.75, 98.37TX4 Caprock Canyons SP, TX 34.4, 101.1TX5 Balmorhea,TX 30.97, 103.72TX6 San Angelo, TX 31.53, 100.54TX7 Palo Duro Canyon SP, TX 34.96, 101.67NM1 Hobbs, NM 32.70, 103.13NM2 Cimarron Canyon, NM 36.51, 104.91NM3 Clines Corners, NM 35.01, 105.67NM4 Valmora, NM 35.8, 105.88NM5 Galisteo, NM 35.4, 105.9NM6 Albuquerque, NM 35.08, 106.65NM7 Nogal Mt, NM 33.48, 105.8NM8 Carrizozo, NM 33.63, 105.87NM9 Clovis, NM 34.39, 103.28NM10 Brantley Lake SP, NM 32.57, 103.38NM11 Deming, NM 32.27, 107.75CO1 Trinidad, CO 37.17, 104.51CO2 Barber Ponds SP, CO 40.17, 105.01CO3 Colorado River State Park, CO 39.05, 108.55CO4 Colorado City, CO 37.94, 104.85CO5 Avondale, CO 38.22, 104.39CO6 Sedalia, CO 39.43, 104.95CO7 Colorado Springs, CO 38.83, 104.82AZ1 South Western Research Station, AZ 31.91, 109.37AZ2 Dead Horse Ranch State Park, AZ 34.6, 112.1UT1 Wasatch Mountains SP, UT 40.55, 111.49UT2 Springdale, UT 37.18, 112.99UT3 St. George 37.10, 113.58CA1 8.3 mi west of Del Loma, CA 40.78, 123.45CA2 Near Don Pedro Reservoir, CA 37.82, 120.3CA3 Newport Beach, CA 33.57, 117.84CA4 San Diego, CA 32.73, 117.15CA5 Yosemite National Park, CA 37.85, 119.57MB Winnipeg, MB, Canada 49.9, 97.11BC Victoria, BC, Canada 48.41, 123.35FL1 Silver Springs, FL 29.21, 82.05FL2 Salt Springs, FL 29.35, 81.73
2.2. DNA extraction and sequencing
We extracted total genomic DNA from frozen spiderlegs using a modiWed CTAB protocol and standardphenol–chloroform extraction (Sambrook et al., 1987;Shahjahan et al., 1995). We sequenced two mitochon-drial genes for this study: (1) the protein coding gene,cytochrome oxidase I (COI) and (2) the ribosomal RNAgene, 16S. To assess within species variation, we initiallysequenced COI from multiple individuals and multiplepopulations of each species where possible (see Table 1).We further sequenced 16S from a subset of these individ-uals to obtain a better understanding of among speciesrelationships.
Sequencing of COI involved PCR-amplifying a 700base pair portion of COI with the primers LCO1490(Folmer et al., 1994) and C1-N-2191 (Simon et al., 1994)and then direct sequencing with C1-N-2191. Sequencingof 16S involved amplifying a 500 base pair portion usingthe primers 16S_A and 16S_B2 (Tan et al., 1999) andthen direct sequencing with both primers. AmpliWcationsand sequencing followed the procedures outlined inAyoub and Riechert (2004). The only modiWcation was a55 °C annealing temperature for amplifying 16S.
COI sequences contained no internal length variationand were unambiguously aligned by eye. The 16Ssequences included length variation among taxa andthese sequences were aligned using the program Clu-stalW (Higgins et al., 1994) with default gap opening andgap extension costs. We then compared this alignment toan hypothetical secondary structure of 16S, which wedetermined by visually comparing the agelenidsequences to the proposed secondary structures of multi-ple spider taxa (Hedin and Maddison, 2001b; Masta,2000b; Smith and Bond, 2003).
2.3. Phylogenetic analyses
2.3.1. Model WtTo determine which model of evolution best Wt the
sequence data for Bayesian and likelihood analysesdescribed below, we used MODELTEST v3.06 (Posadaand Crandall, 1998) to carry out the likelihood ratio testof progressively more complex models of evolution. Weevaluated the model of evolution for each geneseparately, and for the two genes combined. For use inBayesian analysis we further evaluated the model ofevolution for additional data partitions, each codonposition in COI, and paired and unpaired sites in 16S.
2.3.2. All haplotypes (COI)We initially evaluated within and among species rela-
tionships of COI haplotypes by performing maximumparsimony (MP) and maximum likelihood (ML) analy-ses on all observed COI haplotypes using PAUP*V4.0b10 (SwoVord, 2002). Searches were heuristic with
N.A. Ayoub et al. / Molecular Phylogenetics and Evolution 36 (2005) 42–57 47
100 replications of random stepwise addition sequences 2.3.4. Combined data
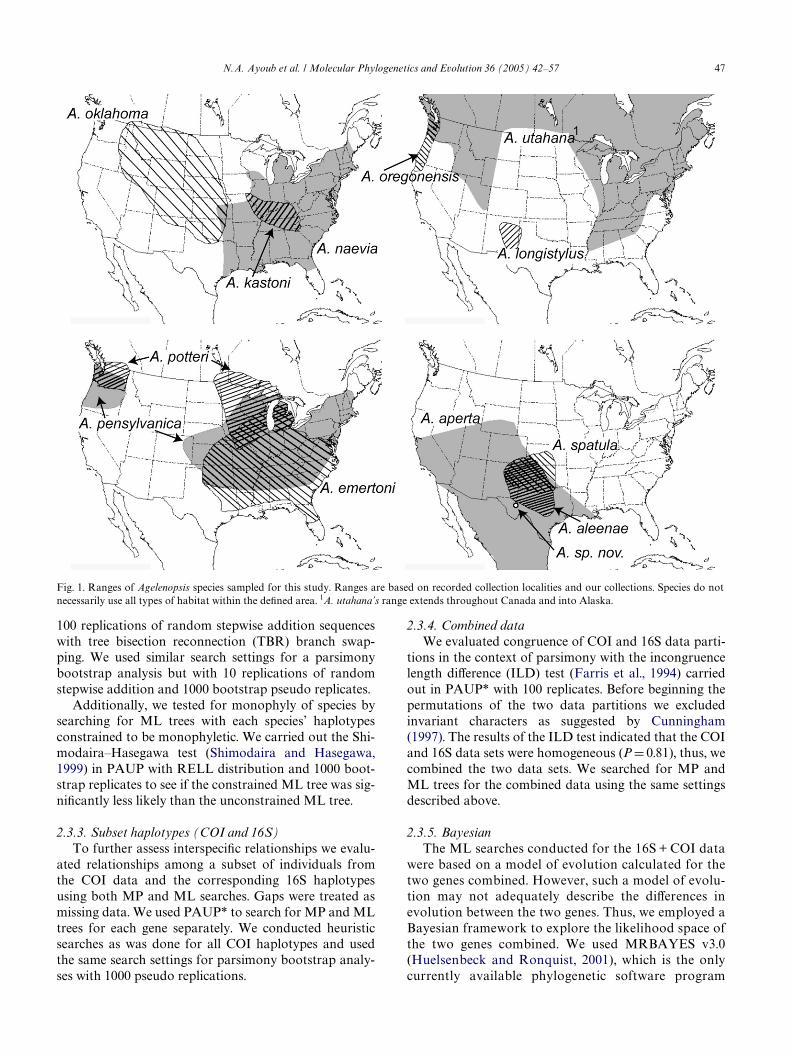
Fig. 1. Ranges of Agelenopsis species sampled for this study. Ranges are based on recorded collection localities and our collections. Species do notnecessarily use all types of habitat within the deWned area. 1A. utahana’s range extends throughout Canada and into Alaska.
with tree bisection reconnection (TBR) branch swap-ping. We used similar search settings for a parsimonybootstrap analysis but with 10 replications of randomstepwise addition and 1000 bootstrap pseudo replicates.
Additionally, we tested for monophyly of species bysearching for ML trees with each species’ haplotypesconstrained to be monophyletic. We carried out the Shi-modaira–Hasegawa test (Shimodaira and Hasegawa,1999) in PAUP with RELL distribution and 1000 boot-strap replicates to see if the constrained ML tree was sig-niWcantly less likely than the unconstrained ML tree.
2.3.3. Subset haplotypes (COI and 16S)To further assess interspeciWc relationships we evalu-
ated relationships among a subset of individuals fromthe COI data and the corresponding 16S haplotypesusing both MP and ML searches. Gaps were treated asmissing data. We used PAUP* to search for MP and MLtrees for each gene separately. We conducted heuristicsearches as was done for all COI haplotypes and usedthe same search settings for parsimony bootstrap analy-ses with 1000 pseudo replications.
We evaluated congruence of COI and 16S data parti-tions in the context of parsimony with the incongruencelength diVerence (ILD) test (Farris et al., 1994) carriedout in PAUP* with 100 replicates. Before beginning thepermutations of the two data partitions we excludedinvariant characters as suggested by Cunningham(1997). The results of the ILD test indicated that the COIand 16S data sets were homogeneous (P D 0.81), thus, wecombined the two data sets. We searched for MP andML trees for the combined data using the same settingsdescribed above.
2.3.5. BayesianThe ML searches conducted for the 16S + COI data
were based on a model of evolution calculated for thetwo genes combined. However, such a model of evolu-tion may not adequately describe the diVerences inevolution between the two genes. Thus, we employed aBayesian framework to explore the likelihood space ofthe two genes combined. We used MRBAYES v3.0(Huelsenbeck and Ronquist, 2001), which is the onlycurrently available phylogenetic software program
48 N.A. Ayoub et al. / Molecular Phylogenetics and Evolution 36 (2005) 42–57
that will allow diVerent likelihood models to beapplied to diVerent data partitions within the sameanalysis.
We searched for trees using three progressively morecomplex models of evolution. In the Wrst, we did not par-tition the data and used the model of evolution calcu-lated by MODELTEST for 16S and COI combined (nopartition). In the second, we partitioned the data intotwo sets, COI and 16S (partition by gene). And in thethird we partitioned the data into Wve sets, by codonposition (1st, 2nd, and 3rd) for COI and by paired(stems) versus unpaired (loops) characters for 16S (5-way partition). For the latter two analyses we input themodel of evolution calculated by MODELTEST foreach data partition. We allowed MRBAYES to calculateoptimal parameter values (the rate of change betweenbases, the proportion of invariant sites, and the gammashape parameter) for each tree generated during thesampling procedure.
For each of the three models we ran multiple indepen-dent Bayesian analyses each starting from a diVerentrandom tree as suggested by Huelsenbeck et al. (2002).To adequately search all of the likelihood space, weemployed a Metropolis-coupled, Markov chain, MonteCarlo algorithm with four diVerently heated chains,using the default settings in MRBAYES. For the no par-
tition and partition by gene analyses we ran three inde-pendent searches for 10-million generations (every 500thtree saved). We found that likelihood scores reached aplateau by 1000 generations. However, initial Bayesiananalyses run for 1-million generations produced variableposterior probabilities among independent runs forsome nodes, indicating that the sampling method hadnot yet reached stationarity (although topology was thesame among all runs). Thus, we discarded the Wrst 10%(1-million generations) of trees from each run as “burn-in” to ensure that we were sampling from a valid poster-ior distribution.
The Bayesian analysis with Wve data partitions con-sisted of three independent searches for 1-million gener-ations (every 100th tree saved). Likelihood scoresreached a plateau by 1000 generations, but we discardedthe Wrst 10% (100,000 generations) of trees as “burn-in.”The posterior probabilities for each of the three runswere similar, indicating that the MCMC procedure hadreached stationarity. However, to make sure that a muchlonger sampling time did not change the topology orposterior probabilities we ran two more independentsearches for 10-million generations. These runs wereidentical in topology and gave similar posterior proba-bilities to the runs that lasted 1-million generations. Foreach partition type, we computed the 50% majority rule
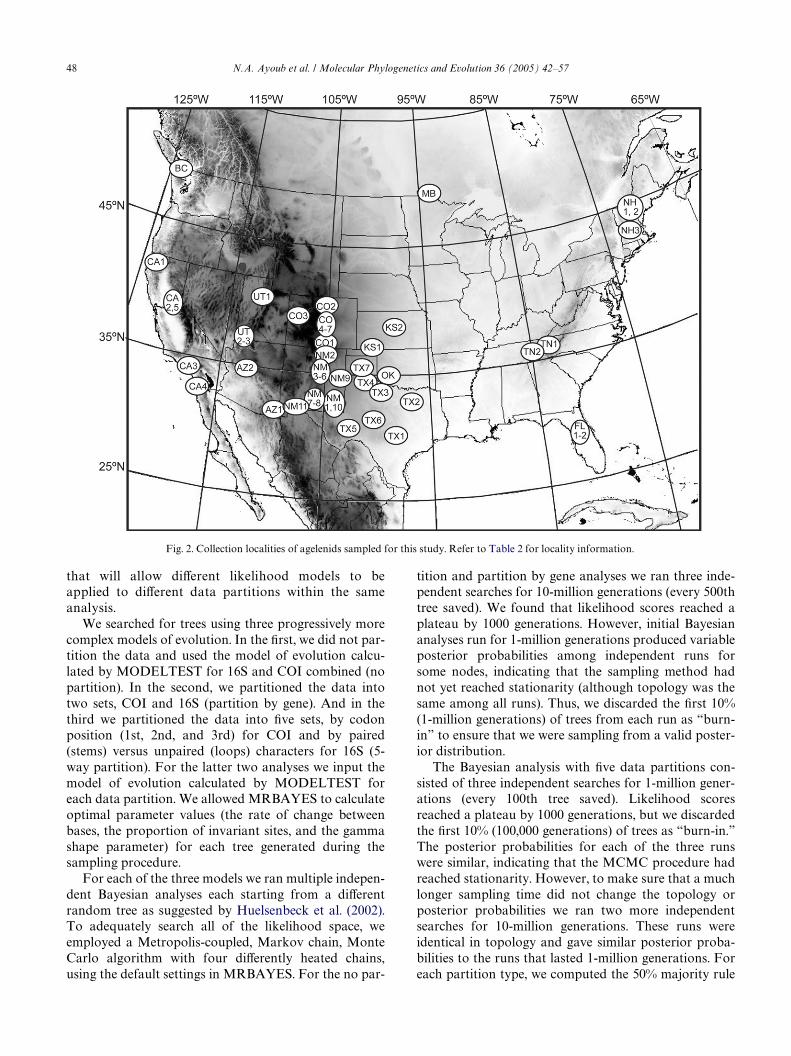
Fig. 2. Collection localities of agelenids sampled for this study. Refer to Table 2 for locality information.
N.A. Ayoub et al. / Molecular Phylogenetics and Evolution 36 (2005) 42–57 49
consensus tree for each run using PAUP* to give us theposterior probabilities for each node and consideredposterior probabilities of 95% or greater to be signiW-
cantly resolved.Adding complexity by partitioning the data as
described above may increase the realism of the modelbut may not signiWcantly improve the phylogeneticresults over a simpler model. Currently, however, MOD-ELTEST cannot evaluate improvements in a model thatincreases complexity by partitioning the data. Thus, weused an approach similar to Castoe et al. (2004) to deter-mine if our partitioned models improved the likelihoodand posterior probabilities of trees. In addition to com-paring post-burn-in likelihood scores, we examined theplots of generation versus likelihood scores to see whichmodel had the fastest rate of convergence. We tested ifincreased complexity oVered signiWcant improvements inposterior probabilities using the Wilcoxon sign-ranktest.
3. Results
3.1. Sequence characteristics
3.1.1. COIWe obtained 635 bp of COI sequence data for 177
Agelenopsis individuals (including 95 of 474 A. apertaindividuals from Ayoub and Riechert, 2004), six Barron-opsis individuals, and one each Hololena and Novalenaindividuals. This sequencing resulted in 47 unique COIhaplotypes in Agelenopsis (including 8 of 51 A. apertahaplotypes from Ayoub and Riechert, 2004) and fourhaplotypes in Barronopsis. Among all agelenid haplo-types there were 192 variable characters of which 139were parsimony informative. Among the Agelenopsishaplotypes 153 characters were variable of which 111were parsimony informative. Third codon positionsaccounted for most of the variation in COI sequenceswith 90% of variable sites among Agelenopsis sequenceslocated at third positions, 9% at Wrst positions, and 1%
at second positions. No indels or premature stop codonswere observed.
3.1.2. 16SWe obtained 446 aligned bp (434–438 bp for individual
sequences) of 16S sequence data for the 27 Agelenopsis,two Barronopsis, and one each Hololena and Novalenaindividuals sequenced. Gaps required for sequence align-ment were never more than two bases long and alignmentwas unambiguous. Our proposed secondary structureconforms well to other proposed spider 16S secondarystructures (Hedin and Maddison, 2001b; Masta, 2000b;Smith and Bond, 2003) and to Drosophila yakuba (Gutelland Fox, 1988) secondary structure. Like other spiders, ahyper-variable region is located between positions 216and 280 of our aligned gene sequences and approximately40% of the total number of parsimony informative char-acters is concentrated in this 65 bp region. Among allagelenids sequenced, 86 sites were variable, of which 61were parsimony informative. Within Agelenopsis, only 51sites were variable and 33 parsimony informative. Split-ting 16S into paired (i.e., stems) and unpaired (i.e., loops)sites, unpaired sites accounted for 80% of the variable siteswithin Agelenopsis.
3.2. Phylogenetic analyses
3.2.1. COIThe results of the likelihood ratio test as carried out
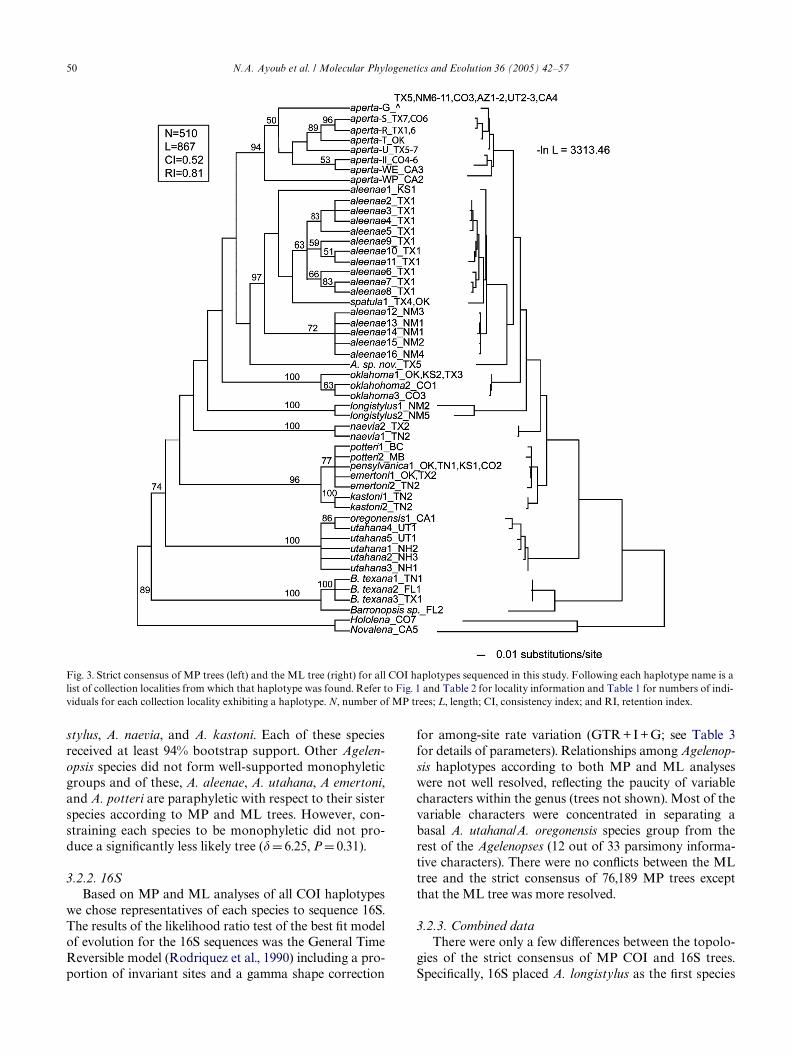
in MODELTEST chose the best Wt model of evolutionfor COI sequences to be that of Tamura and Nei (1993)including a proportion of invariant sites and a gammashape correction for among-site rate variation(TrN + I + G; see Table 3 for details of parameters). Thestrict consensus of 867 MP trees was similar in topologyto the ML tree, with the only diVerences being in rela-tionships among A. aperta haplotypes (Fig. 3). Mono-phyly of Agelenopsis and Barronopsis received 74 and100% parsimony bootstrap support, respectively. Thefollowing species’ haplotypes formed well-supportedmonophyletic groups: A. aperta, A. oklahoma, A. longi-
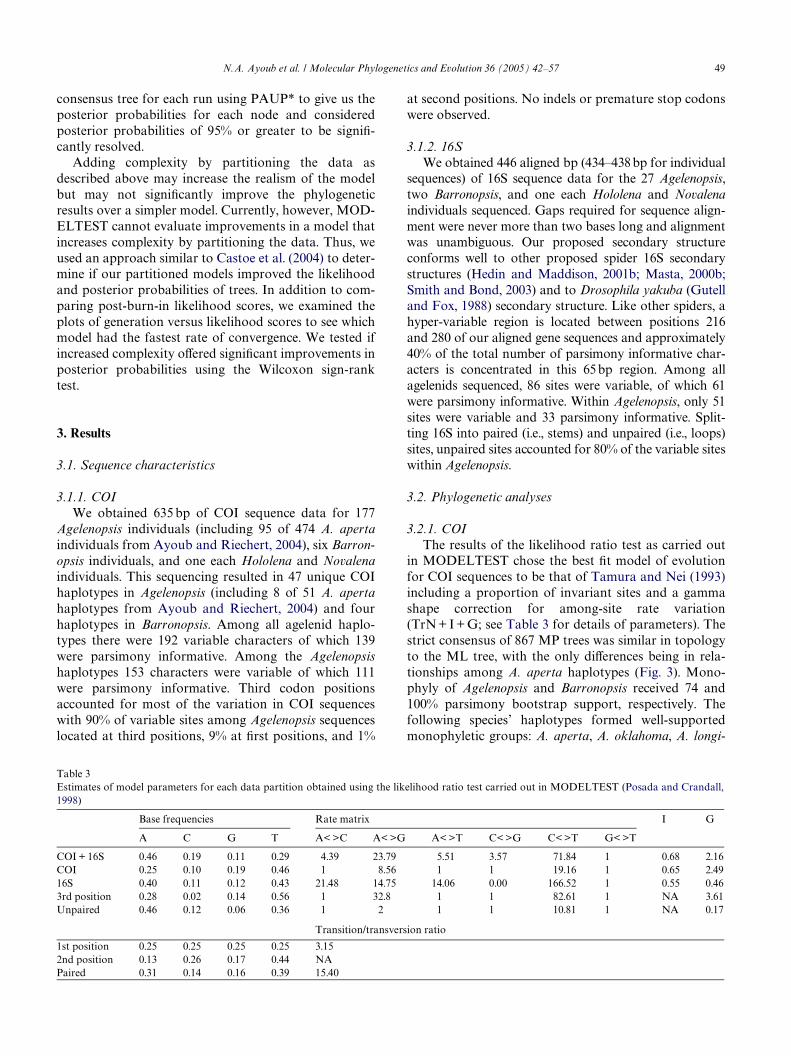
Table 3Estimates of model parameters for each data partition obtained using the likelihood ratio test carried out in MODELTEST (Posada and Crandall,1998)
Base frequencies Rate matrix I G
A C G T A< >C A< >G A< >T C< >G C< >T G< >T
COI + 16S 0.46 0.19 0.11 0.29 4.39 23.79 5.51 3.57 71.84 1 0.68 2.16COI 0.25 0.10 0.19 0.46 1 8.56 1 1 19.16 1 0.65 2.4916S 0.40 0.11 0.12 0.43 21.48 14.75 14.06 0.00 166.52 1 0.55 0.463rd position 0.28 0.02 0.14 0.56 1 32.8 1 1 82.61 1 NA 3.61Unpaired 0.46 0.12 0.06 0.36 1 2 1 1 10.81 1 NA 0.17
Transition/transversion ratio
1st position 0.25 0.25 0.25 0.25 3.152nd position 0.13 0.26 0.17 0.44 NAPaired 0.31 0.14 0.16 0.39 15.40
50 N.A. Ayoub et al. / Molecular Phylogenetics and Evolution 36 (2005) 42–57
stylus, A. naevia, and A. kastoni. Each of these speciesreceived at least 94% bootstrap support. Other Agelen-opsis species did not form well-supported monophyleticgroups and of these, A. aleenae, A. utahana, A emertoni,and A. potteri are paraphyletic with respect to their sisterspecies according to MP and ML trees. However, con-straining each species to be monophyletic did not pro-duce a signiWcantly less likely tree (� D 6.25, P D 0.31).
3.2.2. 16SBased on MP and ML analyses of all COI haplotypes
we chose representatives of each species to sequence 16S.The results of the likelihood ratio test of the best Wt modelof evolution for the 16S sequences was the General TimeReversible model (Rodriquez et al., 1990) including a pro-portion of invariant sites and a gamma shape correction
for among-site rate variation (GTR +I +G; see Table 3for details of parameters). Relationships among Agelenop-sis haplotypes according to both MP and ML analyseswere not well resolved, reXecting the paucity of variablecharacters within the genus (trees not shown). Most of thevariable characters were concentrated in separating abasal A. utahana/A. oregonensis species group from therest of the Agelenopses (12 out of 33 parsimony informa-tive characters). There were no conXicts between the MLtree and the strict consensus of 76,189 MP trees exceptthat the ML tree was more resolved.
3.2.3. Combined dataThere were only a few diVerences between the topolo-
gies of the strict consensus of MP COI and 16S trees.SpeciWcally, 16S placed A. longistylus as the Wrst species
Fig. 3. Strict consensus of MP trees (left) and the ML tree (right) for all COI haplotypes sequenced in this study. Following each haplotype name is alist of collection localities from which that haplotype was found. Refer to Fig. 1 and Table 2 for locality information and Table 1 for numbers of indi-viduals for each collection locality exhibiting a haplotype. N, number of MP trees; L, length; CI, consistency index; and RI, retention index.
N.A. Ayoub et al. / Molecular Phylogenetics and Evolution 36 (2005) 42–57 51
to branch oV after the basal A. utahana/A. oregonesisgroup followed by A. oklahoma. In contrast, the COItree placed A. longistylus sister to an A. oklahoma/A.spatula/A. aleenae/A. aperta/A. sp. nov. group. However,these diVerences were not supported by greater than 50%parsimony bootstrap support for either gene. The onlyother diVerence was that COI indicated paraphyly of A.utahana with respect to A. oregonensis and the 16S dataindicated monophyly of A. utahana.
The combined COI plus 16S parsimony analysis pro-duced 60 MP trees of 627 steps. The strict consensus ofthese trees had a similar topology to the COI tree alonebut with greater bootstrap support for some nodes (treenot shown; bootstrap values in Table 4). SpeciWcally,support for monophyly of Agelenopsis plus Barronopsisincreased from 89 to 100%; monophyly of Agelenopsisincreased from 74 to 100%; monophyly of all Agelenop-ses excluding A. utahana and A. oregonensis increasedfrom <50 to 85%; and monophyly of A. aperta, A. spat-ula, A. aleenae plus A. sp. nov. increased from <50 to55%.
The major diVerences between the MP trees from thecombined analysis versus the COI data alone were in theplacement of A. longistylus and A. naevia but theseplacements were not well-supported by either analysis.Thus, neither gene provided a clear assignment of these
two species. Additionally, the COI data indicated para-phyly of A. utahana while the combined data indicatedmonophyly of A. utahana.
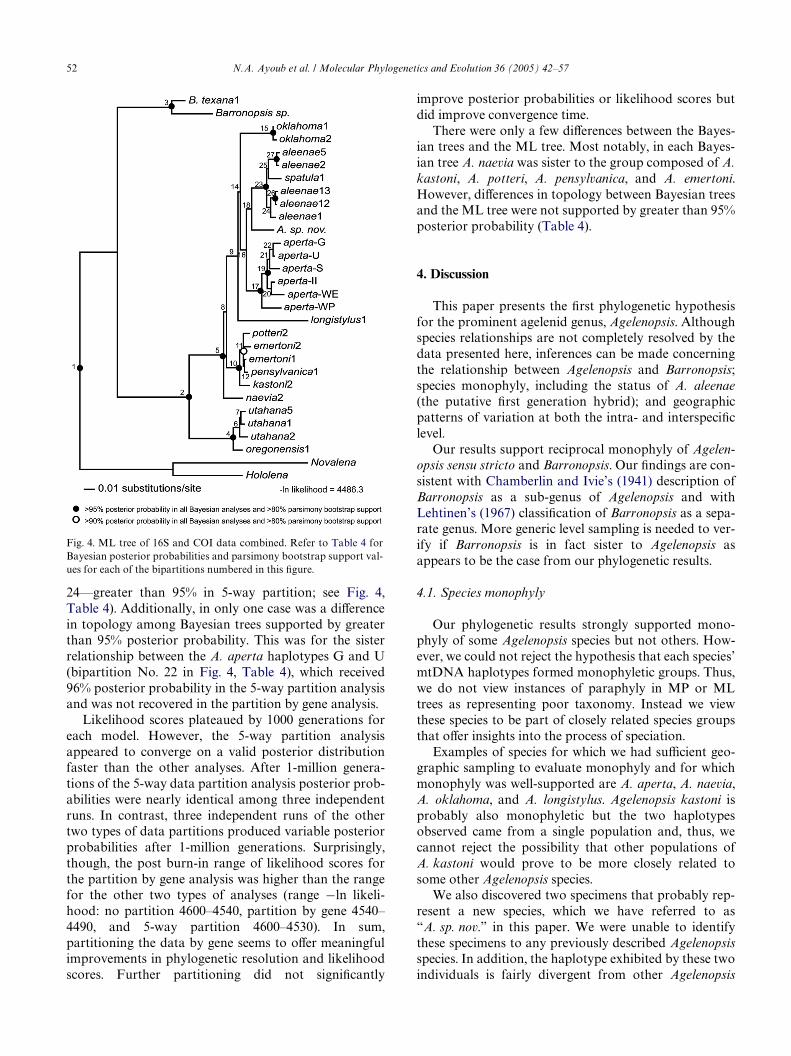
The ML tree of the combined data (Fig. 4) was similarto the strict consensus of MP trees. The main diVerencewas that the ML tree placed A. naevia as basal to allAgelenopses except A. uahana and A. oregonensis whilethe MP trees placed A. naevia sister to the group com-posed of A. kastoni, A. potteri, A. pensylvanica, andA. emertoni.
3.2.4. BayesianThe Bayesian trees resulting from the three types of
data partitions diVered slightly in topology, and poster-ior probabilities tended to increase with increasing com-plexity of the model (Table 4). The increased complexityoVered nearly signiWcant improvements in posteriorprobability (no partition—partition by gene: z D 1.6,P D 0.054; partition by gene—5-way partition: z D 1.46,P D 0.072). However, these diVerences were mostly fornodes that did not receive 95% or greater posteriorprobability in any analysis. Only four nodes improvedfrom less than 95% to greater than 95% posterior proba-bility when increasing complexity from the no partitionmodel to one of the partitioned models (bipartition #s 6,11—greater than 95% in both partition types; and #s 22,
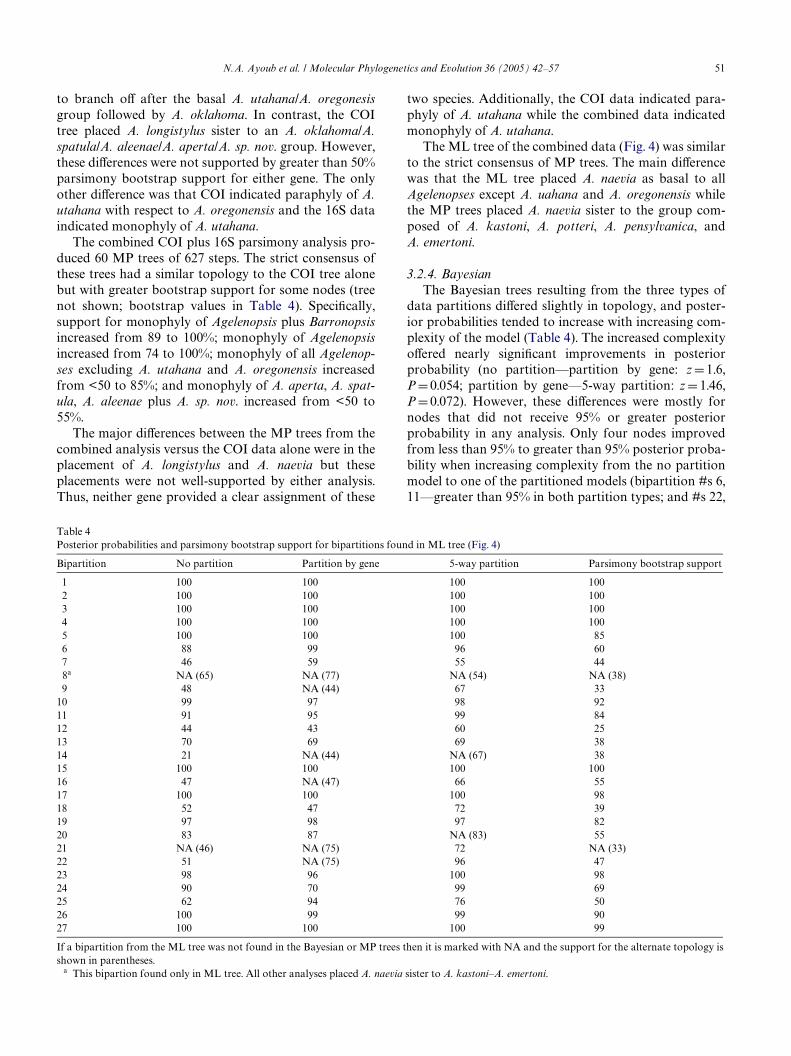
Table 4Posterior probabilities and parsimony bootstrap support for bipartitions found in ML tree (Fig. 4)
If a bipartition from the ML tree was not found in the Bayesian or MP trees then it is marked with NA and the support for the alternate topology isshown in parentheses.
a This bipartion found only in ML tree. All other analyses placed A. naevia sister to A. kastoni–A. emertoni.
Bipartition No partition Partition by gene 5-way partition Parsimony bootstrap support
1 100 100 100 1002 100 100 100 1003 100 100 100 1004 100 100 100 1005 100 100 100 856 88 99 96 607 46 59 55 448a NA (65) NA (77) NA (54) NA (38)9 48 NA (44) 67 33
10 99 97 98 9211 91 95 99 8412 44 43 60 2513 70 69 69 3814 21 NA (44) NA (67) 3815 100 100 100 10016 47 NA (47) 66 5517 100 100 100 9818 52 47 72 3919 97 98 97 8220 83 87 NA (83) 5521 NA (46) NA (75) 72 NA (33)22 51 NA (75) 96 4723 98 96 100 9824 90 70 99 6925 62 94 76 5026 100 99 99 9027 100 100 100 99
52 N.A. Ayoub et al. / Molecular Phylogenetics and Evolution 36 (2005) 42–57
24—greater than 95% in 5-way partition; see Fig. 4,Table 4). Additionally, in only one case was a diVerencein topology among Bayesian trees supported by greaterthan 95% posterior probability. This was for the sisterrelationship between the A. aperta haplotypes G and U(bipartition No. 22 in Fig. 4, Table 4), which received96% posterior probability in the 5-way partition analysisand was not recovered in the partition by gene analysis.
Likelihood scores plateaued by 1000 generations foreach model. However, the 5-way partition analysisappeared to converge on a valid posterior distributionfaster than the other analyses. After 1-million genera-tions of the 5-way data partition analysis posterior prob-abilities were nearly identical among three independentruns. In contrast, three independent runs of the othertwo types of data partitions produced variable posteriorprobabilities after 1-million generations. Surprisingly,though, the post burn-in range of likelihood scores forthe partition by gene analysis was higher than the rangefor the other two types of analyses (range ¡ln likeli-hood: no partition 4600–4540, partition by gene 4540–4490, and 5-way partition 4600–4530). In sum,partitioning the data by gene seems to oVer meaningfulimprovements in phylogenetic resolution and likelihoodscores. Further partitioning did not signiWcantly
Fig. 4. ML tree of 16S and COI data combined. Refer to Table 4 forBayesian posterior probabilities and parsimony bootstrap support val-ues for each of the bipartitions numbered in this Wgure.
improve posterior probabilities or likelihood scores butdid improve convergence time.
There were only a few diVerences between the Bayes-ian trees and the ML tree. Most notably, in each Bayes-ian tree A. naevia was sister to the group composed of A.kastoni, A. potteri, A. pensylvanica, and A. emertoni.However, diVerences in topology between Bayesian treesand the ML tree were not supported by greater than 95%posterior probability (Table 4).
4. Discussion
This paper presents the Wrst phylogenetic hypothesisfor the prominent agelenid genus, Agelenopsis. Althoughspecies relationships are not completely resolved by thedata presented here, inferences can be made concerningthe relationship between Agelenopsis and Barronopsis;species monophyly, including the status of A. aleenae(the putative Wrst generation hybrid); and geographicpatterns of variation at both the intra- and interspeciWclevel.
Our results support reciprocal monophyly of Agelen-opsis sensu stricto and Barronopsis. Our Wndings are con-sistent with Chamberlin and Ivie’s (1941) description ofBarronopsis as a sub-genus of Agelenopsis and withLehtinen’s (1967) classiWcation of Barronopsis as a sepa-rate genus. More generic level sampling is needed to ver-ify if Barronopsis is in fact sister to Agelenopsis asappears to be the case from our phylogenetic results.
4.1. Species monophyly
Our phylogenetic results strongly supported mono-phyly of some Agelenopsis species but not others. How-ever, we could not reject the hypothesis that each species’mtDNA haplotypes formed monophyletic groups. Thus,we do not view instances of paraphyly in MP or MLtrees as representing poor taxonomy. Instead we viewthese species to be part of closely related species groupsthat oVer insights into the process of speciation.
Examples of species for which we had suYcient geo-graphic sampling to evaluate monophyly and for whichmonophyly was well-supported are A. aperta, A. naevia,A. oklahoma, and A. longistylus. Agelenopsis kastoni isprobably also monophyletic but the two haplotypesobserved came from a single population and, thus, wecannot reject the possibility that other populations ofA. kastoni would prove to be more closely related tosome other Agelenopsis species.
We also discovered two specimens that probably rep-resent a new species, which we have referred to as“A. sp. nov.” in this paper. We were unable to identifythese specimens to any previously described Agelenopsisspecies. In addition, the haplotype exhibited by these twoindividuals is fairly divergent from other Agelenopsis
N.A. Ayoub et al. / Molecular Phylogenetics and Evolution 36 (2005) 42–57 53
species (approximately 5% uncorrected COI + 16Ssequence divergence between A. sp. nov. and the mostsimilar species, A. aleenae).
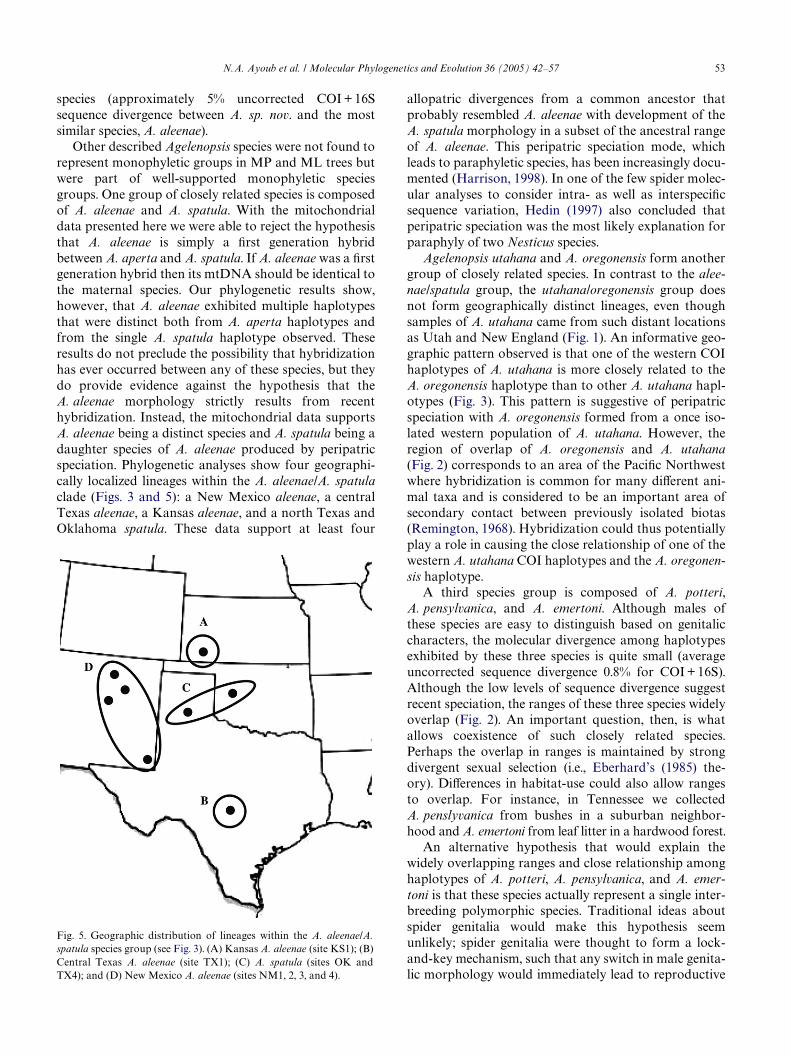
Other described Agelenopsis species were not found torepresent monophyletic groups in MP and ML trees butwere part of well-supported monophyletic speciesgroups. One group of closely related species is composedof A. aleenae and A. spatula. With the mitochondrialdata presented here we were able to reject the hypothesisthat A. aleenae is simply a Wrst generation hybridbetween A. aperta and A. spatula. If A. aleenae was a Wrstgeneration hybrid then its mtDNA should be identical tothe maternal species. Our phylogenetic results show,however, that A. aleenae exhibited multiple haplotypesthat were distinct both from A. aperta haplotypes andfrom the single A. spatula haplotype observed. Theseresults do not preclude the possibility that hybridizationhas ever occurred between any of these species, but theydo provide evidence against the hypothesis that theA. aleenae morphology strictly results from recenthybridization. Instead, the mitochondrial data supportsA. aleenae being a distinct species and A. spatula being adaughter species of A. aleenae produced by peripatricspeciation. Phylogenetic analyses show four geographi-cally localized lineages within the A. aleenae/A. spatulaclade (Figs. 3 and 5): a New Mexico aleenae, a centralTexas aleenae, a Kansas aleenae, and a north Texas andOklahoma spatula. These data support at least four
Fig. 5. Geographic distribution of lineages within the A. aleenae/A.spatula species group (see Fig. 3). (A) Kansas A. aleenae (site KS1); (B)Central Texas A. aleenae (site TX1); (C) A. spatula (sites OK andTX4); and (D) New Mexico A. aleenae (sites NM1, 2, 3, and 4).
allopatric divergences from a common ancestor thatprobably resembled A. aleenae with development of theA. spatula morphology in a subset of the ancestral rangeof A. aleenae. This peripatric speciation mode, whichleads to paraphyletic species, has been increasingly docu-mented (Harrison, 1998). In one of the few spider molec-ular analyses to consider intra- as well as interspeciWcsequence variation, Hedin (1997) also concluded thatperipatric speciation was the most likely explanation forparaphyly of two Nesticus species.
Agelenopsis utahana and A. oregonensis form anothergroup of closely related species. In contrast to the alee-nae/spatula group, the utahana/oregonensis group doesnot form geographically distinct lineages, even thoughsamples of A. utahana came from such distant locationsas Utah and New England (Fig. 1). An informative geo-graphic pattern observed is that one of the western COIhaplotypes of A. utahana is more closely related to theA. oregonensis haplotype than to other A. utahana hapl-otypes (Fig. 3). This pattern is suggestive of peripatricspeciation with A. oregonensis formed from a once iso-lated western population of A. utahana. However, theregion of overlap of A. oregonensis and A. utahana(Fig. 2) corresponds to an area of the PaciWc Northwestwhere hybridization is common for many diVerent ani-mal taxa and is considered to be an important area ofsecondary contact between previously isolated biotas(Remington, 1968). Hybridization could thus potentiallyplay a role in causing the close relationship of one of thewestern A. utahana COI haplotypes and the A. oregonen-sis haplotype.
A third species group is composed of A. potteri,A. pensylvanica, and A. emertoni. Although males ofthese species are easy to distinguish based on genitaliccharacters, the molecular divergence among haplotypesexhibited by these three species is quite small (averageuncorrected sequence divergence 0.8% for COI + 16S).Although the low levels of sequence divergence suggestrecent speciation, the ranges of these three species widelyoverlap (Fig. 2). An important question, then, is whatallows coexistence of such closely related species.Perhaps the overlap in ranges is maintained by strongdivergent sexual selection (i.e., Eberhard’s (1985) the-ory). DiVerences in habitat-use could also allow rangesto overlap. For instance, in Tennessee we collectedA. penslyvanica from bushes in a suburban neighbor-hood and A. emertoni from leaf litter in a hardwood forest.
An alternative hypothesis that would explain thewidely overlapping ranges and close relationship amonghaplotypes of A. potteri, A. pensylvanica, and A. emer-toni is that these species actually represent a single inter-breeding polymorphic species. Traditional ideas aboutspider genitalia would make this hypothesis seemunlikely; spider genitalia were thought to form a lock-and-key mechanism, such that any switch in male genita-lic morphology would immediately lead to reproductive
54 N.A. Ayoub et al. / Molecular Phylogenetics and Evolution 36 (2005) 42–57
isolation (Eberhard, 1985). However, the lock-and-keymechanism is apparently not important for Agelenopsis;according to Gerring (1953) any male structure canmechanically inseminate any female structure. Eventhough the lock-and-key hypothesis is becoming morecommonly disputed (see Eberhard, 1985; Eberhard et al.,1998), most spider taxonomists still consider genitalia tobe monomorphic within species and Eberhard et al.(1998) found little variation in genitalic characterswithin six spider species. We are aware of only two docu-mented cases of polymorphic spider genitalia (Huberand González, 2001; Kaston, 1970) and a few cases ofpolymorphic insect genitalia (Hausmann, 1999; Kunze,1959; Mound et al., 1998; Ulrich, 1988). Thus, it seemsunlikely that a polymorphism in spider genitalia couldbe maintained over the entirety of the combined rangesof A. potteri, A. pensylvanica, and A. emertoni. Regard-less, detailed experiments on the biology and ecology ofthis species group are needed to determine what factorslead to morphological diVerentiation with little associ-ated mitochondrial diVerentiation. We are currentlyengaged in pheromone and courtship analyses to helpelucidate this issue.
4.2. Geographic patterns of variation
We found geographic variation in levels of inter- andintraspeciWc sequence divergence. In particular, a cladeof species with very low interspeciWc divergence,A. kastoni, A. emertoni, A. pensylvancia, and A. potteri,was found in eastern North America. In contrast, west-ern species such as A. longistylus, A. aperta, A. aleenae,A. spatula, and A. oklahoma displayed much higher lev-els of interspeciWc sequence divergence (Figs. 3 and 4).This pattern contrasts with patterns found in otherNorth American animal genera. For instance, molecularphylogenetic data for Cincindela beetles (Vogler et al.,1998) and Enallagma damselXies (McPeek and Brown,2000) both show evidence for low sequence divergencewithin clades found in western North America. Thesestudies indicate recent speciation events in westernNorth America consistent with Cracraft’s (1985) litho-spheric complexity hypothesis. According to thishypothesis, geographic regions that are undergoingtopographic change, such as mountain building in west-ern North America, will cause geographic separationamong populations and promote speciation. Our Wnd-ings, on the other hand, are not consistent with the litho-spheric complexity hypothesis, suggesting thatgeographic isolation alone cannot explain speciationrates within Agelenopsis. Instead, as discussed above,sexual selection or habitat diVerentiation may play amore important role in promoting the apparent recentspeciation of some of the eastern species.
Geographic variation in levels of sequence divergenceappears to extend below the species boundary. For
instance, the western species A. longistylus exhibitsalmost 9% uncorrected COI sequence divergencebetween populations found only 152 km apart, whereasthe eastern species, A. naevia, exhibits 0.2% COIsequence divergence between populations found1230 km apart and A. pensylvanica shows no sequencevariation across 1895 km. Other species exhibiting fairlydeep molecular divergence and geographic structuringare the southwestern species, A. aperta and A. aleenae,with maximum levels of COI sequence divergence of 6.3and 3.4%, respectively. The only other species toapproach this level of intraspeciWc divergence isA. utahana with maximum COI sequence divergence of2.5% among haplotypes found 3300 km apart. WhyintraspeciWc divergence would be higher in species foundin southwestern United States is not immediately clear.However, Ayoub and Riechert (2004) concluded thatprimary geographic structuring of A. aperta haplotypescorresponded to splits along mountain ranges. In thecase of Agelenopsis, then, the topographic complexity ofthe southwestern United States seems to have causedpopulation level diVerentiation rather than speciation aspredicted by Cracraft’s (1985) lithospheric complexityhypothesis.
The very low level of divergence exhibited by haplo-types found 1000–4000 km apart suggests that recentrange expansions may be common for many Agelenopsisspecies. For instance, A. utahana is found throughoutnorthern United States, Canada, and even Alaska. Mostof this area was under ice sheets during the last glacialmaximum, which means that A. utahana must have dis-persed across most of its range over the last 10,000 years.Even within A. aperta, which shows high sequence diver-gence overall, the haplotype “G” is Wxed throughout alarge portion of A. aperta’s range (see Figs. 1 and 3 fordistribution of “G”). Ayoub and Riechert (2004) con-cluded that the widespread Wxation of “G” was bestexplained by recent range expansion. Recent rangeexpansions are consistent with Noonan’s (1988, 1990)prediction that many modern insect ranges are the resultof post-Pleistocene range expansions.
Additionally, the widespread geographic distributionof single haplotypes indicates that Agelenopsis specieshave better dispersal abilities than predicted by their dis-persal mode (ground dispersing rather than aerial dis-persing). Phylogeographic studies of other non-aerialdispersing spider species have found deep moleculardivergence and population monophyly on fairly smallgeographic scales [i.e., Nesitcus species (Hedin, 1997);Habronattus pugilis (Masta, 2000a); Apostichus simus(Bond et al., 2001); Hypochilus species (Hedin, 2001);and Hypochilus thorelli (Hedin and Wood, 2002)], con-sistent with limited dispersal abilities. Our results forA. aperta, A. aleenae, and A. longistylus are similar tothese studies in that they show geographic structure andfairly high levels of intraspeciWc molecular divergence,
N.A. Ayoub et al. / Molecular Phylogenetics and Evolution 36 (2005) 42–57 55
but other Agelenopsis species do not. Complete genericlevel sampling of each of the study systems mentionedmight reveal a similar pattern with some species havingstrong geographic structure and others not. However,the two studies that did include most species within agenus found similar patterns of strong geographic struc-ture for most species (Hedin, 1997, 2001). At themoment, there is only one phylogeographic study of anaerial dispersing species, Stegodyphus dumicola, whichshowed mtDNA haplotypes found in multiple sites150 km apart (Johannesen et al., 2002). Although thegeographic scope of this study was limited, the wide-spread distribution of many diVerent haplotypes proba-bly reXects the better dispersal ability of these spiderscompared to ground dispersing spiders.
Unequal mutation rates among species could alsocontribute to the diVering levels of observed geographicstructure. For instance, A. longistylus appears to form avery long branch (see Fig. 3). Possibly a higher mutationrate in A. aperta, A. aleenae and A. longistylus allows fora stronger signature of geographic structure to bedetected within these species. However, we feel that avariable mutation rate is not suYcient to negate theoverall pattern of geographic variation in geneticrelatedness.
4.3. Higher level relationships
Aside from the well-supported species groups, rela-tionships among Agelenopsis species are not completelyresolved by the data presented here. However, a few rela-tionships are worth discussing. First, the A. oregonensis/A. utahana clade is sister to the remainder of Agelenopsisspecies. A well-supported sister relationship also occursbetween A. kastoni and the A. pensylvanica/A. emertoni/A. potteri species group. All analyses consistently placedA. sp. nov. sister to the A. aleenae/A. spatula group eventhough this relationship is never supported by greaterthan 50% bootstrap probability. Similarly, A. aperta isconsistently sister to the A. aleenae/A. spatula/A. sp. nov.group but this relationship only receives greater than50% bootstrap support in the combined MP analysis.Among the remainder of the Agelenopsis species, thepositions of A. longistylus, A. naevia, and A. oklahomaare ambiguous.
Although the relationships noted above amongA. aperta, A. aleenae, A. spatula, and A. sp. nov. haplo-types are not well-supported by mtDNA, the male geni-talia have similarities that support monophyly of thisgroup. As we mentioned in the introduction, A. aleenaehas intermediate genitalia between A. spatula andA. aperta. The tip of the embolus for A. aleenae is spatu-late, like A. spatula, but also twists, like A. aperta. Simi-larly, A. sp. nov. is intermediate between A. aleenae andA. aperta. The new species has a twisted embolus likeA. aleenae and A. aperta and the tip of the embolus is
broader than A. aperta’s but does not have the distinctspatulate shape of A. aleenae.
5. Conclusions
Approximately half of the Agelenopsis species formwell-supported monophyletic groups, whereas half arepart of well-supported species groups. Rather thanviewing species groups as problematic taxonomy weview them as excellent areas for further research on theprocess of speciation, as they are probably either on thecusp of speciating or have recently speciated. We alsofeel that these groups present an excellent opportunityto better understand the role of genitalic variation anddivergence in the process of speciation. We also foundlower levels of sequence divergence and geographicstructuring than expected for a non-aerial dispersingspider group, suggesting that dispersal ability of thesespiders is better than previously thought, and thatrecent range expansions have played an important rolein modern geographic distributions. Higher levelrelationships were not completely resolved by the datapresented here but represent an important Wrst step indiscerning deep evolutionary relationships withinAgelenopsis.
Acknowledgments
We thank Joseph Spagna for sending leg tissue ofA. oregonensis individuals from northern Californiaand for sending us A. potteri and A. oregonesis speci-mens that had been given to him by R.G. Bennett.Marius PWeVer sent us specimens of A. naevia andA. emertoni from Dallas/Fort Worth, TX. All molecu-lar work was done in the lab of Gary McCracken at theUniversity of Tennessee. Funding for this project camefrom NSF grants to S.E.R., an NSF graduate fellow-ship to N.A.A., and research grants to N.A.A. from theDepartment of Ecology and Evolutionary Biology atthe University of Tennessee. This manuscript wasimproved by the comments of Florencia Campón,Andrew Crawford, Charles Winder, and an anonymousreviewer.
References
Avise, J.C., 1994. Molecular Markers, Natural History and Evolution.Chapman and Hall, New York.
Avise, J.C., 2000. Phylogeography: The History and Formation of Spe-cies. Harvard University Press, Cambridge, MA.
Avise, J.C., Arnold, J., Ball, R.M., Bermingham, E., Lamb, T., Neigel, J.,Reeb, C., Saunders, N., 1987. IntraspeciWc phylogeography: themitochondrial DNA bridge between population genetics and sys-tematics. Annu. Rev. Ecol. Syst. 18, 489–522.
56 N.A. Ayoub et al. / Molecular Phylogenetics and Evolution 36 (2005) 42–57
Ayoub, N.A., Riechert, S.E., 2004. Molecular evidence for Pleistoceneglacial cycles driving diversiWcation of a North American desertspider, Agelenopsis aperta. Mol. Ecol. 13, 3453–3465.
Barraclough, T.G., Nee, S., 2001. Phylogenetics and speciation. TrendsEcol. Evol. 16, 391–399.
Bishop, L., 1990. Meteorological aspects of spider ballooning. Environ.Entomol. 19, 1381–1387.
Bond, J.E., Hedin, M.C., Ramirez, M.G., Opells, B.D., 2001. Deepmolecular divergence in the absence of morphological and ecologi-cal change in the Californian coastal dune endemic trapdoor spiderAptostichus simus. Mol. Ecol. 10, 899–910.
Castoe, T.A., Doan, T.M., Parkinson, C.L., 2004. Data partitions andcomplex models in Bayesian analysis: the Phylogeny of gymnoph-thalmid lizards. Syst. Biol. 53, 448–469.
Chamberlin, R.V., Ivie, W., 1941. North American Agelenidae of thegenera Agelenopsis, Calilena, Ritalena and Tortolena. Ann. Ento-mol. Soc. Am. 34, 585–628.
Cracraft, J., 1985. Biological diversiWcation and its causes. Ann. Mo.Bot. Gdn. 72, 794–822.
Croucher, P.J.P., Oxford, G.S., Searle, J.B., 2004. Mitochondrial diVer-entiation, introgression and phylogeny of species in the Tegenariaatrica group (Araneae: Agelenidae). Biol. J. Linn. Soc. 81, 79–89.
Cunningham, C.W., 1997. Can three incongruence tests predict whendata should be combined?. Mol. Biol. Evol. 14, 733–740.
Eberhard, W.G., 1983. Why are genitalia good species characters. In:Eberhard, W.G., Lubin, Y.D., Robinson, B.C. (Eds.), Proceedings ofthe Ninth International Congress of Arachnology. Panama. Smith-sonian Institution Press, Washington, DC, pp. 53–59.
Eberhard, W.G., 1985. Sexual Selection and Animal Genitalia. Har-vard University Press, Cambridge, MA.
Eberhard, W.G., Huber, B.A., Rodriguez, R.L., Briceno, R.D., Salas, I.,Rodriguez, V., 1998. One size Wts all? Relationships between the sizeand degree of variation in genitalia and other body parts in twentyspecies of insects and spiders. Evolution 52, 415–431.
Farris, J.S., Kallersjo, M., Kluge, A.G., Bult, C., 1994. Testing signiW-cance of incongruence. Cladistics 10, 315–319.
Folmer, O., Black, M., Hoeh, W., Lutz, R., Vrijenhoek, R., 1994. DNAprimers for ampliWcation of mitochondrial cytochrome oxidasesubunit I from diverse metazoan invertebrates. Mol. Mar. Biol. Bio-technol. 3, 294–299.
Garb, J.E., González, A., Gillespie, R.G., 2004. The black widow genusLatrodectus (Araneae: Theridiidae): phylogeny, biogeography, andinvasion history. Mol. Phylogenet. Evol. 31, 1127–1142.
Gerring, R.L., 1953. Structure and function of the genitalia in someAmerican agelenid spiders. Smithsonian Miscellaneous Collections,vol. 121, Smithsonian Institution, Washington, DC, p. 84.
Gillespie, R., 2004. Community assembly through adaptive radiation inHawaiian spiders. Science 303, 356–359.
Gutell, R.R., Fox, G.E., 1988. A compilation of large subunit RNAsequences presented in structural format. Nucleic Acids Res. 16,R175–R313.
Harrison, R.G., 1998. Linking evolutionary pattern and process: therelevance of species concepts for the study of speciation. In: How-ard, D.J., Berlocher, S.H. (Eds.), Endless Forms: Species and Speci-ation. Oxford University Press, New York, pp. 19–31.
Hausmann, A., 1999. FalsiWcation of an entomological rule: polymor-phic genitalia in Geometrid moths. Spixiana 22, 83–90.
Hedin, M.C., 1997. Speciational history in a diverse clade of habitat-specialized spiders (Araneae: Nesticidae: Nesticus): inferences fromgeographic-based sampling. Evolution 51, 1929–1945.
Hedin, M.C., 2001. Molecular insights in species phylogeny, biogeogra-phy, and morphological stasis in the ancient spider genus Hypochi-lus (Araneae: Hypochilidae). Mol. Phylogenet. Evol. 18, 238–251.
Hedin, M.C., Maddison, W.P., 2001a. Phylogenetic utility and evidencefor multiple copies of elongation Factor-1alpha in the spider genusHabronattus (Araneae: Salticidae). Mol. Biol. Evol. 18, 1512–1521.
Hedin, M.C., Maddison, W.P., 2001b. A combined molecular approachto phylogeny of the jumping spider subfamily Dendryphantinae(Araneae: Salticidae). Mol. Phylogenet. Evol. 18, 386–403.
Hedin, M.C., Wood, D.A., 2002. Genealogical exclusivity in geographi-cally proximate populations of Hypochilus thorelli Marx (Araneae,Hypochilidae) on the Cumberland Plateau of North America. Mol.Ecol. 11, 1975–1988.
Higgins, D., Thompson, J., Gibson, T., Thompson, J.D., Higgins, D.G.,Gibson, T.J., 1994. CLUSTAL W: improving the sensitivity of pro-gressive multiple sequence alignment through sequence weighting,position-speciWc gap penalties and weight matrix choice. NucleicAcids Res. 22, 4673–4680.
Huber, K.C., Haider, T.S., Manfred, M.W., Huber, B.A., Schweyen,R.J., Barth, F.G., 1993. DNA sequence data indicates the polyphylyof the family Ctenidae (Araneae). J. Arachnol. 21, 194–201.
Huber, B.A., González, A.P., 2001. Female genital dimorphism in a spi-der (Araneae: Pholcidae). J. Zool. Lond. 255, 301–304.
Huelsenbeck, J., Ronquist, F., 2001. MrBayes: Bayesian inference ofphylogenetic trees. Bioinformatics 17, 754–755.
Huelsenbeck, J., Larget, B., Miller, R., Ronquist, F., 2002. Potentialapplications and pitfalls of Bayesian inference of phylogeny. Syst.Biol. 51, 673–687.
Johannesen, J., Hennig, A., Dommermuth, B., Schneider, J.M., 2002.Mitochondrial DNA distributions indicate colony propagation bysingle matri-lines in the social spider Stegodyphus dumicola (Eresi-dae). Biol. J. Linn. Soc. 76, 591–600.
Kaston, B.J., 1970. Comparative biology of American black widow spi-ders. San Diego Soc. Nat. Hist. Trans. 16, 33–82.
Kunze, L., 1959. Die funktionsanatomischen Grundlagen der Kopula-tion der Zwergkikaden, untersucht en Euscelis plebejus (Fall.) undeinigen Typhlocybinen. Dtsch. Entomol. Z. 6, 322–387.
Lehtinen, P.T., 1967. ClassiWcation of the cribellate spiders and someallied families, with notes on the evolution of the suborder Araneo-morpha. Ann. Zool. Fenn. 4, 199–468.
Masta, S., 2000a. Phylogeography of the jumping spider Habronattuspugillis (Araneae: Salticidae): recent vicariance of sky island popu-lations?. Evolution 54, 1699–1711.
Masta, S., 2000b. Mitochondrial sequence evolution in spiders: intra-speciWc variation in tRNAs lacking the TgammaC arm. Mol. Biol.Evol. 17, 1091–1100.
McPeek, M.A., Brown, J.M., 2000. Building a regional species pool:diversiWcation of the Enallagma damselXies in eastern North Amer-ica. Ecology 81, 904–920.
Morando, M., Avila, L.J., Sites, J.W., 2003. Sampling strategy fordelimiting species: genes, individuals, and populations in the Lio-laemus elongatus-kriegi complex (Squamata: Liolaemidae) inAndean-Patagonian South America. Syst. Biol. 52, 159–185.
Mound, L.A., Crespi, B.J., Tucker, A., 1998. Polymorphism and klepto-parasitism in thrips (Thysanoptera: Phalaeothripidae) from woodygalls on Casuarina trees. Aust. J. Entomol. 37, 8–16.
Noonan, G.R., 1988. Biogeography of North American and Mexicaninsects, and a critique of vicariance biogeography. Syst. Zool. 37,366–384.
Noonan, G.R., 1990. Biogeographical patterns of North AmericanHarpalus Latreille (Insecta: Coleoptera: Carabidae). J. Biogeogr.17, 583–614.
Paison, T., 1997. A biogeographic review of the spider genus Agelenop-sis (Araneae: Agelenidae). Masters Thesis, University of Tennessee,Knoxville, TN.
Piel, W.H., Nutt, K.J., 1997. Kaira is a likely sister group to Metepeira,and Zygiella is an araneid (Araneae: Araneidae): evidence frommitochondrial DNA. J. Arachnol. 25, 262–268.
Piel, W.H., Nutt, K.J., 2000. One species or several? Discordant pat-terns of geographic variation between allozymes and mtDNAsequences among spiders in the genus Metepeira (Araneae: Aranei-dae). Mol. Phylogenet. Evol. 15, 414–418.
N.A. Ayoub et al. / Molecular Phylogenetics and Evolution 36 (2005) 42–57 57
Platnick, N.I., 2005. The world spider catalog, version 5.5. AmericanMuseum of Natural History, online at http://research.amnh.org/entomology/spiders/catalog/index.html.
Posada, D., Crandall, K.A., 1998. MODELTEST: testing the model ofDNA substitution. Bioinformatics 14, 817–818.
Remington, C.L., 1968. Suture-zones of hybrid interaction betweenrecently joined biotas. Evol. Biol. 2, 321–428.
Rodriquez, F., Oliver, J.L., Marin, A., Medina, J.R., 1990. The general sto-chastic model of nucleotide substitution. J. Theor. Biol. 142, 485–501.
Roth, V.D., 1954. Review of the spider subgenus Barronopsis (Arach-nida, Agelenidae). Am. Museum Novitiates 1678, 1–7.
Roth, V.D., Brame, P.L., 1972. Nearctic genera of the spider family Age-lenidae (Arachnida: Araneida). Am. Musuem Novitates 2505, 1–52.
Sambrook, J.E., Fritsch, F., Maniatis, T., 1987. Molecular Cloning: ALaboratory Manual. Cold Spring Harbor, New York.
Shahjahan, R., Hughes, K., Leopold, R., DeVault, J., 1995. Lower incu-bation temperature increases yield of insect genomic DNA isolatedby the CTAB method. Biotechniques 19, 333–334.
Shimodaira, H., Hasegawa, M., 1999. Multiple comparisons of log-like-lihoods with applications to phylogenetic inference. Mol. Biol.Evol. 16, 1114–1116.
Simon, C., Frati, R., Bechenbach, A., Crespi, B., Liu, H., Flook, P.,1994. Evolution, weighting, and phylogenetic utility of mitochon-drial gene-sequences and a compilation of conserved polymerasechain-reaction primers. Ann. Entomol. Soc. Am. 87, 651–701.
Smith, S.D., Bond, J.E., 2003. An analysis of the secondary structure ofthe mitochondrial large subunit rRNA gene (16S) in spiders and its
implications for phylogenetic reconstruction. J. Arachnol. 31, 44–54.
SwoVord, D.L., 2002. PAUP*. Phylogenetic Analysis using Parsimony(* and Other Methods), Version 4. Sinauer Associates, Sunderland,MA.
Tamura, K., Nei, M., 1993. Estimation of the number of nucleotidesubstitutions in the control region of mitochondrial DNA inhumans and chimpanzees. Mol. Biol. Evol. 10, 512–526.
Tan, A.M., Gillespie, R.G., Oxford, G.S., 1999. Paraphyly of the Enop-lognatha group (Araneae, Theridiidae) based on DNA sequences. J.Arachnol. 27, 481–488.
Templeton, A.R., 2001. Using phylogeographic analyses of gene treesto test species status and processes. Mol. Ecol. 10, 779–791.
Ulrich, H., 1988. Das Hypopygium von Microphor holosericus (Mei-gen) (Diptera, Empidoidae). Bonn. Zool. Beitr. 39, 179–219.
Vogler, A.P., Welsh, A., Barraclough, T.G., 1998. Molecular phylogenyof the Cicindela maritima (Coleoptera: Cicindelidae) group indi-cates fast radiation in western North America. Ann. Entomol. Soc.Am. 91, 185–194.
Weyman, G.S., Jepson, G.S., Sunderland, K.D., 1995. Do seasonalchanges in numbers of aerially dispersing spiders reXect populationdensity on the ground or variation in ballooning motivation?. Oec-ologia 101, 487–493.
Zehothofer, K., Sturmbauer, C., 1998. Phylogenetic relationships ofcentral European wolf spiders (Araneae: Lycosidae) inferred from12S ribosomal DNA sequences. Mol. Phylogenet. Evol. 10, 391–398.