Embed Size (px)
Citation preview

TECHNICAL REPORT
Spatial variability of N, P, and K in rice field in
Sawah Sempadan, Malaysia
Saeed Mohamed Eltaib1
, Mohd Soom Mohd Amin2
,
Mohd Musa Hanafi 3
, Abdul Rashid Mohd Shariff 4
, and
Aimrun Wayayok5
AbstractEltaib, S.M., Soom, M.A.M., Hanafi, M.M., Shariff, A.R.M. and Wayayok, A.
Spatial variability of N, P, and K in rice field in Sawah Sempadan, MalaysiaSongklanakarin J Sci Technol., 2002, 24(2) : 321-328
The variability of soil chemical properties such as total N, available P, and exchangeable K were exam-
ined on a 1.2 ha rice (Oryza sativa) field. The soil (n = 72) samples were systematically taken from individual
fields in Sawah Sempadan in thirty-six locations at two depths (0-20 and 20-30 cm). The Differential Global
Positioning System (DGPS) was used for locating the sample position. Geostatistical techniques were used to
analyze the soil chemical properties variability of the samples that assist in site-specific management of the
field. Results showed that areas of similarity were much greater for the soil chemical properties measured at
the depth of (0-20 cm) than that of the second lower (20- 30 cm). The ranges of the semivariogram for total N,
available P, and exchangeable K were 12, and 13 m (0-20 cm), 12 and 38 m (20-30 cm), respectively. Point
kriging calculated from the semivariogram was employed for spatial distribution map. The results suggested
that soil chemical properties measured may be spatially dependent even within the small.
Key words : geostatistics, spatial variability, semivariogram, point kriging, DGPS
1
M.Sc. (Soil Chemistry), Ph.D. Student in Land Information Management, 2
Ph.D. (Soil and Water Engineer-
ing), Assoc. Prof., 3
Ph.D. (Soil Chemistry), Assoc. Prof., Department of Biological and Agricultural Engineer-
ing, Faculty of Engineering, 4
Ph.D. (GIS), 5
M.Sc. (Soil and Water Engineering), Ph.D student in Soil and
Water Engineering, Department of Land Management, Faculty of Agriculture, Universiti Putra Malaysia,
43400 UPM, Serdang, Selangor, Malaysia.
Corresponding e-mail : [email protected]
Received, 24 October 2001 Accepted, 8 January 2002

Spatial variability of N, P and K in rice field
Eltaib, S.M., et al.Songklanakarin J. Sci. Technol.
Vol. 24 No. 2 Apr.-Jun. 2002 322
The understanding of the distribution ofsoil chemical properties particularly total nitrogen(N), available phosphorus (P), and exchangeablepotassium (K) are important for refining farm man-agement practices and for assessing the impact ofagriculture on environment. The variability of soilproperties within fields is often described by aclassical method, which assumes that variation israndomly distributed within mapping units. Soilvariability is the outcome of many processesacting and interacting across a continuum ofspatial and temporal scales and is inherently scaledependent (Parkin, 1993). In addition, soil prop-erties frequently exhibit spatial dependency. Soilproperties tend to be more similar in samples thatare progressively closer to each other. However,this depends on the spatial dependence of the soilproperties. Therefore, parametric statistics are in-adequate for analysis of spatially dependent vari-ables because they assume that measured observ-ations are independent in spite of their distributionin space (Hamlett et al., 1986).
Geostatistics provide a tool for improvingsampling design by utilizing the spatial depend-ence of soil properties within a sampling regionand useful to illustrate spatial inter-relationship ofcollected data and it reduces error, biasness andincreases accuracy of data for Kriging (Myers,1997). Geostatistical analyses have been used toestimate spatial variability of soil physical prop-erties (Viera et al., 1981; Lascano and Hatfield,1992), soil biochemical properties (Bonmati et al.,1991; Sutherland et al., 1991), and soil microbio-logical process (Aiken et al., 1991; Rochette et al.,1991). Values for soil properties are predicted forthe majority of locations in the region where thevalues are not actually measured (Burgess andWebster, 1980). The variability of soil propertieswithin fields is often described by classical sta-tistical methods, which assume that variation israndomly distributed within mapping units. Soilvariability is the outcome of many processesacting and interacting across a continuum of spa-tial and temporal scales and is inherently scale-dependent (Parkin, 1993).
The objective of this study was to describethe field scale spatial variability of total N, avail-able P and exchangeable K in Sawah Sempadanrice field in Sabak Bernam, Selangor, Malaysia.
Materials and Methods
This study was conducted in the SawahSempadan rice plantation area, field No. 2162located on a flat coastal plain in the NorthwestSelangor Agriculture Development (PBLS). It isin the districts of Kuala Selangor and Sabak Bern-am at latitude 3
0 35
" 45 and longitude 101
0 05
" 52.
The size of the field was 1.2 ha with rectangular inshape. The soil texture was clay loam, while thetexture of surface layers ranged from clay loam toclay. The soil is defined as Jawa series and wasclassified as clayey, mixed isohyperthermic sulfictropaquept (USDA, 1975). Rice was cultivatedtwo times per year and different types of fertil-izers added to the soil during the season. The ap-proximate mixture of N, P and K (30 kg of urea,30 kg of CIPR and 20 kg of MOP per ha ) is used toapply during tillering (after 5 days of sowing),30 kg and 40 kg of urea per ha were applied duringpanicle formation 9after about 45 days of sowing)and during grain formation (after 70 days ofsowing). The fertilizer was uniformly broadcastedover the field.
Sampling design
The best soil sampling design to quantifyspatial variability is somewhat difficult to deter-mine because measured variability and samplespacing were dependent on each other. However,the grid sampling was selected for this studybecause grid sampling reduces a large degree ofuncertainty (uneven or clustered appearance). Theplot was subdivided into subplot A and B, and atotal of 18 sampling points were chosen for eachsubplot as shown in Figure 1. The grid size was12.5 m × 22.0 m. Since, the length of the plot is200 m and the width is 60 m. Each sub plot A andB divided into three sub-subplots A1, A2, and A3and B1, B2 and B3.

Songklanakarin J. Sci. Technol.
Vol. 24 No. 2 Apr.-Jun. 2002 323Spatial variability of N, P and K in rice field
Eltaib, S.M., et al.
Soil collection and chemical analysis
The soil samples collected before plantingon March 2001.Thirty-six sampling points weretaken using the DGPS unit. It is employed to pre-cisely locate the sample with an error of ±1m.At each point, the values were recorded by theDGPS and then converted to the x and y coordi-nates. From each sub-subplot such as A1, six pointssoil samples with two depths (0-20 cm and 20-30 cm) taken from each point, the distance on thewidth direction is 12.5 m and in the length direc-tion is 22.0 m. The A composite soil sample wastaken for each location at two depths (0-20 cm and20-30 cm) using a stainless steel soil auger (i.d.=2.5 cm) (SFAUS, 1988). Three soil cores from eachdepth were taken and mixed together to obtain 1sample at each point. The soil samples were packedinto plastic bags, then the soil samples were air-dried and ground to pass through a 2-mm sieve,and analyzed for total N, available P, and ex-changeable K. Total N was determined by thesulfuric-salicylic acid digestion method (Bremnerand Mulvaney, 1982). Exchangeable K was de-termined by the neutral ammonium acetate ex-traction method (Schollenberger and Simon, 1945),which available P was determined by the NH
4F-
HCl extraction method (Bray and Kurtz, 1945).
Geostatistical analysis
A geostatistical analysis of the data wasperformed for determining the spatial structure oftotal N, exchangeable K and available P at thetwo depths separately within the study plot usinggeostatistics software (GS+, Gamma Design Soft-ware, St. Plainwell, MI, version 5.0.3 Beta). TheGS+ has a number of models that can be fitted toestimate semivariogram by using non-linear squareprocedure. The spherical model used in this studywas shown below:
γ (h) = Co + C3| h|2r
− 12
hr
3
for 0 < |h| < r
γ (h) = Co + C for |h| > r (1)
γ (0) = 0 ,
Where γ(h) is the semivariance and Co is
the nugget variance which is defined as the semi-variance at X=0. The maximum semivariancewas defined as the sill (C
o + C) , and r is the range
of spatial correlation (Vauclin et al., 1983). Thenugget to sill ratio was used to qualitatively definespatial dependence values. The values less than25% have strong spatial dependence, the valuesbetween 25% and 75% considered as moderate
Figure 1. The sampling grid of the Sawah Sempadan rice field
Spatial variability of N, P and K in rice field
Eltaib, S.M., et al.Songklanakarin J. Sci. Technol.
Vol. 24 No. 2 Apr.-Jun. 2002 324
spatial dependence, and the values greater than75% have weak spatial dependence. It was se-lected over linear and exponential models based onmore favorable weighted residual mean squares,and visual fit to the data at short lags. The contourmaps were developed using the Surfer software(Golden Software, Inc.; Golden CO).
The kriged or spatial maps for total N avail-able P and exchangeable K were constructed byusing point kriging method to estimate the valuesat unsampled locations and then clustering themin 3-5 ranges with equal contours intervals. Theranges for soil nutrients were five classes accord-ing to DOA (1997).
Results and Discussion
Spatial variability for total Nitrogen, available
P, and exchangeable K
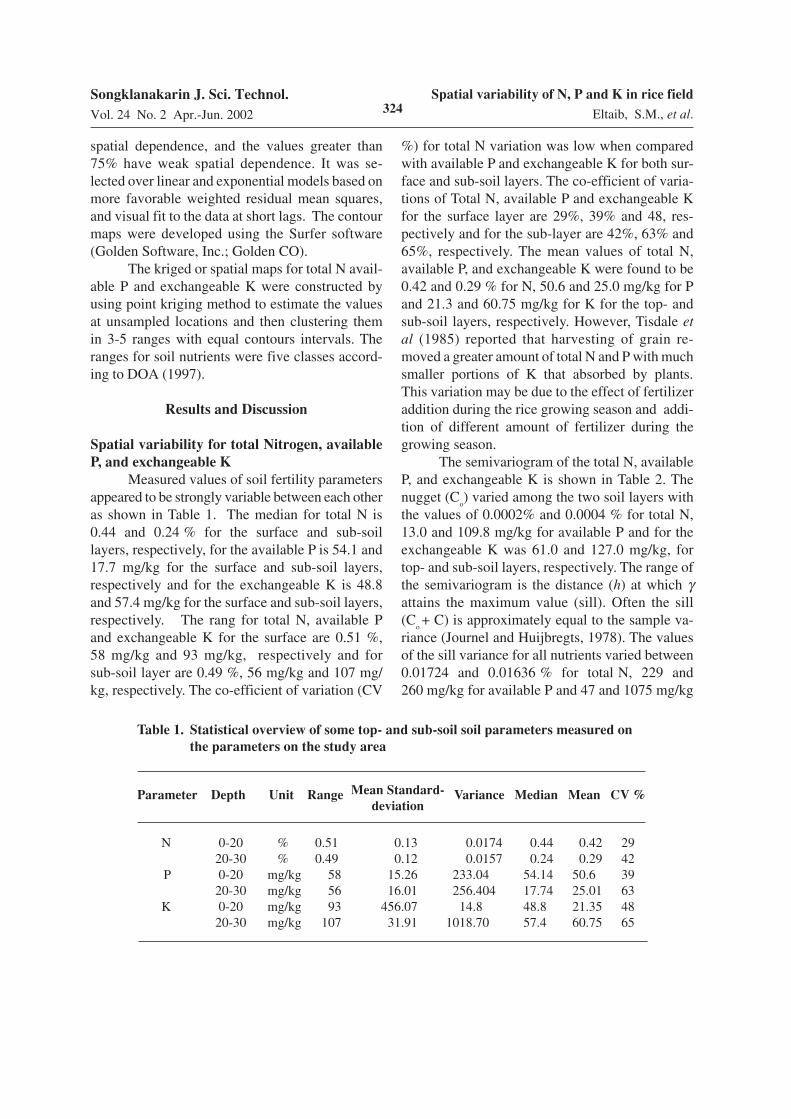
Measured values of soil fertility parametersappeared to be strongly variable between each otheras shown in Table 1. The median for total N is0.44 and 0.24 % for the surface and sub-soillayers, respectively, for the available P is 54.1 and17.7 mg/kg for the surface and sub-soil layers,respectively and for the exchangeable K is 48.8and 57.4 mg/kg for the surface and sub-soil layers,respectively. The rang for total N, available Pand exchangeable K for the surface are 0.51 %,58 mg/kg and 93 mg/kg, respectively and forsub-soil layer are 0.49 %, 56 mg/kg and 107 mg/kg, respectively. The co-efficient of variation (CV
%) for total N variation was low when comparedwith available P and exchangeable K for both sur-face and sub-soil layers. The co-efficient of varia-tions of Total N, available P and exchangeable Kfor the surface layer are 29%, 39% and 48, res-pectively and for the sub-layer are 42%, 63% and65%, respectively. The mean values of total N,available P, and exchangeable K were found to be0.42 and 0.29 % for N, 50.6 and 25.0 mg/kg for Pand 21.3 and 60.75 mg/kg for K for the top- andsub-soil layers, respectively. However, Tisdale etal (1985) reported that harvesting of grain re-moved a greater amount of total N and P with muchsmaller portions of K that absorbed by plants.This variation may be due to the effect of fertilizeraddition during the rice growing season and addi-tion of different amount of fertilizer during thegrowing season.
The semivariogram of the total N, availableP, and exchangeable K is shown in Table 2. Thenugget (C
o) varied among the two soil layers with
the values of 0.0002% and 0.0004 % for total N,13.0 and 109.8 mg/kg for available P and for theexchangeable K was 61.0 and 127.0 mg/kg, fortop- and sub-soil layers, respectively. The range ofthe semivariogram is the distance (h) at which γattains the maximum value (sill). Often the sill(C
o + C) is approximately equal to the sample va-
riance (Journel and Huijbregts, 1978). The valuesof the sill variance for all nutrients varied between0.01724 and 0.01636 % for total N, 229 and260 mg/kg for available P and 47 and 1075 mg/kg
Table 1. Statistical overview of some top- and sub-soil soil parameters measured on
the parameters on the study area
Parameter Depth Unit Range Variance Median Mean CV %
N 0-20 % 0.51 0.13 0.0174 0.44 0.42 29 20-30 % 0.49 0.12 0.0157 0.24 0.29 42
P 0-20 mg/kg 58 15.26 233.04 54.14 50.6 39 20-30 mg/kg 56 16.01 256.404 17.74 25.01 63
K 0-20 mg/kg 93 456.07 14.8 48.8 21.35 48 20-30 mg/kg 107 31.91 1018.70 57.4 60.75 65
Mean Standard-
deviation

Songklanakarin J. Sci. Technol.
Vol. 24 No. 2 Apr.-Jun. 2002 325Spatial variability of N, P and K in rice field
Eltaib, S.M., et al.
for exchangeable K for top-and sub-soil layers,respectively. The range expressed as distance, andcan be interpreted as the diameter of the zone ofinfluence, which represents the average maximumdistance over which a soil property of the twosamples is related. At a distance less than the range,measured properties of two samples become morealike with decreasing distance between them.Thus, the range provides estimate areas of simi-larity. The range varied between 12 and 13 m fortotal N, 12 and 38 m for available P and 31 and32 m for exchangeable K for both surface andsub-soil layers, respectively. The results showedhigh nugget effects were found for all the param-eters studied, indicating a high variability of therespective parameter between the sampling points(Webster and Oliver, 1990). For all parameterssmaller sampling should be recommended on thisfield.
The zone of influence represented by rangeand the effective range for total N, available P,and exchangeable are shown in Table 2. Calcula-tion of the effective range was derived from semi-variogram, which was represented by the A
0. The
total N, available P, and exchangeable K of thesurface was zone of influence greater than thesub-soil layer. This is expected due to the effectof fertilizer addition during the rice-growing sea-son. Similar studies on agricultural land (Ruhlinget al., 1997; Dampney et al., 1997) have all indi-cated that soil nutrient status may have a high
spatial variance. The results Table 2 indicates thatthe variability may even be higher on rice planta-tion.
Interpolation by point kriging
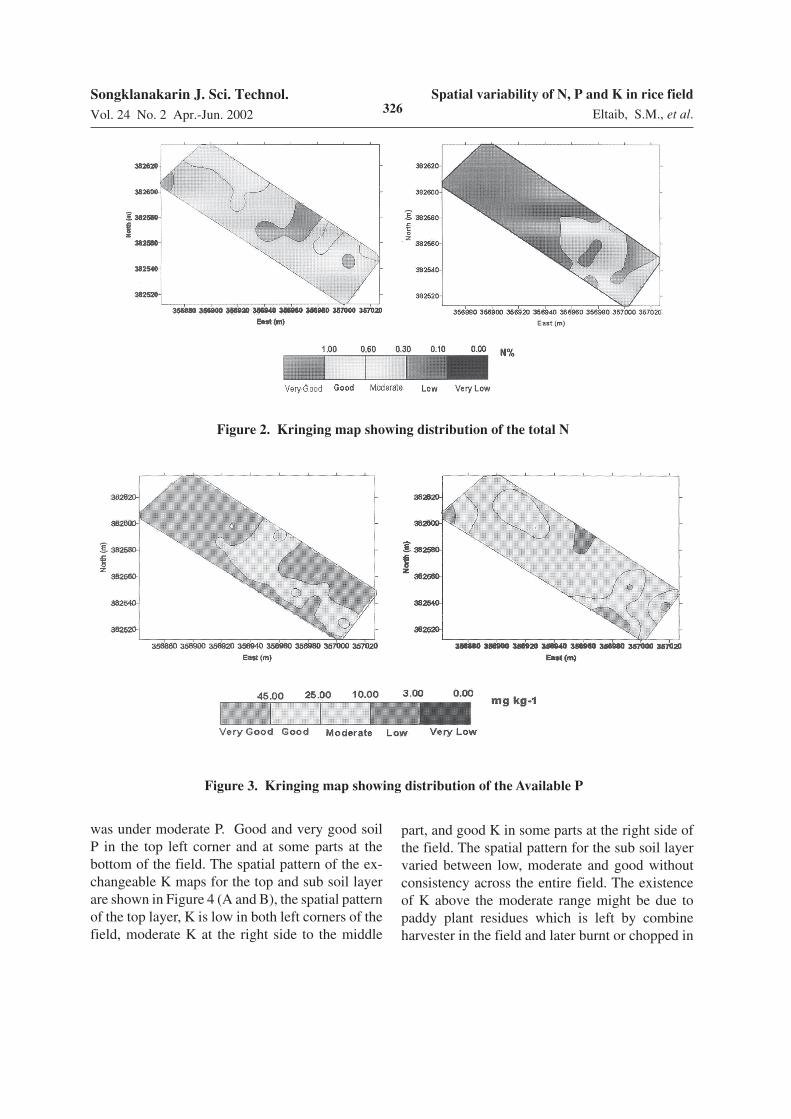
Point kriging values in Figure 2 for total Ndemonstrated the spatial pattern of the concen-tration of the total N along the field for the top-and sub-layer are A and B, respectively. For thetop layer map, moderate N has covered the leftside of the field with respect to the good con-centration at the top north and at the bottom of thefield, also low concentration at the middle and atthe top left corner. For the sub-layer, low N con-centration has covered most of the area of the fieldfrom top to middle part; also moderate N coveredthe bottom part of the field. So, the top soil mightcontain high organic matter which could holdnutrients more than the sub soil as reported byAnon (1997) and Michael (1987). Prasad and Power(1997) found that N content is generally higher inthe top soil layer of any soil since most organicresidues are deposited on the soil surface.
The spatial pattern maps for top- and sub-soil layers of available P are shown in Figure 3 (Aand B, for the top and sub layer, respectively). Forthe top layer, very good range was found coveringmost of the area with good P concentration in themiddle part which extended to the bottom part, alsosome small areas in the middle and bottom hasmoderate P. for the sub layer, the maximum area
Table 2. Characteristic of calculated semivariogram of spatial soil fertility
Nugget Sill Ratio
variance variance nugget/sill
---cm--- ----m---- % N 0-20 spherical 12 0.00002 0.01724 98 Weak
20-30 spherical 13 0.00043 0.01636 97 Weak P 0-20 spherical 12 13.00000 229.2000 94 Weak
20-30 spherical 38 109.8000 260.0000 59 Moderate K 0-20 spherical 31 61.000000 477.6000 72 Moderate
20-30 spherical 32 127.00000 1075.000 88 Moderate
Spatial
dependence
levelParameter Depth Model Range (A
o)
Spatial variability of N, P and K in rice field
Eltaib, S.M., et al.Songklanakarin J. Sci. Technol.
Vol. 24 No. 2 Apr.-Jun. 2002 326
Figure 3. Kringing map showing distribution of the Available P
was under moderate P. Good and very good soilP in the top left corner and at some parts at thebottom of the field. The spatial pattern of the ex-changeable K maps for the top and sub soil layerare shown in Figure 4 (A and B), the spatial patternof the top layer, K is low in both left corners of thefield, moderate K at the right side to the middle
part, and good K in some parts at the right side ofthe field. The spatial pattern for the sub soil layervaried between low, moderate and good withoutconsistency across the entire field. The existenceof K above the moderate range might be due topaddy plant residues which is left by combineharvester in the field and later burnt or chopped in
Figure 2. Kringing map showing distribution of the total N

Songklanakarin J. Sci. Technol.
Vol. 24 No. 2 Apr.-Jun. 2002 327Spatial variability of N, P and K in rice field
Eltaib, S.M., et al.
tillage operation. Sistani et al. (1998) reported ricecrop residues (straw and hulls) are rich in Si andK which have beneficial effects on rice plantgrowth.
Soil nutrients seem to have a much smallerrange and may vary within a short time period;therefore, a higher sampling density is required tocharacterize the spatial variance. Information onsoil nutrients status and others, such as soil maps,remote sensing maps, and existing soil nutrientsmaps may be reducing the soil sampling density.
Conclusion
Soil total N available P and exchangeableK were spatially varied within the study field andthe maximum range was reach at 38 m for theavailable P for the sub-soil layer. The kriged mapsshowed that different ranges of N-P-K existedfrom both sides of the field to the middle part.The soil chemical properties commonly have spa-tial dependence and that understanding such struc-ture may provide new insights into soil behaviorfor the land management. Geostatistical techniquesoffer methods for the estimation of soil chemicalproperties and their associated variability. Thepattern of spatial variability in the form of kriging
Figure 4. Kringing map showing distribution of the Exchangeable K
map may improve the decision for field manage-ment practices, such as fertilizer recommendationrates. Also knowledge of the variability in spaceand time of soil fertility such as total N, availableP and exchangeable K is one of the most importantkeys in further development of site-specific man-agement. Measuring this variation according topresent sampling methods is not always econo-mically viable, so other sampling methods ortechniques and other tools are needed.
Acknowledgment
The author grateful for Malaysian Centerfor Remote Sensing (MACRES) for funding thisresearch. We thank the technical staff at the soilchemistry and plant analysis lab at UniversityPutra Malaysia for their assistance in analyzingthe soil.
References
Aiken, R.M., Jawson, M.D., Grahammer, K. and Poly-menopoulos, A.D. 1991. Positional, spatiallycorrelated and random components of variabil-ity in carbon dioxide flux. J. Environ. Qual.20:301-308.
Spatial variability of N, P and K in rice field
Eltaib, S.M., et al.Songklanakarin J. Sci. Technol.
Vol. 24 No. 2 Apr.-Jun. 2002 328
Bonmati, M., Ceccanti, B. and Nanniperi, P. 1991. Spa-tial variability of phosphate, urease, protease,organic carbon and total nitrogen in soil. SoilBio. Biochem. 23: 391-396.
Bray, R. H. and Kurtz, L. T. 1945. Determination oftotal, organic and available forms of phosphorusin soils. Soil Sci. 59: 39-45.
Bremner, J.M., and Mulvaney, C.S. 1982. Total N. In
Page, A. L., Miller, R. H. and Keeny, D. R. (eds).Methods of Soil Analysis, Part 2, 2nd Ed.,American Society of Agronomy, Inc. and SoilScience Society of America, Inc., Madison,Wisconsin, USA. pp, 595-624.
Burgess, T.M. and Webster, R. 1980b. Optimal andisarithmic mapping of soil properties. 1: Thesemivariogram and punctual kriging. J. Soil Sci.31: 315-331.
Burgess, T.M., and Webster, R. 1980. Optimal inter-polation and isarithmic mapping of soil proper-ties. 1. The semivariogram and punctual kriging.J. Soil Sci. 31:315-331.
Dampney, P. M. R., Goodlass, A., Ridling, A.E. andFromnet, M.A. 1997. Fertilization for sustain-able plant production and soil fertility. CIECand FAL Germany. p.155.
DOA. 1997. Rating for chemical properties of soil inPeninsular Malaysia. Soil Management Division,Department of Agriculture (DOA), Malaysia.
Hamlett, J.M., Horton, R. and Cressie, N.A.C. 1986.Resistant and exploratory techniques for use insemivariogram analysis. Soil. Sci. Soc. Am. J.50:868-875.
Journel, A.G. and Hujibregts, C.H. 1978. MiningGeostatistics. AC-Academic Press, New York.
Lascano, R.J. and Hatfield, J.L. 1992. Spatial variabil-ity of evaporation along two transects of Abaresoil. Soil Sci. Soc. Am. J. 56:341-346.
Myers, J.C. 1997. GeoStatistical error managementquantifying uncertainity for environmentalsampling and mapping. Van Nortrand Reinhold-division of international; Thomson publishinginc., U.S.A.
Parkin, T.B. 1993. Spatial variability of microbial pro-cess in soil a review. J. Environ. Qual. 22:409-41.
Rochette, P., Desjardins, R.L. and Pattey, E. 1991. Spa-tial temporal variability of soil respiration inagricultural fields. Comm. J. Soil. Sci. 71:189-196.
Ruhling, S., Haneklaus., and Schnug, E. 1997. Fertili-zation for sustainable plant production and soilfertility. CIEC and FAL, Germany. p.178.
SFASU. 1988. Procedure for taking soil samples.Miscellaneous Extension Publication. StephenF. Austin State Univ. Soil Test Lab, Nacogdoches,Texas.
Schollenberger, C. J and Simon, R. H. 1945. Determi-nation of exchangeable capacity and exchange-able bases in soil-ammonium acetate method.Soil Sci. Res. 14:161-168.
Sistani, K. R., Reddy, M. L., Savantand, N. K., Kanyika,W. 1998. An integrated nutrient managementsystem for sustainable rice production. Proc. Of4th Int. conference on agriculture, 19-22 july, St.Pauls, MN,USA.
Sutherland, R. A., VanKessel, C. and Pennock, D. J.1991. Spatial Variability of Nitrogen-15 naturalabundance. Soil Sci. Am. J. 55:1339-1347.
Tisdale, S. L., Nelson, W. L., Beaton, J. D. and Havlin,J. L. 1985. Soil fertility and fertilizers-5th edition.Macmillan publishing Co., New York, U.S.A.
Vauclin, M., Vieira, S. R., Vachaud, G. and Nielsen,D. R. 1983. The use of cokriging with limitedfield soil observations. Soil Sci. Soc. Am. J. 47:175-184.
Vieira, S.R., Nelsen, D.R. and Biggar, J.W. 1981. Spa-tial variability of field-measured infiltrationrate. Soil. Sci. Soc. Am. J. 45:1040-1048.
Webster, R. and Oliver, M. A. Statistical methods inSoil and land resources survey (Oxford Univer-sity Press, 1990), p.316.