Embed Size (px)
Citation preview

Accepted and forthcoming in Environment and Planning A
ERIM REPORT SERIES RESEARCH IN MANAGEMENT
ERIM Report Series reference number ERS-2009-057-ORG
Publication December 2009
Number of pages 44
Persistent paper URL http://hdl.handle.net/1765/17431
Email address corresponding author [email protected]
Address Erasmus Research Institute of Management (ERIM)
RSM Erasmus University / Erasmus School of Economics
Erasmus Universiteit Rotterdam
P.O.Box 1738
3000 DR Rotterdam, The Netherlands
Phone: + 31 10 408 1182
Fax: + 31 10 408 9640
Email: [email protected]
Internet: www.erim.eur.nl
Bibliographic data and classifications of all the ERIM reports are also available on the ERIM website:
www.erim.eur.nl
Spatial Structure and Productivity in U.S. Metropolitan Areas
Evert Meijers and Martijn Burger

ERASMUS RESEARCH INSTITUTE OF MANAGEMENT
REPORT SERIES
RESEARCH IN MANAGEMENT
ABSTRACT AND KEYWORDS
Abstract Recent concepts as megaregions and polycentric urban regions emphasize that external
economies are not confined to a single urban core, but shared among a collection of close-by
and linked cities. However, empirical analyses of agglomeration and agglomeration externalities
so-far neglects the multicentric spatial organization of agglomeration and the possibility of
‘sharing’ or ‘borrowing’ of size between cities. This paper takes up this empirical challenge by
analyzing how different spatial structures, in particular the monocentricity – polycentricity
dimension, affect the economic performance of U.S. metropolitan areas. OLS and 2SLS models
explaining labor productivity show that spatial structure matters. Polycentricity is associated with
higher labor productivity. This appears to justify suggestions that, compared to relatively
monocentric metropolitan areas, agglomeration diseconomies remain relatively limited in the
more polycentric metropolitan areas, while agglomeration externalities are indeed to some extent
shared among the cities in such an area. However, it was also found that a network of
geographically proximate smaller cities cannot provide a substitute for the urbanization
externalities of a single large city.
Free Keywords polycentricity, dispersion, labor productivity, urbanization externalities
Availability The ERIM Report Series is distributed through the following platforms:
Academic Repository at Erasmus University (DEAR), DEAR ERIM Series Portal
Social Science Research Network (SSRN), SSRN ERIM Series Webpage
Research Papers in Economics (REPEC), REPEC ERIM Series Webpage
Classifications The electronic versions of the papers in the ERIM report Series contain bibliographic metadata by the following classification systems:
Library of Congress Classification, (LCC) LCC Webpage
Journal of Economic Literature, (JEL), JEL Webpage
ACM Computing Classification System CCS Webpage
Inspec Classification scheme (ICS), ICS Webpage

1
Spatial Structure and Productivity in U.S. Metropolitan Areas
E.J. (Evert) Meijers Delft University of Technology, OTB Research Institute for Housing, Urban and Mobility Studies. PO Box 5030, 2600 GA Delft, The Netherlands. E-mail: [email protected] (Corresponding author) M.J. (Martijn) Burger Erasmus University Rotterdam, Department of Applied Economics and ERIM. PO Box 1738, 3000 DR Rotterdam, The Netherlands. E-mail: [email protected]. URL: http://www.mjburger.net.
Abstract
Recent concepts as megaregions and polycentric urban regions emphasize that external economies are not confined to a single urban core, but shared among a collection of close-by and linked cities. However, empirical analyses of agglomeration and agglomeration externalities so-far neglects the multicentric spatial organization of agglomeration and the possibility of ‘sharing’ or ‘borrowing’ of size between cities. This paper takes up this empirical challenge by analyzing how different spatial structures, in particular the monocentricity – polycentricity dimension, affect the economic performance of U.S. metropolitan areas. OLS and 2SLS models explaining labor productivity show that spatial structure matters. Polycentricity is associated with higher labor productivity. This appears to justify suggestions that, compared to relatively monocentric metropolitan areas, agglomeration diseconomies remain relatively limited in the more polycentric metropolitan areas, while agglomeration externalities are indeed to some extent shared among the cities in such an area. However, it was also found that a network of geographically proximate smaller cities cannot provide a substitute for the urbanization externalities of a single large city. Keywords: Polycentricity, Dispersion, Labor productivity, Urbanization externalities Acknowledgement Evert Meijers wishes to thank the funding provided by the Netherlands Organisation for Scientific Research (NWO). The paper has benefited from well thought-out comments by Nick Phelps as well as three anonymous reviewers,

2
Spatial Structure and Productivity in U.S. Metropolitan Areas
1. Introduction
Slowly but steadily, the image of the city has changed dramatically over the last one
and a half century. The industrial image of a city – as being composed of an urban
core and a rural hinterland – has become increasingly obsolete. Advances in transport
infrastructure and rising levels of car ownership have fuelled a process of
decentralization and suburbanization, initially of people, but later followed by jobs
(Boarnet, 1994). However, this trend does not stop with the establishment of new
centers in the city or at its edges. We are also witnessing the ‘fusion’ of formerly
relatively independent and distinct cities into wider metropolitan areas. Nowadays,
what is ‘urban’ increasingly spreads out over a wider region, requiring us to think of
the city as a regional phenomenon (Scott, 1988; Storper, 1997). This is reflected in the
revival of the debate on city-regions (Parr, 2005) and in the conceptualisation of
regionalised urban entities (Kloosterman and Musterd, 2001; Hall and Pain, 2006;
Florida et al., 2008). In spatial terms, the spatial structure of such regions can be
characterised as a series of towns ‘physically separate but functionally networked,
clustered around one or more larger cities’ (Hall and Pain, 2006, 3), or ‘integrated
sets of cities and their surrounding suburban hinterlands’ (Florida et al., 2008, 459).
Therefore, the emerging spatial form of post-industrial urban regions is
quintessentially polycentric (Hall, 2000; Kloosterman and Musterd, 2001; Phelps and
Ozawa, 2003).

3
Essential to this debate on such regionalised urban entities is the underlying
idea that external economies are not confined to a well-defined single urban core,
but, instead, are shared among a group of functionally linked settlements (Phelps
and Ozawa, 2003; Sassen, 2007). The basic idea of polycentricity is that multiple
centers or cities, and hence multiple sources of agglomeration economies, are co-
located and also interact, given the widening geographical scale of economic and
social processes (Van Oort et al., 2010). Such ‘regionalisation’ of urbanization
externalities has been conceptualised and described by several scholars (Richardson,
1995; Coe and Townsend, 1998), thereby deploying terms such as ‘urban network
externalities’ (Capello, 2000), ‘spatial externality fields’ (Phelps et al., 2001) or
‘regional externalities’ (Parr, 2002). Such concepts build on the concept of ‘borrowed
size’, coined by Alonso (1973), who used it to explain why smaller cities that are part
of a megalopolitan urban complex had much higher incomes than self-standing cities
of similar size. According to Phelps and Ozawa (2003, 594), ‘the idea of borrowed size
suggests that today’s examples of megalopolitan agglomeration are based
predominantly on some combination of pecuniary and technological externalities open
to service industries across a group of settlements, rather than the technological
externalities available at the localised scale of discrete towns or cities.’
When external economies are increasingly conceptualised in relational terms
(Gordon and McCann, 2000; Phelps and Ozawa, 2003; Johansson and Quigley, 2004;
Burger et al., 2009), it would make sense to study agglomeration externalities at the
scale of the regional urban system rather than the single city, as the interactions with
nearby cities may also influence the presence of agglomeration externalities.
However, such research is rather non-existent. It seems that empirical analysis of

4
economic agglomeration does not correspond to the changes in the geographical
scale at which agglomeration manifests itself (Phelps and Ozawa, 2003; Burger et al.,
2010). In analysis, the shape of the urban system is most often simply taken for
granted (Scott, 2000; Kloosterman and Musterd, 2001). In equilibrium approaches,
the economic organisation of space is not a concern (see Corpataux and Crevoisier,
2007).
The principal objective of this paper is to provide some first steps to overcome
the empirical deficit that characterises the current debate about the sharing of
agglomeration externalities between a collection of more or less proximally located
cities. Do cities actually borrow size from each other? Can a collection of close-by
cities provide a substitute for the urbanization externalities of a single larger city?
These key questions are at the heart of the worldwide policy debates on the
geographical scale of agglomeration, be it the megaregions in the U.S. or Asia or the
somewhat smaller – in spatial terms- polycentric urban regions that have become
such a popular planning concept in Europe (see Meijers, 2005).
The approach developed in this paper to answer the question of whether
cities borrow, or share, size, is to include the spatial structure of metropolitan areas
into empirical analysis of agglomeration externalities. Building on previous work by
Anas et al. (1998) and Lee and Gordon (2007), we will not limit ourselves to the
monocentricity-polycentricity dimension, but also include a centralization-dispersion
dimension. Labor productivity is used as a proxy for metropolitan performance. We
extend existing production functions (notably Ciccone & Hall, 1996) with spatial
variables other than the commonly used indicators as size or average density.
5
The remainder of this article is organised as follows. We synthesise the
literature discussing the spatial structure of metropolitan areas in relation to their
performance in Section 2, which results in three testable assumptions. Section 3
presents our measurements of the spatial structure of metropolitan areas. Section 4
continues with the model specification and other data used. Section 5 presents the
estimation results. Section 6 concludes and discusses the implications of our findings.
2. Urbanization, spatial structure and metropolitan performance
Spatial structure tends to attract increasing interest from urban geographers and
planners as it is believed to affect the economic performance, environmental
sustainability and social well-being of places and their inhabitants. Clear examples are
the ‘new urbanism’ and ‘smart growth’ movements in urban planning circles in the
U.S. Although in regional science and urban economics there is a large empirical
literature which links city characteristics to urban performance, often empirical work
on agglomeration does not go beyond including average density or city size
(‘urbanization externalities’) as a spatially relevant factor. However, neither density
nor size reveals much about a region’s spatial organization.
Indicators of the spatial organisation of metropolitan areas need to address
two questions (Anas et al., 1998). First, how is the urban population spread over
urban centers? Second, to what extent is the metropolitan population located in
urban centers or dispersed? The first question refers to a monocentric-polycentric
dimension, while the second question refers to a centralization-dispersion dimension.
Below, we address the relationship of size, monocentricity-polycentricity and

6
centralization-dispersion respectively with metropolitan performance, which results
in three testable hypotheses.
2.1 Size and urbanization externalities
A large strand of empirical research in regional science and urban economics focuses
on the benefits stemming from the size or density of the urban economy. As a
general rule, these urbanization externalities can be regarded as external economies
passed to firms as a result of savings from large-scale operation of the city as a
whole. These benefits are uncontrollable and unregulable for a single firm and, above
all, immobile or spatially constrained (Van Oort, 2004). Following Isard (1956), it is the
availability of a large and multi-functional labor pool and the presence of a good
infrastructure and public facilities in dense economic areas that are the sources of
urbanization externalities. Relatively more urbanized areas are also more likely to
accommodate universities, R&D laboratories, trade associations, and other
knowledge-generating institutions. Moreover, the often diverse industry mix in an
economically dense area increases the odds of interaction, generation, replication,
modification and recombination of ideas and applications across different sectors
(Van Oort, 2004) and protects a region from volatile demand (Frenken et al., 2007).
Finally, the presence of a large internal market offers a larger degree of stability and
lower transport costs (Siegel et al., 1995). However, a high degree of urbanization
may also result in a dispersion of economic activities due to pollution, crime or high
land and housing prices. In this respect, one can speak of urbanization diseconomies,
which are assumed to be negatively related to metropolitan performance. We expect
to confirm the strong positive relation between size and metropolitan performance,

7
but our main interest lies with the monocentricity-polycentricity and centralization-
dispersion dimensions of urban spatial structure.
2.2 Monocentricity and polycentricity
Whereas metropolitan size is linked to external economies to scale, monocentricity
or polycentricity, and centralization or dispersion can be linked to some sort of
external economies to structure. In the current debate on metropolitan spatial
structure, the influence of monocentricity or its opposite, polycentricity, on the
performance of metropolitan areas remains unclear due to a lack of empirical
research, while this evidence is urgently needed (Lambooy, 1998; Kloosterman and
Musterd, 2001; Parr, 2004; Turok and Bailey, 2004; Cheshire, 2006; Parr, 2008;
Meijers, 2008a).
At the spatial scale of the metropolitan area, Lee and Gordon (2007) did not
find that a polycentric or monocentric structure, measured by the subcenters’ share
of all center employment, does affect metropolitan population and employment
growth. Still, it is generally brought forward that the advantage of polycentricity at
the local level is that it comes with a lack of agglomeration disadvantages (see Fujita
et al., 1997, Goffette-Nagot and Schmitt, 1999; Bertaud, 2004) such as fierce
competition for land and workers, congestion, and pollution exposure.
Agglomeration disadvantages appear to be largely confined to the scale of
individual cities within the metropolitan area (Parr, 2002) and evidence suggests that
smaller cities have a greater endogenous capacity to keep these social, economic and
environmental costs under control (Capello and Camagni, 2000). When, at the same
time, the idea holds that agglomeration advantages are increasingly associated with

8
a more regionalized spatial structure (Parr, 2002; Capello and Camagni, 2000; Sassen,
2007) as networks may substitute for agglomeration (Johansson and Quigley, 2004),
then polycentricity will become an increasingly strong asset of metropolitan areas.
So far, however, it remains untested that a polycentric spatial structure in
metropolitan areas leads to successful economic development (Parr, 2008; Parr,
2004; Lambooy, 1998). Building on the idea that agglomeration advantages have
‘regionalized’ to a considerable extent, while disadvantages remain local issues, we
hypothesize in this paper that a more polycentric urban structure has a direct and
positive effect on metropolitan performance, as they may provide a better balance
between agglomeration advantages and agglomeration disadvantages.
Extent of regionalization of urbanization externalities
Despite the theoretical consensus regarding the ‘regionalization’ of urban
externalities, the extent to which such a ‘regionalization’ may take place in a
polycentric spatial structure is highly questioned. According to Bailey and Turok
(2001) the idea that the integration of separate cities results in agglomeration
advantages comparable to similar-sized monocentric cities is ‘rather simplistic’. Parr
(2004; 2008) points in this respect to the need for longer travel flows, longer
commodity flows and less convenient flows of information in polycentric urban
regions. Moreover, it should be noted that ‘some of the advantages of urban size
stem from the nature of the metropolitan environment, and are related to such
factors as density, proximity, face-to-face contact, informal structures, unplanned
interaction, etc.’ (Parr, 2004, 236), and consequently hold less for polycentric urban
regions. This is confirmed by a recent study (Meijers, 2008a) that showed that

9
polycentric regions in the Netherlands had significantly less cultural, leisure and
sports amenities than monocentric regions in which the urban population is
concentrated in a single city. In this paper we test the hypothesis that polycentricity
diminishes the effect of urbanization economies on labor productivity at the regional
metropolitan scale.
2.3 Centralization and dispersion
A dispersed spatial structure refers to the situation in which a large part of the
population is not living in centers but spread out across the territory in a non-
concentrated pattern. It is not necessarily similar to urban sprawl, as this is often
equated with low-density residential development, whereas dispersion concerns the
issue of whether this development is taking place in centers or not, leaving aside the
question of density. Whether or not dispersion negatively influences urban
performance is an unsolved issue and as far as it corresponds to urban sprawl even
controversial. According to a 2000 Costs of Sprawl report (Transportation Research
Board, 2002), dispersed low-density development consumes more land and
infrastructure, provides fewer fiscal impacts, whilst increasing housing costs,
personal travel costs and automobile dependence. Critics claim that spread out,
dispersed development fulfills a widespread need for safe neighbourhoods,
appreciating housing values, and unrestricted use of automobiles. Glaeser and Kahn
(2004) stress the association of sprawl with significant improvements in quality of
life. According to the 2000 Costs of Sprawl study, the alternative is a form of
centralization that directs development to locations where it is more efficient to
provide public services. This is referred to as ‘smart growth’. In this study we will test

10
the hypothesis that metropolitan areas that have a higher proportion of the
population living in urban places, and hence, less dispersion, perform better in terms
of labor productivity.
3. Quantifying metropolitan spatial structure
A prerequisite for testing the idea of whether urbanization economies are dependent
on spatial structure is to quantify this regional spatial structure. Next to size, we
distinguished two dimensions that effect spatial concentration. Here we discuss their
exact measurement. The centralization-dispersion dimension refers to the extent to
which population and employment is centralised in cities or dispersed over smaller
non-urban places in the area in a non-centralised pattern. The monocentricity-
polycentricity dimension reflects the extent to which urban population and
employment is concentrated in one city or spread over multiple cities in the wider
metropolitan area (see Figure 1). These two dimensions are quite similar to the two
types of spatial concentration at the city-level discerned by Anas et al. (1998) in their
classic essay on the urban spatial structure of cities (see also Lee and Gordon, 2007),
although in terms of measurement we adopt them to the larger metropolitan area
scale.
<Figure 1>
3.1 Monocentricity versus polycentricity

11
In the literature, one finds different interpretations of what makes a metropolitan
area polycentric (Meijers, 2008b). Grossly speaking, there is an approach that defines
polycentricity on the basis of urban morphology (see Kloosterman and Musterd,
2001; Parr, 2004), while another approach adds relational aspects to it in the sense
that a metropolitan area can only be considered polycentric when the cities are
strongly functionally linked, which is sometimes referred to as ‘relational
polycentricity’ or ‘functional polycentricity’ (see for instance Hall and Pain, 2006;
Green, 2007; De Goei et al., 2009). Here, we adhere to the first and least restrictive
vision, thus studying the monocentricity-polycentricity dimension from a
morphological perspective. It is important to note that polycentricity is not so much
about the presence of multiple cities in a metropolitan area, but about the balance in
the size distribution of these cities. The more even this balance and hence the lack of
a strong hierarchy, the more polycentric (Kloosterman and Lambregts, 2001; Parr,
2004; Meijers, 2005).
The rank-size distribution of the regional urban system provides information
on this hierarchy and is therefore a useful indication of the extent of mono- or
polycentricity (Spiekermann and Wegener in Nordregio et al., 2004; Parr, 2004).
Figure 2 presents the four largest incorporated places in two U.S. metropolitan areas
and also the regression slope that best fits the distribution of their sizes. The flatter
this slope is, the more polycentric the metropolitan area. Conversely, the steeper this
slope is, the more monocentric the metropolitan area. In this example, San Antonio,
TX, is obviously monocentric, while San Jose-San Francisco-Oakland, CA, is a clear
example of a polycentric metropolitan area.

12
<Figure 2>
In this study we calculated the slope of the regression line of the rank-size
distribution of incorporated places (cities)1 in each U.S. metropolitan area. Following
Meijers (2008b) we did so for different numbers of incorporated places per
metropolitan area (2, 3 and 4) and then calculated the average of these three scores.
The slopes found were normally distributed, meaning that the majority of
metropolitan areas in the US cannot be considered (very) monocentric nor (very)
polycentric, but are somewhere in between those extremes on the same scale. It
appears that only the most polycentric metropolitan areas can be considered
polycentric urban regions in the way they are usually defined.2 Below we will refer to
the position of a metropolitan area on this scale ranging from monocentric to
polycentric as its’ ‘degree of polycentricity’, simply because higher values mean that
it is more polycentric. Otherwise, we could have equally chosen to term it the ‘degree
of monocentricity’.
The rank-size distribution does not provide information on the spread of cities
over the metropolitan territory, but polycentricity is also about spatially distinct cities
(Parr, 2004; Kloosterman and Lambregts, 2001). Therefore, we need to filter out
regions that score polycentric in terms of the rank-size distribution, but in which the
cities are part of the same contiguous built-up area. In the latter case, the term
polycentric conurbation is more appropriate. If the two largest cities of a
metropolitan area that scored polycentric belong to the same ‘urban area’, which is
delineated by the US Census Bureau to encompass densely settled territory, we
labelled these ‘polycentric conurbations’. We did not include these polycentric

13
conurbations in the analysis as it could be argued that these metropolitan areas,
while scoring polycentrically, in fact resemble monocentric metropolitan areas more,
the main difference being the presence of administrative boundaries dividing the
built-up area (see Appendix A).
3.2 Centralization versus dispersion
The share of the central city in total metropolitan area population in the U.S. fell
rapidly from almost 64% in 1930 to 38% in 2000 (Kim, 2007). The question then is
where the majority of the metropolitan population is located; are they clustered in
other urban centers or are they dispersed over the metropolitan territory in an
uncentered way? In order to test the hypothesis that less centralization and thus
more dispersion limits labor productivity, we scored each case study area on a
centralization–dispersion axis, their position being dependent on the share of the
metropolitan population that was not located in urban centers of at least 25,000
inhabitants in 2006.
Association of dimensions
Both dimensions are associated in the sense that more polycentric metropolitan
areas tend to be characterised slightly more often by dispersion. But, as Table 1
displays, there are several exceptions to this ‘rule’. For instance Midland-Odessa, TX,
is the most polycentric metropolitan area, while it is also among the top 5 most
centralised areas.
<Table 1>
14
4. Model, data and estimation strategy
4.1 Model
In regional science and urban economics, many studies have investigated the effect
of urbanization externalities using aggregate production functions at the city level.
Although different functional forms of the urban production exist, our point of
departure is the models developed in Ciccone and Hall (1996) and Ciccone (2002),
who use a Cobb-Douglas production function to assess the effect of agglomeration
economies on localised labor productivity.
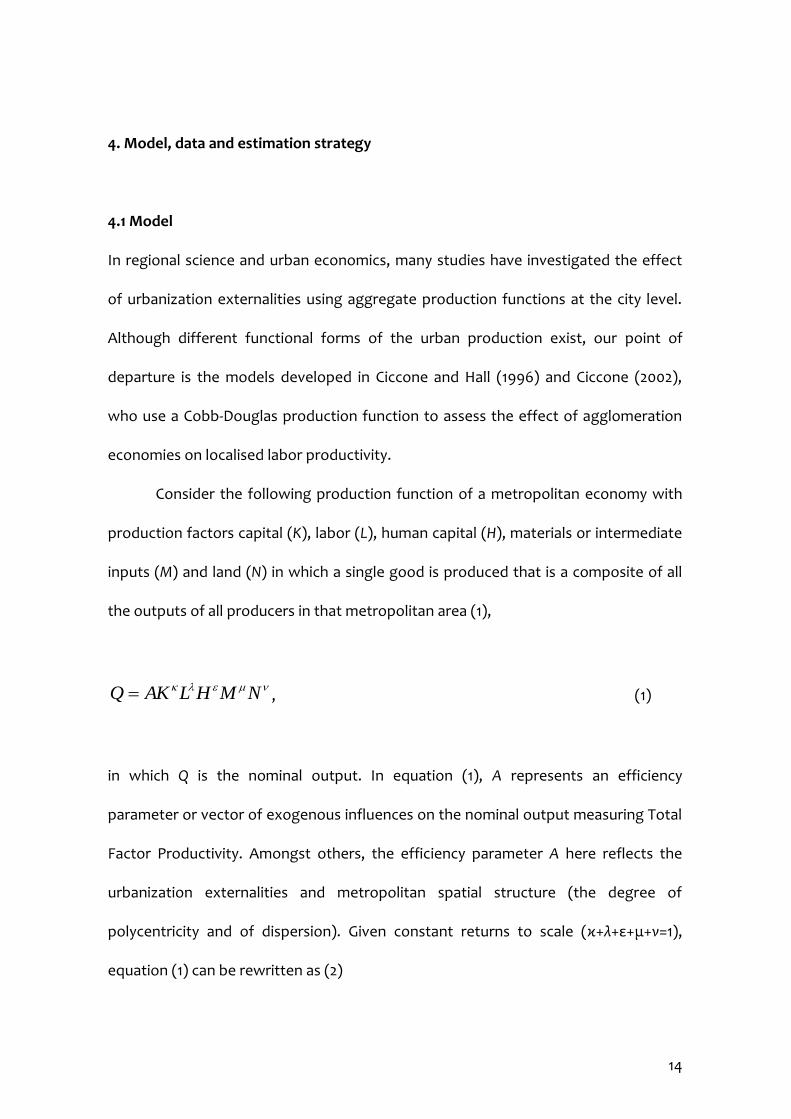
Consider the following production function of a metropolitan economy with
production factors capital (K), labor (L), human capital (H), materials or intermediate
inputs (M) and land (N) in which a single good is produced that is a composite of all
the outputs of all producers in that metropolitan area (1),
NMHLAKQ , (1)
in which Q is the nominal output. In equation (1), A represents an efficiency
parameter or vector of exogenous influences on the nominal output measuring Total
Factor Productivity. Amongst others, the efficiency parameter A here reflects the
urbanization externalities and metropolitan spatial structure (the degree of
polycentricity and of dispersion). Given constant returns to scale (κ+λ+ε+μ+ν=1),
equation (1) can be rewritten as (2)

15
L
N
L
M
L
H
L
KA
L
Q, (2)
in which the output per worker (labor productivity) is a function of the capital-labor
ratio, human capital-labor ratio (or alternatively, education per worker), intermediate
inputs-labor ratio, land-labor ratio, and the efficiency parameter A. By taking
logarithms on both sides of equation (2), the multiplicative form can be converted
into a linear stochastic form, to give the following testable equation (3):
j
j
jj rXL
N
L
M
L
H
L
K
L
Q)(lnlnlnlnlnln 10
(3)
, where equation (3) is augmented with a set of variables X with parameters θ, which
are related to metropolitan size and spatial structure and enter the production
function through a higher value of A (Fogarty and Garofolo, 1988; Broersma and
Oosterhaven, 2009). Here, this set includes the size of the metropolitan population,
the degree of polycentricity, and the degree of dispersion. Following Ciccone (2002)
census region dummy variables rj are included to account for remaining differences in
exogenous Total Factor Productivity which may moderate the relationship between
agglomeration, spatial structure and labor productivity, such as relative differences in
climate, price levels, and levels of technology across metropolitan areas.

16
4.2 Data and Variables
To estimate our production function, data was gathered for metropolitan statistical
areas (MSAs), but in the many cases in which these were part of a wider combined
statistical area (CSA) we used this widest possible definition of U.S. metropolitan
areas, which is largely based on commuting behavior (see Appendix A). The reason to
principally focus on CSAs comes forward from the necessity to analyse the
performance of cities in their wider spatial context and we wanted to avoid the
monocentric perspective that underlies the MSA definition. For example, it was
deemed necessary for this analysis to take the San Jose- San Francisco – Oakland CSA
as a unit of analysis rather than the MSAs that make up this CSA separately. Data
concerns those metropolitan areas located in continental U.S with a total population
over 250,000 inhabitants in 2006.
Our dependent variable Labor Productivity is measured as the 2006 GDP in
real dollars of a metropolitan area divided by the total number of jobs in the included
sectors in that area in 2006. As our research underlies a market-based model and
spatial externalities are most profound in sectors that lack exogenous endowments,
agriculture, fishing, hunting, mining and public administration were excluded (see
also Brülhart and Mathys 2008). In addition, no figures on self-employment were
available. Data on GDP by metropolitan area and sector were obtained from the U.S.
Department of Commerce’s Bureau of Economic Analysis (BEA). Data on the number
of jobs were provided by the Bureau of Labor Statistics (BLS) of the U.S. Department
of Labor, and for individual sectors taken from the 2006 American Community
Survey. The new BEA estimates enable a more direct measurement of labor
productivity than previously possible, when many researchers used indirect proxies

17
such as the mean annual wage or household income. Descriptive statistics are
provided in Table 2. Note that corresponding specification (3), all non-dummy
variables in our empirical analysis are log-transformed.
With respect to the factor inputs, the Capital-Labor Ratio within a
metropolitan area was measured by linking the capital-labor ratio of broad sectors, as
obtained from the Annual Survey of Manufacturers, to the industrial composition
within the metropolitan area (based on a division into 15 sectors). Hence, the
obtained value is a weighted average of the capital-labor ratio across sectors.
Although this operationalization does not account for regional differences within
sectors (e.g., capital intensity, level of technology and sub-sector specialization), it
provides a reasonable proxy to the capital-labor ratio within metropolitan areas. The
Land-Labor Ratio is defined as the average number of acres per worker within a
metropolitan area. The human capital-labor ratio or average Education per Worker
within a metropolitan area is obtained from the American Community Survey (2006)
and measured as the percentage of the metropolitan population of 25 years and
older with a bachelor’s degree or higher. As our output variable is Gross Domestic
Product (GDP), which equals the total production minus intermediate inputs, we do
not take intermediate goods into consideration (see also Broersma and Oosterhaven,
2009).
However, the main variables of interest in our research are the indicators
related to the urbanization externalities and spatial structure. Urbanization
externalities are captured by the variable Metropolitan Size, which is measured as the
size of the metropolitan population in 2006. With respect to urban spatial structure,
we include both a metropolitan area’s degree of Polycentricity and its degree of

18
Dispersion in our model. Their measurement was discussed in section 3. Finally,
dummy variables based on the census divisions are included, which reflect nine broad
geographic regions in the United States (New England, Middle Atlantic, South
Atlantic, East North Central, East South Central, West North Central, West South
Central, Mountain and Pacific; see also Lee and Gordon, 2007).3 These dummies
attempt to control for some of the unobserved heterogeneity across metropolitan
areas, in particular differences in technology and price levels.
<Table 2>
4.3. Endogeneity and Two Stage Least Squares Estimation (TSLS)
Although equation (3) can be estimated using conventional Ordinary Least Squares
(OLS), this estimation technique does not account for the simultaneity between
metropolitan size and structure and labor productivity. In the model specification, it
is assumed that metropolitan size and spatial structure have an effect on
metropolitan labor productivity. However, the causality of this relationship is far from
clear. On the one hand, agglomeration is often associated with a number of benefits
such as labor market pooling, accessibility to intermediate goods, knowledge
spillovers, and proximity to consumers, which in turn would augment productivity.
On the other hand, firms may also be attracted to economically dense areas because
of the presence of higher productivity levels (Rosenthal and Strange, 2004). In other
words, agglomeration can be regarded as both a cause and consequence of labor
productivity. Likewise, metropolitan spatial structure may be regarded a
consequence rather than a cause of labor productivity growth. High land and real

19
estate prices in combination, driven by high levels of labor productivity in city
centers, may disperse people and firms out of the main cities into the wider
metropolitan area. In this case, it is not spatial structure that directs metropolitan
performance, but metropolitan performance that directs spatial structure.
Not accounting for simultaneity can lead to inconsistent estimates as it
violates one of the underlying assumptions of OLS, namely that the independent
variables are uncorrelated with the disturbance term of the dependent variable. In
other words, the independent variables should not be affected by the dependent
variable. Probably the most common technique to deal with this (potential)
simultaneity bias is to isolate the effect that runs from agglomeration and urban
spatial structure to labor productivity by means of a two stage least squares (TSLS)
estimation (see also, Ciccone and Hall, 1996; Ciccone, 2002; Combes et al., 2008). In
order to do so, we need instruments, or variables that are correlated with the
endogenous independent variables but not with the dependent variable. Hence, they
should be ‘relevant’, but at the same time ‘exogenous’. Based on Ciccone and Hall
(1996), we used five historical variables that are not related to labor productivity
today, as production 60-150 years ago was organised in a very different way than
nowadays, but that did significantly contribute to today’s metropolitan size and
spatial structure:
1. The metropolitan population in 1950
2. The degree of polycentricity in 1950
3. The degree of dispersion in 1950
4. Presence or absence of a railroad in the metropolitan area in 1860 (Stover,
1961).

20
5. Agricultural land use, measured as the density of employment in agriculture
outside the urban areas.
The 1950 variables are constructed in exactly the same way as our 2006 variables and
their inclusion as instrumental variables is obvious. With respect to our railroad
variable, it is assumed that the presence or absence of railroads in 1860 was not
driven by modern productivity differences (Ciccone and Hall, 1996), but are important
in explaining agglomeration at the end of the 19th century and the development of
other places through suburbanization in the early 20th century. Finally, the
agricultural land use variable is used as an instrument of dispersion: more extensive
agricultural land use outside the urban areas increases relative land rent as
competition for land intensifies (Brueckner, 2001). This in turn, slows down the
development of housing and offices outside the urban area compared to
metropolitan areas in which non-urban land is relatively cheap. Agricultural land use
is however not related to our dependent variable as this sector was excluded in the
measurement of the labor productivity of metropolitan areas.
5. Empirical Results
5.1. Testing for endogeneity of metropolitan size and spatial structure
Although there may be a problem of recursive causality from a theoretical point of
view, this does not necessarily mean that there is a problem from an econometric
point of view (Combes et al., 2008). If indeed the independent variables of interest
can be treated as exogenous, then OLS, which is a more efficient estimator, should

21
be preferred over the TSLS estimator (Woolridge, 2006). In order to conduct such a
test, the instruments need to fulfil two general conditions: they should be relevant
(not weak) and valid (exogenous).
Table 3 shows the test results on the relevance and validity of the instruments
as well as the endogeneity of metropolitan size and structure. The endogenous
variables were tested both separately and simultaneously. In other words, we ran
three regressions in which we instrumented metropolitan size, polycentricity or
dispersion and one regression in which we instrumented the three variables
simultaneously. We included more instruments than endogenous independent
variables in each specification in order to conduct an overidentification test to assess
the validity of the instruments. On the basis of the Anderson canonical correlation,
Cragg-Donald F-statistic and Shea Partial R2 statistics, we can conclude that our
instruments are relevant.4 With respect to testing the validity of the instruments,
both the Sargan and Basmann test indicate that our instruments are valid.5
<Table 3>
Finally, we tested whether the endogenous independent variables included
are also econometrically endogenous. In this, the Wu-Hausman F-test and Durbin-Wu-
Hausman Chi-Square test assess the null-hypothesis that the instrumented variables
are exogenous by comparing the TSLS estimates with the OLS estimates. From these
tests it can be concluded that metropolitan spatial structure, defined by
monocentricity-polycentricity and centralization-dispersion can be treated as
exogenous. In line with Lee and Gordon (2007), this is not surprising because spatial

22
restructuring can be considered a long-term process. However, for the specification
in which metropolitan size is instrumented the Durbin-Wu-Hausman test rejects the
hypothesis at a 5% confidence level (p=0.021). The estimation of this equation using
the OLS estimator would therefore not yield inconsistent results. Examining the
specification with multiple endogenous regressors, we cannot reject the null-
hypothesis that metropolitan size and metropolitan spatial structure are exogenous.
As both the Wu-Hausman F-test and Durbin-Wu-Hausman Chi-Square test indicate
that there is no evidence for an endogenous relationship between labor productivity
and metropolitan size and structure, OLS estimation should be used, given the fact
that our instruments are relevant and valid and OLS more efficient. However, we test
for robustness of our results by comparing the OLS estimates with the estimates
from the TSLS specification in which only metropolitan size is treated as endogenous.
5.2. Labor productivity, urbanization externalities and spatial structure
Model 1 in Table 4 shows the results of the OLS estimation of metropolitan size and
spatial structure on labor productivity, controlling for capital-labor ratio, land-labor
ratio, education and including census division fixed effects. The White-Koenker test
indicates that the null-hypothesis that the residuals are homoskedastic cannot be
rejected, while the Ramsey RESET test shows that we do not face an omitted variable
bias problem. The VIF statistics indicate no multicollinearity problems. In general, the
model fits the data well, explaining about two-thirds of the variance in labor
productivity across American metropolitan areas.
<Table 4>

23
Turning to the main results, we find a positive and significant effect of the
capital-labor ratio (elasticity of 0.75) and no effect of the proportion of the workforce
with a bachelor’s degree or higher on metropolitan labor productivity. However, our
main interest lies in examining the effect of metropolitan size and structure on urban
performance. In line with the existing empirical work on agglomeration, we find a
positive and significant effect of urbanization externalities on metropolitan labor
productivity. A doubling of metropolitan size increases metropolitan labor
productivity by over 10%. This is slightly higher than the consensus view that a
doubling of city size increases productivity by between 3 and 8% (Rosenthal and
Strange, 2004) and the average of 5.4% found by Melo et al. (2009) in a meta-analyses
of such estimates.
With respect to metropolitan spatial structure, we find mixed results, in the
sense that we find a positive and significant effect of the degree of polycentricity on
metropolitan labor productivity, but no effect of the degree of dispersion. We had
expected that dispersion would have a negative effect on labor productivity, but this
is not the case. However, the positive effect of the degree of polycentricity on
metropolitan labor productivity confirms our theoretical expectation. A doubling of
the degree of polycentricity, increases the metropolitan labor productivity by 5.5%.
This means that the labor productivity in metropolitan areas in which the urban
population is relatively evenly spread over multiple places in the metropolitan area
leads to higher labor productivity than in metropolitan areas in which the urban
population is concentrated in one large city, holding everything else constant. We will
elaborate on this important finding in the concluding section.

24
Comparing the OLS and TSLS estimator (Model 2 in Table 4), it can be seen
that the urbanization externalities effect is over 25% less when estimated using TSLS
(elasticity of 0.078), while the effect of the capital-labor ratio is larger. The parameter
estimates of polycentricity and dispersion do not significantly differ across the
models.
Examining the two interaction effects between metropolitan structure and
urbanization externalities (Model 3 and 4 in Table 5), the only negative effect we
found is for the interaction between metropolitan size and polycentricity on
metropolitan labor productivity. The negative and significant interaction term can be
interpreted as the fact that urbanization externalities are larger in monocentric cities.
This confirms our theoretical assumption that polycentricity diminishes the effect of
size on labor productivity. We will discuss the important theoretical implications of
this finding further in the next section. Similarly, it can also be interpreted as that the
benefits of polycentricity hold more for smaller regions than for large regions (in
terms of population).
<Table 5>
6. Conclusion and discussion
Recent theoretical interest of geographers has turned to post-industrial forms of
urban agglomeration. The industrial image of a metropolitan area as being composed
of an urban core and a rural hinterland is in many cases becoming obsolete and
appears to be being replaced by increasingly polycentric metropolitan areas that

25
spread over larger territories, thereby including multiple cities that together
constitute a metropolitan network of cities. The ‘city’ is becoming a regional
phenomenon and calls have been made that this should also manifest itself in the
study of agglomeration economics as these seem to be associated also with wider,
and more polycentric, forms of metropolitan agglomeration rather than being
confined to a single urban core (Alonso, 1973; Kloosterman and Musterd, 2001;
Phelps and Ozawa, 2003; Cheshire, 2006; Parr, 2008). Despite these calls, however,
several of these scholars have suggested that empirical research on agglomeration
externalities in relation to the regional urban systems is rather non-existent, contrary
to the more local scale of polycentric cities (Lee and Gordon, 2007). An important
reason for this empirical deficit is that many existing empirical analyses of
agglomeration still originate from definitions of metropolitan areas that depart from
a single nodal perspective. By this, we mean that the vast majority of countries
defines functional urban areas as being one central city and its hinterland, thereby
ignoring the possibility of having multiple core cities. Moreover, particularly in urban
economics, spatial structure is hardly an issue and often approximated by general
indicators such as just size or density, which, however, do not reveal much detail of
the spatial structure within regions.
This paper takes up this empirical challenge by analysing how different spatial
structures affect the development of agglomeration externalities in U.S.
metropolitan areas in 2006 with over 250,000 inhabitants. Externalities were
measured in terms of labor productivity. The widest official delimitation of
metropolitan areas was used (CSAs), and these were supplemented with MSAs that
do not form part of such CSAs.

26
As regards spatial structure, we assumed that, next to size, two dimensions
are important as these affect urban concentration within the region: 1) the
monocentricity-polycentricity dimension that indicates to what extent the urban
population is concentrated in one urban centre (monocentricity), or spread over
multiple urban centres in a metropolitan area in a balanced way (polycentricity); and,
2) the centralization–dispersion dimension, which indicates the extent to which the
metropolitan population is concentrated in centers. In addition to these indicators
relating to spatial structure we controlled for the capital-labor ratio, land-labor ratio
and human capital .
The empirical analysis in this paper resulted in four findings about the
relationship between a region’s spatial structure and its economic performance in
terms of labor productivity.
1) Metropolitan areas with more dispersion do not perform worse in terms of labor
productivity.
Whether a large part of the population is concentrated in urban centers or lives
outside of these centers in the non-urban part of the metropolitan area was not
found to influence labor productivity. Thus we found no evidence for the expectation
that dispersion is harmful to labor productivity.
2) Metropolitan areas that are more polycentric show higher labor productivity.

27
We found a positive and significant direct effect of the degree of polycentricity on
labor productivity. The more evenly the population is spread across the different
places in a metropolitan area, the higher the labor productivity in the metropolitan
area. As labor productivity proxies the balance between agglomeration economies
and diseconomies, we can conclude that this balance is better in the more polycentric
metropolitan areas. This can be explained by the assumption that urbanisation
diseconomies are less in the more polycentric areas and the idea that urbanisation
economies have ‘regionalized’ to some extent, while ‘urbanisation diseconomies’
appear to be confined to the city boundaries. So, this result appears to confirm ideas
that agglomeration externalities spread over larger distances, and may interact in
regions where multiple urban places and hence multiple sources of agglomeration
externalities are co-located. As such, it confirms that agglomeration economies need
to be conceptualised in relational terms. Thus, as Phelps and Ozawa (2003) proposed,
external economies are not confined to a single urban core, but instead, appear to be
shared among a group of functionally linked settlements. The latter appears to be
the case for the relatively more polycentric metropolitan areas. Finding 3, however,
qualifies the extent to which this ‘regionalization’ of agglomeration economies takes
place.
3) The effect of metropolitan size decreases as metropolitan areas are more
polycentric
Metropolitan size tends to reflect the presence of urbanization externalities. It was
found that the degree of polycentricity has an indirect effect on labor productivity as

28
urbanization externalities are fewer in the more polycentric metropolitan areas. Put
differently, the productivity gains of size diminish as the metropolitan area becomes
more polycentric. These results are in line with the conclusion of Meijers (2008a),
who found that the more polycentric a region was, the less cultural, leisure and
sports amenities were present. It also confirms the doubts raised by Parr (2004;
2008) and Bailey and Turok (2001) that the magnitude of urbanization externalities in
a polycentric metropolitan area is less compared to a monocentric metropolitan area.
From a theoretical perspective, we cannot expect the advantages based on density,
proximity and the easy and sometimes unplanned exchange of information to be
equally present in a metropolitan area in which population is spread over multiple
smaller cities as in one where the population is concentrated in a single large city.
This result means that a collection of cities does not provide a substitute for the
urbanization externalities of a single large city, even though the size of the
population in both metropolitan areas is similar.
4) Polycentricity appears to be more beneficial in smaller (population) metropolitan
areas
Our findings on the interaction-effect could also be interpreted as that the positive
effect of having a relatively more polycentric spatial structure on labor productivity
found here decreases as the population size of the metropolitan area increases. A
possible reason for polycentricity being relatively more beneficial in smaller
metropolitan areas is that perhaps cities in smaller polycentric metropolitan areas are

29
more functionally related than those in larger polycentric metropolitan areas. This
needs to be tested, however.
Research agenda
More generally, the relation between the strength and extent of functional linkages
between cities in a metropolitan area and their performance as a regional urban
system deserves further exploration. Also external linkages between more distant
metropolitan regions require our attention. The idea that such external linkages are
of great importance in explaining metropolitan performance appears to hold in
particular for the largest metropolitan areas as these are the main locations for
knowledge-intensive activities such as the advanced producer services and as such,
the centers in the global network of information and knowledge exchange (Sassen,
1991; Hall and Pain, 2006). In this, it would be interesting to see whether
agglomeration externalities are also shared between even more distant cities. Other
important research issues following from our findings are whether the gap in
urbanization externalities between more polycentric and more monocentric
metropolitan areas is increasing or diminishing over time, whether typical
agglomeration disadvantages are less severe in polycentric metropolitan areas
indeed and whether the effects of spatial structure on productivity levels differ
across sectors.
References Alonso W, 1973, “Urban Zero Population Growth” Daedalus 109, 191-206

30
Anas A, Arnott R, Small K A, 1998, “Urban Spatial Structure” Journal of Economic Literature 36 1426-1464
Bailey, N, Turok, I, 2001, “Central Scotland as a polycentric urban region: useful planning concept or chimera?” Urban Studies 38 697-715
Bertaud A, 2004, “The Spatial Organization of Cities: Deliberate Outcome or Unforeseen Consequence?”, IURD Working Paper Series WP-2004-01, Institute of Urban & Regional Development, Berkeley, CA
Boarnet M G, 1994, “An empirical model of intermetropolitan population and employment growth” Papers in Regional Science 73 135-152
Broersma L, Oosterhaven J, 2009 “Regional Labour Productivity in The Netherlands: Evidence of Agglomeration and Congestion Effects” Journal of Regional Science 49 483-511
Brueckner J K, 2001, “Urban Sprawl: Lessons from Urban Economics” in Brookings-Wharton Papers on Urban Affairs Eds W G Gale, J Rothenberg Pack (Brookings Institution Press, Washington DC) pp 65-89
Brülhart M, Mathys N A (2009), “Sectoral Agglomeration Economies in a Panel of European Regions”, Regional Science and Urban Economics 38, 348-362
Burger M J, Oort van F G, Frenken K, Knaap van der B, 2009, “Networks and Economic Agglomerations” Tijdschrift voor Economische en Sociale Geografie, 100 139-144
Burger M J, Oort van F G, Knaap van der B, 2010, “A treatise of the Geographical Scale of Agglomeration Externalities and the Modifiable Areal Unit Problem” Scienze Regionali (forthcoming).
Capello R, 2000, “The City Network Paradigm: Measuring Urban Network Externalities” Urban Studies 37 1925-1945
Capello R, Camagni R, 2000, “Beyond Optimal City Size: An Evaluation of Alternative Urban Growth Patterns” Urban Studies 37 1479-1496
Cheshire P C, 2006, “Resurgent cities, urban myths and policy hubris: what we need to know” Urban studies 43 1231-1246
Ciccone A, 2002, “Agglomeration effects in Europe” European Economic Review 46 213-227
Ciccone A, Hall R E, 1996, “Productivity and the density of economic activity” American Economic Review 86 54-70
Coe N M, Townsend A R, 1998, “Debunking the Myth of Localized Agglomerations: The Development of a Regionalized Service Economy in South-East England” Transactions of the Institute of British Geographers 23 385-404

31
Combes P P, Mayer T, Thisse J F, 2008 Economic Geography: The Integration of Regions and Nations (Princeton University Press, Princeton, NJ)
Corpataux J, Crevoisier O, 2007, “Economic theories and spatial transformations clarifying the space-time premises and outcomes of economic theories” Journal of Economic Geography 7 285-309
Florida R, Gulden T, Mellander C, 2008, “The rise of the mega-region” Cambridge Journal of Regions, Economy and Society 1 459-476
Fogarty M, Garofolo G, 1988, “Urban Spatial Structure and Productivity Growth in the Manufacturing Sector of Cities” Journal of Urban Economics 23 60-70
Frenken K, Oort van F G, Verburg T, 2007 “Related Variety, Unrelated Variety and Economic Growth” Regional Studies 41 685-697
Fujita, M, Thisse J F, Zenou Y, 1997 “On the endogenous formation of secondary employment centres in a city” Journal of Urban Economics 41 337-357.
Glaeser E L, Kahn M E, 2001, “Decentralized Employment and the Transformation of the American City”, Working paper 8117, National Bureau of Economic Research, Cambridge, MA
Glaeser, E L, Kahn M E, 2004, “Sprawl and urban growth” in Handbook of Regional Science and Urban Economics, Vol. 4 Cities and Geography Eds J V Henderson, J-F Thisse (Elsevier Amsterdam) pp 2481-2527
Goei de B, Burger M J, Kitson M, Oort van F G, 2009, “Functional Polycentrism and Urban Network Development in the Greater South East UK: Evidence from Commuting Patterns” Regional Studies (forthcoming).
Goffette-Nagot, F, Schmitt, B, 1999, “Agglomeration economies and spatial configurations in rural areas” Environment and Planning A 31 1239-1257.
Gordon I, McCann P, 2000, “Industrial Clusters: Complexes, Agglomeration and/or Social Networks?” Urban Studies 37 513-532
Green N, 2007, “Functional Polycentricity: A Formal Definition in Terms of Social Network Analysis” Urban Studies 44 2077-2103
Hall P, 2000, “Global city-regions in the twenty-first century” in Global City Regions: Trends, Theory, Policy Ed. A J Scott (Oxford University Press, Oxford) pp 59–77
Hall P, Pain K, 2006 The polycentric metropolis: learning from mega-city regions in Europe (Earthscan, London)
Hohenberg P, Lees L, 1985 The Making of Urban Europe, 1000-1994 (Harvard University Press, Cambridge, MA).
Isard W, 1956 Location and Space Economy (MIT Press, Cambridge, MA)

32
Johansson B, Quigley J M, 2004, “Agglomeration and networks in spatial economies” Papers in Regional Science 83 165-176
Kim S, 2007, “Changes in the nature of urban spatial structure in the United States, 1890-2000” Journal of Regional Science 47 273-287
Kloosterman R C, Lambregts B, 2001, “Clustering of Economic Activities in Polycentric Urban Regions: The Case of the Randstad” Urban Studies 38 717-732
Kloosterman R C, Musterd S, 2001, “The Polycentric Urban Region: Towards a Research Agenda” Urban Studies 38 623-633
Lambooy J G, 1998, “Polynucleation and Economic Development: The Randstad” European Planning Studies 6 457-466
Lee B, Gordon P, 2007, “Urban spatial structure and economic growth in US Metropolitan Areas”, paper presented at the 46th annual meeting of the Western Regional Science Association, Newport Beach, CA
Meijers E J, 2005, “Polycentric Urban Regions and the Quest for Synergy: Is a Network of Cities More than the Sum of the Parts?” Urban Studies 42 765-781
Meijers E J, 2008a, “Summing small cities does not make a large city: Polycentric Urban Regions and the provision of Cultural, Leisure and Sports Amenities” Urban Studies 45 2323-2342
Meijers E J, 2008b, “Measuring polycentricity and its promises” European Planning Studies 16 1313-1323
Melo P C, Graham DJ, Noland R B, 2009, “A meta-analysis of estimates of urban agglomeration economies” Regional Science and Urban Economics 39 332-342
Nordregio et alia, 2004, ESPON 1.1.1: Potentials for polycentric development in Europe, Project report, Nordregio/ESPON Monitoring Committee, Stockholm/Luxembourg
Office of Management and Budget (OMB), 2000, Standards for defining Metropolitan and Micropolitan Regions, Federal Register, 65, No.249
Oort van F G, 2004, Urban Growth and Innovation, Spatially Bounded Externalities in the Netherlands (Ashgate, Aldershot)
Oort van F G, Burger M J, Raspe O, 2010, “On the Economic Foundation of the Urban Network Paradigm. Spatial Integration, Functional Integration and Economic Complementarities within the Dutch Randstad” Urban Studies (forthcoming)
Parr J B, 2002, “Agglomeration economies: ambiguities and confusions” Environment and Planning A 34 717-731

33
Parr J B, 2004, “The Polycentric Urban Region: A Closer Inspection” Regional Studies 38 231-240
Parr J B, 2005, “Perspectives on the City-Region” Regional Studies 39 555-566
Parr J B, 2008, “Cities and regions: problems and potentials” Environment and Planning A 40 3009-3026
Phelps N A, Fallon R J, Williams C L, 2001, “Small Firms, Borrowed Size and the Urban-Rural Shift” Regional Studies 35 613-624
Phelps, N A, Ozawa T, 2003, “Contrasts in agglomeration: proto-industrial, industrial and post-industrial forms compared” Progress in Human Geography 27 583–604
Richardson H W, 1995, “Economies and diseconomies of agglomeration” in Urban agglomeration and economic growth Ed. H Giersch (Springer, Berlin) pp 123-155
Rosenthal S S, Strange W C, 2004, “Evidence on the nature and sources of agglomeration economies” in Handbook of Regional Science and Urban Economics, Vol. 4 Cities and Geography Eds J V Henderson, J-F Thisse (Elsevier Amsterdam) pp 2119-2171
Sassen, S, 1991, The Global City: New York, London, Tokyo (Princeton University Press, Princeton, NJ)
Sassen S, 2007, “Megaregions: Benefits Beyond Sharing Trains and Parking Lots?” in The Economic Geography of Mega-Regions Ed. K S Goldfeld, (The Policy Research Institute for the Region, Princeton, NJ) pp 59-83
Scott A J, 1988 Metropolis: From the Division of Labor to Urban Form (University of California Press, Berkeley and Los Angeles)
Scott A J, 2000, “Economic geography: the great half-century” Cambridge Journal of Economics 24 483-504
Siegel P, Johnson T, Alwang J, 1995, “Regional Economic Diversity and Diversification” Growth and Change 26 261-284
Stock J H, Yogo M, 2005, “Testing for weak instruments in linear IV regression” in Identification and Inference for Econometric Models: Essays in Honor of Thomas Rothenberg Eds D W K Andrews, J H Stock, (Cambridge University Press, Cambridge) pp 80-108
Storper M, 1997 The Regional World: Territorial Development in a Global Economy (Guilford Press, London and New York)
Stover J F, 1961 American Railroads (The University of Chicago Press, Chicago)
Turok I, Bailey N, 2004, “The Theory of Polynuclear Urban Regions and its Application to Central Scotland” European Planning Studies 12 371-389

34
Transportation Research Board, 2002 Costs of Sprawl – 2000 (National Academy Press, Washington, DC)
Woolridge J M, 2006 Introductory Econometrics: A Modern Approach (Thomson South-Western Educational Publishing, Mason, OH)

35
Notes
1 Only considering incorporated places of at least 5,000 inhabitants in 2006. In cases
where the second largest incorporated place in the metropolitan region did not meet
this threshold, we used its actual size in order to be able to calculate a slope.
2 Following common definitions of such regions (see Kloosterman and Musterd, 2001;
Parr, 2004; Meijers, 2005), although for a definite categorization we require more
knowledge on the level of specialization and the level of interaction.
3 Using census region dummies (covering four broad geographical regions) yielded
similar empirical results.
4 The Anderson canonical correlation statistic is significant in all four specifications,
meaning that the instruments used in these specifications are adequate to identify
the equation. The Cragg-Donald F-statistic tests whether we face a weak-instrument
problem. A set of instruments is defined as weak if the bias of the TSLS estimator,
relative to the bias of the OLS estimator, exceeds the threshold of 10% (Stock and
Yogo, 2005) at the 5% confidence level. As can be obtained from Table 3, this is the
case for all specifications as the value of the Cragg-Donald F-statistic exceeds the
critical values provided by Stock and Yogo (2005). These results are reinforced by the
Shea partial R2 statistic, which is reasonably high for all specifications. In particular,
metropolitan size appears to be well instrumented.
5 In this, it is tested whether the instruments for metropolitan size and spatial
structure are uncorrelated with the disturbance term. As these overidentification test
statistics were non-significant for all four specifications, we cannot reject the null
hypothesis that the instruments are uncorrelated with the disturbance term of the
dependent variable and can be considered valid.

36
Figure 1. Dimensions of regional urban form.

37
Figure 2. Rank-size distributions to measure mono/polycentricity.

38
Table 1. Most monocentric, polycentric, centralised and dispersed metropolitan regions in the U.S.
Rank Most monocentric Most polycentric Most centralised Most dispersed
1 Lincoln, NE Midland-Odessa, TX El Paso, TX Greenville-Spartanburg-Anderson, SC
2 Tallahassee, FL Santa Barbara-Santa Maria, CA
Lincoln, NE Portland-Lewiston-South Portland, ME
3 Jacksonville, FL Johnson City - Kingsport - Bristol (Tri-cities), TN-VA
Phoenix-Mesa-Scottsdale, AZ
Columbia – Newberry, SC
4 El Paso, TX Salt Lake City-Ogden-Clearfield, UT
San Diego-Carlsbad-San Marcos, CA
Pittsburgh-New Castle, PA
5 San Antonio, TX Greenville-Spartanburg-Anderson, SC
Midland-Odessa, TX Youngstown-Warren-East Liverpool, OH-PA

39
Table 2. Descriptive Statistics of Variables (N=113)
Mean Std. dev. Minimum Maximum
Labor Productivity (ln) 11.29 0.197 10.70 11.85
Capital-Labor Ratio (ln) 11.93 0.106 11.73 12.31
Land-Labor Ratio (ln) -3.661 0.732 -5.620 -1.671
Education per Worker (ln) -0.621 0.404 -1.650 0.418
Metropolitan Size (ln) 13.68 0.998 12.43 16.89
Polycentricity (ln) -0.573 0.554 -1.636 2.291
Dispersion (ln) -0.769 0.425 -2.144 -0.124
New England 0.027 0.161 0 1
Middle Atlantic 0.071 0.258 0 1
East North Central 0.177 0.383 0 1
West North Central 0.088 0.285 0 1
South Atlantic 0.159 0.368 0 1
East South Central 0.177 0.383 0 1
West South Central 0.071 0.258 0 1
Mountain 0.088 0.285 0 1
Pacific 0.142 0.350 0 1

40
Table 3. First stage results of TSLS regressions on metropolitan labor productivity
Metropolitan Size
Polycentricity Dispersion All
Instruments Population ‘50 Railroad
Polycentricity ’50 Railroad
Dispersion ’50 Agr. land use
Population ‘50 Polycentricity ’50 Dispersion ’50 Railroad Agr. land use
Relevance
Anderson canon. corr.
79.28** 44.63** 35.13** 36.89**
Cragg-Donald F-test
114.05** 31.66** 22.11* 9.31**
Critical value CD (10% relative bias)
19.93 19.93 19.93 6.06
Shea Partial R2
- Metropolitan size
0.70 0.75
- Polycentricity 0.40 0.43
- Dispersion 0.31 0.33
Validity
Sargan statistic 0.29 0.08 0.00 1.00
Basmann statistic 0.25 0.07 0.00 0.86
Exogeneity
Wu-Hausman F-test
4.78* 0.71 0.02 1.85
Durbin-Wu-Hausman Chi-Square test
5.31* 0.83 0.02 6.24
Observations 113 113 113 113
Regressors 14 14 14 14
Instruments 15 15 15 16
Excluded Instruments
2 2 2 5
**p<0.01, *p<0.05

41
Table 4: OLS and TSLS on Metropolitan Labor Productivity (2006)
Model 1 OLS
Model 2 TSLSa
Intercept 11.36 (.110)** 11.28 (.110)**
Capital-Labor Ratio (ln) 0.754 (.232)** 0.843 (.222)**
Land-Labor Ratio (ln) 0.013 (.032) -0.012 (.032)
Education per Worker (ln) -0.007 (.050) -0.010 (.047)
Metropolitan Size (ln) 0.107 (.020)** 0.078 (.023)**
Polycentricity (ln) b 0.055 (.023)* 0.051 (.022)*
Dispersion (ln) c 0.024 (.039) 0.030 (.036)
Census division dummies YES YES
Number of Observations 113 113
F-statistic 13.48 12.01
R2 (OLS) / Centered R2 (TSLS)
0.66 0.65
Root MSE 0.12 0.12
White-Koenker (OLS) / Pagan-Hall test (TSLS)
22.7 19.8
Ramsey RESET test 0.83 0.03
**p<0.01, *p<0.05 Standard errors between parentheses; all non-dummy variables are mean-centered aInstruments used in the first stage of the regression for the endogenous variable metropolitan population b The higher the value, the more polycentric. The lower the value, the more monocentric, c The higher the value, the more dispersed. The lower the value, the more centralized.

42
Table 5: OLS and 2SLS on Metropolitan Labor Productivity (2006) – Interaction Effects
Model 3 OLS
Model 5 TSLSa
Intercept 11.33 (.110)** 11.26 (.108)**
Capital-Labor Ratio (ln) 0.752 (.229)** 0.824 (.216)**
Land-Labor Ratio (ln) 0.002 (.031) -0.018 (.031)
Education per Worker (ln) 0.015 (.049) 0.015 (.045)
Metropolitan Size (ln) 0.094 (.021)** 0.072 (.023)**
Polycentricity (ln) 0.037 (.023) 0.033 (.022) #
Dispersion (ln) 0.038 (.039) 0.047 (.037)
Metropolitan Size*Polycentricity
-0.059 (.021)** -0.063 (.020)**
Metropolitan Size*Dispersion -0.008 (.024) -0.016 (.023)
Census division dummies YES YES
Number of Observations 113 113
F-statistic 13.48 12.11
R2 (OLS) / Centered R2 (TSLS)
0.68 0.68
Root MSE 0.12 0.11
White-Koenker (OLS) / Pagan-Hall test (TSLS)
21.11 20.32
Ramsey RESET test 0.07 1.09
**p<0.01, *p<0.05 Standard errors between parentheses; all non-dummy variables are mean-centered aInstruments used in the first stage of the regression for the endogenous variable metropolitan population

43
Appendix A. Selection of metropolitan regions.
In principle, all CSAs as well as MSAs not part of a CSA with a total population of over
250,000 inhabitants in 2006 located in the U.S. continental states were included in
the analysis. Metropolitan areas are defined by the U.S. Office of Management and
Budget (OMB), and the latest revised version (2007) of the 2000 definitional
standards was used. An MSA contains a core urban area with a population of 50,000
or more. It consists of one or more counties and includes the counties containing the
core urban area, as well as any adjacent counties of which more than 25% of
employed residents work in the urban core. MSAs that are adjacent may be joined in
order to form a Combined Statistical Area if the employment interchange is at least
25. Adjacent MSAs that have an employment interchange measure of at least 15 and
less than 25 are combined if local opinion favors combination (OMB, 2000). There are
also micropolitan areas that contain an urban core with a population of at least
10,000 but less than 50,000. These are not considered here, unless they form part of
a CSA that is furthermore composed of at least one MSA.
Some regions had to be left out for other reasons:
1) CSAs are composed of metropolitan statistical areas and/or micropolitan
statistical areas. Often, data was not available for micropolitan areas. In a
limited number of cases, this meant that no reliable data for the CSA could be
retrieved. There were a couple of CSAs, where more than 20% of their
population was located in a micropolitan statistical area, which were left out
for this reason. These were Charlotte-Gastonia-Salisbury, NC-SC; Fort Wayne –
Huntington- Auburn, IN; and, Lexington-Fayette--Frankfort--Richmond, KY.

44
2) New Orleans was left out as the data appeared biased as a result of Hurricane
Katrina.
As argued in the text, polycentric conurbations had to be left out. These include:
Albany-Schenectady-Amsterdam, NY; Charleston-North Charleston, SC; Dallas-Fort
Worth, TX; Davenport-Moline-Rock Island, IA-IL; Fayetteville-Springdale-Rogers, AR-
MO; Hartford-West Hartford-East Hartford, CT; McAllen-Edinburg-Mission, TX; Miami-
Fort Lauderdale-Miami Beach, FL; Minneapolis-St. Paul- St. Cloud, MN-WI; Palm Bay-
Melbourne-Titusville, FL; Provo-Orem, UT; Sarasota-Bradenton-Punta Gorda, FL;
Scranton—Wilkes-Barre, PA; Tampa-St. Petersburg-Clearwater, FL; Virginia Beach-
Norfolk-Newport N., VA-NC.

Publications in the ERIM Report Series Research in Management ERIM Research Program: “Organizing for Performance” 2009 On the Specification of the Gravity Model of Trade: Zeros, Excess Zeros and Zero-Inflated Estimation Martijn J. Burger, Frank G. van Oort, and Gert-Jan M. Linders ERS-2009-003-ORG http://hdl.handle.net/1765/14614 The Current State of Research on Networks in China’s Business System Johannes Meuer and Barbara Krug ERS-2009-007-ORG http://hdl.handle.net/1765/14842 Encountered Problems and Outcome Status in Nascent Entrepreneurship A. Marco van Gelderen, B. Pankaj Patel, and A. Roy Thurik ERS-2009-008-ORG http://hdl.handle.net/1765/14913 The Ethics of Organizations: A Longitudinal Study of the U.S. Working Population Muel Kaptein ERS-2009-018-ORG http://hdl.handle.net/1765/15405 From Symbolic to Substantive Documents: When Business Codes of Ethics Impact Unethical Behavior in the Workplace Muel Kaptein ERS-2009-021-ORG http://hdl.handle.net/1765/15909 Knowledge Management as a Strategic Tool to Foster Innovativeness of SMEs Haibo Zhou, and Lorraine Uhlaner ERS-2009-025-ORG http://hdl.handle.net/1765/15913 Knowledge Management in the SME and its Relationship to Strategy, Family Orientation and Organization Learning Haibo Zhou, and Lorraine Uhlaner ERS-2009-026-ORG http://hdl.handle.net/1765/15914 Defining Respectful Leadership: What it is, how it can be measured, and another glimpse at what it is related to Niels van Quaquebeke, and Tilman Eckloff ERS-2009-027-ORG http://hdl.handle.net/1765/15942 Blue Ocean versus Competitive Strategy: Theory and Evidence Andrew Burke, André van Stel, and Roy Thurik ERS-2009-030-ORG http://hdl.handle.net/1765/16037 Pattern matching Tony Hak and Jan Dul ERS-2009-034-ORG http://hdl.handle.net/1765/16203 Replication Tony Hak and Jan Dul ERS-2009-035-ORG http://hdl.handle.net/1765/16204

Theory-Building With Cases Tony Hak and Jan Dul ERS-2009-036-ORG http://hdl.handle.net/1765/16205 Theory-Testing With Cases Tony Hak and Jan Dul ERS-2009-036-ORG http://hdl.handle.net/1765/16206 Functional Polycentrism and Urban Network Development in the Greater South East UK: Evidence from Commuting Patterns, 1981-2001 B. de Goei, M.J. Burger, F.G van Oort, and M. Kitson ERS-2009-038-ORG http://hdl.handle.net/1765/16213 On the Economic Foundation of the Urban Network Paradigm: Spatial Integration, Functional Integration and Economic Complementarities within the Dutch Randstad F.G. van Oort, M.J. Burger, and O. Raspe ERS-2009-039-ORG http://hdl.handle.net/1765/16214 Gender Pay Differences in the European Union: Do Higher Wages Make Up For Discrimination? Erik Canton and Ingrid Verheul ERS-2009-041-ORG http://hdl.handle.net/1765/16215 What do We Know about Social Entrepreneurship: An Analysis of Empirical Research Brigitte Hoogendoorn, Enrico Pennings, and Roy Thurik ERS-2009-044-ORG http://hdl.handle.net/1765/16558 Developing Innovative Competences in an Emerging Business System: New Private Enterprises in Hangzhou’s Software Industry Mark Greeven and Zhao Xiaodong ERS-2009-045-ORG http://hdl.handle.net/1765/16599 From Inaction to External Whistleblowing: The Influence of the Ethical Culture of Organizations on Employee Responses to Observed Wrongdoing Muel Kaptein ERS-2009-047-ORG http://hdl.handle.net/1765/16600 What Turns Knowledge into Innovative Products? The Role of Entrepreneurship and Knowledge Spillovers Joern H. Block, Roy Thurik, and Haibo Zhou ERS-2009-049-ORG http://hdl.handle.net/1765/16769 The X-Factor: On the Relevance of Implicit Leadership and Followership Theories for Leader-Member Exchange (LMX) Agreement Suzanne van Gils, Niels van Quaquebeke, and Daan van Knippenberg ERS-2009-055-ORG http://hdl.handle.net/1765/17429 Entrepreneurial Finance in France: The Persistent Role of Banks Sylvie Cieply and Marcus Dejardin ERS-2009-056-ORG http://hdl.handle.net/1765/17430

Spatial Structure and Productivity in U.S. Metropolitan Areas Evert Meijers and Martijn Burger ERS-2009-057-ORG http://hdl.handle.net/1765/17431
A complete overview of the ERIM Report Series Research in Management:
https://ep.eur.nl/handle/1765/1
ERIM Research Programs:
LIS Business Processes, Logistics and Information Systems ORG Organizing for Performance MKT Marketing F&A Finance and Accounting STR Strategy and Entrepreneurship