Embed Size (px)
Citation preview

City of Johannesburg Metropolitan Municipality
Spatial Development Framework 2040
In collaboration with: Iyer Urban Design, UN Habitat, Urban Morphology and Complex Systems Institute and the French Development Agency
City of Johannesburg: Department of Development Planning 2016

2 Spatial Development Framework 2016/17
Table of Contents Glossary of Terms.................................................................................................................................... 5
Abbreviations and Acronyms .................................................................................................................. 8
1. Foreword ....................................................................................................................................... 10
2. Executive Summary ....................................................................................................................... 11
Existing Spatial Structure of Johannesburg and its Shortcomings ........................................ 11 2.1.
Transformation Agenda: Towards a Spatially Just City ......................................................... 12 2.2.
Spatial Vision: A Compact Polycentric City ........................................................................... 12 2.3.
Spatial Framework and Implementation Strategy ................................................................ 17 2.4.
An integrated natural structure .................................................................................... 17 2.4.1.
Transformation Zone .................................................................................................... 17 2.4.2.
The Spatial Economy ..................................................................................................... 18 2.4.3.
A Consolidation Zone .................................................................................................... 19 2.4.4.
Reinforcing the Urban Development Boundary and defining development zones ...... 19 2.4.5.
City-wide spatial policy regulations .............................................................................. 19 2.4.6.
Measuring urban performance ..................................................................................... 21 2.4.7.
Capital Investment Focus .............................................................................................. 21 2.4.8.
3. Reviewing the SDF ......................................................................................................................... 22
The SDF as a Transformative Process .............................................................................. 22 3.1.
SDF Review Process ....................................................................................................... 23 3.1.1.
Applying this SDF in relation to regional and local spatial plans .................................. 23 3.1.2.
Nodal boundaries and the Urban Development Boundary .......................................... 24 3.1.1.
Spatial Policy/Legislative Context ......................................................................................... 25 3.2.
National Development Plan .......................................................................................... 25 3.2.1.
Spatial Planning and Land Use Management Act (SPLUMA) ........................................ 25 3.2.2.
Gauteng Transformation Modernisation and Reindustrialisation Strategy (TMR) ....... 26 3.2.3.
Gauteng Environmental Management Framework ...................................................... 27 3.2.4.
25 Year Gauteng Integrated Transport Master Plan ..................................................... 27 3.2.5.
Gauteng Spatial Development Framework ................................................................... 28 3.2.6.
Johannesburg Growth and Development Strategy 2040 (GDS 2040) .......................... 28 3.2.7.
4. Johannesburg: Global, African, Regional and Local Context ........................................................ 29
A Role in Africa ...................................................................................................................... 29 4.1.
The Importance of the Gauteng City-Region ........................................................................ 32 4.2.

3 Spatial Development Framework 2016/17
Climate Change: Risks and Opportunities for Johannesburg ................................................ 33 4.3.
Climate change adaptation ........................................................................................... 34 4.3.1.
A Dynamic, Changing City ..................................................................................................... 35 4.4.
5. The Current City ............................................................................................................................ 38
Urbanisation .......................................................................................................................... 38 5.1.
The City’s Spatial Economy ................................................................................................... 40 5.2.
Housing Backlog: Providing Affordable Housing for the Poor and Improving the Lives of 5.3.
Informal Dwellers .............................................................................................................................. 44
Existing Spatial Structure ...................................................................................................... 48 5.4.
Shortcomings of the Current City Structure ......................................................................... 49 5.5.
Urban sprawl and limiting densities ............................................................................. 50 5.5.1.
Spatial inequality and the job-housing mismatch ......................................................... 52 5.5.2.
Fragmentation and spatial disconnection .................................................................... 55 5.5.3.
Limited diversity and inefficient land use patterns ...................................................... 57 5.5.4.
Increasing pressure on the natural environment ......................................................... 60 5.5.5.
Implications of the Prevailing Development Pattern ............................................................ 64 5.6.
6. A Future City ................................................................................................................................. 65
Spatial Vision ......................................................................................................................... 65 6.1.
A Compact Polycentric Urban Model ............................................................................ 66 6.1.1.
Transformation Themes and Spatial Opportunities ............................................................. 71 6.2.
The Compact City .......................................................................................................... 71 6.2.1.
The Inclusive City .......................................................................................................... 73 6.2.2.
The Connected City ....................................................................................................... 75 6.2.3.
The Resilient City ........................................................................................................... 80 6.2.4.
The Generative City ....................................................................................................... 82 6.2.5.
7. Spatial Framework ........................................................................................................................ 86
An Integrated Natural Structure as a Provider of Ecosystem Services ................................. 88 7.1.
Transformation Zone ............................................................................................................ 92 7.2.
A Strong, Accessible and Generative Metropolitan Core ............................................. 92 7.2.1.
Corridors of Freedom .................................................................................................... 99 7.2.2.
Unlocking Soweto as a True City District .................................................................... 103 7.2.3.
Developing a Randburg – OR Tambo Corridor ............................................................ 108 7.2.4.
Unlocking the Mining Belt ........................................................................................... 112 7.2.5.

4 Spatial Development Framework 2016/17
The Spatial Economy: Nodes as Centres for Economic Growth ......................................... 116 7.3.
Consolidation Zone ............................................................................................................. 121 7.4.
Deprivation areas ........................................................................................................ 123 7.4.1.
Established suburban built-up areas ........................................................................... 131 7.4.2.
Re-enforcing the Urban Development Boundary ............................................................... 133 7.5.
Summary of Development Zones........................................................................................ 137 7.6.
8. Spatial Policies, Design Guidelines and Mechanisms.................................................................. 139
Housing ............................................................................................................................... 139 8.1.
Informal Settlements, back yarding and subsidiary dwelling units ............................ 140 8.1.1.
Inclusionary housing ................................................................................................... 141 8.1.2.
City- Wide Spatial Policy Regulations and Guidelines ......................................................... 143 8.2.
Form-Based Codes to supplement zoning in Transformation Zones .......................... 143 8.2.1.
Urban design concepts ................................................................................................ 144 8.2.2.
Public environment ..................................................................................................... 150 8.2.3.
Nodal Guidelines ......................................................................................................... 151 8.2.4.
Density Regulations..................................................................................................... 157 8.2.5.
Land readjustment ...................................................................................................... 161 8.2.6.
Process and Quality Control ........................................................................................ 162 8.2.7.
Land Value Capture ..................................................................................................... 162 8.2.8.
Urban Performance Measures and guidelines for new developments .............................. 165 8.3.
9. Capital Investment and Growth Strategy ................................................................................... 166
Capital Investment Focus ................................................................................................... 166 9.1.
Capital Investment and Growth Management Framework ........................................ 167 9.1.1.
Annexure 1: Urban Development Boundary Amendment ................................................................. 171

5 Spatial Development Framework 2016/17
Glossary of Terms
1 Gauteng Draft Inclusionary Housing Bill, 2012
2 http://formbasedcodes.org/definition
Affordable Housing A dwelling where the total costs do not exceed 30% of a household's gross income including taxes and insurance for owners, and utility costs1 (definition from the Gauteng Draft Inclusionary Housing Bill).
Backyard Dwelling
Dwelling Units subsidiary to a main residential dwelling unit.
Compact Polycentricity
An urban structure that is characterized by a dense urban core interlinked by efficient transit networks to dense complementary sub-centres.
Consolidation Zone Areas neither outside the Urban Development Boundary, nor inside nodes or the Transformation Zone. These areas are developable; but are not a high priority for capital investment, except where there is a backlog of services.
Corridors of Freedom
Johannesburg’s development corridors based on public transport corridors and transit oriented development, with the potential to generate substantial compact economic and housing development around strategic points along the primary movement axis. They include the Turffontein, Louis Botha, Empire-Perth and Soweto corridors.
Densification
A process of development that intensifies urban land use within the area.
Development Corridor
Not to be confused with a transit corridor. A demarcated area along public transit routes in which high intensity, mixed use and mixed income development is promoted. For example, the Corridors of Freedom.
Engineering Infrastructure
Engineered services such as roads, electricity, water, sewers and storm water systems. Sometimes referred to as ‘hard services’.
Entropy
A measure/ indicator of land use mix.
Form Based Codes A land development regulation that fosters predictable built results and a high-quality public realm by using physical form (rather than separation of uses) as the organising principle for the code. A form-based code is a regulation, not a mere guideline, adopted into city, town, or county law.2
Inclusionary Housing
A housing programme that requires developers to dedicate a certain percentage of new housing developments to low income and low middle income households at affordable housing cost (Definition from the Gauteng Draft inclusionary Housing Bill).
In-situ upgrading Upgrading is a staged process of improvement of quality of life in informal

6 Spatial Development Framework 2016/17
3 Department of Human Settlements. (2016). Definitions. Retrieved April 28, 2016, from National Upgrading
Support Programme: http://www.upgradingsupport.org/content/page/definitions
settlements, based on incremental provision of services and tenure. It should seek to maximise in-situ development in appropriate areas and minimise relocation. An effective improvement process is built on close community participation and cooperation, aiming to strengthen livelihoods strategies of the poor. Housing is provided by a variety of methods, including self-build, People’s Housing Process, social housing or affordable rental, individual subsidy or consolidation subsidy.3
Job Density
The number of jobs in a given area, calculated as Jobs/ km2
Job- Housing Mismatch
A spatial distribution whereby the location and concentration of jobs does not match/ correlate with that of where people live.
Land Use Diversification
A mixing of land uses.
Low Cost Housing
Housing catering to low income households, which are households earning between R1501 and R3500 per month (as defined in the Gauteng Inclusionary Housing Bill).
Low Income Housing Housing catering to low income households, which are households earning between R1501 and R3500 per month (as defined in the Gauteng Inclusionary Housing Bill).
Mobility Spine/Corridor
An arterial (road) along which through traffic flows with minimum interruption (focus on providing mobility). More often than not it will be the main arterial road between major nodes or between nodes and the freeway and motorway system (Definition from 2009/10 SDF).
Node A well-defined and legible urban environment where highly accessible, mixed and compatible land uses are concentrated and serviced.
Polycentricity An urban structure that is characterised by more than one self-sufficient urban centre that are interconnected by transit links.
Population Density
The number of people in a given area, calculated as people per km2
Precinct Plan
A development plan and guidelines for a localised area, taking directive from higher order plans (RSDFs, UDFs and SAFs).
Public Transit Infrastructure
Public Assets/ Property related to public transport use, such as rail, buses, bus stops and stations and rail stations.
Residential Density
The number of housing units in a given area, calculated as dwelling units per hectare (Du/ha) and calculated per erf.

7 Spatial Development Framework 2016/17
Social Housing
A rental or co-operative housing option for low to medium income households which requires institutionalised management which is provided by accredited Social Housing Institutions or in accredited social housing projects in designated areas.
Social Infrastructure
Assets that accommodate social services, such as schools, libraries, clinics and public facilities. Sometimes referred to as ‘soft’ services or infrastructure.
Spatial Discontinuity
A spatial disruption in the urban structure and logic.
Spatial Inequality
Unequal access to urban opportunities as a result of spatial distribution.
Sprawl
A development pattern that disperses development versus focusing/ concentrating it.
Transformation Zone
Areas defined in this SDF where capital investment is prioritised for future urban intensification and expansion, as they have the capacity to trigger positive effects on a city-wide scale. These are equivalent to Integration Zones, defined in the Built Environment Performance Plan (BEPP). Transformation Zones also indicate areas where the development of detailed spatial plans, where they don’t exist already, will be prioritised. They include: The Inner City, Corridors of Freedom, Randburg – OR Tambo Corridor, Mining Belt and Soweto.
Transit Corridor Not to be confused with development corridor. A corridor connecting two areas of the city with efficient transit routes (road based or public transit). Transit corridors connect two or more areas of development, and do not promote development along their length. A Gautrain or BRT route for example that connects two distant areas would draw development around their stations, and not along the entire length of the route. This applies to mobility spines/corridors, too.
Transit Oriented Development
An approach to development that focuses and intensifies development around public transport facilities such as public transit stations, that promotes walkable, mixed use, dense, urban form and a high quality public environment.

8 Spatial Development Framework 2016/17
Abbreviations and Acronyms
BEPP - Built Environment Performance Plan
BRICS - Brazil, Russia, India, China and South Africa
BRT - Bus Rapid Transit
CBA - Critical Biodiversity Area
CBD - Central Business District, in this case, the Johannesburg Inner City
CIPA - Capital Investment Priority Area
CoJ - City of Johannesburg Metropolitan Municipality
DED - Department of Economic Development, City of Johannesburg
Du/ha - Dwelling units per hectare
EIA - Environmental Impact Assessment
ESA - Ecological Support Areas
GCRO- Gauteng City Region Observatory
GDP - Gross Domestic Product
GDS - Growth and Development Strategy
GEMF - Gauteng Environmental Management Framework
GSDF - Gauteng Spatial Development Framework
ICHIP - Inner City Housing Implementation Plan
IDP - Integrated Development Plan
ITN - Integrated Transport Network
JSIP - Johannesburg Strategic Infrastructure Platform
MFMA - Municipal Finance Management Act (No. 56 of 2003)
MSA - Municipal Systems Act, 2000 (Act No. 32 of 2000)
MSDF - Municipal Spatial Development Framework
NCCR - National Climate Change Response White Paper
NDP - National Development Plan
NUSP - The National Upgrading Support Programme
PP - Precinct Plan
PRASA - Passenger Rail Agency of South Africa
RSDF - Regional Spatial Development Framework
SAF - Strategic Area Framework
SDF - Spatial Development Framework
SHSUP - Sustainable Human Settlements Urbanisation Plan, City of Johannesburg

9 Spatial Development Framework 2016/17
SPLUMA- The Spatial Planning and Land Use Management Act, 2013 (No. 16 of 2013)
SPRE - Special Programme for Relocation of Evictees
TMR - Transformation Modernisation and Re-Industrialisation strategy
TOD - Transit Oriented Development
UDF - Urban Development Framework
UISP - Upgrading Informal Settlements Programme
UMI - Urban Morphology and Complex Systems Institute

10 Spatial Development Framework 2016/17
1. Foreword
To follow.

11 Spatial Development Framework 2016/17
2. Executive Summary
Existing Spatial Structure of Johannesburg and its Shortcomings 2.1.
Spatial inequality remains a defining characteristic of the settlement pattern of Johannesburg. The
location and concentration of jobs does not match that of where people live. This job-housing
mismatch significantly contributes to inequality in the city as- for many residents- access to
economic opportunities is stifled by costly and distant commuting.
Some of the highest densities of housing, the ‘townships’ inherited from apartheid spatial policies,
are also some of the most deprived areas in the city, with little land use diversity (mainly residential),
and located far from areas of economic opportunity. There are also two major spatial discontinuities
in the city structure that present significant areas of opportunity: the mining belt, which has become
a symbol of north-south segregation, and the vacant tracts of undeveloped land in the north east of
the city (Glen Austin/Austin View and Modderfontein) with the potential to improve connection
between the City of Johannesburg and its eastern neighbour, Ekurhuleni.
Post-apartheid housing delivery has arguably exacerbated apartheid spatial development patterns,
by building housing in areas far from economic activity, with the availability of land being the
primary logic behind their location. The private sector, through car-oriented developments (for
example malls, gated residential estates and office parks) has further aggravated spatial segregation.
Continuing to meet development demand in this manner not only exacerbates existing socio-
economic disparities and spatial inequality, but also places significant pressure on the natural
environment and reduces the efficiency and increases the cost of infrastructure provision (both to
build, and to maintain over the long term).
The Spatial Development Framework thus seeks to address five major issues in Johannesburg’s
spatial and social landscape:
Increasing pressure on the natural environment and green infrastructure.
Urban sprawl and fragmentation.
Spatial inequalities and the job-housing mismatch.
Exclusion and disconnection emanating from:
o high potential underused areas (the mining belt and the Modderfontein area);
o securitisation and gated developments, and disconnected street networks (high cul-
de-sac ratios and low intersection densities).
Inefficient residential densities and land use diversity.

12 Spatial Development Framework 2016/17
Transformation Agenda: Towards a Spatially Just City 2.2.
The SDF for Johannesburg 20404 is a city-wide spatial policy document that identifies the main
challenges and opportunities in the city, sets a spatial vision for the future city, and outlines a set of
strategies to achieve that vision.
Importantly, along with providing a spatial vision, the SDF defines the strategic spatial areas to be
used in the City’s capital investment prioritisation model (Johannesburg Strategic Infrastructure
Platform – JSIP). This will ensure that infrastructure investment is directed to areas with the highest
potential to positively impact on the development trajectory of the city as defined in this SDF.
The core objective of the SDF 2040 is to create a spatially just world class African city. The SDF 2040
is premised on spatial transformation, defined through the principles of equity, justice, resilience,
sustainability and urban efficiency which it seeks to translate into a development policy.
The SDF is not a static master plan; it is rather a dynamic model of strategic planning that will be
cyclically reviewed, adjusting its focus and direction based on city transformation that takes place on
the ground.
Spatial Vision: A Compact Polycentric City 2.3.
The spatial transformation vision of the SDF 2040 seeks to create a spatially just world class African
city based on a compact polycentric growth model. The model is based on an exercise testing three
development scenarios, each hypothesising the growth of Johannesburg from 4.3 million to 7 million
people by 2040. The first model tested describes a sprawled scenario with dispersed growth. The
second describes a ‘linear development’ scenario where future development occurs along an
expansive public transport network (corridor development) linking peripheral marginalised areas of
the city, through vast development corridors to the Inner City. The third scenario is a compact
polycentric model which concentrates growth in a compact urban core, around transformation areas
and key urban and transit oriented development nodes. The compact polycentric city model
performed significantly better than the other two in terms of economic, environmental and social
indicators.
Therefore, the spatial vision of the SDF 2040 is a compact polycentric city. Here the Inner City
would form the strong urban core linked by efficient public transport to dense, mixed use
(residential and commercial), sub-centres, situated within a protected and integrated natural
environment.
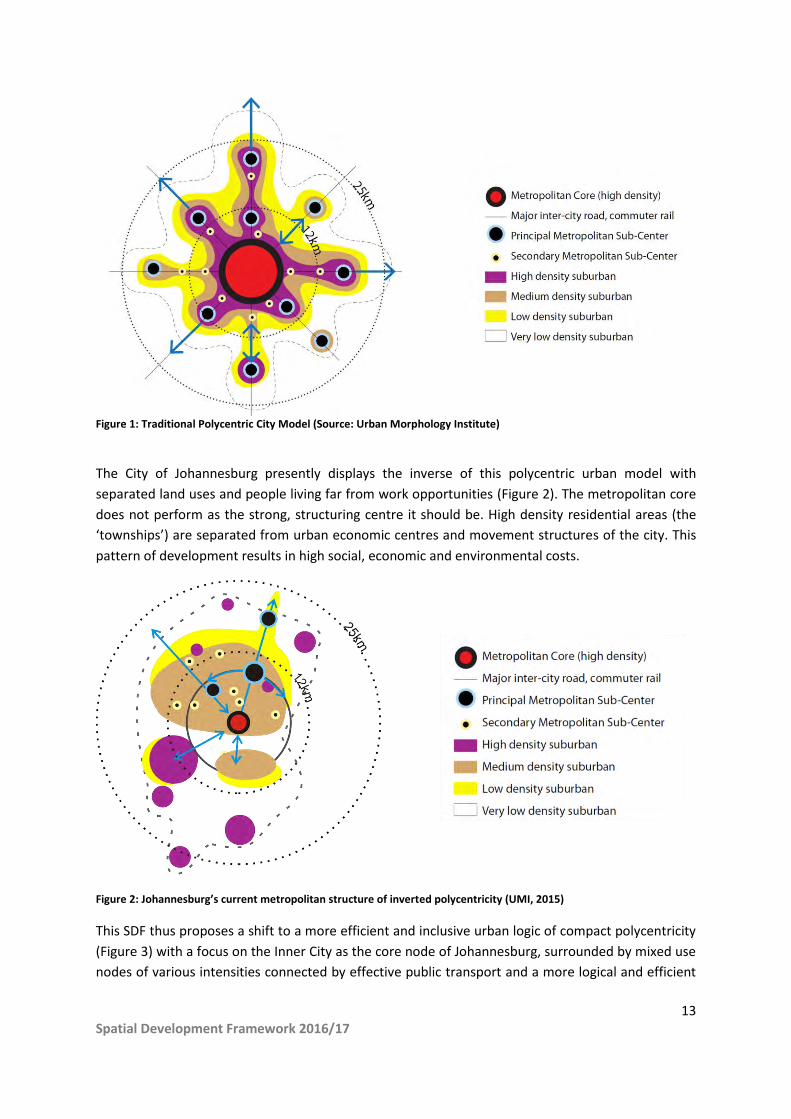
The development model below (Figure 1) is a diagram of a traditional polycentric city with a strong
core, connected to economic sub centres by efficient public transit, with high housing densities
surrounding cores and gradually lower densities further from cores.
4 While SPLUMA dictates that the SDF should indicate a 5 and a 10-20 year vision, this SDF has taken a 25 year
view in line with the City’s GDS 2040.
13 Spatial Development Framework 2016/17
Figure 1: Traditional Polycentric City Model (Source: Urban Morphology Institute)
The City of Johannesburg presently displays the inverse of this polycentric urban model with
separated land uses and people living far from work opportunities (Figure 2). The metropolitan core
does not perform as the strong, structuring centre it should be. High density residential areas (the
‘townships’) are separated from urban economic centres and movement structures of the city. This
pattern of development results in high social, economic and environmental costs.
Figure 2: Johannesburg’s current metropolitan structure of inverted polycentricity (UMI, 2015)
This SDF thus proposes a shift to a more efficient and inclusive urban logic of compact polycentricity
(Figure 3) with a focus on the Inner City as the core node of Johannesburg, surrounded by mixed use
nodes of various intensities connected by effective public transport and a more logical and efficient
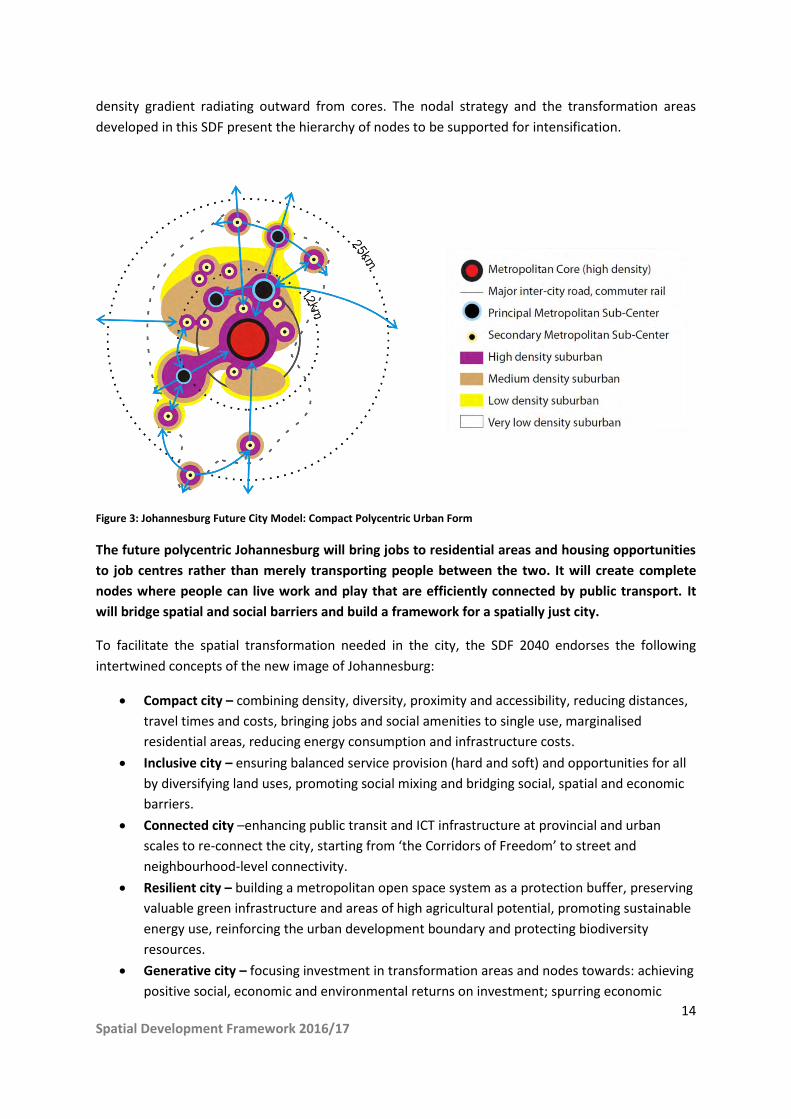
14 Spatial Development Framework 2016/17
density gradient radiating outward from cores. The nodal strategy and the transformation areas
developed in this SDF present the hierarchy of nodes to be supported for intensification.
Figure 3: Johannesburg Future City Model: Compact Polycentric Urban Form
The future polycentric Johannesburg will bring jobs to residential areas and housing opportunities
to job centres rather than merely transporting people between the two. It will create complete
nodes where people can live work and play that are efficiently connected by public transport. It
will bridge spatial and social barriers and build a framework for a spatially just city.
To facilitate the spatial transformation needed in the city, the SDF 2040 endorses the following
intertwined concepts of the new image of Johannesburg:
Compact city – combining density, diversity, proximity and accessibility, reducing distances,
travel times and costs, bringing jobs and social amenities to single use, marginalised
residential areas, reducing energy consumption and infrastructure costs.
Inclusive city – ensuring balanced service provision (hard and soft) and opportunities for all
by diversifying land uses, promoting social mixing and bridging social, spatial and economic
barriers.
Connected city –enhancing public transit and ICT infrastructure at provincial and urban
scales to re-connect the city, starting from ‘the Corridors of Freedom’ to street and
neighbourhood-level connectivity.
Resilient city – building a metropolitan open space system as a protection buffer, preserving
valuable green infrastructure and areas of high agricultural potential, promoting sustainable
energy use, reinforcing the urban development boundary and protecting biodiversity
resources.
Generative city – focusing investment in transformation areas and nodes towards: achieving
positive social, economic and environmental returns on investment; spurring economic
15 Spatial Development Framework 2016/17
growth and job creation and enhancing public space and promoting sustainability (social,
environmental and economic).
16 Spatial Development Framework 2016/17
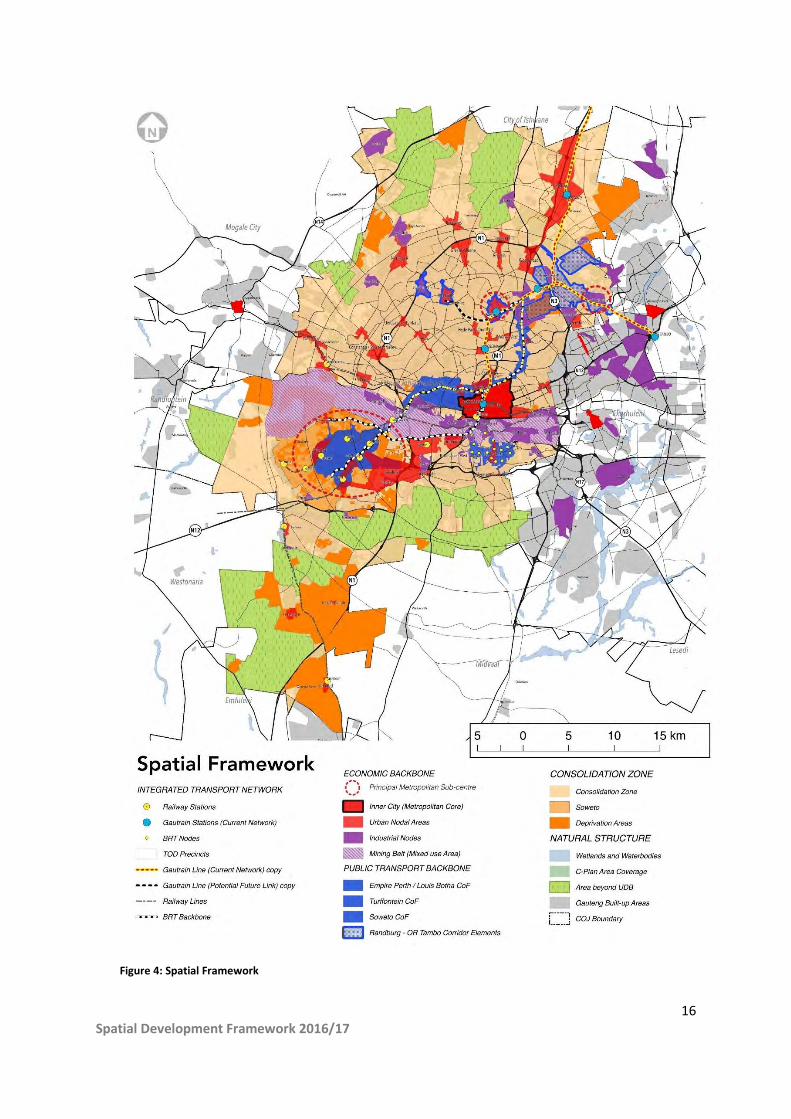
Figure 4: Spatial Framework

17 Spatial Development Framework 2016/17
Spatial Framework and Implementation Strategy 2.4.
The SDF 2040 sets the guiding vision and then builds a concrete strategy for its realisation. The
spatial strategy is translated into the following steps for implementation:
Defining the key elements of the spatial framework (Figure 4) and strategies for them.
Outlining spatial policy regulations and guidelines.
Measuring urban performance.
A spatially directed capital investment focus.
These strategies are discussed under the relevant headings below.
An integrated natural structure 2.4.1.
The natural environment is an essential element in the structuring of the future city. It is the
environment around which all planning, development and land use decisions should be made. The
natural structure should be seen as an irreplaceable city asset that provides valuable ecosystem
services and not merely as unused land available for development. Protecting these areas is not
done for the sake of conservation alone, but to make surrounding developed parts of the city more
sustainable, liveable and valuable (socially, financially and in terms of green infrastructure). As such,
the protection of the City’s natural assets must be a starting point for all development.
Transformation Zone 2.4.2.
The Transformation Zone includes areas where investment is prioritised for future urban
intensification and growth, as they have the capacity to trigger positive effects on a metropolitan
scale. The Transformation Zone also indicates areas where the development of detailed spatial
plans, where they don’t exist already, will be prioritised.
Strengthening the metropolitan core – Through Inner City Transformation Roadmap and Inner City
Housing Implementation Plan, building on the opportunities of the CBD as a dense economic core of
the city and tackling issues of fragmented developments, crime, ‘bad buildings’ and lack of
affordable housing. The strategy suggests creating compact precincts of inclusive residential
densification structured around public transit and economic activity. An investment programme in
social facilities and engineering infrastructure to support development is critical. It further supports
economic growth in the Inner City through various measures. The strategy proposes consolidating
the Inner City through a public space/street network and expanding it towards the southern
industrial area and the Turffontein Corridor of Freedom.
The Corridors of Freedom – Consolidating growth and development opportunities around existing
and future public transport nodes, starting from the Corridors of Freedom linking Soweto, through
the Inner City, to Sandton (along Empire-Perth and Louis Botha Avenues) and linking Turffontein into
the Inner City. This will also include a focus on transit oriented development nodes, including
Gautrain, Rea Vaya (BRT) and PRASA stations.
18 Spatial Development Framework 2016/17
Unlocking Soweto as a True City District – Diversifying and intensifying Soweto to address its largely
residential nature by developing mixed land uses (particularly economically productive, job creating
ones) and social services, making use of its good street pattern and public transport network. The
strategy is to develop Soweto into a series of self-sufficient mixed-use nodes (starting around public
transit stations and nodes) as drivers of economic growth and job creation, allowing Soweto to
function as a liveable city district in its own right with access to jobs and the full array of urban
amenities.
Developing a Randburg-OR Tambo Development Corridor – Establishing a strategic connection
between the northern parts of the city (Randburg, Sandton and Alexandra) and Ekurhuleni, to the
OR Tambo Airport and its surrounding Aerotropolis; incorporating the Modderfontein, Frankenwald
and surrounding areas; develop Alexandra into an intensive, liveable mixed-use area well-connected
into the surrounding urban opportunities; creating a regional logic for the development of strategic
land parcels using current development dynamics to drive growth and reduce expansion pressure on
the periphery.
Unlocking the Mining Belt – This historical spatial discontinuity presents significant opportunities for
development and public open space that could integrate the north with the south of Johannesburg
and improve cross-border linkages with Ekurhuleni and the West Rand. By identifying strategic
interventions along the belt - road linkages, mixed use redevelopments, rehabilitation of degraded
and damaged land – this feature could become one of inclusion.
The Spatial Economy 2.4.3.
A hierarchy of nodes
The previous SDF defined a number of metropolitan, regional, district and neighbourhood nodes as
catalytic areas for growth in the city. Added to these are TOD nodes. These will be supported as focal
points for growth in the city through extended development rights (in terms of density and land use
mix) and through significant infrastructure investment by the city. Nodes should develop into
compact, walkable, liveable, mixed use and mixed income areas. Industrial nodes will be a focus of
future job creation, as well as diversification.
Economic Strategy supporting plans
The City of Johannesburg has a recently approved Economic Strategy which is anchored on five
dimensions, including:
Industrial transformation
Spatial transformation
Global identity transformation
Competitive market transformation
Institutional transformation
The broad economic strategy is progressing through more detailed, spatially targeted plans in
consultation with Development Planning and other departments in the city. The success of these
plans is vital in transforming Johannesburg into a spatially just city. These plans, along with the nodal

19 Spatial Development Framework 2016/17
review that will follow this SDF, will identify key areas of economic growth potential or need, and
put in place mechanisms to accelerate job creating economic growth. Importantly too, these plans
will look to support Small, Medium and Micro-sized Enterprises (SMMEs), including those in the
informal economy.
A Consolidation Zone 2.4.4.
This area (neither within the Transformation Zone, nor outside the urban development boundary) is
viewed as a focus of urban consolidation, infrastructure maintenance, controlled growth, urban
management, addressing backlogs (in social and hard infrastructure) and structural positioning for
medium to longer term growth. The policy intent in these areas would be to ensure existing and
future development proposals are aligned as far as possible with the broader intent of the SDF,
specifically in terms of consolidating and diversifying development around existing activity nodes
and public transport infrastructure. In this broad area, new development that does not require bulk
infrastructure upgrades should be supported, however underserviced parts of the city (informal
settlements and marginalised areas) should receive investment.
The Consolidation Zone includes:
Established suburban built-up areas – The focus of the strategy is to create liveable lower to
medium density suburban areas that are well-connected to areas of higher intensity through transit
infrastructure, without the need for additional investment in service infrastructure. Large vacant or
under-developed land portions within these areas will only be released for development subject to
stringent conditions related to sound growth management principles.
Improving sustainability and quality of life in deprivation areas – Many of the city’s marginalised
areas, including informal settlements, fall outside of the Transformation Zone defined in this SDF.
This does not mean that they will not receive infrastructure investment. In these areas in the short
term, efficient, affordable public transport must be introduced that connects to economic centres
and in the medium to long term mixed land uses must be strategically included, to drive economic
development and job creation. Infrastructure backlogs (hard and soft) must also be met. Having said
this, where marginalised areas are poorly located regarding access to jobs and other city amenities,
they should not be promoted as areas of expansion. The intent is thus not to increase capacity for
expansion but rather for the creation of liveable and sustainable human settlements.
Reinforcing the Urban Development Boundary and defining development zones 2.4.5.
Re-emphasising the Urban Development Boundary (UDB) and limiting new development outside of it
and protecting the natural environment. Emphasis is on ecological resource protection and
management, food production, low intensity social services and amenities, agriculture related
investment, leisure and tourism and green energy initiatives. In addition to the UDB, two other
development zones are introduced, the priority and consolidation zones, discussed above.
City-wide spatial policy regulations 2.4.6.
The intent of the Spatial Development Framework is realised through the application of policy and
legal guidelines, requirements and mechanisms to direct development towards achieving its overall

20 Spatial Development Framework 2016/17
goals and outcomes. Various new spatial policy regulations are suggested as a means of supporting
the spatial framework. Some of these policy regulations are detailed in this SDF, and some require
additional policy formulation.
Nodal Guidelines – facilitating the development of a polycentric multi-nodal city by categorising the
current city nodes with prospects for growth. Promote densification, diversification and
development in these nodes. The main categories of nodes are: mixed-use/key urban nodes (under
various categories), industrial nodes, Transit Oriented Development (TOD) nodes and
neighbourhood nodes. A thorough nodal review will follow this SDF process, to review the
boundaries of existing nodes in the city, and define new nodes where appropriate.
Form-Based Codes to compliment zoning in Transformation Zones – supplementing land use
zoning, form-based coding would support the building of compact, mixed use neighbourhoods and
public spaces in each of the priority areas, through physical form regulations. These should be
incorporated into RSDFs and more localised spatial planning frameworks, as has already been done
in many plans, such as the Corridors of Freedom. The consolidated Town Planning Scheme for the
city should include such codes, negotiated and agreed upon by various City departments, and public
participation.
Density Regulations – density provisions and regulations facilitating higher density development
within defined areas, promoting mixed use developments and improved connections.
Inclusionary, affordable and low cost housing – ensuring the provision of affordable, low cost and
social housing within all new housing developments. Affordable low cost housing should ultimately
make up 20-50% of residential floor area in all neighbourhoods.5 The bulk of provision of low
income, affordable housing (both by the private sector and the state) should shift from peripheral
greenfield developments, to high density, mixed use brown field development6 near to jobs,
economic activity, public transport and services (hard and soft), with a focus on Transformation
Zones such as the Corridors of Freedom, the Inner City and mixed use nodes. Requirements for the
development of inclusionary housing by private developers are included in this SDF.
Informal Settlements - The SDF reiterates the position supported in national and City of
Johannesburg policy that in-situ upgrading of informal settlements should be the first option for
intervention, with relocation only applied where upgrades are not possible or desirable for the
community in question. This decision process, and the implementation of any decisions, should be
done in close consultation with the community/ies affected. Upgrading of informal settlements
5 UN Habitat. (2013, December). A New Strategy of Sustainable Neighbourhood Planning: Five principles –
Urban Planning Discussion Note 3. Retrieved March 9, 2016, from UN Habitat: http://unhabitat.org/a-new-
strategy-of-sustainable-neighbourhood-planning-five-principles/
6 Brown field land, in this document, refers to developed or undeveloped land within the existing built-up
fabric of the city. Brown field development refers to the refurbishing of buildings, demolition and re-development, or development of unused land in the existing urban fabric (within existing townships).

21 Spatial Development Framework 2016/17
should be done in line with the Upgrading Informal Settlements Programme (UISP) and with support
from the National Upgrading Support Programme (NUSP).
The Public Environment – placing focus on the public environment for all development (green and
brownfield), the quality of public space and the interface between public and private space. Public
space should make up at least 50% of total area at a neighbourhood level, including 15-20% public
open space, and 30-45% for streets including sidewalks.
Land Readjustment – The SDF recommends the development of a land readjustment framework or
legislation to allow neighbouring property owners to pool land for development to ensure integrated
urban forms on privately owned land that include public streets, facilities and open space.
Measuring urban performance 2.4.7.
The implementation of the SDFs strategies and vision will be assessed using indicators on spatial
development. The indicators include land use mix, population and job density, the amount and
quality of public space, the percentage of affordable housing, connectivity levels and access to public
transit. These measures will also be used to assess current urban forms to provide direction for how
they may be retrofitted for better performance going forward.
Capital Investment Focus 2.4.8.
The implementation of the SDF relies on capital investment in infrastructure. This investment guides
growth directions for future development. Through guiding public investment in bulk infrastructure
and services the SDF will in turn guide private investment and development in the City. The City has
a well-established practise of strategic integration of capital investment programmes with
development strategies and spatial plans. The City’s strategic capital investment focus is described in
three broad investment categories that relate to managing existing assets, meeting infrastructure
backlogs and increasing capacity to direct growth in strategic areas. The strategic growth areas
identified in this SDF include the Transformation Zone, strategic economic nodes and economic
growth centres that can accommodate future urban intensification.
Focusing major investments in the identified transformation and under-serviced areas, supported
by defined spatial policies and regulations, and revising the SDF’s priority areas over time would
ensure the evolution of Johannesburg into a spatially just world class African city.
22 Spatial Development Framework 2016/17
3. Reviewing the SDF
Chapter Summary: Spatial Development Frameworks (SDFs) are described by the Municipal Systems
Act (MSA) (Act 32 of 2000) as a component of Integrated Development Planning (IDP) for
municipalities. More recently, they have been mandated by the Spatial Planning and Land Use
Management Act (SPLUMA) (Act 16 of 2013).
This review of the City of Johannesburg’s SDF follows a number of previous versions. The City’s first
SDF was approved by council in 2001, with the most recent approved SDF being the 2010/11 version.
As this document is a review of the preceding SDF, it is seen as an evolving document, rather than a
full overhaul. As such, the intent is to build on the strengths and successes of the previous SDF and
address its limitations. This document details the spatial policies, strategies and implementation
mechanisms that will carry through from previous SDFs, as well as those that have been amended,
removed or added.
The SDF as a Transformative Process 3.1.
This SDF presents a vision through which spatial transformation, as defined by the principles of
spatial justice, sustainability, resilience and efficiency, can be achieved. It is a planning process
situated within a broader suite or package of plans as presented in Figure 5. It is influenced by and
takes direction from the Growth and Development Strategy (GDS) and the Integrated Development
Plan (IDP), and in turn provides direction for the formulation of more detailed spatial planning and
strategic frameworks including Regional Spatial Development Frameworks (RSDFs), Urban
Development Frameworks (UDFs) and Precinct Plans (PPs). As such, the SDF should find a balance in
the detail it provides for its implementation. Direction should be sufficiently detailed to give
concrete guidance, yet not overly prescriptive to the point that it inhibits creativity and meaningful
action.
The main objectives of the SDF Review process can be summarised as follows:
To build on the successes and address the limitations of the previous SDF.
To provide a spatial dimension and plan to direct investment, growth and development in a
manner that can deliver on the desired outcomes of the Growth and Development Strategy
(GDS) 2040.
To fulfil the legislative requirements of review, noting the requirements of the MSA and
SPLUMA.
To capture, analyse and utilise the most updated information regarding developmental
trends and issues, both within the city, and in wider contexts including international,
regional, national and the Gauteng City-Region.
To collect, collate and reflect on the needs of a range of stakeholders in the City of
Johannesburg and different spheres of government.

23 Spatial Development Framework 2016/17
To provide regulations for development in the city, as well as suggest areas where more
detailed planning is needed, and where new policy should be formulated.
To develop indicators to be used: to monitor the implementation of the SDF; to evaluate
new development applications and to assess current form to direct future intervention.
The SDF presents a desired future whilst being cognisant of the past and present. It is important to
recognise that spatial planning in itself cannot realise the full suite of requirements for city
development. Hence, a realistic implementation framework is tied to this SDF. The SDF must
translate into a clear decision-making framework that is able to chart a way forward for public sector
investment. This is addressed in this SDF through implementation strategies that combine a set of
priority investment area projects with spatial policies to support them.
Equally, realising the development goals of the municipality relies on the ability of the city to create
an environment that facilitates private sector confidence and investment. It is therefore critical that
the SDF conveys a confident and realistic future that is attractive for private sector investment.
SDF Review Process 3.1.1.
The review of this SDF was structured around a number of processes. First was a series of charrette
sessions with a reference group of planners, developers, bankers, environmental interest groups,
provincial government departments and specialists in various development-related fields. Second
was consultation with various departments within the City of Johannesburg for input and comment.
Third was a public participation process in which a concept draft SDF was presented and debated
and contributed to by various interest groups. Last was the SPLUMA legislated process of gazetting
the draft SDF document for a period of 60 days for public comment. Comments from each process
were collated and incorporated (where applicable) into the document before final council approval
and publication.
Applying this SDF in relation to regional and local spatial plans 3.1.2.
This SDF 2040 (2016/17), once approved by council, will replace its predecessor. Development
corridors and other primary development areas included in the previous SDF that are not contained
in this version will fall away, along with guidelines within sub-area tables of Regional Spatial
Development Frameworks7 related specifically elements that have fallen away. The SDF is read in
conjunction with Regional Spatial Development Frameworks (RSDFs) and other localised spatial
policy documents including Urban Development Frameworks (UDFs) and Precinct Plans (PPs) that
have been approved by council.
This SDF will prompt the development of new regional and/or local spatial policy frameworks. Until
such time as new regional and local policies are approved by council, the following should be noted:
7 This includes mobility spines, roads and corridors, as outlined in section 8.2.5.

24 Spatial Development Framework 2016/17
For areas explicitly covered by this SDF including Transformation Zones and economic nodes
(Chapter 7), density regulations (Table 6 p.159) and urban performance measures (section
8.3); this SDF will apply, with the exception to regulations of the approved Strategic Area
Frameworks (2014) and PPs/UDFs approved since and including 2015.
In those areas not explicitly covered by this SDF, current RSDFs, PPs and UDFs should be
applied until such time as new RSDFs, PPs or UDFs are approved by council.
Figure 5: Hierarchy of Spatial Plans
Nodal boundaries and the Urban Development Boundary 3.1.1.
This SDF does not include new alterations of any nodes (district, specialist, metropolitan, local or
industrial), which remain the same as the most recent boundaries approved by council, nor does it
include changes to the Urban Development Boundary from existing council approvals8. The SDF
8 One change to the urban development boundary as per a council resolution on 29 October 2015 has been
made. This change is illustrated in the SDF maps and in Annexure 1: Urban Development Boundary Amendment.
25 Spatial Development Framework 2016/17
process will be followed by a nodal review process, in which nodal boundary changes and additions
will be considered. This process will include an urban potential modelling exercise, and public
participation on nodal additions and/or amendments.
Spatial Policy/Legislative Context 3.2.
The SDF for Johannesburg represents the key spatial policy position for the city. It should reflect the
intent and principles of broader city policy, as well as spatial policy and legislative initiatives in other
spheres of government. Amongst the policies and acts reviewed are the National Development Plan
(NDP), the Spatial Planning and Land Use Management Act (SPLUMA), the Gauteng Transformation
Modernisation and Reindustrialisation Strategy (TMR) and the Gauteng Spatial Development
Framework (GSDF). The key city of Johannesburg policies reviewed include the Growth and
Development Strategy 2040 (GDS), and the Integrated Development Plan (IDP).
National Development Plan 3.2.1.
The National Development Plan 2030 provides a policy framework that looks beyond current
constraints confronting the nation to the transformation imperatives that are needed to support
accelerated economic growth over the next 20 to 30 years, focussing specifically on addressing
poverty and reducing inequality.
A number of key spatial principles are outlined in Chapter 8 of the NDP, ‘Sustainable Human
Settlements’. They include: spatial justice, spatial resilience, spatial sustainability, spatial efficiency
and spatial quality.
Of specific relevance to the SDF Review process are the NDP’s human settlement targets, as set out
in Chapter 8, which focus on transforming human settlements and the national space economy.
These spatial targets include:
Upgrade all informal settlements on suitable, well located land by 2030.
More people living closer to their places of work.
Better quality public transport.
More jobs in proximity to townships.
To achieve these targets the NDP advocates strong measures to prevent further development of
housing in marginal locations (far from urban amenities including jobs and access to infrastructure,
hard and soft), increased urban densities to support sustainable public transport, incentivising
economic activity in and adjacent to townships; and engaging the private sector in the low income
and gap housing markets.
Spatial Planning and Land Use Management Act (SPLUMA) 3.2.2.
The Spatial Planning and Land Use Management Act, 2013 (SPLUMA) came into effect on 01 July
2015. It is a framework act for all spatial planning and land use management legislation in South
26 Spatial Development Framework 2016/17
Africa. The legislation seeks to promote consistency and uniformity in procedures and decision-
making related to the spatial planning environment across the country, and across all spheres of
government.
SPLUMA reinforces and unifies the NDP’s vision and policies in respect of using spatial planning
mechanisms to tackle poverty and inequality while creating conditions for inclusive growth by
fostering a high-employment economy that delivers on social and spatial cohesion.
The five development principles, as set out in Section 7 (a) to (e) of SPLUMA are summarised as:
Spatial justice: past spatial and other development imbalances must be redressed through
improved access to and use of land.
Spatial sustainability: spatial planning and land use management systems must promote the
principles of socio-economic and environmental sustainability.
Efficiency: land development must optimise the use of existing resources and the
accompanying infrastructure.
Spatial resilience: securing communities and livelihoods from spatial dimensions of socio-
economic and environmental shocks through mitigation and adaptability that is
accommodated by flexibility in spatial plans, policies and land use management systems.
Good administration: all spheres of government must ensure an integrated approach to
land use and land development and all departments must provide their sector inputs and
comply with prescribed requirements during the preparation or amendment of SDFs.
Gauteng Transformation Modernisation and Reindustrialisation Strategy (TMR) 3.2.3.
At the 2014 inaugural State of the Province Address, Gauteng Premier David Makhura tabled the
Transformation Modernisation Reindustrialisation Strategic Roadmap to move Gauteng forward. The
strategy identifies the apartheid space economy and human settlements patterns as key structural
challenges.
The TMR strategy proposes 10 pillars which will ensure integrated, socially cohesive and
economically inclusive development. These are: radical economic transformation, decisive spatial
transformation, accelerating social transformation, transformation of the state and governance,
modernisation of the economy, modernisation of the public service and the state, modernisation of
human settlements and urban development, modernisation of public transport and other
infrastructure, reindustrialising Gauteng as our country’s economic hub, taking a lead in Africa’s new
industrial revolution.
The TMR strategy identifies five (5) “development corridors”, with the CoJ anchoring the central
development corridor; the hub of finance, services, ICT and pharmaceutical industries.
To achieve these goals, the TMR strategy supports:
Inner City regeneration efforts in the City of Johannesburg CBD

27 Spatial Development Framework 2016/17
The Corridors of Freedom initiative
Regeneration of Kliptown and Alexandra
Integrated human settlements development
Township economies
The aerotropolis initiative at OR Tambo and Lanseria airports.
The TMR advocates that Gauteng municipalities adopt a city region perspective to ensure that
Gauteng remains the economic and industrial hub of South Africa and the SADC region, and a
“gateway to Africa”.
Gauteng Environmental Management Framework 3.2.4.
The Gauteng Provincial Environmental Management Framework is a legal instrument in terms of the
Environmental Management Framework Regulations, 2010. The regulations are designed to assist
environmental impact management including EIA processes, spatial planning and sustainable
development.
The objectives of the policy are:
To ensure efficient urban development (including associated service infrastructure) in
defined selected areas with lower environmental concerns and high development demand in
order to help facilitate the implementation of Gauteng Growth and Management
Perspective, 2014.
To facilitate the optimal use of current industrial, mining land and other suitable derelict
land for the development of non-polluting industrial and large commercial developments.
To protect Critical Biodiversity Areas (CBAs) within urban and rural environments.
To ensure the proper integration Ecological Support Areas (ESAs) into rural land use change
and development.
To use ESAs as defined in municipal bioregional plans in spatial planning of urban open space
corridors and links within urban areas.
To focus on the sustainability of development through the implementation of initiatives such
as:
o Energy efficiency programmes, plans and designs
o Waste minimisation, reuse and recycling
o Green infrastructure in urban areas
o Sustainable Urban Drainage Systems (SUDS)
25 Year Gauteng Integrated Transport Master Plan 3.2.5.
The ITMP259 (Figure 31 pg. 78) embodies the principles of an efficient, competitive and responsive
economic infrastructure network that prioritises public transport. It aims to assist Government at all
9 Gauteng Provincial Government. (2013, November). 25-Year Integrated Transport Master Plan. Retrieved
April 20, 2016, from Gauteng 25 year Integrated Transport Master Plan: http://bit.ly/26eJ2A5
28 Spatial Development Framework 2016/17
levels to deliver a world class, sustainable transport system that supports Gauteng’s economic,
social, cultural, environmental and developmental goals.
The policy focus areas of the Gauteng Integrated Transport Master Plan are as follows:
Economic development
Spatial development and social Integration
Environmental soundness and sustainability
Optimum usage of new and existing infrastructure
Development of an efficient and effective Public Transport Network and System
Gauteng Spatial Development Framework 3.2.6.
The Gauteng Spatial Development Framework is currently under review, with the draft having been
released for a sixty day comment period on the 12th of May, 2016. The Gauteng Spatial Development
Framework 2030 is based on four (4) key spatial development strategies (that engage the six spatial
objectives in varying degrees of relevance), namely:
Building an integrated network
Capitalising on proximity
Managing settlement development and growth
Creating a viable and productive hinterland
These four strategies ultimately make up the composite Gauteng Spatial Development Framework,
2030. Each of the strategies address the six spatial objectives (being Liveability, Concentration,
Connectivity, Conservation, Diversity and Viability) in varying degrees, with certain principles
featuring more prominently in certain development strategies. Overall the four strategies
collectively however address all six objectives.
At the time of finalising the Johannesburg SDF, the Gauteng SDF has been advertised for public
comment. The City of Johannesburg has been engaging in the process of the GSDF review, and will
submit written comments to the Gauteng Provincial Government.
Johannesburg Growth and Development Strategy 2040 (GDS 2040) 3.2.7.
The Johannesburg GDS 2040 is an aspirational strategy that defines the type of society the city
aspires to achieve by 2040. The strategy restates the City’s resolve in confronting the past injustices
created during apartheid, working towards a democratic, non- prejudiced and just City while
simultaneously confronting present and future challenges as they emerge.
The GDS 2040 provides a set of defined strategic directions that frame the five- year IDP and other
medium-term plans. In support of long-term delivery, the IDP will contain specific five-year
operational activities, targets and financial budgets.
The GDS 2040 is predicated on three principles, namely: Resilience; Sustainability and Liveability.

29 Spatial Development Framework 2016/17
Given the National (NDP and SPLUMA), provincial (TMR and GSDF) and local (GDS and IDP) policy
principles that have been outlined, the principles of spatial justice, sustainability, resilience and
efficiency have been identified as pivotal for spatial development in Johannesburg. It is crucial,
therefore, that the city of Johannesburg’s SDF adopt these principles for Johannesburg’s spatial
future.
4. Johannesburg: Global, African, Regional and Local Context
Chapter Summary: It is clear that cities do not exist in isolation to their surroundings. They form part
of local, regional and international networks, connected through economic systems, social ties,
shared environmental concerns, and the movement of goods, people and services. It is for this
reason, that despite only having direct influence within certain borders, municipal planning must take
cognisance of the city and how it interacts with wider contexts. At the same time a strong evidence
based understanding of the city is needed to drive decision making and planning for future
improvement and growth. This chapter outlines the regional context of Johannesburg, and the
challenges the city faces.
A Role in Africa 4.1.
Improving the capacity of Johannesburg to absorb population growth in an inclusive way is one of
the key challenges. The latest data provided by the Population Division of the United Nations show
that Africa is experiencing unprecedented population growth. The UN’s ‘World Population
Prospectus’ for 201510, estimates the current population of Africa to be 1.18 billion. The African
population, according to the report, is also growing at a faster rate than any other in the world, and
is projected to grow as high as 2.48 billion by 2050, and 4.39 billion by 2100, with much of this
population growth happening in cities.
As the City of Johannesburg moved through its democratic transformation, its role in a broader
African context has grown. A recent report entitled ‘Cities of Opportunity’11 which undertook an
analysis of 30 cities at the heart of the world’s economy and culture, showed that Johannesburg is
indeed a top-ranking city to live and do business in from a cost and ease point of view. Factors such
as liveability, connectivity and innovation were also taken into account. Although mature cities such
as London, New York and Singapore perform best, Johannesburg sits ahead of several emerging
market cities such as Istanbul, São Paulo, Rio de Janeiro, Mumbai, Jakarta and Nairobi. At a macro
level this is a very positive outlook for Johannesburg, although the report recognises that there are
other essential areas in which it needs to improve for its citizens – health, safety and recognising
informality (key issues for many emerging economies).
10 UN, Department of Economic and Social Affairs, Population Division, 2015. World Population Prospects The
2015 Revision Key Findings and Advance Tables 11
PWC, 2014. Cities of Opportunity, http://www.pwc.com/us/en/cities-of-opportunity/

30 Spatial Development Framework 2016/17
Johannesburg is a major economy in the global south, and the top performer in Africa. However this
status may soon change. The economy of Lagos (Nigeria) with an annual GDP of R400 billion is
growing faster than Johannesburg’s (R510 billion) and may soon take top spot in the continent. This
falls in the context of a number of other African urban centres that are also growing in regional and
international prominence. While urban economies do compete with one another, the growth in
African urban economies should be seen as an opportunity that Johannesburg, and indeed other
cities in South Africa, can connect to for mutual benefit. This benefit is already being seen for
Johannesburg and Gauteng in terms of large Johannesburg based businesses working in Africa, but
also in terms of smaller scale trade. A recent study by the Gauteng City-Region Observatory (GCRO)12
interviewed some 1200 cross border informal sector traders who travel to Gauteng to buy goods to
sell in their home country. Most of these traders travel to Gauteng at least once a month, and spend
on average R11 679 on goods per trip as well as money on transport and accommodation.
Collectively the traders interviewed (who represent only a portion of the total) spend over R160
million a year in Gauteng. This represents the economic significance of the city and its region, not
only in international financial terms, but in more localised and less formal markets too.
The role of the informal economy must be acknowledged and defined. In the face of global
economic downturns linked to the impacts of Climate Change globally, the informal sector has
made remarkable responses in terms of the need to reduce, reuse and recycle resources with
significant spin offs in terms of income creation; in contrast to the formal economy.
A sustained Johannesburg economic transition creating jobs for all population strata will hinge
on achieving two important features highlighted in the UN Habitat report The State of African
Cities 201413.
Firstly, Johannesburg’s economic development must become more self-driven by further
exploration of existing and new technologies for raising domestic productivity and income
generation. Johannesburg must rapidly improve its social services, especially in its lower income
areas, to create better working and living conditions as well as new economic opportunities for
its young people who will carry forward the current economic momentum.
Secondly, trade and investment flows between Johannesburg, Africa and the world, will need to
be further expanded. These strategic relationships must rise above mere natural resource
extraction. Investments in road, rail and energy networks will be crucial in boosting
Johannesburg’s urban economy; unlocking areas for investments in agro-industrial and
12 Peberdy, S. (2015). Informal sector cross border trade spending in Gauteng. Retrieved October 6, 2015, from
Gauteng City-Region Observatory: http://bit.ly/GPtrade
13 UN Habitat. (2014). State of African Cities 2014: Re-imagining sustainable urban transitions. Retrieved April
20, 2016, from UN Habitat: http://unhabitat.org/books/state-of-african-cities-2014-re-imagining-sustainable-
urban-transitions/

31 Spatial Development Framework 2016/17
manufacturing enterprises; facilitating flows of people, commodities and services; and assuring
food, water and energy security for development.
Johannesburg’s thrust towards industrialisation must, however, take into account the roles that
the inevitable African urban transition will play in structural transformations. With a large
emerging urban consumer class in Africa, Johannesburg should actively explore and embrace
more diverse growth opportunities, especially where these can be decoupled from resource
exploitation and ecological degradation.
While Growing economies and urban populations in Africa pose many challenges, they provide many
opportunities. It is important for Johannesburg and other South African cities to embrace the growth
of African cities, and to strengthen links into the growing urban network in Africa.
Securing Johannesburg’s future as a leading African city economy will require responsiveness to this
changing economic environment through sound economic strategies and good coordination
between planning, economic and infrastructural development. The key focus areas for Johannesburg
as set out in the City’s economic strategy will be: improving the spatial efficiency and
competitiveness of the City, better exploitation of agglomeration potential in both new and existing
industries and positioning of the City’s businesses in global value chains14.
14 Economic Development Strategy for the City of Johannesburg, 2015.
32 Spatial Development Framework 2016/17
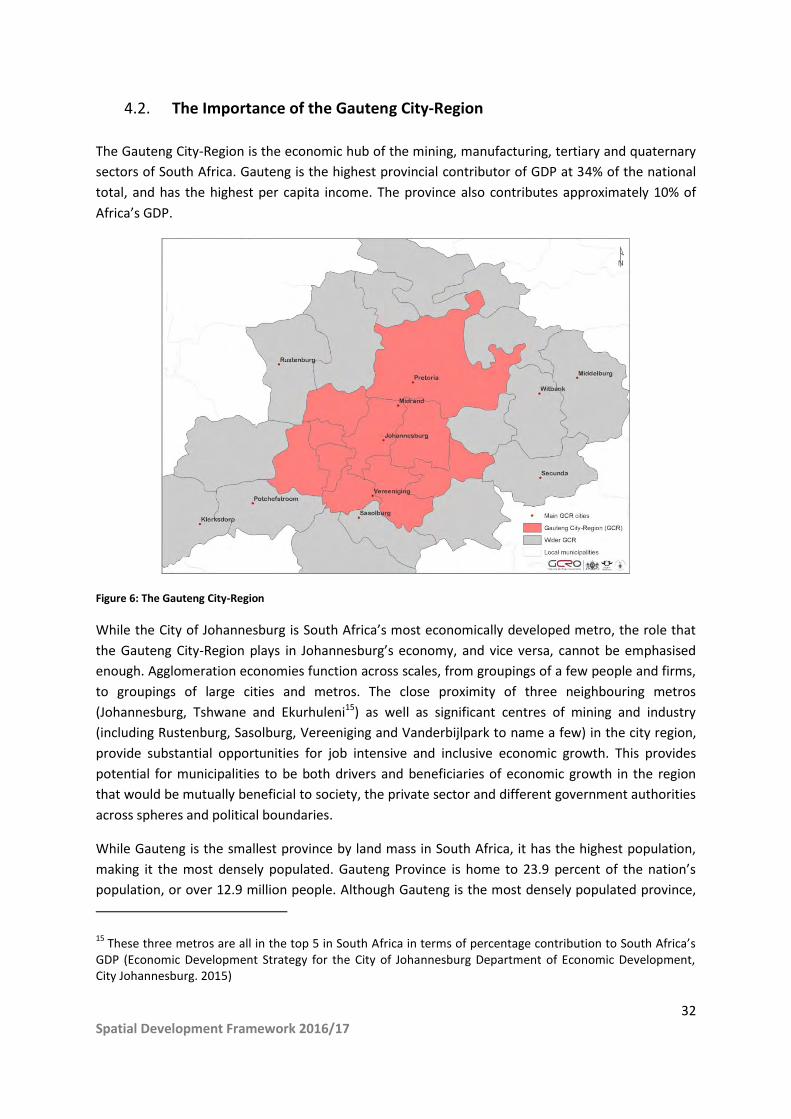
The Importance of the Gauteng City-Region 4.2.
The Gauteng City-Region is the economic hub of the mining, manufacturing, tertiary and quaternary
sectors of South Africa. Gauteng is the highest provincial contributor of GDP at 34% of the national
total, and has the highest per capita income. The province also contributes approximately 10% of
Africa’s GDP.
Figure 6: The Gauteng City-Region
While the City of Johannesburg is South Africa’s most economically developed metro, the role that
the Gauteng City-Region plays in Johannesburg’s economy, and vice versa, cannot be emphasised
enough. Agglomeration economies function across scales, from groupings of a few people and firms,
to groupings of large cities and metros. The close proximity of three neighbouring metros
(Johannesburg, Tshwane and Ekurhuleni15) as well as significant centres of mining and industry
(including Rustenburg, Sasolburg, Vereeniging and Vanderbijlpark to name a few) in the city region,
provide substantial opportunities for job intensive and inclusive economic growth. This provides
potential for municipalities to be both drivers and beneficiaries of economic growth in the region
that would be mutually beneficial to society, the private sector and different government authorities
across spheres and political boundaries.
While Gauteng is the smallest province by land mass in South Africa, it has the highest population,
making it the most densely populated. Gauteng Province is home to 23.9 percent of the nation’s
population, or over 12.9 million people. Although Gauteng is the most densely populated province,
15 These three metros are all in the top 5 in South Africa in terms of percentage contribution to South Africa’s
GDP (Economic Development Strategy for the City of Johannesburg Department of Economic Development, City Johannesburg. 2015)

33 Spatial Development Framework 2016/17
only 17% of its area is considered ‘urbanised’ or settled. Thus, while the population density of the
entire province is low in international urban terms (672 people/km2) the density of built up areas16 is
significantly higher at around 4 724 people/km2.17
The City Region displays a wide range of social and economic opportunities that the province seeks
to realise through an economic strategy of radical transformation, modernisation and
reindustrialisation to create decent work, economic inclusion and equity.18 Based on this, and with
the implementation of sustainable development principles, the city region has the potential to
develop as one of the world’s significant emerging conurbations, with Johannesburg at its centre.
The SDF supports and will contribute to the Gauteng Spatial Perspective Vision, which envisages: “A
smart and spatially integrated City Region with high mobility where everyone enjoys equal access to
quality basic services, resides in sustainable human settlements that are strategically located close to
economic opportunities and offer a range of habitation options that enable choices to ensure quality
living experience”.19
Climate Change: Risks and Opportunities for Johannesburg 4.3.
Climate change is a current inevitability and its manifestations are unpredictable. Whether it will
involve gradual shifts in temperature (up or down), changes in rainfall patterns, altered groundwater
salinity or changes in the frequency and/or severity of extreme weather events is yet to be
confirmed.
South Africa is the only African country among the world’s top 25 emitters of carbon dioxide over
the past several decades.20 In 2014, the City of Johannesburg conducted its first ever city-wide
carbon inventory using the Global Protocol for Community-scale Greenhouse Gas Emissions (GPC),
on a 2007 baseline. Total greenhouse gas emissions were estimated at 26.5 million tons of CO2
emissions. Carbon emissions per capita in Johannesburg are already much higher than best practice
cities such as Paris, Tokyo or Seoul. The carbon intensity (in tCO2e/$GDP) of Johannesburg’s
economy is 4 to 6 times higher than these three cities. The share of mining and energy intensive
industries in Johannesburg’s economy and the countries coal intensive energy supply are partly
responsible for this figure, but the transportation sectors also largely widely contribute to this figure,
with 41,000 TJ (Tera joule) consumed annually for passenger transportation, or 9.3 GJ (gigajoule) per
capita. This makes Johannesburg transportation energy intensity much higher than some cities in
Europe (Paris, London, Berlin) or Asia (Hong Kong, Tokyo, Seoul).
16 This is based on the built up area of the province as it was in 2000
17 Gotz, G., Wray, C., and Mubiwa, B. (2014). The 'thin oil of urbanisation'? Spatial change in Johannesburg and
the Gauteng City-Region. In P. Harrison, G. Gotz, C. Wray, and A. Todes (Eds.), Changing Space, Changing City: Johannesburg After apartheid (pp. 42-62). Johannesburg: Wits University Press. 18
Gauteng Province Strategic Plan 2014-2019 19
Gauteng Spatial Perspective, 2030 20
http://data.worldbank.org

34 Spatial Development Framework 2016/17
This massive increase in energy and carbon intensity of transportation due to the switch towards
private cars can only be balanced with a very ambitious strategy resting upon both transit
investment and an intensification of the urban fabric around transit infrastructures, through
higher residential and job density, and denser, more mixed-use urban fabrics.
Source: Urban Morphology Institute
The SDF will integrate the link between urbanisation patterns, energy intensity and carbon emission
levels in the city of Johannesburg. Modelling the link between local urban intervention and carbon
emissions, such as increases of density under different scenarios (section 6.1.1), the SDF will make
Johannesburg a pioneering city regarding link between emissions and urban structure.
Climate change adaptation 4.3.1.
Johannesburg, like all Southern African cities is extremely vulnerable to climate change impacts.
Temperature increases and weather variability threaten to directly or indirectly disrupt systems
critical to the survival of cities in the region. The sub-region is warming and increased droughts are
possible in the future. Heat island effects and changing disease patterns are key challenges for inland
urban areas. Unguided urbanisation, degradation of freshwater resources, lowered levels of food
security and failure of climate change adaptation strategies are among the most significant global
environmental risks in African cities.
The challenge for African cities such as Johannesburg to respond to the impacts of climate change is
particularly serious, due to the often precarious nature of living conditions and livelihoods that many
face. For those living just outside of poverty, but still with very low incomes very slight external
changes can prompt a shift to poverty. These may include social, economic, political or
environmental changes such as droughts, increasing food or fuel prices or damage to property due
to unexpected events.
35 Spatial Development Framework 2016/17
Many of Johannesburg’s poor residents live in informal settlements, informal backyard dwellings or
informally occupied buildings, sometimes referred to as ‘bad buildings’. Informal living environments
are at times located in high-risk locations (such as flood plains) and often with minimal bulk and
public services, such as waste collection and management, public transport, access to potable water,
sanitation, and health facilities. As such, it is clear that certain portions of the population are more at
risk to the seemingly slight and gradual changes that climate change poses.
Policy and action on climate change in South Africa is changing. The AFD21 reports that efforts of
some local leaders, like Johannesburg, “in addition to rising global awareness of climate change and
increasing impacts on the poor and the rich alike, are beginning to create a political opportunity for
making climate change a central development issue, linked to patterns of consumption, employment
and public services. This, in turn, creates the potential for mainstreaming climate adaptation into the
core mandate, planning and budget allocations of South African municipalities.”
The South African government’s National Climate Change Response (NCCR) White Paper22 was
developed in 2011 and focuses on three key aspects:
Adaptation;
Mitigation; and
Mainstreaming sustainable and ‘climate- resilient’ development.
The NCCR White Paper requires all government departments and state-owned enterprises to
achieve “full alignment with the national climate change response” by way of reviewing their
legislation, policies, strategies, governance structures and plans.
The push for resilience in all planning is a major policy objective for the City of Johannesburg.
Climate change is a significant threat to a sustainable future in the short, medium and long term. As
such, the city introduced the Climate Change Adaptation Plan in 2009 and the Energy and Climate
Change and Action Plan 2012, with both documents currently under review. A draft Climate Change
Strategic Framework has also been developed, which paves the way towards the development of an
integrated Climate Change Strategy that incorporates both adaptation and mitigation.
In the context of the significant role urban form plays in carbon emissions, the SDF must: build
resilience within communities; promote a compact carbon efficient urban form; and preserve the
natural environment that provides irreplaceable ecosystem services for the city.
A Dynamic, Changing City 4.4.
From its early beginnings as a mining camp, Johannesburg has grown to become a truly global and
cosmopolitan city, with strong physical, economic, and social connections to key centres across
21 Taylor, A., Cartwright, A., and Sutherland, C. (2014). Institutional Pathways for Local Climate Adaptation: A
Comparison of Three South African Municipalities. Paris: Agence Française de Développement. (pp.8)
22 http://bit.ly/NCCRwhitepaper

36 Spatial Development Framework 2016/17
Southern Africa, Africa and the world. In transforming from a mining town to an industrial city and
more recently to a centre of the tertiary economy, the City is continually extending its significance as
a regional centre in Southern Africa, and an important global gateway. The city’s economy is now
dominated by the tertiary sector, with Trade, Transport, Finance and Community services making up
76% of the city’s economic output. Importantly, the finance sector was the fastest growing from
1996 to 2013. Mining has declined to just 1% of economic output, and while manufacture still makes
up 16% of the city’s economic output, it has declined from 20% in 199623 (for further details see
section 5.2).
At the same time, the city is grappling with a number of spatial and developmental issues, including
a growing population, a backlog of adequate housing, high levels of poverty and unemployment,
spatial and economic fragmentation, disconnection, and inequality.
These issues become increasingly challenging in the context of a unique and irreplaceable natural
environment, already degraded by mining, industry and past development, which is becoming
increasingly threatened by current urban growth patterns.
Within this context, the city is defined by several ‘tensions’ that require constant mediation and
balance, often between ‘big’ and ‘small’. These include: global versus local leadership; supporting
large and small/medium enterprises (formal and informal); transformative initiatives vs incremental
interventions; addressing the city of the past while building the city of the future; driving change vs
supporting organic informal growth; retaining conventional wisdom while adapting to next
generation innovation; and regional connections vs local walkability.
The spatial future of the city is difficult to predict, and is likely to be determined, to some extent, by
a number of key challenges moving forward, including:
A growing role in Africa, and specifically Sub- Saharan Africa, as trade increases and the city
becomes more accessible.
Decelerating economic growth.
Ongoing urbanisation, high levels of poverty and increasing levels of unemployment and
inequality.
The growing impact of climate change on economic and spatial patterns.
23 Economic Development Strategy for the City of Johannesburg Department of Economic Development, City
Johannesburg. 2015
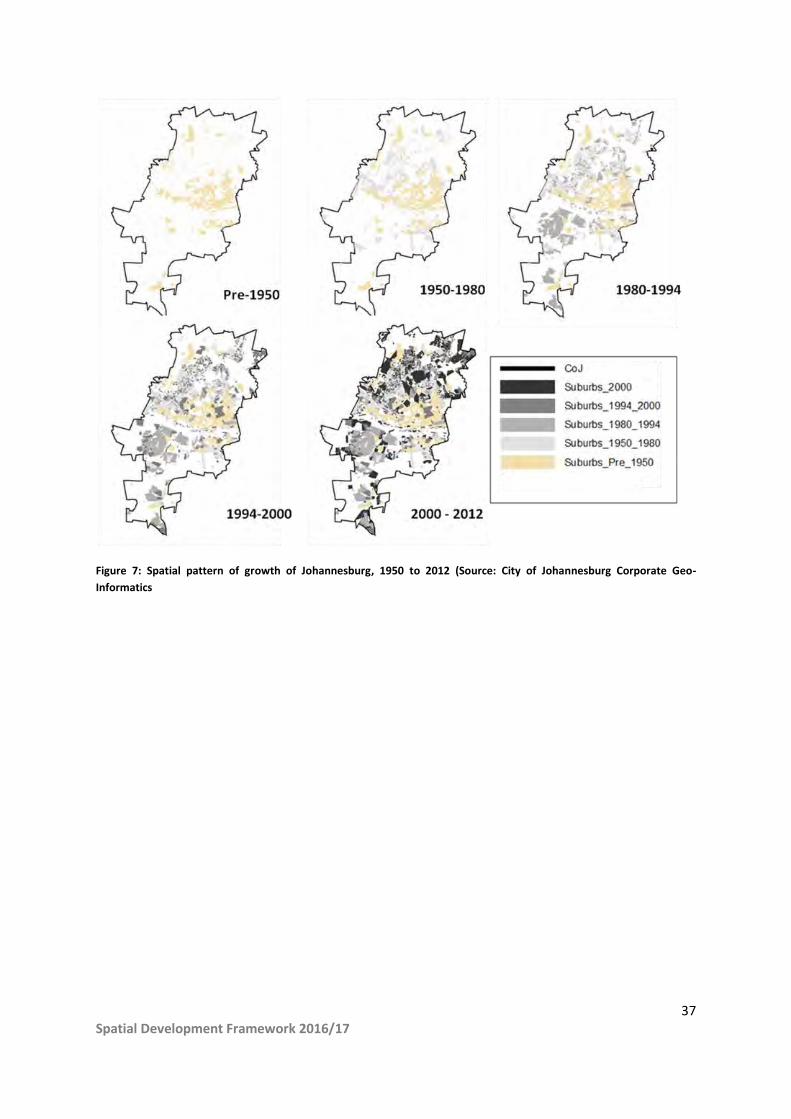
37 Spatial Development Framework 2016/17
Figure 7: Spatial pattern of growth of Johannesburg, 1950 to 2012 (Source: City of Johannesburg Corporate Geo-
Informatics

38 Spatial Development Framework 2016/17
5. The Current City
Chapter Summary: The apartheid practices of planning and urbanisation have led to the
development of a spatial structure with many shortcomings: spatial inequality (including a stark job-
housing mismatch), fragmentation and spatial disconnection, urban sprawl and limiting densities,
limited land-use diversity and pressure on the natural environment. Although there is evidence of
some reconstructive developments over the past decade the current structure and development
patterns require revisiting in order to meet the future urban challenges in a sustainable manner.
Urbanisation 5.1.
During apartheid, various measures were used to suppress urbanisation in South Africa, including
the pass system and legislation such as the Group Areas Act of 1950. This led to a pent-up demand
for access to urban areas. The end of Apartheid saw a surge in urbanisation in South Africa, related
to meeting pent up demand.24 Much of this growth happened in South Africa’s metropolitan
municipalities, including Johannesburg. Data from the United Nations however suggests that the
post-apartheid ‘boom’ in population for the city is slowing, and that while population growth will
continue, it will be at much lower rates than experienced in the 1990s and early 2000s (Figure 8).
According to population data from the 1996, 2001 and 2011 censuses, Johannesburg is continuing to
grow, although at a decelerating rate. From 1996 to 2001 its population grew at an average of 4.1%
per annum while from 2001 to 2011 it grew on average at 3.2% per annum25. The United Nations
predicts a further deceleration of growth, to 2% for the period 2015 to 2020, 1.3% for 2020 to 2025
and 1% for 2025 to 2030. As indicated below, however, this is one of the low-range estimates for
Johannesburg’s growth and is used to illustrate the trend of slowing population growth.
24 Harrison, P., Gotz, G., Todes, A., and Wray, C. (2014). Materialities, subjectivities, and spatial transformation
in Johannesburg. In P. Harrison, G. Gotz, A. Todes, and C. Wray (Eds.), Changing Space Changing City:
Johannesburg After Apartheid (pp. 2-41). Johannesburg: Wits Press.
25 Quantec. (2016). EasyData. Retrieved December 4, 2015, from http://www.easydata.co.za/

39 Spatial Development Framework 2016/17
Figure 8: Population Growth Rates for Johannesburg, 1975-2030 (UN Population Division 201426
)
Figure 9: UN Projected Population Growth for Johannesburg using census 2011 as the starting point27
26 United Nations, Department of Economic and Social Affairs, Population Division (2014). World Urbanization
Prospects: The 2014 Revision, CD-ROM Edition.
1975-1980
1980-1985
1985-1990
1990-1995
1995-2000
2000-2005
2005-2010
2010-2015
2015-2020
2020-2025
2025-2030
Johannesburg 1.5% 1.5% 1.5% 4.0% 4.3% 3.7% 3.5% 3.2% 2.0% 1.3% 1.0%
0.0%
0.5%
1.0%
1.5%
2.0%
2.5%
3.0%
3.5%
4.0%
4.5%
UN Projection: Average Annual Rate of Change 1975-2030 for Johannesburg's Population
4434,827
5038,122
5619,085 6020,505
6333,231
,0
1000,000
2000,000
3000,000
4000,000
5000,000
6000,000
7000,000
UN Projection: Johannesburg's Population
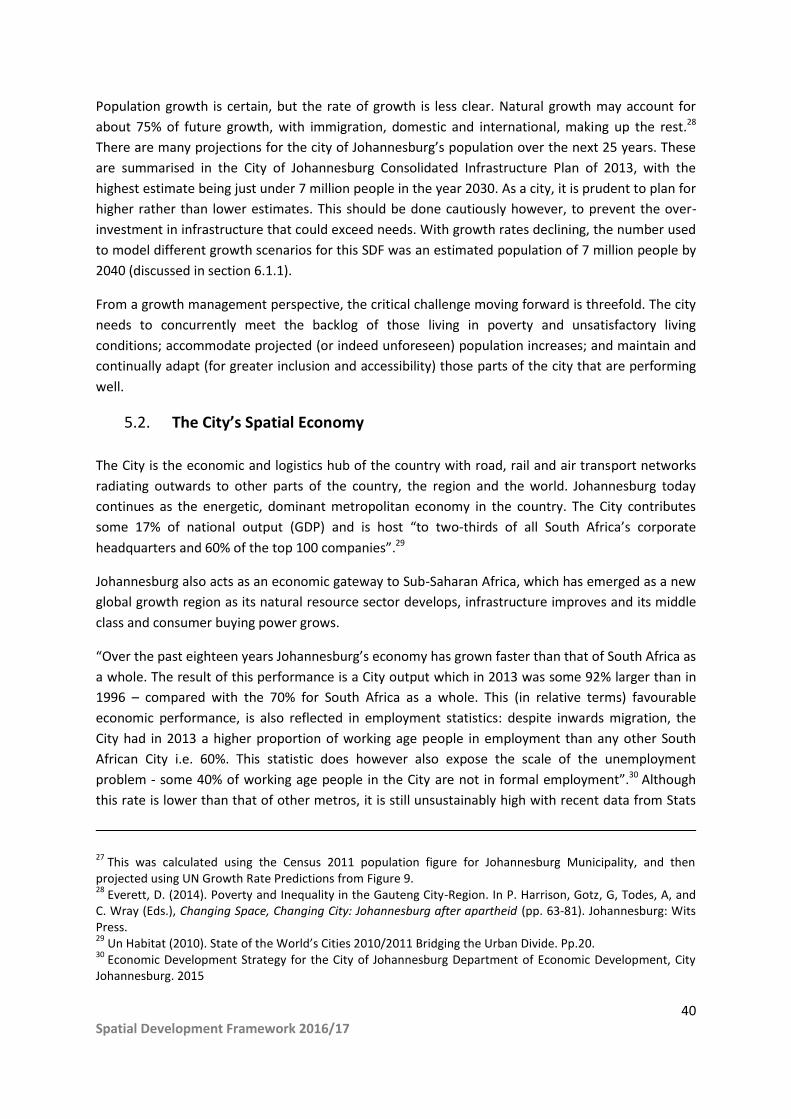
40 Spatial Development Framework 2016/17
Population growth is certain, but the rate of growth is less clear. Natural growth may account for
about 75% of future growth, with immigration, domestic and international, making up the rest.28
There are many projections for the city of Johannesburg’s population over the next 25 years. These
are summarised in the City of Johannesburg Consolidated Infrastructure Plan of 2013, with the
highest estimate being just under 7 million people in the year 2030. As a city, it is prudent to plan for
higher rather than lower estimates. This should be done cautiously however, to prevent the over-
investment in infrastructure that could exceed needs. With growth rates declining, the number used
to model different growth scenarios for this SDF was an estimated population of 7 million people by
2040 (discussed in section 6.1.1).
From a growth management perspective, the critical challenge moving forward is threefold. The city
needs to concurrently meet the backlog of those living in poverty and unsatisfactory living
conditions; accommodate projected (or indeed unforeseen) population increases; and maintain and
continually adapt (for greater inclusion and accessibility) those parts of the city that are performing
well.
The City’s Spatial Economy 5.2.
The City is the economic and logistics hub of the country with road, rail and air transport networks
radiating outwards to other parts of the country, the region and the world. Johannesburg today
continues as the energetic, dominant metropolitan economy in the country. The City contributes
some 17% of national output (GDP) and is host “to two-thirds of all South Africa’s corporate
headquarters and 60% of the top 100 companies”.29
Johannesburg also acts as an economic gateway to Sub-Saharan Africa, which has emerged as a new
global growth region as its natural resource sector develops, infrastructure improves and its middle
class and consumer buying power grows.
“Over the past eighteen years Johannesburg’s economy has grown faster than that of South Africa as
a whole. The result of this performance is a City output which in 2013 was some 92% larger than in
1996 – compared with the 70% for South Africa as a whole. This (in relative terms) favourable
economic performance, is also reflected in employment statistics: despite inwards migration, the
City had in 2013 a higher proportion of working age people in employment than any other South
African City i.e. 60%. This statistic does however also expose the scale of the unemployment
problem - some 40% of working age people in the City are not in formal employment”.30 Although
this rate is lower than that of other metros, it is still unsustainably high with recent data from Stats
27 This was calculated using the Census 2011 population figure for Johannesburg Municipality, and then
projected using UN Growth Rate Predictions from Figure 9. 28
Everett, D. (2014). Poverty and Inequality in the Gauteng City-Region. In P. Harrison, Gotz, G, Todes, A, and C. Wray (Eds.), Changing Space, Changing City: Johannesburg after apartheid (pp. 63-81). Johannesburg: Wits Press. 29
Un Habitat (2010). State of the World’s Cities 2010/2011 Bridging the Urban Divide. Pp.20. 30
Economic Development Strategy for the City of Johannesburg Department of Economic Development, City Johannesburg. 2015

41 Spatial Development Framework 2016/17
SA showing that the country and Johannesburg have in the last few years lost rather than created
jobs31.
“The urgency of achieving faster economic growth and accelerating job creation in the City economy
is emphatically underscored by this aggregate data. Without faster economic growth and
significantly increased job creation the livelihoods necessary to address poverty and inequality will
not be forthcoming”. Despite 1996 to 2004 being characterised by good economic growth, the
annual estimates of people living in poverty have increased consistently from 2003 to 2013. The
percentage of Johannesburg’s residents living in poverty increased from 30% in 2003 to 33% in
2013.32
The structure of output in the City’s economy today is dominated by the financial sector, with
community services, trade and accommodation and manufacturing also significant contributors. This
is a shift in the economic base of the city from resources and manufacturing, to services. In 2013,
sector contributions to output were: Finance, Real Estate and Business Services (32%), Community,
Social and Personal Services (20%), Wholesale and Retail Trade, Catering and Accommodation (16%),
Manufacturing (16%), followed at some distance by Transport Storage and Communication (8%),
Construction Contractors (4%), Electricity, Gas and Water (2%), Mining and Quarrying (1%) and
Agriculture less than 1%.
Figure 10: Sector Economic Growth (Economic Development Strategy for the City of Johannesburg, 2015 pg. 8)
Apart from the sectoral structure of the economy, the spatial distribution of the urban economy has
significant implications for future growth of the city. Factors such as location, connectivity,
accessibility, infrastructure, diversification of activities and services, and levels of interdependence
31 Stats SA. (2016, May 9). Quarterly Labour Force Survey, Quarter 1: 2016. Retrieved May 15, 2016, from Stats
SA: http://www.statssa.gov.za/publications/P0211/P02111stQuarter2016.pdf
32 Economic Development Strategy for the City of Johannesburg Department of Economic Development, City
Johannesburg. 2015. Pp. 6.

42 Spatial Development Framework 2016/17
with the economic patterns of the wider city region, have a marked influence on the potential for
future development.
Spatial Distribution of the Urban Economy
While economic indicators suggest Johannesburg is well placed in terms of its competitiveness,
inequality in the city (specifically the spatial inequality that is apparent in its structure) is a tough
reality that must be addressed.
The city economy is centred on two regions of significant economic activity. The Inner City and
Sandton nodes and their immediate regions, (Region E and F respectively), constitutes 50% of the
city’s economic output but only house 23% of the city’s population.
In contrast the south western regions of the city stretching from Soweto to Orange Farm only
contributes to 13%, (9% and 4% respectively), of the city’s economy but house 41% of the
population. The southern parts of the city have consistently reported the highest percentage of
people living in poverty. Most of the south western regions’ sectoral growth dynamics remain weak
when compared to other regions. Most of the areas south of the N12 highway have low
interdependence and interconnectedness with the main economic centres in the City region and as a
result attract limited economic investment. An exception is in Soweto where the community, social
and personal services sector grew the fastest of all regions, reflecting both demand and public sector
efforts to improve service delivery in the region.
Apart from the low economic energy in southern Johannesburg, there is also a significant east-west
division of the space economy. The economic activity along the M1 that links the CBDs of
Johannesburg and Pretoria, and the area east of the M1 accounts for 62% of the city’s economy. If
the Randburg region (Region B) is added to this total, then 72% of the city’s economy is generated in
the northern and eastern quadrants of the city. The economic necessity of agglomeration and linking
of economic centres in the city region is clearly illustrated by the orientation of the city’s economy to
Tshwane to the north and Ekurhuleni to the east. This trend is further emphasised by the constant
growth and increase in economic share of the north-eastern quadrant of the city over the past 18
years.

43 Spatial Development Framework 2016/17
Figure 11: Spatial Economic Distribution (blue: economic contribution; orange: population)
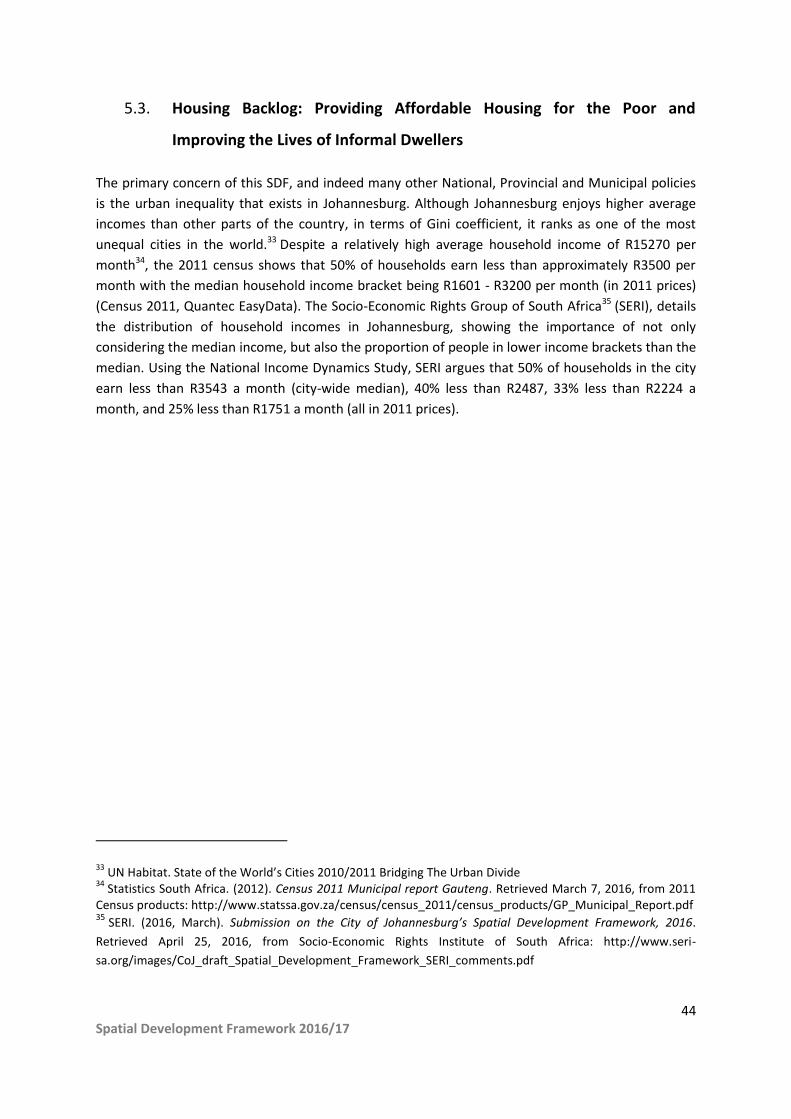
44 Spatial Development Framework 2016/17
Housing Backlog: Providing Affordable Housing for the Poor and 5.3.
Improving the Lives of Informal Dwellers
The primary concern of this SDF, and indeed many other National, Provincial and Municipal policies
is the urban inequality that exists in Johannesburg. Although Johannesburg enjoys higher average
incomes than other parts of the country, in terms of Gini coefficient, it ranks as one of the most
unequal cities in the world.33 Despite a relatively high average household income of R15270 per
month34, the 2011 census shows that 50% of households earn less than approximately R3500 per
month with the median household income bracket being R1601 - R3200 per month (in 2011 prices)
(Census 2011, Quantec EasyData). The Socio-Economic Rights Group of South Africa35 (SERI), details
the distribution of household incomes in Johannesburg, showing the importance of not only
considering the median income, but also the proportion of people in lower income brackets than the
median. Using the National Income Dynamics Study, SERI argues that 50% of households in the city
earn less than R3543 a month (city-wide median), 40% less than R2487, 33% less than R2224 a
month, and 25% less than R1751 a month (all in 2011 prices).
33 UN Habitat. State of the World’s Cities 2010/2011 Bridging The Urban Divide
34 Statistics South Africa. (2012). Census 2011 Municipal report Gauteng. Retrieved March 7, 2016, from 2011
Census products: http://www.statssa.gov.za/census/census_2011/census_products/GP_Municipal_Report.pdf 35 SERI. (2016, March). Submission on the City of Johannesburg’s Spatial Development Framework, 2016.
Retrieved April 25, 2016, from Socio-Economic Rights Institute of South Africa: http://www.seri-
sa.org/images/CoJ_draft_Spatial_Development_Framework_SERI_comments.pdf
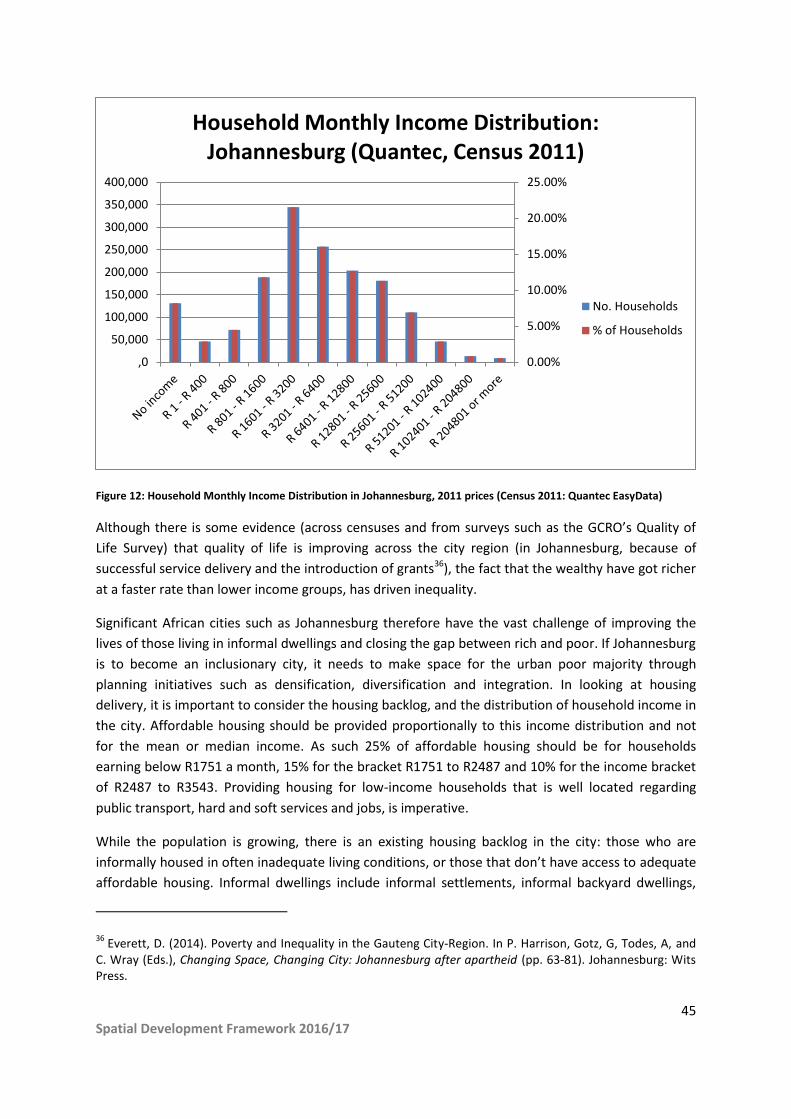
45 Spatial Development Framework 2016/17
Figure 12: Household Monthly Income Distribution in Johannesburg, 2011 prices (Census 2011: Quantec EasyData)
Although there is some evidence (across censuses and from surveys such as the GCRO’s Quality of
Life Survey) that quality of life is improving across the city region (in Johannesburg, because of
successful service delivery and the introduction of grants36), the fact that the wealthy have got richer
at a faster rate than lower income groups, has driven inequality.
Significant African cities such as Johannesburg therefore have the vast challenge of improving the
lives of those living in informal dwellings and closing the gap between rich and poor. If Johannesburg
is to become an inclusionary city, it needs to make space for the urban poor majority through
planning initiatives such as densification, diversification and integration. In looking at housing
delivery, it is important to consider the housing backlog, and the distribution of household income in
the city. Affordable housing should be provided proportionally to this income distribution and not
for the mean or median income. As such 25% of affordable housing should be for households
earning below R1751 a month, 15% for the bracket R1751 to R2487 and 10% for the income bracket
of R2487 to R3543. Providing housing for low-income households that is well located regarding
public transport, hard and soft services and jobs, is imperative.
While the population is growing, there is an existing housing backlog in the city: those who are
informally housed in often inadequate living conditions, or those that don’t have access to adequate
affordable housing. Informal dwellings include informal settlements, informal backyard dwellings,
36 Everett, D. (2014). Poverty and Inequality in the Gauteng City-Region. In P. Harrison, Gotz, G, Todes, A, and
C. Wray (Eds.), Changing Space, Changing City: Johannesburg after apartheid (pp. 63-81). Johannesburg: Wits Press.
0.00%
5.00%
10.00%
15.00%
20.00%
25.00%
,0
50,000
100,000
150,000
200,000
250,000
300,000
350,000
400,000
Household Monthly Income Distribution: Johannesburg (Quantec, Census 2011)
No. Households
% of Households
46 Spatial Development Framework 2016/17
and formal buildings that are informally occupied (sometimes referred to as ‘bad buildings’). While
these areas are sometimes well located (a reason that people may have chosen to live there) they
are often poorly serviced (if at all), living conditions are often inadequate, and they can pose risks to
their inhabitants, from fire to flooding, illness and crime.
Due to the nature of informality, reliable statistics are difficult to achieve, however there are some
sources of data. According to the Census 2011, 17.4% of Johannesburg’s households live in informal
settlements or informal backyard dwellings. The census indicates that there are 125,800 households
living in informal settlements, and some 124,000 households living in informal backyard homes.
According the City’s studies, however, in 2012 there were an estimated 164,939 informal structures
located within informal settlements in the City with the largest concentration in the Ivory Park area.
Backyard dwellings accounted for about 320,652 families; higher than what is quoted in census data
figures. The largest concentration of backyard dwellings is located in the Soweto area.37
37 Sustainable Human Settlements Urbanisation Plan, 2012

47 Spatial Development Framework 2016/17
Figure 13: The Location of Informal Backyard Dwellings in Johannesburg (GTI, 2012)
Important to note, according to census figures, is that the number of households living in informal
settlements has declined from 2001 to 2011, while households living in informal backyard dwellings
have increased significantly (Table 1). The decline in households living in informal settlements may
be due to government housing and upgrading programmes, and due to a move to backyard
accommodation. Regardless of this, the backlog is significant and needs to be addressed.

48 Spatial Development Framework 2016/17
Table 1: Households Living in Informal Settlements and Informal Backyard Dwellings, 2001 to 2011 (Source: Census 2001
and 2011, Quantec EasyData)
Year Informal Settlements
(households) Informal backyard dwellings
(households)
Number % of all CoJ Households
Number % of all CoJ Households
2001 133,400 12.7% 78,572 7.5%
2011 125,788 8.8 % 123,977 8.6%
% change 2001 to 2011 -5.71%
57.79%
Existing Spatial Structure 5.4.
The spatial structure that currently defines the City of Johannesburg can be summarised in terms of
the following dominant elements:
An established Inner City core or CBD which still functions as a significant economic focus of
the City. It is also anchored on the two dominant development corridors that cross the city-
region.
A series of activity nodes of varying intensities and functional characteristics that have
established around the core over time.
An east-west urban corridor system that has grown around the key rail, road, and
industrial areas that supported the mining industry that formed the basis of the city’s
historic growth.
A related belt of mining land and residue areas, immediately south of the east-west
corridor, that is a significant development buffer (but also an area with great
development potential) between the northern and southern parts of the city.
A spatially and economically marginalised pattern of settlement to the south-west,
centred around the Soweto area and home to approximately 40% of the city’s population,
characterised by low to medium r e s i d e n t i a l density sprawling settlement, with
relatively low levels of economic activity and generally poor connectivity to the urban
areas and economic opportunities to the north.
An economically strong northern corridor characterised by a major mobility spine
supporting accessibility routes, and now a regional mass transit system (Gautrain).
An area of mainly residential development, predominantly medium to upper income,
structured around a series of nodes and radial links between the Inner City and the ring
road (N1).
An area of predominately low income, traditional “blue collar” residential settlement
south of the Inner City area, separated by the mining and industrial belt.
49 Spatial Development Framework 2016/17
A series of marginalised, predominantly low income, residential areas with low levels of
economic activity, jobs and land use diversity.
A growing fringe of low residential density, and generally spatially exclusive, housing
development on the northern fringe of the city.
Marginalised and environmentally rich areas in the Southern Parts of the City.
Pockets of under-utilised, well located pieces of land within the urban structure such as
those in the Modderfontein and Frankenwald areas.
In interpreting the current city structure morphologically, Johannesburg displays a unique structure
of inverted polycentricity, inherited largely from its complex history. This structure is characterised,
inter-alia, by peripheral or satellite nodes that are disproportionately large compared to, and
disconnected connected from the main urban centre (Inner City). It is also characterised by an
illogical density gradient, where core economic areas are surrounded by large low to medium
density residential areas. Many high density residential areas are located on the outskirts of the city,
and far from job and economic opportunities. This spatial contradiction translates into a job housing
mismatch and has a significant impact in terms of social exclusion, energy and carbon intensity (by
increasing travel time and travel distances from jobs to housing) and economic productivity (by
jeopardising agglomeration economies) with most commuter flows being directed to the city centre.
Shortcomings of the Current City Structure 5.5.
The spatial structure of the city presents a number of significant challenges to future urban
development processes, most notably:
• Urban sprawl and limiting densities.
• High levels of spatial inequality and a mismatch between jobs and housing.
• Fragmentation and spatial disconnection.
• Limited diversity and inefficient land use patterns.
• Increasing pressure on the natural environment.
Understanding these spatial shortcomings, the dynamics that drive them and the opportunities that
exist for addressing them provide a basis for moving forward with a new transformative vision for
the city.

50 Spatial Development Framework 2016/17
Urban sprawl and limiting densities 5.5.1.
Urban growth in Johannesburg has not occurred in a compact manner. Despite the fact that over the
last 20 years the city has become denser (with population having grown at a faster rate than the
built up area footprint38) the city has grown in a fairly sprawled fashion. This is due to both apartheid
and post-apartheid planning. Apartheid planning sprawled the city by design, placing large portions
of the population in peripheral ‘dormitory townships’, while post 1994, there has been dispersed
and piecemeal growth in the city (including gated and car oriented developments and public housing
developments on the outskirts of the city). As such, densities and concentrations of jobs and people
have not adequately developed to support a sustainable city. There have however been successes in
diversifying and densifying certain parts of the Johannesburg.
A density analysis shows that one third of the population (1.45 million inhabitants) is concentrated in
5% of the urban area (87km²), with a residential density of 16,000 inhabitants per km². This figure is
to be compared with international benchmarks and best practices. Successful compact cities display
a much higher density in the urban core such as Paris with 21,200 people/km² or Manhattan in New
York City with 27,000 people/km².
Table 2: Variable population densities across the City of Johannesburg (Census, 2011)
AREA
POPULATION DENSITY (People/ km2)
Hillbrow
68 400
Alexandra Ext. 47
52 900
Yeoville
19 400
Killarney
12 300
Cosmo City
4 500
Radiokop Ext. 10
3 200
Houghton Estate
1 100
Blue Hills Agricultural Holdings
350
The City’s average population density of 2,695 persons per km2 is often quoted, although it is
misleading due to the relatively large (in international terms) area of the municipality. The built up
38 Angel, S., Parent, J., Civco, D. L., and Blei, A. M. (2010). The Persistent Decline in Urban Densities: Global and
Historical Evidence of ‘Sprawl’. Cambridge, MA: Lincoln Institute of Land Policy.

51 Spatial Development Framework 2016/17
area only makes up a portion of the entire municipal area and has a population density of between
5,700 and 6,500 people per square km.39 Even this is considered low.
Compared to established residential areas of the City, newer townhouse and cluster developments
have relatively higher average residential density. These new developments are focused on private
vehicle use however and are frequently located in single use clusters, with limited access to public
transit infrastructure. As such they generally do not foster walkable neighbourhoods and often have
not been met with the requisite public infrastructure (e.g. public schools, clinics etc.).
Important to note is the fact that some of the highest residential densities in the city are some
distance from the core, and from economic activity. Soweto, Orange Farm, Diepsloot and Ivory Park
for example reflect relatively high residential densities but are all limited in their land use diversity.
Erven of 250-350m2 are common in these areas typically translating into densities of 40-60du/ha or
10,000 to 20,000 people per square km.
Extensive analysis of prevailing patterns in land use change, based on different types of
development applications, has been undertaken by the city, with some key trends identified:
Subdivision of land is not necessarily related to the public transportation network and is
most prevalent within the northern suburbs of the City and within the ring of freeways
to the north and south of the CBD (Figure 23 pg. 63).
62% of rezoning applications for higher density development are within walking distance
of nodes of the City or public transportation network.
Residential building applications accounted for more than 96% of applications submitted
and 75% of the building area approved.
There are diverse consequences of sprawl for the City. These include increased costs of
administering electricity, waste management, water, sewage and transport services through
centralised systems. Urban sprawl significantly contributes to climate change. Sprawled and
fragmented urban forms have very high per capita carbon emissions and energy consumption.
This relates firstly to transportation: low densities and fragmentation create higher average
travel distances, and thus higher per capita energy consumption. Second, there are higher
energy costs in moving goods, services and waste into, around and out of the city.
Beyond energy and carbon emissions, low densities and sprawled single use settlements
impact infrastructure needs per which capita increases when density decreases. Comparing a
compact city like Seoul or Tokyo to Johannesburg, road network investment length (and cost) per
capita is multiplied by 6 and waste water network length and costs are multiplied by 3.5. At the
39 Harrison, P., Gotz, G., Todes, A., and Wray, C. (2014). Materialities, subjectivities, and spatial transformation
in Johannesburg. In P. Harrison, G. Gotz, A. Todes, and C. Wray (Eds.), Changing Space Changing City:
Johannesburg After Apartheid (pp. 2-41). Johannesburg: Wits Press. Pp. 9.
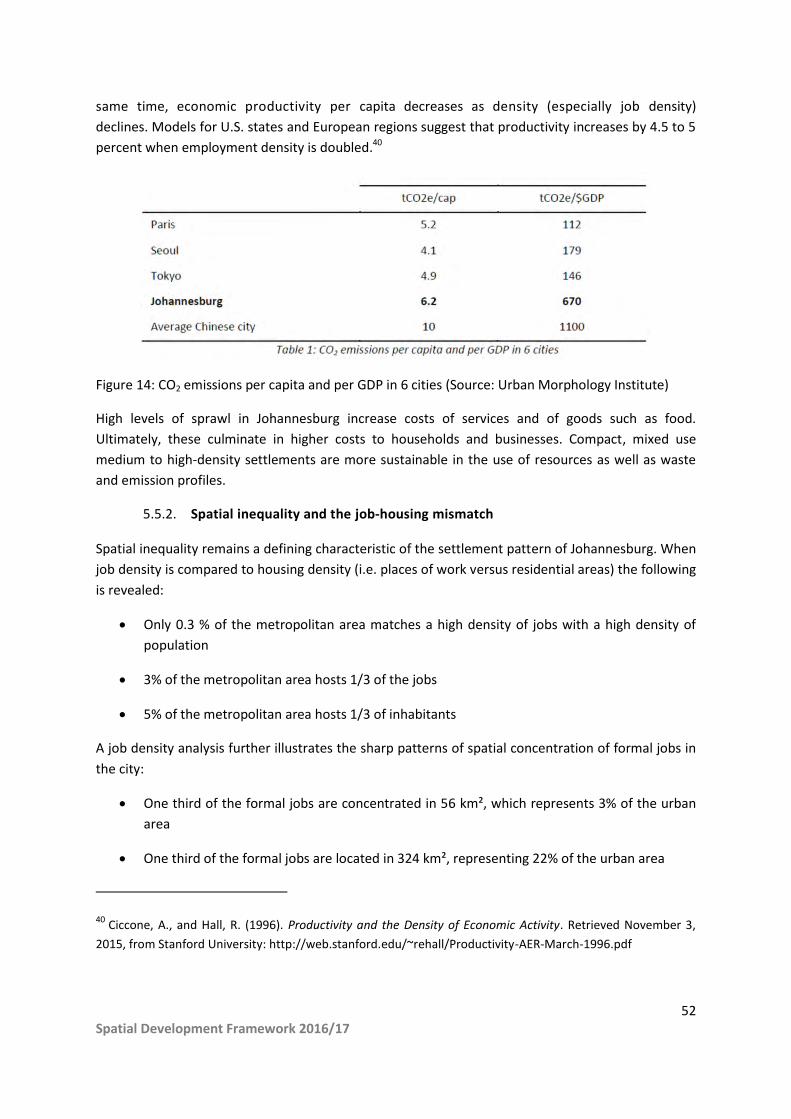
52 Spatial Development Framework 2016/17
same time, economic productivity per capita decreases as density (especially job density)
declines. Models for U.S. states and European regions suggest that productivity increases by 4.5 to 5
percent when employment density is doubled.40
Figure 14: CO2 emissions per capita and per GDP in 6 cities (Source: Urban Morphology Institute)
High levels of sprawl in Johannesburg increase costs of services and of goods such as food.
Ultimately, these culminate in higher costs to households and businesses. Compact, mixed use
medium to high-density settlements are more sustainable in the use of resources as well as waste
and emission profiles.
Spatial inequality and the job-housing mismatch 5.5.2.
Spatial inequality remains a defining characteristic of the settlement pattern of Johannesburg. When
job density is compared to housing density (i.e. places of work versus residential areas) the following
is revealed:
Only 0.3 % of the metropolitan area matches a high density of jobs with a high density of
population
3% of the metropolitan area hosts 1/3 of the jobs
5% of the metropolitan area hosts 1/3 of inhabitants
A job density analysis further illustrates the sharp patterns of spatial concentration of formal jobs in
the city:
One third of the formal jobs are concentrated in 56 km², which represents 3% of the urban
area
One third of the formal jobs are located in 324 km², representing 22% of the urban area
40 Ciccone, A., and Hall, R. (1996). Productivity and the Density of Economic Activity. Retrieved November 3,
2015, from Stanford University: http://web.stanford.edu/~rehall/Productivity-AER-March-1996.pdf
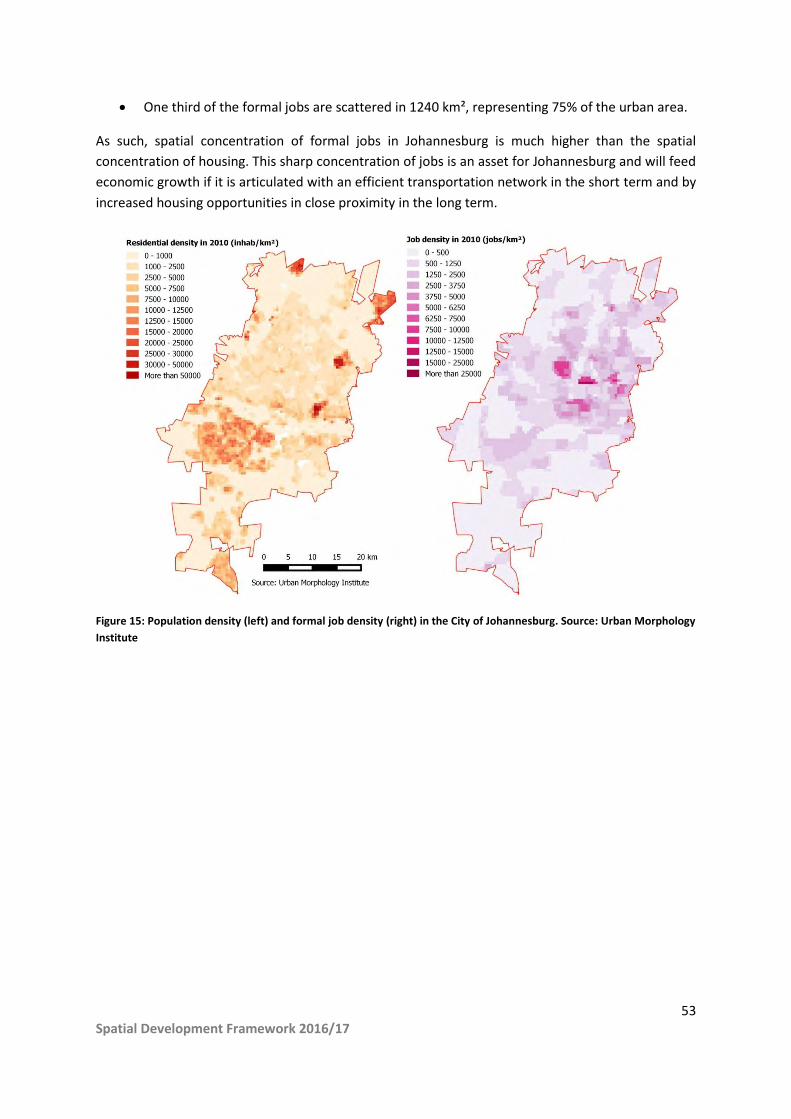
53 Spatial Development Framework 2016/17
One third of the formal jobs are scattered in 1240 km², representing 75% of the urban area.
As such, spatial concentration of formal jobs in Johannesburg is much higher than the spatial
concentration of housing. This sharp concentration of jobs is an asset for Johannesburg and will feed
economic growth if it is articulated with an efficient transportation network in the short term and by
increased housing opportunities in close proximity in the long term.
Figure 15: Population density (left) and formal job density (right) in the City of Johannesburg. Source: Urban Morphology
Institute

54 Spatial Development Framework 2016/17
Figure 16: Administrative regions in the City of Johannesburg and their share of economic output
The concentration of jobs relates to the significant variation in economic output across the city’s
regions. Regions E and F (which house Sandton and the Johannesburg CBD respectively) account for
50% of the city’s economic output. Together regions A, B and C contribute 37%, while regions D and
G only contribute 13%, despite housing significant proportions of the metro’s population.41
Historically, housing for low income residents has been delivered in areas that are distant from main
economic sectors on cheap and available land, rather than on land that is optimal for urban
development. Continuing to meet housing demand in this manner would not only exacerbate
existing socio-economic disparities in the city, but entrench a growing pattern of spatial inequality.
In most cases (with exceptions, such as the Inner City), the areas with highest population densities
are also the areas with the lowest concentration of formal jobs. These areas include Soweto, Orange
Farm, Diepsloot and Ivory Park, to name a few.
This illustrates a job-housing mismatch in the city’s spatial form, a significant contributor to
inequality. When population densities are overlaid onto a deprivation map (Figure 17), it reveals
that, generally, the highest densities are in the most deprived areas which are far from areas of
economic opportunity. This spatial inequality is inherited from apartheid planning which was based
on racial and functional zoning.
41 Economic Development Strategy for the City of Johannesburg 2015

55 Spatial Development Framework 2016/17
Figure 17: Deprivation (green to red) and Densities (grey columns)
Fragmentation and spatial disconnection 5.5.3.
Spatially, the city of Johannesburg displays a high degree of fragmentation that is evident across all
scales of development. At the City-Region and metropolitan scale, there is a broad divide between
northern and southern development areas, a pattern that is evident across Gauteng.
Two key discontinuities in the urban fabric present significant development potential in the urban
system. The first is the mining belt.
While the whole mining belt represents urban fragmentation in the city by dividing it north/south,
the effects in the western parts of the belt are most prominent. In particular, it separates Soweto
from economic centres along the western corridor from Krugersdorp (in Mogale City) through
Roodepoort, towards the Inner City. As already mentioned, this feature, while historically
representing fragmentation, holds great potential for development towards the integration and
transformation of Johannesburg.
The second key discontinuity lies to the north-east of the city, around the areas of Modderfontein42,
Frankenwald and Linbro Park. This area represents a key opportunity to create an east-west
connection to Ekurhuleni and OR Tambo Airport and its surrounding Aerotropolis. For various
42 Which is currently being developed.

56 Spatial Development Framework 2016/17
reasons, these areas have remained undeveloped as the city has grown around them, notably along
the corridor between Johannesburg and Pretoria. Many are drawing development energy and
investment now, however.
At more localised levels, the issues of fragmentation and spatial disconnection are evident, very
often as a result of patterns of urban development. The trend in the northern parts of the city
towards ‘security estates’ has major implications in this regard, effectively sterilising large parts of
the urban system and creating significant buffers to sustainable and inclusive urban form.
In analysing the connectivity of the street networks in the City of Johannesburg, a mapping exercise
was undertaken showing intersections per km². The analysis highlighted most of the metropolitan
area (93%) falls below 100 intersections per km², an internationally recognised connectivity
benchmark to support walkability.
The high level of spatial inequality in the city is reflected in the urban spatial form and in high levels
of securitisation with the proliferation of strip malls and gated office parks and townhouse
developments. These are characterised by controlled street patterns that have moved from the
historically open grid to the clustered cul-de-sac, loop and ‘lollipop’ configuration contributing to
fragmentation and low levels of walkability.
Figure 18: Intersection density across Johannesburg
57 Spatial Development Framework 2016/17
Limited diversity and inefficient land use patterns 5.5.4.
The City of Johannesburg covers 1,645 km2 and is characterised by a wide range of land uses and
patterns, shaped over time by myriad factors, including geology (the basis of the mining industry),
politics (the segregating policies of apartheid planning), industry and more recently national,
regional and international migration.
The pattern of land use in the city is dominated by residential development, accounting for almost
30% of total settlement area. Economic activity, or land use that generates jobs, accounts for only
10% of the developed area. This includes land developed for business, commercial, industrial and
demarcated mining land.
The two maps in Figure 19 below display the spatial structure of land use in Johannesburg. To map
the local diversity of land use, land use diversity indexes have been calculated within a 500m x 500m
grid. The higher the land use diversity index, the higher the mix of uses (commercial, residential or
community use). These maps show that most of the city has a land use diversity index below 0.8,
which is considered as the best practice benchmark. The separation of land uses contributes to
increasing average distances travelled. Hence, separation of land uses and zoning impact on (1)
climate and energy intensity, by increasing energy needs for transportation, (2) social inclusion, by
making jobs and social infrastructure less accessible to low income households and (3) economic
productivity, by separating economic activities from labour and limiting agglomeration economies.43
High levels of land use diversity are paramount, especially around transit stations. To reap the full
benefits of public transit investment, the target for land use diversity indexes within 1km catchment
areas should be set within the 0.80 - 0.90 range, which will ensure high levels of mixed use in close
proximity to transit infrastructures.
43 Ewing, R., and Cervero, R. (2010). Travel and the Built Environment. Journal of the American Planning
Association, 76(3).

58 Spatial Development Framework 2016/17
Figure 19: Land uses (left) and land use diversity index (right). Source: Urban Morphology Institute
At the present time, urban areas along the Corridors of Freedom remain significantly lower than
international best practice in terms of urban intensity (residential density, job density and built
density). To reap the full benefits of transit investments in terms of generalised accessibility and
modal switch to public transit, it is essential to implement an ambitious strategy of intensification of
the urban fabric in very close proximity to public transit.
Residential and job density analyses carried out within the Corridors of Freedom catchment areas
provide valuable insights when compared to international benchmarks and best practices. Figure 20
and Figure 21 compare the share of people living and working within 500m, 1km and 2km of public
transit in three cities (London, New York and Copenhagen) and in Johannesburg using the current
densities/projected BRT network. In London, New York and Copenhagen one quarter of people live
less than 500m from public transit and half live within 1km. In the three cities, between one third
and half of all jobs are located less than 500m from public transit, two thirds less than 1km.
With the current/projected BRT scheme in Johannesburg, and taking into account current residential
and job density spatial distributions, only a limited number of residents and workers will be in close
proximity to transit facilities.
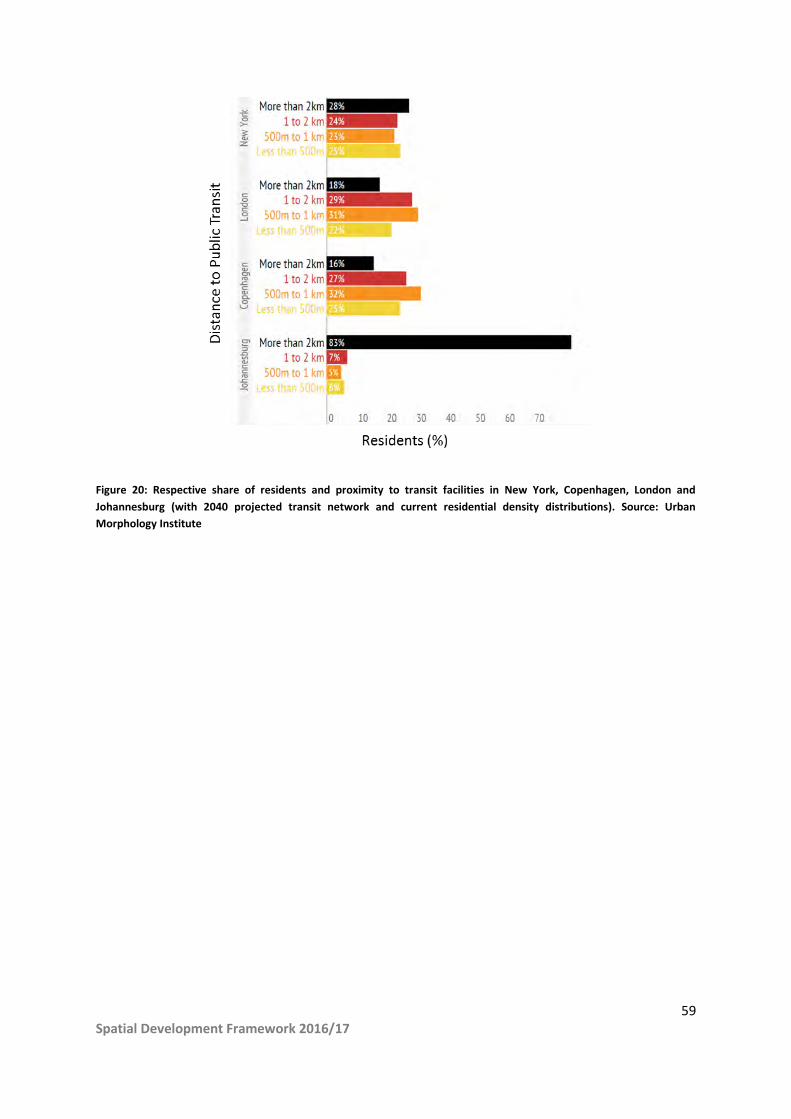
59 Spatial Development Framework 2016/17
Figure 20: Respective share of residents and proximity to transit facilities in New York, Copenhagen, London and
Johannesburg (with 2040 projected transit network and current residential density distributions). Source: Urban
Morphology Institute
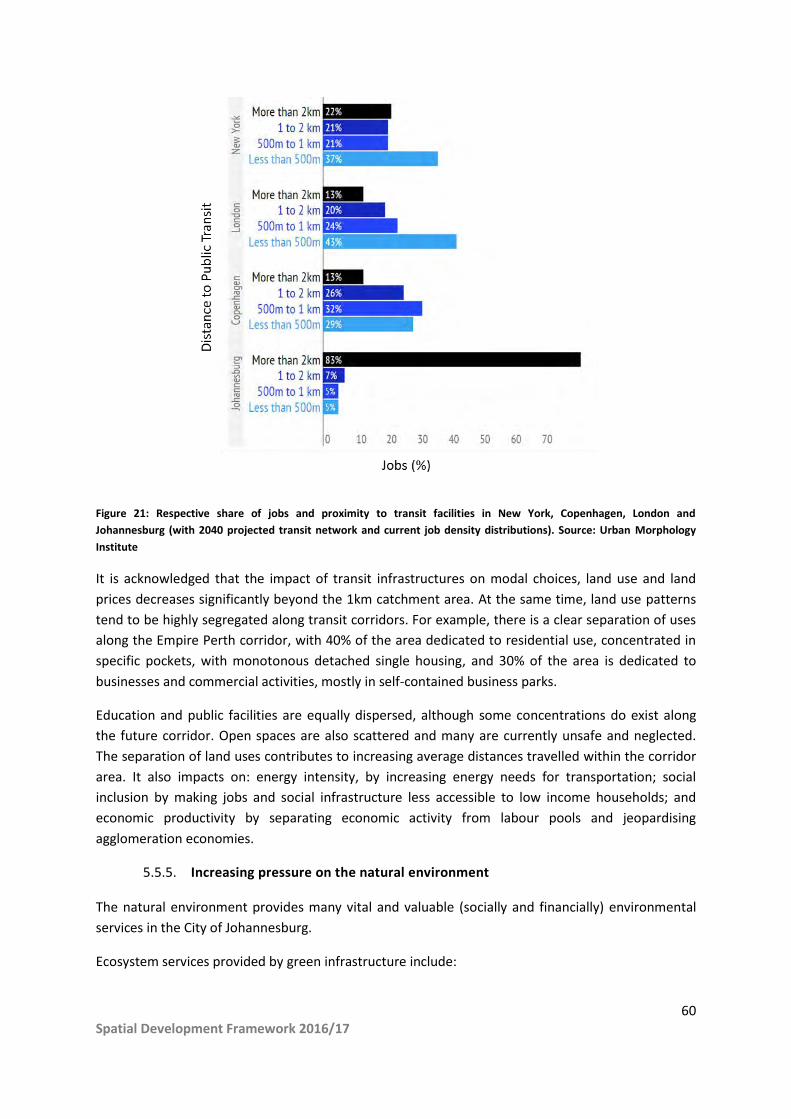
60 Spatial Development Framework 2016/17
Figure 21: Respective share of jobs and proximity to transit facilities in New York, Copenhagen, London and
Johannesburg (with 2040 projected transit network and current job density distributions). Source: Urban Morphology
Institute
It is acknowledged that the impact of transit infrastructures on modal choices, land use and land
prices decreases significantly beyond the 1km catchment area. At the same time, land use patterns
tend to be highly segregated along transit corridors. For example, there is a clear separation of uses
along the Empire Perth corridor, with 40% of the area dedicated to residential use, concentrated in
specific pockets, with monotonous detached single housing, and 30% of the area is dedicated to
businesses and commercial activities, mostly in self-contained business parks.
Education and public facilities are equally dispersed, although some concentrations do exist along
the future corridor. Open spaces are also scattered and many are currently unsafe and neglected.
The separation of land uses contributes to increasing average distances travelled within the corridor
area. It also impacts on: energy intensity, by increasing energy needs for transportation; social
inclusion by making jobs and social infrastructure less accessible to low income households; and
economic productivity by separating economic activity from labour pools and jeopardising
agglomeration economies.
Increasing pressure on the natural environment 5.5.5.
The natural environment provides many vital and valuable (socially and financially) environmental
services in the City of Johannesburg.
Ecosystem services provided by green infrastructure include:

61 Spatial Development Framework 2016/17
“provisioning services that relate to the products derived from an ecosystem, including
food, fibre and fuel, genetic resources, medicines and pharmaceuticals
regulating services that involve the benefits derived from the regulation of ecosystem
processes, such as air quality regulation, climate regulation, water regulation, erosion
regulation, disease regulation, pest regulation and natural hazard regulation
cultural services are the benefits people obtain from ecosystems such as reflection,
recreation, inspiration, and aesthetic enjoyment, and include cultural diversity and
educational values, and
supporting services are those necessary for the production of all other ecosystem services,
such as soil formation, photosynthesis, primary production, nutrient cycling and water
cycling.”44
As such, these areas are not merely nice to have, but essential in the functioning of the city. If the
services are lost, they will need to be replaced, at great cost (in terms of capital outlay and operating
cost) by city authorities. A 2013 report by the GCRO for example, calculates the value of ecosystem
services provided by open space and natural assets in Johannesburg at between R 38.6 million and R
77 million per annum. The report also gives a current value of these natural assets, of between R966
million and R 1.9 billion. 45
A key defining characteristic of the City of Johannesburg is its remarkable urban forest, underpinned
by an extensive wetland system. There are six million trees in Johannesburg - 1.2 million within the
parks and on the pavements, and 4.8 million in private gardens throughout the suburbs. This system
provides valuable ecosystem services, including air quality and storm water regulation and should be
protected.
The sheltering and shading effect of trees can save as much as 10% of annual energy
consumption, and cut down the air pollution caused by burning fossil fuels and particulates.
The urban forest plays a major role in moderating rainstorm impact and droughts; the
cooling effect of the canopy reduces wear and degradation of the road surface.
Of the 164,499.6ha of the Johannesburg Municipality, only 54,081.7ha (32.9%) remains in a natural
state (South African National Biodiversity Institute). There are a total of 10 reserves in the City
covering only 993.7ha (0.6% of the municipality). This represents an inadequate level of protection
for the city’s ecosystems.
44 Schäffler, A., Christopher, N., Bobbins, K., et al. (2013). State of Green Infrastructure in the Gauteng City-
Region. Johannesburg: Gauteng City-Region Observatory. Pp. 126. 45
Same as above.
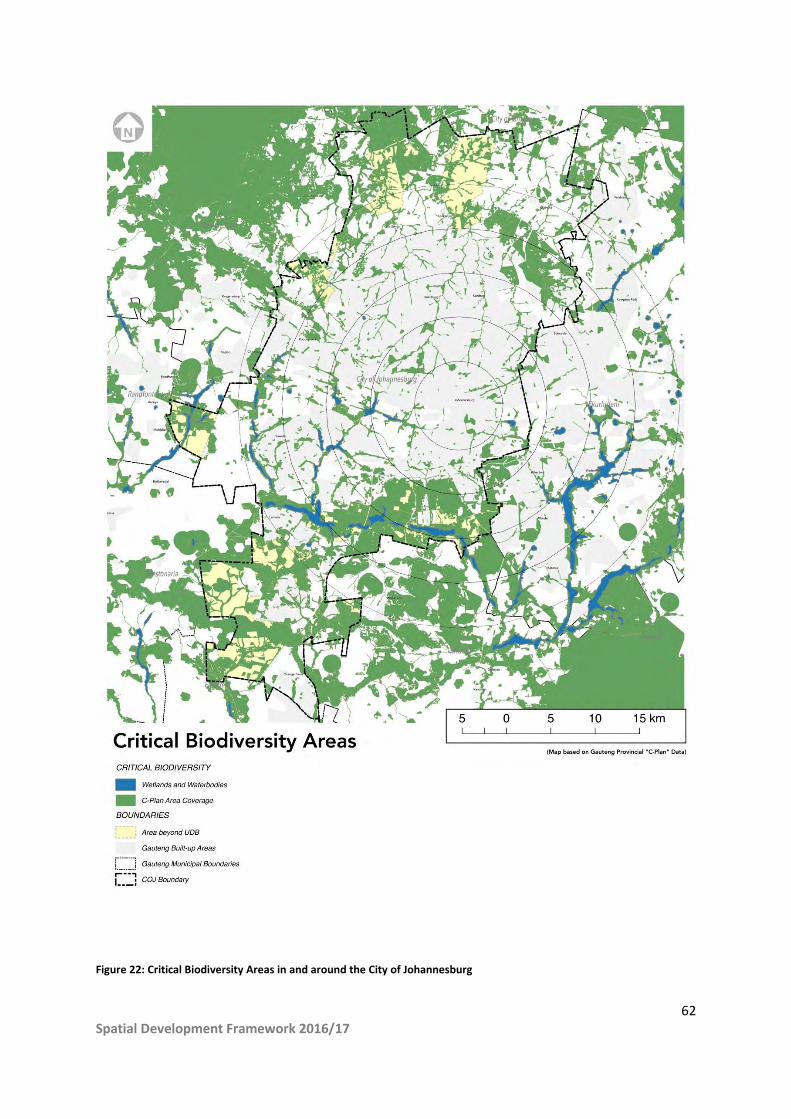
62 Spatial Development Framework 2016/17
Figure 22: Critical Biodiversity Areas in and around the City of Johannesburg
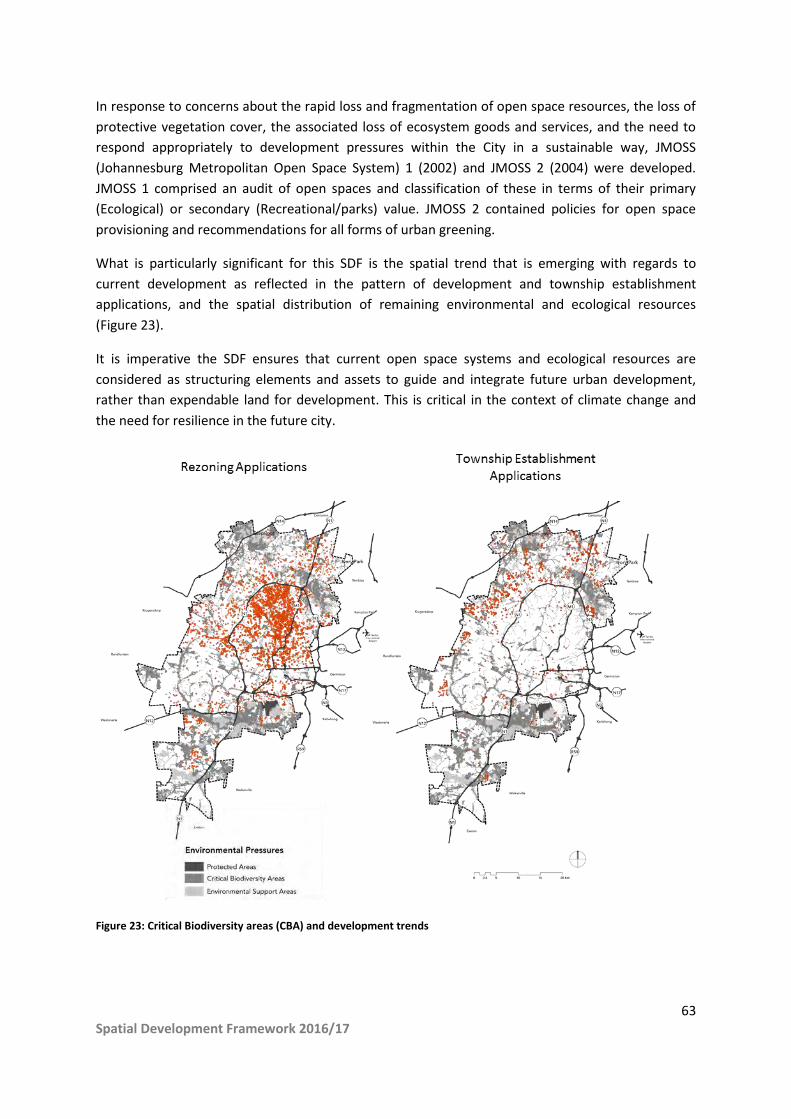
63 Spatial Development Framework 2016/17
In response to concerns about the rapid loss and fragmentation of open space resources, the loss of
protective vegetation cover, the associated loss of ecosystem goods and services, and the need to
respond appropriately to development pressures within the City in a sustainable way, JMOSS
(Johannesburg Metropolitan Open Space System) 1 (2002) and JMOSS 2 (2004) were developed.
JMOSS 1 comprised an audit of open spaces and classification of these in terms of their primary
(Ecological) or secondary (Recreational/parks) value. JMOSS 2 contained policies for open space
provisioning and recommendations for all forms of urban greening.
What is particularly significant for this SDF is the spatial trend that is emerging with regards to
current development as reflected in the pattern of development and township establishment
applications, and the spatial distribution of remaining environmental and ecological resources
(Figure 23).
It is imperative the SDF ensures that current open space systems and ecological resources are
considered as structuring elements and assets to guide and integrate future urban development,
rather than expendable land for development. This is critical in the context of climate change and
the need for resilience in the future city.
Figure 23: Critical Biodiversity areas (CBA) and development trends
64 Spatial Development Framework 2016/17
Implications of the Prevailing Development Pattern 5.6.
Urbanisation is a reality to which the city’s spatial policy and other city policies must respond. It is
evident that the current spatial structure and development patterns in the city require revisiting if
we are to meet our future urban challenge in a manner that is responsive to the identified policy
principles of spatial justice, spatial resilience, spatial sustainability, spatial efficiency, spatial quality
and spatial transformation. Although current policy seeks to address the challenges that face our
city; the prevailing development pattern, that needs to be addressed, is still one of:
Sprawl and disconnection.
A spatial mismatch between residents and jobs.
Monofunctional land uses with low diversity at the local scale.
A finite and threatened natural structure with social and spatial fragmentation accentuating
the divide between incomes and populations.
The current pattern of job dispersal within the city results in and exacerbates: socio-economic
exclusion; poor mobility; high congestion; high energy and carbon intensity; high infrastructure costs
and jeopardises urban productivity.
65 Spatial Development Framework 2016/17
6. A Future City
Chapter Summary: During the SDF review process three alternative spatial trajectories were
modelled, with accompanying scenario analysis. Each scenario was based on the hypothetical growth
of Johannesburg from 4.3 million to 7 million inhabitants by 2040. The first described a scenario
where the city continues to sprawl and disperse, scattering population and jobs across the
metropolitan area. The second model described a ‘corridor development’ scenario where future
development occurs along an expansive public transport network linking peripheral marginalised
areas to the Inner City. The third scenario is a ‘compact polycentric’ model with ambitious
intensification (more jobs, residents and services) in metropolitan cores of different sizes with high
access to transit infrastructure. The compact polycentric city model performed significantly better
than the other two in terms of economic, environmental and social impact indicators. Therefore the
spatial vision outlined in the review of the SDF 2040 is a compact polycentric city model, opposing
spatial inequality and long commuting distances, promoting a denser, diversified, spatially just city,
where people have easy access to jobs and urban amenities, and the natural environment is
protected. The vision of the polycentric city model is built around the principles of: compactness,
inclusivity, connectivity, efficiency, resilience, sustainability and job creation.
Spatial Vision 6.1.
As is evident from the previous chapter, the City of Johannesburg faces numerous challenges moving
forward, and the SDF must provide a basis for dealing with the key issues confronting the city.
The spatial transformation of Johannesburg will require a focused shift from the apartheid legacy
and spatial patterns of the past to unlock the potential of the city. Today’s decisions and
interventions will begin transforming the urban spatial and social form into a particular development
direction for future decades. Real opportunities exist for embracing a new urban paradigm that is
more conducive to both the present and long-term needs of Johannesburg’s population.
Johannesburg now has an opportunity to seek policy and strategic directions that incorporate long-
term sustainability for social, environmental and economic development.
To address these priorities the following goals for transformation are essential:
From sprawl, fragmentation and inverted polycentricity to compact polycentricity.
From job-housing mismatch to spatially matching people, jobs and skills.
From mono-functional land uses to mixed use densities.
From spatial disconnection to a connected city (through public transit and improved
walkability).
From limited diversity to mixed land use, with traditional zoning supplemented by form
based codes.
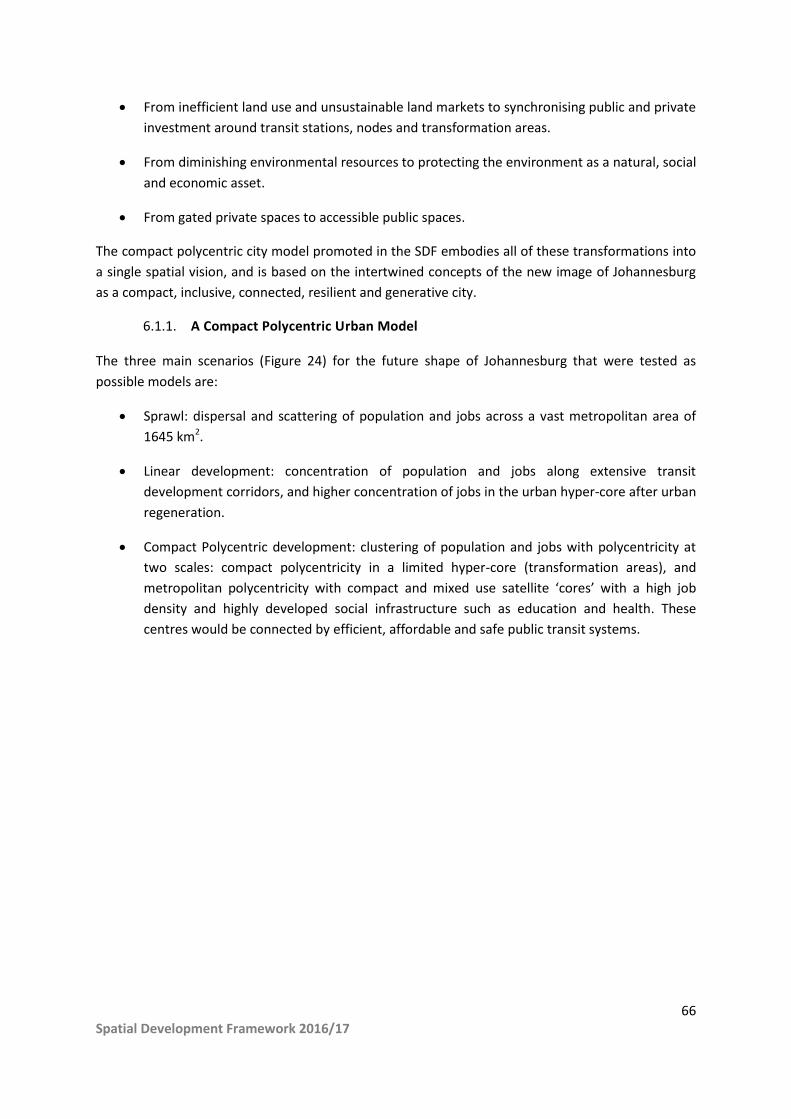
66 Spatial Development Framework 2016/17
From inefficient land use and unsustainable land markets to synchronising public and private
investment around transit stations, nodes and transformation areas.
From diminishing environmental resources to protecting the environment as a natural, social
and economic asset.
From gated private spaces to accessible public spaces.
The compact polycentric city model promoted in the SDF embodies all of these transformations into
a single spatial vision, and is based on the intertwined concepts of the new image of Johannesburg
as a compact, inclusive, connected, resilient and generative city.
A Compact Polycentric Urban Model 6.1.1.
The three main scenarios (Figure 24) for the future shape of Johannesburg that were tested as
possible models are:
Sprawl: dispersal and scattering of population and jobs across a vast metropolitan area of
1645 km2.
Linear development: concentration of population and jobs along extensive transit
development corridors, and higher concentration of jobs in the urban hyper-core after urban
regeneration.
Compact Polycentric development: clustering of population and jobs with polycentricity at
two scales: compact polycentricity in a limited hyper-core (transformation areas), and
metropolitan polycentricity with compact and mixed use satellite ‘cores’ with a high job
density and highly developed social infrastructure such as education and health. These
centres would be connected by efficient, affordable and safe public transit systems.

67 Spatial Development Framework 2016/17
Figure 24: Modelled Scenarios: Sprawl (top); Corridor Development (middle); Compact Polycentric (bottom) (Source:
Urban Morphology Institute)
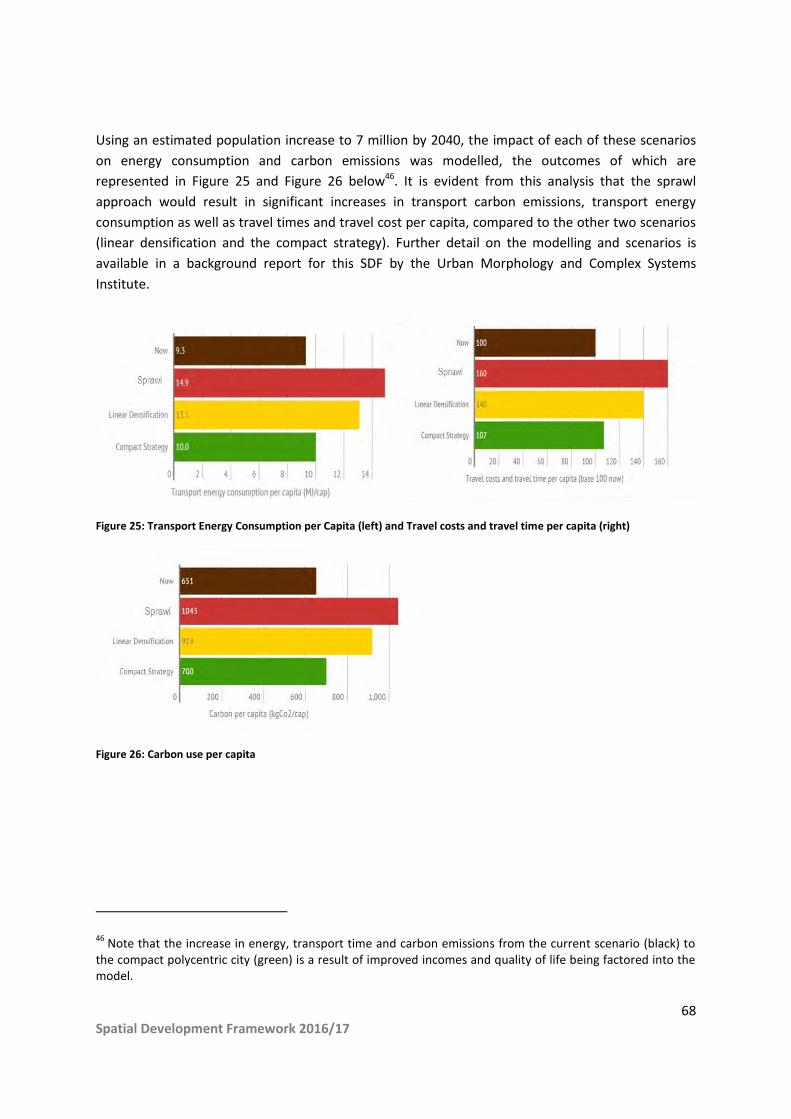
68 Spatial Development Framework 2016/17
Using an estimated population increase to 7 million by 2040, the impact of each of these scenarios
on energy consumption and carbon emissions was modelled, the outcomes of which are
represented in Figure 25 and Figure 26 below46. It is evident from this analysis that the sprawl
approach would result in significant increases in transport carbon emissions, transport energy
consumption as well as travel times and travel cost per capita, compared to the other two scenarios
(linear densification and the compact strategy). Further detail on the modelling and scenarios is
available in a background report for this SDF by the Urban Morphology and Complex Systems
Institute.
Figure 25: Transport Energy Consumption per Capita (left) and Travel costs and travel time per capita (right)
Figure 26: Carbon use per capita
46 Note that the increase in energy, transport time and carbon emissions from the current scenario (black) to
the compact polycentric city (green) is a result of improved incomes and quality of life being factored into the model.
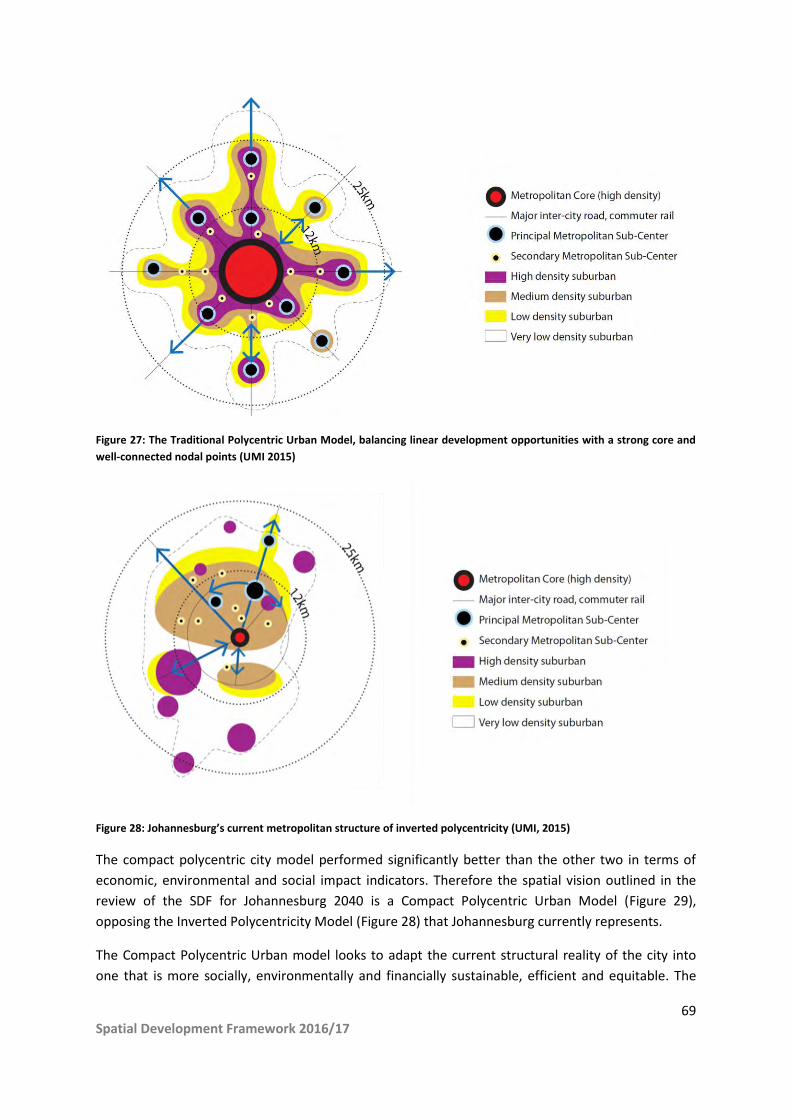
69 Spatial Development Framework 2016/17
Figure 27: The Traditional Polycentric Urban Model, balancing linear development opportunities with a strong core and
well-connected nodal points (UMI 2015)
Figure 28: Johannesburg’s current metropolitan structure of inverted polycentricity (UMI, 2015)
The compact polycentric city model performed significantly better than the other two in terms of
economic, environmental and social impact indicators. Therefore the spatial vision outlined in the
review of the SDF for Johannesburg 2040 is a Compact Polycentric Urban Model (Figure 29),
opposing the Inverted Polycentricity Model (Figure 28) that Johannesburg currently represents.
The Compact Polycentric Urban model looks to adapt the current structural reality of the city into
one that is more socially, environmentally and financially sustainable, efficient and equitable. The

70 Spatial Development Framework 2016/17
model seeks to create a well-connected (by public transit and other transport routes) series of dense
metropolitan centres and sub-centres, each immediately surrounded by high density residential and
mixed use areas, with residential densities declining with distance from these nodes or centres.
Densification should also occur along defined corridors, specifically the Corridors of Freedom and
the Randburg – OR Tambo Corridor. The model looks to maximise the potential of the current nodal
structure of the city, while addressing the spatial inequalities that exist.
The model is based on five broad strategies, all conceptually depicted in Figure 29 below. In no
particular order (as they should happen concurrently) they are: First, to strengthen the Inner City as
the metropolitan core of Johannesburg. This will be through intensification of housing delivery and
strengthening economic activities in and around the Inner City, diversifying land uses and expanding
the core south to Turffontein. Second is to introduce efficient, safe and affordable public transit
systems to effectively connect the city’s metropolitan core and sub-centres. Third is to densify and
diversify development in defined development corridors, such as the Corridors of Freedom and the
Randburg - OR Tambo corridor. Fourth is to intensify mixed use and high density residential
development in and around economic nodes in the city (including mixed use and TOD nodes). Fifth,
is to introduce centres of local economic activity and better services to high density, marginalised
residential areas (the ‘townships’) to allow them to function as more integrated suburban areas in
their own right. In these areas, higher intensity development should happen in and around mixed
use nodes and public transit stations. The model opposes spatial inequality and long commuting
distances and promotes a denser, spatially just city, where people have easy access to jobs and city
amenities.
Figure 29: Johannesburg Future City Model: Compact Polycentric Urban Form
The model builds a Gauteng City-Region perspective which respects the interconnectedness of the
City of Johannesburg to the surrounding local municipalities by connecting areas on or near the
municipal boundary not only to the economic centre of Johannesburg, but to appropriate nearby
economic nodes within and outside of the boundary of the City of Johannesburg. The model enables,
71 Spatial Development Framework 2016/17
rather than merely transporting people to jobs and social services, bringing jobs to where people are
and people to where jobs are. The Polycentric Compact Urban Model directly combats both spatial
inequality and inaccessibility of jobs, as well as long commuting times, traffic congestion and
pollution.
Transformation Themes and Spatial Opportunities 6.2.
A number of themes have been identified as goals of this SDF. These are detailed below.
The Compact City 6.2.1.
The Compact City strategy aims to intensify urban land use through a combination of higher
residential densities and centralisation, mixed land uses, and development limits outside of a
designated area.47
Outcomes
Compactness reduces physical distances and travel times, bringing people closer to their jobs, public
facilities and social amenities, thus generating the urban space for interactions between citizens with
different incomes and social origin. The Compact City is environmentally and economically
sustainable: increasing density and proximity helps to reduce energy consumption for transportation
as well as improves land use management and preservation of rural land and biodiversity. The city
generated through medium to high-density settlements, also reduces cost of services, public
facilities and infrastructure provision, increasing economic sustainability and feasibility.
Indicators
By creating high-density, mixed use areas, cities can accommodate population growth and ensure
land is used in accordance with demand without compromising the City’s natural assets. UN-
Habitat’s residential density principle proposes at least 15,000 people/km², to make optimal use of
scarce land both on the city and neighbourhood scale. It must be noted that densification on its
own cannot make cities more liveable and sustainable, but that this densification should happen
in conjunction with a mixing and intensification of land uses linked with high accessibility. In this
light, diversification is needed in high density residential areas, and residential densification is
needed in core areas with access to economic activity and city infrastructure (including social
services, public transit and bulk infrastructure).
To ensure job accessibility, a target of at least 1 job for two inhabitants (job-housing ratio equal to
0.5) should be aimed at, that is at least 7,500 jobs/ km², but with much higher job densities in
economic centres.
Strategies
47 Churchman, A. (1999). Disentangling the Concept of Density. Journal of Planning Literature, 13(4), 389-411.

72 Spatial Development Framework 2016/17
Compact development prioritises development close to and radiating from a strong urban core,
where the definition of high-density development is based primarily on the concentration of jobs,
businesses and dwelling units. The development approach focusses on infill and redevelopment
(brown field48) in favour of green-field development on the outskirts of the city. The new polycentric
compact city model will combine density (in terms of housing, jobs and urban amenities), proximity,
accessibility to public transit, and diversity of land uses in order to establish an urban hierarchy and
logic.
A basic principle to guide future growth and development is to view appropriate densification as the
first response to meeting growth demands. There are significant vacant or underutilised land parcels
in well located areas within the existing urban fabric that should be unlocked and released for
development or re-development. In addition, there should be a related shift towards more
sustainable typologies for urban development, particularly residential development, in well located
urban areas. New residential developments, including those in the affordable and subsidised housing
sectors, should move away from the detached house option, towards row and cluster mixed use
urban forms including housing, offices and shops as the basic building model for urban development.
Importantly, redevelopment of existing buildings to higher density is fundamental in the city of
Johannesburg.
Densification of existing built-up areas does not mean that investment in new infrastructure will not
be required. In fact, it means the opposite. This SDF promotes pre-emptively upgrading
infrastructure in key transformative areas (defined later in the document) to promote private sector
development and densification. In the longer term, this form of infrastructural investment will be
more efficient, and cost-effective, than continually expanding infrastructural systems outwards.
Spatial opportunities
With reference to the emerging spatial framework of the city, the following key spatial opportunities
exist as a basis for moving towards a more compact urban form. Integrated development of business
and residential densification should occur:
Around key public transport facilities (existing and future).
As a mixed-use response within the CBD, increasing intensity and capacity in the Inner City.
Around current and future mixed use and economic nodes.
Within transformation areas identified in this SDF, specifically where nodes exist in these
areas (for example the nodes and ToD nodes in Soweto).
Around existing social service facilities, including schools, healthcare and public open space.
48 Brown field land, in this document, refers to developed or undeveloped land within the existing urban fabric
of the city. Brown field development refers to the refurbishing of buildings, demolition and re-development, or development of unused land in the existing urban fabric (within existing townships).
73 Spatial Development Framework 2016/17
The Inclusive City 6.2.2.
The Inclusive City – ensuring balanced service provision (hard and soft) and opportunities for all by
diversifying land uses, promoting social mixing and bridging social, spatial and economic barriers.
The delivery of services to different social groups and neighbourhoods, spatial integration through
urban connectivity and the creation of a liveable city are rights related to Inclusivity.
Outcomes
The objectives of the social mix areas are to promote more social inclusivity and interaction and
avoid exclusion, to attract a diverse array of services, and to foster multi-level employment within
communities.
Johannesburg represents, for many inhabitants from the Southern African sub-region, the
opportunity of a more prosperous future. As presented earlier in this document the future of
Johannesburg will be strongly influenced by migration and the SDF needs to respond to this in an
inclusive manner. The arrival-city is defined as the urban enclave where tight social networks
provide the essential services to urban newcomers, such as affordable housing and assistance in
finding entry-level jobs. The adequate planning and management of the social aspirations of
newcomers is the strength that will breathe life into the city and create new integral parts of the
economy of Johannesburg.
Indicators
The UN Habitat principle with regards to social mix suggests that 20%-50% residential space should
be reserved for affordable housing.
Strategies
Inclusivity is achieved through a social mix, understood as the spatial integration of different social
and economic groups to build a healthy and vibrant city. Inclusivity and compactness are deeply
intertwined, as inclusivity is fostered by the proximity to jobs and services, social mix, increased
feasibility of service provision in dense areas, the reduction of household expenditure in transport
and energy consumption, and the availability of a range of nearby housing typologies that are a
result of compactness.
Understanding, managing and supporting Johannesburg’s social advancement ladder and planning
for the median will unlock the potential of development of the city. Nevertheless, in this process,
specific attention must be set to ensure that the most vulnerable groups are able to exercise their
Rights to the City. A significant percentage of the economic activity of the city will be informal in
these enclaves. Understanding and creating the enabling mechanisms for support and formalisation
will undoubtedly translate into a progressive shift in the city’s economy. It is important to endorse
informality for its positive effects and support its adaption where it yields undesirable effects.
Challenges on the social sphere for Johannesburg are the provision of housing and land tenure for
deprived groups and the reinforcement of safety and security. Enhancement of safety and security
inside the city will be a key component to foster integration and promote a more sustainable way of

74 Spatial Development Framework 2016/17
life, through safe neighbourhoods with walkable streets and developments balancing residential,
offices and commercial uses.
Overcoming spatial inequality in Johannesburg requires rethinking urban systems such public
transport (formal and informal) and putting in place systems that create a high density of jobs
matched with a high density of housing. This is particularly important for the urban poor who are
generally those who must travel farthest at great cost to places of work and to access social services
such as education and healthcare. Here, a move must be made from merely transporting people to
jobs each day, to creating housing opportunities near jobs, and creating job intensive economic
opportunities in high density residential areas. This must be done through matching local skills with
relevant economic growth opportunities at metropolitan and regional scales.
A key concern here is to balance the supply of new housing and related social infrastructure, with
the creation of new employment and related economic opportunities. This is particularly significant
when one considers the anticipated socio-economic pattern of housing demand, which is
predominantly in the lower income sectors of the population. The City’s Sustainable Human
Settlements Urbanisation Plan (SHSUP) estimates housing demand for Johannesburg up to 2030
noting that the majority of housing demand will be for low income households (earning less than
R3500 income per month). If this housing delivery is to improve the socio-economic circumstances
of beneficiaries over time it must be located close to job opportunities and not on peripheral green
field sites.
Future housing delivery must be considered in the context of the future spatial economy if the city is
to address the job-housing mismatch that exists. A recent study undertaken by the city has shown
that Johannesburg can expect positive annual growth across all sectors and regions except the
Mining sector for the period 2013-2018.
The CoJ’s economy is primarily dependent upon the finance and business sector, community
services, trade and manufacturing. This suggests a need for economic transformation that creates
opportunities in other sectors that are currently not performing well in the City.
The existing distribution of population density, poverty and unemployment also needs to be
considered, with the southern parts of the city reporting the highest levels of poverty. In order to
address this inequality, in the short term reliable, affordable and efficient public transport
connections are needed to the south of the city to link people to jobs, and in the medium to long
term economic development and job growth in the south of the city is needed to allow people to
lead productive lives, close to where they live. This development should be around existing nodes in
the south of Johannesburg, especially Soweto, which this SDF promotes as transformation area with
diversification of land use (from predominantly residential, to include increased economic activity),
the introduction of better public transport links, and the delivery of improved social services. Where
warranted new nodes should also be investigated and delineated in the south of the city that will
promote job creation and economic development. This will be done through the nodal review
process that will follow the publication of this SDF. Lastly, public and private initiatives in the south
of the city that promote economic growth and job creation should be supported, such as the
Klipriviersberg Economic and Ecosystem Development Zone (KEEDZ) initiative, that seek to not only

75 Spatial Development Framework 2016/17
preserve natural assets and green infrastructure, but also to maximise their economic and social
potential through agribusiness, tourism and leisure initiatives.
Enhancing social inclusivity is a cornerstone principle of sustainable urbanism. There are many
aspects to social inclusivity: at the broadest level; this deals with the notion of people centred
cities, whereby citizens have equal opportunities and an active role in shaping their futures.
Participation in decision-making is therefore an essential aspect of social inclusivity.
Spatial opportunities
The key spatial imperatives and opportunities that support a more inclusive city include:
Overcome the spatial barriers that have separated people and places in the city by
establishing new opportunities and development patterns.
Connect people to people and people to jobs by providing public transit, intensifying street
networks and addressing street network disconnections.
Intensify and grow areas of greatest inclusivity.
Plan mixed-use areas instead of single use residential areas and use financial, legal and
regulatory frameworks to bring opportunities and jobs to people
Densify and diversify single use areas by: delivering mixed-use commercial, infrastructure
(hard and soft) and cultural activities to residential only areas; providing housing
opportunities near to economic centres and supporting commercial activity and housing in
light industrial areas (however not at the cost of job opportunities).
Plan affordable housing with mixed housing typologies in each new development, enhancing
the social mix.
Focus on the creation of public spaces and amenities to create opportunities for interaction.
The inequalities that exist in the spatial structure of the city are equally evident in the quality
of the public environment, with a clear distinction in quality of parks and open spaces in
different parts of the city. This should be addressed.
The Connected City 6.2.3.
Connected City – enhancing physical and ICT infrastructure at provincial and all urban scales to re-
connect the city, starting from ‘the Corridors of Freedom’ to street and neighbourhood-level
connectivity
Outcomes
Connectivity strengthens the physical, social and virtual relationship between people, places and
goods. At a regional level, connectivity links centres of production and consumption with the view of
strengthening systems of cities and urban-rural linkages.
76 Spatial Development Framework 2016/17
Regionally, Johannesburg is the centre of the Gauteng province which is home to 12 million
inhabitants, 25% of the South African population. Connectivity with the other countries, provinces,
municipalities, towns and cities will foster economic development through specialisation of activities
and economies of agglomeration. A trans-boundary vision of regional linkages is vital to introducing
sustainable economic growth in Johannesburg and developing new linkages with global markets and
emerging world economic powers.
At a city level, connectivity is closely related to mobility and the permeability of an area. At a
neighbourhood level, connectivity is linked to the public realm (including street) design, walkability,
ground floor and street facing activities and a network of public spaces.
Specifically, street connectivity refers to the density of connections and nodes in a street
network and the directness of the links between places, correlating positively with increased
efficiency (and multi-modality) of flows and access to jobs and services. As connectivity
increases, travel distances and congestion decrease and route options and travel modes
increase allowing more direct travel between destinations, creating a more accessible and
efficient system that is less prone to failure. Connected street networks are internally and
externally well connected. Fine grain grids represent highly connected street networks, while
disconnected layouts are represented by larger scales, gated enclaves and cul-de-sac and loop
intensive layouts. These low connectivity layouts are not supported as development options within
this policy framework.
This principle proposes a grid and a hierarchy of streets with arterial and secondary roads that
are well connected through intersections. The grid pattern allows for continuous and connected
public realm and supports walkability and alternative transit modes. Healthy communities are
fostered by a connected city where streets and public spaces are interlinked and provide a
continuum for economic and social activities to flourish.
Indicators
As an indicator, in developing countries land allocated to streets (including sidewalks) is low, ranging
between 6-12%, compared to cities in developed countries where it averages 29%. Additional 15-
20% land should be allocated for other open/green public spaces. Intersection densities should
range between 80 and 120 intersections per square kilometre.
The City’s Integrated Public Transport Network and Gauteng Provinces 25-year Integrated Transport
Master Plan provide guidance on how connectivity will be strengthened going forward. The SDF
supports, and has responded to these plans, indicated in Figure 30 and Figure 31.

77 Spatial Development Framework 2016/17
Figure 30: Trunk Routes: Johannesburg Strategic Integrated Public Transit Network49
49 City of Johannesburg. (2016). Integrated Public Transport Network. Johannesburg: City of Johannesburg.
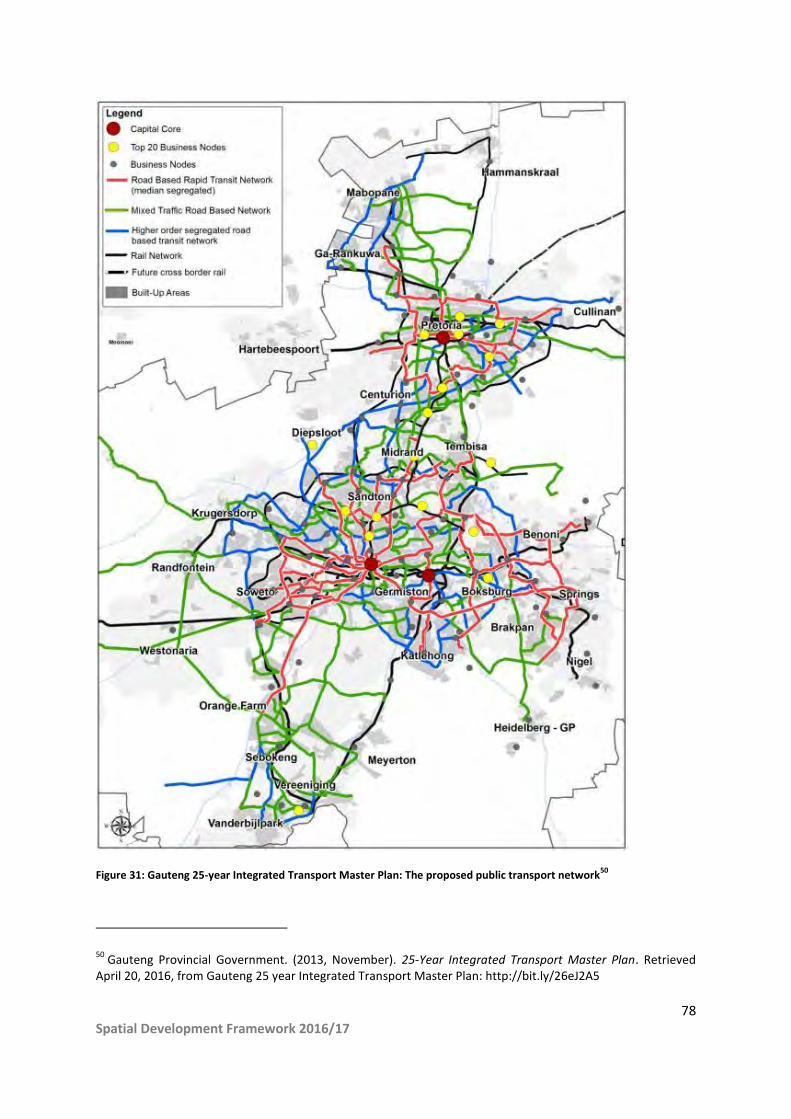
78 Spatial Development Framework 2016/17
Figure 31: Gauteng 25-year Integrated Transport Master Plan: The proposed public transport network50
50 Gauteng Provincial Government. (2013, November). 25-Year Integrated Transport Master Plan. Retrieved
April 20, 2016, from Gauteng 25 year Integrated Transport Master Plan: http://bit.ly/26eJ2A5
79 Spatial Development Framework 2016/17
A realisation in this SDF (and a departure from the previous one), based on the compact polycentric
model, is that transit corridors do not necessarily represent development corridors. There are cases
where development should be promoted at nodes along a transport corridor, and not along the
entire length of the corridor, and other examples, such as the Corridors of Freedom, where
development along corridors is promoted.
The Corridors of Freedom are the first step in the strategy of physical connectivity at a city
scale to mobilise the dynamic energy of the city, connecting important strategic nodes such as
Soweto, Inner City, Alexandra and Sandton to each other. These holistically designed economic,
social and infrastructure corridors are important tools to achieve compactness and
competitiveness, through an affordable and accessible mass public transit system that includes
both bus and passenger rail, and that provides mixed income housing, schools, offices,
community facilities, cultural centres, parks, public squares, clinics and libraries.
The design of the city must address the layout of street patterns to maximise connectivity, mixed
use blocks and the provision of high quality and continuous public space to encourage
walkability, social interaction and safety. Johannesburg has space to retrofit and redesign
disconnected street networks, enhance well connected ones, and design new networks to be well
connected.
Importantly, streets are not merely places for cars. UN-Habitat considers the street as the most
important public space where people interact on a daily basis. The street is a structural
element that shapes urban form and determines the pattern of development of blocks,
buildings, open spaces and landscape. Sufficient, accessible and well-designed space allocated to
streets contributes to improved walkability and connectivity, which fosters economic
development.
Communication networks and ICT’s are playing an increasingly important role to promote social
advancement and integration. Virtual connectivity in Johannesburg enables access to
information and education, fosters job creation and entrepreneurship and enhances
competitiveness and social participation. It also reduces the need for physical connectivity and
commuter trips. ICT connectivity is currently being supported by the City’s Smart City Initiative,
which is providing affordable (sometimes free) internet across locations in Johannesburg.
Physical and ICT connectivity at all scales must ensure that the economic potential of the city
and the region are fully utilised. In order to achieve competitiveness, it is essential to create jobs
closer to citizens, located in new centralities and/or in current mainly residential areas like
Soweto, Diepsloot, Ivory Park, and Orange Farm. The renewal and revival of the Inner City (CBD)
as the heart of the new compact polycentric city acts as the connector, bridging the historical
north-south divide.
Spatial opportunities
The key spatial imperatives and opportunities that support a more connected city include:
Promote global connectivity by drawing on the key transit corridors that connect the City to
the broader regional system, namely:

80 Spatial Development Framework 2016/17
o The North-South development Corridor between Johannesburg and Tshwane.
o The central East-West transport corridor that straddles the mining belt.
o A new mixed use development corridor, the Randburg – OR Tambo Corridor, running
from Randburg, through Sandton, Alexandra and Modderfontein towards the
aerotropolis around OR Tambo Airport.
Ensure public transport links between residential deprivation areas and economic centres.
Ensure future development contributes to, rather than reduces, levels of connectivity within
the city.
Address connectivity barriers to development through the redesign and refurbishment of
street networks in poorly connected areas.
Promote transit oriented, mixed use development around public transit stations (including
PRASA, Gautrain and BRT stations).
Focus on selected public transport corridors as one aspect of a connected city, primarily the
Corridors of Freedom.
The Resilient City 6.2.4.
Resilient city – Resilience spans over economic, social and environmental dimensions. Resilience,
fundamentally, is concerned with the ability of the city to withstand and adapt to changes over time,
including climate change. This implies continuous processes of innovation and transformation.
Outcomes
“Resilience refers to the capability of individuals, social groups, or social-ecological systems including
towns and cities not only to live with changes, disturbances, adversities or disasters but also to
adapt, innovate and transform into new more desirable configurations.”51 While it is more than just
environmental, resilience places a strong emphasis on protecting the natural environment as a
protection buffer, protecting valuable green infrastructure and areas of high agricultural potential,
promoting sustainable energy use, reinforcing the urban development boundary and protecting
biodiversity resources. Protecting and enhancing these resources is done towards protecting the
social, economic and environmental returns they generate.
Targets
51 Harrison, P., et al. (2014). Urban Resilience Thinking for Municipalities. University of the Witwatersrand and
Gauteng City-Region Observatory. Retrieved October 7, 2015, from: http://bit.ly/resiliencereport
81 Spatial Development Framework 2016/17
Urban resilience directly links to the climate change targets. The City adopted its Climate Change
Strategic Framework in late 2015. The City has set its long term target to between 40% and 65%
reductions by 2040 (from the 2007 baseline).
Contributing to these targets, 15-20% of land should be allocated for open/green public spaces.
Street area, including sidewalks should make up 30-45% of neighbourhood area. 30% of new housing
opportunities should be within 1km of public transit stops, 70% within 2km.
Strategies
A key resource and structuring element in a resilient city is the natural environment. The natural
environment must not be viewed as a limit to economic development, but rather a basis on which all
economic activity is founded – offering minerals, fresh air, water, a sense of relief from dense urban
environments and so forth. As such, it can be viewed as the ‘natural capital’ of any given area and
the provider of essential and valuable (socially and economically) ecosystem services (see section
5.5.5).
Environmentally sensitive and open areas pose unique, sometimes-overlooked opportunities to
development. It can create unique green infrastructure solutions, socio-economic, agricultural,
educational and tourism based opportunities.
Green open spaces, parks and gardens, secure and accessible to the public are a feature and asset of
all liveable cities. It is a competitive advantage determining quality of life. A metropolitan open
space system in a city is essential to a set of important functions, including improving air quality,
reducing the urban heat island, providing a habitat to species (for instance birds), allowing urban
agriculture, natural storm water systems, recreation and spiritual solace.
Density and compactness in a city should be complemented by a metropolitan open space system. A
metropolitan open space system is a key feature in increasing Johannesburg’s resilience, including
taking action against climate change and mitigating extreme weather events. For this reason, open
space must be protected and preserved to support the densification and infill imperatives of the city.
Johannesburg recognises its leading regional role in Climate Change Mitigation and Adaptation, as
well as the potential role that the city will play as the regional centre of innovation, development
and application of new technologies and solutions in the effort to curb, halt, reverse and adapt to
global climate change.
Anticipating climate change and integrating climate change mitigation and adaptation into the SDF
and urban planning practices of Johannesburg will help the city set a regional example of planning a
sustainable, resilient city.
Energy and resource efficiency is a prerequisite to maintain and extend the access to basic urban
services in Johannesburg at affordable levels. The way the city spatially develops will be a major
determining factor for both accessibility and affordability. Compact urban forms have proven to be
more resilient and have better coping capabilities in adapting to economic, social and environmental
changes. Sustainable buildings are able to conserve energy and resources, keeping costs down, while
82 Spatial Development Framework 2016/17
at the same time providing formidable spaces for working and living. A broader city-region
perspective is imperative, if sustainability is to be achieved.
Equally important is the latent and somewhat overarching opportunity for streets to accommodate
quality open space areas. The notion of Complete Streets will indeed play a key and central role in
SDF planning (albeit at the finer planning scale). The environmental co-benefits of these streets are
numerous, evidenced by studies which have found that cities with these types of streets enjoy inter
alia: better environmental sustainability, enhanced walkability, reduced traffic congestion, higher
productivity and quality of life, and higher levels of social inclusion.52
Spatial opportunities
Key spatial interventions and priorities in this regard include:
Protect and enhance Biodiversity resources by using them as structuring elements for
urbanisation and ecosystem services (including storm water, natural purification systems,
and public open space).
Consider JMOSS as an integrated social open space layer.
Integrate parts of the open space network that directly form part of the fabric of the built
environment with those that don’t.
Reinforce an urban development boundary, restricting any development in the ecological
backbone/footprint and disaster and hazard prone areas.
Consider the public environment, particularly streets, as a key open space contributor.
Plan natural buffer zones in the ecological footprint and disaster prone areas, protecting
from flooding and/or mining waste exposure.
The Generative City 6.2.5.
Generative city – Cities are traditionally generators of opportunity for people to build more healthy,
productive and meaningful lives, although their ability to generate real opportunities for a growing
urban population can be constrained by inefficient growth patterns, including sprawl. Spatial plans
and public investment should look to enhance this generative capacity of Johannesburg, to promote
opportunities for meaningful, productive lives for all.
Targets
A UN Report entitled “Streets as Public Spaces and Drivers of Urban Prosperity”53, suggests that
prosperous cities are those that recognise the importance and relevance of public spaces, and which
have allocated sufficient land to street development. It states that where the resulting City
52 UN Habitat. (2015). Streets as Public Spaces and Drivers of Urban Prosperity. Nairobi: UN Habitat.
53 UN Habitat. (2015). Streets as Public Spaces and Drivers of Urban Prosperity. Nairobi: UN Habitat.

83 Spatial Development Framework 2016/17
Prosperity Index (CPI) is closer to a factor of 1, cities enjoy: higher street connectivity, good
infrastructure development, provision of basic services – water, sanitation and drainage - , good
environmental sustainability, walkability and reduced traffic congestion, higher productivity and
quality of life and higher levels of equity and social inclusion. After studying 100 cities across the
globe, it found that Johannesburg has a low to moderate score of 0.5. This grouping of cities studied
includes ‘contemporaries’ such as Beijing, Casablanca and Sao Paolo. Johannesburg therefore needs
to perform better in this area to ensure enhanced city, and individual, well-being.
Strategies
Spatial complexity is an urban quality that is central to the future sustainability of the city.
Complexity in the urban system stems from a layering of patterns of activity over time that gives
character and diversity to the city. Functional zoning practices that have served to guide much of
Johannesburg’s growth and development have, to a large extent, stifled diversity by grouping, rather
than layering, complementary urban activities and functions. True urban complexity requires
delivery agencies and departments within the city to function in a similar “layered “approach.
The city must focus investment in areas where the potential for developing and sustaining true
mixed-use and efficient urban environments is greatest. Bid-rent modelling for the SDF suggests that
the Inner City, Soweto and the central public transport corridors provide the best opportunities for
creating sustainable and efficient urban structure. In addition, opportunities for new transit oriented
nodal areas must be promoted. The bid-rent model (Figure 32, below) provides important spatial
clues as to which parts of the city have more inherent development potential, based on their
generative capacity. The logic of movement and centrality is important in this regard, and as the
model shows that consolidating development around established urban elements such as
commercial nodes and activity links provides significant potential moving forward. An adapted
version of this model will be used in the nodal review process to follow the adoption of this SDF. A
key element of structure that can influence the generative capacity of the city is the public realm.
The public realm comprises of all public space including street space. This represents an important
layer of the built environment in that it provides the connections between different elements and
functions of the urban environment. A well-developed public environment serves as a fundamental
supporting layer to sustainable growth and development.

84 Spatial Development Framework 2016/17
Figure 32: Bid-Rent Model

85 Spatial Development Framework 2016/17
In the context of the city, the key contributors to the public environment include formal open
spaces, parks and streets (including sidewalks and non-motorised transport space). It also includes
public infrastructure such as public transit stations, clinics and libraries. The quality of the public
realm has a significant impact on social interaction, identity and economic investment of an area.
Importantly, the quality of the public environment acts as a support, and determines the quality of
the overall system.
The legibility or imageability of a place, to a large extent, determines the success of the place, and
assists in developing an understanding of the potential of a place to generate clear and memorable
images. An area which is successful in achieving this will attract a number of people and economic
activities in turn making the area viable. The initial impression of an area encourages the need by a
user to return. Features such as architectural character, interactions between buildings and the
public realm, street furniture, unique opportunities and places increase an area’s imageability.
Street Space is a key element of a generative urban structure, and very often becomes the focus of
economic opportunity and potential.
What is evident is that the generative propensity of the city in the future will depend on a range of
other factors, related to spatial connectivity and integration, diversity and mix of uses, and the
ability of the spatial structure of the city to support a wide range of urban users and operators.
Spatial opportunities
Key spatial opportunities for building a more generative urban structure in Johannesburg suggest the
following:
Focus on the Inner City.
Focus on the public realm, including streets.
Diversify high density residential areas to allow them to function as urban areas in their own
right
Diversify large commercial nodes.
Promote new transit nodes.
Consolidate and grow primary economic areas.
Promote a Generative Urban Structure through development regulations and assessment
processes that prevent new developments from becoming mono-functional and
disconnected “islands” in the urban system.

86 Spatial Development Framework 2016/17
7. Spatial Framework
Chapter summary: The spatial framework for Johannesburg 2040 builds on the spatial vision for the
future city as a Compact Polycentric City. The framework entails a series of strategies and
interventions in focus areas and at a city-wide scale. The spatial framework envisions Johannesburg
as a hierarchy of dense mixed use transformation areas, corridors and nodes, that integrate the
natural ecological system as a structuring layer, and that are connected by an efficient public transit
system.
Figure 33: Spatial Framework

87 Spatial Development Framework 2016/17
The analysis and transformation themes outlined in the previous chapters and the identified spatial
opportunities provide the basis the spatial framework to guide development in the city over the
coming decades. These areas will influence the city’s capital investment priority area model as well
as the consideration of development applications.
The spatial framework for Johannesburg 2040 is based on a compact polycentric structural system,
strongly focused on the natural ecological system as a structuring layer; a hierarchy of
transformation areas and dense mixed-use nodes efficiently connected by public transit
infrastructure.
The spatial system defines the boundaries of growth and investment of the city through an Urban
Development Boundary (UDB), anticipating future population growth and defining the limit of urban
growth towards the peripheries and sensitive natural areas. It also adds a second layer, of areas
neither outside the development boundary, nor within the Transformation Zone or nodes which are
referred to as the Consolidation Zone. Growth and densification will be controlled and regulated in
these areas. The Transformation Zone indicates areas where the development of detailed spatial
plans, where they don’t exist already, will be prioritised.
The key elements of the spatial framework are summarised as follows and indicated in Figure 33:
An Integrated Natural Structure
Transformation Zone o A strong, accessible and generative urban core o Corridors of Freedom o Unlocking Soweto as a true city district o Developing a Randburg – OR Tambo Corridor o Unlocking the Mining Belt
The spatial economy o Priority Economic Zones o A hierarchy of nodes as a focus for growth, consolidation, and reinvestment o Public transport station nodes as a focus of growth (TOD)
A Consolidation Zone o Deprivation areas o Established suburban, built up areas
Reinforcing the Urban Development Boundary
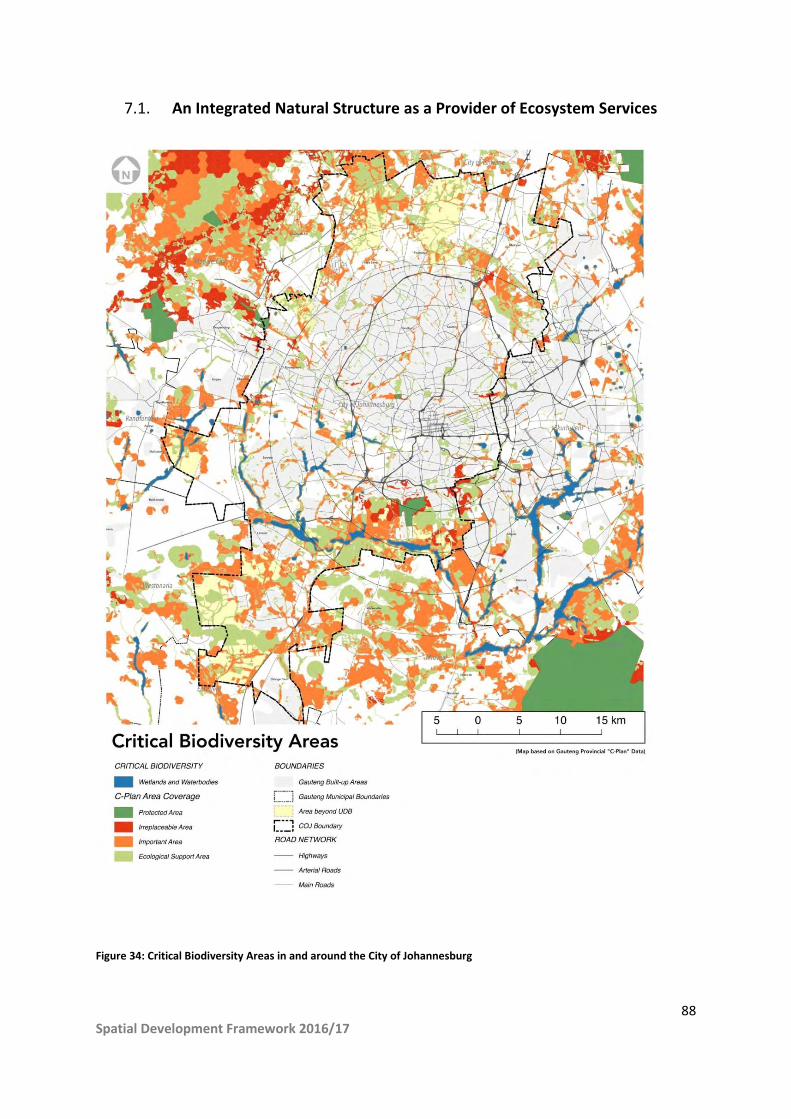
88 Spatial Development Framework 2016/17
An Integrated Natural Structure as a Provider of Ecosystem Services 7.1.
Figure 34: Critical Biodiversity Areas in and around the City of Johannesburg

89 Spatial Development Framework 2016/17
The natural environment becomes an increasingly important element in the structuring of the future
compact polycentric city. The critical biodiversity layer should be seen as a city asset that provides
valuable infrastructure services and not merely as unused land available for development. Protecting
these areas is not done for the sake of conservation alone, but to make surrounding developed parts
of the city more sustainable, liveable and valuable. They should also be protected to maximise their
intrinsic value in providing ecosystem services as green infrastructure, including supporting,
provisioning, regulating and cultural services. Defining an ecological layer in this SDF is done
towards:
Protecting high value areas beyond existing areas of settlement.
Integrating natural ecological systems with urban development through green corridors and
the extension of an urban open space network.
Ensuring new development and redevelopment is cognisant of current environmental policy.
Extending the role of the public environment, through streets and public spaces, in a
broader, integrated, open space network.
Maximising the value of ecosystem services.
The green infrastructure of Johannesburg would encompass not only vacant open space, but several
different categories of spaces, including:
smaller green patches
small community parks
community/neighbourhood gardens
small scale urban agriculture
larger green patches
bigger city parks
forests
natural reserves
natural areas within the Mining belt
wetlands
swamps
productive landscapes (agriculture, crops)
green fields/meadows
green corridors
streets with a green path trees
rivers and river banks
pedestrian/bicycle pathways
wildlife passages
wider natural pathways
Development Strategy
Applying development controls and supporting mechanisms in critical biodiversity areas is important
to protect and enhance these valuable city assets.
90 Spatial Development Framework 2016/17
Critical biodiversity areas must be protected and preserved, with the value of ecosystem services
they provide maximised. They should form part of the public realm, adding value and structuring
elements to the urban system and provide agricultural, tourism, social and spiritual services.
Developments within critical biodiversity areas must be limited to those that add value to
the public realm, and that preserve the vital ecosystem services these areas provide.
These areas must be considered as vital to adding value and structuring elements to the
urban realm
o The interface with the urban area must be given high priority to promote public
accessibility
o These areas are not just dead green space, but are key parts of the public realm, and
must be protected as such.
o They provide needed open space that must be preserved for a growing city
o These areas must be considered as adding real estate value to urban developments.
All building or rezoning applications for critical biodiversity, Gauteng EMS or protected open
space areas must go through the appropriate processes set out by the Environment and
Infrastructure Services Department in the City of Johannesburg, the Gauteng Department of
Agriculture and Rural Development and any other relevant national policy and legislation
The City should:
Invest in and support the agricultural industry and agricultural projects as a key sector in
preserving green infrastructure and maximising its value for the city, including growing the
economy, creating jobs and providing food and other products.
Invest in and support tourism, social, spiritual and leisure initiatives in critical biodiversity
areas to protect the areas, grow the economy, and create jobs.
Plan natural areas such as wetlands and swamps as protected natural buffers, serving as a
natural ‘urban development boundary’ and protection from flooding and other climate-
change related damages.
Within the city, plan green corridors and green patches as buffers/dividers between
incompatible land use areas, such as between residential and noxious industries.
Use neighbourhood guidelines and form-based codes in order to ensure that each street is
planned with a tree line, a pedestrian and bicycle pathway.
On a neighbourhood scale, support, invest and incentivise development of smaller
community parks, gardens and urban agriculture.
In implementing integration of the natural environment, it should be strongly incorporated into all
finer detail spatial policy frameworks. The current approval process for development in the city with
input from the Environment and Infrastructure Department should also be noted, as a tool for the
protection and integration of the city’s natural assets. The process is summarised as follows:
91 Spatial Development Framework 2016/17
Development proposals and applications must demonstrate integration of the natural environment
into the development and deal with the impact of development on the City’s natural resources.
The Impact Management (IM) Sub-unit within the Environment and Infrastructure Services
Department is responsible for the review (from an environmental perspective) of land use
management and other applications. Comments focus on possible impacts that development
proposals will have on the environment. Different national, provincial and local environmental
legislation, policies and guidelines are used to inform comments. Tools, policies and guidelines which
inform decisions and recommendations include: the Catchment Management Policy (2008); Wetland
Audit layers 1 and 2 and other indicative layers on the City GIS; Sustainable Urban Drainage Systems;
Johannesburg Metropolitan Open Space System; Biodiversity Sector Plan; and water, air and waste
permit and license requirements as per legislation or by-laws.
Financing green infrastructure in cities
Natural services are very similar to other utilities, in the sense that they provide tangible, valuable
benefits to inhabitants and visitors of the city. However, these benefits do not always create an
immediate incentive for investors, as the economic benefits do not flow back to them directly.
Where such services do benefit private agents (such as in increasing real estate prices), they should
contribute to the maintenance of such services as well.
A crucial step for making investing in ecological areas viable is to create a business case for investing
in ecological assets, coupled with a strategy for the implementation of taxation and pricing measures
to raise revenue for advancing environmental goals (e.g. tax exemptions or subsidies for private
developers that invest in environmentally friendly technologies, water, energy and waste
management, as well as in green spaces and neighbourhood parks; or conditions for building
permission obliging investors to leave a certain percentage of their plot as a green space). The
business case should be developed with a background of strong collaboration between the city’s
financial and environmental departments, as well as other related departments such as basic
services, disaster management and transportation. This should also include priority investment from
the city budget in green infrastructure, especially since the investment pays off in reduced public
costs for storm water management, flooding, transport and basic services.
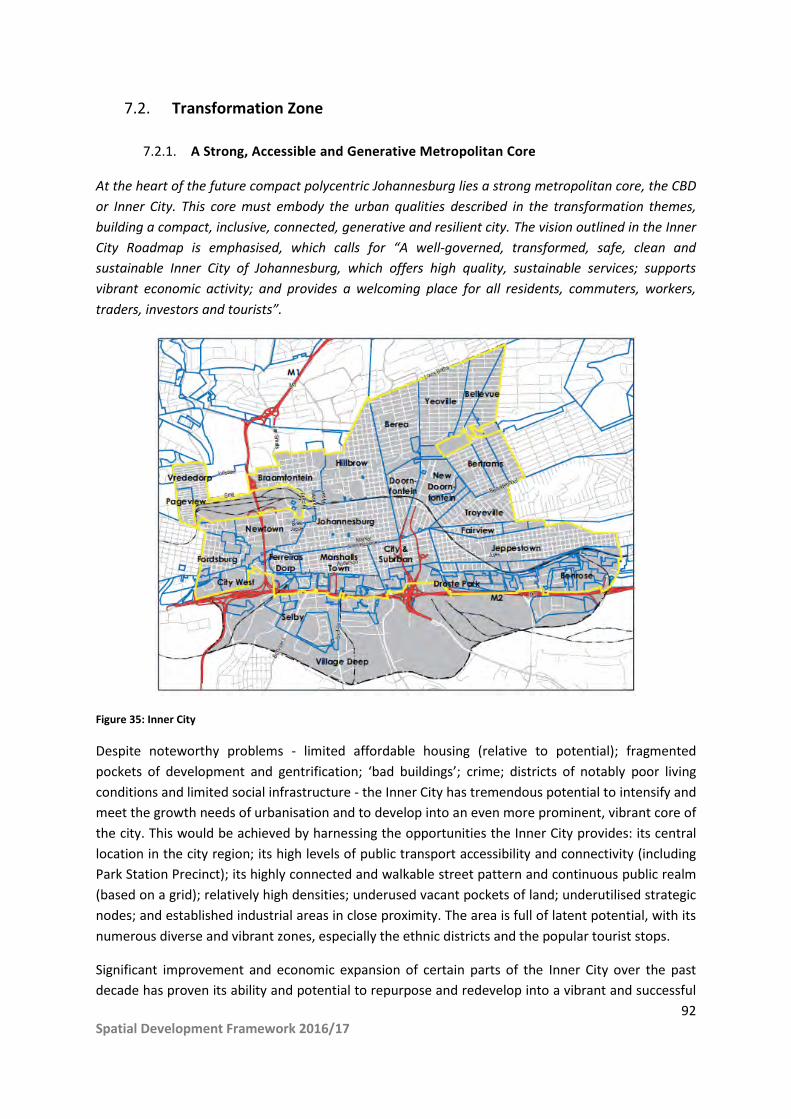
92 Spatial Development Framework 2016/17
Transformation Zone 7.2.
A Strong, Accessible and Generative Metropolitan Core 7.2.1.
At the heart of the future compact polycentric Johannesburg lies a strong metropolitan core, the CBD
or Inner City. This core must embody the urban qualities described in the transformation themes,
building a compact, inclusive, connected, generative and resilient city. The vision outlined in the Inner
City Roadmap is emphasised, which calls for “A well-governed, transformed, safe, clean and
sustainable Inner City of Johannesburg, which offers high quality, sustainable services; supports
vibrant economic activity; and provides a welcoming place for all residents, commuters, workers,
traders, investors and tourists”.
Figure 35: Inner City
Despite noteworthy problems - limited affordable housing (relative to potential); fragmented
pockets of development and gentrification; ‘bad buildings’; crime; districts of notably poor living
conditions and limited social infrastructure - the Inner City has tremendous potential to intensify and
meet the growth needs of urbanisation and to develop into an even more prominent, vibrant core of
the city. This would be achieved by harnessing the opportunities the Inner City provides: its central
location in the city region; its high levels of public transport accessibility and connectivity (including
Park Station Precinct); its highly connected and walkable street pattern and continuous public realm
(based on a grid); relatively high densities; underused vacant pockets of land; underutilised strategic
nodes; and established industrial areas in close proximity. The area is full of latent potential, with its
numerous diverse and vibrant zones, especially the ethnic districts and the popular tourist stops.
Significant improvement and economic expansion of certain parts of the Inner City over the past
decade has proven its ability and potential to repurpose and redevelop into a vibrant and successful

93 Spatial Development Framework 2016/17
urban core, if supported by consistent and targeted investment programmes. The launch of the
Inner City Charter in 2006 and more recently the Inner City Transformation Roadmap has helped to
consolidate and focus investment and revitalisation efforts.54 It is estimated that the Inner City is
home to approximately 260,00055 people with an estimated 800 000 to 1 million commuters
entering or passing through each day. Analysis for this SDF shows that the number of jobs, facilities
and residents in the CBD (and areas immediately surrounding it) could increase significantly by
exploiting the latent potential mentioned above.
Figure 36: Inner City Components
Development Strategy
In Compact City terms, development is prioritised within and radiating outward from the urban core,
with high densities of jobs, residents and amenities. This mix should be dispersed across the urban
fabric where possible, rather than in segregated pockets. The Inner City should accommodate the
highest densities in the City, ranging from 15 000 to 60 000 people/km². While there are significant
opportunities for residential densification within the Inner City, it should focus in areas that would
increase mixing of land uses (i.e. near commercial activity) and importantly in areas linked with high
accessibility. This would include precincts such as Westgate, Park Station and Doornfontein which
are well-served by multiple modes of public transport and range of economic and educational
54 It is important to note that the Inner City Urban Design Implementation Plan, 2009, specifically identifies the
key roles and functions for the Inner City of Johannesburg. This spatial plan should be used to contextualise any planning interventions. 55
It is noted that this is from the 2011 Census, and is likely higher in reality.
94 Spatial Development Framework 2016/17
facilities. Redevelopment of existing buildings56 to higher density is fundamental to this strategy,
with the inclusion of business and social facilities within the vertical mix where possible.
To match residential densities, the Metropolitan Core should have the highest concentration of
urban amenities, including public spaces and social amenities. An aggressive strategy for the delivery
of the full range of social amenities should be pursued by public agencies. This should firstly target
areas with existing high densities (and backlogs in amenities), and secondly priority areas for future
densification.
A key intervention to facilitate large-scale intensification is an Inner City Infrastructure Upgrading
Programme. The City needs to replace ageing infrastructure as part of its asset management
programme, but also create new capacity to promote private sector development and
intensification. While JSIP will direct significant capital spend to the Inner City, an integrated
programme should be developed for the next decade, to ensure a coordinated programme not only
to provide the required engineering services, but to align it with other programmes such as the
public environment upgrades and housing implementation strategy.
The Inner City is a primary focus for growing and intensifying as an area of greatest inclusivity. As
one of the main reception areas in the city for urban migrants, it is critical that the Inner City
provides essential services to urban newcomers, such as affordable housing, access to work and
access to public transit. Given the function of the Inner City as a major housing location for the urban
poor, it should also be a place where most vulnerable groups are able to exercise their right to the
City. This means the range of economic, social and housing interventions in the Inner City must
reflect an understanding of the underlying socio-economic dynamics and create an enabling
environment.
Inclusive economic opportunities: A significant percentage of the economic activity in the Inner City
is and will be informal. Understanding and finding mechanisms to support and adapt informal
economic activities to progressively expand the City’s economy should be unpacked in the City’s
economic strategy, so that micro enterprise and informal trading activities continue to provide
livelihoods and economic resilience for those excluded from the formal economy. This strategy
should include a spatial dimension, in looking to provide affordable, secure and accessible space for
the informal economy to function, such as small shop spaces and storage facilities. The strategy
should also support the evolution and growth of informal businesses to become bigger economic
contributors and employers over time.
Inclusive housing opportunities: The Inner City population is increasingly lower-middle income and
employed but with a large number of very poor households. Based on the Census data there were
some 22,000 households who earn less than R800/month (in 2011 prices), with 75% of these
households indicating no income. Noting the limitations of available data, it is estimated that some
56 Either through refurbishment, or re-building.

95 Spatial Development Framework 2016/17
16,000 units of accommodation are required in the short to medium term in order to accommodate
the most vulnerable households.57
A focussed Inner City Housing programme is critical to move the Inner City of Johannesburg onto a
sustainable development trajectory. The Inner City Housing Implementation Plan proposes to
increase the availability of a range of housing typologies, with a focus on affordable housing. This
plan proposes strategies that can be applied to extend the reach of commercial landlords and social
housing institutions; deliver and operate municipal-owned rental housing and shelters; and
incentivise and fund innovative landlords and facility managers to deliver and operate housing and
shelter options in the Inner City. Priority precincts are identified and a precinct development
approach is proposed to ensure that residential densification is complimented with social and
community facilities with an emphasis on high quality public environments.
The housing strategy for the Inner City focuses on the following key areas:58
Providing Critical Need Accommodation: This comprises implementing a programme to
develop a specified, limited supply of basic, city-controlled and financed accommodation to
meet Constitutional Court obligations and to unblock the SPRE (Special Programme for
Relocation of Evictees) bottleneck in accommodation provision which is inhibiting removal
and redevelopment of Inner City buildings. This should use identified, existing buildings and
development on vacant land.
Growth of Subsidised Rental Stock Delivery: This comprises delivering a pipeline of
subsidised social rental housing in the Inner City through accredited Social Housing
Institutions (SHIs). These SHIs should target types of stock and households who are not
already being provided for by the private sector. In this regard it is proposed that the Inner
City becomes a ‘Megaproject’.
Private Sector Delivery Enhancement: This comprises enhancing the existing delivery of
affordable reasonable quality rental stock by the private sector specifically corporate and
Small-Scale landlords. .
Provision of emergency services to critical buildings: If building conditions are deemed to
pose a severe health and safety threat, then emergency action needs to be taken to secure
conditions of health and safety.
Dealing with Targeted ‘High Risk Buildings’: This comprises implementing a multi-faceted
approach within the City to identify, target and upgrade ‘high risk buildings’ that pose health
and safety threats. This should be undertaken on a building by building basis and should
focus on improving conditions in the buildings so that basic services are provided and
appropriate health and safety standards apply. It includes expropriation of selected buildings
for redevelopment for appropriate housing or supporting uses.
57 Inner City Housing Implementation Plan, 2015/6
58 Inner City Housing Implementation Plan, 2015/6. Pg. 46

96 Spatial Development Framework 2016/17
Ownership Facilitation: This comprises stabilising and reversing decline in owner-occupied
houses and buildings in the Inner City with a specific focus on improving the functioning of
targeted failed Sectional Title buildings.
Under the Connected City theme, the Metropolitan Core must re-assume its role as the primary
anchor for urban activities in the City of Johannesburg. Connected via affordable and accessible
mass public transit that includes both bus and passenger rail, the Inner City is connected at national,
provincial and city scales to key strategic nodes. This is being strengthened by its role as anchor of
the City’s priority development corridors, the Corridors of Freedom.
The strategy to improve connections includes intensifying, diversifying and re-stitching the Inner City
into a compact and safe walkable area through:
New public transport facilities promoting modal integration and better management of
minibus taxis.
Assessing, retrofitting and expanding the network of ‘connecting streets’ linking different
places of public interest together, as well as residential and office developments.
Enhancing the attractiveness of connecting streets by supporting public transport,
pedestrian and bicycle movement, demarcating selected streets for pedestrian-only
movement. Supporting the development of ground floor commercial activities along the
streets ensuring 24/7 activity and thus increased safety and security.
Enhancing the street grid system by planning pockets of public spaces (parks, playgrounds,
squares etc.), densifying the network of activities and facilities.
Generative City: The Inner City remains the primary metropolitan node in the city, a role that should
be protected and reinforced through future development initiatives, particularly in view of the
significance of the public sector as a key employer in the city economy. Potential for reinforcing the
role of the CBD as a global trading focus, with specific reference to Africa, certainly exists given the
transport and freight infrastructure that is tied into this node. The majority of the anticipated
housing demand for Johannesburg up to 2030 will be for low income households meaning that the
creation of new employment and economic opportunities within the Inner City is critical.
Of concern is the relative stagnation in growth dynamics in Region F (the Johannesburg Inner City
and Central Business District and the south eastern part of the City) when compared to other
Regions.59 This is of particular significance given that this is the City’s second largest regional
economy, contributing 24% of the City’s output. This raises challenges of reactivation of growth
dynamics in this region and it should be one of the priority areas for a targeted economic strategy by
the City.
Creating spatial complexity is very possible within the Inner City and the City must therefore focus
investment in areas where urban complexity is already evident or where the potential for developing
and sustaining true mixed-use and efficient urban environments is greatest. The nature of City
59 Economic Development Strategy for the City of Johannesburg, 2015

97 Spatial Development Framework 2016/17
investment must include not only engineering service capacity and housing, but also public
environment (including formal open spaces, parks and streets, with sidewalks and non-motorised
transport space) and public infrastructure such as public transit stations, clinics and libraries. The
quality of the public realm has a significant impact on social interaction, identity and economic
investment of an area.
The reclamation and revitalisation of low or non-revenue generating parts of the Inner City is a key
intervention in support of a Generative City. This includes implementing a programme to address
Bad Buildings over the next decade. This is linked to the Inner City Housing Implementation Plan and
must be conceptualised as a housing, economic and social development programme. Housing
programmes proposed within the Inner City Housing Implementation Plan identify a mix of housing
types and incomes, with a focus on the ‘very affordable’, to ensure formal accommodation options
in price ranges that can only be found in ‘bad buildings’ at present. In this way, the goals of
inclusivity and addressing bad buildings are emphasised. Opportunities in these areas include some
usable vacant land and many underutilised and abandoned warehouse and factory spaces with
potential for brownfield housing and mixed use developments.
There are potential expansion areas which can accommodate a more diverse and intensified urban
form. These include areas such as west of the Inner City (Mayfair) as well as the southern industrial
belt. The industrial belt south of the Inner City is currently predominantly low density, light industrial
development and warehouses, with some pockets of commercial development. Many people
working in the area commute from distant parts of the city and have access to neither housing
options, nor social and leisure amenities in the working area. The newly planned public transport
route that links the Inner City to the Turffontein Corridor of Freedom opens up possibilities for
development through the industrial belt from the southern edge of the CBD.
The development of the corridor in combination with the opportunities provided by underdeveloped
land and buildings could transform the area into a connected system of mixed-use developments,
offering affordable housing options to compliment the jobs available. At the same time it would
enhance and expand the existing commercial activities in the area, attracting visitors from both the
Inner City and the Turffontein area, gradually bridging the North-South barrier. Redevelopment of
these expansion areas needs to be considered carefully. Economic growth and job opportunities are
critical factors to consider and should not be compromised by the introduction of new residential or
social developments. Mixed-use opportunities should be carefully identified, with links to public
transport services and access to social facilities spatial informants.
Resilient City: A strong, well-connected open space system should be a prominent feature of the
Inner City development. This includes green open spaces, parks and gardens, but also a network of
high quality public spaces and facilities.
Interventions should include linking the Inner City strongly with adjacent areas that provide regional
facilities, such as the Wemmer Pan regional recreational node to the south of the Inner City. This
node is within walking and cycling distance from the Inner City and non-motorised transport
infrastructure would assist in linking this area functionally with the Inner City.
98 Spatial Development Framework 2016/17
Refurbishment of buildings and investing in upgraded infrastructure services provide for
opportunities to invest in green infrastructure options at scale. The precinct approach proposed in
the Inner City Housing Implementation Plan could allow the City to implement more innovative
design approaches to facilitate an integrated public space system.
The intended outcomes of the development strategy includes establishing the Metropolitan Core as
the place of greatest intensity – highest densities (population; job and amenity); greatest
connectivity (regional and local); widest range of accommodation typologies (full spectrum of income
groups; with main focus on catering for the poor); highest economic output in the city.
The Legal and financial tools suggested to support the implementation of these strategies are:
Provide incentives to add social housing options on empty plots or rehabilitated buildings.
Set-up a framework for land readjustment for the southern industrial zone.
Expansion of the Urban Development Zone incentive to include Mayfair and the southern
industrial belt.

99 Spatial Development Framework 2016/17
Corridors of Freedom 7.2.2.
Consolidate appropriate growth and development opportunities around existing and future public
transport nodes, starting with the Corridors of Freedom and the Randburg – OR Tambo Corridor.
Figure 37: Conceptual Representation of the Soweto – Sandton Corridor
Development Corridors as element of the Compact Polycentric Model
The concept of development corridors connecting strategic nodes through an affordable and
accessible mass public transport system is an integral component of the Johannesburg compact
polycentric model for future development. For the development corridors to support the notion of a
compact city form they are distinguished from purely transport corridors which have a
predominantly movement function, and where development should not occur along their entire
length.
The future built environment envisaged along these development corridors - the Corridors of
Freedom- will be a mixed land-use type dominated by high-density accommodation options,
supported by offices and social facilities, retail and commercial development and opportunities for
leisure and recreation. The intention is that residents of the City will live closer to their workplace
and be able to work, live and play without having to use private motorised transport. Safe,
affordable and convenient buses, cycling and pedestrian activity will reduce the domination of
carbon-intensive private vehicles.
The urban function of the development corridors within the broader system is as follows:

100 Spatial Development Framework 2016/17
Connect urban centres of strategic significance in terms of size and diversity of activities
Support and connect nodes with high interdependence and functional coherence especially
in relation to the urban core
Provide a conduit for new economic growth and job creation
Promote urban compaction in areas with good access to a strong urban core
Provide opportunities for densification and intensification related to public transport
systems
Demonstrate TOD principles and walkability
For a transport corridor (movement priority), to qualify as a development corridor (development
priority), it has to demonstrate the potential to generate substantial compact economic and housing
development around strategic points along the primary movement axis. This would also imply that
urban development corridors have a functional distance limit (length), related to movement
volumes, frequency of interaction and interdependence and nature of the connected centres.
Development corridors must also be defined in city policy for them to be differentiated from
transport corridors, for example, the Corridors of Freedom.
Building Blocks within the existing urban structure
Detailed Strategic Area Frameworks and precinct plans already exist for the Corridors of Freedom.
The approved plans for Louis Botha, Turffontein and Empire-Perth corridors as well as the approved
precinct plans in the Soweto Corridor form the basis of implementation and investment programmes
already under way.60
The Corridors of Freedom are located along the public transport backbone. The location and extent
of the development corridors are supported with evidence from the bid-rent model (Figure 32 pg.
84) that indicated the corridors as high value development potential areas. The Corridors of
Freedom have a strong and direct relationship to the Inner City, thus supporting a more compact
urban form with the urban core. In addition to the urban core that acts as an economic focal point,
the corridors already have various forms of economic activity that have the potential to be up-scaled
and intensified. Established and planned public transport infrastructure directly supports the
corridors in the form of rail and BRT systems that connect the core with significant sub-centres.
Certain portions of the corridors already have fairly high population densities while further
densification can be accommodated within a reconfigured built form. The existing urban structure
provides extensive opportunities for densification within walking distance from public transport
stations. The relatively low land cover ratio is an indicator of the potential for the of land use
through more intensive development, mixing and densification. This also applies to the current
underutilised social infrastructure that demonstrates potential for substantial intensification and
repurposing.
60 For Corridors of Freedom documents and information visit http://bit.ly/Corridors-Of-Freedom (note caps)

101 Spatial Development Framework 2016/17
Latent infrastructure capacity in some areas provides further opportunities for intensification and
urban transformation, however where needed, infrastructure within the Corridors of Freedom must
be upgraded to service higher demand.
Development Strategy and Outcomes
The corridor concept, as part of the overall development strategy, is prioritised in that it addresses a
range of prevailing urban issues.
The Corridors of Freedom programme is the leading edge of the compact polycentricity approach
that must fundamentally alter the spatial form and sustainability of the City. Public transportation is
the backbone on which the new city will be constructed. It serves a dual purpose of moving people
and as structuring element for mixed use intensification.
The public transport backbone fulfils an important “correction” in the urban system in that an
accessible and affordable public transport network would provide efficient, affordable and quick
movement and connection to city opportunities. Redeveloping high intensity neighbourhoods
around public transport stations provides the opportunity to reorganise the urban form in order to
create walkable neighbourhoods. This element starts to address the poor walkability within
Johannesburg in general and provides options for non-motorised transport to become the primary
means of neighbourhood movement.
A densification process can be fostered either with higher building, or wider building footprint, or
both combined. While increasing the building footprint along the backbone will support
densification, it will also allow for the creation of a much finer grain urban fabric. The major benefit
will be a higher quality public realm (characterised by human scale streets, high levels of walkability,
connectivity and continuity), supporting vibrant street life and ultimately contributing to decreasing
crime levels. Higher intensity building must be met with active building frontages along streets, as
described in the Corridors of Freedom in order to create vibrant public environments.
Development corridors will act as conduits for economic activity and will create anchor points for
economic development where major roads intersect them. The development of economic clusters
and intensification of economic activity will be promoted along the corridors. The outcome of the
strategy is to increase the job density around these highly accessible points and to attract economic
development into economically under developed areas like Soweto and Alexandra.
A diversification of land plot sizes is essential to support a vibrant and sustainable land market and
create a generative urban structure. The fine grain of plot subdivisions fosters an active land market
with a great potential of a future mix of uses and income levels. Over time, some plots will
consolidate for large investors, whereas others will keep a fine grain and provide opportunities for
medium and small investors (SMMEs, home owners, etc.). Building on initial investments made by
the public sector, and provided the appropriate regulations and incentives are in place, the diversity
of actors from the private sector will lead to steady land use diversification.
The Corridors of Freedom is a programme through which the City will use public investment in
transportation, engineering and social infrastructure, administrative levers (such as policies and

102 Spatial Development Framework 2016/17
incentives) to directly intervene in the locational decisions that are made by both the state and the
private sector, to reconfigure the City’s urban form.
The guidelines for Transit Oriented Development (TOD) as a development concept seek to
consolidate investment and development in close proximity to transit infrastructure. This co-locates
compatible uses to minimise the need to commute from one area to another to access the range of
urban amenities. A critical component of TOD is increased density and intensity of uses in these
areas. These density guidelines are included in section 8.2.5.
The mechanisms and tools suggested to support the implementation of these strategies are:
A comprehensive package of Strategic Area Frameworks and precinct plans.
Form-based codes to complement zoning in the transport corridors to help regulate street
fronts, building typologies, ground floor activities, public spaces and private-public
boundaries.
A collaborative programme with the City’s Social Housing Companies and Property Company
to develop social housing along corridors.
Density bonuses in exchange for provision for social and public infrastructure (these will be
negotiated on individual applications, based on meeting the goals of this SDF, and the
development control and urban performance indicators (section 8.3).
Density bonuses in exchange for the delivery of inclusionary housing (sections 8.2.5).
Rates rebates for social housing and mixed use residential developments.
Mechanisms discouraging idle/vacant/underutilised private land through higher taxation.
Mechanisms to share increases in land value due to public infrastructure upgrades.
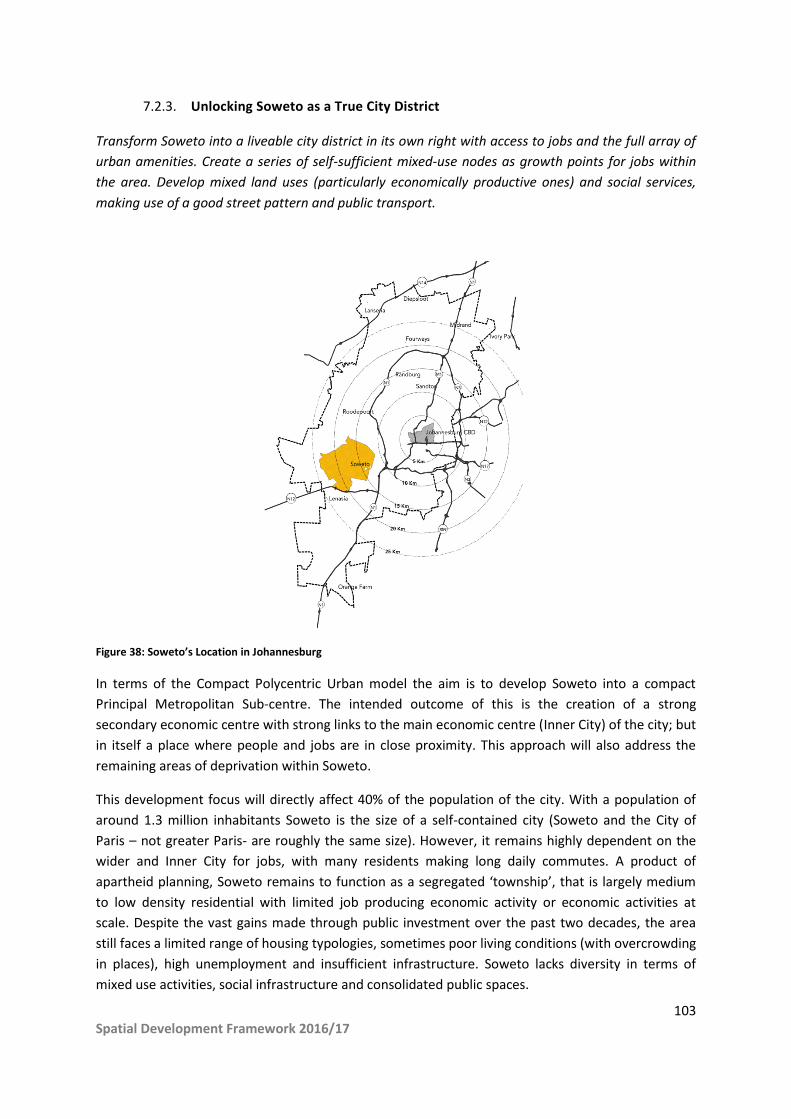
103 Spatial Development Framework 2016/17
Unlocking Soweto as a True City District 7.2.3.
Transform Soweto into a liveable city district in its own right with access to jobs and the full array of
urban amenities. Create a series of self-sufficient mixed-use nodes as growth points for jobs within
the area. Develop mixed land uses (particularly economically productive ones) and social services,
making use of a good street pattern and public transport.
Figure 38: Soweto’s Location in Johannesburg
In terms of the Compact Polycentric Urban model the aim is to develop Soweto into a compact
Principal Metropolitan Sub-centre. The intended outcome of this is the creation of a strong
secondary economic centre with strong links to the main economic centre (Inner City) of the city; but
in itself a place where people and jobs are in close proximity. This approach will also address the
remaining areas of deprivation within Soweto.
This development focus will directly affect 40% of the population of the city. With a population of
around 1.3 million inhabitants Soweto is the size of a self-contained city (Soweto and the City of
Paris – not greater Paris- are roughly the same size). However, it remains highly dependent on the
wider and Inner City for jobs, with many residents making long daily commutes. A product of
apartheid planning, Soweto remains to function as a segregated ‘township’, that is largely medium
to low density residential with limited job producing economic activity or economic activities at
scale. Despite the vast gains made through public investment over the past two decades, the area
still faces a limited range of housing typologies, sometimes poor living conditions (with overcrowding
in places), high unemployment and insufficient infrastructure. Soweto lacks diversity in terms of
mixed use activities, social infrastructure and consolidated public spaces.
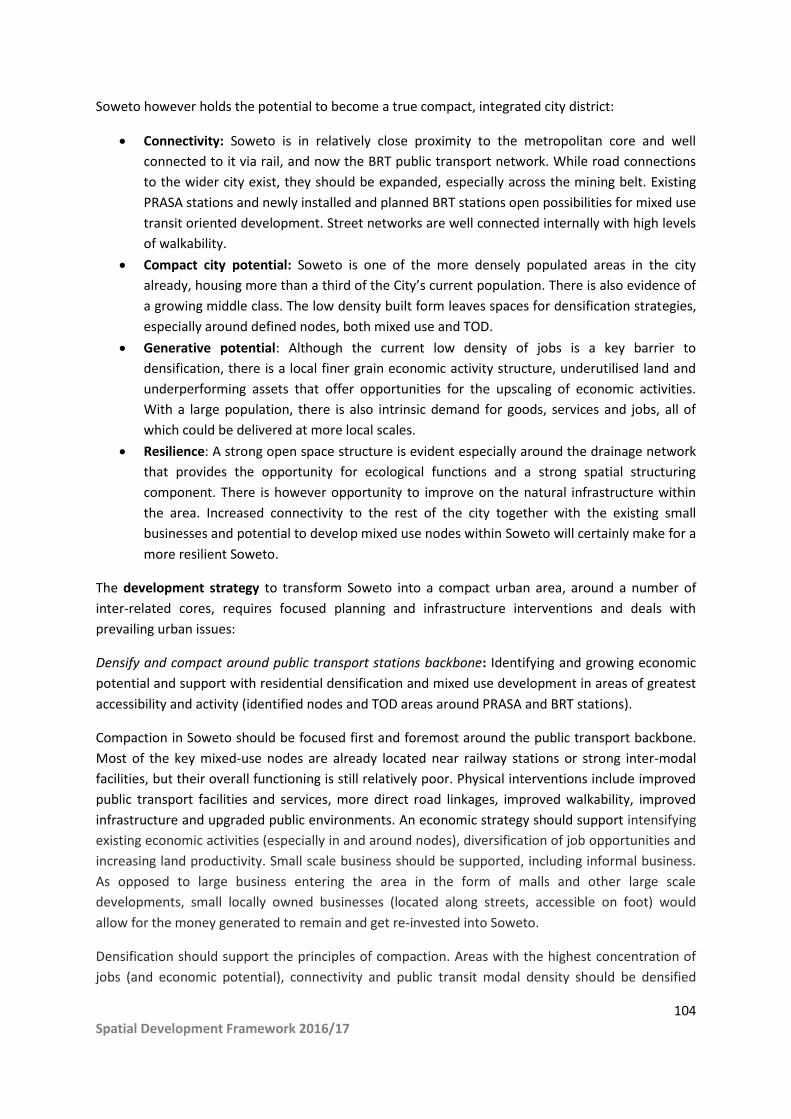
104 Spatial Development Framework 2016/17
Soweto however holds the potential to become a true compact, integrated city district:
Connectivity: Soweto is in relatively close proximity to the metropolitan core and well
connected to it via rail, and now the BRT public transport network. While road connections
to the wider city exist, they should be expanded, especially across the mining belt. Existing
PRASA stations and newly installed and planned BRT stations open possibilities for mixed use
transit oriented development. Street networks are well connected internally with high levels
of walkability.
Compact city potential: Soweto is one of the more densely populated areas in the city
already, housing more than a third of the City’s current population. There is also evidence of
a growing middle class. The low density built form leaves spaces for densification strategies,
especially around defined nodes, both mixed use and TOD.
Generative potential: Although the current low density of jobs is a key barrier to
densification, there is a local finer grain economic activity structure, underutilised land and
underperforming assets that offer opportunities for the upscaling of economic activities.
With a large population, there is also intrinsic demand for goods, services and jobs, all of
which could be delivered at more local scales.
Resilience: A strong open space structure is evident especially around the drainage network
that provides the opportunity for ecological functions and a strong spatial structuring
component. There is however opportunity to improve on the natural infrastructure within
the area. Increased connectivity to the rest of the city together with the existing small
businesses and potential to develop mixed use nodes within Soweto will certainly make for a
more resilient Soweto.
The development strategy to transform Soweto into a compact urban area, around a number of
inter-related cores, requires focused planning and infrastructure interventions and deals with
prevailing urban issues:
Densify and compact around public transport stations backbone: Identifying and growing economic
potential and support with residential densification and mixed use development in areas of greatest
accessibility and activity (identified nodes and TOD areas around PRASA and BRT stations).
Compaction in Soweto should be focused first and foremost around the public transport backbone.
Most of the key mixed-use nodes are already located near railway stations or strong inter-modal
facilities, but their overall functioning is still relatively poor. Physical interventions include improved
public transport facilities and services, more direct road linkages, improved walkability, improved
infrastructure and upgraded public environments. An economic strategy should support intensifying
existing economic activities (especially in and around nodes), diversification of job opportunities and
increasing land productivity. Small scale business should be supported, including informal business.
As opposed to large business entering the area in the form of malls and other large scale
developments, small locally owned businesses (located along streets, accessible on foot) would
allow for the money generated to remain and get re-invested into Soweto.
Densification should support the principles of compaction. Areas with the highest concentration of
jobs (and economic potential), connectivity and public transit modal density should be densified

105 Spatial Development Framework 2016/17
most. Within the public transport backbone, densification should support the principles of Transit
Oriented Development, with mixed used, high intensity, walkable urban form. Not only should
diverse residential typologies be provided, but developments should cater for a range of income
groups. Within TOD precincts, mixed income and mixed use typologies must include multi storey
walk up buildings with shops and commercial activities on the ground floor that directly face the
street.
Most of the remaining deprivation areas within Soweto relate to informal settlements – places such
as Kliptown and Klipspruit (Hllomisa settlement). These areas also predominantly fall within the
public transport backbone intervention area – which means that they should be upgraded into urban
settlements characterised by multi-storey, mixed use (with commercial activity on the ground floor)
medium to high density typologies supportive of the TOD principles.
Residential densification should also be provided through different community lead development
initiatives, including backyard accommodation in terms of the Council’s policies and standards.
Connecting Soweto, externally and internally: A number of key regional connections should be
improved to strengthen Soweto’s connection to the metropolitan core and other sub-centres,
including the mining belt development corridor. These include a direct link to the Roodepoort node,
the N17 extension westwards and improved highway access from the N1 on the eastern side. There
are limited east-west regional routes and poor north-south linkages between key existing regional
links, such as the Golden Highway, Chris Hani Road, and the Soweto Highway.
Internal connectivity is also critical. A strong internal road network linking key nodes, such as
Jabulani to Kliptown and Bara Central to Nancefield station, should be supported. While Soweto has
a relatively high intersection density, indicating good levels of walkability, higher order roads and
connectivity across natural barriers (such as streams), across railway lines and between districts of
Soweto should be improved. The fine grain internal structure should be supported and strengthened
on a neighbourhood level to further support walkability.
Upgraded rail services and stations will also improve movement, especially as more intensification is
focused around stations. This should include improving intermodal connections at stations to ensure
sustainable and efficient public transport networks as a means of generating opportunity. Here
stations would become destinations rather than merely morning departure and evening arrival
points.
Bridging urban fragmentation: Soweto is characterised by large areas of urban fragmentation, both
internally and with the wider city. Extending Soweto’s development into and across the mining belt,
one of the major areas of discontinuity, is a key development strategy. New industrial and
commercial activities should be the focus of the mining belt development, but could also include
mixed housing developments structured around public transport linkages with social facilities that
could serve both new residents and the existing Soweto population.
Internal areas of fragmentation include large-scale mono-functional and under-utilized land uses,
such as the SANDF base next to the Soweto Empowerment Zone in Baralink and the Goudkoppies
Land fill and waste water treatment facility. These facilities were part of the apartheid planning

106 Spatial Development Framework 2016/17
interventions to create buffer zones and their redevelopment should be part of the strategy to
connect urban areas within Soweto.
Public environment quality and community facilities: A strong emphasis should remain on improving
liveability in Soweto, including the creation of a good quality public environment. Designing spaces
for social activities; focussing on streets as public space and enhancing public life through
investment in social infrastructure mixed-use nodes are key strategies to transform Soweto into a
liveable urban environment. Underutilised social assets such as reserved school sites should be
retained for future social requirements.
Strengthening the natural structure as a provider of ecological services: A major component of
Soweto’s natural structuring system is its river and wetland system, which is of metropolitan
significance as a Critical Biodiversity Area. The system’s importance in forming ecological corridors
and environmental infrastructure should be protected and enhanced. Current storm water
infrastructure is not adequate and with the proposed intensification the river and wetland system
will need to be restored and protected as a part of the storm water management solution. The
opportunity also exists to create well integrated open space networks as a strong structuring
element into the urban area – key nodes such as Kliptown, Jabulani and Bara Central are all within
walkable distance from major open space systems that should be integrated into the urban fabric.
Legal and financial tools that are suggested in supporting the implementation of these strategies
are:
Unlock the land market to stimulate owner development, acquisition, sales, and
consolidation of plots.
Set-up a framework for land readjustment/pooling to enable home owner driven dense
mixed-use development and preventing gentrification.
Set-up pilot projects to test the viability and desirability of TOD, plot consolidation and land
readjustment projects.
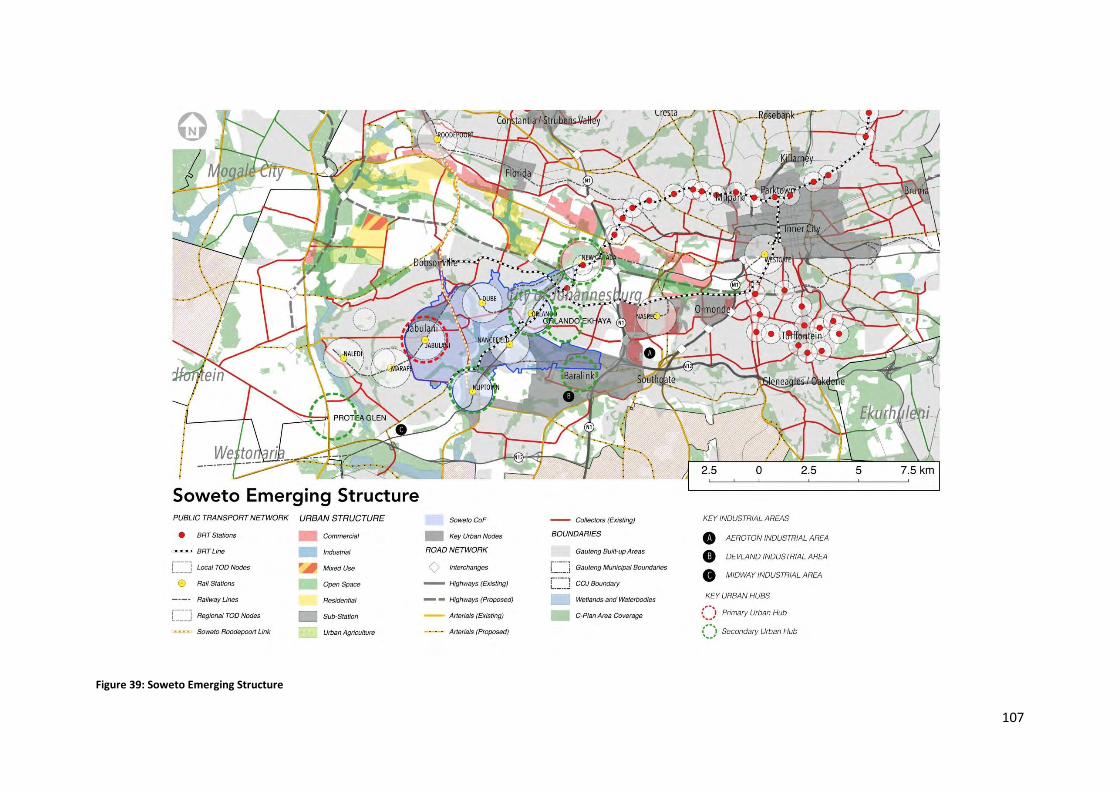
107
Figure 39: Soweto Emerging Structure
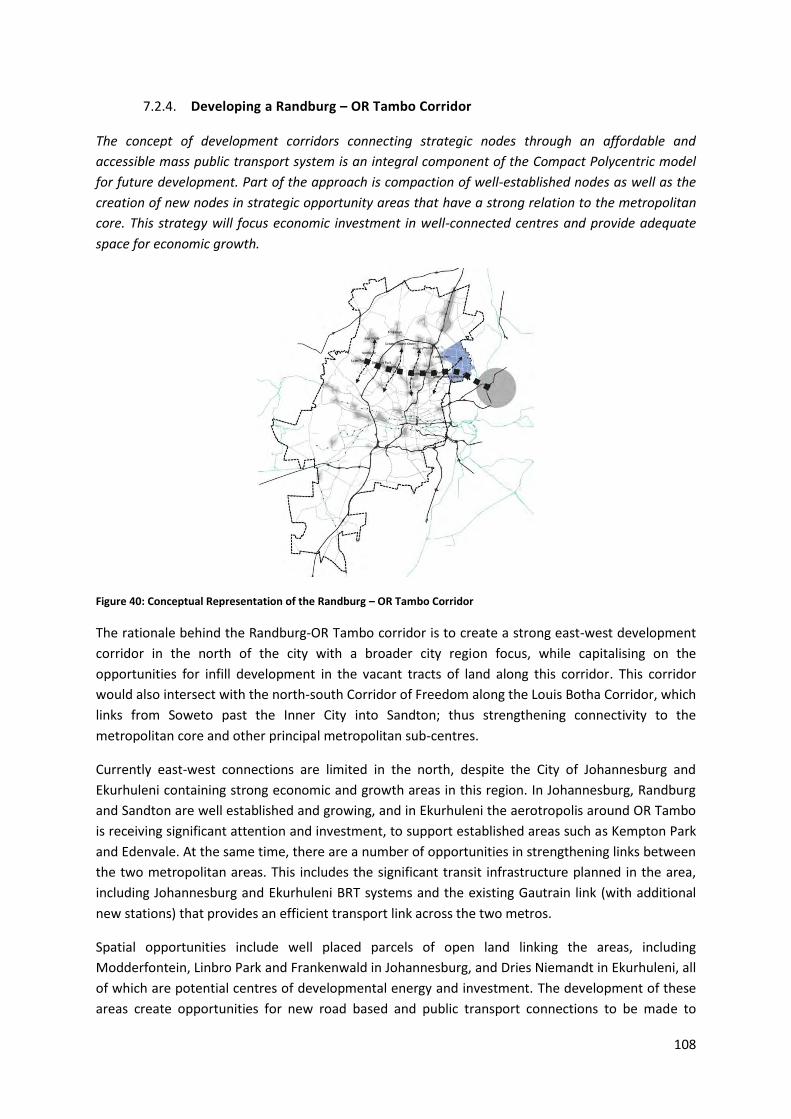
108
Developing a Randburg – OR Tambo Corridor 7.2.4.
The concept of development corridors connecting strategic nodes through an affordable and
accessible mass public transport system is an integral component of the Compact Polycentric model
for future development. Part of the approach is compaction of well-established nodes as well as the
creation of new nodes in strategic opportunity areas that have a strong relation to the metropolitan
core. This strategy will focus economic investment in well-connected centres and provide adequate
space for economic growth.
Figure 40: Conceptual Representation of the Randburg – OR Tambo Corridor
The rationale behind the Randburg-OR Tambo corridor is to create a strong east-west development
corridor in the north of the city with a broader city region focus, while capitalising on the
opportunities for infill development in the vacant tracts of land along this corridor. This corridor
would also intersect with the north-south Corridor of Freedom along the Louis Botha Corridor, which
links from Soweto past the Inner City into Sandton; thus strengthening connectivity to the
metropolitan core and other principal metropolitan sub-centres.
Currently east-west connections are limited in the north, despite the City of Johannesburg and
Ekurhuleni containing strong economic and growth areas in this region. In Johannesburg, Randburg
and Sandton are well established and growing, and in Ekurhuleni the aerotropolis around OR Tambo
is receiving significant attention and investment, to support established areas such as Kempton Park
and Edenvale. At the same time, there are a number of opportunities in strengthening links between
the two metropolitan areas. This includes the significant transit infrastructure planned in the area,
including Johannesburg and Ekurhuleni BRT systems and the existing Gautrain link (with additional
new stations) that provides an efficient transport link across the two metros.
Spatial opportunities include well placed parcels of open land linking the areas, including
Modderfontein, Linbro Park and Frankenwald in Johannesburg, and Dries Niemandt in Ekurhuleni, all
of which are potential centres of developmental energy and investment. The development of these
areas create opportunities for new road based and public transport connections to be made to
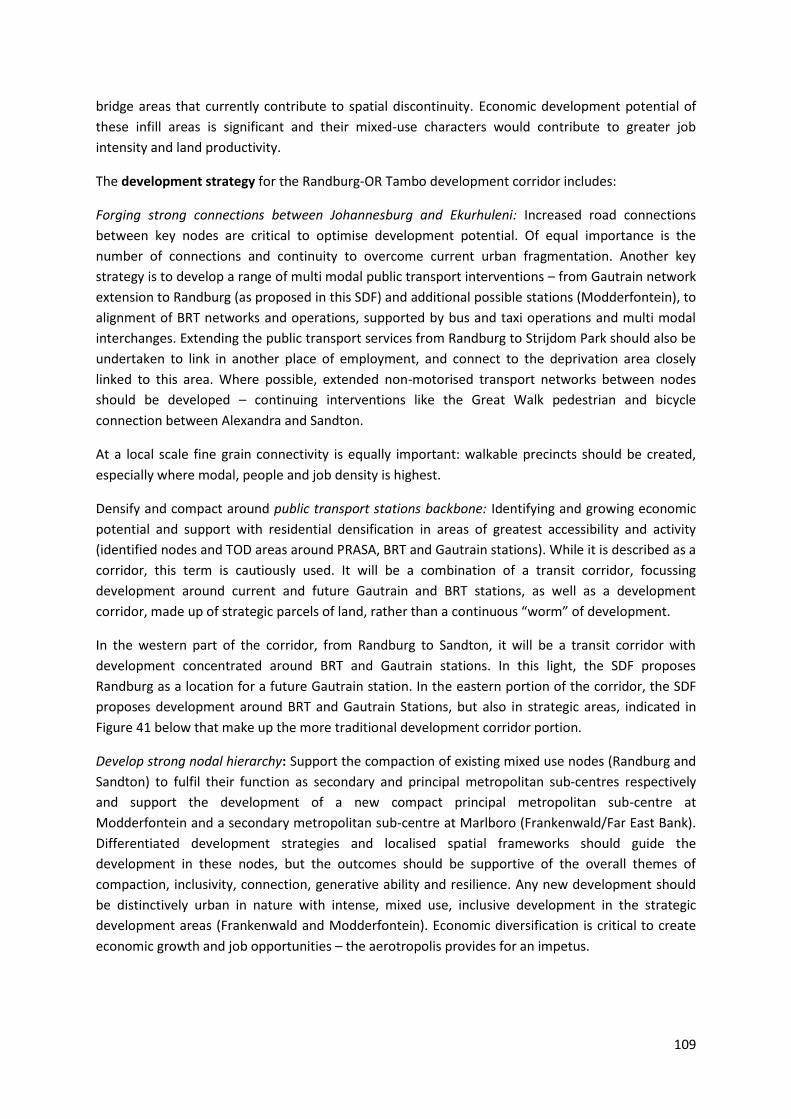
109
bridge areas that currently contribute to spatial discontinuity. Economic development potential of
these infill areas is significant and their mixed-use characters would contribute to greater job
intensity and land productivity.
The development strategy for the Randburg-OR Tambo development corridor includes:
Forging strong connections between Johannesburg and Ekurhuleni: Increased road connections
between key nodes are critical to optimise development potential. Of equal importance is the
number of connections and continuity to overcome current urban fragmentation. Another key
strategy is to develop a range of multi modal public transport interventions – from Gautrain network
extension to Randburg (as proposed in this SDF) and additional possible stations (Modderfontein), to
alignment of BRT networks and operations, supported by bus and taxi operations and multi modal
interchanges. Extending the public transport services from Randburg to Strijdom Park should also be
undertaken to link in another place of employment, and connect to the deprivation area closely
linked to this area. Where possible, extended non-motorised transport networks between nodes
should be developed – continuing interventions like the Great Walk pedestrian and bicycle
connection between Alexandra and Sandton.
At a local scale fine grain connectivity is equally important: walkable precincts should be created,
especially where modal, people and job density is highest.
Densify and compact around public transport stations backbone: Identifying and growing economic
potential and support with residential densification in areas of greatest accessibility and activity
(identified nodes and TOD areas around PRASA, BRT and Gautrain stations). While it is described as a
corridor, this term is cautiously used. It will be a combination of a transit corridor, focussing
development around current and future Gautrain and BRT stations, as well as a development
corridor, made up of strategic parcels of land, rather than a continuous “worm” of development.
In the western part of the corridor, from Randburg to Sandton, it will be a transit corridor with
development concentrated around BRT and Gautrain stations. In this light, the SDF proposes
Randburg as a location for a future Gautrain station. In the eastern portion of the corridor, the SDF
proposes development around BRT and Gautrain Stations, but also in strategic areas, indicated in
Figure 41 below that make up the more traditional development corridor portion.
Develop strong nodal hierarchy: Support the compaction of existing mixed use nodes (Randburg and
Sandton) to fulfil their function as secondary and principal metropolitan sub-centres respectively
and support the development of a new compact principal metropolitan sub-centre at
Modderfontein and a secondary metropolitan sub-centre at Marlboro (Frankenwald/Far East Bank).
Differentiated development strategies and localised spatial frameworks should guide the
development in these nodes, but the outcomes should be supportive of the overall themes of
compaction, inclusivity, connection, generative ability and resilience. Any new development should
be distinctively urban in nature with intense, mixed use, inclusive development in the strategic
development areas (Frankenwald and Modderfontein). Economic diversification is critical to create
economic growth and job opportunities – the aerotropolis provides for an impetus.

110
Residential densification: This development corridor has major potential to provide for a diverse
range of residential typologies and income groups. Inclusionary housing must be a key component of
all new development and should be introduced into the existing nodes.
Develop Alexandra as an intensive, accessible mixed use liveable area: Situated within the Randburg
– OR Tambo development corridor, Alexandra, despite facing a number of challenges, is well located
giving it vast potential to transform. A number of programmes and interventions are in place that
seek to address its developmental challenges. Strategies include: improving movement and
connectivity (internally and to surrounding economic centres); optimising development
opportunities around Marlboro Gautrain station and BRT stations and introducing better public
spaces and social amenities. Support must also be provided to a vibrant range of economic activities
and various training programmes to grow job opportunities. Lastly energy is being focussed on
developing medium to high density residential typologies catering to a range of income groups, and
providing new housing and job opportunities in adjoining areas such as Linbro Park.
Some legal and financial tools that are suggested support the implementation of these strategies
are:
Mechanisms to incentivise private investors to invest in the development of the large vacant
lands (tax cuts, bonus densities in other parts of the city).
Inclusionary zoning mechanisms to leverage private developers to create affordable, low
income and social housing mixed with high-income housing (requiring 20%-30% affordable
housing).
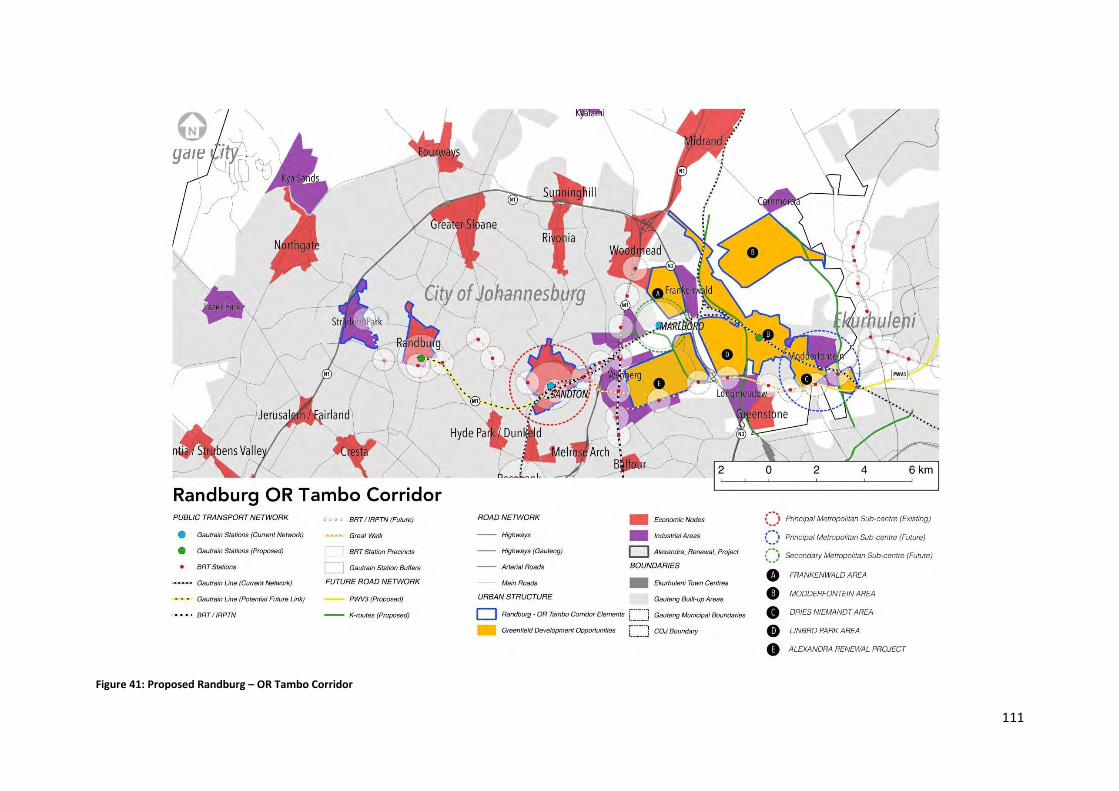
111
Figure 41: Proposed Randburg – OR Tambo Corridor
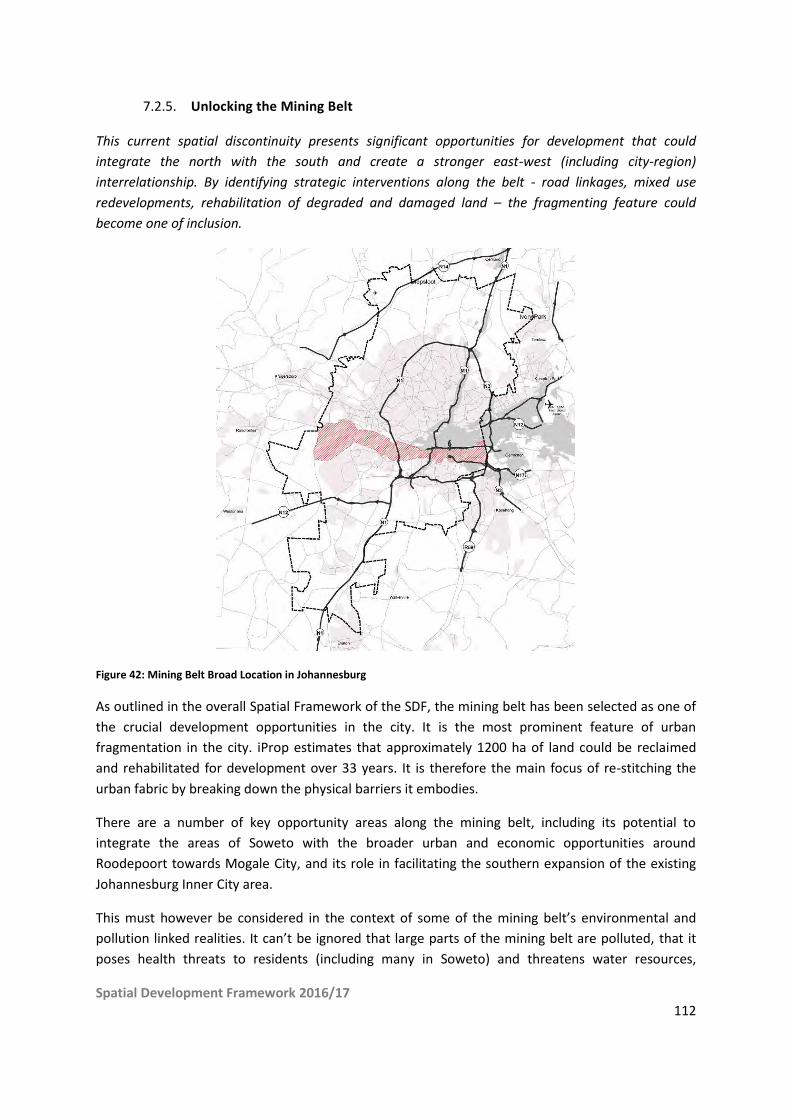
Spatial Development Framework 2016/17 112
Unlocking the Mining Belt 7.2.5.
This current spatial discontinuity presents significant opportunities for development that could
integrate the north with the south and create a stronger east-west (including city-region)
interrelationship. By identifying strategic interventions along the belt - road linkages, mixed use
redevelopments, rehabilitation of degraded and damaged land – the fragmenting feature could
become one of inclusion.
Figure 42: Mining Belt Broad Location in Johannesburg
As outlined in the overall Spatial Framework of the SDF, the mining belt has been selected as one of
the crucial development opportunities in the city. It is the most prominent feature of urban
fragmentation in the city. iProp estimates that approximately 1200 ha of land could be reclaimed
and rehabilitated for development over 33 years. It is therefore the main focus of re-stitching the
urban fabric by breaking down the physical barriers it embodies.
There are a number of key opportunity areas along the mining belt, including its potential to
integrate the areas of Soweto with the broader urban and economic opportunities around
Roodepoort towards Mogale City, and its role in facilitating the southern expansion of the existing
Johannesburg Inner City area.
This must however be considered in the context of some of the mining belt’s environmental and
pollution linked realities. It can’t be ignored that large parts of the mining belt are polluted, that it
poses health threats to residents (including many in Soweto) and threatens water resources,
Spatial Development Framework 2016/17 113
including through acid mine drainage. As such, strict regulations and legislation (including nuclear,
and radiation linked regulations and legislation) must be followed in rehabilitating the mining belt.
Land must be made safe in a sustainable manner, before it can be developed. In doing so, a triple
benefit can be gained. The city can: (1) clear polluted land, reduce health risks and protect natural
resources; (2) free up valuable land for mixed use development and (3) transform the mining belt
from a feature of exclusion, to one of connection and inclusion.
The primary objective is to re-shape the historical mining-belt buffer (that segregated areas such as
Soweto from the north of the City) into a mixed use, vibrant growth area that bridges the historic
spatial divide. The strategy is to identify select strategic interventions that are well suited to re-stitch
Johannesburg across the mining belt. In the short term, due to the sheer size of the mining belt, key
catalytic projects should be implemented, that will contribute to the long term evolution of the
mining belt. The Mining Land (West) Strategic Area Framework provides details of the proposed
development and interventions in the area. The development strategy is structured around a
number of key strategies, discussed below.
Development Strategy
Connecting the Mining belt, across and within: Connecting principal and secondary metropolitan
sub-centres to one another and the metropolitan core by creating new road connections across the
mining belt is a key intervention. A regional and local movement network is critical to optimise the
development potential of land and to functionally integrate the area into the surrounding urban
fabric. This includes creating a direct road connection between Soweto to Roodepoort with multi-
modal transport services; improving connections between the Inner City and the Turffontein
Corridor of Freedom and protecting and enhancing future north-south connections with the
extension of the N17. A strong, continuous east-west central spine highlights the importance of N17
(and its westwards extension) as east-west connector - this road will be the new backbone for
structuring economic investment. The N17 route will also provide a critical cross-border connection
between areas of opportunity within Ekurhuleni, through Johannesburg and into the West Rand.
Economic diversification is the primary focus of development in the mining belt: First and foremost, it
should provide jobs and economic activities. All development strategies should be geared towards
optimising the economic potential of the mining belt, which includes continuation of productive and
viable mining activities (including the extraction of gold from and removal of tailings) and the
strengthening of industrial and commercial sectors. The strategy includes consolidating current
industrial activities and growing the potential for real job creation in the primary economic sector in
accessible locations. Potential of reclaimed land for economic development and job creation in close
proximity or interconnected with Soweto must be prioritised – the potential of an ICT Hub at
NASREC is one such area.
Residential diversification: The mining belt can accommodate a significant proportion of low income
and affordable housing within a range of housing typologies and mix of income levels. The
residential infill strategy should support the intensification of new economic development and
residential should be closely related to access afforded by new links and especially the public
transport backbone. The housing typologies and densities should result in compact, walkable

Spatial Development Framework 2016/17 114
neighbourhoods related to public transportation. Importantly, as mentioned above, all housing
developments within the mining belt must be subject to regulations and legislation in determining if
the land is safe to inhabit.
Establish a comprehensive and functional regional open space system to serve the mining belt area:
The mining belt offers the opportunity to accommodate a strong regional open space network that
can support the intensification of the developable areas over time.
Rehabilitation of degraded and polluted land and mitigation of acid mine drainage is a key
intervention, which will have to be phased over a long period of time. This includes exploring the
ecological structure of the areas as a key determinant to a future settlement pattern: Geotechnical
and undermining constraints will inform land use and building typologies. This process is required to
reclaim land for development.
Major bulk infrastructure investment is required: The phasing strategy should be linked to
reclamation and connectivity interventions. This is a long-term development strategy.
Partnerships for Development: It is acknowledged that the task of rehabilitating and developing the
mining belt is vast and will require co-operation from many stakeholders including mining
companies, land owners, various government departments across spheres, and the communities
affected (including informal dwellers). It is also acknowledged that the project of rehabilitation is a
multi-decade one. As such partnerships should be continued where they exist, or entered into where
they do not. Projects such as Project Aurous61 and Project Hloekisa62 (among others) should thus be
supported where they show potential to benefit the residents of Johannesburg.
Some legal and financial tools that are suggested support the implementation of these strategies
are:
Mechanisms and incentives to encourage mining land owners or new private sector
investors to rehabilitate and redevelop the land
A dedicated environmental restoration strategy that could attract international funds.
Regularisation or land readjustment programs for informal dwellers to improve tenure
security.
61 This project proposed by iProp, a major land owner in the mining belt, looks to promote collaboration and
cooperation between the City, mining landowners, mining land rehabilitation and reclamation operators, investors and developers to bring mine impacted land to development quickly and efficiently. 62
Project Hloekisa is addressing the removal of the non-viable point sources of mining residues and deposition sites associated with AMD. This is releasing further areas of land and improving the environmental conditions of the mining land corridor.

Spatial Development Framework 2016/17 115
Figure 43: Mining belt West, Draft development Concept
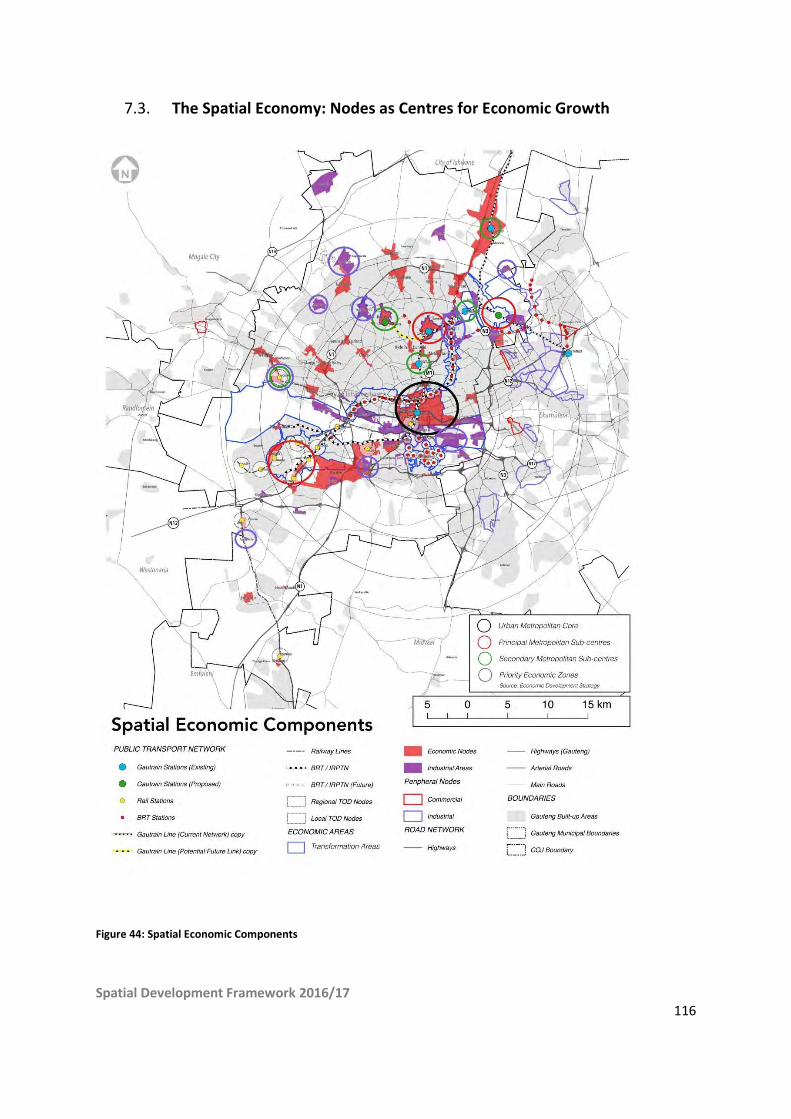
Spatial Development Framework 2016/17 116
The Spatial Economy: Nodes as Centres for Economic Growth 7.3.
Figure 44: Spatial Economic Components

Spatial Development Framework 2016/17 117
It is imperative that the Spatial Development Framework supports the City’s Economic Development
Strategy and provides an enabling urban structure for economic growth, job creation and poverty
alleviation.
The structure and efficiency of the urban system has a significant bearing on the economic growth
potential of the City. The Compact Polycentric development approach addresses a number of the
key deficiencies in the current spatial structure of the economy. The application of this approach for
economic growth is summarised as follows:
The Compact City model concentrates the factors of production, capital, people (with varied
skills), and resources close together in a shared space. High density mixed use living and a
wider range of transport options removes the need for long travel distances between home
and work. The concentration of a variety of skills and resources and quality public
environments not only creates vibrant and innovative cities, it also has substantial efficiency
gains for the economy.
The approach seeks to create higher urban value (land and property values but also place
value) and equity in the urban system by combining the following elements in specific areas,
underpinned by a quality urban environment:
o Increased modal density (the variety of transit options available).
o Increased job density and diversification of economic opportunities.
o Increases social density (intensity and quality of community facilities like schools,
libraries, parks and health facilities).
o Increased people density (population and job density combined).
A strong urban core provides a large concentration of people, jobs and city amenities that
allows for economies of scale and significant diversification within a mixed use environment
that is highly accessible internally and well connected to the rest of the city. Its centrality
and diversity provide major opportunities for new economic growth without the need for
major infrastructure expansion.
Concentrated infrastructure investment yields higher returns (both monetary and socio
economic); serves more people and increases the reliability of supply. High density compact
environments also provide the opportunity for major infrastructure investment like public
transport systems that would not be viable otherwise.
The Economic Development Strategy aims to support the following outcomes:
Retention and consolidation of existing viable business and economic centres.
Attraction of new businesses and investment including those in the manufacturing sector.
Support for the development and growth of micro enterprise and small and medium-sized
enterprise.
Achievement of a better spatial distribution of economic activity and job opportunities in the
City. Delivering greater inclusiveness in the economy in particular for previously
disadvantaged citizens and the youth.

Spatial Development Framework 2016/17 118
The City’s Economic Development Strategy proposes five main economic interventions to achieve
faster economic growth, higher city revenues and economic transformation:
I. Improved service delivery for business by doing the basics right.
II. Creation of priority economic zones.
III. Creation of business clusters in priority sectors and areas.
IV. Fast tracking decision making for large, job creating investments.
V. Establish SMME hubs.
The spatial development strategy for the city will create an urban structure that will ensure urban
efficiencies and qualities that will support the outcomes and interventions mentioned above.
Key outcomes for the spatial development strategy are to: position the City’s economy in relation to
global markets; improve the spatial efficiency and competitiveness of the City; better exploit
agglomeration potential in both new and existing economic sectors; grow economic energy and
potential in areas of economic deprivation and connect deprived communities into existing
economic centres.
Spatial Development Strategy for the Key Economic Components
i. Global significance
Linking the City into the African and global economy is dependent on a range of factors but in
essence the city needs to act as a hub for movement, transactions, investment, goods and services
especially for the African region and BRICS economies.
Building up the Inner City as a strong and diverse urban economic core will strengthen
Johannesburg’s role as a gateway to Africa and the world. The interrelationship between the Inner
City as a strong urban core and Sandton as a Principal Metropolitan Sub-Centre provides the basis
for defining the City’s role within the global economy. Although the roles of these two centres
overlap, Sandton is to a large extent the City’s global financial gateway, supported by the
connectivity to OR Tambo Airport. The Inner City, while also playing a significant financial role in
hosting major banks and businesses, will act mainly as a trade hub and gateway to Africa. Future
investment and growth in the central core must position the Inner City as an African hub that
provides expertise and a variety of goods and services with a strong network to growing markets on
the continent. The cosmopolitan nature and strong cross border trading function of the Inner City
must be enhanced to fulfil this role.
ii. Nodal structure and connectedness
A clear and logical nodal structure related to a Compact Polycentric city will create the efficiencies in
the urban system to enable sustainable economic growth. Transforming the Inner City into a strong
and diversified urban metropolitan core, (as discussed above), will establish it as the central anchor
of the polycentric system.

Spatial Development Framework 2016/17 119
The next nodal tier in the polycentric system consists of Metropolitan Sub-Centres. Three Principal
Metropolitan Sub-Centres are identified:
Sandton: (Existing)
Soweto: (Emerging)
Modderfontein: (Future)
Sandton is the only clear centre that currently fulfils this role with a high level of inter-
connectedness and interdependence with the Inner City. Increasing efficiency, diversifying land use
and linking it with good public transport systems are necessary to support its future function.
Soweto provides all of the potential elements of a Principal Metropolitan Sub-Centre but for its weak
economic structure and low level of diversification. The strategy is therefore to build a strong mixed
use and dense urban core around the existing public transport network that includes both rail and
BRT. This core will be concentrated around the Jabulani, Kliptown and Baralink nodes and supported
by smaller nodes like Nancefield station and Orlando Ekhaya. Improved access to Soweto and
connectivity to the Inner City and other economic nodes like Roodepoort is essential for increasing
the economic base of Soweto. The potential of the Mining Belt for economic development and job
creation also provides an opportunity to draw economic energy into the Soweto core area. The
construction of the N17, access to Soweto from the N1 and cross mining belt connections are
critical. Detailed economic strategies and the creation of viable economic clusters would start to
develop Soweto into a vibrant and diversified Metropolitan Sub-Centre forming the southern anchor
of the polycentric network.
Modderfontein is earmarked as a future Principal Metropolitan Sub-Centre as part of the proposed
Randburg – OR Tambo Corridor. Its strategic location within the broader city-region makes it well
suited for such a centre. The intention is to create space and opportunity for major economic growth
and expansion that is integrated with the rest of the city-region, taking advantage of existing and
planned infrastructure investment in the area. Any future development in Modderfontein and
surrounding land parcels will be considered in terms of: the development principles contained in the
SDF and related policies; the need for expansion and the logical sequence of infrastructure
programmes and availability of funding; connection to surrounding marginalised areas; and the
development of inclusionary housing in the area. The detailed frameworks and proposals for the
development of the centre around the new Modderfontein Gautrain station and the surrounding
areas, (including Linbro Park), will ultimately determine the exact nature of the node.
A number of Secondary Metropolitan Sub-Centres that have a similar strong relationship to the
Principal Metropolitan Sub-centres would be targeted for future economic growth. Rosebank,
Randburg, Roodepoort, Malboro Station (Frankenwald/Far East Bank) and Midrand provide
opportunities in this regard. A detailed Nodal Development Strategy will be developed in support of
the SDF. It will clearly define the function and role of the different nodes in the system and
determine the interventions and investment required for future economic growth.
iii. Agglomeration and growth clusters
Spatial Development Framework 2016/17 120
The Transformation Zone provides significant opportunities for the creation of economic
agglomeration and growth clusters. A more detailed economic strategy for these areas, including the
Corridors of Freedom and the Inner City, will determine the nature of economic clusters in specific
areas and the interventions required to attract and grow industry and business in targeted sectors.
The economic nodes located outside the transformation areas are also targeted as key areas for
economic growth. Interventions and investment focus will depend on the outcome of the nodal
strategy and evolution of the Economic Development Strategy. These further investigations will
determine the specific context and function of each node and its potential to generate economic
growth and job creation to support residential densification.
The creation of economic clusters for the industrial, manufacturing and logistics sectors (including
agro-industry) will be targeted at specific areas to promote job creation especially for SMMEs.
Industrial areas earmarked as priority economic zones in terms of the Economic Development
Strategy will be a focus for economic diversification and increased accessibility especially for poor
communities. The possible development of the Lanseria area as a logistics and airport industry hub is
recognised. It will however depend on private sector investment appetite and the availability and
cost of infrastructure. Lanseria’s potential as a significant job provider for the surrounding
marginalised areas is recognised.
iv. Connecting the poor
Economic nodes and industrial areas in close proximity to areas of deprivation will be important
focus points for economic investment and growth. Access to industrial areas like Kya Sands and Laser
Park has to be improved with diversification of the economy and job creation promoted. Investment
will be focused on creating small and medium business opportunities, training and skills
development and reliable service delivery.
The development of local economic opportunities within deprived areas, especially in close to
transport stations, is a major focus of this SDF. Development of liveable neighbourhoods with good
social amenities and community facilities will form the support base for local economic
development. Affordable connectivity options to major work centres within Johannesburg and in
neighbouring municipalities are also vital.
The SDF supports the development of urban agriculture as part of the economic strategy for the
south. Particular emphasis should fall on optimising the potential of industrial areas in the south to
meet the needs of agribusiness and processing. Here the provision of infrastructure and facilities for
small business development, training and skills development should be a priority. The development
and restoration of ecological resources in the south would not only provide ecological benefits but
should also be explored as an opportunity for the establishment of related business and job
creation.
The spatial development framework and the creation of a compact polycentric urban structure will
support the economic transformation described in the Economic Development Strategy. Spatial
transformation will ensure urban efficiencies that will lower the cost of doing business (and of
Spatial Development Framework 2016/17 121
getting to work) and improve economic competitiveness. The small business sector will be
supported as a key agent in broadening opportunity, creating jobs and building the economic
resilience which can progressively address poverty and reduce inequality. Spatial transformation
that results in increased connectivity, efficiency and liveability, better quality urban environments
and a low carbon footprint will help transform the city into a more productive, generative and
ultimately equal urban system.
Consolidation Zone 7.4.
The Consolidation Zone refers to areas that fall neither outside the urban development boundary,
nor within priority areas or nodes. The area is mainly characterised by suburban built-up areas and
low density areas including small holdings and undeveloped farm portions. A range of urban nodes
are located within the Consolidation Zone, especially in the north of the city, which provides higher
intensity concentrations of jobs and densities. There are also areas characterised by high levels of
deprivation and high population densities - some more marginalised than other in terms of access to
local economic opportunities and transport connectivity.
The focus of the Consolidation Zone is 1) to create liveable lower to medium density suburban areas
that are well-connected to higher intensity areas through transit infrastructure and 2) address
challenges in areas of deprivation. In terms of the Compact Polycentric Urban model the strategy for
the Consolidation Zone is to manage (control) growth, address social and infrastructural service
backlogs and improve the structural efficiencies. The city will therefore allow new developments
that promote the goals and meet the requirements of the SDF, but do not require extensive bulk
infrastructure upgrades.
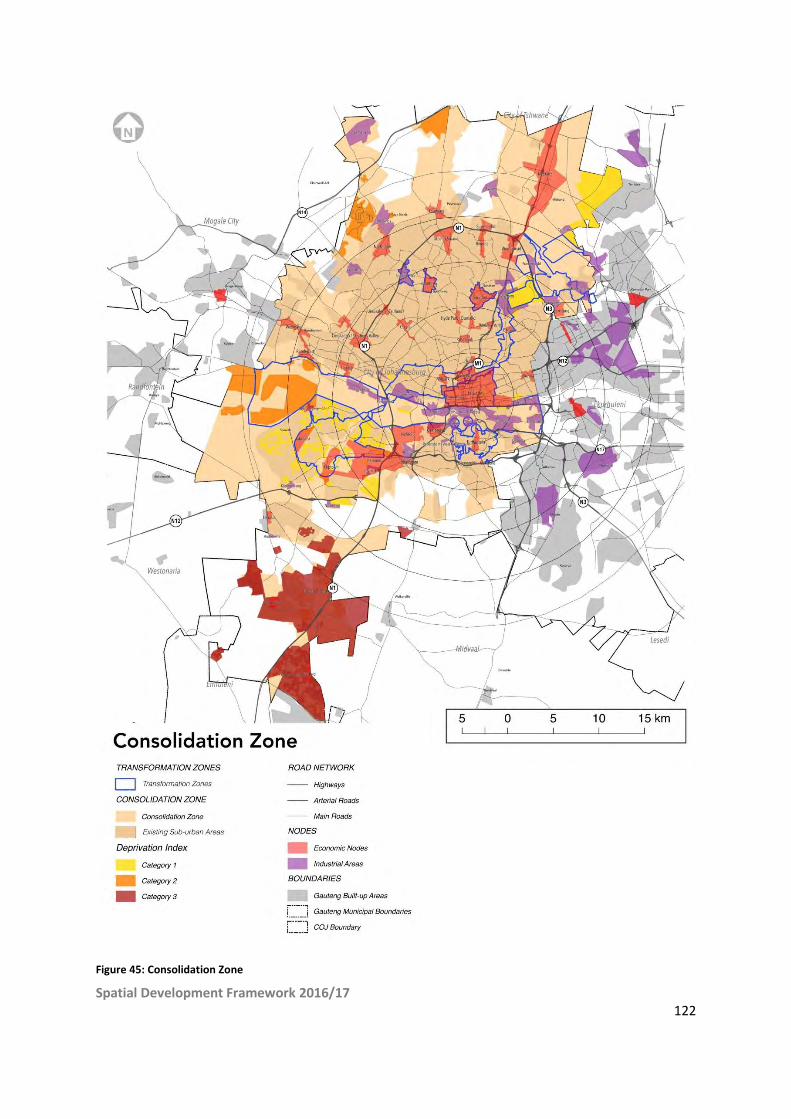
Spatial Development Framework 2016/17 122
Figure 45: Consolidation Zone
Spatial Development Framework 2016/17 123
Deprivation areas 7.4.1.
Although the compact polycentric development strategy proposes that the bulk of future
development for urbanisation should be directed towards the Transformation Zone in support of a
more compact urban form, there are substantial parts of the Consolidation Zone that require
remedial action. A large proportion of the population live in areas that are classified as deprived in
that they do not contain the qualities of sustainable and liveable neighbourhoods. These include
informal settlements and low income formal areas.
Many deprivation areas are located on or beyond the fringe of the urban system and are dislocated
from services and qualities that should be associated with urban living. Some deprivation areas fall
within the Transformation Zones discussed in the previous section and would therefore be
integrated and redeveloped as part of those development programmes. The focus of this section is
on those deprivation areas that fall outside the focus of the Transformation Zones.
Although these areas are too remote and disconnected to form an integral part of the proposed
urban core, their location and surrounding suburban configuration offer some opportunities for
growth that will improve connectivity and functionality at a local scale. Investment in the
Consolidation Zone should therefore be aimed at addressing inequalities in the deprivation areas
and to create a compact logic at a local scale. The deprivation areas fall in three distinct categories,
each with its own spatial context, opportunities and potential for development:
Category 1:
These are typically areas that despite their deprivation classification are relatively well located within
the broader urban context. This category displays the following characteristics:
Good regional transport connections.
Relatively close to large-scale economic centres.
Interconnected to the urban continuum.
Centrally located within the broader city region.
Deprivation areas that fall within this category include the broader Ivory Park area, which includes
Ebony Park, Kaalfontein and Rabie Ridge. These areas display high potential for integration and
functional interconnectedness with economic centres and adjoining urban areas over time.
Improvement of public transport links to employment centres of Olifantsfontein industrial node,
Midrand and Modderfontein as a future principle metropolitan sub-centre will provide a local public
transport backbone around which incremental development, densification and future expansion can
take place. The pace and extent of development will rely on capacity of infrastructure in the area.
Long term opportunities for major urban expansion exist in the Glen Austin and President Park
areas. Lack of bulk infrastructure and public transport shifts these areas to a long term future
opportunity to be explored once most of the Transformation Zone has reached its development
potential. Deprivation areas located in Soweto also form part of this category and are addressed in
the redevelopment of Soweto as a transformation area.

Spatial Development Framework 2016/17 124
Figure 46: Category 1 Deprivation Areas
Category 2:
These areas are mostly situated on the western suburban fringe and are to a certain extent
disconnected from the urban continuum. This category displays the following characteristics:
Fragmented suburban structure.
Variable degrees of connectivity at local and regional scale.
Some distance from economic centres but within range to reasonably access opportunities
on a daily basis.
Deprivation areas that fall within this category are Diepsloot, Zandspruit and informal settlements
near to Lanseria Airport and Kya Sand.
The general current built form and development patterns surrounding these areas are typical of
urban sprawl (car based, low intensity, mono-functional suburban areas) and thus present very
limited options for any integrated and sustainable development. There are no secondary
metropolitan sub-centres in the area to link new urban development to. The closest secondary
metropolitan sub-centres (Randburg and Midrand), are between 15 and 20 kilometres away from

Spatial Development Framework 2016/17 125
Zandspruit and Diepsloot. Even at a local scale there are no mixed use local centres that provide the
basis for structuring intensification and compaction around them.
The only significant job opportunities in the area are industrial nodes in Laser Park and Kya Sand. The
area around Lanseria Airport will provide some job opportunities in future, but will not have the
qualities of an urban centre. It will to a large extent be a mono-use logistics and distribution centre
with airport related industries with a potential mixed-use opportunity at the N14/R511 intersection
that can accommodate finer grain residential and commercial activities.
The industrial areas of Kya Sand and Laser Park will be a focus for economic development in terms of
the Johannesburg economic strategy and provide the best opportunity for integrated and compact
development around them and as economic catalyst areas the redevelopment of Zandspruit
informal settlement. These industrial nodes then become the most logical connection point and link
into the broader urban area.
The extension of the K56 through Diepsloot connecting to Midrand provides an opportunity for a
mixed use economic node at the intersection with the R511. This local node will support the logic for
the expansion of Diepsloot to the east in order to deal with the local need for housing in the area,
and for the growth of economic opportunities.
Figure 47: Category 2 Deprivation Areas
Spatial Development Framework 2016/17 126
Category 3: Peripheral areas
These are deprivation areas that are situated mostly to the south of Soweto and are far removed
from any significant economic centres within the city region. This category displays the following
characteristics:
Highly fragmented suburban structure
Poor connectivity to urban centres – limited transport options.
Long distance from economic centres.
Low inter dependence and functional coherence with any urban centre in the city.
No principle or secondary metropolitan sub-centres in the surrounding region.
Very low economic base.
Deprivation areas that fall within this category are Orange Farm, Lehae, Poortjie and informal
settlements in surrounding areas.
The deprivation areas in the South mainly consist of historical formal low income settlements and
informal settlements. The formalisation of informal settlements in this area has resulted in the
supply of housing but to a large extent has created single use and poorly serviced settlements that
are so isolated from economic activity in the city or its region that they hold little opportunity for any
significant economic centre to be created. Further expansion of the current footprint will only
exacerbate the deprivation and economic exclusion of more people.
This does however not mean that the areas should remain deprived. On the contrary, it should be a
key focus for targeted investment in order to achieve the following outcomes:
Meeting infrastructure backlogs.
Establishment and improvement of public transit links and connectivity to the urban core
(Inner City), the principal metropolitan sub-centre (Soweto) and nodes in the south of the
city, such as Lenasia.
Establish safe and walkable environments especially to and from public transport and
community facilities.
Affordable efficient and safe public transport provision.
Development of local economic opportunities especially around public transport facilities.
A network of high quality social and community facilities that is easily accessible in social
clusters where possible.
The strategy intention is therefore to create liveable neighbourhoods with high quality public
amenities and environments that are well connected with economic opportunities in the urban
centre and sub-centre. The options for formalisation and upgrading of informal settlements should
be carefully considered to ensure that further marginalisation of communities don’t occur (through
expansion). The main provision of accommodation should shift to the Transformation Zone to
ensure better inclusion into the urban economy. The current housing programmes in the area should
be concluded and a continued programme of investment should ensure that in existing housing
developments, sustainable and liveable neighbourhoods are created.

Spatial Development Framework 2016/17 127
The development strategy supports the establishment of urban agriculture operations throughout
the region to act as a broad economic base. Wherever opportunities for economic development
become viable it should be supported with relevant infrastructure.
Figure 48: Category 3 Deprivation Areas
Development Strategy and Outcomes
Development of settlements in the deprivation areas to become liveable, diversified, integrated
parts of the city is a critical and priority component of the development strategy. Although the
Consolidation Zone is not the focus for future growth and development (infill intensification or urban
expansion), there is a realisation that the prevailing issues in deprivation areas must be resolved and
that interventions will be required within the local context.
The development of sustainable and liveable settlements with a range of housing typologies that
also respond to affordable and low cost housing needs in the area will be an important component
of the strategy. Ad hoc development to simply respond to the immediate housing need without also
addressing other factors of marginalisation such as fragmentation, poor connectivity, poor
walkability, proximity to facilities and jobs, diversification, poor and unsafe public environments, etc.
is however not supported by the strategy as it will simply exacerbate the urban deficiencies already
in evidence.

Spatial Development Framework 2016/17 128
Any new development in the deprivation areas has to demonstrate its contribution to a more
compact, integrated and efficient development pattern and as such the development parameters in
this area will impose strict criteria and requirements to ensure the intended outcomes of the
strategy are achieved.
The intention of the development strategy is to maximise the potential of the deprivation areas
within the context of their distinct characteristics. The intended outcome is to resolve the problems
associated with deprivation areas and at the same time create patterns of development that support
compact city principles (at a local scale), create improved connectivity, improve quality of life and
provide the building blocks for economic growth. The focus of the strategy is to address
developmental issues within the local context that will ultimately allow for seamless integration in
the long term. It is imperative that this investment is generative in nature, rather than merely
responsive. Any new development and investment should seek to establish a clear urban logic that
can serve as a basis for future sustainable urban evolution.
The strategy implies that connections from deprivation areas to local and regional centres of
employment should be strengthened and that new development required to alleviate the housing
need in the area is focussed within walking distance from employment centres and public transport
stations. The nature of these developments should be higher density typologies with associated
public and social facilities and a structural logic that supports walkability and access.
Priorities for development in existing deprivation areas are as follows:
On-going commitment to the provision and upgrading of engineering services to meet the
standards and needs of the local area.
The provision of high quality social infrastructure and public facilities is a priority focus of the
development strategy.
Formalisation and upgrading of informal settlements that fall within the parameters of the
Consolidation Zone requirements. Poorly located informal settlements should be relocated
to the closest possible proximity of employment centres.
Promotion of local economic opportunities within settlements, concentrated around public
transit stations.
Improve connections and affordable public transport options to economic centres and job
opportunities.
Promote economic growth and job creation in the priority Economic Zones proposed in the
economic strategy, especially those in the proximity of deprived areas.
Extension of walking, cycling and public transport provision and related infrastructure.
Provision of high quality public transport and upgrading of precincts around public transport
nodes such as taxi ranks, interchanges and rail and Rea Vaya BRT stations.
Parameters and requirements for new development related to the deprivation areas within the
Consolidation Zone
No substantive development requiring bulk infrastructure upgrades within the Consolidation Zone
will be supported unless it supports compact city principles and fulfils the following requirements:

Spatial Development Framework 2016/17 129
Any urban expansion or infill development in the Consolidation Zone will have to
demonstrate that it is required in order to address issues related to deprivation in the local
context.
The focus of any residential development should be on low cost and affordable housing. At
least 60% of housing should be geared towards affordability levels below the median
household income of R3500 per month.
Residential density must relate to movement and structural logic of the development and
support principles for compact walkable neighbourhoods. Developments must realise
appropriate densities and ensure a mix of housing typologies and affordability range.
Connectivity into the existing suburban fabric and main movement lines should be
maximised. To this end design standards for walkability, intersection density, road pattern
and proportion of street space must be met.
Any new development must be in close proximity to an existing or planned economic node.
Accessibility to jobs and especially walkable access must be achieved. Adequate space for
possible expansion of economic centres should be planned for with reference to the
Johannesburg economic strategy.
Developments should demonstrate urban efficiency gains related to sustainability indicators.
No potential infill area within the Consolidation Zone will be released for development unless there is
an approved development framework for the area that incorporates the following elements:
Spatial plan that addresses the requirements for development in the Consolidation Zone and
conforms to the development principles of a compact and integrated urban form.
Clearly specified outcomes of the development and the related targets.
A land readjustment scheme must be completed as a component of the framework.
Infrastructure planning and costing must be represented in the form of an implementation
programme that indicates the total cost of the project (including bulk services costs) and
proposed phasing of the development. The total financial commitment for the City has to be
disclosed.
Any commencement of development will be subject to the inclusion of the associated capital
investment requirements in the approved three year budget Medium Term Expenditure
Framework (MTEF) of the City.
A land release strategy will be linked to phases based on the logical and cost effective
provision of infrastructure.
New phases for development in the infill zone will only be released once 80% of the
preceding phase has been developed.

Spatial Development Framework 2016/17 130
Figure 49: Potential Infill Areas

Spatial Development Framework 2016/17 131
Established suburban built-up areas 7.4.2.
Development in the established suburban built-up areas in the Consolidation Zone should be
focused on improving liveability and local urban efficiencies. The overall SDF transformation themes
of compaction, inclusivity, connectedness, resilience and generative urban structures are still
appropriate to inform the city’s developmental approach to these suburban areas, albeit within a
localised scale and context. Most of the established suburban built-up areas are characterised by low
levels of inclusivity and structural improvements are required to improve local connectivity,
resilience and vibrancy.
Development Strategy
The focus of development strategy is to create liveable lower to medium density suburban areas
that are well-connected to areas of higher intensity through transit infrastructure, without the need
for additional investment in service infrastructure. The city will therefore allow new developments
that promote the goals and meet the requirements of the SDF, but do not require extensive bulk
infrastructure upgrades.
Structural efficiencies can be addressed by:
Improving access to metropolitan sub-centres and economic nodes by creating strong
connections and affordable public transport options between local and regional centres of
employment. Public transport routes such as the BRT and Gautrain feeder routes can assist
to strengthen the connections and also become a structuring element for residential
diversification.
Diversification of residential typologies will contribute to a greater range of inclusive housing
opportunities within these areas. Residential densities should decline with distance from
economic nodes and transformation areas and the appropriate density ranges will be
informed by the nodal hierarchy. Residential density must relate to movement and
structural logic and support principles for compact walkable neighbourhoods. Residential
typologies that are well-integrated with the economic nodes and social clusters through
good design and good public space interventions should be demonstrated.
Diversification of economic activities can include promotion of more inclusionary economic
activities by providing smaller economic spaces and more mixed-use developments. Small
scale business activities supported by residential accommodation on the same site can form
part of this approach.
Clustering of social facilities will create accessible social amenities and provide opportunities
for linking through non-motorised transport networks. Suburban areas should be well-
serviced by the full range of social amenities and services, including facilities such as
childcare and educational services. These types of local services should be located along key
movement networks and within or in close proximity to nodes and medium to higher density
residential typologies.
Spatial Development Framework 2016/17 132
The suburban areas also interfaces with the green zone (urban development boundary) and its
sensitive ecological resources, which means that land use and intensities must be scaled down where
this interface occurs. Development guidelines are also provided in chapter 8 to address this.
There are large vacant (in excess of 2 hectares) or under developed land parcels, including
agricultural holdings and farm portions within these suburban built-up areas and the conditions
related to potential infill areas within the Consolidation Zone under 7.4.1 will be applicable to guide
their development).
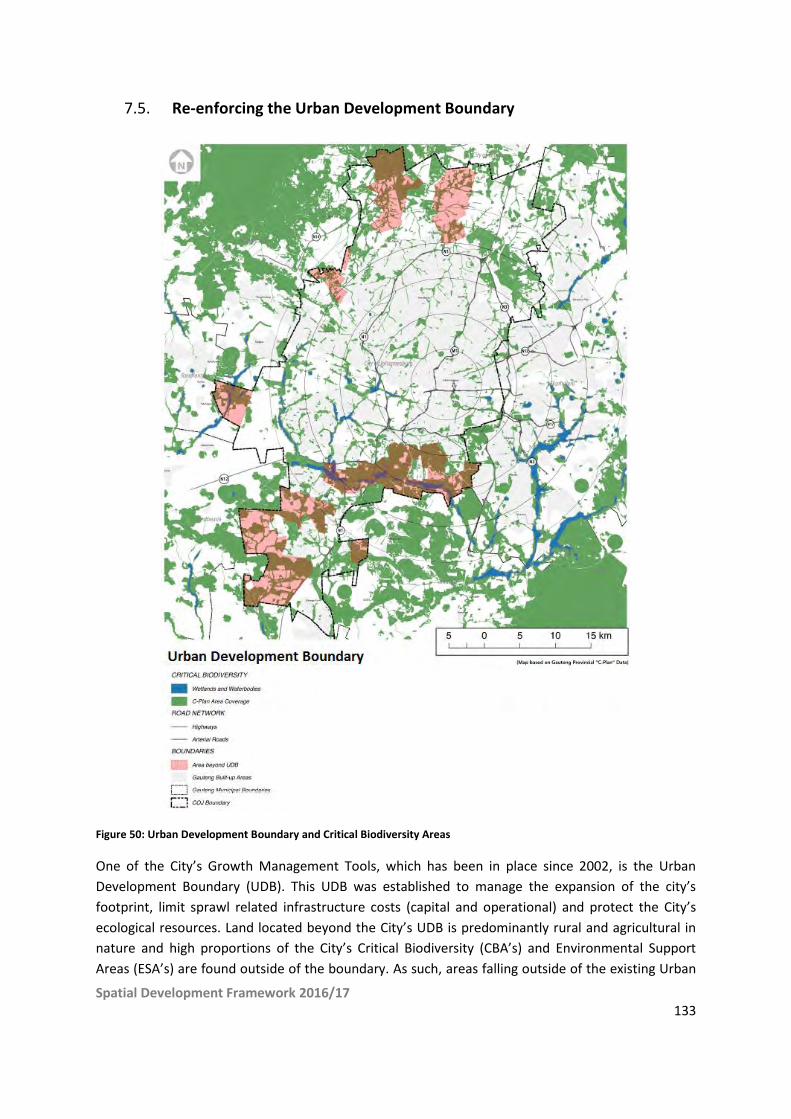
Spatial Development Framework 2016/17 133
Re-enforcing the Urban Development Boundary 7.5.
Figure 50: Urban Development Boundary and Critical Biodiversity Areas
One of the City’s Growth Management Tools, which has been in place since 2002, is the Urban
Development Boundary (UDB). This UDB was established to manage the expansion of the city’s
footprint, limit sprawl related infrastructure costs (capital and operational) and protect the City’s
ecological resources. Land located beyond the City’s UDB is predominantly rural and agricultural in
nature and high proportions of the City’s Critical Biodiversity (CBA’s) and Environmental Support
Areas (ESA’s) are found outside of the boundary. As such, areas falling outside of the existing Urban
Spatial Development Framework 2016/17 134
Development Boundary are viewed as a focus of ecological resource protection and management,
food production, low intensity social services and amenities, agricultural related investment, leisure
and tourism, and green energy initiatives. The city will, therefore, limit development and
infrastructure investment that is not related to such initiatives.
Development outside the UDB will be considered in terms of compliance with the following land use
criteria:
Agriculture: purposes normally associated or reasonably necessary in connection with
agricultural purposes and agri-villages. This includes only dwelling units related to the
agricultural use of the property.
Conservation Areas and Nature Reserves: Areas designated for nature conservation, which may
include tourism facilities (accommodations/restaurants) and recreational facilities directly
related to the main use.
Tourism and recreational related facilities: Outdoor and tourism related activities including
hiking trails, hotels, restaurants, curio markets, conference facilities, wedding venues, game
lodges and other similar uses with a rural character not causing a nuisance or having a
detrimental effect on the environment.
Social amenities: Social amenities serving communities in close proximity and that cannot be
accommodated within the Urban Development (including Schools, Clinics, Religious facilities) –
the scale of these facilities will be considered carefully and may be more restricted than the
development controls outlined below, especially schools and religious facilities
Farm stalls
Rural residential uses and agricultural holdings
Any other related development or service, provided that the proposed development:
o Services primarily a local market; or
o Is located at a service delivery centre or central place to the community; or
o Is premised on a City approved Development Framework / Precinct Plan (e.g. Lawley
Station).
Proposed activities that conform to the above land use criteria will be further evaluated noting
whether:
The development is in an area that has been identified to be ecologically sensitive or contains
endangered species – proposals would not generally be supported in these instances.
The development would have a detrimental effect on the environment – applicable
environmental legislation will prevail.
Bulk infrastructure capacities would be exceeded – proposals would not generally be supported
in these instances.
The development will be in keeping with the character / ambience of the surrounds.
Proposed developments outside the UDB that do not conform to the above land use criteria will not
be supported.

Spatial Development Framework 2016/17 135
The following regulations are applicable to the Urban Development Boundary
Urban Development Boundary Regulations
Site Specifics vs. “The Bigger Picture”: In many instances, applications submitted for a change of land
use or division of land beyond the UDB are motivated on the grounds that agricultural potential and
operations have diminished and / or security issues associated with relatively large portions of land.
Whilst these issues cannot be ignored and each proposal and application must be considered on
individual merit, the bigger picture of the desired City form and the potential precedent (if
approved) must also be considered in assessing applications and proposals. The availability of bulk
services on a site cannot be used as the primary motivation for development beyond the UDB.
Infrastructure is one aspect related to the delineation of the UDB, issues of environmental
sensitivities, precedent, implication of similar developments on infrastructure capacities and life-
cycle costs, urban form and access to current / planned (i.e. 3-5 year budget horizon) public
transportation infrastructure are also considerations.
Existing and new rights: Amending the UDB each time an application is approved beyond its
delineation would be impractical. Similarly, a scattered series of properties bounded by individual
boundaries is not desirable. Where large portions of land are involved and or a cluster of properties
form a logical extension of the UDB, a re-alignment of the UDB post-approval of rights may be
considered via a SDF and RSDF review cycle.
Where rights have been historically approved or are newly approved by Council beyond the UDB,
these rights remain intact. It will not however necessitate a formal amendment to the UDB (unless
deemed prudent by Executive Director: Development Planning or successor via a SDF and RSDF
review cycle).
Where rights have been historically approved or are newly approved by Council beyond the UDB and
a conflict exists with the Provincial Edge (given alignments) the City recognises these rights as
legitimate and directs any queries in respect of additional Provincial policy or requirements to the
Head of Department: Gauteng Department of Economic Development.
Infrastructure Provision: The focus for the City in the short to medium timeframe is to upgrade and
refurbish existing infrastructure within the UDB and within the transformation areas associated. As a
founding principle, extensions of the City’s infrastructure beyond the UDB cannot be supported.
Township Establishment and Land Development Areas beyond the UDB: A proliferation of
developments beyond the boundary, facilitated via Township Establishment applications is not
desirable. However, the formal establishment of a township to facilitate an appropriate and
acceptable development (in relation to the criteria outlined in this section) without placing an
obligation on the City to extend services and infrastructure may be acceptable in certain instances
(e.g. where legal issues prohibit the granting of consent uses, where a township application becomes
most appropriate to address development concerns i.e. traffic impact study & geotechnical analysis).
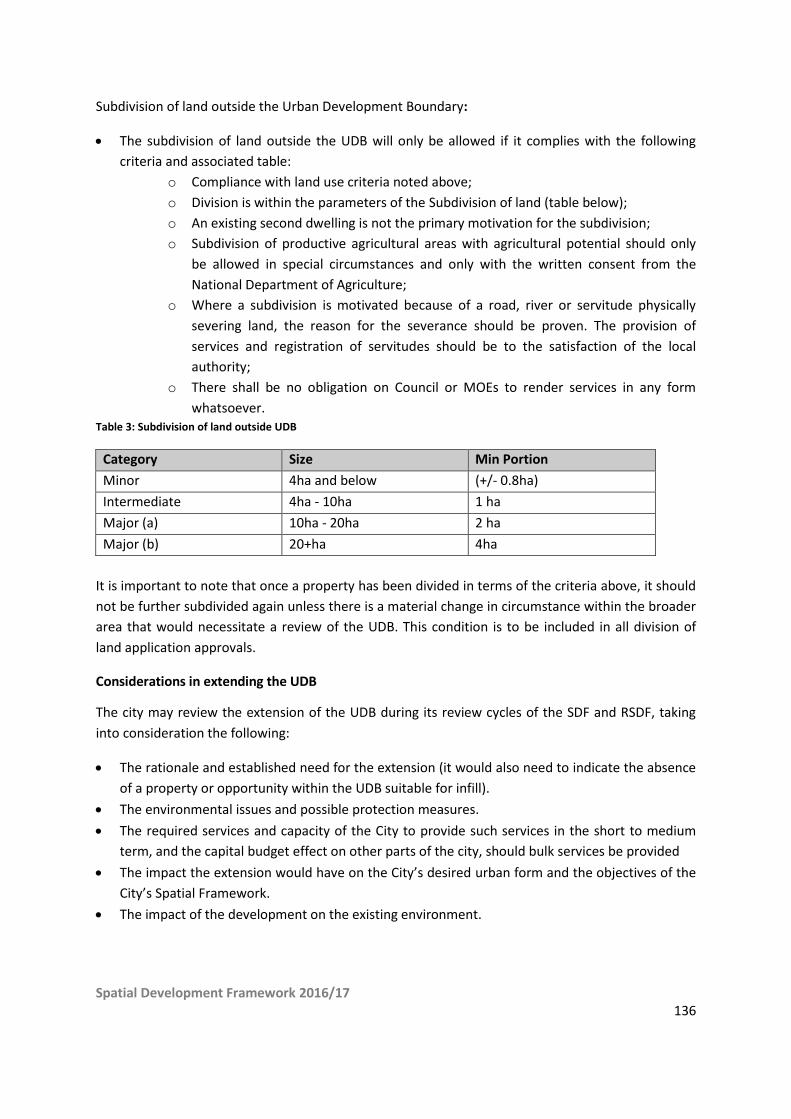
Spatial Development Framework 2016/17 136
Subdivision of land outside the Urban Development Boundary:
The subdivision of land outside the UDB will only be allowed if it complies with the following
criteria and associated table:
o Compliance with land use criteria noted above;
o Division is within the parameters of the Subdivision of land (table below);
o An existing second dwelling is not the primary motivation for the subdivision;
o Subdivision of productive agricultural areas with agricultural potential should only
be allowed in special circumstances and only with the written consent from the
National Department of Agriculture;
o Where a subdivision is motivated because of a road, river or servitude physically
severing land, the reason for the severance should be proven. The provision of
services and registration of servitudes should be to the satisfaction of the local
authority;
o There shall be no obligation on Council or MOEs to render services in any form
whatsoever. Table 3: Subdivision of land outside UDB
Category Size Min Portion
Minor 4ha and below (+/- 0.8ha)
Intermediate 4ha - 10ha 1 ha
Major (a) 10ha - 20ha 2 ha
Major (b) 20+ha 4ha
It is important to note that once a property has been divided in terms of the criteria above, it should
not be further subdivided again unless there is a material change in circumstance within the broader
area that would necessitate a review of the UDB. This condition is to be included in all division of
land application approvals.
Considerations in extending the UDB
The city may review the extension of the UDB during its review cycles of the SDF and RSDF, taking
into consideration the following:
The rationale and established need for the extension (it would also need to indicate the absence
of a property or opportunity within the UDB suitable for infill).
The environmental issues and possible protection measures.
The required services and capacity of the City to provide such services in the short to medium
term, and the capital budget effect on other parts of the city, should bulk services be provided
The impact the extension would have on the City’s desired urban form and the objectives of the
City’s Spatial Framework.
The impact of the development on the existing environment.

Spatial Development Framework 2016/17 137
Summary of Development Zones 7.6.
Figure 51: Development zones for Johannesburg

Spatial Development Framework 2016/17 138
A Transformation Zone (Blue)
The Transformation Zone (The “Blue” Zone) represents the spatial extent of the urban
transformation focus of urban growth and investment promotion, as well as being the focus of
future incentive packages, and the bulk of public capital investment (primarily facilitated through the
Johannesburg Strategic Infrastructure Platform – JSIP) .
In the Blue Zone, the city will promote densification, diversification and intensification through
capital infrastructure investment, increased density allowances and other incentives.
A Consolidation Zone (Orange)
In the Consolidation Zone, the city will allow new developments that promote the goals and meet
the requirements of the SDF, but do not require extensive bulk infrastructure upgrades other than in
meeting current infrastructure backlogs. The land uses and intensities of uses within this zone must
be scaled down where this zone interfaces with the ecological resource zone or low
intensity/ecologically sensitive areas.
An Ecological Resource Zone: Beyond the UDB (Green)
The areas falling outside of the existing Urban Development Boundary are viewed as a focus of
ecological resource protection and management, food production, low intensity social services and
amenities, agricultural related investment, leisure and tourism, and green energy initiatives.
Outside of the Urban Development Boundary, the city will limit development and infrastructure
investment that is not related to the initiatives mentioned immediately above.
Critical Biodiversity Layer
In addition to the three ‘zones’ of development, special attention must be given to the Critical
Biodiversity, Protected, and Environmental Support Areas in the city. These areas (which fall in
different development zones) should provide structuring elements to the urban realm and should be
protected to maximise the ecosystem services they provide (see section 5.5.5).
The spatial extent of each of these development zones is reflected below:
ha km2 % of CoJ
BLUE ZONE 40283.28 402.83 24%
GREEN ZONE 32662.21 326.62 20%
ORANGE ZONE 91656.68 916.56 56%
Spatial Development Framework 2016/17 139
8. Spatial Policies, Design Guidelines and Mechanisms
Chapter Summary: The spatial framework above is supported by several spatial policies and
mechanisms for implementation that are detailed in this section, namely:
Housing – providing a housing vision and approach and locational principles for housing,
including housing for the poor, state delivered housing, informal settlements, backyard
homes and inclusionary housing.
Spatial policy regulations – providing guidelines and regulations in support of the
transformation agenda.
Measuring urban performance - a system or measuring the urban performance of the
implemented strategies.
Housing 8.1.
The City’s Housing Department is currently finalising a five-year strategy and an Inner City Housing
Implementation Plan relating to shifts in national policy (current work around a revised white paper,
and later housing act nationally), and priority interventions. The City’s housing delivery strategy
should support the SDF in ensuring that programmes deliver the range of housing typologies in the
areas identified for residential densification.
The location of future housing developments to meet demand across socio-economic categories
should be located close to urban amenities, including economic activity, public transport and jobs. As
such the SDF defines the Transformation Zone as the primary focus for public and private delivery of
large-scale housing developments in the City, whereas housing development in the Consolidation
Zone is subject to a range of conditions to ensure sustainable development takes place.
In terms of this focus, the Inner City is targeted to accommodate a large number of new low income
and affordable housing opportunities, including pubic rental housing, mainly through conversion of
buildings. A significant proportion of new housing should take place in the Corridors of Freedom,
with an emphasis on affordable and social housing and rental accommodation. Some areas within
the Corridors offer opportunities for large scale low income and affordable housing developments,
such as Marlboro South, Wemmer Pan and Kliptown. The identified metropolitan sub-centres,
including new infill developments such as Frankenwald, Modderfontein and Linbro Park, and areas
around nodes and TOD nodes within Soweto are areas where significant housing opportunities for
all income groups can be realised. The Mining Belt can also provide a significant contribution to
housing accommodation, although some of this potential may only be realised over the medium to
longer term.
In the Consolidation Zone, opportunities exist for developing housing opportunities within
Deprivation areas, targeting low income residents, depending on the locational characteristics. The
approach to development of any informal settlements within the Consolidation Zone will be
informed by key determinants such as local economic opportunities, access to public transport and
future growth potential.

Spatial Development Framework 2016/17 140
Acknowledging the role of backyard rental accommodation in the City and implementing strategies
to legitimise it and ensuring minimum safety and health standards, as well as allowing additional
subsidiary dwelling units across the city within its existing built-up footprint, will also contribute to
providing more affordable accommodation throughout the city in serviced areas.
The development of inclusionary housing is a key priority to ensure that the City’s residents are
housed adequately, in close proximity to job opportunities, public transport as well as social
amenities. Such development would be achieved through inclusionary housing measures as set out
in this SDF (see section 8.1.2) and the outcomes of the Gauteng Inclusionary Housing Bill and the
City’s Housing Strategies, including a planned inclusionary housing strategy.
Informal Settlements, back yarding and subsidiary dwelling units 8.1.1.
The SDF reiterates the position supported in national policy (e.g. Breaking New Ground, the National
Development Plan, National Development Outcome 8 and the National Upgrading Support
Programme) and City of Johannesburg Policy (e.g. SHSUP and the City’s Informal Settlement
Regularisation Policy) that in-situ upgrading of informal settlements should be the first option for
intervention, with relocation only applied where upgrades are not possible or desirable for the
community in question, i.e. when settlements are not well located regarding “public transport
and/or pedestrian access to economic opportunities and social amenities (in particular, schools and
health facilities)”63 and bulk services. When relocation is necessary, distances should be kept to a
minimum (within 5 km) and should be done in close consultation and negotiation with the
community/ies affected. Upgrading of informal settlements should be done in line with the
Upgrading Informal Settlements Programme (UISP) and with support from the National Upgrading
Support Programme (NUSP).
Informal back yarding must also be addressed where it yields sub-standard living conditions. The aim
here should not be to do away with back yarding. The practice of backyard rental housing provides
valuable income for home owners, provides affordable shelter for the urban poor, and densifies low
density urban areas. In 2012 the City approved the Sustainable Human Settlement Urbanisation Plan
(SHSUP) which acknowledged backyard living as a housing option. One of the central strategies was
the Informal Backyard Enablement Programme that aimed to legitimise backyard housing and
ensure minimum safety and health standards. The programme is ongoing. The City therefore sees
the process of back yarding as part of the housing solution that can be adapted and improved to
maintain livelihoods and provide affordable housing in the city in a way that provides an adequate
standard of living, access to economic opportunity and improved quality of life for low income urban
dwellers.
The provision of additional formal subsidiary dwelling units on single residential erven in the City,
which can be rented or sold, is considered a desirable form of expanding accommodation options.
63 Department of Human Settlements. (2016). Definitions. Retrieved April 28, 2016, from National Upgrading
Support Programme: http://www.upgradingsupport.org/content/page/definitions

Spatial Development Framework 2016/17 141
This should be supported in existing built-up areas of the City, within both the Transformation and
Consolidation Zones, where sufficient bulk services are available. The intention is to allow any
residential property or business property (that allows residential use as primary or consent right) to
accommodate two subsidiary dwelling units, not exceeding 75 m2 each. This will be further
considered in the forthcoming Consolidated Town Planning Scheme. Although properties in the
Transformation Zone should intensify to higher densities than subsidiary dwelling units would allow,
incremental densification can take place in this form in the short term (except where it is explicitly
not supported in terms of approved local spatial plans/minimum density regulations). The
availability of services and accessibility will be the main determinants of desirability of this
development, as well as site evaluation of the proposed placement of units to ensure good quality
living environments.
Inclusionary housing 8.1.2.
As at the time of the current SDF review process, the Gauteng Provincial Government is in the
process of preparing an Inclusionary Housing Policy that is envisaged to apply to housing
developments within the Province as a whole. The draft Bill defines affordable housing as “a
dwelling where the total costs do not exceed 30% of a household's gross income including taxes and
insurance for owners, and utility costs” and inclusionary housing as “a housing programme that
requires developers to dedicate a certain percentage of new housing developments to low income
and low middle income households at affordable housing cost”. The Bill seeks to design inclusionary
housing legislation that requires private developers to include a certain number of affordable
housing options in new residential developments of a certain size. The number of inclusionary units
will be based on a percentage of the total number of units in a development; currently proposed at
between 10 and 30%. This SDF seeks to achieve a conscious mix of income groups in areas of the city
that are well located and well serviced by jobs, social services and public transport. The SDF supports
a requirement for inclusionary housing. With a complex issue such as this, it is recommended that a
dedicated policy be adopted for inclusionary housing, or that the Gauteng Inclusionary Housing Bill
be implemented.
Until such time as the Gauteng Inclusionary Housing Bill is adopted or the proposed City of
Johannesburg Inclusionary Housing Policy is drafted and adopted by council, all new residential or
mixed use developments of 10 residential units or more must include at least 20% affordable
inclusionary housing, catering to households earning R7000 or less per month. The City may include
conditions related to inclusionary housing in approval of applications. Density bonuses will be
awarded to developers who accommodate inclusionary housing. For details and requirements for
density bonuses, see section 8.2.5. Inclusionary housing provided must cater to a range of household
incomes below the R7000 a month indicated above, based on the City’s income distribution outlined
in section 5.3.
The Inclusionary Housing Policy proposed in this SDF aims to:
Contribute towards achieving a better balance of income groups in new residential and
mixed use developments and redevelopments.
Spatial Development Framework 2016/17 142
Provide accommodation opportunities for low income and lower-middle income households
in well located areas that they might otherwise be excluded from.
Improve the supply of affordable housing opportunities for low income households
(ownership and rental).
Mobilise the private sector to provide lasting solutions in the delivery of affordable housing
opportunities across all income groups in the city.
The following must be clarified in by-laws and related regulations:
Market correction mechanisms must be in place to protect beneficiaries of inclusionary
housing from displacement through gentrification.
Management of inclusionary housing must ensure that rentals and the reselling of units
remains affordable. In the case of ownership, amendment scheme conditions and/or title
deed restriction giving the municipality a right of first refusal on all inclusionary unit sales
will help ensure this goal.
The possibility of offsite provision/supply, as long as it is in well located areas regarding
access to jobs, economic opportunities, public transit, social infrastructure and bulk
infrastructure.
Ensuring that inclusionary housing caters for the whole spectrum of low income households,
and not just the top end of the low income segment (as detailed in section 5.3).
Mechanisms must be in place to ensure the timely development of the inclusionary units.
The development of inclusionary units must occur concurrently with the market related
units.
The design and location of inclusionary units within new developments must be approved by
council.
In order to facilitate the delivery of inclusionary housing, the SDF proposes the following:
Inclusionary housing should be coupled to an incentive programme to create a positive
development environment, and to target priority areas.
The inclusionary housing policy provides for inclusionary units to be additional to allowable
residential densities.
Land use and development management should give priority to development applications
that include inclusionary housing through fast tracking approvals.
Land use and development management must support smaller unit sizes to promote the
provision of inclusionary housing.

Spatial Development Framework 2016/17 143
Flexibility in zoning, density, height, footprint, parking and other design requirements should be
allowed to accommodate affordable housing.
City- Wide Spatial Policy Regulations and Guidelines 8.2.
A series of Policy Regulations are suggested in the SDF as a means of supporting the Spatial
Framework and the broader transformation vision. The intention of the Policy Guidelines is to
provide implementation mechanisms for meeting the vision of the SDF.
Form-Based Codes to supplement zoning in Transformation Zones64 8.2.1.
In meeting the vision of the SDF, the supplementation of traditional zoning with form based zoning,
or codes, is proposed. The aim is to pilot this approach in select transformation areas to create
design guidelines that will supplement current zoning controls, intended to create the type of urban
forms proposed by this SDF. Form-based codes are not necessarily new in the City of Johannesburg;
with policies such as the Corridors of Freedom already having introduced aspects of form-based
coding. The SDF does not define these codes in detail for each priority area, noting rather that they
should be developed for each area in consultation with the principles laid out in this SDF, and
stakeholders in each priority area. It is also proposed that, in reviewing the Consolidated Town-
Planning Scheme for the City, a level of form-based coding should be incorporated in consultation
with various city departments, stakeholders and the public. These codes should be fairly broad in
city-wide documents such as the Consolidated Town-Planning Scheme, and more detailed in area
specific spatial policies.
Traditional zoning was designed to separate land uses, in response to inappropriate land use mixes,
for example having high density residential areas in close proximity to heavy, high polluting industry.
What it has often resulted in is the separation of land uses that complement one another, such as
retail, accommodation, social services, public space and business. It has also resulted in car oriented
urban form, as well as sprawl, as large single use areas exist, that are not accessible to
complementary land uses on foot.
Traditional zoning, which defines the use of land and the development requirements of that land
(density, floor area ratio, etc.) allows for myriad combinations, that can meet the technical
requirements without benefitting the character of the built environment that various stakeholders
(from communities to planning authorities) would like to achieve. For example, a townhouse
complex may have the correct land use, coverage and density, but not interact with the street nor
contribute positively to the public realm, nor create walkability. Another example may be a mall,
which, while it may meet requirements, does not necessarily interact positively with the public
realm in which it finds itself. These are general examples, and not a consideration of all malls or
townhouse developments.
64 This section is based on information from http://formbasedcodes.org/
Spatial Development Framework 2016/17 144
The Form Based Codes Institute defines form-based codes as:
“…a land development regulation that fosters predictable built results and a high-quality public
realm by using physical form (rather than separation of uses) as the organising principle for the
code. A form-based code is a regulation, not a mere guideline, adopted into city, town, or county
law. A form-based code offers a powerful alternative to conventional zoning regulation.”65
Form-based codes are thus usually developed for a specific context, and a smaller area – a
neighbourhood or a district. Certain form-based codes may apply at a City scale, such as parking
requirements. A form-based approach may also look at ‘retrofitting’ existing built form that does not
meet the needs of the collective built environment vision, to better meet those needs.
Introducing Form-Based Codes as spatial policy on a local or regional scale in Johannesburg has the
following goals:
To supplement, not replace, traditional zoning tools to allow for a more desirable built form.
To define what form the built environment should take, and what land uses should be in
place.
To offer design requirements (not only guidelines) to be applied in specific areas.
To deal with context-specific aspects such as interaction with the street (shops and
commercial activities, and permeability on the ground floor), height, interaction of building
facades, parking location (on street, underground, or in a manner that does not create a
parking ‘buffer’ between the street and the building), pedestrian accessibility and
contribution to shared visions for the built environment.
Urban design concepts 8.2.2.
The following sections illustrate some of the key urban design concepts that will improve good built
form and enhance urban quality to be applied in this SDF. They relate to the spatial policies and
guidelines set out in this chapter.
65 http://formbasedcodes.org/definition

Spatial Development Framework 2016/17 145
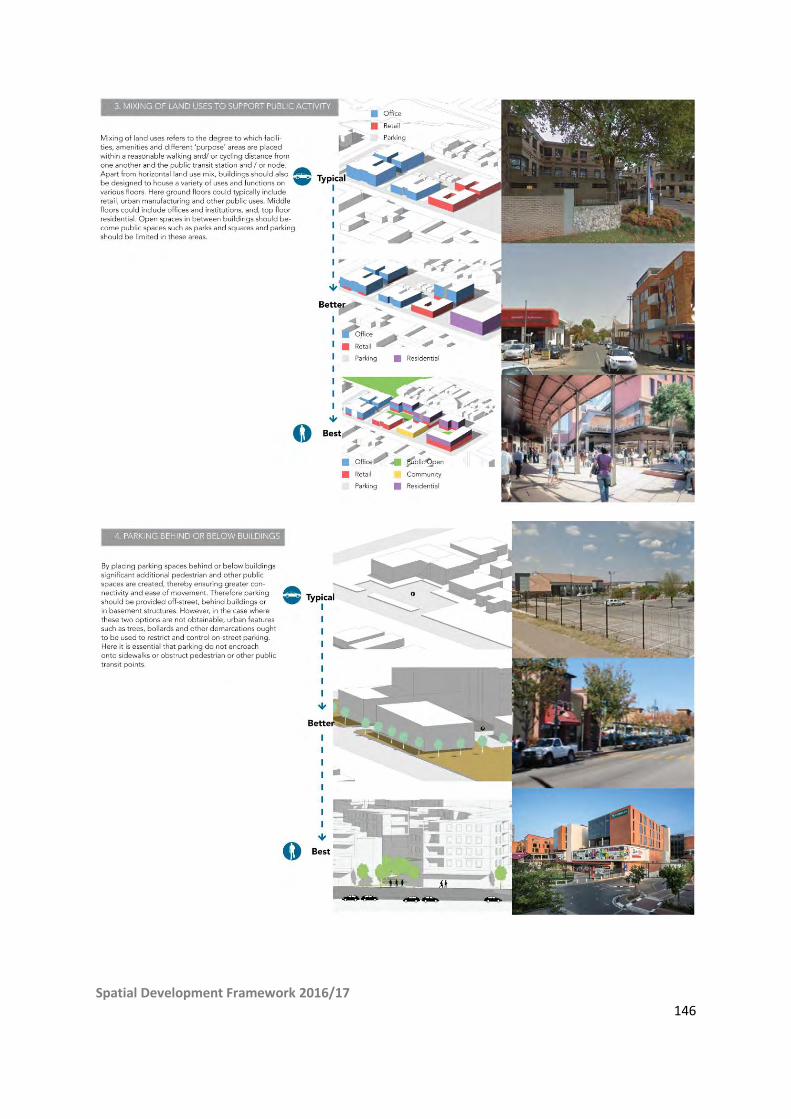
Spatial Development Framework 2016/17 146

Spatial Development Framework 2016/17 147
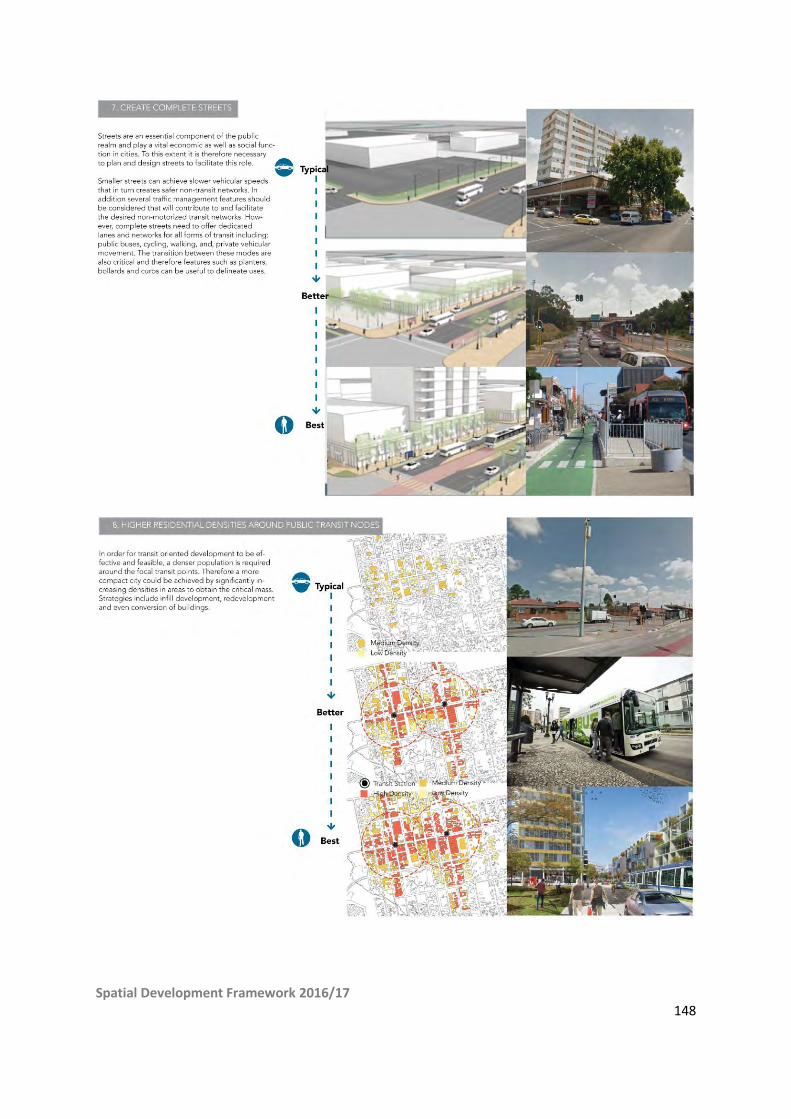
Spatial Development Framework 2016/17 148
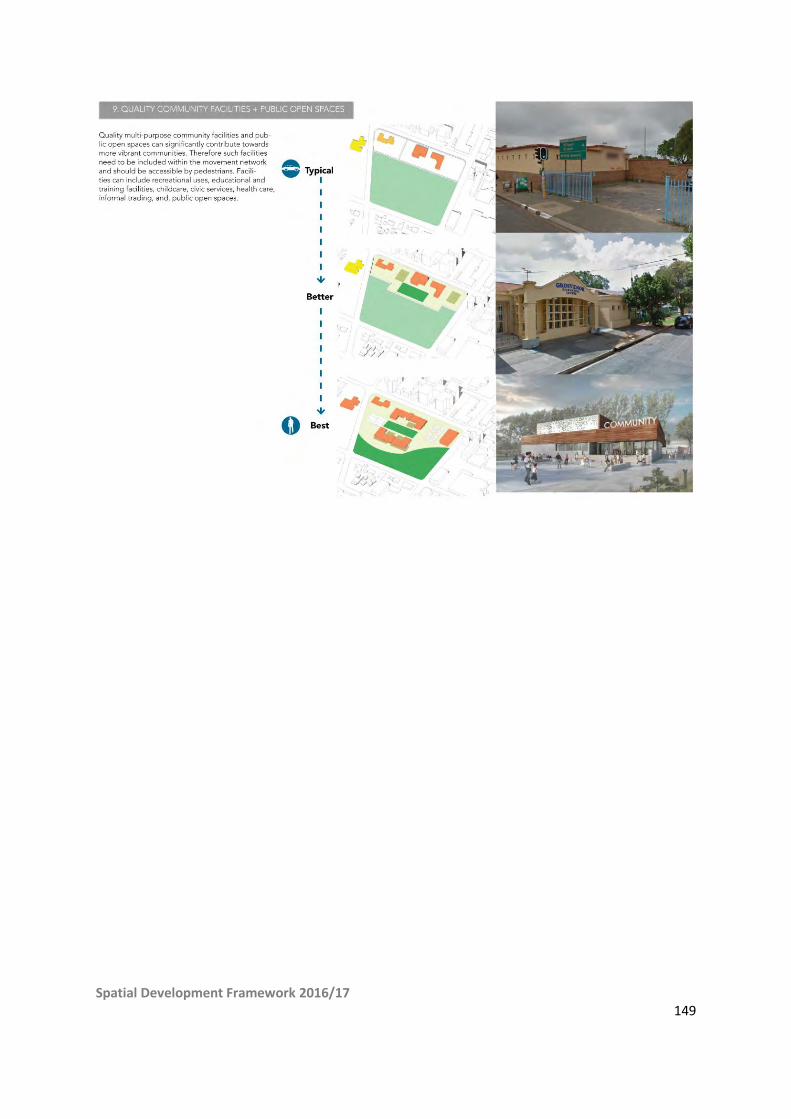
Spatial Development Framework 2016/17 149

Spatial Development Framework 2016/17 150
Public environment 8.2.3.
In addition to the urban design concepts, the following guidelines are also aimed at improving urban
quality by prosing guidelines to protect and enhance the public environment.
According to the Charter of Public Space66, “public spaces are the places publicly owned or for public
use, accessible and enjoyable for all for free and without profit motive”.
A well designed and responsive public environment is central to the broader intent of this SDF. In
this regard, the notion of the Public Environment extends beyond the provision of parks and open
spaces, including also sidewalks, streets, pedestrian connections, and spaces occupied and activated
by traders and residents on a daily basis. The public environment offers a range economic, social and
ecological benefits to the city (see section 5.5.5). One of the key intents of this SDF is thus to ensure
adequate provision, protection, and integration of public environment resources.
In order to protect and enhance the public environment:
Development should seek to integrate with its context by establishing connections to
and from the surrounding urban system, maximising permeability through the site, and
ensuring continuity of movement through the neighbourhood.
Development should ensure positive interface conditions between new and existing
developments, built and natural landscapes, and a clear transition between public, semi-
public, semi-private and private realms.
Development should reinforce and enhance existing patterns of activity where
appropriate, promote diversity and layering of uses, and provide opportunities for as
wide a range of user groups as possible.
Development should reinforce the role of non-motorised transport, providing for safe
pedestrian and cycling movement, linking to public transport systems.
Development should seek to enhance the overall public environment, reinforcing the
character of an area, and creating usable and memorable public space opportunities.
Development should consider sustainable development responses, enhance protection
of and access to biophysical resources, and adopt a physical response that can adapt to
changes over time.
A policy guideline initiative is proposed to supplement existing building and planning regulations
to focus specifically on elements of the public environment with regards to new development.
Some areas of concern that should be addressed include the interface between private
and public development, and between built and unbuilt, the configuration of the street
network, the privatisation and neglect of public space, the configuration of the pu blic
66 Biennial of Public Space. (2013). Charter of Public Space. Retrieved from http://bit.ly/1iHexO8
Spatial Development Framework 2016/17 151
environment as well as the quality (and inequality) of public environment investment.
Moreover, the erosion of public environment resources causes additional concern.
The following indicators offer precise values and possible directions that can guide previously stated
efforts:
Ensure that there is an accessible public park or recreational open space within 500 meters
of every resident. (UN Urban Environmental Accords 2005, Action 10).
By 2030, all regions achieve a tree canopy of at least 25%.
Allocate at least 50% of land to streets and public space at a neighbourhood scale. (15-20%
to public space, 30%-45% to streets, including sidewalks).
Street connectivity is between 80-120 intersections per square kilometre (UN-Habitat Global
Public Space Toolkit).
Nodal Guidelines 8.2.4.
The previous SDF and current RSDFs defined metropolitan, regional, district and neighbourhood
nodes. There has been no change in classification or delineation of nodes from the previous SDF and
current RSDFs; however this change will take place following the publication of the SDF through a
nodal review process. The nodal review will also contextualise the role and function of each node
within the new spatial framework concepts (i.e. Transformation Zone, Consolidation Zone).
The following describes the unique characteristics and qualities of different nodes, categorising
them accordingly, and offering a set of recommended interventions for each. This offers directions
for gradual development of all the relevant nodes in the city summarised in Table 4 Table 5,
reflecting the main characteristics of the nodes and guidelines for development or intervention. The
urban design concepts and public environment guidelines are particularly relevant to the City’s
nodes and have furthermore been refined in various precinct plans for specific mixed-use and TOD
nodes.
The four categories of existing nodes are:
Mixed-use / Key Urban Nodes
Industrial Nodes
Transit-Oriented-Development Nodes
Neighbourhood Nodes
Mixed-Use nodes
The system of mixed-use nodes in the city provides an important basis for integrating future growth
and investment. Not all nodes have the same potential in this regard, however, and the challenges
confronting individual nodes are equally diverse in nature. A strategy to guide short to medium term
growth within the defined nodes must thus take cognisance of these variations, whilst at the same
time seeking to contribute to the longer term vision expressed through the compact polycentric
urban model around which the SDF Spatial Concept is premised.
Spatial Development Framework 2016/17 152
The mixed-use nodes are divided according to a Nodal Hierarchy being: CBD (Metropolitan Core)
Node, Metropolitan Node, Regional Node, District Node and Neighbourhood Node.
While the guidelines and management approach with the Nodal Hierarchy suggest a broad
framework for directing the longer term development of nodal areas within the city, specificities of
different nodes should be taken into account. Following is the table outlining both the Nodal
Hierarchy and guidelines related to it:
The distinction that is important to note here is that the Nodal Hierarchy provides a high level
“placement” of these nodes relative to one another, whilst the Nodal Strategy proposed here
provides more immediate direction to shorter term growth priorities with key Urban Nodes.
Following are the tables outlining both the Nodal Hierarchy and the Priority Nodal Strategy:
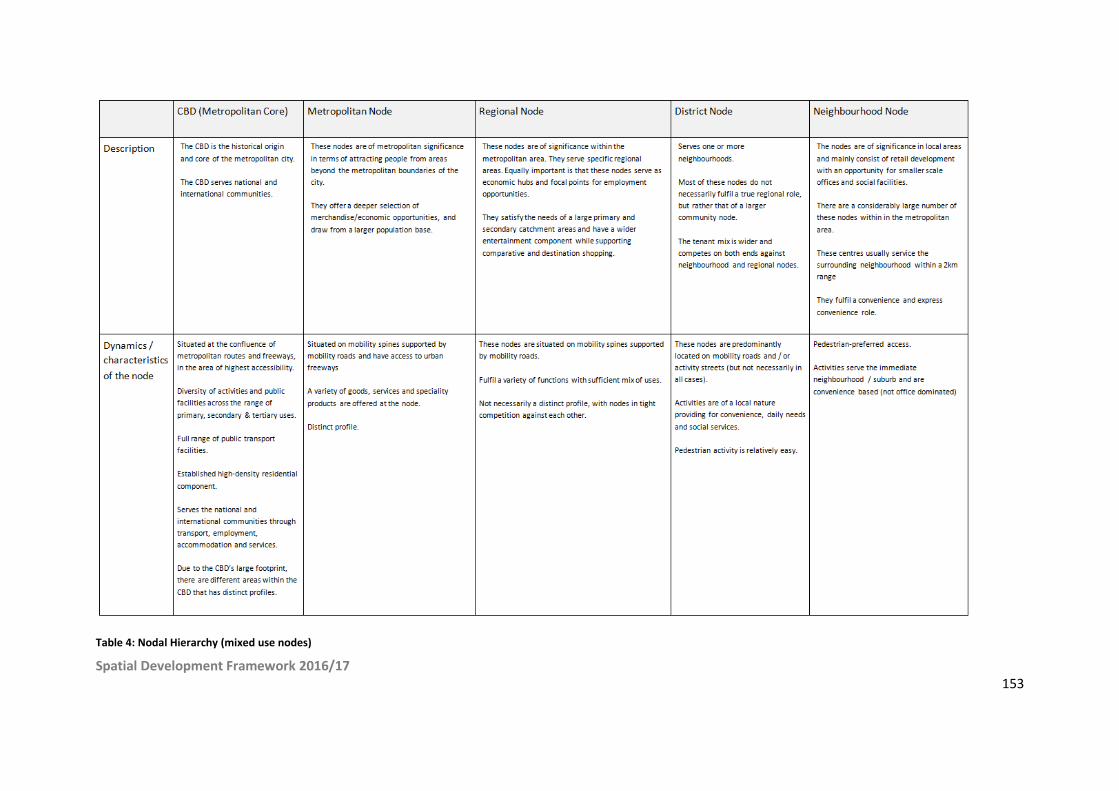
Spatial Development Framework 2016/17 153
Table 4: Nodal Hierarchy (mixed use nodes)

Spatial Development Framework 2016/17 154
Table 5: Priority Nodal Strategy

Spatial Development Framework 2016/17 155
Spatial Development Framework 2016/17 156
Industrial/Specialist Nodes
An important goal for the City is to promote the successful development of Johannesburg’s
economic base in part by ensuring that industrial land is maximised for its highest and best use.
Ultimately, it is in the City’s interests to direct manufacturing, warehousing, or other industrial
activities to the most competitive new or existing locations for such activity, so that these sectors
may flourish and create jobs and income for local residents.
In order to maximise the social and economic value of current industrial nodes, residential
opportunities, with all of the requisite urban amenities, should be promoted close by (see 7.4.1).
This would allow shorter commuting times for people working in industrial nodes. Importantly, this
housing should include a majority of low income units that are affordable (30% of household income
per month) for households earning the city median income of approx. R3500 a month (2011 prices).
This housing must also not be located in areas of polluting industry that would be harmful to
residents. A second strategy is to promote the growth of non-polluting industrial nodes in close
proximity to low income residential areas. This would bring jobs in close proximity to the areas
where they are needed most. A significant opportunity in this regard is the mining belt, as described
in section 7.2.5.
Transit Oriented Development (TOD) Nodes
Through the GDS process, TOD was identified as a priority programme, with the objective to
encourage the optimal development of transit hubs across the city, that provide access to affordable
accommodation, intense economic activities, transport, high quality spaces, amenities and social
services.
TOD nodes are a key aspect of the compact polycentric vision for Johannesburg. Stations, in this
regard, act not only as points for accessing public transit, but as catalysts for growth. Currently, too
many stations in the city are origin points, rather than destinations. This is most clear in areas such
as Soweto and Orange Farm, where the bulk of traffic leaves these areas in the morning, and returns
in the afternoon. Stations should act as points of departure and arrival, and are thus promoted as
areas of intensification of high density, mixed land uses.
TOD nodes are those that are specifically linked to transit facilities such as the Gautrain Stations,
PRASA rail stations, BRT, stations, the Corridors of Freedom and other major public transport
facilities. These nodes should ideally offer a range of mixed uses relating to the function and scale of
the transit node. TOD areas have great potential for offering good quality of life through the creation
of intense mixed-use precincts that can accommodate a range of economic opportunities within
walking distance from public transport.
These nodes vary in size and function. The largest TOD nodes are anchored by multi-modal stations,
such as Park Station, followed by Gautrain Stations such as Park, Rosebank, Sandton and the
developing Midrand and Marlboro Stations. A large number of TOD precincts are anchored by PRASA
rail stations, however generally speaking, the development potential around these stations has not
been realised. At a more localised scale, BRT stations will contribute significantly to the achievement
of TOD precincts in the City. As a matter of principle, low density, single-storey, single use

Spatial Development Framework 2016/17 157
developments are not acceptable within TOD nodes (within walking distance of PRASA, Gautrain or
BRT stations). Densities envisaged for these various public transport elements are reflected under
the Density Guidelines (section 8.2.2).
Neighbourhood Nodes
Neighbourhood nodes fulfil specific functions for neighbourhood residents and the functioning of
neighbourhoods as a whole. Their importance is related to the provision of convenience related uses
such as: social and community facilities, petrol stations with retail outlet, doctor’s consulting rooms,
convenience related shopping/services which may include uses such as convenience grocers, dry
cleaners, butchers, local fruit and vegetable shops, laundromats, restaurants, beauty parlours and
hairdressers.
In many neighbourhood nodes however, the functions that exist tend to be focussed on retail uses
alone, with little diversification, particularly in terms of social and community functions. Many
neighbourhood nodes have developed incrementally and in an ad-hoc manner, frequently resulting
in inappropriate land uses and zonings. Consequently, managing the scale of development, land use
control and law enforcement becomes problematic and limits opportunities for integration and the
sustainability of these nodes and the areas in which they are located. There is an increasing
acknowledgement that these nodes need to be better managed.
Moving forward, it is important that a process and guidelines be put in place that can guide a
transformation from neighbourhood shopping centres to real neighbourhood nodes. Such a
process/guideline would need to be premised on a number of key strategic imperatives:
Diversifying activity away from basic retail and petrol filling stations, accommodating a wider
range of uses and activities that would be appropriate to a small growing nodal area, such as
higher density residential opportunities, non-retail commercial functions, and importantly,
social and community functions.
Premising future nodal expansion around public transport infrastructure and services,
growing the user base of the node and extending its area of influence.
Structuring the expansion of neighbourhood nodes around an integrated public
environment that connects elements, facilitates movement for motorised and non-
motorised users, and provides real opportunities for place-making.
Density Regulations 8.2.5.
Density provisions and regulations are central to realising the longer term vision of the Compact
Polycentric city that forms the basis for the SDF’s Spatial Framework. In this regard, it is imperative
that specific regulations and targets be set that can facilitate higher intensity development in
appropriate areas within the urban structure (not across the entire municipality), and to develop
infrastructural capacity that can support this growth.

Spatial Development Framework 2016/17 158
It is important to note the shift in thinking from the previous SDF to this one regarding development
along mobility corridors. This SDF, as a general principle, no longer supports high intensity
development along transit (mobility) corridors and spines (specifically roads), unless specifically
defined, such as the Corridors of Freedom, or any development corridors that may be defined in
finer grain planning or during the RSDF review process. Densification and diversification should
rather be focussed around nodes, public transit stations and in the Transformation Zone.
The goal of the density regulations is to assist the City in curbing urban sprawl and locating the bulk
of the City’s residents across all income groups close to urban amenities, specifically public
transportation infrastructure, jobs, economic opportunities and social infrastructure. It is for this
reason that higher densities (as seen in the table below) will be allowed within defined walking
distances of mixed use and economic nodes and public transit stations.
Importantly too, higher residential densities will be allowed where developers show that they will
deliver inclusionary housing. To qualify, the inclusionary housing proportion of the development
must cater to households earning less than R7000 a month, with a total monthly housing cost of 30%
of household income per month (for rental or purchase). This inclusionary housing should reflect the
household income distribution indicated in section 5.3. Density bonuses will be awarded
proportionally to the percentage of inclusionary units per development (i.e. 30% inclusionary units
would result in a 30% density bonus in du/ha)67, up to a maximum density bonus of 50%. To qualify,
at least 20% of the total units applied for should be for inclusionary housing.
The strategy employs the following to achieve the above goal:
Creating a common vision of high density, mixed use, mixed income developments within
nodes and the Transformation Zone.
Increase the viability of existing and proposed public transport infrastructure and services.
Public transport and non-motorised transport infrastructure to be aligned and invested into
key priority areas.
Appropriate urban design and TOD principles to guide development.
Alignment of public infrastructure and social amenities with high density areas.
To optimise the use of land and provide accommodation in close proximity to urban
opportunities.
To improve residents' quality of life by bringing them closer to urban opportunities and
reduce travel times.
To reduce pressure for the development of open spaces and environmentally sensitive
areas.
To reduce air, water and land pollution.
Subsidised and social housing to be well integrated with uses along transport corridors.
67 For example, if the maximum allowable density is 100du/ha on a 1ha plot, the developer may apply for 120
units if they can show that 24 units (20% of total units) will be for inclusionary housing.

Spatial Development Framework 2016/17 159
To optimise the use of existing infrastructure, and realising that increasing existing
infrastructure capacity is more efficient than building new infrastructure systems.
Channel market supply into strategic densification areas.
To promote human scale, pedestrian friendly, mixed use developments.
Below are density and land use mix regulations for different typologies of urban structure and parts
of the city. All densities are subject to infrastructure availability and capacity (roads, sewers, water,
refuse removal, electricity etc.), applicable building controls and standards, heritage policies and
legislation, environmental policy and legislation and any other relevant policy, legislation and by-
laws.
Table 6: Density and land use mix regulations
Target Locations/Spatial Elements
Density /Mix Regulations
Housing Density (per erf)68 (du = dwelling units)
Land Use Mix Allowed (in order of preference)69
1
Transformation Zone
Inner City
Urban node guideline for CBD to apply (see below)
As per approved local SAF/PP/UDF/Urban Performance Measures and guidelines (section 8.3)
Corridors of Freedom Apply public transport density and Corridors of Freedom guidelines
As per approved local SAF/PP/UDF/Urban Performance Measures and guidelines (section 8.3)
Soweto Subject to provisions and guidelines emanating from approved Strategic Area Frameworks to be developed Guide Density: 40 du/ha
As per approved local SAF/PP/UDF/RSDF
Mining Belt As per approved local SAF/PP/UDF/RSDF
Randburg- OR Tambo Corridor
Minimum: 60 du/ha As per approved local SAF/PP/UDF/Urban Performance Measures and guidelines (section 8.3)
2 Consolidation Zone
Deprivation Areas/ (Re) Urbanisation Focus
To be determined per proposal - an urban design/typology issue and not a density issue. It will therefore be dealt with by the development control indicators outlined in this SDF.
As per approved local SAF/PP/UDF/RSDF
68 Where mixed uses are present in individual buildings or properties, housing density (du/ha) will be
proportionally calculated. For example, if residential use makes up 80% of the development’s floor area, the number of residential units should be divided by 80% of the property area to achieve du/ha. 69
Those listed first should be applied. If the item listed first does not exist or may be overridden by this SDF (as per section 3.1.2) then the next should be applied and so on.

Spatial Development Framework 2016/17 160
Target Locations/Spatial Elements
Density /Mix Regulations
Housing Density (per erf)68 (du = dwelling units)
Land Use Mix Allowed (in order of preference)69
Guide Density: 50 du/ha
All existing single dwelling and low density residential areas outside of Transformation Zone, nodes, nodal buffers (defined below) and TOD nodes.
To be based, per individual application, on access to: economic activity; public transit; public open space; social infrastructure (health, education, public facilities); the potential to address deprivation area challenges and the surrounding built form. Allowable erf size to be assessed per individual application. Guide density: 20 Du/ha Height: not more than one story higher than adjacent built form.
As per approved local PP/UDF/RSDF
Mobility Spines/Corridors: The fact that a property abuts a mobility spine or corridor (as defined in current RSDF’s) will no longer be supported as a stand-alone (sole) rationale for densification.
To be based, per individual application, on access to: economic activity and jobs; public transit; public open space; and social infrastructure (health, education, public facilities) and on surrounding built form.
As per approved local PP/UDF/RSDF
3 Nodes
Within CBD Minimum: 100 du/ha As per approved local SAF/PP/UDF/Urban Performance Measures and guidelines (section 8.3)
Within Metropolitan/ Regional Nodes
Minimum: 80 du/ha As per approved local SAF/PP/UDF/Urban Performance Measures and guidelines (section 8.3)
Within 500m walking distance
70 of CBD
Minimum: 80 du/ha As per approved local SAF/PP/UDF/Urban Performance Measures and guidelines (section 8.3)
70 Walking distance is by public road or public walkway, not ‘as the crow flies’.

Spatial Development Framework 2016/17 161
Target Locations/Spatial Elements
Density /Mix Regulations
Housing Density (per erf)68 (du = dwelling units)
Land Use Mix Allowed (in order of preference)69
Within 100m walking distance of a Metropolitan/Regional Node
Minimum: 60 du/ha Maximum: 120 du/ha
As per approved local SAF/PP/UDF/Urban Performance Measures and guidelines (section 8.3)
Within District nodes/Specialist nodes
Minimum: 60 du/ha As per approved local SAF/PP/UDF/Urban Performance Measures and guidelines (section 8.3)
Within 100m walking distance of District nodes/ Specialist nodes
Minimum: 50 du/ha Maximum: 100 du/ha
As per approved local SAF/PP/UDF/Urban Performance Measures and guidelines (section 8.3)
Within Neighbourhood Nodes
Guide Density: 40 du/ha As per approved local SAF/PP/UDF/Urban Performance Measures and guidelines (section 8.3)
4 Transit Oriented Development Nodes
Within 500m walking distance of Rea Vaya /BRT bus stations.
Minimum: 60 du/ha (Subject to provisions and guidelines emanating from approved Strategic Area Frameworks that exist)
As per approved local SAF/PP/UDF/Urban Performance Measures and guidelines (section 8.3)
Within 500m walking distance of Gautrain stations, PRASA rail stations
Minimum: 60 du/ha (Subject to provisions and guidelines emanating from approved Strategic Area Frameworks that exist)
As per approved local SAF/PP/UDF/Urban Performance Measures and guidelines (section 8.3)
Land readjustment 8.2.6.
Land readjustment is a process that facilitates the re-distribution of land in a project area to the
respective former landowners, after adjustment and consolidation of all parcels of land according to
a new land use plan that both enables densification and opens space for infrastructure, services and
public spaces. It is a process suggested by the SDF for implementation in the City of Johannesburg.
Land readjustment is a method that allows landowners to pool their land and develop their plots
collectively. It allows landowners to use their land as main resource to improve housing, finance
redevelopment, and can also be used for the redevelopment of dilapidated industrial areas. While
urban renewal is often associated with expropriation and displacement, land readjustment aims to
develop land while maintaining the population and creating fair and equitable benefits. The method
is often used where the fragmentation of plots impedes effective development, and single
landowners have insufficient capital to initiate their plot’s development.
With land readjustment, a group of neighbouring landowners come together in a partnership and
pool their land to jointly plan and service their adjoining plots. Part of the land can also be sold to

Spatial Development Framework 2016/17 162
offset development costs. The resulting costs and benefits of the project are equitably shared among
public bodies, landowners and developers. During the readjustment, part of the land will often be
used for infrastructure or public space. The public sector can stimulate this process by devising
incentives that promote collective action.
Land readjustment involves a change in people’s legal relationships in the same way that it alters
their physical ones. This means that there are three fundamental considerations: (1) to provide the
framework within which relationships can be changed in a clear and predictable manner that results
in mutual (public and private) benefit. (2) To ensure that the framework is fair and will treat
individuals and groups equitably, particularly the poor, women and the vulnerable, including private
landowners and the wider citizenry of the city. (3) To provide the vehicle for the implementation of
government policy on the ground, legal mechanisms are needed to address issues such as site
selection, the level of land contributions, the land valuation mechanism, sales and transfers of land
after the project has been announced, handling disputes, combatting speculation, the classification
of land in the plan, the types of formal land rights to be allocated, and financial arrangements.
Land readjustment benefits landowners and communities, as well as the city, as it helps achieve a
higher standard of living, better access to infrastructure, services and public open spaces at lower or
no cost to the local government. It also may help create new sites for development and urban
expansion. Land readjustment has been widely adopted in Asian, European and Latin American
countries.
Process and Quality Control 8.2.7.
In order to ensure that new developments meet the goals of this SDF, it is important that quality
control is implemented not only in the application phase of developments (land use and building
permission), but also in the design phase. The SDF thus proposes the strengthening of the existing
Urban Design Adjudication Committee (UDAC) that will assess all new township developments, and
developments of 1000m2 floor space or more, according to the goals of this SDF, the density
regulations (section 8.2.5) and development control measures (section 8.3).
Land Value Capture 8.2.8.
Land value capture is a mechanism to share the benefits of a land value increase that result from
public investment in infrastructure and amenities (e.g. public transit infrastructure, roads, parks or
bulk service upgrades) or other public action (e.g. rezoning, increasing development rights, etc.). It
ensures that government authorities, private developers and the general public realise a return on
public investment (through rates increases, operating revenue, land transfers etc.), and that this
return can be used for maintenance of infrastructure, and re-invested into new improvement
projects.
It is very important, especially in the context of the inequality present in Johannesburg, that returns
on investment are not only financial, but social too. This is in line with two of the major goals of the
city’s GDS, which are financial sustainability and reducing inequality. If a BRT station (or any other
infrastructure) for example were to increase the rates base, but then ‘push out’ poorer citizens to

Spatial Development Framework 2016/17 163
make way for more wealthy ones, the financial gain would be negated by the social loss. It is
therefore imperative to balance the two goals of financial and social returns on investment for the
city. It would mean that new developments should have a requirement to accommodate lower
income citizens of the city, and contribute to improving the public realm (see section 8.1.2).
Importantly, land value capture can be used as a tool not only to realise returns on public
investment, but also as a means to finance the provision of new infrastructure; a method that the
City of Johannesburg is already piloting, and one that has been successfully implemented in a
number of cities worldwide (Tax Increment Financing - TIF). It is possible to model the increase in
rates that infrastructure and resulting new developments will generate for the city. The
infrastructure needed to support this new development can then be financed, based on the
projected returns. It is important in this case, that:
Rates increases are considered thoroughly, and in consultation with finance experts and
lenders to ensure realistic predictions;
Rates increases from the specific developments are ring fenced to service the specific
infrastructure loans;
That risk on the infrastructure loans is shared by private developers and the city, to ensure
mutual commitment to realising the goals of such a project;
And that inclusive social return (such as inclusionary housing and a percentage of public
space) is set out as a requirement for this type of infrastructure funding.
According to the Urban Land Institute71, value capture mechanisms involve a financial positive
feedback loop with four components: (1) Value Creation, (2) Value Realisation, (3) Value Capture and
(4) Local Value Recycling.
71 Huxley, J. (2009). Value Capture Finance: Making urban development pay its way. Urban Land Institute.
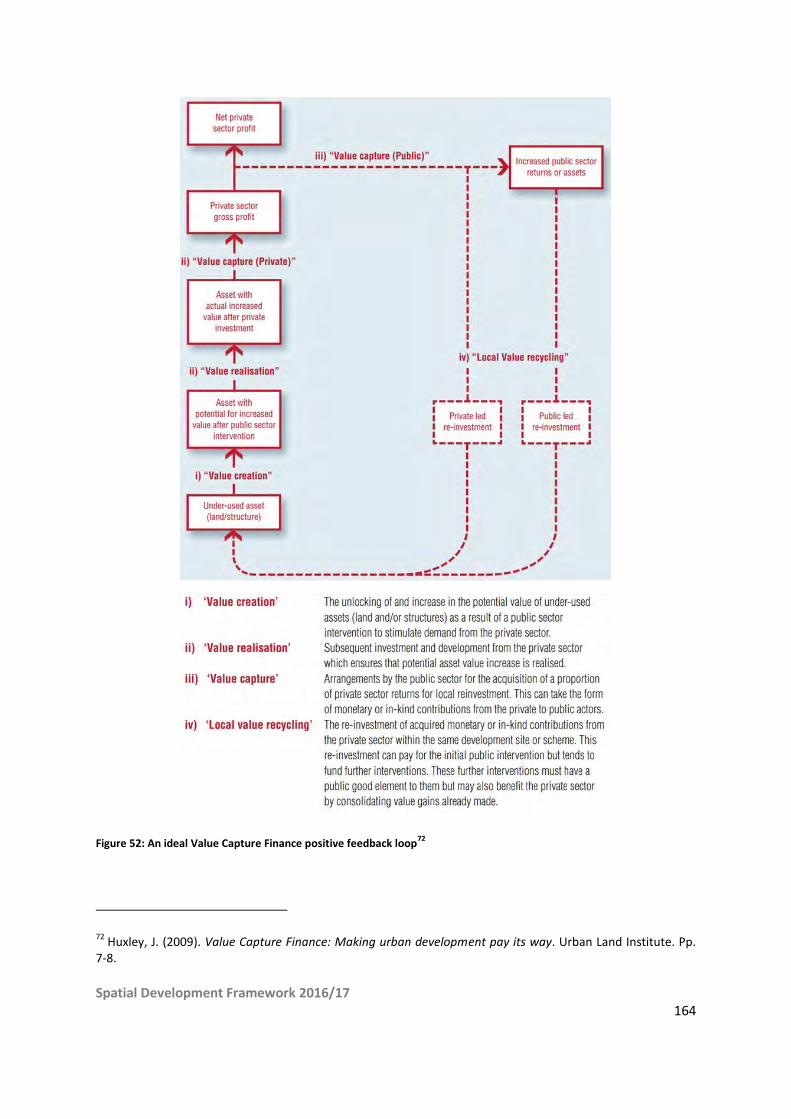
Spatial Development Framework 2016/17 164
Figure 52: An ideal Value Capture Finance positive feedback loop72
72 Huxley, J. (2009). Value Capture Finance: Making urban development pay its way. Urban Land Institute. Pp.
7-8.
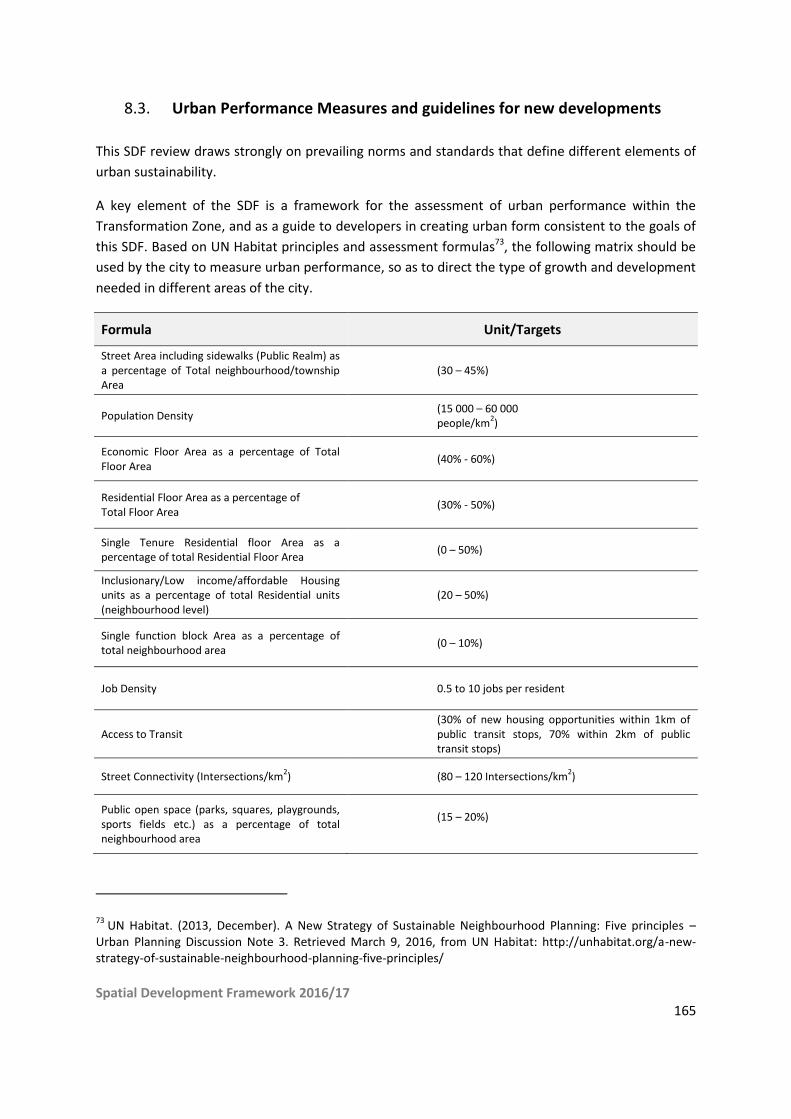
Spatial Development Framework 2016/17 165
Urban Performance Measures and guidelines for new developments 8.3.
This SDF review draws strongly on prevailing norms and standards that define different elements of
urban sustainability.
A key element of the SDF is a framework for the assessment of urban performance within the
Transformation Zone, and as a guide to developers in creating urban form consistent to the goals of
this SDF. Based on UN Habitat principles and assessment formulas73, the following matrix should be
used by the city to measure urban performance, so as to direct the type of growth and development
needed in different areas of the city.
Formula Unit/Targets
Street Area including sidewalks (Public Realm) as a percentage of Total neighbourhood/township Area
(30 – 45%)
Population Density (15 000 – 60 000 people/km
2)
Economic Floor Area as a percentage of Total Floor Area
(40% - 60%)
Residential Floor Area as a percentage of Total Floor Area
(30% - 50%)
Single Tenure Residential floor Area as a percentage of total Residential Floor Area
(0 – 50%)
Inclusionary/Low income/affordable Housing units as a percentage of total Residential units (neighbourhood level)
(20 – 50%)
Single function block Area as a percentage of total neighbourhood area
(0 – 10%)
Job Density 0.5 to 10 jobs per resident
Access to Transit (30% of new housing opportunities within 1km of public transit stops, 70% within 2km of public transit stops)
Street Connectivity (Intersections/km2) (80 – 120 Intersections/km
2)
Public open space (parks, squares, playgrounds, sports fields etc.) as a percentage of total neighbourhood area
(15 – 20%)
73 UN Habitat. (2013, December). A New Strategy of Sustainable Neighbourhood Planning: Five principles –
Urban Planning Discussion Note 3. Retrieved March 9, 2016, from UN Habitat: http://unhabitat.org/a-new-strategy-of-sustainable-neighbourhood-planning-five-principles/

Spatial Development Framework 2016/17 166
9. Capital Investment and Growth Strategy
Chapter Summary: The spatial framework above, along with the spatial policies and design
guidelines in the previous chapter, will be implemented through a targeted capital investment and
growth strategy.
Capital Investment Focus 9.1.
The purpose of this chapter is to provide an overview of the strategic investment focus and how it
links back to the spatial strategy. For the detail of the actual programmes and the funding allocations
the BEPP and IDP, and approved budget (each updated an annual basis) should be referred to.
Along with defining a spatial vision for the City, the SDF must provide clear direction for future
growth through development policies and strategies. Further to the policies and guidelines
introduced in the previous chapter, the implementation of the SDF takes place at two key levels.
Firstly state and private sector developments are overseen by the city through its development
approval process. The intent of the Spatial Development Framework is realised through the
application of policy and legal guidelines, requirements and mechanisms to direct development
towards achieving its overall goals and outcomes.
Secondly the implementation of the SDF relies on capital investment in infrastructure. This
investment guides growth directions and ambitions for future development. Through guiding public
investment in bulk infrastructure and services the SDF will in turn guide private investment and
development in the city. Public sector investment in infrastructure and services represents the most
significant portion of capital investment in the city and the direction the spatial framework provides
for the capital investment programme is essential for successful implementation.
Spatially guided investment planning is well established in Johannesburg and is the focus of this
chapter. The City’s approved Built Environment Performance Plan (BEPP) provides detailed evidence
of the strategic integration of capital investment programmes with development strategy and spatial
plans. The BEPP incorporates the Capital Investment Framework and the Consolidated Infrastructure
Plan (CIP) that focus primarily on engineering infrastructure related to asset management plans and
future bulk requirements.
Along with aligning spatial policies and goals with capital investment, the capital budget process
ensures compliance with the requirements and regulations of the Municipal Finance Management
Act (MFMA) and the guidelines of National Treasury. The process consists of a number of extensive
consultations between all departments and entities responsible for capital investment and the
Development Planning Department. Development Planning is the custodian of the SDF and related
development strategies and also coordinates the capital planning process and formulation of the
capital budget. This technical process is overseen by and reports to a political process consisting of a
number of Mayoral Lekgotlas, Budget Steering Committee sittings and ultimately Mayoral
Committee and Council approval of the three year budget. To support this process the City had

Spatial Development Framework 2016/17 167
developed and implemented a software model, the Johannesburg Strategic Investment Platform
JSIP, which provides:
A consolidated database of all infrastructure project requirements across the City.
A sophisticated prioritisation model underpinned by strategic spatial directives (SDF), asset
management requirements (CIP) and the growth and development strategies of the City.
A 3 year Medium Term Expenditure Framework (MTEF) linked to financial sources and
budget allocations for prioritised projects over multiple years. The budget is further broken
down into spatial development programmes like the Corridors of Freedom, Deprivation
Areas, Inner City (Urban Core) and various asset management programmes.
Project implementation tracking and reporting system.
Capital Investment and Growth Management Framework 9.1.1.
There are three broad categories for capital investment that contribute to the overall Capital
Investment Framework strategy. These relate to managing existing assets, meeting infrastructure
backlogs, and increasing capacity to direct growth. These are discussed below.
Infrastructure Asset Management
Infrastructure Asset Management refers to investment in existing infrastructure assets to address
asset life cycle requirements. It includes refurbishment and replacement in order to secure
continued service delivery. The Consolidated Infrastructure Plan prioritises areas that require
refurbishment and replacement, including those where service constraints exist (where demand
currently exceeds capacity), and upgrading of capacity is required.
The priority areas for upgrading, refurbishment and replacement of existing infrastructure for roads,
power, water and sewer are depicted in Figure 53 and Figure 54.
Figure 53: Priority Sewer and Water Upgrade Areas

Spatial Development Framework 2016/17 168
Figure 54: Priority Power and Road Upgrade Areas
In priority development areas including the Transformation Zones, strategic economic nodes and
deprivation areas, upgrading of existing infrastructure, (in addition to refurbishment and
replacement), to create additional capacity for development will form part of the asset management
investment where it contributes to the intended development outcomes of the SDF.
Infrastructure investment to deal with backlogs in deprivation areas
This investment focuses on servicing backlogs and deficiencies in engineering and social
infrastructure in underserviced, marginalised parts of the city. Investment in these areas also needs
to address the structural and built form concerns that have been raised in the SDF. Infrastructure
investment is therefore targeted at resolving backlogs and inequalities specifically related to the
deprivation areas towards creating more sustainable and liveable settlements with improved quality
of life for residents.

Spatial Development Framework 2016/17 169
A number of deprivation area programmes are already in place (previously referred to as
marginalised area programmes) including in Orange Farm, Diepsloot, Ivory Park/Kaalfontein and
Alexandra. These programmes will be supplemented by similar programmes focussed on the
Zandspruit area and the general area of the Southern Deprivation areas.
Figure 55: Capital Investment in Deprivation areas
These areas are classified as high priority investment areas with clear envisaged outcomes and
spatial opportunities as expressed in the SDF (section 7.4.1) as well as detailed frameworks and
development strategies for the individual areas.
The Formalisation of Informal Settlements Programme is an integral part of the deprivation areas
investment plan. A large number of housing projects are currently addressing demand in these
areas. The development strategy is to conclude existing projects already underway and to align new
in-situ development projects to the SDF policy imperatives for integrated and sustainable human
settlements before new capital investment is allocated.
Increasing infrastructure capacity for development in strategic growth areas
This investment targets the Transformation Zone and strategic economic and ToD nodes to provide
adequate capacity for higher intensity development promoted throughout the SDF. This growth is
aims at accommodating urbanisation and economic growth, in line with the compact polycentric
model defined. Development programmes in these areas require pre-emptive capacity upgrades
Spatial Development Framework 2016/17 170
both to allow for the densities proposed, and to attract private investment towards building a more
compact, efficient and ultimately liveable city.
The transformation areas are the main focus for future development through urban intensification
and growth and thus are high priority areas for growth enabling capital investment. Each programme
that makes up the Transformation Zone already has detailed development frameworks and precinct
plans to guide capital investment. Investment in these areas covers all infrastructure requirements,
including engineering infrastructure, social infrastructure and public facilities. The Corridors of
Freedom and Inner City have clear investment programmes, with funding allocations in the MTEF,
that will ensure the desired urban structure and developmental outcomes are achieved.
Another priority for intensification and expansion is investment to support economic growth centres
in terms of the Johannesburg Economic Strategy. Investment in economic infrastructure will support
and safeguard the current economic mainstay of the city and ensure growth opportunities and job
creation. The investment focus on the nodes is also of strategic importance for the deprivation area
programme to ensure more economic growth and job opportunities in close proximity of
economically marginalised areas. Where economic nodes form part of the Transformation Zone such
investment is already integrated in the respective development programmes.
With so many competing infrastructure and development needs across the city, and a finite capital
budget, it is inevitable that trade-offs through prioritisation have to be made. The JSIP and the
associated capital investment planning process assist the city to find an optimal balance in
infrastructure delivery to secure and improve the current asset base, achieve the objectives for
upgrading and development in deprived areas and accommodate the future development
aspirations and needs of the city.
While broad priority areas for investment have been identified, funding availability, economic
growth rates and other practical considerations require that development and growth have to be
managed. The concept of growth management firstly requires that growth and investment have an
area based focus in order to consolidate a range of investments that will have a catalytic, multiplier
effect on returns (social, environmental and financial). The second implication of growth
management is the phasing of growth and the timing of investment that will release new growth
opportunities. It is therefore important that growth trends be monitored and interpreted continually
to influence policy and investment decisions. Growth management is thus linked to the SDF
development indicators that will provide a measure of the success in relation to the intended
development outcomes and targets. This would then allow for future adjustments of investment
policy to be more responsive to prevailing conditions and development objectives.
The SDF seeks to integrate all urban components of infrastructure, transport, housing, the
environment and economic development to provide the basis for targeted capital investment to
achieve future development outcomes and targets.

Spatial Development Framework 2016/17 171
Annexure 1: Urban Development Boundary Amendment