Embed Size (px)
Citation preview

International Journal of Astrophysics and Space Science 2016; 4(1): 1-11
Published online January 22, 2016 (http://www.sciencepublishinggroup.com/j/ijass)
doi: 10.11648/j.ijass.20160401.11
ISSN: 2376-7014 (Print); ISSN: 2376-7022 (Online)
Spatial Pattern of Burglary in South Yorkshire Using Geographic Information System (GIS)
Gaylan Rasul Faqe Ibrahim
Geography Department, Faculty of Arts, Soran University, Soran City, Erbil, Kurdistan Region, Iraq
Email address: [email protected]
To cite this article: Gaylan Rasul Faqe Ibrahim. Spatial Pattern of Burglary in South Yorkshire Using Geographic Information System (GIS). International
Journal of Astrophysics and Space Science. Vol. 4, No. 1, 2016, pp. 1-11. doi: 10.11648/j.ijass.20160401.11
Abstract: Burglary is an offence committed against others’ property and it is considered a violent crime. Nowadays to
monitor and detect burglary crime geographic information system (GIS) is used broadly. The aim of this study is to analyses
spatial pattern and spatial dependency of burglary in the study area by applying GIS techniques. For understanding the crime
pattern better and creating plans for preventing and reducing crime and using the resources and places, sometimes might make
greatest differences; the identification of hotspots in time is very important. The data for this study obtained from the
secondary data; boundary shape file of the study area, socioeconomic data and burglary data for November 2012 were gained.
The outcome of the study shows that the distribution of burglary is clustered. It is clear from the results that the rate of burglary
strongly affects the percentage of unemployed people; also the percentage of non-white and young people (aged 20-24) does
not significantly correlate with burglary.
Keywords: Crime, Burglary, Spatial Pattern, GIS, South Yorkshire
1. Introduction
‘Crime analysis is the systematic study of crime and disorder
problems as well as other police-related issues-including
sociodemographic, spatial, and temporal factors to assist the
police in criminal apprehension, crime and disorder reduction,
crime prevention and evaluation’ (Santos, 2012, p. 2).
The field of crime analysis was invented at the beginning
of nineteenth century by the London Metropolitan Police
(Santos, 2012). The United States (US) National Institute of
Justice’s Crime Mapping Research contributed significantly
to the novelty and widespread of crime analysis in many
developed like countries like Australia and South America
(Chainey and Ratcliffe, 2005).The main purpose of this study
is to analyze spatial pattern of burglary in South Yorkshire
using Geographic Information Systems (GIS) techniques.
The rest of the report is organized as follows. Section two
focuses on reviewing existing literature, section three
discusses the methodology for this study while section four
analyses spatial pattern of burglary. Section four discusses
results of the analysis and section concludes the report.
1.1. Explanation of the Topic
This current study focuses on identifying spatial pattern of
burglary in South Yorkshire using based techniques. The
study analyses burglary data for November obtained from the
South Yorkshire website and map examines its distribution
using spatial auto-correlation concept in GIS environment.
Density of burglary per 1000 households was mapped in
order to examine rates of victimization of a household in the
study and spatial cluster of burglary was mapped using
kernel density estimation so as examine areas of higher than
average concentration of burglary. Finally, socioeconomic
variables like ethnicity, age groups, education attainment and
occupation was mapped in order to analyse spatial
heterogeneity and dependency of burglary. The topic is
valuable and worthy of researching because earlier studies
(Ratcliffe, 2004; 2002; Santos, 2012) have the valuable of
crime mapping in policing management and decision
makings.
1.2. Study Justification
In a British survey of 2009/10, total crime rates in England
and Wales dropped by eight per cent in 2009/10 while burglary
rates in South Yorkshire has declined by 11% with 7 rates per
1000 households (The Guardian, 2010). Despite recent
significant declined in burglary rates, the South Yorkshire
police authority and their partner organizations lunched Closed

2 Gaylan Rasul Faqe Ibrahim: Spatial Pattern of Burglary in South Yorkshire Using Geographic Information System (GIS)
Circuit Television (CCTV) to assist them in ‘reducing and
detecting’ burglary as well as reducing the fear of victimization
(South Yorkshire Police, 2012). However, more efforts are
required by the police authority to maintain the low burglary
rates and even further reduce the burglary rates to the
minimum level like identifying spatial pattern of burglary.
Previous literature (Ratcliffe, 2004; Chainey and Ratcliffe,
2005; Brunsdon et al, 2007 and Chainey et al, 2008) have
demonstrated that identifying crime pattern assist the policing
authority to understand places with high cluster of crime and
allocate ideal resources to those areas since police resources
are limited. This study is aimed at identifying spatial pattern of
burglary in the study area and therefore it is worthy of
investigating because it will assist the policing authority in
strategy burglary reduction planning and managing their
resources because police resources are limited.
1.3. Study Area
South Yorkshire is a county in England. It comprises of
four metropolitan areas that include Doncaster, Rotherham,
Sheffield and Barnsley. South Yorkshire has 94 wards.
Fig. 1. Study area (South York Shire).
2. Literature Review
GIS application in crime mapping is widely spread.
Declined in the prices of computer hardware and software,
and availability of digital police crime data have resulted to
the broad applications of GIS concept in crime mapping
(Chainey and Ratcliffe, 2005). Various theories of
environmental criminologists (Santos, 2012; Thomas and
Znaniecki, 2012; Nagin and Peternoster, 1993) have
explained occurrence of crime based on environmental and
behavioral factors that led to the opportunities for
perpetrating crimes in space and time. These theories include
the rational choice, the crime pattern, the social

International Journal of Astrophysics and Space Science 2016; 4(1): 1-11 3
disorganization and the routine activity theory. According to
Santos (2012) crime pattern theory observed that crime
activities prevail as a result of interaction between activities
of potential perpetrators and activities of potential victims in
space and time. The rational choice theory emphases on
circumstances that influence individual propensity to commit
a crime based on perceived benefits and risks involved
(Nagin and Peternoster, 1993). The social disorganization
theory considers individual locality or neighborhood type as
a key predictor of crime and defines crime as outcome of
social interactions. The social disorganization theory posited
that neighborhood type affects individual’s ability to commit
or not to commit a crime (Thomas and Znaniecki, 2012). The
routine activity theory observes that variation in people daily
activities improves opportunities for perpetrating a crime like
burglary (Santos, 2012).
Burglary rates are not evenly distributed. Winchester et al
(1982) state that burglary clustered around or in deprived
neighborhoods. They examined risk of burglary in Sheffield
and explored that burglary concentrations cluster around
privately rented dwellings and terraced housing. Similar
study was conducted in Manchester and found that burglary
risk cluster around council flats (Winchester et al, 1982).
Akins (2006) examined relationship between burglary and
racial segregation in 340 American cities. Akins (2006)
finding revealed that percentage of young male population
does not significantly correlates with burglary while
deprivation positively and significantly predict burglary.
Carmichael and Ward (2000) examined relationships between
youth unemployment and crime in the England regions and
Wales using statistical method. They revealed that
unemployment positively and strongly correlates with
burglary and percentage of non-white ethnic group does not
significantly correlates with burglary. This study will
examine spatial pattern of burglary as well as spatial
dependency or heterogeneity with burglary and other
socioeconomic variables.
3. Research Method
This study applies GIS-based techniques in analysing
spatial pattern and spatial dependency of burglary in the
study area. The methods include spatial autocorrelation in
order to examine spatial distribution of burglary in the study
area, thematic mapping of burglary in order to map
distribution of burglary, kernel density estimation for
examining cluster of burglary and burglary density mapping
in order to map risk of victimization for a household. The
analysis of this study entails mapping of socioeconomic
variables In order to examine spatial heterogeneity and
dependency of burglary.
3.1. Research Methodology
Table 1. Crime mapping techniques.
Methods of crime hot
spots mapping advantages limitations
Thematic mapping
It is one of the most widely applied techniques. Williamson et al.
(2001) have revealed that geographical boundary themaptic map
is easier and quicker to identify crime hot spots even by an
unskilled analyst.
‘Geographic areas of various sizes and shapes, when
aggregated and thematically shaded can be misleading.
For example map reader’s attention to be drawn to the
large area that are broadly shaded’ (Chainey and
Ratcliffe, 2005, p. 151)
Grid thematic mapping
Chainey and Ratcliffe (2005) state that grid thematic mapping
gives better visualization of the spatial crime pattern when ideal
cell resolution is selected.
Processing grid thematic map is time consuming and big
sizes of files. The output map can be misleading when
high resolution grid is applied.
Point mapping
Chainey and Ratcliffe (2005) have posited that point mapping is
useful in visualizing few number of crime incidents and mapping
repeat victimization of burglary. This technique is not ideal for
this study because it is restricted t small number of crime events.
According to Brunsdon et al (2005) crime events cluster
in particular location when and identify hot spots can be
hard applying this technique to map huge number of crime
data.
Kernel density
estimation (KDE)
A KDE output map enable better interpretation of spatial crime
cluster as compare to other traditional methods like point map,
grid thematic map, thematic and geographic thematic maps
(Chainey and Ratcliffe, 2005). KDE map shows more accurate
location, relative scale and spatial distribution of crime hot spot
(op cit). AS a result of the above benefits of KDE, this study
applies KDE method in analysing burglary hot spots.
KDE technique is influenced by lack of statistical strength
(Chainey and Ratcliffe, 2005).
KDE method is the most appropriate technique for
analyzing burglary hot spots in the study area due to the
above advantages of the technique over others as mentioned
in table 1 above.
Moran’s I.
Moran’s I index estimate spatial distribution of crime data
which cluster, disperse or random across a geographic unit
(Santos, 2012). It is a standard measure of global spatial
dependency, which can be applied to polygons, or points that
have attribute data attached to it (Chainey and Ratcliffe, 2005).
‘The advantage of Moran I over nearest neighbour is that
while nearest neighbour analysis allow analyst to measure
clustering in points, Moran’s I can show if there is significant
clustering in a variable’ (Chainey and Ratcliffe, 2005, p. 130).

4 Gaylan Rasul Faqe Ibrahim: Spatial Pattern of Burglary in South Yorkshire Using Geographic Information System (GIS)
The above benefits of Moran’s I, justifies the suitability of
Moran’s I over nearest neighbour for this study.
3.2. Data
This study obtained data from the secondary sources.
Boundary shapefile of the study area was extracted from the
UKBoarder, burglary data for the month of November were
obtained from the South Yorkshire Police website.
Socioeconomic data were collected from the 2001 UK census
records.
3.3. Data Weakness
The police data is primarily the main source of data for
this study but it is argued that not all crime events are been
report to the police and therefore the Police data is not
comprehensive (Home office, 2012). This constraint of police
data affects the strength of this research. The UK 2001
census data used for this study is outdated, for more than ten
years that shows that some information may possibly change
but 2011 census is not yet released for public usages. The
used of UK 2001 census data is one the key limitations of
this study because it does not reflect current statistics. The
2001 census wards are associated with modifiable area unit
problem at both scale and zonally level. Openshew (1984)
observed that administrative boundary are been influenced by
MAUP related issues at zones and scale level. The aggregate
statistical data does not represent the underlying factors and
the polygons or census boundaries have being designed and
cannot be altered.
3.4. Rationale for Variables Selection
Table 2. Justification for selecting data.
Data chosen for the study Justification
Burglary data for the month November 2012 It was the most recent burglary data available on the police website.
UK 2001 Census data at ward level
Comparative researches (Martins, 2000; Mesev 1998; Stillwell and Duke‐Williams 2007) have posited
that census data is the most comprehensive, consistent and complete source of socioeconomic data in the
UK. Openshaw (1984) has observed that administrative boundaries like census tracts, wards and output
area units are associated with modifiable areal unit problems (MAUP) therefore it is paramount to adopt
wards level data for this study because both ward and output area level have similar problem of MAUP
and interpreting result of 92 wards in the study area is better than interpreting the result large output area
of over 1700.
Percentage of non-white Carmichael and Ward (2000) state that percentage of non-white negatively correlate with burglary.
Percentage of people aged 20-24years Akins (2006) revealed that percentage of young people does not significantly correlates with burglary.
Percentage of people with no qualification Measures of deprivation and previous works (Winchester et al 1982; Buonanno and Montolio, 2008;
Kawachi et al, 1999) have documented the relationship between burglary and deprivation.
Percentage of people with elementary
occupation
Measure of income and Kawachi et al (1999) revealed that percentage of people with low income
positively correlates with crime. Low income is a measure of deprivation.
Percentage of people with no car ownership
Measure of low income because UK 2001 census record does not holds information on income and car
ownership is used to measure income as it is assume that people with high income can afford cars.
Income is a measure of deprivation and Kawachi et al. (1999 revealed that deprived neighbourhoods are
associated with higher crime rates.
Percentage of unemployed Carmichael and Ward (2000) observed that strong positive relation exist between percentage of
unemployed people and burglary.
4. Data Analysis
4.1. Spatial Autocorrelation
Fig. 2. Spatial autocorrelation.

International Journal of Astrophysics and Space Science 2016; 4(1): 1-11 5
4.2. Distribution of Burglary
Fig. 3. Distribution of burglary.
4.3. Burglary per 1,000 Households
Fig. 4. Burglary density in South Yorkshire.

6 Gaylan Rasul Faqe Ibrahim: Spatial Pattern of Burglary in South Yorkshire Using Geographic Information System (GIS)
4.4. Hot Spot Mapping
Fig. 5. Burglary hot spots.
4.5. Choropleth Mapping of Socioeconomic Variables
Fig. 6. Percentage of people with elementary occupation.
International Journal of Astrophysics and Space Science 2016; 4(1): 1-11 7
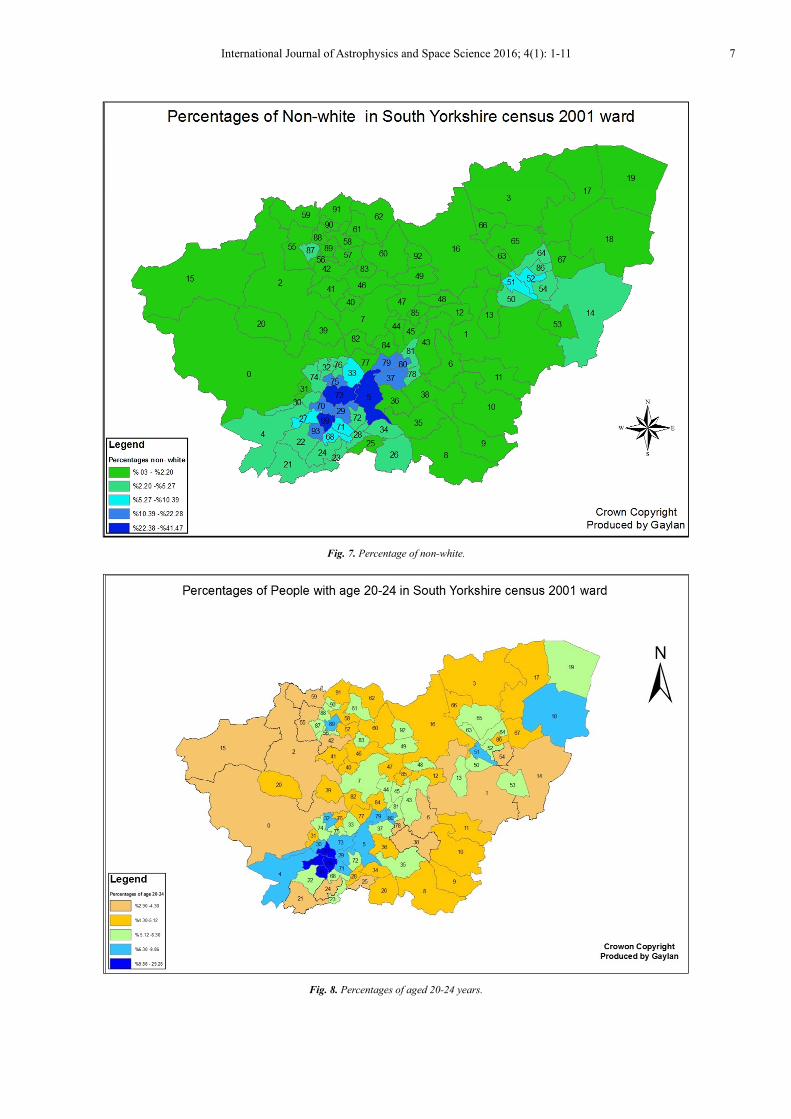
Fig. 7. Percentage of non-white.
Fig. 8. Percentages of aged 20-24 years.

8 Gaylan Rasul Faqe Ibrahim: Spatial Pattern of Burglary in South Yorkshire Using Geographic Information System (GIS)
Fig. 9. Percentages of people with no qualification.
Fig. 10. Percentages of people with no car ownership.

International Journal of Astrophysics and Space Science 2016; 4(1): 1-11 9
Fig. 11. Percentages of unemployed people.
5. Discussion
Global Moran’s I summary in figure 2 shows Z-score
value of 12.000, P-value of 0.000 and Moran’s index of
0.3280. P-value of 0.000 shows that the overall model is
significant and Z-score of 12.000 indicates that distribution
of burglary is clustered. Wards that show highest distribution
of burglary of 36 to 49 in figure 3 were Intake and
Mosborough while wards with the lowest distribution of
burglary were Penistone East, Hatfield and Askerns among
others. The thematic of burglary distribution just reflect
burglary count not the density because it has not been
normalized by the households. Burglary density map in
figure 4 shows that wards with highest of victimization of
burglary with 0.40 to 0.113 rates of 1000 households were
Broomhill, Intake in both Sheffield and Doncaster, Town
Field and Central and it implies that 1000 houses were 0.40
to 0.113 at great risk of been victims of burglary (see figure
4). Wards with the lowest 0.04 to 0.16 lowest rates of
victimization were Chapel Green and Pennistone West
among others (see figure 4). It means that 1,000 wards were
0.04 to 0.16 low rates likely to be burgled. The wards with
high density burglary like Intake and Town Field were wards
with high percentages of people elementary occupation of
over 20% (see figure 6), high percentages of unemployed
people over 6% in figure 11 and high percentages of people
with no qualification of over 45% in figure 9. This finding is
consistent with the finding Winchester et al (1982) that
observed that burglary cluster around deprived
neighborhoods. Finding from Broomhill ward challenges the
finding of Winchester et al (1982) because Broomhill ward is
among the least deprived neighbourhood as it is characterized
by low percentage of unemployed people 1.6% to 2.7% in
figure 11, low percentages of people with no cars in 13% to
23% in figure 10 and low percentage of people with no
qualification of 0.3% to 2.2% in figure 9 but high density of
burglary 0.46 to 0.113 in figure 4. Broomhill ward insight
disagrees with the finding Winchester et al (1982) might be
because of proxy.
Burglary hot spot map in figure 5 displays Hallam, South
Wortley, Penistone East, Richmond and Kiveton ward among
others as areas with significantly low cluster of burglary
crime cool spots with Z-score value of 0 to 0.8.5. Z-score
value of 10 to 19 indicates high cluster of burglary hot spots
in figure 5 and wards that shows significantly high clustered
of burglary hot spots were Intake, Sharrow, Park, Nether
Edge and Broomhill.
Wards that display significantly low cluster of burglary hot
spots (see figure 5) like Hallam, Penistone East and South
Wortley were characterized by 6% to 22% low percentages of
people with no educational qualification (see figure 9), 0.3%
to 2.2% low percentages of non-white people in figure 7, low
percentages of unemployed people of 1.6% to 2.7% in figure
11, low percentages of people with no cars of 13% to 23% in
figure 10 and low percentages of people aged 20-24 years of
2.9% to 4.3% in figure 8. Wards that displayed low cluster of
burglary hot spots in figure 5, like Park, Intake and Firth Park
ward displayed low percentages of non-white people of 0.3%

10 Gaylan Rasul Faqe Ibrahim: Spatial Pattern of Burglary in South Yorkshire Using Geographic Information System (GIS)
to 2.2% (see figure 7) except Broomhill and Sharrow displayed
high percentages of non-white people of 22% and above.
Intake, Park and Firth Park ward were wards of high
percentages of unemployed people of above 6% in figure 11
but Broomhill and Sharrow ward displayed low percentages of
unemployed people of 1.6% to 2.7% but high cluster of
burglary hot spot. Park and Firth Park ward were characterized
by high percentages of people with no cars of 43% and above
while Broomhill and Sharrow displayed low percentages of
people without cars of 13% to 23% in figure 10.
Insights from this study revealed that deprived wards like
Intake, Park and Firth Park have high cluster of burglary hot
spot in figure 5, is consistent with the theory of social
disorganization which states that neighbourhood type affects
person propensity to commit a crime and as a result, deprived
areas tend to have higher crime rates than affluent
neighbourhoods (Thomas and Znameck, 2012). The finding
from Broomhill and Sharrow ward that were among the least
deprived wards but show high clustering of burglary hot
spots challenges the theory of social disorganization in
Thomas and Znameck (2012) and (Akins, 2006; Wincester et
al, 1982) that consistently revealed that high rates of burglary
cluster around deprived wards. Broomhill and Sharrow ward
deviating from the findings of these previous works could be
as a result of proxy effect.
Evidence from the study discloses that low cluster of
burglary cool spots (see figure 5) like South Wortley and
Hallam among others were wards of 1.6% to 2.7% of
unemployed people in figure 11. This finding agrees with the
finding of Carmicheal and Ward (2000) that observed that
percentages of unemployed people strongly and positively
predicts burglary. The unique insight from this investigation
that Intake, Park and Firth Park were wards of low
percentages of non-white people of 0.3% to 2.2% in figure 7
but show high cluster of burglary hot spots with Z-score of
10 to 19 (see figure 5) while Broomhill and Sharrow were
wards of above 6% of non-white but show significant cluster
of burglary hot spot with Z-score between 10 to 19 (see
figure 5), agrees with the finding of Akins (2006) that posited
that percentage of non-white does not significantly correlates
with burglary. This indicates that burglary has no spatial
dependency with percentages of non-white persons. The
evidence from the research indicates that wards of high
percentages of people aged 20-24 years 9.8% in figure 8 like
Broomhill and Sharrow shows high cluster of burglary hot
spots (see figure 5) and also wards of low percentages of
people aged 20-24 years like Park, Intake and Firth park (see
figure 8) display high cluster of burglary hot spot this finding
is consistent with the finding of Akin (2006) that revealed
that percentage of young people does not significantly
correlates with burglary. The evidence from this study reveals
that burglary has no spatial dependency with percentage of
people aged 20-24 years.
6. Conclusion
The insight from this research (Moran’s I) reveals that
distribution of burglary is clustered (see figure 2). Evidence
from the current investigation has shown that burglary
density clustered around deprived neighbourhoods like
Central and Intake but a least deprived ward (Broomhill)
appeared to have high risk of burglary (see figure 3). This
indicates that burglary risk of victimization could happen in
both deprived and affluent wards. Affluent wards like
Pennistone East and Chapel Green displayed low risk of
burglary in figure 3. Hot spot of burglary appeared to be
significantly high most deprived wards like Park, Intake and
Town Field and even some least deprived wards like
Broomhill in figure 5. Least deprived wards like Hallam,
Penistone West and South Wortley among others were to be
wards of significant low cool spots of burglary.
References
[1] AKINS, S. (2003). Racial segregation and property crime: Examining the mediating effect of police strength. Justice quarterly, 20 (4), 675-695.
[2] BRUNSDON, Chris, CORCORAN, Jonathan and HIGGS, Gary (2007). Visualising space and time in crime patterns: A comparison of methods. Computers, environment and urban systems, 31 (1), 52-75.
[3] BUONANNO, Paolo and MONTOLIO, Daniel (2008). Identifying the socio-economic and demographic determinants of crime across Spanish provinces. International review of law and economics, 28 (2), 89-97.
[4] CARMICHAEL, F. and WARD, R. (2000). Youth unemployment and crime in the English regions and wales. Applied economics, 32 (5), 559-571.
[5] CHAINEY, S. and RATCLIFFE, J. (2005). GIS and crime mapping. Wiley.
[6] Home Office (2012). A new approach to fighting crime. [online]. Last accessed 20 October 2012 at: http://www.jdi.ucl.ac.uk.
[7] KAWACHI, I., KENNEDY, B. P. and WILKINSON, R. G. (1999). Crime: Social disorganization and relative deprivation. Social science & medicine, 48 (6), 719-731.
[8] MARTIN, D. (2000). Towards the geographies of the 2001 UK census of population. Transactions of the institute of British geographers, 25 (3), 321-332.
[9] MESEV, V. (1998). The use of census data in urban image
classification. Photogrammetric engineering and remote
sensing, 64 (5), 431-436.
[10] NAGIN, D. S. and PATERNOSTER, R. (1993). Enduring
individual differences and rational choice theories of crime.
Law & soc'y rev., 27, 467.
[11] OPENSHAW, S. (1983). The modifiable areal unit problem.
Geo Books Norwich. 38.
[12] RATCLIFFE, J. H. (2002). Aoristic signatures and the spatio-
temporal analysis of high volume crime patterns. Journal of
quantitative criminology, 18 (1), 23-43.

International Journal of Astrophysics and Space Science 2016; 4(1): 1-11 11
[13] SANTOS, R. B. (2012). Crime analysis with crime mapping. Sage Publications, Incorporated.
[14] South Yorkshire Police (2012). NOT PROTECTIVELY MARKED SOUTH YORKSHIRE POLICE [online]. Last accessed 17th January 2013 at: http://www.southyorks.police.uk.
[15] SOUTH YORKSHIRE POLICE (2012). Police crime data. [online]. Last accessed November 2012 at: http://www.police.uk/data.
[16] STILLWELL, J. and DUKE-WILLIAMS, O. (2007). Understanding the 2001 UK census migration and commuting data: The effect of small cell adjustment and problems of comparison with 1991. Journal of the royal statistical society: Series A (statistics in society), 170 (2), 425-445.
[17] THE GUARDIAN (2010). Crime statistics: Get the rates where you live. [Online]. Last accessed 15th January 2013 at: http://www.guardian.co.uk/.
[18] THOMAS, W. I. and ZNANIECKI, F. (2012). Social disorganization theory.
[19] WILLIAMSON, D., MCLAFFERTY, S., GOLDSMITH, V., MOLLENKOPF, J AND MCGUIRE, P., (1999). `A better method to smooth crime incident data’, ESRI news. [online]. Last accessed 20 January 2013 at: http://www.esri.com.
[20] WINCHESTER, S., JACKSON, H. and BRITAIN, G. (1982). Residential burglary: The limits of prevention. HM Stationery Office.


![2011 Burglary Report [infographic]](https://img.pdfslide.us/doc/110x75/568c48d41a28ab491691bd6e/2011-burglary-report-infographic.jpg)