Embed Size (px)
Citation preview

Regional Statistics, Vol. 9. No. 2. 2019 Online first Béres et al.: 1–17; DOI: 10.15196/RS090202
Spatial econometrics: transport infrastructure development and real estate values in Budapest
Attila BéresEquinox Consulting,
Hungary
György Jablonszky W.UP Kft.,
Hungary
Tamás Laposa National University of
Public Service, Hungary
Györgyi Nyikos
(corresponding author) National University of
Public Service, Hungary E-mail: [email protected]
Keywords:public infrastructures,
urban transportation analysis, sustainability
Over the last few decades, the M4 metro line has been the largest transport infrastructure project in Budapest. Despite the size and im-portance of the project, there has been no evaluation of its economic impacts in the scien-tific literature. This paper addresses this gap and expands the scientific discourse on spatial econometrics, cohesion policy, and sustainable urban development by exploring the impact of the new metro line on real estate prices. To assess the economic effect of the M4 pro-ject on the value of nearby properties, the au-thors use counterfactual impact evaluation along with a measurement of the utility in-crease in the change in property prices. The research database has been provided by the National Tax and Customs Administration. Sustainable and useful public infrastructure de-velopments will have a positive effect on the value of nearby properties. It is reasonable to assume that easier access to downtown areas can be an added value; however, the increased traffic, crowds, or noise may outweigh these positive impacts. In case of M4, the authors find no significant effects of the stations on the Pest side. Only the new stations that were not connected directly to existing underground lines exert a positive effect on nearby real estate properties. It is worth using this information when making decisions on further transport development in Budapest. This paper presents original research on the economic effects of the M4 transport project. It determines the factors that increase or de-crease the economic effects of the stations. As has been shown, several stations have failed to generate additional economic value. This in-formation is highly useful for the planning of future transport infrastructure projects.
2 Attila Béres – György Jablonszky – Tamás Laposa – Györgyi Nyikos
Regional Statistics, Vol. 9. No. 2. 2019 Online first Béres et al.: 1–17; DOI: 10.15196/RS090202
Introduction
The cohesion policy of the European Union strengthens economic, social, and terri-torial cohesion within the Union, and aims to reduce regional disparities. Realistic regional convergence also requires the elimination of obstacles such as the devel-opment level of basic transport infrastructure. This objective is frequently fulfilled through the development of urban public transport systems and facilities (Guzik et al. 2017, Bodnár–Csomós 2018, Konecka-Szydłowska et al. 2018).
In addition to their undoubted effects on mobility (Varga et al. 2016, Kiss–Szalkai 2018), these interventions can alter the spatial distribution of urban property values. Studies suggest that economic impacts can vary significantly depending on the type of interventions, the locations and geographical areas served, pre-existing market conditions, and other policy and planning factors. The impact of urban in-frastructural developments has been studied in other countries with special attention paid to underground projects. Research on sustainability and market value has re-ceived considerable attention in recent years, which has led to a rapidly evolving body of research. The literature presents several methodologies from the domain of spatial econometrics for the measurement of real estate values (Ibeasa et al. 2012).
In 2014, a new metro line was opened in Budapest. The project was co-financed by European development funds. The new line is seen as a milestone for the Hun-garian capital; however, its economic impacts have not been investigated in detail. This paper addresses this research gap and expands the scientific discourse of spatial econometrics and cohesion policy by examining the impact of the new metro on real estate prices. The new metro line also intended to steer the surface, non-line infrastructure public transport traffic underground1. Increasing accessibility of re-mote parts of the city and decreasing the pollution from urban transport are particu-larly important aspects in the sustainable development of Budapest. This paper presents a method to monetise these effects by measuring the change in real estate prices.
Conceptual background
The efficiency of public spending has always been an important issue, and in the current economic and financial climate, the questions of what and how the scarce resources available are used, and the impact of this spending are of particular signif-icance. The issues of whether the use of public funds is justified, which areas require development, and where the best result can be ensured (value for money principle) (Nyikos 2011, 2013) are extremely important. Greater welfare can be achieved by increasing the gross domestic product (GDP) components and increasing state or
1 See the official website of Metro4 (http://www.metro4.hu/en/what-will-metro4-be-like)

Spatial econometrics: transport infrastructure development and real estate values in Budapest
3
Regional Statistics, Vol. 9. No. 2. 2019 Online first Béres et al.: 1–17; DOI: 10.15196/RS090202
corporate capital is one type of investment intervention in infrastructure. The objec-tive of the cohesion policy is to enhance regional economic performance (Nyikos 2013, p. 164), particularly with respect to GDP, employment, productivity, invest-ments, and the foreign trade equilibrium. Within the policy framework, significant amounts of public funds are utilised to support the necessary infrastructure and to stimulate private investment, which could significantly speed up the convergence process. Realistic convergence requires the elimination of growth obstacles such as the development level of basic infrastructure and the need to increase mobility. Thus, one of the efficient channels of the medium- and long-term sustainable im-pacts of EU cohesion policy is the funding of broadly interpreted public infrastruc-tural investments (Nyikos 2013). The European Union’s structural and cohesion funds play a major role in the funding of Hungarian economic agents (Egri–Kőszegi 2018).
The effect of infrastructure investment could be multidirectional and, in several cases, controversial (Horkay et al. 2006). Transportation infrastructure is known to affect the value of real estate property due to changes in accessibility. The impact of transportation facilities is also highly localised, and the capitalisation of accessibility may lead to spillover effects (Dorantes et al. 2011).
Public mass transit systems can alter the spatial distribution of urban property values. The magnitude of this effect is likely to be highly parcel-specific, and chang-es in real estate values may occur both prior to and after a transit system’s construc-tion. In the US, access to the transit system and the implementation schedule of metro line construction were found to be significant determinants of parcel transac-tion prices (Lerman et al. 1978). In other cases, the literature on the impact of trans-it on land values reports mixed results concerning the economic benefits of accessi-bility to subway stations, specifically in the context of commercial properties (Kim–Zhan 2005). A Korean study suggests the discrimination impact of transit on land values by location, in a built-up urban area as a possible explanation for the mixed results. A Scandinavian study argues that the distance to the city centre and the proximity of metro stations constitute two of the factors that significantly affect the market price of dwellings. This means that the positive and negative effects of the recently constructed metro line have capitalised the market value of property in the vicinity and in feeder transport areas (Laakso 1992). A Spanish case study indicated that better accessibility to MetroSur stations (Madrid) had a positive impact on real estate values, and that this effect was marked in cases in which a house was put up for sale. The results also revealed the presence of submarkets, well defined by geo-graphic boundaries and transport fares, which implied that the economic benefits differed across municipalities (Dorantes et al. 2011). The results of a Portuguese study (Martínez–Viegas 2009) and a Polish study (Bazyl 2009) also suggest that the proximity to one or two metro lines leads to significant changes in property values.

4 Attila Béres – György Jablonszky – Tamás Laposa – Györgyi Nyikos
Regional Statistics, Vol. 9. No. 2. 2019 Online first Béres et al.: 1–17; DOI: 10.15196/RS090202
However, an important factor is that, as in the case of the Jubilee Line Extension and the Madrid MetroSur, positive economic benefits occurred most frequently around the stations where enforceable land use plans and complementary policies has already been in place to increase urban densities and encourage mixed land uses, alongside restricted car access and good pedestrian access to stations (Mejia-Dorantes–Lucas 2014).
The literature presents several methodologies for the measurement of real estate values. Hedonic multiple linear regression models, spatial autoregressive hedonic models, spatial autoregressive hedonic in the error term models and spatial Durbin hedonic models are used to estimate housing price variations in metropolitan areas as a result of changing environmental and accessibility conditions (Ibeasa et al. 2012).
Research suggests that economic impacts can vary significantly depending on the type of interventions, the locations and geographical areas served, pre-existing mar-ket conditions, and other policy and planning factors. However, another issue for evaluation is the extent to which the different studies that are available are compa-rable in terms of their methodologies, which makes the synthesis of research find-ings across different case studies extremely difficult (Mejia-Dorantes–Lucas 2014).
The relationship between sustainability and market value has also received con-siderable attention. Most studies that investigate the relationship between sustaina-bility and value have been categorised into the following themes to allow critical analysis and examine the applicability of the theory or research for valuation prac-tice:
‒ discussion and analysis of stakeholders’ perceptions and sentiments; ‒ normative studies that suggest the relationship ‘should’ be present; ‒ case studies used to demonstrate normative theory; and ‒ quantitative studies to quantify the effect of sustainability (Warren-
Myers 2012).
Methodology
Measuring the utility of large transport infrastructural projects is a challenge in co-hesion policy. The standard tools are cost-benefit analysis and passenger counting, however these techniques often fail to measure the real value-added of these types of projects2.
2 Statistical methods are designed to answer large sample-based research questions. Large infrastructural pro-
jects often fail to build a well-based counterfactual situation (i.e. what would have happened without the develop-ment). Our approach attempts to combine the evaluation of territorially focused infrastructure development with large sample statistical hypothesis testing and counterfactual impact evaluation.

Spatial econometrics: transport infrastructure development and real estate values in Budapest
5
Regional Statistics, Vol. 9. No. 2. 2019 Online first Béres et al.: 1–17; DOI: 10.15196/RS090202
The main challenge is to construct a solid counterfactual analysis exploring what would have happened if there were a lack of investment. Our idea was to borrow a widely used technique of counterfactual impact evaluation from human develop-ment and SME development evaluations. This method (Khandker et. al. 2010) was combined with Lucas’ (1988) concept of measuring the utility increase using the change in property prices. According to this research methodology, useful public infrastructural developments have a positive effect on the value of nearby proper-ties. It is reasonable to assume that easier access to downtown areas can be a value-added, but the increased traffic, crowds, or noise may outweigh these positive im-pacts. To explore the economic impacts of the M4 project, this research uses the following methodological steps.
The research database has been provided by the National Tax and Customs Administration. The initial dataset contained the location data of properties sold in the capital. These data were used to estimate one of the research variables: the dis-tance of dwellings from the metro stations. However, two difficulties arose. First, due to data protection requirements, the records of the dataset included ZIP codes, city, and street names without house numbers. Second, the addresses were provided in a semi-structured format (free text fields) that contained many abbreviations and typos to be unified in some degree. In the absence of house numbers, it was neces-sary to apply a simplification to ensure adequate granularity. To manage these, a list of ZIP codes and unique addresses was created, excluding undefinable cases. To address the second challenge, street midpoints were used for distance measure-ment. For addresses concerning more than one ZIP code, ZIP code level midpoints were calculated to improve accuracy. This approach may result in some inaccuracies; it has been assumed that such approximations can fit the purpose of the research3. To obtain accurate distance measurement, it was necessary to convert addresses to geo-coordinates. The list of street midpoints was used for geocoding via the HERE Geocoder API using a Python script. This step provided X and Y coordinates for all street midpoints to enable distance measurement. The calculation of distances was based on Euclidean distances (Jóna 2018) between stations and street midpoints4. The Haversine formula was used to provide distance variables in metres (van Brummelen 2013). Going one step further, the shortest distance between met-ro stations and street midpoints was defined.
We choose to use a double propensity score matching (for the propensity score matching technique, see Rosenbaum–Rubin 1983) technique to evaluate the utility of the M4 metro line development in Budapest through the change in property values. We created a ‘treated’ group, from sold properties close to the metro stations
3 Due to data protection measure, imposed by the National Tax Authority, we could not obtain more accurate
geopoints. 4 As we used a large sample, the possible errors have been eliminated through aggregation.

6 Attila Béres – György Jablonszky – Tamás Laposa – Györgyi Nyikos
Regional Statistics, Vol. 9. No. 2. 2019 Online first Béres et al.: 1–17; DOI: 10.15196/RS090202
(we estimated a walking distance of seven minutes from the new metro stations as the treated area, which is approximately 580 m)5, and created a ‘control’ group on which the new metro stations had no effect (more than 15 minutes’ walking distance from any of the newly built metro stations, which is approximately 1,250 m). We compared the change in the property prices before and after the investment. The main challenge here is that properties are rarely sold twice (before and after the investment); we first created pairs of properties with very similar characteristics in the treatment and control groups, sold before and after the investment. This was done using a one-to-one nearest neighbour propensity score matching.
To find the average treatment effect on the treatment group, we analysed the re-sults of three models:
1. a one-to one nearest neighbour matching without the per square metre start-ing property prices;
2. kernel matching with the per square metre starting property prices; 3. kernel matching without the per square metre starting property prices.
Discussion
The new subway line in Budapest
The newest M4 metro line in Budapest has been on the political agenda since 1990. However, the plans are even older; the majority of them were created in the 1970s. There were extensive discussions as to whether the metro line would fit either into the structure of the existing Budapest public transportation network or into the reasona-ble future development scenarios. The aim of the M4 project was to establish a metro line with modern, automated, air-conditioned trains that run even every 1.5 minutes, with modern, airy, and less draughty stations where passengers can wait for the new metro trains on uniquely built platforms. The investment has to facilitate the recon-struction of the surroundings of every station and change the life of Budapest (DBR Metró Projekt Igazgatóság 2018). Metro 4 is a relatively short line (7.34 km), connecting two major railway terminals with a major metro line. The overall budget of the first section included the creation of 10 stations to relieve the downtown area and connect Kelenföld with Baross Square, that is, south Buda with north Pest. The Cohesion Fund application of the project referred to this first section.
5 According to the Cohesion Policy regulation.

Spatial econometrics: transport infrastructure development and real estate values in Budapest
7
Regional Statistics, Vol. 9. No. 2. 2019 Online first Béres et al.: 1–17; DOI: 10.15196/RS090202
Table 1 Comparison of the four metro lines in Budapest
Description Millennial Under-ground Metro line
Line 2 (East-West)
Line 3 (North-South)
Line 4 (DBR)
Surface section length (km) 0 1.4 1.3 0
Line length (useful, km) 4.2 10.1 16.6 6.7
Line length (total [from terminal to terminal], km)
4.4
10.3
17.1
7.4
Number of stations 11 11 20 10
Vehicle number (cars) 23 135 252 64
Transport capacity in peak hours (capacity/hour/direction)
6,185
23,790
26,326
20,100
Highest number of passengers in peak hours (passen-gers/hour/direction)
5,170
14,755
16,710
15,700
Highest number of passengers in peak hours (passengers/abs. peak hour/direction)
5,170
15,885
17,300
16,480
Train pairs per hour running in peak hours
32.7
26.66
24.0
30.0
Daily number of trips taken (thou-sand passengers./working day)
107
425
610
421
Note: DBR – South Buda-Rákospalota. Source: DBR Metró Projekt Igazgatóság.
The overall project budget was HUF 353 billion, from which the eligible6 amount was HUF 292 billion, and Budapest requested EU financial assistance of HUF 224 billion. (DBR Metró Projekt Igazgatóság 2018). The detailed budget is presented in Figure 1.
6 According to the Cohesion Policy regulation.

8 Attila Béres – György Jablonszky – Tamás Laposa – Györgyi Nyikos
Regional Statistics, Vol. 9. No. 2. 2019 Online first Béres et al.: 1–17; DOI: 10.15196/RS090202
Figure 1 M4 construction budget (billion HUF)
Cohesion Fund Hungarian stateBudapest municipality (EIB Ioan) Budapest municipality (own contribution)
The construction of the first section of Metro 4 line eventually received HUF 180.8 billion in EU funding, which, although not the expected maximum amount, is a significant amount of financing to assist the project.
We examined the economic effects of the M4 project and the change in property prices using the following steps: The first matching was based on the location (district) and the size (in square me-tres) of the apartments. We matched property selling transactions for the ‘before investment’ period (2007–2008) with the ‘after investment’ period (2015–2015)7. The new metro line affected five districts in Budapest: V, VII, VIII, IX, and XI. We chose to set the treated area to within a radius of 580 m of the new stations and the control area as a radius of more than 1,250 m from the stations, but within the affected districts. To include a neutral area, we also set up an area between 580 m and 1,250 m of the stations; the effect of the prices was not measured in this area (see Figure 2). Along with the new stations, the undertaking of major surface level developments and restorations in some of the most deprived urban areas (e.g. Rákóczi Square and II. János Pál pápa Square) must also be noted.
7 The chosen methodology of counterfactual impact evaluation is designed to capture and eliminate the general
macroeconomic effects that affected all the real estates. The general growth in real estate prices has been excluded using the diff-in-diff methodology. See Wooldridge (2012).

Spatial econometrics: transport infrastructure development and real estate values in Budapest
9
Regional Statistics, Vol. 9. No. 2. 2019 Online first Béres et al.: 1–17; DOI: 10.15196/RS090202
Figure 2 Map of the new metro stations
We obtained 13,805 observations for the treated properties (5,222 property pric-es before and 8,583 after the M4 investment) and 13,935 observations for the con-trol properties (5,370 property prices before and 8,565 after the M4 investment). We identified 5,214 matches in the treated and 5,369 matches in the control groups.
M4 line stations M4 line 580 m ring buffer from M4 stations 1,250 m ring buffer from M4 stations Districts: V, VII, VIII, IX, XI
0 500 1,000 1,500 2,000 m

10 Attila Béres – György Jablonszky – Tamás Laposa – Györgyi Nyikos
Regional Statistics, Vol. 9. No. 2. 2019 Online first Béres et al.: 1–17; DOI: 10.15196/RS090202
Table 2 The results of the one-to-one propensity score matching
before and after the M4 investment
Variable
Treated property Control property
Coefficient (standard error)
p-value Coefficient (standard error)
p-value
Constant –0.2241 (0.0458)
0.000 –0.3763 (0.0395)
0.000
Size of the apartment (m2) –0.0019 (0.0004) 0.000
–0.0008 (0.0004) 0.044
District VII dummy 0.0170
(0.0463) 0.713 1.3197
(0.2811) 0.000
District VIII dummy 0.0264 (0.0417) 0.528 0.1581
(0.0443) 0.000
District IX dummy 0.0399 (0.0563)
0.478 0.0931 (0.0327)
0.004
District XI dummy 0.0237 (0.0425)
0.577 0.2348 (0.0340)
0.000
Table 2 shows that for the treated properties, the percentage share of the sold apartments between the different districts was very similar before and after the M4 investment, but the average size of the sold apartments increased significantly. This phenomenon is not surprising as the selection of the treated properties was based on their distance from the new metro stations before and after the invest-ment. For the control properties, both the geographical location and the size of the apartments were significantly different.

Spatial econometrics: transport infrastructure development and real estate values in Budapest
11
Regional Statistics, Vol. 9. No. 2. 2019 Online first Béres et al.: 1–17; DOI: 10.15196/RS090202
Table 3 Comparison of the before and after matching values for the treated properties
Variable
Before matching After matching
mean – before
investment(standard
error)
mean – after investment(standard
error)
p-value (Wald test)
mean – before
investment(standard
error)
mean – after investment (standard
error)
p-value (Wald test)
Size of the apartment (m2) 56.78 (0.3981)
59.46 (0.3298) 0.0000 56.57
(0.3856) 56.51
(0.3826) 0.9131
District V dummy 0.0816 (0.0038)
0.0880 (0.0031) 0.1817 0.0813
(0.0038) 0.0846
(0.0039) 0.5462
District VII dummy 0.1676 (0.0052)
0.1672 (0.0040) 0.9551 0.1676
(0.0052) 0.1669
(0.0052) 0.9164
District VIII dummy 0.3734 (0.0067)
0.3696 (0.0052) 0.6497 0.3736
(0.0067) 0.3759
(0.0067) 0.8082
District IX dummy 0.0672 (0.0035)
0.0664 (0.0027) 0.8543 0.0667
(0.0035) 0.0641
(0.0034) 0.5793
District XI dummy 0.3102 (0.0064)
0.3087 (0.0050) 0.8557 0.3107
(0.0064) 0.3086
(0.0064) 0.8158
Table 4 Comparison of the before and after matching values for the control properties
Variable
Before matching After matching
mean – before
investment(standard
error)
mean – after in-vestment(standard
error)
p-value (Wald test)
mean – before
investment(standard
error)
mean – after in-vestment (standard
error)
p-value (Wald test)
Size of the apartment (m2) 55.93 (0.3895)
57.43 (0.3119) 0.0025 55.88
(0.3869) 55.48
(0.3766) 0.4583
District V dummy 0.1423 (0.0048)
0.1794 (0.0041) 0.0000 0.1421
(0.0048) 0.1429
(0.0048) 0.9121
District VII dummy 0.0041 (0.0009)
0.0006 (0.0003) 0.0001 0.0041
(0.0009) 0.0041
(0.0009) 1.0000
District VIII dummy 0.1058 (0.0042)
0.0998 (0.0032) 0.2619 0.1058
(0.0042) 0.1039
(0.0042) 0.7528
District IX dummy 0.4196 (0.0067)
0.4427 (0.0054) 0.0071 0.4196
(0.0067) 0.4215
(0.0067) 0.8450
District XI dummy 0.3283 (0.0064)
0.2774 (0.0048) 0.0000 0.3284
(0.0064) 0.3276
(0.0064) 0.9345
The initial significant differences between the before and after M4 investment property characteristics disappeared after the matching.
12 Attila Béres – György Jablonszky – Tamás Laposa – Györgyi Nyikos
Regional Statistics, Vol. 9. No. 2. 2019 Online first Béres et al.: 1–17; DOI: 10.15196/RS090202
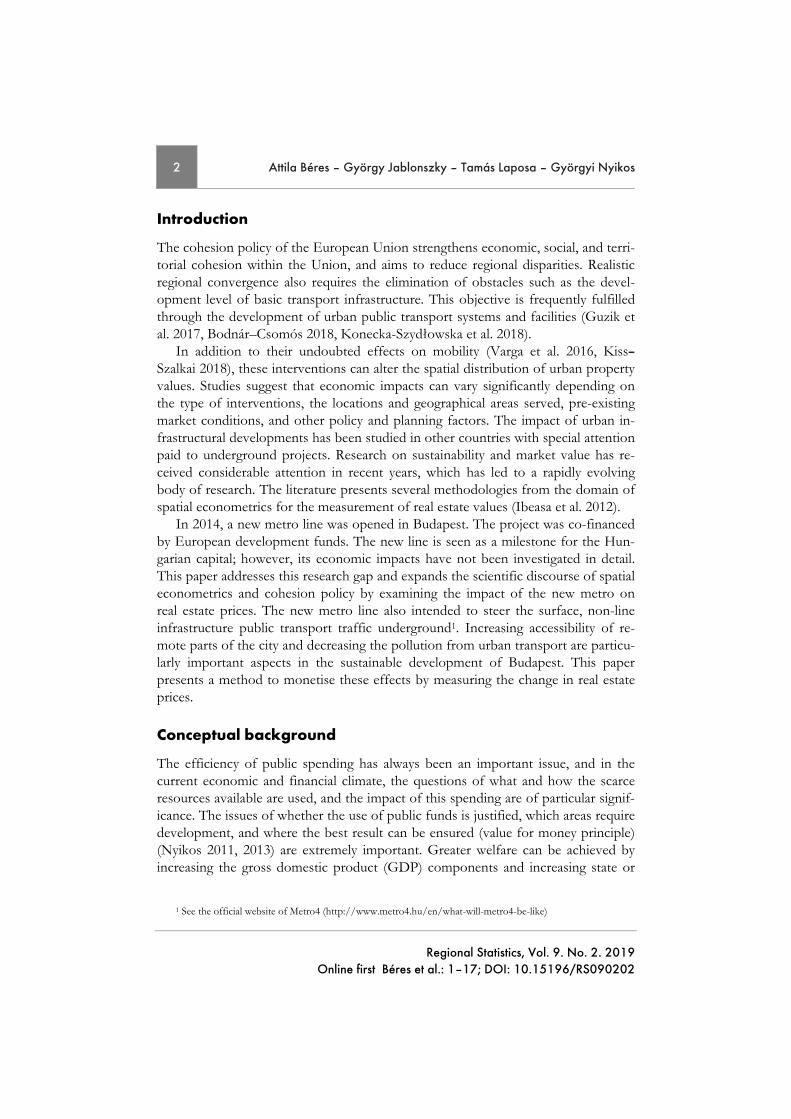
We took the pairs of the sold properties before and after the M4 investment and obtained second propensity scores using three different models. In the models, the treatment variable was always the distance from the new stations (1 if within 580 m and 0 if more than 1,250 m but within the affected districts).
Table 5 Models of the secondary propensity score matching
Model 1 Nearest neighbor matching with
the covariates
Model 2 Kernel matching
with the covariates
Model 3 Kernel matching
with the covariates
apartment size (m2) district VII dummy district VIII dummy district IX dummy district XI dummy
apartment size (m2) the before investment per m2
property prices district VII dummy district VIII dummy district IX dummy district XI dummy
apartment size (m2) district VII dummy district VIII dummy district IX dummy district XI dummy
The treatment effect was measured in the change of the per square meter prop-erty prices before and after the M4 investment (results of the three measurement scenarios are shown in Tables 6–8).
Table 6 Model 1 – The effects of the M4 metro stations on property prices: per square
meter price growth of the properties near the new metro stations and the controls, 2007–2014 *
Effect/Metro station
Properties near the stations
Controls DifferenceStandard
error t-statisticNumber of obser-vations
Number of treated properties
in HUF Overall effect 45,931 –7,250 53,182** 53,182 2.20 10,583 5,125 Kelenföld 179,199 –16,133 195,333*** 63,859 3.06 3,385 301 Bikás Park 105,911 –12,364 118,276* 65,997 1.79 2,180 420 Újbuda-Centre 88,622 –35,798 124,421*** 27,145 4.58 3,854 770 Móricz Zsigmond Square
75,009 –12,926
87,935*** 23,172 3.79
3,741
656
Szent Gellért Square 108,016 46,215 61,801* 33,682 1.83 4,910 121 Fővám Square 75,425 30,051 45,374* 25,265 1.80 6,040 671 Kálvin Square 60,593 25,145 35,447* 19,724 1.80 6,290 921 Rákóczi Square –1,790 –22,275 20,485 20,504 1.00 6,727 1,355 II. János Pál pápa Square
–2,300 –25,123
22,823 20,761 1.10
6,704
1,332
Keleti Railway Station
18,618 32,725
–14,107 109,834 –0.13
4,524
854
Note: * p < 0.1, ** p < 0.05, *** p < 0.01. * As described in the Tables 6–8, the three models differ in the number of covariates and the corresponding
methods.

Spatial econometrics: transport infrastructure development and real estate values in Budapest
13
Regional Statistics, Vol. 9. No. 2. 2019 Online first Béres et al.: 1–17; DOI: 10.15196/RS090202
Table 7 Model 2 – The effects of the M4 metro stations on property prices: per square
meter price growth of the properties near the new metro stations and the controls, 2007–2014
Effect/Metro station
Properties near the stations
Controls Difference Standard error t-statistic
Number of observa-
tions
Number of treated properties
in HUF
Overall effect 45,296 51,813 –6,517 8,502 –0.77 10,583 5,139 Kelenföld 179,199 132,966 46,233*** 9,073 5.10 3,385 301 Bikás Park 105,472 120,028 –14,555* 8,448 –1.72 2,180 421 Újbuda-Centre 88,622 98,984 –10,362 6,940 –1.49 3,854 770 Móricz Zsigmond Square
75,009 91,676
–16,667** 7,218 –2.31
3,741
656
Szent Gellért Square 108,016 81,297 26,719 21,752 1.23 4,910 121 Fővám Square 75,635 11,506 64,129*** 14,464 4.43 6,040 670 Kálvin Square 61,014 48,719 12,294 10,174 1.21 6,290 920 Rákóczi Square –225 25,086 –25,311*** 8,395 –3.01 6,357 1,296 II. János Pál pápa Square
–2,290
22,179
–24,469*** 8,593 –2.85
6,704
1,329
Keleti Railway Station
12,254
17,132
–4,878 32,926 –0.15
4,524
737
Note: * p < 0.1, ** p < 0.05, *** p < 0.01.
Table 8 Model 3 – The effects of the M4 metro stations on property prices: per square
meter price growth of the properties near the new metro stations and the controls, 2007–2014
Effect/Metro station
Properties near the stations
Controls Difference Standard error t-statistic
Number of observa-
tions
Number of treated
properties in HUF
Overall effect 46,089 35,356 10,732 13,028 0.82 10,583 5,119 Kelenföld 179,199 64,928 114,271*** 8,135 14.05 3,385 301 Bikás Park 105,911 72,717 33,914*** 7,333 4.53 2,180 420 Újbuda-Centre 88,622 62,606 26,016*** 6,968 3.73 3,854 770 Móricz Zsigmond Square
75,009 62,040
12,968* 7,259 1.79
3,741
656
Szent Gellért Square
108,016 59,080 48,936** 22,249 2.20 4,910 121
Fővám Square 75,715 43,429 32,285** 14,620 2.21 6,040 670 Kálvin Square 61,014 41,750 19,263 11,853 1.63 6,290 920 Rákóczi Square –1,533 20,919 –22,452 16,123 –1.39 6,727 1,308 II. János Pál pápa Square
–2,350 18,907
–21,257 16,148 –1.32
6,704
1,316
Keleti Railway Station
12,254 17,132
–4,878 32,926 –0.15
4,524
737
Note: * p < 0.1, ** p < 0.05, *** p < 0.01.

14 Attila Béres – György Jablonszky – Tamás Laposa – Györgyi Nyikos
Regional Statistics, Vol. 9. No. 2. 2019 Online first Béres et al.: 1–17; DOI: 10.15196/RS090202
In Model 1, the growth difference of the treated and control property prices was significant overall. After analysing the effects of the individual metro stations, we found that the stations on the Buda side had more significant positive effects on property prices than on the Pest side. The effect of three stations were significant (at least 5%):
‒ Kelenföld – this station is the Buda side terminus of the M4 metro line with direct connection to the Hungarian Railways. This station seems to have the most value-added as it connects the surrounding area to Budapest downtown.
‒ Újbuda-Központ and Móricz Zsigmond Square are still on the Buda side of the metro line with relatively good surface connections; these are the termi-nuses of the largest tramlines.
We found no significant effects of the stations on the Pest side. In Model 2, we controlled for the before investment apartment prices and used a
kernel matching method. The effect of the M4 investment on the overall price changes was not significant, but we identified two significantly positive and three significantly negative effects:
‒ Kelenföld has already been mentioned; Fővám Square is the first M4 station on the Pest side of the town.
‒ For Móricz Zsigmond Square, we found significantly negative effects, proba-bly due to the special composition of the sold apartments. The apartments here are larger than the average size (around 64 m2 instead of 55 m2), and the price of these apartments in the control area increased dramatically. Rákóczi Square and II. János Pál pápa Square are two of the most deprived areas of Budapest, and even the new metro stations do not seem to have outweighed the negative processes.
We believe Model 3, where we applied the kernel matching method without us-ing the starting apartment prices, is the most reliable. In this model, we found less significant effects when moving from the Buda to the Pest side of the city, which has better links with the Budapest underground network (especially the M2 and M3 lines).
Our results reveal that the new stations have significant positive effects on hous-ing prices in the areas that had not been connected to existing metro lines (especially in the Buda area).
Although it may bring benefits, quantifying and assessing a relationship between sustainability and market value is somewhat more difficult. Sustainability presents a rapidly changing dynamic that has varying, complex assessment criteria (Warren-Myers 2012). Accordingly, to assess a relationship between sustainability and market value of property, there is a need for extensive analysis of unbiased, evidence-based research in individual and broader markets to provide guidance, evidence, and knowledge of the implications of sustainability in the valuation of real estate.

Spatial econometrics: transport infrastructure development and real estate values in Budapest
15
Regional Statistics, Vol. 9. No. 2. 2019 Online first Béres et al.: 1–17; DOI: 10.15196/RS090202
Conclusion
Useful public infrastructural developments have a positive effect on the value of nearby properties. It is reasonable to assume that easier access to downtown areas can be an added value, but the increased traffic, crowds, or noise may outweigh these positive impacts. Economic impacts can vary significantly depending on the type of interventions, the locations and geographical areas served, pre-existing mar-ket conditions, and other policy and planning factors. Increased economic effects are possible; we integrated development projects where the transport development initiative is linked to housing or other real estate development projects.
When examining the nearby properties at the M4 metro line stations in Budapest, we have found mixed results for the property prices. The new stations exert a positive effect only in those areas that were not connected directly to existing underground lines (especially in the southern Buda area). Our results support the arguments that the new stations on the Pest side of the city are too close to each other and to the existing and functioning transport network, so their additional value is questionable.
Even though the results provide valuable information for planning forthcoming transport infrastructure in Budapest, there is room for developing this analysis fur-ther. For example, using walking distances instead of ‘as the crow flies’ distance; using more sophisticated data regarding the quality of the apartments; or further examination of other, especially private development processes, besides the metro investment can provide more detailed findings.
REFERENCES
BAZYL, M. (2009): Hedonic price model for Warsaw housing mark Warsaw School of Economics Institute of Econometrics Department of Applied Econometrics Working Paper No. 8-09, Warsaw.
BODNÁR, B.–CSOMÓS, G. (2018): Possible Impacts of the Intermodal Community Center for Transport on the Development of Debrecen Területi Statisztika 58 (5): 505–538. https://doi.org/10.15196/TS580504
VAN BRUMMELEN, G. R. (2013): Heavenly Mathematics: The Forgotten Art of Spherical Trigonometry Princeton University Press, Priceton.
DORANTES, L.–PAEZ, A.–VASSALLO, J. (2011): Analysis of House Prices to Assess Econom-ic Impacts of New Public Transport Infrastructure Madrid Metro Line 12 Trans-portation Research Record: Journal of the Transportation Research Board 2245 (1): 131–139. https://doi.org/10.3141/2245-16
EGRY, Z.–KÖSZEGI, I. R. (2018): The Spatial Structure of Central and Eastern Europe by the Social and Economic Features Területi Statisztika 58 (1): 27–56. https://doi.org/10.15196/TS580102

16 Attila Béres – György Jablonszky – Tamás Laposa – Györgyi Nyikos
Regional Statistics, Vol. 9. No. 2. 2019 Online first Béres et al.: 1–17; DOI: 10.15196/RS090202
GUZIK, R.–KOŁO, A.–GWOSDZ, K. (2017): Interconnections in public transport as a method for delimiting urban functional areas and the settlement hierarchy in Poland Regional Statistics 7 (1): 63–77. https://doi.org/10.15196/RS07104
HORKAY, N–NYIKOS, G.–PÉTI, M. (2006): Territorial development and planning in micro-regions In: NÉMETH, J. (eds.): Kistérségi tervezési módszertan pp. 119–146., Macken-sen Kft., Budapest.
IBEASA, Á.–CORDERAA, R.–DELL’OLIOA, L–COPPOLAB, P.–DOMINGUEZA, A. (2012): Mod-elling transport and real-estate values interactions in urban systems Journal of Transport Geography 24: 370–382. https://doi.org/10.1016/j.jtrangeo.2012.04.012
JÓNA, G. (2018): Measurement of Complex Spatial Performance of the Economic Networks Területi Statisztika 58 (4): 380–398. https://doi.org/10.15196/TS580403
KHANDKER, S. R.–KOOLWAL, G. B.–SAMAD, H. A. (2010): Handbook on Impact Evaluation: Quantitative Methods and Practices World Bank, Washington.
KIM, J.–ZHAN, M. (2005): Determining Transit’s Impact on Seoul Commercial Land Values: An Application of Spatial Econometrics International Real Estate Review 8 (1): 1–26
KISS, J. P.–SZALKAI, G. (2018): Mobility Characteristics of Commuting Based on the Mobili-ty Data of the Latest Censuses Területi Statisztika 58 (2): 177–199. https://doi.org/10.15196/TS580203
KONECKA-SZYDŁOWSKA, B.–TRÓCSÁNYI, A.–PIRISI, G. (2018): Urbanisation in a formal way? The different characteristics of the ‘newest towns’ in Poland and Hungary Regional Statistics 8 (2): 135–153. https://doi.org/10.15196/RS080202
LAAKSO, S. (1992): Public transport investment and residential property values in Helsinki Scandinavian Housing and Planning Research 9 (4): 217–229.
https://doi.org/10.1080/02815739208730308 LERMAN, S. R.–DAMM, D.–LERNER-LAMM, E.–YOUNG, J. (1978): The effect of the Washington
metro on urban property values CTS-77-18 Final Rpt., UMTA-MA-11-0004-79-1 Na-tional Technical Information Service, Washington, D.C.
LUCAS, R. E. (1988): On the Mechanics of Economic Development Journal of Monetary Economics 22 (1): 3–42. https://doi.org/10.1016/0304-3932(88)90168-7
MARTÍNEZ, L.–VIEGAS, J. (2009): Effects of Transportation Accessibility on Residential Property Values Hedonic Price Model in the Lisbon, Portugal, Metropolitan Area Transportation Research Record: Journal of the Transportation Research Board 2115 (1): 127–137. https://doi.org/10.3141/2115-16
MEJIA-DORANTES, L.–LUCAS, K. (2014): Public transport investment and local regeneration: A comparison of London's Jubilee Line Extension and the Madrid Metrosur Transport Policy 35: 241–252. https://doi.org/10.1016/j.tranpol.2014.05.020
NYIKOS, G. (2013): The Impact of Public Funded Developments, with Special regard to EU Cohesion Policy Public Finance Quarterly, Journal of public finance 2013/2: 165–185.
NYIKOS, G. (2011): Territorial planning and territorial aspects in the development policy Falu Város Régió 18 (2): 35–41.
ROSENBAUM, P. R.–RUBIN, D. B. (1983): The central role of the propensity score in observa-tional studies for causal effects Biometrika 70 (1): 41–55.
https://doi.org/10.2307/2335942

Spatial econometrics: transport infrastructure development and real estate values in Budapest
17
Regional Statistics, Vol. 9. No. 2. 2019 Online first Béres et al.: 1–17; DOI: 10.15196/RS090202
VARGA, L.–TÓTH, G.–NÉDA, Z. (2016): An improved radiation model and its applicability for understanding commuting patterns in Hungary Regional Statistics 6 (2): 27–38. https://doi.org/10.15196/RS06202
WARREN-MYERS, G. (2012): The value of sustainability in real estate: a review from a valua-tion perspective Journal of Property Investment & Finance 30 (2): 115–144. https://doi.org/10.1108/14635781211206887
WOOLDRIDGE, J. M. (2012): Introductory Econometrics: A Modern Approach Fifth Edition, South-Western Cengage Learning, Boston.