Embed Size (px)
Citation preview

REAL ESTATE MARKET OVERVIEW SPAIN 2016
www.cohispania.com
RETAIL | OFFICE | HOSPITALITY | INDUSTRIAL | RESIDENTIAL | LAND

1
Content
0.1 ECONOMIC CLIMATE ................................................................................................................... 2
0.2 INVESTMENT KEY FACTS ............................................................................................................. 3
0.3 KEY INVESTORS & PLAYERS ....................................................................................................... 6
0.4 TRENDS BY SECTORS ................................................................................................................... 8
RETAIL ........................................................................................................................................................................ 9
OFFICE ...................................................................................................................................................................... 11
HOSPITALITY ........................................................................................................................................................... 13
INDUSTRIAL ............................................................................................................................................................ 15
RESIDENTIAL & LAND .......................................................................................................................................... 17
0.5 OUTLOOK .................................................................................................................................... 20
2
01
Economic Indicators 2013 2014 2015 2016
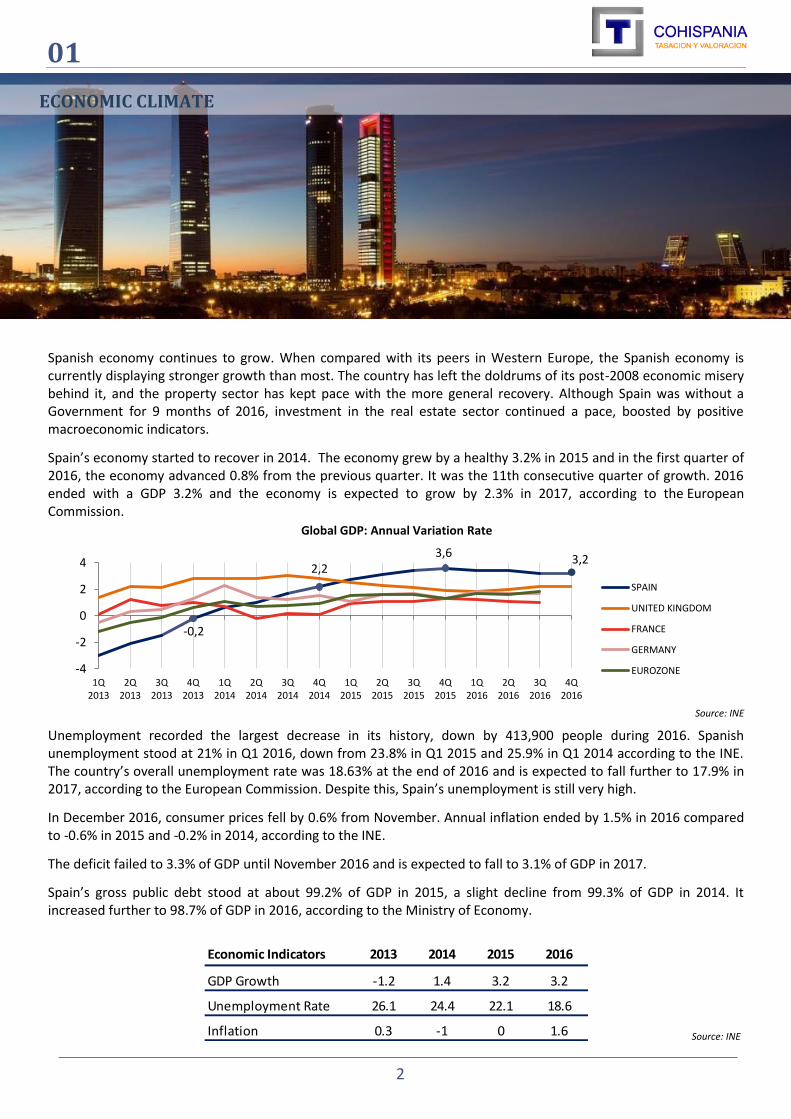
GDP Growth -1.2 1.4 3.2 3.2
Unemployment Rate 26.1 24.4 22.1 18.6
Inflation 0.3 -1 0 1.6
Spanish economy continues to grow. When compared with its peers in Western Europe, the Spanish economy is currently displaying stronger growth than most. The country has left the doldrums of its post-2008 economic misery behind it, and the property sector has kept pace with the more general recovery. Although Spain was without a Government for 9 months of 2016, investment in the real estate sector continued a pace, boosted by positive macroeconomic indicators.
Spain’s economy started to recover in 2014. The economy grew by a healthy 3.2% in 2015 and in the first quarter of 2016, the economy advanced 0.8% from the previous quarter. It was the 11th consecutive quarter of growth. 2016 ended with a GDP 3.2% and the economy is expected to grow by 2.3% in 2017, according to the European Commission.
Unemployment recorded the largest decrease in its history, down by 413,900 people during 2016. Spanish unemployment stood at 21% in Q1 2016, down from 23.8% in Q1 2015 and 25.9% in Q1 2014 according to the INE. The country’s overall unemployment rate was 18.63% at the end of 2016 and is expected to fall further to 17.9% in 2017, according to the European Commission. Despite this, Spain’s unemployment is still very high.
In December 2016, consumer prices fell by 0.6% from November. Annual inflation ended by 1.5% in 2016 compared to -0.6% in 2015 and -0.2% in 2014, according to the INE.
The deficit failed to 3.3% of GDP until November 2016 and is expected to fall to 3.1% of GDP in 2017.
Spain’s gross public debt stood at about 99.2% of GDP in 2015, a slight decline from 99.3% of GDP in 2014. It increased further to 98.7% of GDP in 2016, according to the Ministry of Economy.
-0,2
2,2 3,6
3,2
-4
-2
0
2
4
1Q2013
2Q2013
3Q2013
4Q2013
1Q2014
2Q2014
3Q2014
4Q2014
1Q2015
2Q2015
3Q2015
4Q2015
1Q2016
2Q2016
3Q2016
4Q2016
Global GDP: Annual Variation Rate
SPAIN
UNITED KINGDOM
FRANCE
GERMANY
EUROZONE
Source: INE
ECONOMIC CLIMATE
Source: INE
3
02
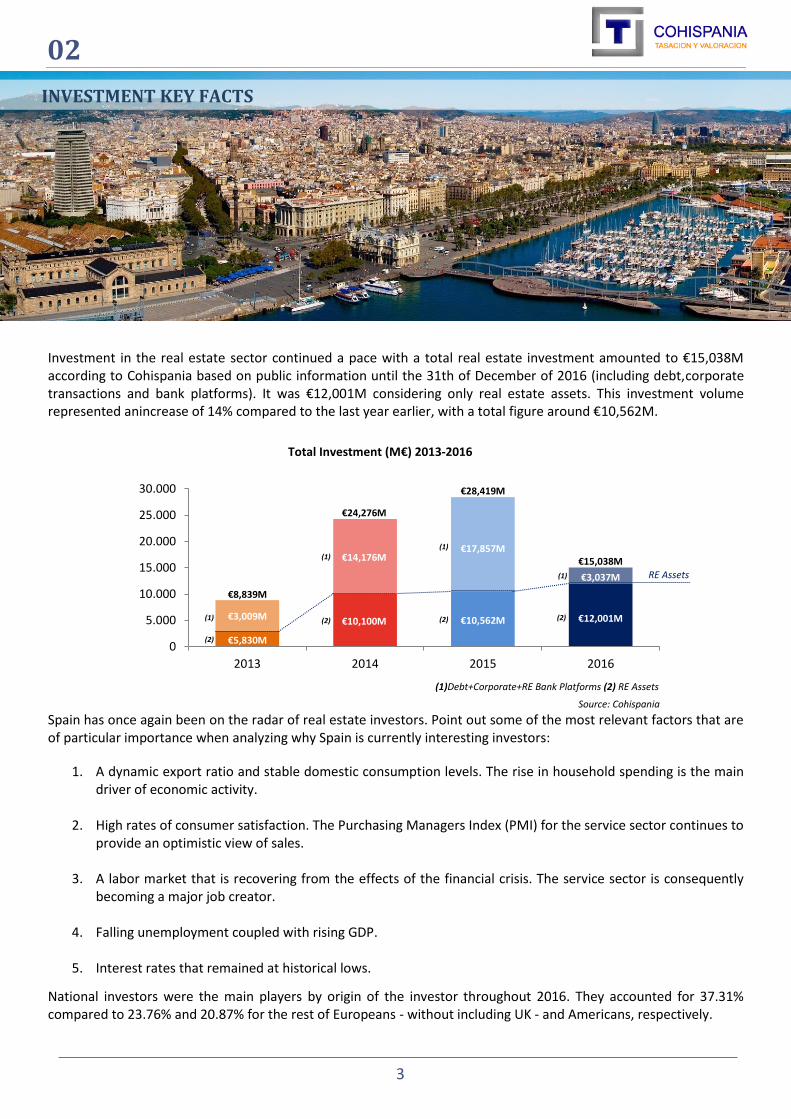
Investment in the real estate sector continued a pace with a total real estate investment amounted to €15,038M according to Cohispania based on public information until the 31th of December of 2016 (including debt,corporate transactions and bank platforms). It was €12,001M considering only real estate assets. This investment volume represented anincrease of 14% compared to the last year earlier, with a total figure around €10,562M.
Spain has once again been on the radar of real estate investors. Point out some of the most relevant factors that are of particular importance when analyzing why Spain is currently interesting investors:
1. A dynamic export ratio and stable domestic consumption levels. The rise in household spending is the main driver of economic activity.
2. High rates of consumer satisfaction. The Purchasing Managers Index (PMI) for the service sector continues to provide an optimistic view of sales.
3. A labor market that is recovering from the effects of the financial crisis. The service sector is consequently becoming a major job creator.
4. Falling unemployment coupled with rising GDP.
5. Interest rates that remained at historical lows.
National investors were the main players by origin of the investor throughout 2016. They accounted for 37.31% compared to 23.76% and 20.87% for the rest of Europeans - without including UK - and Americans, respectively.
0
5.000
10.000
15.000
20.000
25.000
30.000
2013 2014 2015 2016
Total Investment (M€) 2013-2016
RE Assets
Source: Cohispania
(1)Debt+Corporate+RE Bank Platforms (2) RE Assets
(2)
(2) (2) (2) (1)
(1)
(1)
(1)
€8,839M
€3,009M
€5,830M
€10,100M
€14,176M
€24,276M
€10,562M
€17,857M
€28,419M
€15,038M
€3,037M
€12,001M
INVESTMENT KEY FACTS
4
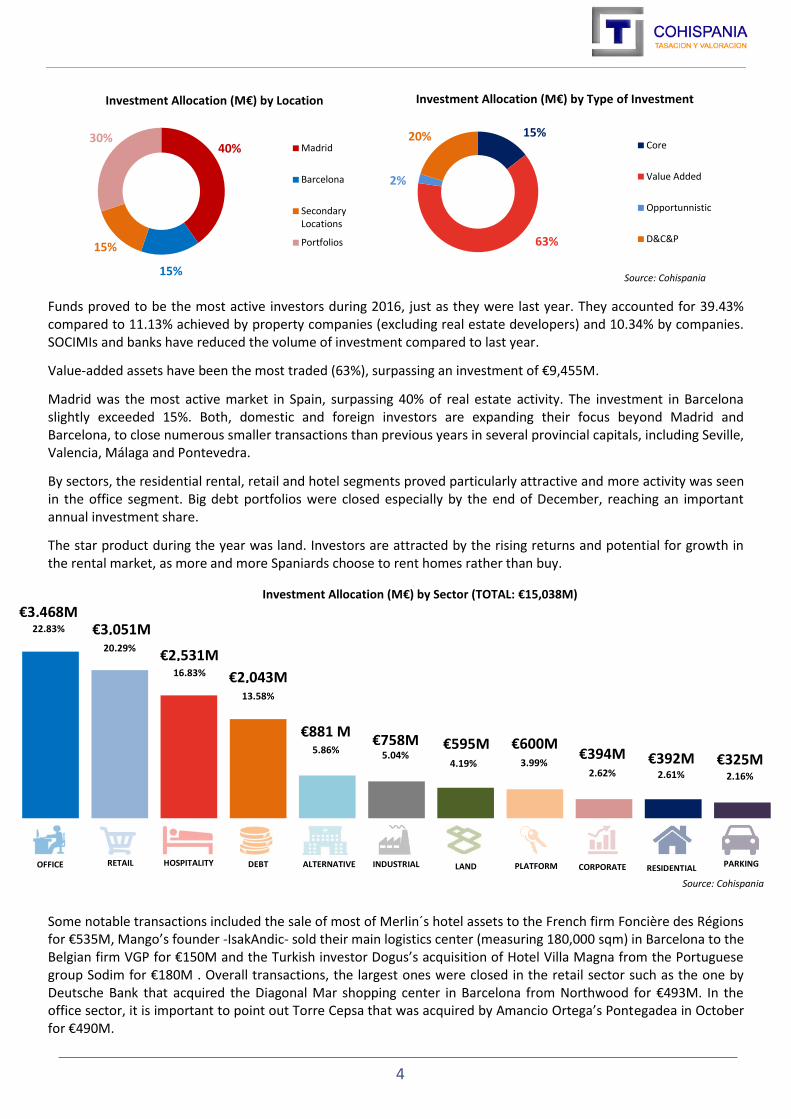
Investment Allocation (M€) by Sector (TOTAL: €15,038M)
15%
63%
2%
20%
Investment Allocation (M€) by Type of Investment
Core
Value Added
Opportunnistic
D&C&P
Funds proved to be the most active investors during 2016, just as they were last year. They accounted for 39.43% compared to 11.13% achieved by property companies (excluding real estate developers) and 10.34% by companies. SOCIMIs and banks have reduced the volume of investment compared to last year.
Value-added assets have been the most traded (63%), surpassing an investment of €9,455M.
Madrid was the most active market in Spain, surpassing 40% of real estate activity. The investment in Barcelona slightly exceeded 15%. Both, domestic and foreign investors are expanding their focus beyond Madrid and Barcelona, to close numerous smaller transactions than previous years in several provincial capitals, including Seville, Valencia, Málaga and Pontevedra.
By sectors, the residential rental, retail and hotel segments proved particularly attractive and more activity was seen in the office segment. Big debt portfolios were closed especially by the end of December, reaching an important annual investment share.
The star product during the year was land. Investors are attracted by the rising returns and potential for growth in the rental market, as more and more Spaniards choose to rent homes rather than buy.
Some notable transactions included the sale of most of Merlin´s hotel assets to the French firm Foncière des Régions for €535M, Mango’s founder -IsakAndic- sold their main logistics center (measuring 180,000 sqm) in Barcelona to the Belgian firm VGP for €150M and the Turkish investor Dogus’s acquisition of Hotel Villa Magna from the Portuguese group Sodim for €180M . Overall transactions, the largest ones were closed in the retail sector such as the one by Deutsche Bank that acquired the Diagonal Mar shopping center in Barcelona from Northwood for €493M. In the office sector, it is important to point out Torre Cepsa that was acquired by Amancio Ortega’s Pontegadea in October for €490M.
40%
15%
15%
30%
Investment Allocation (M€) by Location
Madrid
Barcelona
SecondaryLocations
Portfolios
Source: Cohispania
€3,468M €3,051M
€2,043M
€881 M €758M €595M €600M
€392M
€2,531M
€394M
PARKING RETAIL HOSPITALITY CORPORATE INDUSTRIAL DEBT RESIDENTIAL ALTERNATIVE PLATFORM LAND
20.29%
13.58%
5.86% 5.04% 4.19% 3.99%
2.61%
16.83%
2.62%
OFFICE
22.83%
2.16%
€325M
Source: Cohispania

5
According to land, as a good example there is the residential property developer Vía Célere that snapped up two attractive plots of land in Madrid for €19M (11,230 sqm) and €29.15M (14,859 sqm), where construction will begin shortly.
SAREB and the banks were extremely busy (especially in December) as they continued their balance sheet clean up. SAREB sold one NPL portfolio, secured by residential assets (€573M), to Goldman Sachs (Project Eloise), in its largest transaction to date; as well as two portfolios to Deutsche Bank (Projects Sevilla and Marina, amounting to €80M each). Also during the month, Caixa Bank sold a €700M debt and foreclosed hotel portfolio to Apollo (Project Sun); and Banco Sabadell completed the sale of two NPL portfolios: one (€950M) secured by loans to property developers, which it sold to Oaktree (Project Normandía) and another (€364M) containing debt relating to 60 developments and hotels, which it sold to Bain (Project Traveler).
In any case, the star operation of the year was Merlin’s merger with Metrovacesa, saw the creation of country’s largest real estate company, with assets worth more than €9,000M.
In terms of new remarkable, iconic and strategic developments, the focus is in the north of Madrid.
On the one hand there is the future Torre Caleido that will be develop by Inmobiliaria Espacio (GrupoVillar Mir) and will add 70,000 sqm of real estate space in the area of Cuatro Torres complex. As such, there will be five skyscrapers at the top of the Paseo de la Castellana from 2019, which means that Madrid’s skyline will change once again. In total, the five towers will supply around 300,000 sqm of space to companies. The new IE University campus will occupy 48,000 sqm of Torre Caleido.
On the other hand there is Distrito Castellana Norte (DCN) project commonly known as Operación Chamartín. The Town Hall has taken the decision to reject this project under development. It was in May when the Town Hall of Madrid published revised plans for the development of the land around Chamartín train station. The new plans cut the number of homes to be constructed by 75%, a proposal that the property developer DCN (driven by BBVA and Grupo San José) is currently appealing.
MADRID
Torre Cepsa
Pontegadea
€490M
BARCELONA SECONDARY LOCATIONS
Ciudad Adequa
MerlinProperties
€380M
Edificio España
Baraka GI
€272MM
C.C. Nassica
Neinver / TIAA
€140M
C.C. Diagonal Mar
Deutsche Asset Management
€493M
C.C. La Maquinista
Euro Cervantes
€201M
C.L. Mango
VGP
€150MM
Hotel Silken Diagonal
BensonElliot
€80M
C.C. Gran Via de Vigo
LarEspaña
€141M
C.C. L ´Aljub
TPG Capital / Partners Group
€110M
C.C. Luz del Tajo
CBRE GI
€107MM
Hospital Infanta Luisa
CVC Capital Partners
€100M
6
03
Key Players
SOCIMIs (Spanish REITs)
The SOCIMIs were less active in terms of purchases during 2016, but the largest four (Merlin, Hispania, Lar and Axiare) were more profitable than ever. The latest available results (as at Q3 2016) were as follows: Merlin generated a net profit of €255M during the 9 months to September 2016, driven by a 64.6% increase in revenues; Hispania multiplied its net profit by 11 to €136.7M, generated from its real estate assets, which have a gross value of €1,684M; Axiare’s net profit rose by 145% to €91.3M, thanks to its €1,000 M asset portfolio, which comprises offices (68%), logistics (19%) and retail assets (13%); and Lar España saw its profits soar by 77% to €47M, driven mainly by its booming shopping center portfolio.
Moreover, 17 SOCIMIs debuted on the MAB during the year, including Vbare, which specialises in the residential rental market, taking the total number of listed real estate companies to 28. (See Appendix about SOCIMIs)
SAREB (Company for the Management of Assets proceeding from Restructuring of the Spanish Banking System)
In March, SAREB was forced to convert €2,400M of its subordinated debt into capital to cover the losses it had incurred in 2015. Those losses were the direct result of the requirement to recognise additional provisions following the bad bank’s mandatory implementation of the Bank of Spain’s new accounting circular. However, in December, the Ministry of Finance softened its demands on the entity chaired by Jaime Echegoyen, which should give it some much needed breathing room. On the update, SAREB managed to put its first finished homes up for sale in October; it also completed the sale of its largest NPL portfolio to date.
Banking sector
The banks continued to clean up their balance sheets during 2016 and sales of secured assets with a face value of €12 Billion were recorded. Banco Sabadell (€2.9 Billion), La Caixa (€2.2 Billion), Bankia (€1.8 Billion) and SAREB (€1.6 Billion) were the most active entities. The following portfolio sales were completed: Normandy, Carlit, Baracoa, Far (which also included an unsecured component), Sun, Traveller, Fenix, Tizona, Eloise, Empire, Pirene, Ocean, Lane, Patriot, Sevilla, Marina, Madrid Buildings (…) In total, 34 portfolios were sold in the secured space in 2016.
The most active portfolio investors during the year were: Oaktree, Bain Capital, Goldman, Blackstone, Apollo and Deutsche.
KEY INVESTORS & PLAYERS

7
25%
15%
1% 9%
25%
1% 2%
1%
4% 5%
12%
2%
10%
5%
7%
39%
1%
1%
9%
11%
10%
5%
Investment Allocation (M€) by Type of Investor - Seller
Banks
Corporate
Developer
Family Offices
Funds
Hotel Chains
Insurance Companies
Joint Venture
Property Companies
SOCIMIs
Undisclosed
37%
6% 24%
21%
5%
5%
2% 5%
Investment Allocation (M€) by Country
Spain
UK
Others
USA
Germany
Canada
Middle
Australia
Latam
Undisclosed
Key Investors
National investors were the main players by origin of the investor throughout 2016. They accounted for 37.31% compared to 23.76% and 20.87% for the rest of Europeans - without include UK - and Americans, respectively.
Funds proved to be the most active investors during 2016, just as they were last year. They accounted for 39.43% compared to 11.13% achieved by property companies (excluding real estate developers) and 10.34% by companies. SOCIMIs and banks have reduced the volume of investment compared to last year.
.
40%
47%
64%
2% 97%
17%
17% 25%
1%
17%
27% 3%
Source: Cohispania
INVESTOR
SELLER
Source: Cohispania

8
04
Trends by Sectors
Real Estate investment reached €15,038M in 2016, a figure according to Cohispania on the basis of public and open information until 31 December 2016.
The retail and office sectors were the most popular last year, making a total of €3,467M and €3,051M respectively and reaching both more than 40% of assets investment.
Parking sector takes only 2.16% of the investment, however it has increases it share compared with the previous years.
€M % €M % €M % €M %
Retail 2.795,00 31,62% 3.586,60 14,77% 2.978,78 10,48% 3.051,01 20,29%
Office 1.532,80 17,34% 2.634,44 10,85% 2.664,71 9,38% 3.467,60 23,06%
Hospitality 672,95 7,61% 1.175,92 4,84% 2.012,21 7,08% 2.531,18 16,83%
Residential 710,20 8,03% 1.154,03 4,75% 1115,77 3,93% 392,40 2,61%
Land 15,60 0,18% 1.014,20 4,18% 1064,47 3,75% 594,93 3,96%
Industrial 104,00 1,18% 487,77 2,01% 725,64 2,55% 758,45 5,04%
Alternative 0,00 0,00% 0,00 0,00% 0,00 0,00% 880,80 5,86%
Parking 0,00 0,00% 47,20 0,19% 0,00 0,00% 325,00 2,16%
Subtotal 5.830,55 65,96% 10.100,16 41,61% 10.561,58 37,16% 12.001,37 79,81%
Debt 2.120,50 23,99% 12.930,88 53,27% 8.759,97 30,82% 2.042,70 13,58%
Corporate 0,00 0,00% 0,00 0,00% 9.097,16 32,01% 394,00 2,62%
RE Platform 888,00 10,05% 1.245,00 5,13% 0,00 0,00% 600,00 3,99%
Subtotal 3.008,50 34,04% 14.175,88 58,39% 17.857,13 62,84% 3.036,70 20,19%
TOTAL 8.839,05 100,00% 24.276,04 100,00% 28.418,71 100,00% 15.038,07 100,00%
2013 2014 2015 2016
32%
17%8%
8%1%
24%
10%
Retail
Office
Hospitality
Residential
Land
Industrial
Alternative
Parking
Debt
Corporate
RE Platform
15%
11%
5%
5%4%
2%53%
5% 10%
9%
7%4%
4%3%31%
32% 20%
23%
17%3%
4%
5%6%
2%
13%
3%4%
66%34%
RE Assets
D&C&P
42%58% 37%63% 80%20%
Source: Cohispania

9
RETAIL
Key Facts
Retail sales are showing solid growth, evidence of the economic recovery mentioned before. In the immediate term at least, Spanish consumers have more money at their disposal, and this is a benefit for the entire retail sector. Positive employment conditions, easy access to capital, low inflation and weak interest rates all serve to stimulate the country’s substantial domestic demand. These extremely beneficial conditions give investors all the more reason to invest in every retail sector.
In any case, real estate investment in the retail sector - which includes shopping centers, retail parks and high street premises - decreased by almost a30% during the first half of the year, as a result of the shortage of products in the market. Despite the decrease in investment during the first half of the year, the full year closed roughly in line with 2015 (€2,979M), with an investment close to€3,051M.
In High Street segment, 2016 was a great year, doubling the investment figure of 2014. All High Street operations recorded more than €944M, a volume similar to last year (€1,078M). The activity continued to be intense and it is expected that next year it will end in a similar way.
Shopping Centers activity in 2016 was better than forecasted. It was expected to end the year with a total investment of €2,000M, as it was awarded the sale of more than 30 shopping centers for €2,100M.
In terms of demand, new and existing operators in the fashion and restaurants sectors are a particularly noticeable grouping. Some new international investors and buyers, predominantly from Europe and America, have already zeroed in on the Spanish retail market as they believe it offers great potential for their flagship stores situated in core locations. However, the space available for these outlets is limited, particularly at top locations in major cities such as Madrid and Barcelona.
As a result, stiff competition has broken out between the various competitors, which of course results in falling yields. Demand continues to grow for second-tier assets in good regional locations, and for high-quality assets in secondary markets with a rising risk factor. Consequently, the gap between primary and secondary assets’ yields is shrinking further as investors turn their attention more to non-core properties at promising locations.
In terms of rents in Madrid for high street premises, Preciados is the most expensive street, with rents of 255€/sqm/month, following an increase of more than 6%. It is followed by Serrano (240€/sqm/month and an increase of almost a 7%) and Gran Vía (230€/sqm/month, up by 4.5%).
In Barcelona, Paseo de Gracia recorded an increase around a 12% reaching 240€/sqm/month, although Portal del Ángel in Barcelona was crowned the most expensive street in Spain after rents there increased by almost a 8.5% to 260€/sqm/month.
In the case of shopping centers, rentals reached an average price of 90€/sqm/month and forecasts show that they will increase at an average annual rate of around a 2%.
During this period, new shopping center openings are expected to double after hitting a minimum of 343,000 sqm between 2013 and 2015.
ABC Serrano Eroski Portfolio Diagonal Mar S.C. La Maquinista S.C.

10
Project highlights this year include: Parque Nevada (Granada), Sambil Outlet Madrid and Fan Mallorca Shopping. Between now and 2018, the following centers are also expected to open: Plaza Río; Open Sky Center; Viladecans The Style Outlets; Torre Village; Palmas Altas and Torrecárdenas.
Investment Focus
Opportunistic funds that invested between 2012 and 2014 were busy divesting in 2016, having reached their target returns much sooner than expected. Overseas institutional investors, which have a much lower cost of capital, are now taking over the reins, now that the yield offered by shopping centers in the rest of Europe is lower than in Spain, despite the fact that the evolution of the consumer environment is less favorable than in our country.
In any case, SOCIMIs were the major players, with Merlin and Lar leading the charge. They accounted for almost 20% of the total investment with €607M. Especially for big SOCIMIs, shopping centers and retail parks have great potential due to sales that are increasing along with consumption. That means that shopping centers are managing to achieve much higher rent increases than offices, which have not ended up experiencing the improvements that were expected at the beginning of the recovery in 2013.
There are increasingly more players interested in developing new centers from scratch. International property developers are expected to enter the market, especially from France, to actively seek out land.National SOCIMIs have also started to develop, such as the retail park that Lar has announced that it will construct in Sagunto.
For the time being, there are several operators familiar with the format of retail parks, such as Leroy Merlin, which expects to open 25 new stores between now and 2020; Ikea, with new formats such as the new delivery point in Navarra; Media Markt, Sprinter and supermarkets such as Lidl and Aldi, as well as the entry into retail parks of less typical brands, such as H&M, C&A and Mustang. This is proof of the consolidation of the retail park segment.
Overall transactions of the year, the largest ones were closed in the retail sector. Deutsche Bank acquired the Diagonal Mar shopping center in Barcelona from Northwood for €493M in August; Eroski sold a portfolio of shopping centers to the US firm Invesco for €358M in March and a portfolio of hypermarkets to Carrefour for €205M in June; TH Real Estate sold the Aljub shopping center in Elche (Alicante), along with several other assets, to Partners Group and TPG Capital for €250M; TH Real Estate then teamed up with Neinver to buy the Nassica shopping center in Getafe (Madrid) from KKR for €140M. Finally, the ABC Serrano shopping center and the store on Preciados street in Madrid also changed hands, as the SOCIMIZ ambal sold both assets to CBRE GI for €138M.
Most Relevant Transactions
25.42% 260.00
90.00 90.00
275.00 3.50
4.25 4.25
3.50
Source: Cohispania % of Retail transactions over the total investment amount
11
Key Facts
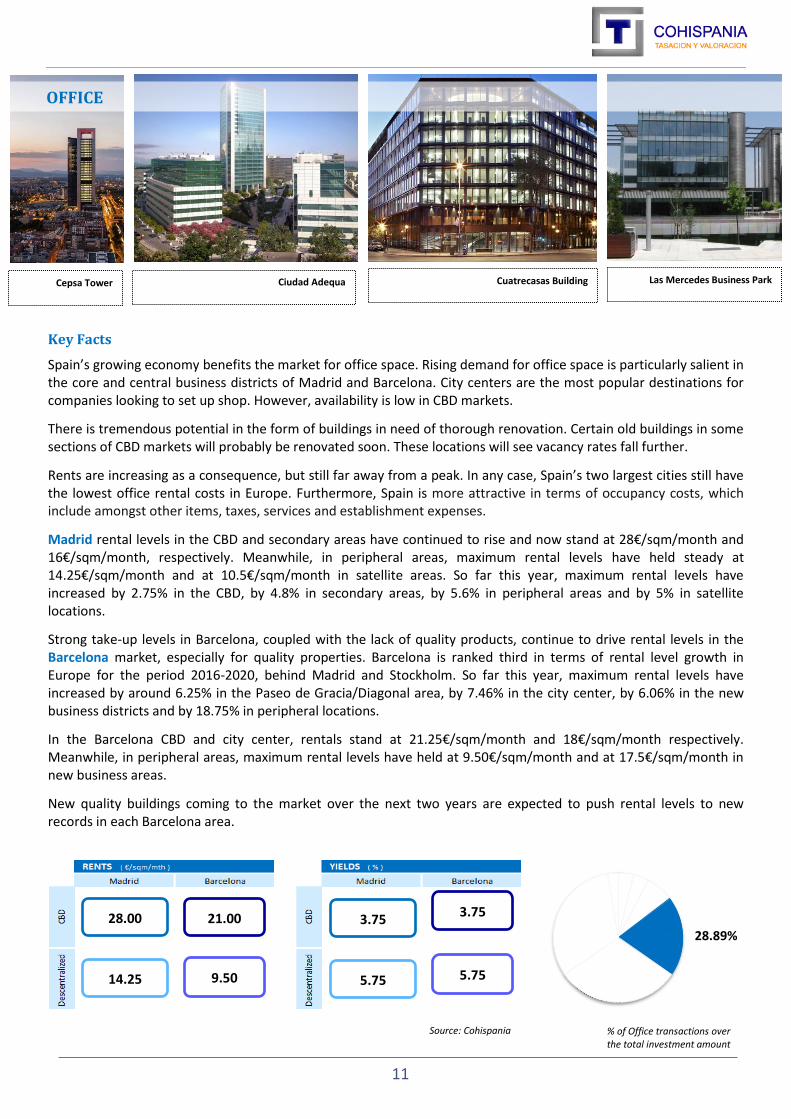
Spain’s growing economy benefits the market for office space. Rising demand for office space is particularly salient in the core and central business districts of Madrid and Barcelona. City centers are the most popular destinations for companies looking to set up shop. However, availability is low in CBD markets.
There is tremendous potential in the form of buildings in need of thorough renovation. Certain old buildings in some sections of CBD markets will probably be renovated soon. These locations will see vacancy rates fall further.
Rents are increasing as a consequence, but still far away from a peak. In any case, Spain’s two largest cities still have the lowest office rental costs in Europe. Furthermore, Spain is more attractive in terms of occupancy costs, which include amongst other items, taxes, services and establishment expenses.
Madrid rental levels in the CBD and secondary areas have continued to rise and now stand at 28€/sqm/month and 16€/sqm/month, respectively. Meanwhile, in peripheral areas, maximum rental levels have held steady at 14.25€/sqm/month and at 10.5€/sqm/month in satellite areas. So far this year, maximum rental levels have increased by 2.75% in the CBD, by 4.8% in secondary areas, by 5.6% in peripheral areas and by 5% in satellite locations.
Strong take-up levels in Barcelona, coupled with the lack of quality products, continue to drive rental levels in the Barcelona market, especially for quality properties. Barcelona is ranked third in terms of rental level growth in Europe for the period 2016-2020, behind Madrid and Stockholm. So far this year, maximum rental levels have increased by around 6.25% in the Paseo de Gracia/Diagonal area, by 7.46% in the city center, by 6.06% in the new business districts and by 18.75% in peripheral locations.
In the Barcelona CBD and city center, rentals stand at 21.25€/sqm/month and 18€/sqm/month respectively. Meanwhile, in peripheral areas, maximum rental levels have held at 9.50€/sqm/month and at 17.5€/sqm/month in new business areas.
New quality buildings coming to the market over the next two years are expected to push rental levels to new records in each Barcelona area.
28.00
14.25 9.50
21.00 3.75
5.75 5.75
3.75
Source: Cohispania
28.89%
OFFICE
Cepsa Tower Ciudad Adequa Cuatrecasas Building Las Mercedes Business Park
% of Office transactions over the total investment amount

12
Investment Focus
According to the investment market, total invested volume in office sector reached the figure of €3.468M. Specifically, the volume of investment in offices in Madrid amounted to €2.981M during 2016, which represented a 35% increase compared to last year (€2,200M). Meanwhile, investment in Barcelona was €216M which decreased by 26% to €272M.
Prime yields are holding steady in Madrid 4%, whereas they have fallen 25 basis points to 4.25% in Barcelona. These yields are higher than those offered in other cities, such as Paris.
It is important to highlight that SOCIMIs, which represented a 23% and 19% of total investment volumes in 2014 and 2015, cut back their investment activity significantly during 2016. SOCIMIs have focused more on managing their acquired assets. By contrast, one of the most active players during 2016 was Axiare that invested in 4 buildings and one office project.
While domestic companies still dominate the market today, foreign investors are gaining in prominence, and they are currently trying to stimulate competition to actively undercut yields from core real estate in Madrid and Barcelona. The limited potential of these high-demand sites is forcing some investors to put their money to work in other market subsections and second-tier cities, where they have higher yield expectations.
Specifically, international funds generated more than 27% of the volume of investment in the office market that compared to 19% invested in 2015, shows its interest for investing. Most of those transactions were on value added assets due to obtain more benefits.
To mention some relevant transactions in the office sector, Amancio Ortega acquired Torre Cepsa in October for €490M; Merlin acquired the Adequa business park in the north of Madrid from Lone Star for €380M.
Most Relevant Transactions

13
HOSPITALITY
Key Facts
Spanish tourism sector has been on the path of the record for some years and 2016 has been no exception. Pending the final annual figures, Spain reached a record number of 74 M tourists, 8.8% more than in 2015.These figures are spectacular thanks, on the one hand, to the structural conditions of a competitive sector and, on the other hand, to conjunctural circumstances such as the instability in part of the destinations that are the natural competitors of our country.
There are certain risks, such as the excessive concentration of the demand on specific countries (68% of the tourists come from only five countries) and destinations (five communities account 83% of travelers).This concentration exposes Spanish tourism sector to the reality of these five countries, as it is happening now with British people and Brexit. The outcome is still unknown, but if it ends up affecting their purchasing power, it will be a factor to be considered and analyzed. In addition, Spain is still a holiday destination -linked to sun and beach- that is concentrated in five seasonals months.
In 2017 it will be interesting to study the global environment and how it affects the conditions of our country, paying special attention not only to Brexit but also the evolution of the United States with the new President Trump and its effect on geopolitical balances. It is also important to observe the evolution of an oil barrel price, that has been at really low prices favoring airlines with very attractive rates and this may not continue.
Key figures
Spain’s hotel industry is one of the most profitable in the world. Proof of this comes from the double digit increases in RevPar (revenue per available room) seen during the first nine months of 2016 in the main Spanish capitals, with the exception of Barcelona (+8.9%) and Marbella (+8.2%), which are already well established markets.
During the first nine months of 2016, the RevPar of Spain’s hotels increased by 13.4% to reach €82.21, driven by an increase in the ADR (average daily rate), which rose by 8.5% to €109.38, and by a rise in occupancy rates, which grew by 4.5% with respect to the same period last year – a record high of 75.7%.
Behind these significant increases there is the strong behaviour of groups in the vacation and MICE (meetings, incentives, conferences and events) sectors.
It is important to point out the recovery of Madrid. In terms of its average occupancy rate, Madrid has managed to surpass the magic number of 70% in 2016 and now has an average occupancy of 70.4%, up by 3.4% compared to last year, which means that establishments in the city can now play around more with prices. Not surprisingly, the ADR in Madrid has increased by 7.1% to €97.29 and the RevPar has also increased by 10.7% to €69.46.
In this way, the capital is recovering as a city break destination, with figures returning to their pre-crisis levels, above all in the case of low-end and mid-range hotels, which, together with the luxury segment, are seeing the most activity. In 2015, Madrid surpassed Barcelona as the primary urban destination for hotel investment. As a result, demand has increased whilst supply has remained almost stable, which has benefitted those properties already in operation.
Pullman Skipper Barcelona Silken Diagonal Villamagna Merlin Hotel Portfolio

14
The two island groups (the Balearic and Canary Islands), which have seen RevPar increases of between 15% and 17% are benefitting from higher demand (diverted from competing destinations currently suffering from political instability) and from the recovery in domestic tourism, together with the low price of oil, which is boosting transport.
Investment Focus
With tourist activity at record highs and no signs of a slowdown in sight, the purchase of hotel buildings has become a cushy deal for investors.
Following a historical record in 2015, when operations were closed amounting to €2,012M, this year transactions were signed amounting to €2,531M, according to Cohispania based on public information until 31 of December. To calculate these figures, Cohispania includes the sale and purchase of hotels that already exist, as well as of buildings that are acquired for conversion into hotels. However, it does not include land to develop hotels and amounts relating to possible renovations performed at each establishment or for each project.
Several major operations have sustained the pace of investment. Just before the end of 2016, Merlin Properties sold off its hotel portfolio, transferring it to the fund Froncière des Règions for €535M. The sale of the hotel Villa Magna de Madrid by Sodim SGPS to Dogus Group for €180M represented a new national record in the price paid per room (€1.2 M per room, compared to €800,000 per room in the case of the Ritz in 2015, which had held the record since then).
Other large transactions included the sale by AXA Investment Managers of the Pullman Barcelona Skipper Hotel to Shaftesbury for €93M; and the purchase of the historical headquarters of Caja Madrid by KKH Capital Group and Perella Weinberg RE for €80M, which it will convert into a luxury hotel.
In total, investors purchased 93 hotel assets in Spain in 2016, in addition to the 75 hotels that they bought during the record year of 2015. Madrid led the ranking as the main location for investment, accounting for 17% of the total volume with €421M. It was followed by Barcelona with €255M (10%), despite the hotel moratorium declared by Ada Colau’s Town Hall, and Canarias (8.33%), Málaga (4.55%) and Baleares (2.66%).
In terms of investors, during 2015 the major stars of the hotel investment segment by far were the SOCIMIs, but they have been replaced by investment funds, which have become the major players in the hotel investment market, accounting for 36.8% of total volumes.
The investment funds that have accounted for most of the transaction volume have been: the mentionedFoncière des Régions, with 19 hotels and a total investment volume of €535 M; HI Partners, which has purchased eight assets for €200M; KKH Capital Partners, which together with Perella Weinberg RE, bought the Celenque building for €80 M; and Internos Global Investors, which purchased Hotel Innside Madrid Suecia for €45 M.
It is expected that the hotel investment market will continue to be active in 2017 and investment volumes will remain similar to those seen in 2016, thanks to interest from international investors. The requirement for owners to continuing to reduce the debt on their balance sheets, the strengthening of the strategy by national hotel chains to sell off properties and continue to operationally manage establishments, and the strong outlook for the tourist sector in general place the Spanish hotel market in the investor spotlight.
Most Relevant Transactions
15
INDUSTRIAL
Key Facts
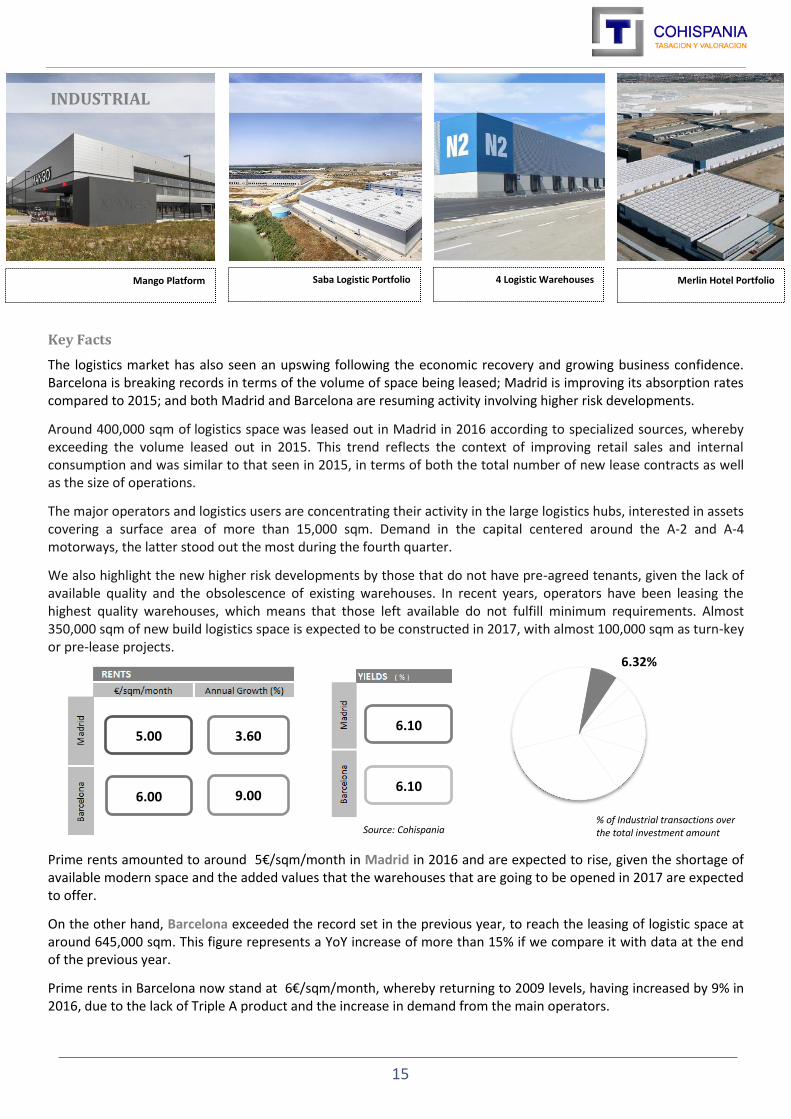
The logistics market has also seen an upswing following the economic recovery and growing business confidence. Barcelona is breaking records in terms of the volume of space being leased; Madrid is improving its absorption rates compared to 2015; and both Madrid and Barcelona are resuming activity involving higher risk developments.
Around 400,000 sqm of logistics space was leased out in Madrid in 2016 according to specialized sources, whereby exceeding the volume leased out in 2015. This trend reflects the context of improving retail sales and internal consumption and was similar to that seen in 2015, in terms of both the total number of new lease contracts as well as the size of operations.
The major operators and logistics users are concentrating their activity in the large logistics hubs, interested in assets covering a surface area of more than 15,000 sqm. Demand in the capital centered around the A-2 and A-4 motorways, the latter stood out the most during the fourth quarter.
We also highlight the new higher risk developments by those that do not have pre-agreed tenants, given the lack of available quality and the obsolescence of existing warehouses. In recent years, operators have been leasing the highest quality warehouses, which means that those left available do not fulfill minimum requirements. Almost 350,000 sqm of new build logistics space is expected to be constructed in 2017, with almost 100,000 sqm as turn-key or pre-lease projects.
Prime rents amounted to around 5€/sqm/month in Madrid in 2016 and are expected to rise, given the shortage of available modern space and the added values that the warehouses that are going to be opened in 2017 are expected to offer.
On the other hand, Barcelona exceeded the record set in the previous year, to reach the leasing of logistic space at around 645,000 sqm. This figure represents a YoY increase of more than 15% if we compare it with data at the end of the previous year.
Prime rents in Barcelona now stand at 6€/sqm/month, whereby returning to 2009 levels, having increased by 9% in 2016, due to the lack of Triple A product and the increase in demand from the main operators.
5.00
6.00 9.00
3.60 6.10
6.10
6.32%
Source: Cohispania
Mango Platform Saba Logistic Portfolio 4 Logistic Warehouses Merlin Hotel Portfolio
% of Industrial transactions over the total investment amount

16
The cumulative total of space leased in Barcelona was concentrated in the regions of Baix Penedés and Alt Penedés.
The main operations included for example the new logistics center that Amazon plans to inaugurate at the end of 2017 in El Prat de Llobregat, which will have a surface area of more than 63,000 sqm. It also includes Mango’s leasing of space in Lliçà covering a surface area of 119,000 sqm.
But not only is Madrid and Barcelona but also secondary locations such as Aragón. So far during this legislature, the Government of Aragón has sold 500,000 sqm of land for logistics activities. The sector accounts for 5.5% of the region’s GDP. The Logistics Platform in Zaragoza is the largest in Spain and the fifth-largest in Europe.
The Government of Aragón has launched a new strategy based on the creation of a new single brand “Aragón Logística”, involving the harmonization of the supply of land from the various logistics platforms, which already account for 38% of Spain’s logistics space. It is also looking to consolidate Aragón’s relationships with all of its potential partners in the sector, which has resulted in improvements in the relationships with Cataluña, Navarra and Valencia.
Moreover Comunidad Valenciana has seen relevant transactions of industrial use plots to develop turnkey projects. Mercadona acquired a plot of almost 400,000 sqm in Parc Sagunt what has an special meaning, not only as a new business initiative but also because it is the first push to be the first logistic hub in Valencia.
Investment Focus
In terms of invested volume it reached €758M, slightly higher than past 2015 (€726M), according to our figures. Clear out that from €594M invested in land transactions, more than 14% were invested in logistic or industrial use plots as Merlin Properties bought in Cabanillas (Madrid) almost 40.000 sqm to develop a turnkey project of warehouses.
Barcelona recorded an investment volume of €154M mainly due to the acquisition of the Mango logistic platform that the Belgian company VGP bought for €150M. Madrid was in second position in terms of volume investment but with higher volume of transactions than Barcelona. In the capital, as in 2015, mainly in the area of the A-2 was where most of the transactions were concentrated for an amount of €98M. Among the most relevant transactions, highlight the acquisition of 121,000 sqm by Axiare in the Henares Corridor of a project for the construction of two logisticwarehouses and a LEED certified platform for €43M.
The most important investment deals were the Saba logistic portfolio bought by Merlin Properties for €115M and also the acquisition of the logistic portfolio of 23 logistic and cross docking platforms owned by Zaphir Logistic Properties to the joint venture formed by Neinver and Colony Logistics by €87M relocated all around Spain.
Joint ventures played a good role during 2016, but the main investors in this sector were the SOCIMIs that will continue to invest in this sector, as demonstrated during last year with an investment of more than 30% of the total invested in logistic assets reaching almost €228M.
Most Relevant Transactions

17
Prices
House prices accelerated slightly during the third quarter of the year, but the differences between the two speeds in the market widened. In fact, only Madrid, Cataluña and the Balearic Islands saw higher than average price rises; house prices in the other fourteen autonomous regions grew by below average.
Specifically, house prices rose by 4% during the third quarter of the year, with respect to the same period last year, according to data published in December 2016 by Spain’s National Institute of Statistics (INE), based on signed house deed figures provided by the General Council of Notaries. As such, the indicator recorded ten consecutive quarters of increases, a trend that will be maintained over the next few months, according to experts.
In the context of the overall recovery in the real estate market –which began in the second quarter of 2014 after six years of decreases -new house prices are rising at a rate of 7.3%, more than double the rate of second-hand home price increases (3.5%). That is because the supply of new homes in certain areas is now scarce, which is driving prices up.
As mentioned, the data also showed that the recovery in the housing sector is happening at two speeds, driven primarily by the large urban centers and tourist housing segments. By autonomous region, Madrid led the price increases, with a rise of 7.8%, the same figure as last quarter. In second place, Cataluña accelerated its growth rate by 1.1 points, to reach 6.6%, whilst the Balearic Islands was ranked in third place, with an increase of 5.4%, four tenths higher than in Q2.
These three autonomous regions are the only ones that saw house price rises above the national average and they have one thing in common: they are all keeping their foot on the accelerator and some are even increasing the pressure. As such, the gap is widening between the recovery in the housing sector in the most sought-after areas and in other zones where stock is more abundant and demographic pressure is lower.
In summary, we are seeing quite generalized growth, in the sense that prices are rising in 16 regions and twelve of them have accelerated their rates with respect to the previous quarter.
This data shows that house prices are continuing on their upwards trajectory but there is still a long way to go. Different market sources agree thathouse prices will grow driven by the improvement in the economy and employment, but also by the pseudo boom that is happening in the rental sector, in particular in large cities.
Serrano 53 Ros Casares Complex Paseig de Gracia 81 BMB Residential Portfolio
2,827
3,318 2,170
2,350
1,816 1,874
5.50
5.90
6.10
269
377
272
3.96%
Source: Cohispania
2.61%
% of Residential & Land transactions over the total investment amount
RESIDENCIAL & LAND
RESIDENTIAL & LAND

18
Rental Market
The large group of potential buyers, such as young people aged between 25 and 35 years old, are unable to buy a home because of their low wages and because of the precariousness associated with the majority of the new jobs that are being created. Since those people are not buying, many are choosing to rent, which has caused demand in the rental market to soar, along with rental prices.
If no response is given to this insolvent demand, rental prices will continue to rise and that will, in turn, drive up the prices of homes up for sale.
The rental market in Spain now accounts for 15.6% (of the total housing stock), a ratio not seen since 1987, according to the latest data from the Bank of Spain. By contrast, the percentage of owned homes has decreased to 77.3%, a figure not seen since 1988.
The real estate market itself is not oblivious to this trend and for this reason, a wave of SOCIMIs are getting reach to focus on the rental housing sector. The average yield on rental properties in large cities stands at around 6% at the moment.
For the time being, Fidere and Optimum III are the only residential SOCIMIs that are actually up and running. Imminent debuts are expected from Alquiler Seguro, with its SOCIMI Quid Pro Quo, which will have 625 units in its first phase, and Domo Activos Socimi, the cooperative manager, with its portfolio of 1,400 units. The Valencian group Inveriplus, the US fund Blackstone -with Albinara Properties, Pegarena and Tourmalet- and Testa Residencial, with 4,700 homes, are also expected to enter the market.
Sales: Second Hand & New Homes
Most recent data concerning housing sales is from November 2016. House sales rose by 17.3% in November 2016 compared to the same month in 2015, to reach 33,806 operations, according to data published on Thursday by Spain’s National Institute for Statistics (INE). In the absence of INE’s last month data, real estate market experts predict that 2016 will end up surpassing 400,000 housing sales.
This increase, which represents the tenth month of consecutive YoY increases, exceeds the rise recorded in October 2016, when those operations rose by 6.5% YoY.
Transactions in November involving second-hand homes rose by 19.8% with respect to November 2015, to reach 27,996 operations, whilst sales of new homes rose by 6.8% YoY to reach 5,810 transactions.
Andalucía was the region that saw the most absolute house sales during the eleventh month of the year, with 6,541 sales, followed by Cataluña (5,476), the Community of Valencia (5,216) and Madrid (4,563). The autonomous regions that saw the lowest absolute number of house sales were La Rioja (233), Navarra (363) and Cantabria (440).
Housing Permits
The latest figures published by the Ministry of Development reveal that in November last year 5,934 building permits were granted for housing purposes, the highest figuregure in the eleventh month of the year since 2010 and 25% more than in the same month last year. At the same time, the cumulative annual total stood at over 59,000, representing an increase of 32.5% compared to the equivalent period in 2015 and the highest eleven-month total for ve years.
These figures must be taken as encouraging, as they are 72% higher than those of three years ago, and of course they indicate that the existing stock of unsold homes is insufcient to cater for demand. However, the scale of the boom-and-bust cycle which swept the construction sector away in Spain is illustrated by the fact that in 2006 permission was given for over 860,000 new homes to be built, including 126,000 in September alone: in other words, the current level of construction activity is running at around 7.3% of where it was a decade ago.
Investment Focus
The real estate market is constantly evolving and adapting to new times and players, such as, for example, Listed Real Estate Market Investment Companies (SOCIMIs). These investment vehicles, which have significant tax

19
advantages and whose structure was created in 2012 to promote the leasing of properties, is now becoming a major player in the residential rental market.
To date, large real estate firms have created most of the SOCIMIs in the market. They have spent billions of euros on investments, with the primary aim of managing tertiary and commercial assets. There have been a handful of purely residential SOCIMIs on the scene, but they have been mostly driven at a family level. But that is now changing, after several high profile firms linked in one way or another to housing have decided to launch new SOCIMIs. This is being perceived as a real declaration of intent that will lead to the professionalization of the rental housing market.
As mentioned before, this professional boost will happen through initiatives such as those launched by Quid Pro Quo Alquiler (the SOCIMI being prepared by Alquiler Seguro) and Domo Activos Socimi (Domo Gestora), amongst others. They are just two of the new companies that are being called upon to define the before and after in the rental housing sector. It is worth highlighting that the new SOCIMIs are backing the rental of diverse homes and the acquisition of buildable land to construct apartments for rental.
At the beginning, it made complete sense to SOCIMIs to acquire offices and shopping centres, because it was easier to find those products and at good prices. The situation was completely the opposite in the residential sector, where there were few packages of private homes available to buy. Over time, it has made sense for companies to start to group together large residential portfolios and commit to that formula.
On the other hand, many SOCIMIs confirm that housing is less attractive than others sectors. The residential asset is very intense in terms of management and it requires a certain condensed critical mass to be profitable. Even more, if portfolios are very diverse and dislocated, many avoid them as they make management more difficult and increase costs. For this reason, SOCIMIs and many other residential investors prefer investments in whole buildings because that means that they are able to renovate entire assets, increase their values significantly and optimise costs.
Apart from SOCIMIs, there are international funds such as Castlelake that is backing the housing market as the funds Lone Star and Värde Partners by the construction of new homes. Behind of all of them there are Aedas, Neinor and Dospuntos respectively. Between the three of them, the US entities have now invested almost €5,000 million in the sector.
The latest player to join the party, Aedas Homes, ownes a land portfolio worth €1,000 million and the capacity to construct 12,000 homes. Värde has committed to starting construction of 900 homes during Q1 2017 and Neinor published its plans for the 20-storey residential tower that it will construct next to the Manzanares River. Moreover, Värde bought the real estate firm Aelca for €50M and other one called Procisa, famous for La Finca luxurious development in Pozuelo (Madrid).
Moreover, Testa approved the receipt of 3,300 homes, worth €665M in total, from its shareholder banks (Santander, BBVA and Popular) in a move that will double the number of assets in the residential rental company’s portfolio. Analysts forecast a strong year ahead for the residential market, boosted in particular by the buy-to-let market and the increase in demand for rental housing.
Most Relevant Transactions
20
OUTLOOK
05
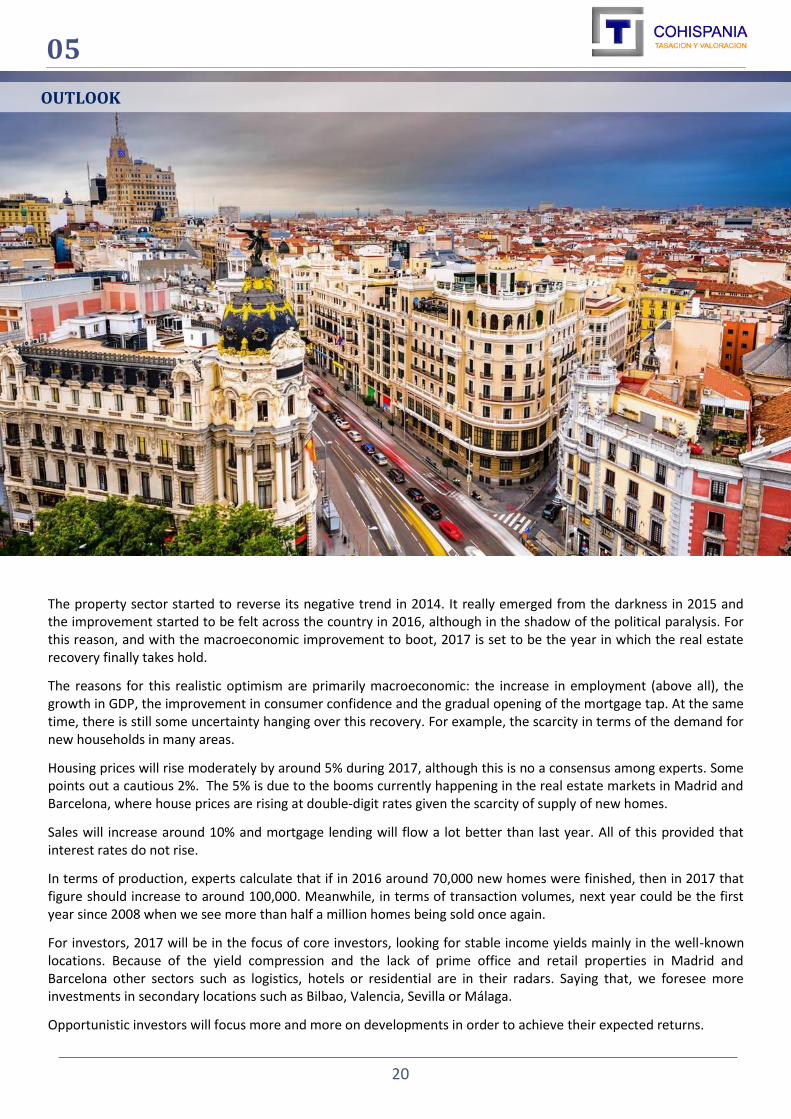
The property sector started to reverse its negative trend in 2014. It really emerged from the darkness in 2015 and the improvement started to be felt across the country in 2016, although in the shadow of the political paralysis. For this reason, and with the macroeconomic improvement to boot, 2017 is set to be the year in which the real estate recovery finally takes hold.
The reasons for this realistic optimism are primarily macroeconomic: the increase in employment (above all), the growth in GDP, the improvement in consumer confidence and the gradual opening of the mortgage tap. At the same time, there is still some uncertainty hanging over this recovery. For example, the scarcity in terms of the demand for new households in many areas.
Housing prices will rise moderately by around 5% during 2017, although this is no a consensus among experts. Some points out a cautious 2%. The 5% is due to the booms currently happening in the real estate markets in Madrid and Barcelona, where house prices are rising at double-digit rates given the scarcity of supply of new homes.
Sales will increase around 10% and mortgage lending will flow a lot better than last year. All of this provided that interest rates do not rise.
In terms of production, experts calculate that if in 2016 around 70,000 new homes were finished, then in 2017 that figure should increase to around 100,000. Meanwhile, in terms of transaction volumes, next year could be the first year since 2008 when we see more than half a million homes being sold once again.
For investors, 2017 will be in the focus of core investors, looking for stable income yields mainly in the well-known locations. Because of the yield compression and the lack of prime office and retail properties in Madrid and Barcelona other sectors such as logistics, hotels or residential are in their radars. Saying that, we foresee more investments in secondary locations such as Bilbao, Valencia, Sevilla or Málaga.
Opportunistic investors will focus more and more on developments in order to achieve their expected returns.
21
APPENDIXES

22
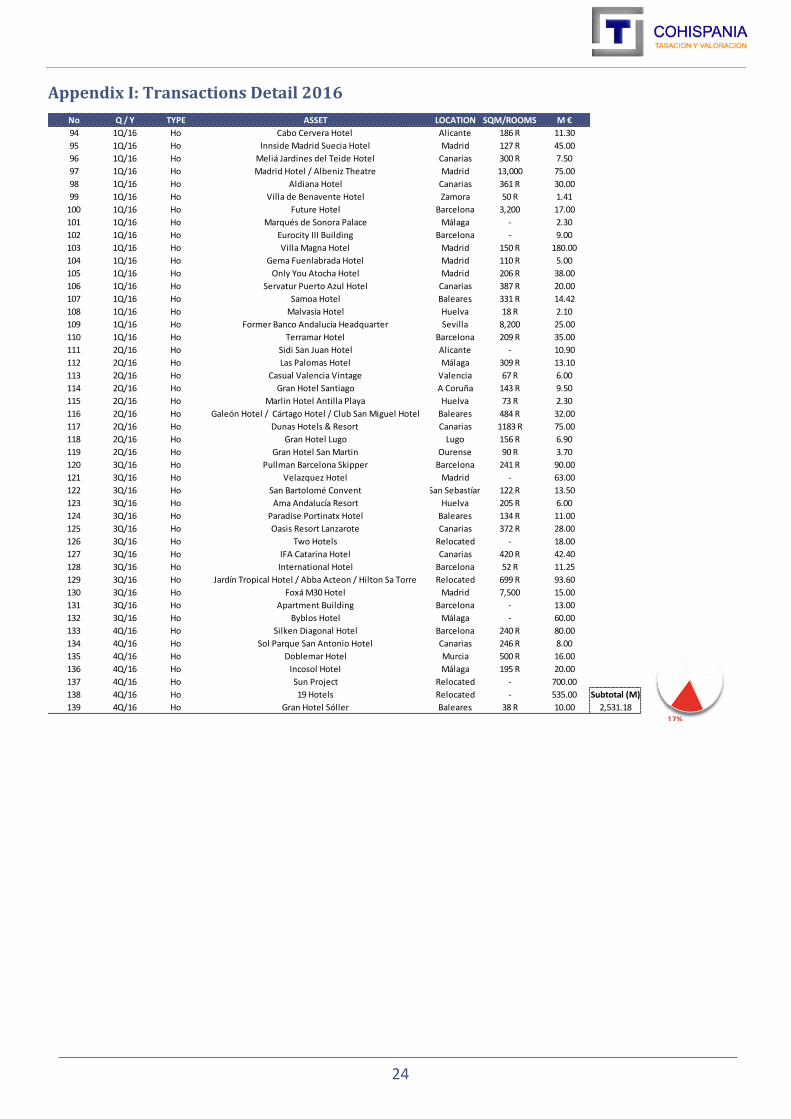
Appendix I: Transactions Detail 2016
No Q / Y TYPE ASSET LOCATION SQM/ROOMS M €
1 1Q/16 Rt C.C. Zubiarte Bilbao 61,000 30.00
2 1Q/16 Rt Former Bankia Bank Branch Madrid 900 39.50
3 1Q/16 Rt H.S. Unit Barcelona - 38.50
4 1Q/16 Rt Passeig de Gracia 32 Barcelona 1,136 45.00
5 1Q/16 Rt C.C. Bahia Azul Málaga 13,827 18.50
6 1Q/16 Rt Supermarket Portfolio Relocated 40,000 35.00
7 1Q/16 Rt 11 Shopping Centres Relocated - 358.00
8 1Q/16 Rt C.C. ABC Serrano / Preciados 9 Madrid 14,000 138.80
9 1Q/16 Rt 3 Retail Premises Relocated - 27.30
10 1Q/16 Rt Gran Via 55 Madrid 1,400 13.00
11 1Q/16 Rt Commercial Portfolio Relocated 235,000 205.00
12 1Q/16 Rt Reina Victoria Theatre Madrid - 7.00
13 1Q/16 Rt C.C. Portal de la Marina Alicante 16,400 14.58
14 1Q/16 Rt H.S. Unit Madrid 1,144 65.00
15 2Q/16 Rt 50% Commercial Park Viapark Almería 15,475 20.00
16 2Q/16 Rt 4 Supermarkets Relocated - 13.00
17 2Q/16 Rt C.C. Campanar Valencia 14,000 5.00
18 2Q/16 Rt C.C. L´albuj Alicante 60,000 110.00
19 2Q/16 Rt 33 BBVA Bank Branches Relocated - 50.30
20 2Q/16 Rt Retail Park Tarragona - 9.43
21 2Q/16 Rt Vistahermosa Retail Park Alicante 33,550 42.50
22 2Q/16 Rt Prada Flagship Store Barcelona 1,800 45.00
23 2Q/16 Rt 2 Mercadona´s Supermarket Zaragoza 8,000 7.00
24 2Q/16 Rt C.C. Manoteras Madrid 12,924 28.75
25 2Q/16 Rt Retail Park Tres Caminos Cadiz 20,270 14.50
26 3Q/16 Rt C.C. Diagonal Mar Barcelona 90,000 493.00
27 3Q/16 Rt C.C. Gran Vía de Vigo Vigo 41,246 141.00
28 3Q/16 Rt Banco Popular Bank Branch Madrid 1,638 21.60
29 3Q/16 Rt Social Security Building Valencia - 20.00
30 3Q/16 Rt C.C. Santa Ana Murcia - 1.35
31 3Q/16 Rt C.C. Luz del Tajo Toledo 41,090 107.00
32 3Q/16 Rt Parla Natura Madrid 18,000 16.20
33 3Q/16 Rt C.C. El Mirador de Burgos / C.C. Montigalá / C.C. Atalayas Relocated 30,000 77.00
34 3Q/16 Rt Castellana 83-85 Madrid - 150.00
35 4Q/16 Rt Commercial Portfolio Madrid - 40.00
36 4Q/16 Rt C.C. Travesía de Vigo Vigo 65,000 49.00
37 4Q/16 Rt C.C. Portal Mediterráneo Castellón 57,445 23.50
38 4Q/16 Rt C.C. Nassica Madrid 50,200 140.00
39 4Q/16 Rt C.C. Sexta Avenida / C.C. Espacio Torrelodones Madrid 49,700 62.30
40 4Q/16 Rt 50% C.C. Arturo Plaza / Office Building Madrid 3,450 71.60
41 4Q/16 Rt Sant Pere 5 Barcelona 4,000 29.10
42 4Q/16 Rt Velazquez 15 Madrid 396 16.50
43 4Q/16 Rt Fuencarral 37 Madrid 600 10.00 Subtotal (M)
44 4Q/16 Rt 49% C.C. La Maquinista Barcelona 95,000 201.20 3,051.01
20%

23
Appendix I: Transactions Detail 2016
No Q / Y TYPE ASSET LOCATION SQM/ROOMS M €
45 1Q/16 Of Amura Building Madrid 18,177 37.00
46 1Q/16 Of Edival Headquarters Valencia 8,000 9.00
47 1Q/16 Of Josefa Valcárcel 24 Madrid 5,640 13.00
48 1Q/16 Of Aguirre Newman Headquarters Madrid - 21.00
49 1Q/16 Of Cemex Headquarters Madrid 7,000 25.00
50 1Q/16 Of Isla de Manoteras business Park Madrid 13,442 44.30
51 1Q/16 Of Business Park Barcelona 49,000 40.00
52 1Q/16 Of Office Building Madrid 7,550 26.00
53 2Q/16 Of Rios Rosas 24 Madrid 3,300 10.60
54 2Q/16 Of Office Building Madrid 1,000 6.00
55 2Q/16 Of Inverseguros Assets Relocated 40,000 66.00
56 2Q/16 Of Generali Building Valencia 6,079 30.00
57 2Q/16 Of IBM Headquarters / BNP Headquarters Madrid 49,200 202.00
58 2Q/16 Of Jose Abascal 45 Madrid 5,300 35.00
59 2Q/16 Of La Vasco Navarra Building Navarra 7,066 15.00
60 2Q/16 Of Future Office Building Madrid 20,000 20.00
61 2Q/16 Of PSC Headquarters Barcelona 4,700 10.00
62 2Q/16 Of Passeig de Gracia 85 Barcelona - 52.50
63 2Q/16 Of Las Mercedes Business Park Madrid 80,000 140.00
64 2Q/16 Of Cepsa Tower Madrid 109,000 490.00
65 2Q/16 Of Cepsa Tower Madrid 109,000 400.00
66 3Q/16 Of Cedaceros 10 Madrid 2,356 11.00
67 3Q/16 Of Parque de Aguas Building Sevilla - 1.60
68 3Q/16 Of Former Forum Filatélico Headquarters Madrid 3,600 30.80
69 3Q/16 Of Edificio España Madrid 65,000 272.00
70 3Q/16 Of Nao Building Barcelona 9,000 30.00
71 3Q/16 Of Novartis Headquarters Barcelona 8,221 13.50
72 3Q/16 Of Parque Ciudad Adequa Madrid 120,813 380.00
73 3Q/16 Of Sede de Roca Junyent Barcelona 11,000 55.00
74 3Q/16 Of Vorsevi Headquarters Sevilla 9,000 3.60
75 3Q/16 Of Sponsor Building Sevilla 11,000 8.20
76 3Q/16 Of Buildings Portfolio Relocated - 50.00
77 3Q/16 Of Former Puig Headquarters Barcelona 4,500 15.00
78 4Q/16 Of Portfolio Relocated 40,000 66.50
79 4Q/16 Of Orion Building Madrid 7,300 15.00
80 4Q/16 Of Jose Echegaray Building Madrid 13,195 36.50
81 4Q/16 Of Cecabank Building Madrid 20,000 30.00
82 4Q/16 Of McKinsey & Co Corporative Headquarters Madrid 7,054 42.00
83 4Q/16 Of Velazquez 23 Madrid 2,548 35.00
84 4Q/16 Of Jose Abascal 41 Madrid - 20.00
85 4Q/16 Of Gas Natural Headquarters Madrid 32,000 120.00
86 4Q/16 Of Monte de Piedad Building Madrid 27,000 80.00
87 4Q/16 Of Cuatrecasas Building Madrid 15,094 124.00
88 4Q/16 Of Alcalá 45 Madrid - 104.00
89 4Q/16 Of Castellana 55 Madrid 5,625 60.00
90 4Q/16 Of Génova 26 Madrid 5,500 30.00
91 4Q/16 Of Three Buildings Madrid 25,100 86.50
92 4Q/16 Of Generali Building Sevilla 4,500 20.00 Subtotal (M)
93 4Q/16 Of Vocento Headquarters Madrid - 35.00 3,467.60 23%
24
Appendix I: Transactions Detail 2016
No Q / Y TYPE ASSET LOCATION SQM/ROOMS M €
94 1Q/16 Ho Cabo Cervera Hotel Alicante 186 R 11.30
95 1Q/16 Ho Innside Madrid Suecia Hotel Madrid 127 R 45.00
96 1Q/16 Ho Meliá Jardines del Teide Hotel Canarias 300 R 7.50
97 1Q/16 Ho Madrid Hotel / Albeniz Theatre Madrid 13,000 75.00
98 1Q/16 Ho Aldiana Hotel Canarias 361 R 30.00
99 1Q/16 Ho Villa de Benavente Hotel Zamora 50 R 1.41
100 1Q/16 Ho Future Hotel Barcelona 3,200 17.00
101 1Q/16 Ho Marqués de Sonora Palace Málaga - 2.30
102 1Q/16 Ho Eurocity III Building Barcelona - 9.00
103 1Q/16 Ho Villa Magna Hotel Madrid 150 R 180.00
104 1Q/16 Ho Gema Fuenlabrada Hotel Madrid 110 R 5.00
105 1Q/16 Ho Only You Atocha Hotel Madrid 206 R 38.00
106 1Q/16 Ho Servatur Puerto Azul Hotel Canarias 387 R 20.00
107 1Q/16 Ho Samoa Hotel Baleares 331 R 14.42
108 1Q/16 Ho Malvasía Hotel Huelva 18 R 2.10
109 1Q/16 Ho Former Banco Andalucía Headquarter Sevilla 8,200 25.00
110 1Q/16 Ho Terramar Hotel Barcelona 209 R 35.00
111 2Q/16 Ho Sidi San Juan Hotel Alicante - 10.90
112 2Q/16 Ho Las Palomas Hotel Málaga 309 R 13.10
113 2Q/16 Ho Casual Valencia Vintage Valencia 67 R 6.00
114 2Q/16 Ho Gran Hotel Santiago A Coruña 143 R 9.50
115 2Q/16 Ho Marlin Hotel Antilla Playa Huelva 73 R 2.30
116 2Q/16 Ho Galeón Hotel / Cártago Hotel / Club San Miguel Hotel Baleares 484 R 32.00
117 2Q/16 Ho Dunas Hotels & Resort Canarias 1183 R 75.00
118 2Q/16 Ho Gran Hotel Lugo Lugo 156 R 6.90
119 2Q/16 Ho Gran Hotel San Martin Ourense 90 R 3.70
120 3Q/16 Ho Pullman Barcelona Skipper Barcelona 241 R 90.00
121 3Q/16 Ho Velazquez Hotel Madrid - 63.00
122 3Q/16 Ho San Bartolomé Convent San Sebastían 122 R 13.50
123 3Q/16 Ho Ama Andalucía Resort Huelva 205 R 6.00
124 3Q/16 Ho Paradise Portinatx Hotel Baleares 134 R 11.00
125 3Q/16 Ho Oasis Resort Lanzarote Canarias 372 R 28.00
126 3Q/16 Ho Two Hotels Relocated - 18.00
127 3Q/16 Ho IFA Catarina Hotel Canarias 420 R 42.40
128 3Q/16 Ho International Hotel Barcelona 52 R 11.25
129 3Q/16 Ho Jardín Tropical Hotel / Abba Acteon / Hilton Sa Torre Relocated 699 R 93.60
130 3Q/16 Ho Foxá M30 Hotel Madrid 7,500 15.00
131 3Q/16 Ho Apartment Building Barcelona - 13.00
132 3Q/16 Ho Byblos Hotel Málaga - 60.00
133 4Q/16 Ho Silken Diagonal Hotel Barcelona 240 R 80.00
134 4Q/16 Ho Sol Parque San Antonio Hotel Canarias 246 R 8.00
135 4Q/16 Ho Doblemar Hotel Murcia 500 R 16.00
136 4Q/16 Ho Incosol Hotel Málaga 195 R 20.00
137 4Q/16 Ho Sun Project Relocated - 700.00
138 4Q/16 Ho 19 Hotels Relocated - 535.00 Subtotal (M)
139 4Q/16 Ho Gran Hotel Sóller Baleares 38 R 10.00 2,531.1817%

25
Appendix I: Transactions Detail 2016
No Q / Y TYPE ASSET LOCATION SQM/ROOMS M €
140 1Q/16 Re Danzarama Building Barcelona 5.000 15,00
141 1Q/16 Re Ros Casares Complex Valencia 80.000 30,00
142 1Q/16 Re Claudio Coello 108 Madrid 5.318 22,00
143 2Q/16 Re Sardenya Building Barcelona - 1,93
144 2Q/16 Re 11 Buildings Barcelona - 48,00
145 2Q/16 Re Residential Complex Madrid 6.296 16,00
146 3Q/16 Re General Martinez Campos 19 Madrid 6.000 25,00
147 3Q/16 Re Residential Building Madrid - 9,20
148 3Q/16 Re 4 Residential Buildings Relocated 19.400 25,00
149 4Q/16 Re Cervantes Building Madrid 0 2,10
150 4Q/16 Re Rambla Poblenou 129 Barcelona 0 23,70
151 4Q/16 Re Genova 5 Madrid 0 23,90
152 4Q/16 Re Alaró 4 Madrid 0 12,90
153 4Q/16 Re Balmes 433 Barcelona 0 8,00
154 4Q/16 Re Podavines Building Gipuzkoa 9.534 9,96
155 4Q/16 Re Santiago Galas Student Residence Madrid 4.022 14,00
156 4Q/16 Re Plaza del Teatro Residential Building Málaga 58 V 8,70
157 4Q/16 Re Pau Claris 175 Barcelona 2.000 6,50
158 4Q/16 Re Eixample Building Barcelona - 5,00
159 4Q/16 Re Serrano 53 Madrid - 52,00
160 4Q/16 Re Passeig de Gracia 81 Barcelona 3.800 32,50 Subtotal (M)
161 4Q/16 Re Residential Building Madrid - 1,01 392,40
162 1Q/16 Su Logistic Use Plot Barcelona 150.000 30
163 1Q/16 Su Residential and Office Use Plot Madrid 37.700 20
164 1Q/16 Su Logistic Use Plot La Rioja 11.935 0,81
165 1Q/16 Su Plot Huesca 5.640 1,2
166 1Q/16 Su Plot Málaga 30.000 25,5
167 1Q/16 Su Retail Use Plot Sevilla 123.000 36
168 1Q/16 Su Meco Logistic Use Plot Madrid - 9,00
169 1Q/16 Su Cabanillas III Logistic Use Plot Guadalajara - 24,00
170 2Q/16 Su Residential Plot Madrid - 5,40
171 2Q/16 Su Residential Plot Madrid 3.045 5,38
172 2Q/16 Su Logistic Plot Relocated 43.141 2,10
173 2Q/16 Su Two Plots Madrid - 10,00
174 2Q/16 Su Plot Barcelona - 8,00
175 2Q/16 Su Los Quintos de San Martín Estate Badajoz 80.000.000 55,00
176 2Q/16 Su Logistic Use Plot Tarragona 85.000 3,80
177 2Q/16 Su Residential Use Plot Madrid 6.029 3,30
178 2Q/16 Su Land Madrid 10.000.000 75,00
179 3Q/16 Su Plot Sevilla 1.375 3,50
180 3Q/16 Su Industrial Use Plot Valencia 28.927 2,00
181 3Q/16 Su Plot Córdoba - 2,90
182 4Q/16 Su Residential Use Plots Relocated - 11,50
183 4Q/16 Su 4 Plots Madrid 15.000 12,00
184 4Q/16 Su Residential Use Plots Barcelona 60.000 36,00
185 4Q/16 Su Plot Canarias 21 1,20
186 4Q/16 Su Via de los Poblados Plot Madrid - 32,00
187 4Q/16 Su Residential Use Plot Madrid 3.174 19,60
188 4Q/16 Su Puerta de Hierro Plot Madrid 0 3,58
189 4Q/16 Su Mendez Alvaro Plot Madrid 2.107 29,15
190 4Q/16 Su Land Portfolio Madrid - 45,00
191 4Q/16 Su Industrial Use Plot Sevilla 10.000 1,25
192 4Q/16 Su Logistic Use Plot Valencia 358.270 24,00
193 4Q/16 Su Residential Use Plot Málaga 16.163 -
194 4Q/16 Su Two Plots Málaga - 2,36
195 4Q/16 Su Vicálvaro Plot Madrid 141.826 39,40 Subtotal (M)
196 4Q/16 Su Residential Plot Málaga 13.000 15,00 594,93
17%
3%
4%

26
Appendix I: Transactions Detail 2016
No Q / Y TYPE ASSET LOCATION SQM/ROOMS M €
197 1Q/16 Lo Zaphir Logistic Portfolio Relocated 151,500 87.00
198 1Q/16 Lo Retail Park Huelva 74,400 7.50
199 1Q/16 Lo Logistic Warehouse Barcelona - 4.00
200 1Q/16 Lo Logistic Park Montepino Casablanca Madrid 50,000 28.00
201 2Q/16 Lo 2 Logistic Assets Relocated - 25.10
202 2Q/16 Lo 6 Logistic Parks Sevilla 84,250 95.00
203 2Q/16 Lo Logistic Warehouse Guadalajara 30,000 20.00
204 2Q/16 Lo Iberia Project Relocated 144,320 24.00
205 2Q/16 Lo Pinto Warehouse Madrid 70,000 12.80
206 2Q/16 Lo Colonia Llaudet Warehouse Girona 8,025 1.75
207 2Q/16 Lo Logistic Project Madrid 121,000 43.00
208 2Q/16 Lo Retail Park Guadalajara 10,000 5.00
209 3Q/16 Lo Warehouse Burgos 4,653 2.00
210 3Q/16 Lo Saba Logistic Portfolio Relocated 1,115,000 115.00
211 4Q/16 Lo Monalisa Portfolio Relocated 80,000 70.00
212 4Q/16 Lo Marie Claire Platform Castellon - 4.20
213 4Q/16 Lo Industrial Warehouse Valencia 16,000 7.00
214 4Q/16 Lo 4 Logistic Warehouses Zaragoza 72,484 42.90
215 4Q/16 Lo Two Logistic Assets Madrid 30,000 14.20 Subtotal (M)
216 4Q/16 Lo Mango Logistic Center Barcelona 180,000 150.00 758.45
217 2Q/16 At Go Fit Relocated - 300.00
218 2Q/16 At Future Clinic Barcelona 8,000 16.00
219 2Q/16 At Sanyres Homes Relocated - 125.00
220 2Q/16 At Sagrada Familia Clinic Barcelona 0 50.70
221 2Q/16 At CEEI Building Valladolid 7,900 2.05
222 2Q/16 At 13% Parque Rioja Cinema La Rioja 1,218 0.50
223 2Q/16 At Amma Group Relocated - 220.00
224 2Q/16 At Plaza Norte 2 Cinemas Madrid 6,034 9.25
225 3Q/16 At Infanta Luisa Hospital Sevilla 14,000 100.00
226 3Q/16 At 87% Parque Rioja Cinema La Rioja 8,155 3.80
227 3Q/16 At Can 60 Barcelona - 6.00
228 4Q/16 At Club Antares Plots Sevilla - 7.50 Subtotal (M)
229 4Q/16 At Portfolio Barcelona - 40.00 880.80
Subtotal (M)
230 2Q/16 Pk Parkia Relocated - 325.00 325.00
231 1Q/16 D Loan Portfolio - - 73.70
232 1Q/16 D Pirene Project - - 540.00
233 2Q/16 D Ocean Project - - 140.00
234 2Q/16 D Carit Project - - 300.00
235 3Q/16 D NPL Portfolio - - 35.00
236 4Q/16 D Debt Portfolio - - 430.00
237 4Q/16 D Sevilla Project - - 80.00
238 4Q/16 D Marina Project - - 80.00 Subtotal (M)
239 4Q/16 D Traveler Project - - 364.00 2,042.70
240 1Q/16 Cp Realia Capital Increase - - 89.00
241 1Q/16 Cp Sociedad Valderrama - - 40.00
242 1Q/16 Cp 75% Aelca - - 50.00
243 2Q/16 Cp Logiters - - 85.00 Subtotal (M)
244 4Q/16 Cp 40% La Finca - - 130.00 394.00
245 1Q/16 Pf Aktua - - 300.00 Subtotal (M)
246 2Q/16 Pf Tinsa - - 300.00 600.00
TOTAL (M) 15,038.07
5%
6%
2%
13%
3%
4%
27
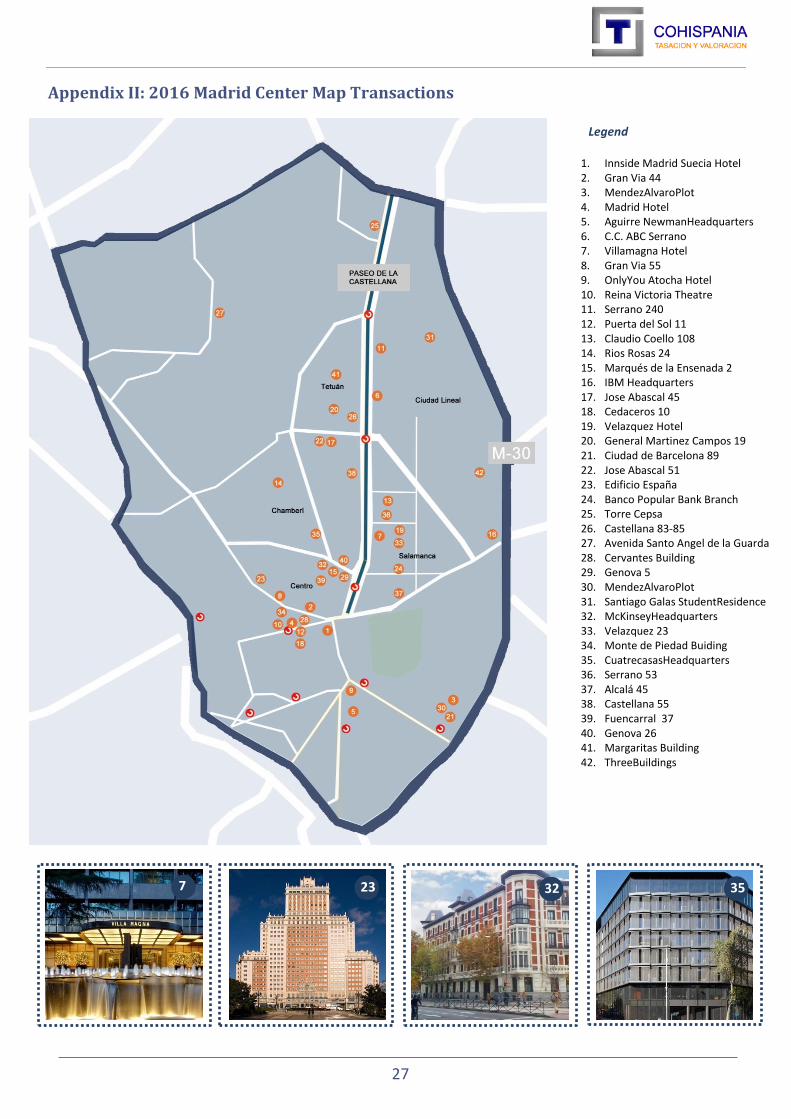
Appendix II: 2016 Madrid Center Map Transactions
Legend
1. Innside Madrid Suecia Hotel 2. Gran Via 44 3. MendezAlvaroPlot 4. Madrid Hotel 5. Aguirre NewmanHeadquarters 6. C.C. ABC Serrano 7. Villamagna Hotel 8. Gran Via 55 9. OnlyYou Atocha Hotel 10. Reina Victoria Theatre 11. Serrano 240 12. Puerta del Sol 11 13. Claudio Coello 108 14. Rios Rosas 24 15. Marqués de la Ensenada 2 16. IBM Headquarters 17. Jose Abascal 45 18. Cedaceros 10 19. Velazquez Hotel 20. General Martinez Campos 19 21. Ciudad de Barcelona 89 22. Jose Abascal 51 23. Edificio España 24. Banco Popular Bank Branch 25. Torre Cepsa 26. Castellana 83-85 27. Avenida Santo Angel de la Guarda 28. Cervantes Building 29. Genova 5 30. MendezAlvaroPlot 31. Santiago Galas StudentResidence 32. McKinseyHeadquarters 33. Velazquez 23 34. Monte de Piedad Buiding 35. CuatrecasasHeadquarters 36. Serrano 53 37. Alcalá 45 38. Castellana 55 39. Fuencarral 37 40. Genova 26 41. Margaritas Building 42. ThreeBuildings
23 35 7 32

28
Appendix III: 2016 Madrid Map Transactions
Legend
1. Amura Building 2. Josefa Valcárcel 24 3. Cemex Headquarters 4. Gema Fuenlabrada Hotel 5. Isla de Manoteras Business Park 6. Logistic Park Montepino 7. ResidentialPlot 8. ResidentialPlot 9. Avenida de la Hispanidad 3 10. Meco Plot 11. Future Office Building 12. Logistic Project
22. Manoteras S.C. 23. Las Rozas Plot 24. Las Mercedes Business Park 25. ValdebebasPlot 26. Foxa M30 27. Ciudad Adequa 28. Plaza Norte 2 Cinemas 29. Parla Natura 30. 4 Plots 31. OrionBuilding 32. Jose Echegaray Building 33. Via de los Poblados Plot
13. CecabankBuilding 14. Puerta de Hierro Plot 15. Alaró 4 16. Nassica S.C. 17. Sexta Avenida S.C./Espacio Torrelodones S.C. 18. 50% Arturo Soria S.C. 19. Gas Natural Portfolio 20. TwoLogisticAssets 21. VocentoHeadquarters
16 35 3 24

29
Legend
1. Arcs 10 2. Passeig de Gracia 32 3. Logistic Use Plot 4. DanzaramaBuilding 5. Fontanella 9 6. Eurocity III Building 7. Business Park 8. LogisticWarehouse 9. SandenyaBuilding 10. 11 Buildings 11. FutureClinic 12. Plot 13. Sagrada Familia Clinic 14. Prada FlagshipStore 15. PSC Headquarters 16. Passeig de Gracia 85 17. Diagonal Mar S.C. 18. PullmanSkipper Barcelona 19. Nao Building 20. International Hotel 21. NovartisHeadquarters 22. Roca JunyentHeadquarters 23. Can 60 24. Former Puig Headquearters 25. Residential Use Plots 26. Silken Diagonal Hotel 27. Rambla Poblenou 129 28. Balmes 433 29. Sant Pere 5 30. Pau Claris 175 31. EixampleBuilding 32. Passeig de Gracia 81 33. Portfolio 34. 49% La Maquinista S.C.
Appendix IV: 2016 Barcelona Map Transactions
7 15
26
13
16 17
6
34

30
Appendix V: 2016 Spain Map Transactions
Legend
1. Zubiarte S.C. 2. Cano Cervera Hotel 3. Melia Jardines del Teide 4. Bahia Azul S.C. 5. EdivalHeadquarters 6. Logistic Use Plot 7. Aldiana Hotel 8. Villa de Benavente Hotel 9. Huesca Plot 10. Ros Casares Complex 11. EsteponaPlot 12. Marqués de Sonora Palace 13. Retail Use Plot 14. Hotel 15. Retail Park 16. Servatur Puerto Azul Hotel 17. Samoa Hotel 18. Malvasia Hotel 19. Portal de la Marina S.C. 20. Former Banco Andalucía Headquarters 21. 50% CommercialViapark 22. Sidi San Juan Hotel 23. 6 LogisticParks 24. LogisticWarehouse 25. Las Palomas Hotel 26. Casual Valencia Vintage 27. Los Quintos de San Martin Estate 28. Gran Hotel Santiago 29. Campanar S.C.
30. L´aljub S.C. 31. Cabanillas III Logistic Use Plot 32. CEEI Building 33. Generali Buiding Valencia 34. Colonia LlaudetWarehouse 35. Marlin Hotel Antilla Playa 36. Retail Park 37. La Vasco Navarra Building 38. 13% Parque Rioja Cinema 39. Vistahermosa Retail Park 40. 2 Mercadona´sSupermarket 41. Logistic Use Plot 42. ThreeHotels 43. Retail Park Tres Caminos 44. Retail Park 45. Infanta Luisa Hospital 46. Gran Via de Vigo S.C. 47. Parque de Aguas Building 48. San Bartolomé Convent 49. Ama Andalucia Resort 50. Paradise Prtinatx Hotel 51. Oasis Resort Lanzarote 52. IFA Catarina Hotel 53. Warehouse 54. 87% Parque Rioja Cinema 55. Social Security Building 56. Dunas Hotels& Resorts 57. Santa Ana S.C. 58. Luz del Tajo S.C.
59. Sevilla Plot 60. VorseviHeadquarters 61. Industrial Use Plot 62. Byblos Hotel 63. Gran Hotel Lugo 64. Gran Hotel San Martin 65. Sponsor Building 66. CordobaPlot 67. Canarias Plot 68. Travesia de Vigo S.C. 69. Portal Mediterraneo S.C. 70. Sol Parque San Antonio Hotel 71. PodavinesBuilding 72. Doblemar Hotel 73. Marie Claire Platform 74. Incosol Hotel 75. Plaza del Teatro ResidentialBuilding 76. Industrial Warehouse 77. Club Antares Plots 78. 4 LogisticWarehouses 79. Industrial Use Plot 80. Logistic Use Plot 81. Residential Use Plot 82. TwoPlots 83. Gran Hotel Soller 84. ResidentialPlot 85. Generali Building Sevilla

31
Appendix VI: SOCIMIS Investment
Source: Cohispania
Retail
Land
Residential
Hospitality
Alternative
Logistic

32
Cohispania has worked in collaboration with Maxxima
About Cohispania Cohispania takes part of the company Grupo Financiero Empredia A26. Grupo Financiero Empredia A26 is a group with interests in various sectors: Valuation of properties, companies and industrial assets, inventories, formation and Real Estate Advisory. Cohispania provides Consultancy in Real Estate Valuation. Cohispania value all types of properties using different criteria depending on the purpose of the report:
Regulatory purposes. Reception to the current regulations (Ministerial Order ECO/805/2003):
Mortgagecredit.
Value studies for Real Estate Investment Funds (REITs).
Value of the real estate assets of Pension Funds.
Administrative and financial purposes. All those need to know the market value of the property:
Coverage of Technical Provisions of Insurance Companies.
Massive Portfolio Evaluations- Automated Valuation Model (AVM).
Balances Sheets.
Advice on processes for buying and selling.
Valuations following IVS, EVS and RICS regulations.
Maxxima Maxxima is a Madrid based Real Estate Advisory firm that manages singular Real Estate assets and portfolios. Moreover, we are specialized in providing integrated and tailored services in Real Estate Market and Transaction Advisory. Our services frame includes: Strategy and Transaction Advisory, Corporate Finance services, Property Valuation, Technical Management, Asset Management and Advisory in Real Estate Operations.
Disclaimer
©Cohispania S.A. 2017
The publication of this report only provides general information. High standards have been used to prepare the information, analysis and projections exposed. This report does not necessarily represent the views of Cohispania S.A.and Maxxima REA and no responsibility for loss associated to any person acting or refraining from acting as a result of any material in this publication can be accepted by the authors or publishers. Reproduction of this report in whole part or in part is allowed with proper reference to Cohispania.
All diagrams, charts and comments have been prepared by Cohispania in collaboration with Maxxima REA on the basis of public and open market data compiled from January until the 31th of December of 2016.

33
www.cohispania.com
Head Office
Avda.Europa 34. Building B
28023
Madrid · Spain
(+34)91 307 00 35