Embed Size (px)
Citation preview
Corporate Earnings Downgrade Cycle: Beginning of the end
Thematic Note
For many quarters now the Indian equity markets have been frustrated by weak corporate earnings and as a corollary earnings downgrade cycle panning out. However, it seems that something has begun to change in the economy and in the corporate earnings. The half yearly results for H2FY16 and particularly the quarterly results for Q4FY16 have begun to show gradual but clear signs of turnaround in the corporate earnings.
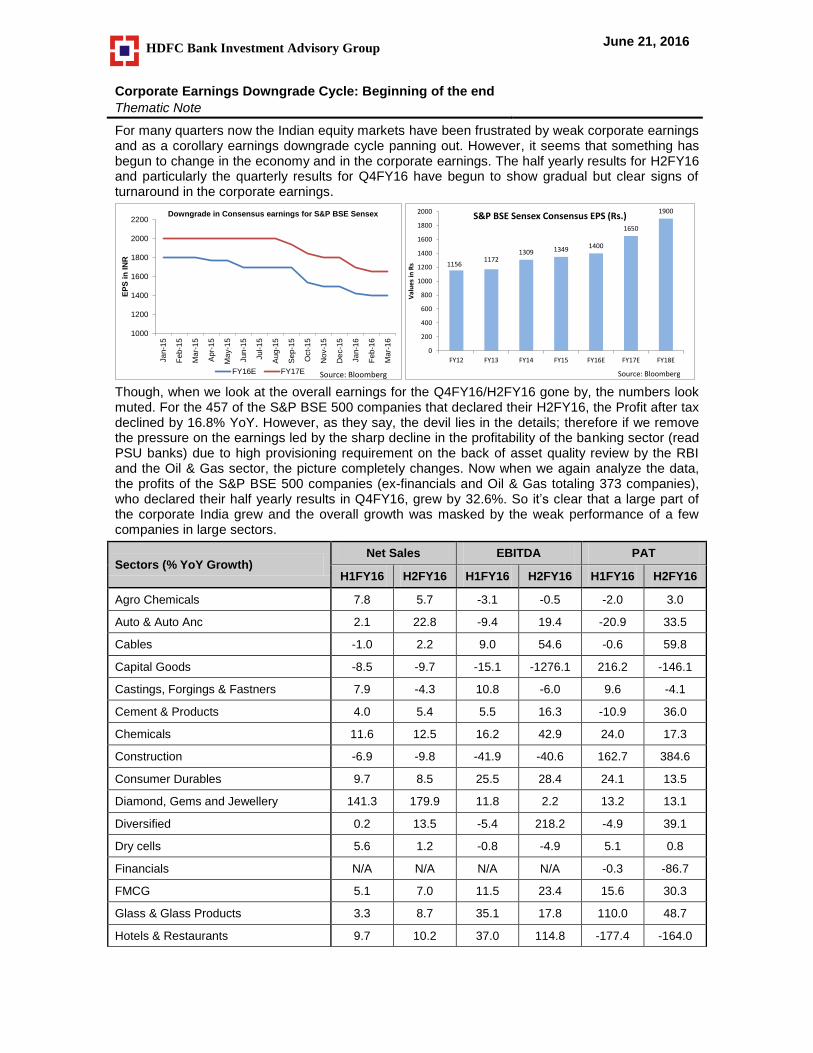
Though, when we look at the overall earnings for the Q4FY16/H2FY16 gone by, the numbers look muted. For the 457 of the S&P BSE 500 companies that declared their H2FY16, the Profit after tax declined by 16.8% YoY. However, as they say, the devil lies in the details; therefore if we remove the pressure on the earnings led by the sharp decline in the profitability of the banking sector (read PSU banks) due to high provisioning requirement on the back of asset quality review by the RBI and the Oil & Gas sector, the picture completely changes. Now when we again analyze the data, the profits of the S&P BSE 500 companies (ex-financials and Oil & Gas totaling 373 companies), who declared their half yearly results in Q4FY16, grew by 32.6%. So it’s clear that a large part of the corporate India grew and the overall growth was masked by the weak performance of a few companies in large sectors.
Sectors (% YoY Growth) Net Sales EBITDA PAT
H1FY16 H2FY16 H1FY16 H2FY16 H1FY16 H2FY16
Agro Chemicals 7.8 5.7 -3.1 -0.5 -2.0 3.0
Auto & Auto Anc 2.1 22.8 -9.4 19.4 -20.9 33.5
Cables -1.0 2.2 9.0 54.6 -0.6 59.8
Capital Goods -8.5 -9.7 -15.1 -1276.1 216.2 -146.1
Castings, Forgings & Fastners 7.9 -4.3 10.8 -6.0 9.6 -4.1
Cement & Products 4.0 5.4 5.5 16.3 -10.9 36.0
Chemicals 11.6 12.5 16.2 42.9 24.0 17.3
Construction -6.9 -9.8 -41.9 -40.6 162.7 384.6
Consumer Durables 9.7 8.5 25.5 28.4 24.1 13.5
Diamond, Gems and Jewellery 141.3 179.9 11.8 2.2 13.2 13.1
Diversified 0.2 13.5 -5.4 218.2 -4.9 39.1
Dry cells 5.6 1.2 -0.8 -4.9 5.1 0.8
Financials N/A N/A N/A N/A -0.3 -86.7
FMCG 5.1 7.0 11.5 23.4 15.6 30.3
Glass & Glass Products 3.3 8.7 35.1 17.8 110.0 48.7
Hotels & Restaurants 9.7 10.2 37.0 114.8 -177.4 -164.0
1000
1200
1400
1600
1800
2000
2200
Ja
n-1
5
Fe
b-1
5
Ma
r-1
5
Ap
r-1
5
Ma
y-1
5
Jun-1
5
Ju
l-1
5
Au
g-1
5
Se
p-1
5
Oct-
15
No
v-1
5
De
c-1
5
Ja
n-1
6
Fe
b-1
6
Ma
r-1
6
EP
S i
n I
NR
Downgrade in Consensus earnings for S&P BSE Sensex
FY16E FY17E Source: Bloomberg
11561172
1309 1349 1400
1650
1900
0
200
400
600
800
1000
1200
1400
1600
1800
2000
FY12 FY13 FY14 FY15 FY16E FY17E FY18E
Val
ue
s in
Rs
S&P BSE Sensex Consensus EPS (Rs.)
Source: Bloomberg
HDFC Bank Investment Advisory Group June 21, 2016

Infrastructure 10.7 18.4 15.4 23.9 7.7 13.5
IT 13.1 14.9 10.6 20.8 8.1 21.2
Logistics 7.7 6.8 165.3 211.7 367.5 1622.7
Media & Ent 16.6 12.3 18.0 27.0 50.5 40.7
Metal & Mining -9.5 -12.2 -45.6 -29.3 -35.7 2.1
Miscellaneous -0.5 -9.8 10.2 -68.5 7.8 19.1
Oil & Natural Gas -22.4 -18.8 25.3 -10.3 16.2 -19.6
Packaging -3.3 -3.3 37.9 31.6 64.0 39.7
Paper 15.6 2.3 27.1 11.3 117.3 54.6
Pharmaceuticals 10.2 13.5 14.1 31.1 -6.5 26.6
Plastic products 9.3 4.4 12.6 33.0 41.7 57.0
Power 10.7 10.9 22.6 33.3 29.1 6.6
Realty 14.3 19.9 3.5 25.5 -13.4 -19.0
Refractories 116.3 61.9 300.3 105.6 -236.2 175.3
Shipping -1.6 -4.1 28.0 -10.4 68.3 -24.3
Sugar -3.4 11.1 -59.7 340.7 67.5 -185.2
Telecomm 4.9 5.9 11.3 9.5 29.3 0.2
Textiles 5.3 -6.1 18.0 15.4 14.9 47.1
Trading -21.3 -32.2 -78.9 -81.0 -8.6 -52.8
Total -2.3 2.1 4.6 -4.3 2.6 -16.8
Total (ex Financial) -4.8 1.2 2.9 11.4 3.6 18.6
Total (ex Financial and Oil & Gas) 5.2 10.3 -1.6 16.5 0.2 32.6
Source: Capitaline
So, the earnings grew!!!, but how did that happen?
Basically when we look at the reasons for the earnings growth, we found that while some sectors grew across the board, in most of the other sectors there was decent margin expansion. Now, the market has been talking about the decline in the commodity prices benefitting the corporate sector, this is the proof of that. When we look at the overall absolute numbers, the sales for H2FY16 (ex-financials and Oil & Gas) grew by 10.3% YoY, but the EBITDA for the same period grew by 16.5% YoY, clearly reflecting the benefits that accrued to the corporates due to weaker raw material prices.
Declining commodity prices boosting EBITDA margins
Source: Bloomberg, *BBG stands for Bloomberg Index
Also, we must understand another aspect of the adjustment processes of the corporates. When the going gets tough, we have seen in the past that a lot of the corporates start to tighten their belts, in
0.0
20.0
40.0
60.0
80.0
100.0
120.0
140.0
160.0
180.0
Dec
-06
Jun-
07
Dec
-07
May
-08
Nov
-08
May
-09
Oct
-09
Apr
-10
Oct
-10
Mar
-11
Sep-
11
Mar
-12
Aug
-12
Feb-
13
Aug
-13
Jan-
14
Jul-1
4
Dec
-14
Jun-
15
Dec
-15
May
-16
(Inde
x to
100
)
Trend in metal commodity
LME Aluminum LME Nickel BBG Industrial Metals LME Copper
Copper
Aluminum
Nickel
Metal
0.0
50.0
100.0
150.0
200.0
250.0
300.0
Sep-
06Fe
b-07
Jun-
07O
ct-0
7M
ar-0
8Ju
l-08
Nov
-08
Mar
-09
Aug
-09
Dec
-09
Apr
-10
Aug
-10
Jan-
11M
ay-1
1Se
p-11
Feb-
12Ju
n-12
Oct
-12
Feb-
13Ju
l-13
Nov
-13
Mar
-14
Jul-
14D
ec-1
4A
pr-1
5A
ug-1
5Ja
n-16
May
-16
(Ind
ex t
o 10
0)
Trend in Brent Crude
terms of reducing costs, cutting wasteful expenditures and building efficiencies into their processes. So, anecdotally we believe that such actions were already taking place in the corporates to be fit in the lean growth season. That along with the strong tailwinds of the decline in the commodity prices has meant that the corporate profitability has seen uptick. We now believe that the earnings can see a much larger leg up once the revenue growth and pricing power comes back to the corporates as there would have double benefits of sales growth and operational efficiencies bringing in strong operating leverage for them.
How are we suggesting that the earnings downgrades could be ending?
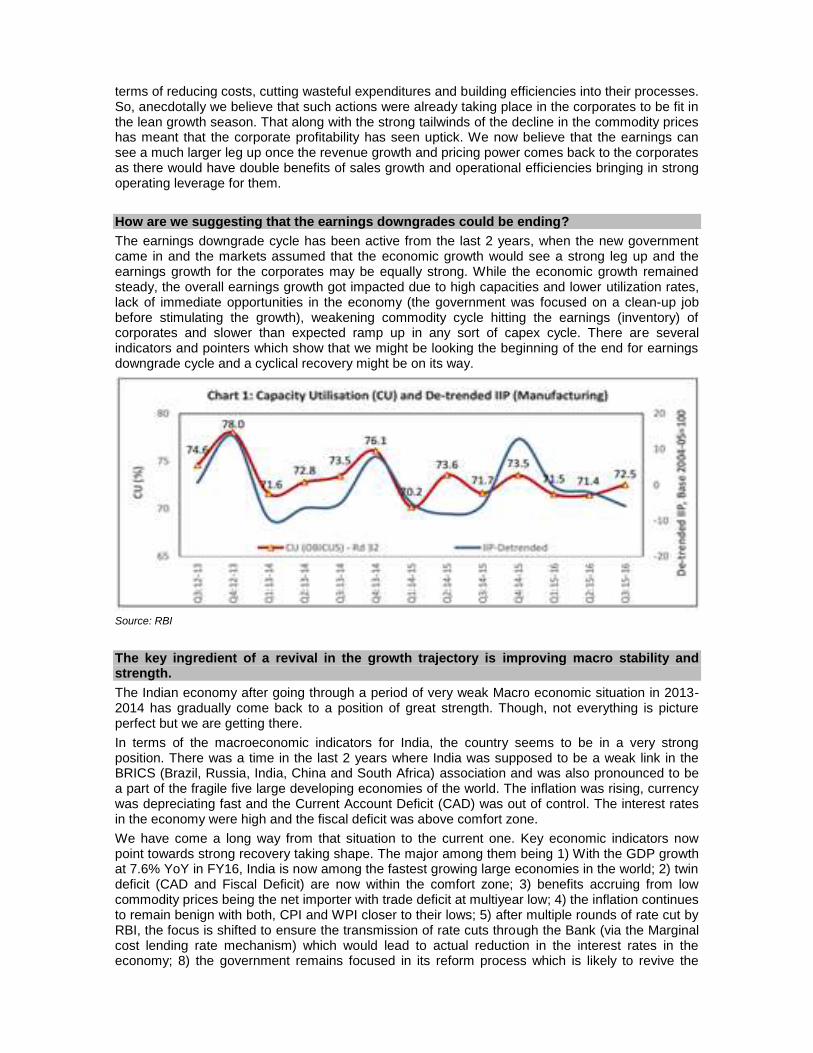
The earnings downgrade cycle has been active from the last 2 years, when the new government came in and the markets assumed that the economic growth would see a strong leg up and the earnings growth for the corporates may be equally strong. While the economic growth remained steady, the overall earnings growth got impacted due to high capacities and lower utilization rates, lack of immediate opportunities in the economy (the government was focused on a clean-up job before stimulating the growth), weakening commodity cycle hitting the earnings (inventory) of corporates and slower than expected ramp up in any sort of capex cycle. There are several indicators and pointers which show that we might be looking the beginning of the end for earnings downgrade cycle and a cyclical recovery might be on its way.
Source: RBI
The key ingredient of a revival in the growth trajectory is improving macro stability and strength.
The Indian economy after going through a period of very weak Macro economic situation in 2013-2014 has gradually come back to a position of great strength. Though, not everything is picture perfect but we are getting there.
In terms of the macroeconomic indicators for India, the country seems to be in a very strong position. There was a time in the last 2 years where India was supposed to be a weak link in the BRICS (Brazil, Russia, India, China and South Africa) association and was also pronounced to be a part of the fragile five large developing economies of the world. The inflation was rising, currency was depreciating fast and the Current Account Deficit (CAD) was out of control. The interest rates in the economy were high and the fiscal deficit was above comfort zone.
We have come a long way from that situation to the current one. Key economic indicators now point towards strong recovery taking shape. The major among them being 1) With the GDP growth at 7.6% YoY in FY16, India is now among the fastest growing large economies in the world; 2) twin deficit (CAD and Fiscal Deficit) are now within the comfort zone; 3) benefits accruing from low commodity prices being the net importer with trade deficit at multiyear low; 4) the inflation continues to remain benign with both, CPI and WPI closer to their lows; 5) after multiple rounds of rate cut by RBI, the focus is shifted to ensure the transmission of rate cuts through the Bank (via the Marginal cost lending rate mechanism) which would lead to actual reduction in the interest rates in the economy; 8) the government remains focused in its reform process which is likely to revive the

investment cycle in the economy; 9) foreign direct investment (FDI) equity in India increased sharply by ~37% YoY for CY15. We think that India’s structural drivers are intact which well differentiates vis-a-vis other emerging countries and are likely to support the economic growth in medium to long term.
Key elements of the economy have started to fire which suggests that the growth may be getting broad based.
Some key element of the economy are now starting to look robust and seems to be firing, while some other parts of the economy are work-in-progress. Some high frequency indicators point to a firming recovery, although it is still uneven. Leading the upturn are cargo traffic at major ports, automobile sales (especially two-wheelers and three-wheelers), commercial vehicle sales, passenger air and freight traffic, cement production and steel consumption. Abstracting from seasonal effects, this suggests that the expansion, especially in the service sector, is getting broad-based. Indirect tax collections grew by about 37% YoY during April-May compared to the same period of the last fiscal suggesting that the economic cycle is gaining momentum.
Among the broader trends, Urban consumption seems to be one area which is showing a lot of promise. The pick-up in urban consumption growth signified by strong growth in domestic passenger traffic in Airlines, sharp rise in the value of mobile banking transactions, double digit growth in housing loans and in demand hotel rooms in India. Strong business sentiment and pick-up in corporate travel have led to strong 30% growth in hotel hiring in the past six months, after five year long period of lull. As per a Nielson survey, the consumer confidence (especially urban consumer confidence) in India is at a nine year high (Source: Business Standard), which is likely to keep up the uptick in urban consumption demand. Overall fuel consumption in India rose to an eight-year high in FY16 with Petrol consumption witnessed a growth of about 15%, a 17-year-high.
With implementation of programmes hike in Minimum Support Prices (MSP), One Rank, One Pension (OROP), Seventh Pay Commission and Direct Benefit Transfer, India’s consumption in general is likely to see major push, resulting acceleration in the GDP growth. The expectations of revival in the Rural consumption is also likely to push the overall economic growth. However, this hinges upon the favourable monsoon as it is likely to push the sales of discretionary and non-discretionary products and services in Rural areas. In addition, it could ease the government’s burden of spending on welfare schemes to drive the growth and improve standard of living in Rural areas. Higher MSP is also another trigger which can lead to improvement in the rural demand.
0.0
1.0
2.0
3.0
4.0
5.0
6.0
7.0
FY11 FY12 FY13 FY14 FY15 FY16
Fig
uers
in
%
Twin deficit under control
Current Account Deficit (% of GDP) Fiscal Deficit (% of GDP)
Source: RBI, CAG
-6
-4
-2
0
2
4
6
8
10
May
-14
Jul-
14
Sep
-14
No
v-1
4
Jan
-15
Mar
-15
May
-15
Jul-
15
Sep
-15
No
v-1
5
Jan
-16
Mar
-16
May
-16
Inflation at lower level
WPI (%) CPI (%)Source: Bloomberg
-5.00
0.00
5.00
10.00
15.00
20.00
25.00
Ap
r-08
Oct
-08
Ap
r-09
Oct
-09
Ap
r-10
Oct
-10
Ap
r-11
Oct
-11
Ap
r-12
Oct
-12
Ap
r-13
Oct
-13
Ap
r-14
Oct
-14
Ap
r-15
Oct
-15
Ap
r-16
% Growth in Personal and Housing loan (YoY)
Personal Loans Housing (Including Priority Sector Housing)
Source: RBI
0.0
5.0
10.0
15.0
20.0
25.0
30.0
35.0
Jan
-14
Mar
-14
May
-14
Jun
-14
Jul-
14
Sep
-14
Oct
-14
De
c-1
4
Jan
-15
Mar
-15
Ap
r-1
5
Jun
-15
Jul-
15
Sep
-15
Oct
-15
De
c-1
5
Jan
-16
Mar
-16
Ap
r-1
6
Domestic Airline Passenger Growth (YoY %)
Source: DGCA

While the industrial growth in the economy seems to be lagging a bit on the topline front, the bottomline of many companies have started to improve led by better gross margins and higher utilizations. The Reserve Bank’s latest rounds of forward looking surveys indicate an improvement in the overall business situation, driven by a pick-up in capacity utilization and in order books – both domestic and external. These developments have improved the expectation of business conditions in the first half of 2016-17. However, Private sector capex continues to remain work in progress (key reason for volatile IIP) and would be stimulated by increased government capex, in our opinion.
Government expenditure is continues to be an area which has shown considerable traction. Public investment, especially in roads and railways, is gaining strength, though the continuing weakness in private investment is of concern. While NHAI (National Highways Authority of India) is planning to develop road projects spanning 50,000 kilometers (km) and entailing investments of about $250 bn over the next five to six years, the Union Road Transport, Highways and Shipping Minister Nitin Gadkari has also emphasized on building 40 km of roads per day. The Indian Railways is looking at a capex of Rs 1.21 trillion for FY17, higher by 21% YoY. According to media reports, hiring activity in the construction equipment manufacturing industry is picking up after a three-year slowdown which impacted the industry's performance, hinting at capex recovery, or at least expectations of a capex recovery. Cement consumption data also is pointing towards incremental pickup in construction and infrastructure activity.
However, Exports are one area which continues to be of concern, as they are dependent on overall global growth, which seems to be taking its own time to revive. However, currency depreciation has been helping the exporters in the interim, to maintain their competitiveness.
Reforms have been incremental but effective and execution has been near perfect.
While the government has not brought in any big bang reforms (Goods and Service Tax (GST) can be one, but its work in progress) there has been a lot of incremental reforms and very innovative ideas from the new government. However, the execution on the new reforms and ideas has been near perfect. The Pradhanmantri Jan-Dhan yojna was one such idea which the government came out with to create a backbone for its many other welfare programs. In a very short span the total number of accounts opened has reached to 220.8 mn, with a total balance of Rs 385 bn.
There were also many other reforms, announcements and bills passed, including: 1) Make in India; 2) Large infrastructure projects like Dedicated Freight corridors, River Linking project, Metros, the Smart Cities Mission, Atal Mission for Rejuvenation and Urban Transformation (AMRUT) and Housing for All; 3) Digital India; 4) Agriculture reforms like Restructuring Food Corporation of India, Agriculture Produce Marketing Corporation reforms, Soil health cards, Farmer insurance, proposal for National Irrigation scheme, Easing supply side bottle necks; 5) Swach Bharat; 6) Direct Benefit Transfer of government subsidies to the end user; 7) Ease of doing business; 8) Indradhanush for revival of PSU Banks; 8) Gold Monetization; 9) UDAY (Ujwal DISCOM Assurance Yojana) for financial turnaround of Power Distribution Companies- to benefit the entire power chain; 10) ‘Rurban Mission’ for developing 300 villages as urban growth centres and 11) Key bills like Insolvency and Bankruptcy Code Bill 2016, Real Estate (Regulation and Development) Bill, Aadhaar (Targeted Delivery of Financial and Other Subsidies, Benefits and Services) Bill, 2016 and Mines and Minerals (Development and Regulation) (Amendment) Bill, 2016 getting cleared. The government has also given strong emphasis on clearing the stuck projects to further kick-start
1,050
1,422
-
200
400
600
800
1,000
1,200
1,400
1,600
Actuals 14-15 Budget Est 15-16
(Rs
in B
n)
Increase in Planned Capital Expenditure
Source: Union Budget Document, cga.nic.in
-40.0
-30.0
-20.0
-10.0
0.0
10.0
20.0
30.0
40.0
-12.0
-7.0
-2.0
3.0
8.0
13.0
H1
FY1
4
H2
FY1
4
H1
FY1
5
H2
FY1
5
H1
FY1
6
H2
FY1
6
Pick up in Passenger Car and MHCV
Passenger Cars MHCVSource: Bloomberg
economic growth, with many large projects being monitored directly the Prime Minister’s office (PMO) level.
The initial two years of the current government seems to be focused on ease of doing business, cutting out corruption, maintaining fiscal prudence, cutting leakages in the system and reducing avenues for generation of black money. We think that as the key pillars of these get in place, the government could look to suitably stimulate the economy by relevant policy measures.
Also, the Reserve Bank of India (RBI) has been very supportive of growth and is maintaining a very accommodative monetary policy stance, though it has taken a tough stand on the NPA issues of the bank. The RBI has cut its Repo rates by 125 bps since January 2015 to 6.5%, lowest in last six years. Also it’s now focusing on ways to push the banking system to pass on these cuts completely into the system (though a major portion has already been passed on) to stimulate demand. To improve the liquidity in the system the RBI has already conducted Open Market Operations (OMO) purchases to the tune of Rs 700 bn.
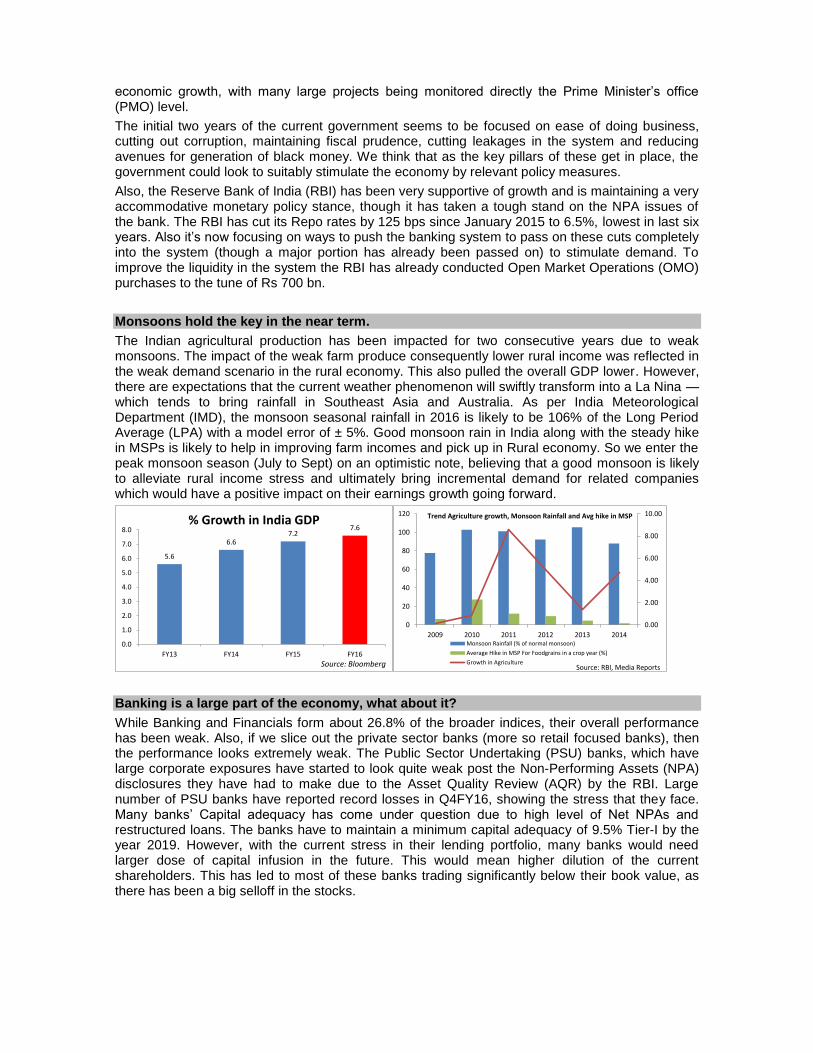
Monsoons hold the key in the near term.
The Indian agricultural production has been impacted for two consecutive years due to weak monsoons. The impact of the weak farm produce consequently lower rural income was reflected in the weak demand scenario in the rural economy. This also pulled the overall GDP lower. However, there are expectations that the current weather phenomenon will swiftly transform into a La Nina — which tends to bring rainfall in Southeast Asia and Australia. As per India Meteorological Department (IMD), the monsoon seasonal rainfall in 2016 is likely to be 106% of the Long Period Average (LPA) with a model error of ± 5%. Good monsoon rain in India along with the steady hike in MSPs is likely to help in improving farm incomes and pick up in Rural economy. So we enter the peak monsoon season (July to Sept) on an optimistic note, believing that a good monsoon is likely to alleviate rural income stress and ultimately bring incremental demand for related companies which would have a positive impact on their earnings growth going forward.
Banking is a large part of the economy, what about it?
While Banking and Financials form about 26.8% of the broader indices, their overall performance has been weak. Also, if we slice out the private sector banks (more so retail focused banks), then the performance looks extremely weak. The Public Sector Undertaking (PSU) banks, which have large corporate exposures have started to look quite weak post the Non-Performing Assets (NPA) disclosures they have had to make due to the Asset Quality Review (AQR) by the RBI. Large number of PSU banks have reported record losses in Q4FY16, showing the stress that they face. Many banks’ Capital adequacy has come under question due to high level of Net NPAs and restructured loans. The banks have to maintain a minimum capital adequacy of 9.5% Tier-I by the year 2019. However, with the current stress in their lending portfolio, many banks would need larger dose of capital infusion in the future. This would mean higher dilution of the current shareholders. This has led to most of these banks trading significantly below their book value, as there has been a big selloff in the stocks.
5.6
6.67.2
7.6
0.0
1.0
2.0
3.0
4.0
5.0
6.0
7.0
8.0
FY13 FY14 FY15 FY16
% Growth in India GDP
Source: Bloomberg
0.00
2.00
4.00
6.00
8.00
10.00
0
20
40
60
80
100
120
2009 2010 2011 2012 2013 2014
Trend Agriculture growth, Monsoon Rainfall and Avg hike in MSP
Monsoon Rainfall (% of normal monsoon)
Average Hike in MSP For Foodgrains in a crop year (%)
Growth in AgricultureSource: RBI, Media Reports

As of end FY 2016 GNPA NNPA
Bank Rs bn (%) Rs bn (%)
Allhabad Bank 154 10% 103 7%
Andhra Bank 114 8% 60 5%
Bank of Baroda 405 10% 194 5%
Bank of India 499 13% 280 8%
Canara Bank 316 9% 208 6%
Punjab National Bank 558 13% 354 9%
State Bank of India 982 7% 558 4%
Union Bank of India 242 9% 140 5%
Source: BSE, Companies, Capitaline
While, the sectors which have contributed to the stress in the banks’ balance sheet are themselves under a lot of pressure due to issues related to global macro (impacting Metals, Gems & Jewellery) and legacy issues like environmental clearances, legal concerns (impacting Infrastructure and Construction) etc, that alone may not be the reason for the pressure on the banks. The general decline in the profits for a large number of the corporates also meant that the banking system was under pressure. Many individual companies built huge leverage which they were not able to service as the economic cycle turned and thus they and their overall eco-system got impacted. Also, the focus of the central bank that the problematic NPAs need to be taken head on rather than being pushed down the line has led to the rise in the Provisioning requirement of the banks and has led to weaker profitability. This is a move which may be negative in the short term, but would help banks clean up their balance sheets so that they are ready to fully participate/lead the next economic upcycle.
As the half yearly results are showing that the corporate earnings growth is gradually coming back, we think that incremental NPA accretion for most of the corporate lenders could be lower. Also, with so much scrutiny by the RBI and the government would make most of the banks tighten their credit standards and that could also result in lower incremental NPA formation. However, in the current scenario banks with more granular exposure and tighter credit standards are likely to continue to deliver better quality earnings, while the stressed banks could consolidate their balance sheet and focus on recoveries. This means that on an overall basis the earnings growth from the Banking sector may continue to be a drag on the overall earnings growth for the S&P BSE 500 companies. Moreover the policy actions taken by the government like the clearance of the Insolvency and Bankruptcy Bill, Indradhanush (Plan for revival of PSU Banks) are all aimed to improve the structures of the banking system and make it less vulnerable to the economic shocks.
Overall View: The earnings growth in the H2FY16 has been strong, led primarily by the strong growth in Q4FY16. While this could signal an end to the earnings downgrade cycle, consistency in this earnings growth and further broad basing of it is required in the ensuing quarters. In the near term, Monsoons, which are predicted to be above normal, is showing signs of weakness; and any further weakness may lead to sharp volatility in the markets as expectation of rural revival would be impacted negatively. There are many other near term issues that the equity market would have to grapple with including issues related to Brexit, US Fed rate hikes, slow/no growth in EU etc. Nevertheless, the relative strength of Indian economy, strong reform and execution focused government and improving dynamics of key segments of Indian economy gives us a hope that the corporate earnings cycle might start to see incremental uptick and the earnings downgrades that we have witnessed in the past may be coming to an end. We are recommending Investors to use any volatility coming in the markets due to near term concerns and should look to increase/add exposure in the cyclical stocks like Bajaj Auto, Birla Corporation, Grasim, L&T, M&M, NTPC, ONGC, Reliance Industries, Sanghi Industries, SBI, Tata Motors and Bank Bees as a proxy to banking sector.
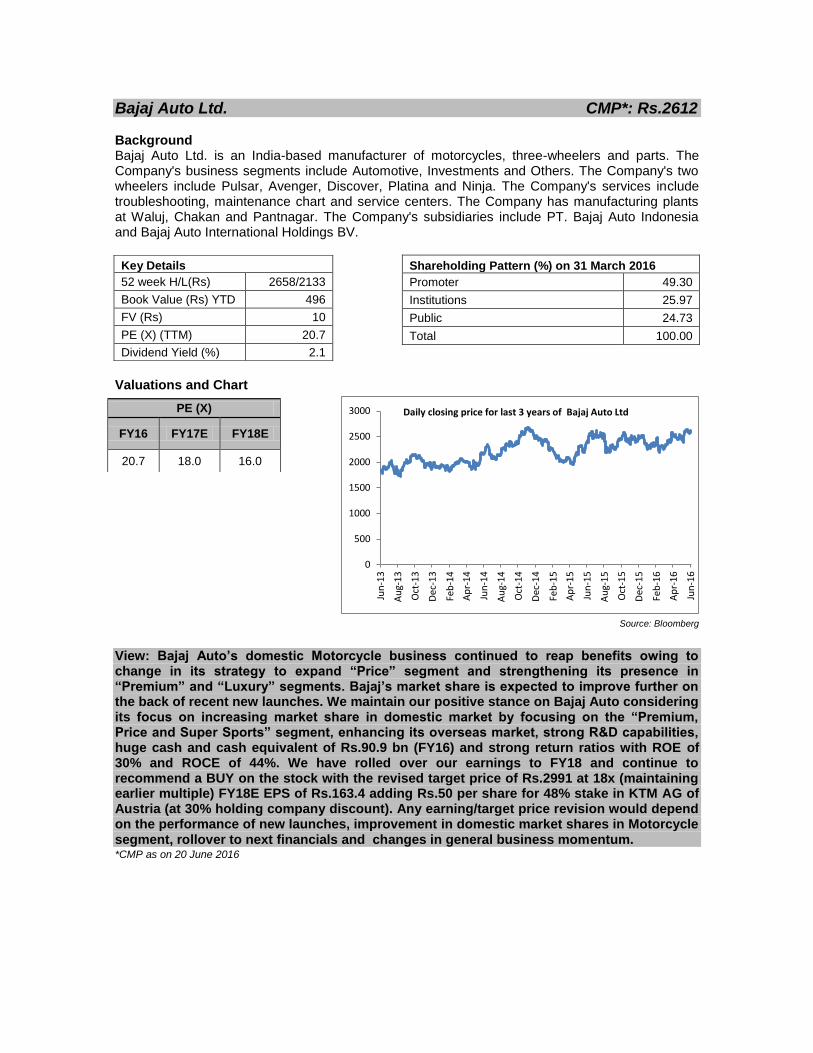
Bajaj Auto Ltd. CMP*: Rs.2612 Background Bajaj Auto Ltd. is an India-based manufacturer of motorcycles, three-wheelers and parts. The Company's business segments include Automotive, Investments and Others. The Company's two wheelers include Pulsar, Avenger, Discover, Platina and Ninja. The Company's services include troubleshooting, maintenance chart and service centers. The Company has manufacturing plants at Waluj, Chakan and Pantnagar. The Company's subsidiaries include PT. Bajaj Auto Indonesia and Bajaj Auto International Holdings BV.
Shareholding Pattern (%) on 31 March 2016
Promoter 49.30
Institutions 25.97
Public 24.73
Total 100.00
Valuations and Chart
Source: Bloomberg
View: Bajaj Auto’s domestic Motorcycle business continued to reap benefits owing to change in its strategy to expand “Price” segment and strengthening its presence in “Premium” and “Luxury” segments. Bajaj’s market share is expected to improve further on the back of recent new launches. We maintain our positive stance on Bajaj Auto considering its focus on increasing market share in domestic market by focusing on the “Premium, Price and Super Sports” segment, enhancing its overseas market, strong R&D capabilities, huge cash and cash equivalent of Rs.90.9 bn (FY16) and strong return ratios with ROE of 30% and ROCE of 44%. We have rolled over our earnings to FY18 and continue to recommend a BUY on the stock with the revised target price of Rs.2991 at 18x (maintaining earlier multiple) FY18E EPS of Rs.163.4 adding Rs.50 per share for 48% stake in KTM AG of Austria (at 30% holding company discount). Any earning/target price revision would depend on the performance of new launches, improvement in domestic market shares in Motorcycle segment, rollover to next financials and changes in general business momentum. *CMP as on 20 June 2016
0
500
1000
1500
2000
2500
3000
Jun
-13
Au
g-1
3
Oct
-13
Dec
-13
Feb
-14
Ap
r-1
4
Jun
-14
Au
g-1
4
Oct
-14
Dec
-14
Feb
-15
Ap
r-1
5
Jun
-15
Au
g-1
5
Oct
-15
Dec
-15
Feb
-16
Ap
r-1
6
Jun
-16
Daily closing price for last 3 years of Bajaj Auto Ltd
Key Details
52 week H/L(Rs) 2658/2133
Book Value (Rs) YTD 496
FV (Rs) 10
PE (X) (TTM) 20.7
Dividend Yield (%) 2.1
PE (X)
FY16 FY17E FY18E
20.7 18.0 16.0
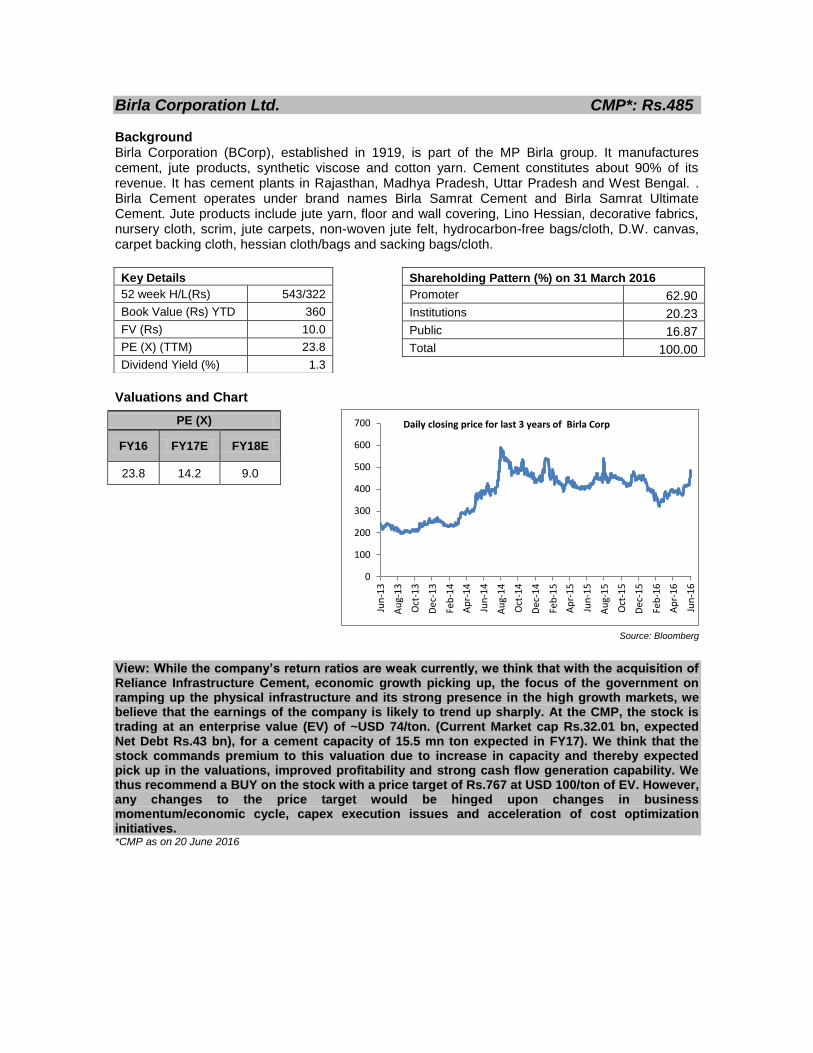
Birla Corporation Ltd. CMP*: Rs.485 Background Birla Corporation (BCorp), established in 1919, is part of the MP Birla group. It manufactures cement, jute products, synthetic viscose and cotton yarn. Cement constitutes about 90% of its revenue. It has cement plants in Rajasthan, Madhya Pradesh, Uttar Pradesh and West Bengal. . Birla Cement operates under brand names Birla Samrat Cement and Birla Samrat Ultimate Cement. Jute products include jute yarn, floor and wall covering, Lino Hessian, decorative fabrics, nursery cloth, scrim, jute carpets, non-woven jute felt, hydrocarbon-free bags/cloth, D.W. canvas, carpet backing cloth, hessian cloth/bags and sacking bags/cloth.
Shareholding Pattern (%) on 31 March 2016
Promoter 62.90
Institutions 20.23
Public 16.87
Total 100.00
Valuations and Chart
Source: Bloomberg
View: While the company’s return ratios are weak currently, we think that with the acquisition of Reliance Infrastructure Cement, economic growth picking up, the focus of the government on ramping up the physical infrastructure and its strong presence in the high growth markets, we believe that the earnings of the company is likely to trend up sharply. At the CMP, the stock is trading at an enterprise value (EV) of ~USD 74/ton. (Current Market cap Rs.32.01 bn, expected Net Debt Rs.43 bn), for a cement capacity of 15.5 mn ton expected in FY17). We think that the stock commands premium to this valuation due to increase in capacity and thereby expected pick up in the valuations, improved profitability and strong cash flow generation capability. We thus recommend a BUY on the stock with a price target of Rs.767 at USD 100/ton of EV. However, any changes to the price target would be hinged upon changes in business momentum/economic cycle, capex execution issues and acceleration of cost optimization initiatives. *CMP as on 20 June 2016
0
100
200
300
400
500
600
700
Jun
-13
Au
g-1
3
Oct
-13
Dec
-13
Feb
-14
Ap
r-1
4
Jun
-14
Au
g-1
4
Oct
-14
Dec
-14
Feb
-15
Ap
r-1
5
Jun
-15
Au
g-1
5
Oct
-15
Dec
-15
Feb
-16
Ap
r-1
6
Jun
-16
Daily closing price for last 3 years of Birla Corp
Key Details
52 week H/L(Rs) 543/322
Book Value (Rs) YTD 360
FV (Rs) 10.0
PE (X) (TTM) 23.8
Dividend Yield (%) 1.3
PE (X)
FY16 FY17E FY18E
23.8 14.2 9.0
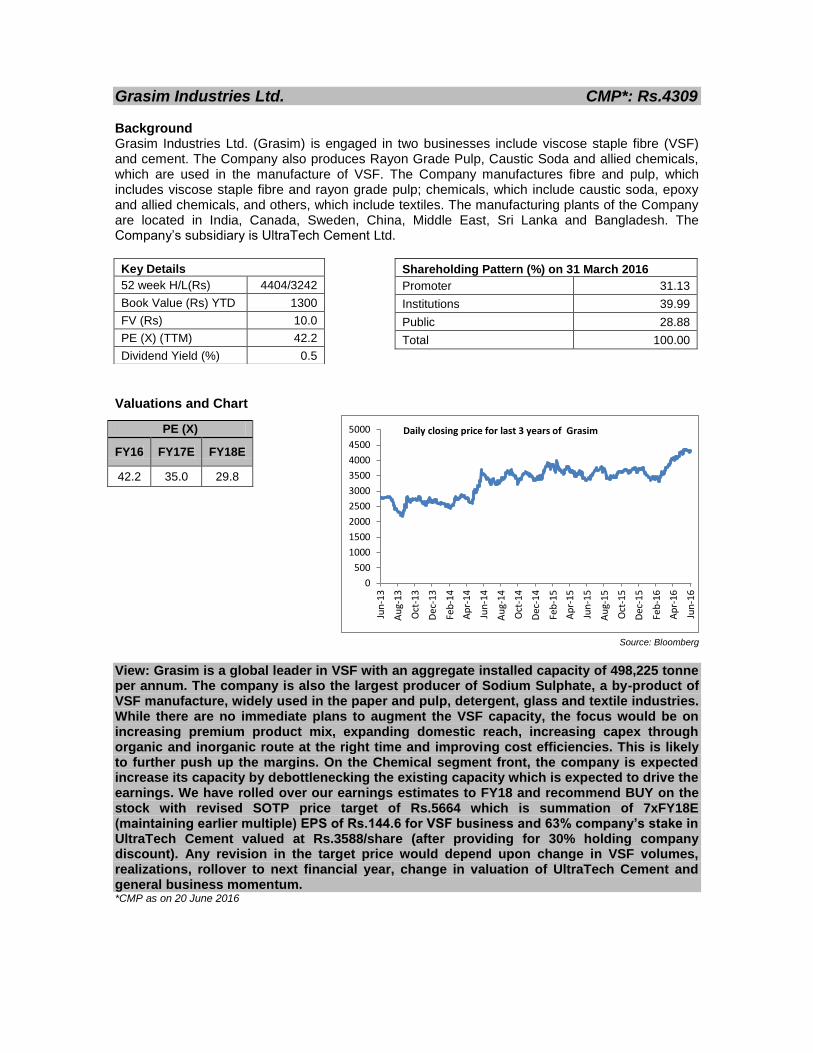
Grasim Industries Ltd. CMP*: Rs.4309 Background Grasim Industries Ltd. (Grasim) is engaged in two businesses include viscose staple fibre (VSF) and cement. The Company also produces Rayon Grade Pulp, Caustic Soda and allied chemicals, which are used in the manufacture of VSF. The Company manufactures fibre and pulp, which includes viscose staple fibre and rayon grade pulp; chemicals, which include caustic soda, epoxy and allied chemicals, and others, which include textiles. The manufacturing plants of the Company are located in India, Canada, Sweden, China, Middle East, Sri Lanka and Bangladesh. The Company’s subsidiary is UltraTech Cement Ltd.
Shareholding Pattern (%) on 31 March 2016
Promoter 31.13
Institutions 39.99
Public 28.88
Total 100.00
Valuations and Chart
Source: Bloomberg
View: Grasim is a global leader in VSF with an aggregate installed capacity of 498,225 tonne per annum. The company is also the largest producer of Sodium Sulphate, a by-product of VSF manufacture, widely used in the paper and pulp, detergent, glass and textile industries. While there are no immediate plans to augment the VSF capacity, the focus would be on increasing premium product mix, expanding domestic reach, increasing capex through organic and inorganic route at the right time and improving cost efficiencies. This is likely to further push up the margins. On the Chemical segment front, the company is expected increase its capacity by debottlenecking the existing capacity which is expected to drive the earnings. We have rolled over our earnings estimates to FY18 and recommend BUY on the stock with revised SOTP price target of Rs.5664 which is summation of 7xFY18E (maintaining earlier multiple) EPS of Rs.144.6 for VSF business and 63% company’s stake in UltraTech Cement valued at Rs.3588/share (after providing for 30% holding company discount). Any revision in the target price would depend upon change in VSF volumes, realizations, rollover to next financial year, change in valuation of UltraTech Cement and general business momentum. *CMP as on 20 June 2016
0
500
1000
1500
2000
2500
3000
3500
4000
4500
5000
Jun
-13
Au
g-1
3
Oct
-13
Dec
-13
Feb
-14
Ap
r-1
4
Jun
-14
Au
g-1
4
Oct
-14
Dec
-14
Feb
-15
Ap
r-1
5
Jun
-15
Au
g-1
5
Oct
-15
Dec
-15
Feb
-16
Ap
r-1
6
Jun
-16
Daily closing price for last 3 years of Grasim
Key Details
52 week H/L(Rs) 4404/3242
Book Value (Rs) YTD 1300
FV (Rs) 10.0
PE (X) (TTM) 42.2
Dividend Yield (%) 0.5
PE (X)
FY16 FY17E FY18E
42.2 35.0 29.8
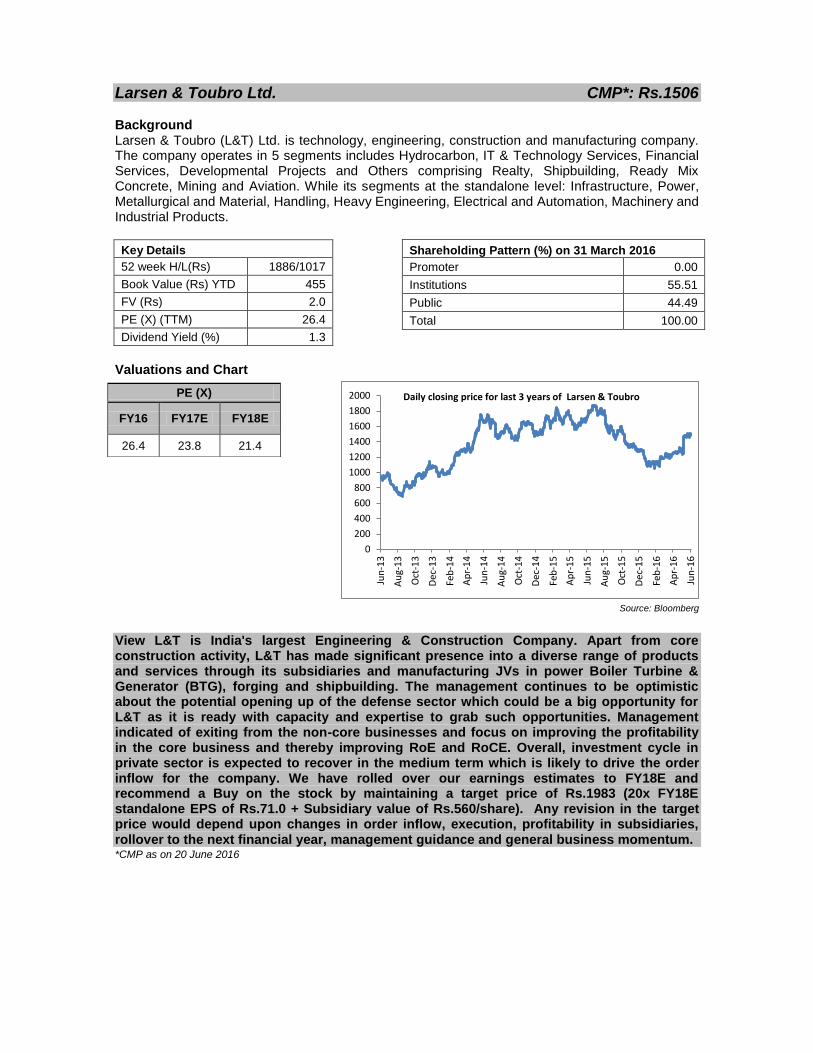
Larsen & Toubro Ltd. CMP*: Rs.1506 Background Larsen & Toubro (L&T) Ltd. is technology, engineering, construction and manufacturing company. The company operates in 5 segments includes Hydrocarbon, IT & Technology Services, Financial Services, Developmental Projects and Others comprising Realty, Shipbuilding, Ready Mix Concrete, Mining and Aviation. While its segments at the standalone level: Infrastructure, Power, Metallurgical and Material, Handling, Heavy Engineering, Electrical and Automation, Machinery and Industrial Products.
Shareholding Pattern (%) on 31 March 2016
Promoter 0.00
Institutions 55.51
Public 44.49
Total 100.00
Valuations and Chart
Source: Bloomberg
View L&T is India's largest Engineering & Construction Company. Apart from core construction activity, L&T has made significant presence into a diverse range of products and services through its subsidiaries and manufacturing JVs in power Boiler Turbine & Generator (BTG), forging and shipbuilding. The management continues to be optimistic about the potential opening up of the defense sector which could be a big opportunity for L&T as it is ready with capacity and expertise to grab such opportunities. Management indicated of exiting from the non-core businesses and focus on improving the profitability in the core business and thereby improving RoE and RoCE. Overall, investment cycle in private sector is expected to recover in the medium term which is likely to drive the order inflow for the company. We have rolled over our earnings estimates to FY18E and recommend a Buy on the stock by maintaining a target price of Rs.1983 (20x FY18E standalone EPS of Rs.71.0 + Subsidiary value of Rs.560/share). Any revision in the target price would depend upon changes in order inflow, execution, profitability in subsidiaries, rollover to the next financial year, management guidance and general business momentum. *CMP as on 20 June 2016
0
200
400
600
800
1000
1200
1400
1600
1800
2000
Jun
-13
Au
g-1
3
Oct
-13
Dec
-13
Feb
-14
Ap
r-1
4
Jun
-14
Au
g-1
4
Oct
-14
Dec
-14
Feb
-15
Ap
r-1
5
Jun
-15
Au
g-1
5
Oct
-15
Dec
-15
Feb
-16
Ap
r-1
6
Jun
-16
Daily closing price for last 3 years of Larsen & Toubro
Key Details
52 week H/L(Rs) 1886/1017
Book Value (Rs) YTD 455
FV (Rs) 2.0
PE (X) (TTM) 26.4
Dividend Yield (%) 1.3
PE (X)
FY16 FY17E FY18E
26.4 23.8 21.4
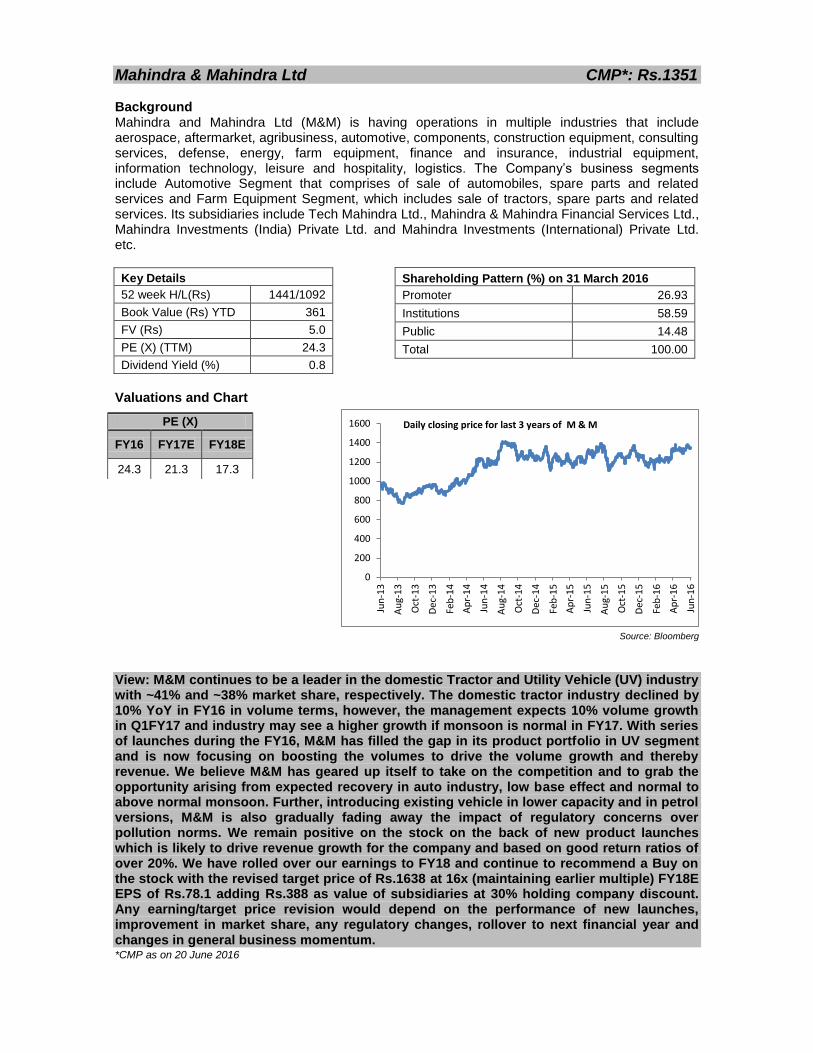
Mahindra & Mahindra Ltd CMP*: Rs.1351 Background Mahindra and Mahindra Ltd (M&M) is having operations in multiple industries that include aerospace, aftermarket, agribusiness, automotive, components, construction equipment, consulting services, defense, energy, farm equipment, finance and insurance, industrial equipment, information technology, leisure and hospitality, logistics. The Company’s business segments include Automotive Segment that comprises of sale of automobiles, spare parts and related services and Farm Equipment Segment, which includes sale of tractors, spare parts and related services. Its subsidiaries include Tech Mahindra Ltd., Mahindra & Mahindra Financial Services Ltd., Mahindra Investments (India) Private Ltd. and Mahindra Investments (International) Private Ltd. etc.
Shareholding Pattern (%) on 31 March 2016
Promoter 26.93
Institutions 58.59
Public 14.48
Total 100.00
Valuations and Chart
Source: Bloomberg
View: M&M continues to be a leader in the domestic Tractor and Utility Vehicle (UV) industry with ~41% and ~38% market share, respectively. The domestic tractor industry declined by 10% YoY in FY16 in volume terms, however, the management expects 10% volume growth in Q1FY17 and industry may see a higher growth if monsoon is normal in FY17. With series of launches during the FY16, M&M has filled the gap in its product portfolio in UV segment and is now focusing on boosting the volumes to drive the volume growth and thereby revenue. We believe M&M has geared up itself to take on the competition and to grab the opportunity arising from expected recovery in auto industry, low base effect and normal to above normal monsoon. Further, introducing existing vehicle in lower capacity and in petrol versions, M&M is also gradually fading away the impact of regulatory concerns over pollution norms. We remain positive on the stock on the back of new product launches which is likely to drive revenue growth for the company and based on good return ratios of over 20%. We have rolled over our earnings to FY18 and continue to recommend a Buy on the stock with the revised target price of Rs.1638 at 16x (maintaining earlier multiple) FY18E EPS of Rs.78.1 adding Rs.388 as value of subsidiaries at 30% holding company discount. Any earning/target price revision would depend on the performance of new launches, improvement in market share, any regulatory changes, rollover to next financial year and changes in general business momentum. *CMP as on 20 June 2016
0
200
400
600
800
1000
1200
1400
1600
Jun
-13
Au
g-1
3
Oct
-13
Dec
-13
Feb
-14
Ap
r-1
4
Jun
-14
Au
g-1
4
Oct
-14
Dec
-14
Feb
-15
Ap
r-1
5
Jun
-15
Au
g-1
5
Oct
-15
Dec
-15
Feb
-16
Ap
r-1
6
Jun
-16
Daily closing price for last 3 years of M & M
Key Details
52 week H/L(Rs) 1441/1092
Book Value (Rs) YTD 361
FV (Rs) 5.0
PE (X) (TTM) 24.3
Dividend Yield (%) 0.8
PE (X)
FY16 FY17E FY18E
24.3 21.3 17.3
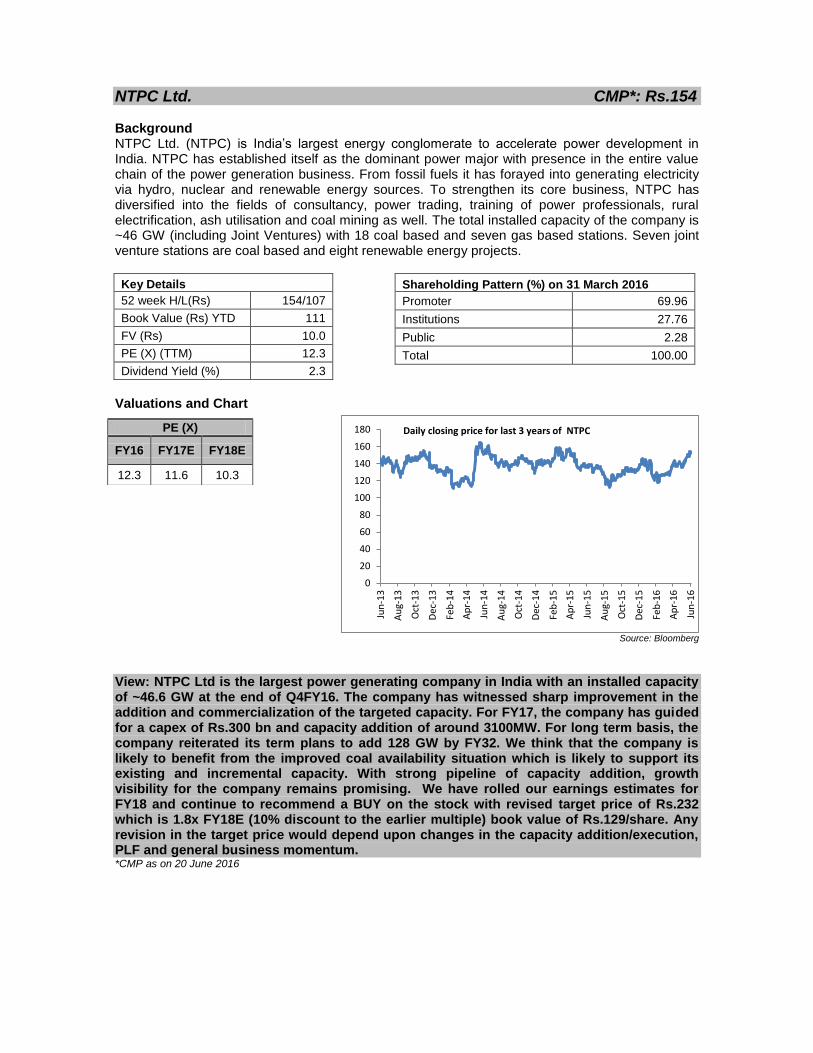
NTPC Ltd. CMP*: Rs.154 Background NTPC Ltd. (NTPC) is India’s largest energy conglomerate to accelerate power development in India. NTPC has established itself as the dominant power major with presence in the entire value chain of the power generation business. From fossil fuels it has forayed into generating electricity via hydro, nuclear and renewable energy sources. To strengthen its core business, NTPC has diversified into the fields of consultancy, power trading, training of power professionals, rural electrification, ash utilisation and coal mining as well. The total installed capacity of the company is ~46 GW (including Joint Ventures) with 18 coal based and seven gas based stations. Seven joint venture stations are coal based and eight renewable energy projects.
Shareholding Pattern (%) on 31 March 2016
Promoter 69.96
Institutions 27.76
Public 2.28
Total 100.00
Valuations and Chart
Source: Bloomberg
View: NTPC Ltd is the largest power generating company in India with an installed capacity of ~46.6 GW at the end of Q4FY16. The company has witnessed sharp improvement in the addition and commercialization of the targeted capacity. For FY17, the company has guided for a capex of Rs.300 bn and capacity addition of around 3100MW. For long term basis, the company reiterated its term plans to add 128 GW by FY32. We think that the company is likely to benefit from the improved coal availability situation which is likely to support its existing and incremental capacity. With strong pipeline of capacity addition, growth visibility for the company remains promising. We have rolled our earnings estimates for FY18 and continue to recommend a BUY on the stock with revised target price of Rs.232 which is 1.8x FY18E (10% discount to the earlier multiple) book value of Rs.129/share. Any revision in the target price would depend upon changes in the capacity addition/execution, PLF and general business momentum. *CMP as on 20 June 2016
0
20
40
60
80
100
120
140
160
180
Jun
-13
Au
g-1
3
Oct
-13
Dec
-13
Feb
-14
Ap
r-1
4
Jun
-14
Au
g-1
4
Oct
-14
Dec
-14
Feb
-15
Ap
r-1
5
Jun
-15
Au
g-1
5
Oct
-15
Dec
-15
Feb
-16
Ap
r-1
6
Jun
-16
Daily closing price for last 3 years of NTPC
Key Details
52 week H/L(Rs) 154/107
Book Value (Rs) YTD 111
FV (Rs) 10.0
PE (X) (TTM) 12.3
Dividend Yield (%) 2.3
PE (X)
FY16 FY17E FY18E
12.3 11.6 10.3

Oil and Natural Gas Corporation Ltd. CMP*: Rs.214 Background Oil and Natural Gas Corporation Ltd. (ONGC) is an oil exploration and production company. The Company is the producer of crude oil and natural gas in India. The company has organized into the geographical and business segments. The geographical segment includes operations in two categories: In India, which include onshore and offshore, and outside India. The business segment includes exploration & production and refining activities. The Company’s wholly owned subsidiaries include ONGC Videsh Ltd. and Mangalore Refinery and Petrochemicals Ltd. (MRPL).
Shareholding Pattern (%) on 31 March 2016
Promoter 68.93
Institutions 17.45
Public 13.62
Total 100.00
Valuations and Chart
Source: Bloomberg
View: While the earnings for FY16 were impacted due to fall in the crude oil prices. The recent reversal in the crude oil prices has led to recovery in the profitability. Any further rise in the crude oil prices is expected to push the profitability higher. ONGC’s large size in the oil & gas space, strong balance sheet (net cash), steady cash flows and consistent dividend payment track record gives us the comfort. There are discussions of reducing the oil cess from 20% to 10% which is also a near term trigger for the company. We have rolled our earnings estimates for FY18 and recommend Buy on the stock with price target of Rs.303 which is 11xFY18E (maintaining earlier multiple) EPS of Rs.27.5. Any revision in the earnings/target price would depend upon change in the international crude oil prices, subsidy share, general business momentum and rollover to next financial year. *CMP as on 20 June 2016
0
50
100
150
200
250
300
350
400
450
500
Jun
-13
Au
g-1
3
Oct
-13
Dec
-13
Feb
-14
Ap
r-1
4
Jun
-14
Au
g-1
4
Oct
-14
Dec
-14
Feb
-15
Ap
r-1
5
Jun
-15
Au
g-1
5
Oct
-15
Dec
-15
Feb
-16
Ap
r-1
6
Jun
-16
Daily closing price for last 3 years of ONGC
Key Details
52 week H/L(Rs) 323/188
Book Value (Rs) YTD 179
FV (Rs) 5.0
PE (X) (TTM) 13.0
Dividend Yield (%) 4.0
PE (X)
FY16 FY17E FY18E
13.0 9.6 7.8
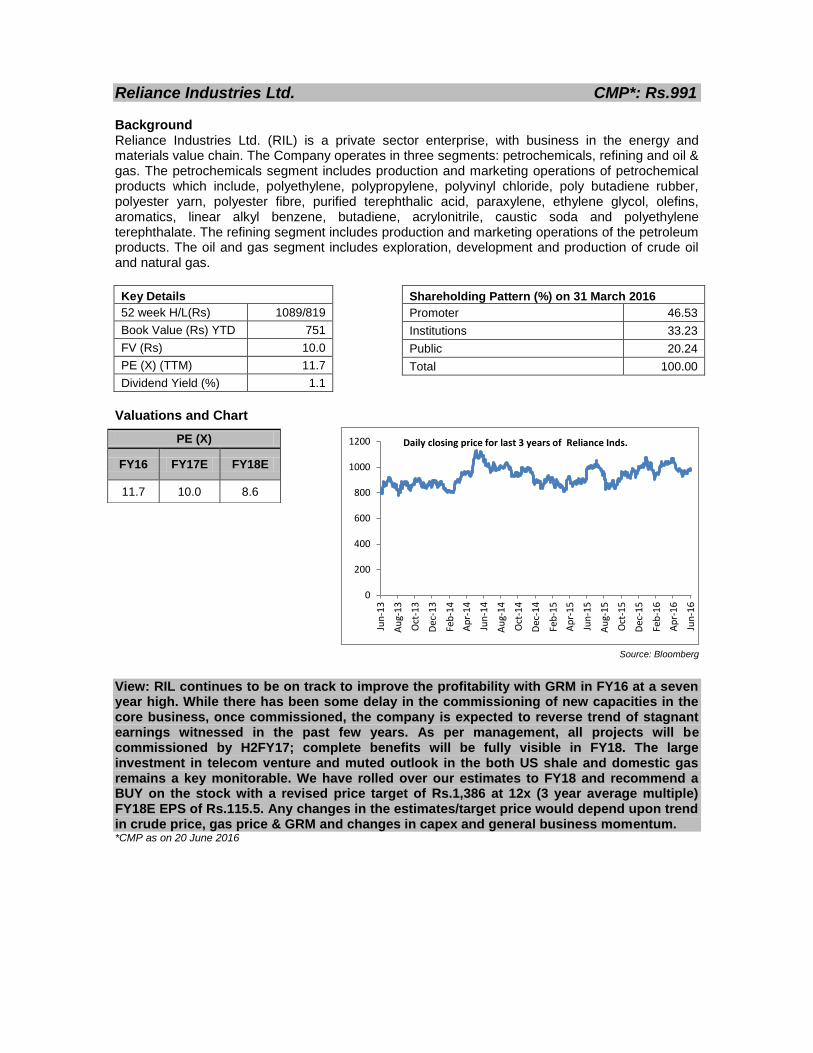
Reliance Industries Ltd. CMP*: Rs.991 Background Reliance Industries Ltd. (RIL) is a private sector enterprise, with business in the energy and materials value chain. The Company operates in three segments: petrochemicals, refining and oil & gas. The petrochemicals segment includes production and marketing operations of petrochemical products which include, polyethylene, polypropylene, polyvinyl chloride, poly butadiene rubber, polyester yarn, polyester fibre, purified terephthalic acid, paraxylene, ethylene glycol, olefins, aromatics, linear alkyl benzene, butadiene, acrylonitrile, caustic soda and polyethylene terephthalate. The refining segment includes production and marketing operations of the petroleum products. The oil and gas segment includes exploration, development and production of crude oil and natural gas.
Shareholding Pattern (%) on 31 March 2016
Promoter 46.53
Institutions 33.23
Public 20.24
Total 100.00
Valuations and Chart
Source: Bloomberg
View: RIL continues to be on track to improve the profitability with GRM in FY16 at a seven year high. While there has been some delay in the commissioning of new capacities in the core business, once commissioned, the company is expected to reverse trend of stagnant earnings witnessed in the past few years. As per management, all projects will be commissioned by H2FY17; complete benefits will be fully visible in FY18. The large investment in telecom venture and muted outlook in the both US shale and domestic gas remains a key monitorable. We have rolled over our estimates to FY18 and recommend a BUY on the stock with a revised price target of Rs.1,386 at 12x (3 year average multiple) FY18E EPS of Rs.115.5. Any changes in the estimates/target price would depend upon trend in crude price, gas price & GRM and changes in capex and general business momentum. *CMP as on 20 June 2016
0
200
400
600
800
1000
1200
Jun
-13
Au
g-1
3
Oct
-13
Dec
-13
Feb
-14
Ap
r-1
4
Jun
-14
Au
g-1
4
Oct
-14
Dec
-14
Feb
-15
Ap
r-1
5
Jun
-15
Au
g-1
5
Oct
-15
Dec
-15
Feb
-16
Ap
r-1
6
Jun
-16
Daily closing price for last 3 years of Reliance Inds.
Key Details
52 week H/L(Rs) 1089/819
Book Value (Rs) YTD 751
FV (Rs) 10.0
PE (X) (TTM) 11.7
Dividend Yield (%) 1.1
PE (X)
FY16 FY17E FY18E
11.7 10.0 8.6

Sanghi Industries Ltd. CMP*: Rs.71 Background Sanghi Industries Ltd. (Sanghi) is the flagship company of the Ravi Sanghi Group dealing in the production and distribution of Cement under the Brand Name "Sanghi Cement". Sanghi Cement is produced at one of the world's largest single stream Cement Plant located at Sanghipuram in the Abdasa Taluka of Kutch District of Gujarat State. This plant is fully automatic with state-of-the-art technology from Fuller International, USA and having total capacity of 4.0 MTPA. The company produces superior quality 53 Grade OPC and PPC Cement and have revolutionized the way cement is produced and sold in India.
Shareholding Pattern (%) on 31 March 2016
Promoter 68.71
Institutions 6.39
Public 24.90
Total 100.00
Valuations and Chart
Source: Bloomberg
View: Management indicated that Cement prices recovered in the second half of Q3FY16, and have largely remained stable. This will likely result in higher cement realizations going ahead. Sanghi’s profitability is in line with the large cement players. We expect profitability to improve post pick up in the voumes. The company has planned to use pet-coke as a key fuel aggressively which is likley to result in further improvement in the margin. We continue to recommend a BUY on the stock with a price target of Rs.94 at USD 130/ton (maintaining earlier multiple) of EV. Any changes to the earnings/price target would be hinged upon changes in business momentum/economic cycle, capex execution issues and acceleration of cost optimization initiatives. #Note Company reports full year numbers on June year ending basis, *CMP as on 20 June 2016
0
10
20
30
40
50
60
70
80
Jun
-13
Au
g-1
3
Oct
-13
Dec
-13
Feb
-14
Ap
r-1
4
Jun
-14
Au
g-1
4
Oct
-14
Dec
-14
Feb
-15
Ap
r-1
5
Jun
-15
Au
g-1
5
Oct
-15
Dec
-15
Feb
-16
Ap
r-1
6
Jun
-16
Daily closing price for last 3 years of Sanghi Industries
Key Details
52 week H/L(Rs) 79/44
Book Value (Rs) YTD 41
FV (Rs) 10.0
PE (X) (TTM) 26.3
Dividend Yield (%) 0.0
PE (X)
FY15 FY16E FY17E
50.9 13.7 9.1

State Bank of India Ltd. CMP*: Rs.216 Background State Bank of India (SBI) is India’s largest commercial bank. Founded in 1806, Bank of Calcutta was the first Bank established in India and over a period evolved into SBI. SBI represents a sterling legacy of over 200 years. It is the oldest commercial Bank in the Indian subcontinent, strengthening the nation’s trillion-dollar economy and serving the aspirations of its vast population. The Bank is largest commercial Bank in terms of assets, deposits, profits, branches, number of customers and employees, enjoying the continuing faith of millions of customers across the social spectrum. Its banking activities include Personal Banking, Agricultural/Rural, NRI Services, International Banking, Corporate Banking and Services. As on FY15, SBI has a total branch network of 16,333 domestic and 191 foreign branches.
Shareholding Pattern (%) on 31 March 2016
Promoter 61.32
Institutions 28.38
Public 10.30
Total 100.00
Valuations and Chart
Source: Bloomberg
View: We recommend a Buy on the stock with the target of Rs 330 based on PBV multiple of 1.7x on FY18E adjusted book value of Rs 166.2 and adding Rs 48.2 per share for value of other subsidiaries. *CMP as on 20 June 2016
0
50
100
150
200
250
300
350
400
Jun
-13
Au
g-1
3
Oct
-13
Dec
-13
Feb
-14
Ap
r-1
4
Jun
-14
Au
g-1
4
Oct
-14
Dec
-14
Feb
-15
Ap
r-1
5
Jun
-15
Au
g-1
5
Oct
-15
Dec
-15
Feb
-16
Ap
r-1
6
Jun
-16
Daily closing price for last 3 years of St Bk of India
Key Details
52 week H/L(Rs) 291/148
Book Value (Rs) YTD 186
FV (Rs) 1.0
PE (X) (TTM) 16.9
Dividend Yield (%) 1.3
PE (X)
FY16 FY17E FY18E
16.9 12.9 9.1
Adjusted BV (Rs.)
FY16 FY17E FY18E
117.0 146.3 166.2

Tata Motors Ltd. CMP*: Rs.482 Background Tata Motors Ltd. (TTMT) is India's largest automobile company. TTMT has operations in the United Kingdom (UK), South Korea, Thailand, South Africa and Indonesia through subsidiaries and associate companies. The Company’s Jaguar Land Rover (JLR) business has significant presence in the UK, North America, continental Europe and China as well as sales operations in many major countries across the globe. It also has an industrial joint venture with Fiat in India. Tata Motors is the country's market leader in commercial vehicles and among the top in passenger vehicles with over 8mn Tata vehicles plying in India.
Shareholding Pattern (%) on 31 March 2016
Promoter 33.01
Institutions 41.23
Public 25.76
Total 100.00
Valuations and Chart
Source: Bloomberg
View: TTMT is India's largest automobile company, with consolidated revenues of Rs.2.75 trillion in FY16. TTMT has strong presence in domestic CV industry (market share of 52% in MHCV) and holds renowned international luxury car brands like Jaguar and Land Rover. In the last one year TTMT’s JLR business faced issues in China which impacted its overall performance in FY16. However, over past two quarters JLR has been reporting strong volume growth in the US and Europe market with growth getting normalizing in China market. TTMT’s consolidated margin has also started improving as domestic business improved significantly during the quarter. We remain positive on the stock on the back of well diversified global presence, expected new launches in both domestic and JLR business, recovery in domestic CV industry, long term structural drivers and on good return ratios of over 20%. We continue to recommend a BUY on the stock with the target price of Rs.568 based on the Sum of the parts (SOTP) valuation (JLR (Rs.512/share) + Standalone business (Rs.46/Share) + other subsidiaries (Rs.30/Share) - net automotive debt (Rs.20/Share)). Any earning/target price revision would depend on the performance of new launches, improvement in market share and changes in general business momentum. *CMP as on 20 June 2016
0
100
200
300
400
500
600
700
Jun
-13
Au
g-1
3
Oct
-13
Dec
-13
Feb
-14
Ap
r-1
4
Jun
-14
Au
g-1
4
Oct
-14
Dec
-14
Feb
-15
Ap
r-1
5
Jun
-15
Au
g-1
5
Oct
-15
Dec
-15
Feb
-16
Ap
r-1
6
Jun
-16
Daily closing price for last 3 years of Tata Motors
Key Details
52 week H/L(Rs) 483/266
Book Value (Rs) YTD 218
FV (Rs) 2.0
PE (X) (TTM) 14.0
Dividend Yield (%) 0.0
PE (X)
FY16 FY17E FY18E
14.8 10.3 8.5

Source: Bloomberg
Disclaimer: This communication is being sent by the Investment Advisory Group of HDFC Bank Ltd., registered under SEBI (Investment Advisors) Regulations, 2013. This note has been prepared exclusively for the benefit and internal use of the recipient and does not carry any right of reproduction or disclosure. Neither this note nor any of its contents maybe used for any other purpose without the prior written consent of HDFC Bank Ltd, Investment Advisory Group. In preparing this note, we have relied upon and assumed, without any independent verification, accuracy and completeness of all information available in public domain or from sources considered reliable. This note contains certain assumptions and views, which HDFC Bank Ltd, Investment Advisory Group considers reasonable at this point in time, and which are subject to change. Computations adopted in this note are indicative and are based on current market prices and general market sentiment. No representation or warranty is given by HDFC Bank Ltd, Investment Advisory Group as to the achievement or reasonableness or completeness of any idea and/or assumptions. This note does not purport to contain all the information that the recipient may require. Recipients should not construe any of the contents herein as advice relating to business, financial, legal, taxation, or other matters and they are advised to consult their own business, financial, legal, taxation and other experts / advisors concerning the company regarding the appropriateness of investing in any securities or investment strategies discussed or recommended in this note and should understand that statements regarding future prospects may not be realized. It may be noted that investments in equity and equity-related securities involve a degree of risk and investors should not invest any funds unless they can afford to take the risk of losing their investment. Investors are advised to undertake necessary due diligence before making an investment decision. For making an investment decision, investors must rely on their own examination of the Company including the risks involved. Investors should note that income from investment in such securities, if any, may fluctuate and that each security’s price or value may rise or fall. Accordingly, investors may receive back less than originally invested. Neither HDFC Bank nor any of its employees shall be liable for any direct, indirect, special, incidental, consequential, punitive or exemplary damages, including lost profits arising in any way from the information contained in this material. This note does not constitute an offer for sale, or an invitation to subscribe for, or purchase equity shares or other assets or securities of the company and the information contained herein shall not form the basis of any contract. It is also not meant to be or to constitute any offer for any transaction. HDFC Bank and its affiliates, officers, directors, key managerial persons and employees, including persons involved in the preparation or issuance of this material may from time to time, have long or short positions in, and buy or sell the securities thereof, of company (ies) mentioned herein. HDFC Bank may at any time solicit or provide commercial banking, credit, advisory or other services to the issuer of any security referred to herein. Accordingly, information may be available to HDFC Bank, which is not reflected in this material, and HDFC Bank may have acted upon or used the information prior to, or immediately following its publication. Disclosures: Research analyst or his/her relatives or HDFC Bank or its associates may have financial interest in the subject company in ordinary course of business. Research analyst or his/her relatives does not have actual/ beneficial ownership of 1% or more securities of the subject company at the end of the month immediately preceding the date of publication of research report: HDFC Bank or its associates may have actual/beneficial ownership of 1% or more securities of the subject company at the end of the month immediately preceding the date of publication of research report. Research analyst or his/her relatives or HDFC Bank or its associates may have other potential / material conflict of interest with respect to any recommendation and related information and opinions at the time of publication of the research report. Subject company may have been client of HDFC Bank or its associates during twelve months preceding the date of publication of the research report. HDFC Bank or its associates may have received compensation from the subject company in the past twelve months. HDFC Bank or its associates may have managed or co-managed public offering of securities for the subject company in the past twelve months. HDFC Bank or its associates may have received compensation for investment banking or merchant banking or brokerage services from the subject company in the past twelve months. HDFC Bank or its associates may have received compensation for products or services other than investment banking or merchant banking or brokerage services from the subject company in the past twelve months. HDFC Bank or its associates has not received compensation or other benefits from the subject company or third party in connection with the research report. Research analyst has not served as an officer, director or employee of the subject company. Neither research analyst nor HDFC Bank has been engaged in market making activity for the subject company. Three year price history of the daily closing price of the securities covered in this note is available at www.nseindia.com and www.bseindia.com.
Rating Expected to
Buy Appreciate more than 10% over a 12 to 15 month period
Hold Appreciate below 10% over a 12 to 15 month period
Under Review Rating under review
Exit Exited out of the Model Portfolio
Rating Interpretation