Embed Size (px)
Citation preview

Mukhopadhyay and Nityananda Sarkar-Demonetization and Its Effects … Econometric Analysis
38
Demonetization and Its Effects on BSE SENSEX and Some Sectoral Indices:
An Exploratory Econometric Analysis
Debabrata Mukhopadhyay and Nityananda Sarkar
West Bengal State University. and Indian Statistical Institute
Received: 13.02.2018 Accepted: 07.05.2019 Published: 30.09.2019
ABSTRACT
This study has carried out some preliminary time series analyses to examine the impacts of
demonetization which was carried out in India on 8 November 2016, on the well-known
Indian stock index, BSE SENSEX, and four major sectoral indices viz., BSE BANKEX,
BSE Auto, BSE Reality and BSE Smallcap, using daily level time series data covering the
period 1 January 2016 to 31 May 2017. Apart from examining the stationarity/
nonstationarity property and existence of structural breaks after demonetization in these
series, the paper has also studied the trend behavior and returns models for both the pre-
and post-demonetization periods. This study has found that while there is more than one
break in all the five series at their level values, there is only one structural break after
demonetization. It has been found that the trend function for all the index series broadly
gives support to this finding of one break after demonetization. Further, some changes have
been observed in the stationary models for the two sub-periods of pre- and post-
demonetization for all but BSE Auto index. Finally, except for BSE SENSEX, no change
in the status of stationarity/nonstationarity in the pre- and post- demonetization periods has
been found in the other series.
Key words: Bai-Perron Multiple Break Points Test, Demonetization, Stationarity,
Structural Breaks, Sup MZ Test
JEL Classifications: C22, G18, G28
1. INTRODUCTION
Demonetization can be described as a monetary action where the monetary authority withdraws
currency notes of higher denominations from circulation and replaces the same with new bank
notes. This is a very rare monetary policy decision taken by any government to tackle extreme
economic situations like hyperinflation, severe corruption, and intolerable size of parallel
economy. In this context, mention may be made of a paper by Rogoff (2014) where he has
advocated in favour of phasing out paper currency for a legal economy while discussing the
costs and benefits of such a step by any central bank. It is also mentioned in the literature that
paper currency makes transactions anonymous which is an essential property of money, giving
it a certain form of anonymity (see, for details; Kiyotaki and Wright, 1989). In most countries,
a large percentage of currency (over 50%) is used to hide transactions because of anonymity
character of paper currency (see, for instance; Rogoff, 1998, 2002). In a recent book, Rogoff
Debabrata Mukhopadhyay, West Bengal State University, Barasat, North 24 Parganas, Kolkata 700 126, India
(email: [email protected]).
Nityananda Sarkar, Indian Statistical Institute, 203 B.T. Road, Kolkata 700 108, India (email: [email protected]).
The authors would like to thank sincerely the two anonymous referees and the Editor for their careful reading of
the manuscript, which has led to considerable improvement in the final version of the paper.

International Econometric Review (IER)
39
(2016) has argued how paper money can also cripple monetary policy as it does not allow
interest rate to go below zero.
The Government of India went for a massive demonetization exercise on 8 November 2016, by
withdrawing the legal tender status of the then existing Rupees (Rs.)1 500/- and Rs. 1000/-
currency notes which constituted around 86% of the total currency in circulation as per the
Reserve Bank of India’s (RBI)2 Database on Indian Economy. According to the announcement
made by the government, this rare monetary action was taken in order to contain the rising
incidence of fake notes and black money in the country leading to running of a huge and ever
increasing parallel economy within the country. In an affidavit submitted to the Supreme Court
by the Government of India, it has also been mentioned that “…the withdrawal of existing high
denomination banknotes will curb funding of terrorists with the proceeds of fake Indian
currency notes (FICN) and use of existing FICN network for subversive activities.” A
movement towards digital economy has also been advocated as a major argument in favour of
demonetization. The government tends to think, based on some economic reasoning, that a
developing economy should have lesser use of paper currency and higher technology-based
transactions.
However, this demonetization decision came under severe criticism from some noted
economists on the ground that (i) the move was authoritarian in nature, (ii) it is very likely to
lead to immense difficulties to common people, and (iii) it would adversely affect business and
commerce, especially in the small and medium sectors, and consequently lead to shrinkage of
production and employment in those sectors. Some also criticized it in terms of its effectiveness
to significantly reduce ‘black money’, which is a process outcome of the prevailing economic
system rather than a one-time phenomenon, especially in a vast and not-so-efficiently managed
developing country like India.
Although this is not the first time that demonetization has been undertaken in India3, but the
unanticipated manner in which it happened and the unpreparedness that the country exhibited
made it a major public debate issue for quite some time. Also, unlike the earlier two occasions
in 1946 and 1978, this has affected a very large section of the population. At the world level,
only very few countries ever undertook such a monetary action. Even in that, most of these
countries that followed demonetization, failed miserably in terms of achieving their goals.
Among the least developed economies that carried out the rare monetary policy of
demonetization, most were Latin American countries, and their objective was to control
hyperinflation and/or high level of corruption. However, in order to understand the implication
of this major policy decision in a big and populated country like India, it is noteworthy to
consider some intrinsic features of the Indian economy which are relevant in this context.
Indian economy is predominantly a cash-intensive economy. According to the 2013 report of
the Institute for Business in the Global Context (IBGC) on cash outlook, it has been noted that
the value of notes and coins in circulation as a percentage of GDP was 12.04% for India, which
is far higher than those for countries like Brazil (3.93%), Mexico (5.32%) and South Africa
(3.72%). The ratio4 of M0/M2 is also high in India compared to other comparable developing
countries, with almost 87% transactions in 2012 being cash-based transactions. According to
the Global Findex data of the World Bank, 53% Indians over age of 15 years had bank accounts
1 The currency note of India is called Rupee or, Re. in abbreviation; Rs. stands for abbreviation of Rupees. 2 The Central Bank in India is called the Reserve Bank of India. 3 Currency notes of higher denominations were earlier withdrawn from circulation in India in 1946 and 1978, but
those affected only the privileged few. 4 M0 and M2 stand for narrow and broad money supply, respectively.

Mukhopadhyay and Nityananda Sarkar-Demonetization and Its Effects … Econometric Analysis
40
in 2014 although India also has the highest number of dormant bank accounts. Another crucial
feature of the Indian economy is that life of the economy is still in the informal sector which,
by the very nature of its activities, is highly cash dominated. The latest Economic Census of
2013-14 has reported that 98.6% establishments in India are in the informal sector. Further,
employment figures show that 82% of total workers are in the informal sector (of which 52%
are self-employed and 30% casual workers) and 10% informal workers are in the formal sector.
A mere 8% of the workers are engaged in the formal sector as formal workers.
The consumption-production linkage between informal and formal sectors that exists in a dual
economy like India is also important in this context. The demonetization process which may
severely affect the real economic activity of cash-intensive informal economy is also
channelized to the formal sector and to the financial sector, especially to the stock market
because of interdependences between real and financial sectors. In order to determine the
macroeconomic impact of this unanticipated monetary shock, one can find the contraction of
aggregate demand due to cash crunch and real balance effect i.e., the Pigou effect. The
aggregate supply curve may also move left due to contraction of money supply (M0) as a result
of this demonetization. Thus, real economic activity may be reduced. The effect on inflation is;
however, ambiguous, being dependent on the relative strength of change in aggregate demand
and supply. Demonetization also causes disproportionate effect on various sectors of the
economy. The work done by National Institute of Public Finance and Policy (NIPFP) in
November 2016 (Rao et al., 2016), has clearly pointed out that the sectors to be adversely
affected are all those sectors where demand is usually backed by cash like, for example,
transport services, real estate, and small business. Another sector that is crucially dependent on
cash for carrying out its activities and hence likely to be affected by demonetization is the
banking sector.
Considering the issues discussed above, the basic purpose of this work is to study the impacts
of this demonetization, if any, on some important sectors of Indian economy which are largely
dependent on cash transactions. But lack of availability of sufficient data is a practical constraint
for doing such a study since for most of the relevant macroeconomic variables, the data are
available at low frequency i.e., either at monthly or quarterly level making the number of sample
observations in the post-demonetization period to be too few to carry out any meaningful time
series analysis. Keeping this in mind, we have confined our attention to Indian stock market
only where daily level data are available. This issue apart, it may be relevant to ask why it is
worth studying the impact of demonetization which is a rare monetary event in the history of
any economy, on some stock indices. It is very well recognized that stock market is a barometer
of the economy where the effects of major economic policy decisions are expected to be
instantaneously transmitted to the agents’ expectation formation about the future state of the
economy, which is more commonly understood through the stock market. Ioannidis and
Kontonikas (2006) pointed out that stock prices are commonly regarded as being highly
sensitive to economic conditions. In the context of transmission mechanism through the stock
market, monetary policy actions affect stock prices, which themselves are linked to the real
economy through their influence on consumption spending i.e., the wealth effect channel, and
investment spending i.e., the balance sheet channel Thus, impact of this massive monetary
action may have some bearing in the capital market, especially in the stock market of the
country.
In this limited study, we have chosen five indices which, we thought, are likely to be affected
by demonetization. Thus, to be specific, this paper empirically studies the possible effects of

International Econometric Review (IER)
41
demonetization on four major sectoral indices of the Bombay Stock Exchange (BSE)5; namely,
S&P BSE BANKEX, S&P BSE Auto, S&P BSE Reality, and S&P BSE Smallcap. Apart from
these indices of four sectors where transactions are heavily cash dependent, we have also taken
the most widely quoted index of the Indian stock market viz., S&P BSE SENSEX. The reason
for including the last one is because of its importance as an overall index of Indian stock prices,
and the fact that nothing, as such, is known about how the likely impacts of demonetization on
different sectors may affect this widely-quoted overall stock index of India through different
transmission channels.
The data refer to the daily level closing prices of the five indices over the period 1 January 2016
to 31 May 2017. The purpose for choosing the time series covering a period prior to
demonetization is to be able to compare the results obtained, based on analysis of time series,
for the post-demonetization period with those of the pre-demonetization period, wherever such
comparisons are meaningful and relevant.
The aim of this paper is very limited viz., this study is a preliminary analysis of each of the five
indices of the Indian stock market, as mentioned above, based on application of econometric
tools available for univariate time series analysis. The sole aim is to find if there has been any
(statistically) significant change/effect on these series, both at level and difference values, as a
result of this very important monetary action by the Government of India. To the best of our
knowledge, no such study has yet been done. What are available are three studies on
consequences of demonetization based on economic theoretic reasoning, and some newspaper
articles. The first such study is due to Rao et al. (2016) where they have pointed out that in the
long run the benefits of demonetization will crucially depend upon the availability of credit,
spending, level of activity and government finances. The second paper by Dasgupta (2016) has
questioned, following Robert Lucas’s Nobel lecture, the merits of economic policies that
assume the form of random shocks to an economic system while explaining the theoretical
issues of demonetization. The last study by Muthulakshmi and Kalaimani (2016) on this issue
basically discusses the effectiveness of demonetization decision to eradicate parallel economy.
The paper is organised as follows. Section 2 describes the data and methodology. Empirical
findings are discussed in Section 3. Conclusions are made in Section 4.
2. DATA AND METHODOLOGY
The study involves time series data of five indices of the Indian stock market6 viz., BSE
SENSEX, BSE BANKEX, BSE Auto, BSE Reality and BSE Smallcap at daily closing prices
covering the period 1 January 2016 to 31 May 2017. There are, in all, 349 observations for each
series. All the time series have been downloaded from www.bseindia.com. The BSE SENSEX
is the most representative stock index of India comprising 30 prominent stocks traded actively
in the exchange and it covers all the key sectors of the economy. The other four indices viz.,
BSE BANKEX, BSE Auto, BSE Reality and BSE Smallcap are sectoral indices.
The BSE BANKEX consists of the companies classified as banks in the BSE 500 index which
are found to be good in terms of trading frequency and free float market capitalization. This
index comprises both private sector banks such as ICICI, and HDFC, and public sector banks
like the State Bank of India, and Bank of Baroda. The sectoral auto index consists of the
5 The Bombay Stock Exchange which was established in 1875 is the oldest stock exchange of India. 6All these indices are now prefaced with S&P; for example, BSE SENSEX is now called as S&P BSE SENSEX.
However, for the sake of convenience, we refer these indices, all throughout the paper, without this preface ‘S&P’.

Mukhopadhyay and Nityananda Sarkar-Demonetization and Its Effects … Econometric Analysis
42
automobile companies enlisted in BSE 500 index, and includes major players in the market
such as Tata Motors, Mahindra & Mahindra, Bajaj Auto, and Maruti Suzuki. The index that
represents real estate sector is the BSE Reality consisting of the real estate companies such as
DLF Ltd., and Unitech Ltd. which are listed in BSE 500 index. The last sectoral index
considered is BSE Smallcap that includes companies which are small in terms of market
capitalization and are not very well known. The choice of the last two sectoral indices has been
primarily guided by consideration of the likelihood of their being affected by demonetization
because of the nature of economic activities represented through stock prices of these indices.
In what follows next, we first describe the methodological approach that has been followed in
this paper. As already stated, an econometric analysis of these five time series at the univariate
level has been done in this paper. To be specific, we have first studied two most important and
fundamental properties of each series viz., stationarity and structural break. Thereafter, we have
obtained the ‘best’ univariate model for the stationary series, and finally, carried out trend
analysis in case a series is found to be nonstationary. These have been done for the full sample
as well as for the relevant sub-periods of pre-demonetization and post-demonetization as
thought to be appropriate and relevant. The core point in all these exercises is to find if there
has been any impact in the important time series properties as well as the data generating
process of these five series due to this rare monetary decision of demonetization.
The stationarity property has been checked by applying the well-known augmented Dickey
Fuller (ADF) test, both at level values as well as differences. All the indices have been taken at
their natural logarithmic values. Thus, the values at first difference stand for the continuously
compounded rate of returns on the corresponding index.
Next, we have performed a test for the presence of any structural break(s), if any, in each of
these five series. This exercise has been carried out both at level values where the series is non
stationary in the sense of having trend, and (first) difference values where the series is
stationary. The existence of breaks in the series has been studied both at level and difference
values since structural breaks may occur at either or both cases/situations. It is probable that
such an unanticipated monetary shock in terms of this massive demonetization action would
lead to permanent change(s)/breaks(s) in the data generating process of the time series either or
both at nonstationary and stationary levels. The literature on structural break(s) starting with
the classic work by Chow (1960) is vast and comprehensive. The Chow test has few well-
known limitations. Andrews in his seminal work in 1993 proposed a proper statistical test for a
stationary series with an unknown single structural break point. Further, a new structural break
test, called the MZ test that tests simultaneously for break in regression coefficients as well as
in variance, was developed by Maasoumi et al. (2010) in 2010. Subsequently, sup MZ test was
proposed by Ahmed et al. (2017), which caters to an unknown breakpoint, and comparison of
this test was made with the sup F-test of Andrews (1993). We have used the sup MZ test to
check whether our finding, based on the Bai-Perron test, on structural break in each series
occurring after demonetization, is supported or not by the sup MZ test.
As regards testing for the presence of multiple structural breaks and that too in case of
nonstationary series as well, the first major breakthrough was given by Bai and Perron (1998,
2001). In a subsequent paper in 2003, they advocated, based on extensive simulations, that
under very general conditions on the nature of data and the error term, the following testing
procedure involving basically two test statistics viz., the UD max test and/or the WD max test,
and the sup F-type test i.e., a sequential test of the null hypothesis of l breaks versus the
alternative of (l+1) breaks, be followed. First, the UD max and/or WD max tests are used to

International Econometric Review (IER)
43
see if at least one break is present. If these indicate the presence of at least one break, then the
number of breaks can be decided based upon a sequential examination of the sup F-
type statistic. It may be noted that in the later, the test F (1|0) is ignored.
The Bai-Perron multiple breaks point test has been applied to find structural breaks in all the
five series. In case the test suggests the existence of one or more structural breaks, then
appropriate models have been obtained for the five series at stationary level i.e., return series,
for both the pre- and post-demonetization periods in order to find if there is any significant
difference in the two models for these two periods.
As already stated, we have also applied the sup MZ test to find if the estimated break date after
demonetization is found to be the same by the sup MZ test for each of the five series. To be
explicit, what we have done is that if the Bai-Perron test has identified, say, 5 break points T1,
T2, T3, T4 and T5 of which T3 refers to the estimated break point after demonetization, then we
have used the data covering the period from T2 to T4 to re-test the existence of a break point
during this period by applying the sup MZ test.
In case trend is found to exist in any time series, trend analysis has been carried out in order to
find if demonetization has led to any change in the trend function. To that end, the following
trend models for the logarithmic price series7 pit=ln(Pit), i=1,2,3,4,5 where P1t, P2t, P3t, P4t
and P5t stand for the daily closing prices of BSE SENSEX, BSE BANKEX, BSE Auto, BSE
Reality, and BSE Smallcap, respectively, have been applied. For considering the break date
which is taken to be given in trend analysis, we have used the estimated break date(s) obtained
for the corresponding series using the Bai-Perron test. The five trend models considered are
stated below.
Model A: i
tA
i
At
ii
Ait tDp 1110
where 11 tD , if BTt
= 0, otherwise
and BT is the break date. The subscript/superscript i stands for the i-th index with i=1,2,3,4,5.
Model B: i
tB
i
Bt
ii
Bit tDp 1220 where 12 tD , if CB TtT
=0, otherwise
and CT is the last time point (i.e., day) upto when the effect of demonetization, if any, remains.
Model C: i
tCt
i
C
i
C
i
Cit Dtp 3210
where Bt TtD 3 , if BTt
=0, otherwise.
Model D: i
tDt
i
D
i
Dt
ii
Dit DtDp 321140 .
7 Since, as already stated, all the five series have been transformed to their natural logarithmic values so that the
difference represents the continuously compounded rate of returns, the trend analysis has been carried out on log-
transformed series, and the results presented and discussed thereof. However, trend analysis was also done on level
values without log-transformation i.e., Pit. But the conclusions were found to be the same as with the log-
transformed values.

Mukhopadhyay and Nityananda Sarkar-Demonetization and Its Effects … Econometric Analysis
44
It may be mentioned at this stage that we are using different trend models instead of a single
model with the idea that effect of structural break(s) may vary across intercept and slope
parameters differently as represented in Models A through D. It may be summarized that
‘Model A’ is a one-time change in the intercept of the trend function where the dummy variable
is a step dummy. ‘Model B’ represents the same but with an extended pulse dummy. It may be
noted that the model with such dummy variables enables us to know at what point of time
demonetization has made impact, if any, on stock indices, and also up to what time point.
‘Model C’ allows for a change in the slope of the trend function without any sudden change in
the level at the time of structural break. Finally, ‘Model D’ considers both changes in intercept
and slope of the trend function.
In a seminal work Nelson and Plosser (1982) argued that if a time series is trend stationary (TS)
then the effects of random shocks disappear over time i.e., the shocks are transitory in nature,
whereas for a difference stationary (DS) process, random shocks have permanent effects. Since
demonetization in India was an unanticipated random shock, it is meaningful to find if these
shocks in the post-demonetization period are temporary or permanent in nature. With this view
in mind, we checked the stationarity status of each index at logarithmic level values separately
for the pre- and post-demonetization periods by applying the ADF test. It is well known that
the ADF test is also used for finding if a time series is DS or TS in case it is found to be
nonstationary.
All the computations have been carried out using the software EViews 9.
3. EMPIRICAL FINDINGS
In this section, we discuss the empirical results following the econometric methodology
presented in the preceding section. We first present, in Table 3.1, the summary statistics of all
the five series at their first difference (log) level values i.e., for the cumulated returns series. It
is observed from Table 3.1 that all the mean returns are positive. Further, among the five mean
returns, the one on BSE Reality index is the highest, and that on BSE SENSEX is the lowest.
Average annual returns values vary from 12% to 24%. We also find that standard deviation
value is also the highest for returns on BSE Reality and lowest in case of BSE SENSEX. All
the series except BSE BANKEX have negative skewness values. Further, all the series have
excess kurtosis values i.e., all the return distributions are leptokurtic.
Returns series Mean Median Std. deviation Skewness Kurtosis
BSE SENSEX 0.0005 0.0005 0.008 -0.093 4.499
BSE BANKEX 0.0009 0.0009 0.012 -0.147 4.178
BSE Auto 0.0007 0.0016 0.012 -0.320 5.073
BSE Reality 0.0010 0.0020 0.019 -0.647 7.429
BSE Smallcap 0.0008 0.002 0.011 -1.148 6.466
Table 3.1 Summary Statistics of Returns on the Five Indices for Full Sample.
Before proceeding further, we take note of an observation made from visual inspection of the
plots showing bank ATM transactions and Point of Sale (POS) transactions at monthly level
for the period under consideration. From these two plots given in Figures 3.1 and 3.2, we note
that the ATM transaction decreased sharply during the three months (including November) after
demonetization and POS transaction increased substantially during the same period.

International Econometric Review (IER)
45
Figure 3.1 Plot of ATM Transactions (Rs. Millions) through debit card
Figure 3.2 Plot of POS transactions (Rs. Millions) through debit card
However, although ATM transactions was back to the pre-demonetization level by March,
2017, POS transactions even though decreased from the peak achieved in January 2017,
remained substantially higher than that of the pre-demonetization period indicating thereby a
structural shift in the movement towards digital transactions in the sample period. To figure out
visually the likely changes in the stock index series after demonetization, we have given
diagrammatic representations of all the five series at level values. In Figure 3.3, we have plotted
the daily closing price for BSE SENSEX. Likewise, Figures 3.4 through 3.7 represent the same
for BSE BANKEX, BSE Auto, BSE Reality and BSE Smallcap series, respectively.
It is evident from the plots that right after the date of demonetization i.e., 8 November 2016,
there is a slowly declining pattern till about middle of January 2017, for all the five index series,
but thereafter all the series have started rising. It is also noted from these plots that there is no
exhibited permanent downward or upward shift after demonetization in the sample period for
any of the five stock indices. At this stage, it may be worth noting that soon after demonetization
there was gradual remonetisation i.e., replacement of old discontinued currency notes with new
ones in the economy, and this might have contributed to all the five series getting back to square
one after some lags.
0
500000
1000000
1500000
2000000
2500000
3000000
AT
M t
ransa
ctio
ns
(Rs.
Mil
lio
ns)
0
100000
200000
300000
400000
500000
600000
700000
PO
S t
ransa
ctio
ns
(Rs.
Mil
lio
ns)

Mukhopadhyay and Nityananda Sarkar-Demonetization and Its Effects … Econometric Analysis
46
Figure 3.3 Plot of BSE SENSEX closing prices
Figure 3.4 Plot of BSE BANKEX closing prices
Figure 3.5 Plot of BSE Auto Index closing prices
20000
22000
24000
26000
28000
30000
32000B
SE
SE
NS
EX
clo
sing p
rice
s
15000
17000
19000
21000
23000
25000
27000
29000
BS
E B
AN
KE
X c
losi
ng p
rice
s
15000
16000
17000
18000
19000
20000
21000
22000
23000
24000
25000
BS
E A
uto
Ind
ex c
losi
ng p
rice
s
International Econometric Review (IER)
47
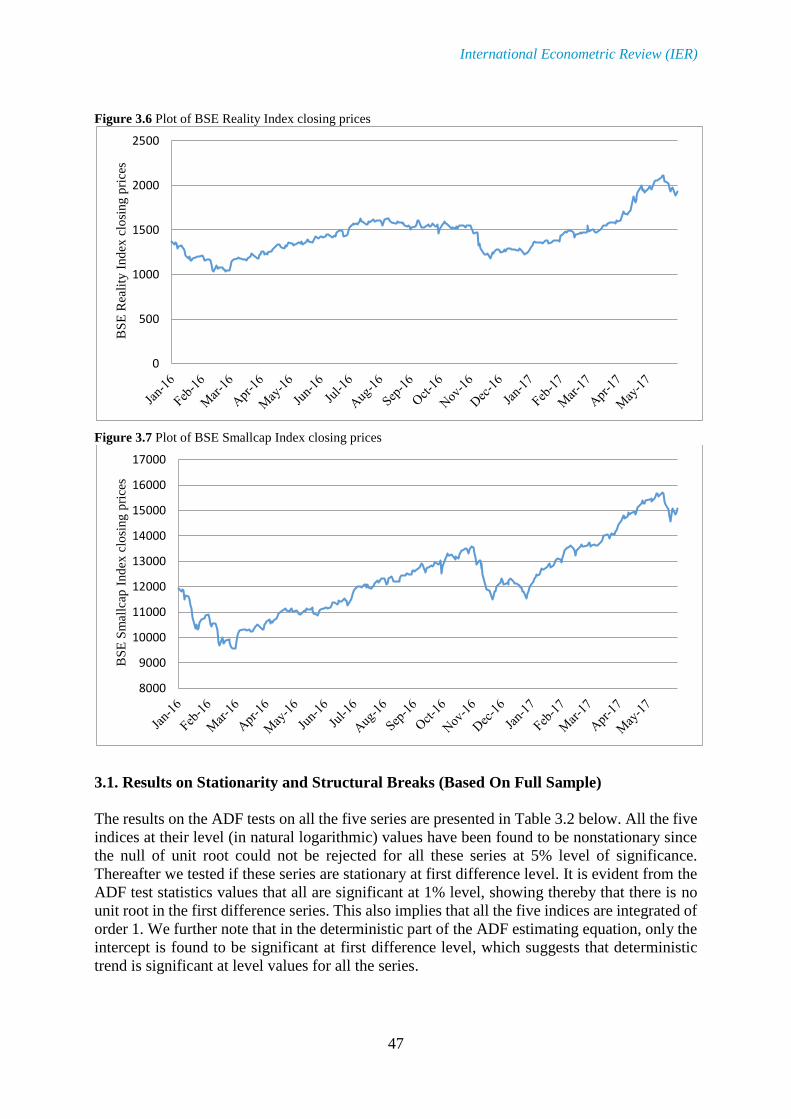
Figure 3.6 Plot of BSE Reality Index closing prices
Figure 3.7 Plot of BSE Smallcap Index closing prices
3.1. Results on Stationarity and Structural Breaks (Based On Full Sample)
The results on the ADF tests on all the five series are presented in Table 3.2 below. All the five
indices at their level (in natural logarithmic) values have been found to be nonstationary since
the null of unit root could not be rejected for all these series at 5% level of significance.
Thereafter we tested if these series are stationary at first difference level. It is evident from the
ADF test statistics values that all are significant at 1% level, showing thereby that there is no
unit root in the first difference series. This also implies that all the five indices are integrated of
order 1. We further note that in the deterministic part of the ADF estimating equation, only the
intercept is found to be significant at first difference level, which suggests that deterministic
trend is significant at level values for all the series.
0
500
1000
1500
2000
2500
BS
E R
eali
ty I
nd
ex c
losi
ng p
rice
s
8000
9000
10000
11000
12000
13000
14000
15000
16000
17000
BS
E S
mal
lcap
Ind
ex c
losi
ng p
rice
s

Mukhopadhyay and Nityananda Sarkar-Demonetization and Its Effects … Econometric Analysis
48
ADF test statistic value p-value Deterministic component
Index Level First diff. Level First diff. Level First diff.
BSE SENSEX -2.407 -17.497 0.375 0.000 constant, trend constant
BSE BANKEX -2.651 -16.974 0.258 0.000 constant, trend constant
BSE Auto -2.336 -17.704 0.413 0.000 constant, trend constant
BSE Reality -1.630 -18.509 0.772 0.000 trend constant
BSE Smallcap -3.270 -16.277 0.073 0.000 constant, trend constant
Table 3.2 Results of Unit Root Test based on Full Sample.
Notes: All the test statistic values are compared with MacKinnon (1996) one-sided critical values. Level values
are in natural logarithm.
Next, we report the results on the impact of demonetization in structural change in these series
at both nonstationary and stationary levels i.e., for both the index series (i.e., at level values)
and the returns series (i.e., first difference values), by following the multiple structural break
points test proposed by Bai and Perron (1998, 2001, 2003), as discussed in the preceding
section. We have presented the findings of this test in Tables 3.3 and 3.4 along with the
(estimated) break dates.
UDmax statistic value WDmax statistic value
Index Level First diff. Level First diff.
BSE SENSEX 560.775* 10.286* 724.505* 10.286*
BSE BANKEX 538.127* 14.361* 738.315* 14.361*
BSE Auto 833.264* 9.987* 875.635* 12.020*
BSE Reality 828.297* 9.116* 1321.358* 11.872*
BSE Smallcap 638.739* 12.969* 751.419* 14.018*
Table 3.3 Results of UDmax and WDmax Tests based on Full Sample.
Note: * indicates significant value at 5% level of significance.
Level First Difference
Index
Total number
of break dates
Estimated break date
after demonetization
Total number
of break dates
Estimated break
date
BSE SENSEX 4 11 November 2016 0 -
BSE BANKEX 4 16 November 2016 1 22 March 2016#
BSE Auto 5 11 November 2016 0 -
BSE Reality 4 9 November 2016 0 -
BSE Smallcap 4 11 November 2016 1 22 April 2016#
Table 3.4 Results of the Bai-PerronMultiple Structural Break Points Test based on Full Sample.
Notes: Trimming parameter value is 0.15; level of significance considered is 0.05.
# indicates that both these dates are before demonetization.
By applying the UDmax and WDmax tests, it is found that the null hypothesis of ‘no break’ is
rejected in favour of ‘one break’ for all the series at level values. However, for the difference
series, the null of ‘no break’ could not be rejected for three series, namely, BSE SENSEX, BSE
Auto and BSE Reality. But the UDmax and WDmax test statistics suggest that the null hypothesis
of ‘no break’ is rejected for BSE BANKEX and BSE Smallcap at first difference values.
Thereafter the sequential sup F-type test with trimming parameter value 0.15 was carried out,
and the number of break dates in each series was obtained along with the estimated break dates.
The results of this test with level values show that for all the indices except BSE Auto series,
the number of breaks obtained in the entire series is four. For BSE auto series, the number of
the estimated break dates has been found to be five.
It is also important to note that for each of the five indices, only one break in the series has been
found immediately after demonetization. The estimated break dates for the five series at level
values after demonetization are 11 November 2016, 16 November 2016, 11 November 2016, 9

International Econometric Review (IER)
49
November 2016, and 11 November 2016 for BSE SENSEX, BSE BANKEX, BSE Auto, BSE
Reality, and BSE Smallcap, respectively. However, we have also presented the sup F-type test
statistic values corresponding to each of the (estimated) break dates obtained for all the five
stock prices at level values in order to empirically establish that there is strong evidence (global
maximum) in favour of one of the break dates as compared to the other dated (local maxima).
These test statistics values are presented in Table 3.5.
BSE SENSEX BSE BANKEX
Break No. Estimated Break date F-Statistic Break No. Estimated Break date F-Statistic
Break date 1 11 November, 2016 238.839** Break date 1 16, November, 2016 184.962**
Break date 2 11 July, 2016 54.758** Break date 2 17 March, 2016 93.174**
Break date 3 17 March, 2016 64.280** Break date 3 29 August, 2016 68.884**
Break date 4 25 January, 2017 21.352** Break date 4 30 January, 2017 33.081**
BSE Auto BSE Reality
Break date 1 11 November, 2016 416.632** Break date 1 9, November, 2016 398.666**
Break date 2 17 March, 2016 70.960** Break date 2 21 March, 2016 70.139**
Break date 3 25 August, 2016 44.953** Break date 3 4Julyt, 2016 98.142**
Break date 4 15 February, 2017 28.715** Break date 4 16 March, 2017 71.693**
Break date 5 10 June,2016 9.064**
BSE Smallcap
Break date 1 15 November, 2016 159.957** Break date 3 30 June, 2016 15.965*
Break date 2 17 March, 2016 246.923** Break date 4 27 January, 2017 15.421*
Table 3.5 Test Statistic values for all the break dates found from the Bai-Perron Test on level values
Note: * and ** indicate significant values at 5% and 1% levels of significance, respectively. Only breaks at level
values are reported.
We find from this table that the F statistic value is the highest corresponding to the post-
demonetization break date for all but one (BSE Smallcap) series. This provides strong evidence
for demonetization effect in terms of structural break on these stock indices. It may be stated
that in the underlying model for each series, constant and linear trend have been taken as
‘breaking’ variables both at level and first difference values.
We now state the results of re-testing for the existence of structural break in the level values of
all the five series after demonetization, by applying the sup MZ test. As stated earlier, the break
point after demonetization considered for doing the re-testing by the sup MZ test is the one
detected after demonetization by the Bai-Perron multiple break points test. The results of this
re-test are presented in Table 3.6.
Level
Index
Estimated break date by
the Bai-Perron test
Estimated break date
by sup MZ test
sup MZ test
statistic
BSE SENSEX 11 November 2016 10 November 2016 132.342*
BSE BANKEX 16 November 2016 21 December 2016 85.976*
BSE Auto 11 November 2016 10 November 2016 198.986*
BSE Reality 9 November 2016 8 November 2016 398.932*
BSE Smallcap 11 November 2016 3 November 2016 242.483*
Table 3.6 Results of sup MZ Test for Re-testing the Existence of Break Point after Demonetization
Notes: * indicates that the sup MZ test statistic value is significant at 1% level compared to tabulated chi-squared
value of 9.21 with 2 degrees of freedom; Trimming parameter value is 0.15.
The existence of a structural break in the time period covering T2 to T4 is confirmed by the sup
MZ test, as expectedly, for each of the series. Moreover, the results show that the estimated
break date obtained by the sup MZ test is essentially the same - the difference being only of one
day - as that determined by the Bai-Perron test tin case of three series viz., BSE SENSEX, BSE

Mukhopadhyay and Nityananda Sarkar-Demonetization and Its Effects … Econometric Analysis
50
Auto and BSE Reality. For instance, the estimated break date for BSE SENSEX series is found
to be 11 November 2016 by the Bai-Perron test while the re-test by sup MZ test yields this date
to be 10 November 2016. Of the two remaining series, BSE Smallcap has a difference of 8 days
which is once again close enough. It is only in case of BSE BANKEX that the two estimated
break dates are found to be quite different with 16 November 2016 being the estimated break
date by the Bai-Perron test, while it is 21 December 2016 by the sup MZ test.
Since estimated break date for BSE BANKEX has been found to be somewhat different by sup
MZ test and the Bai-Perron test, an attempt was made to find which of the two tests estimates
the unknown break points more accurately than the other. Any such exercise would require
ensuring compatibility of the two tests in terms of their size performance. To that end, we first
obtained a base null model which is the best fitting model with no breaks, and applied the Bai-
Perron and Sup MZ tests at 5% level of significance. We then generated simulated data
repeatedly and finally obtained the actual size of the two tests. It was, however, observed that
the two tests were not compatible enough, and hence no further simulation-based exercise was
done.
We have; however, tried to provide some explanations as to why the two tests might have
picked up different estimated break dates for BSE BANKEX series from consideration of
policies and actions initiated by the Reserve Bank of India (RBI) which is the Central Bank of
India. The RBI issued a series of directives almost on daily basis since 8th December, 2016, the
day of demonetization, on banking rules and regulations to implement demonetization. It
periodically changed the rules on cash withdrawal and deposits at banks through the
notifications. These notifications continued till 21 December when RBI finally removed
restrictions on customers depositing old notes in excess of Rs 5,000. An RBI circular said banks
would not be questioning customers depositing old notes if their accounts were compliant under
‘know your customer’ (KYC) norms. It may be observed from Figures 3.1 and 3.2 that ATM
transactions improved from the third week of December, 2016. Therefore, it becomes obvious
that all these directives made the banking sector more susceptible and this sector took much
more time to stabilize compared to other sectors of the economy considered in our study. The
likely departure from the assumptions underlying the two tests because of this kind of
continuing changes in banking rules and regulations till the third week of December 2016 and
hence the lack of stability in this particular time series may provide some explanations for the
finding in case of BSE BANEX.
Now, at the first difference level i.e., for return series, we note that the null hypothesis of ‘no
break’ is rejected only for BSE BANEX and BSE Smallcap. One structural break has been
found in each of these two series, but neither break date is after demonetization. For the
remaining three returns series there is no evidence of any structural break. Combining these
with the earlier findings on the level values of the series, we thus conclude that these series
have structural breaks in their level values but, barring two series, that too before
demonetization, not at their first difference values.
Overall, it can be inferred that break or instability is a feature with all the five index series. But
finding of one break date after 8 November 2016 also suggests that some impact of
demonetization in respect of stability holds for each of the five series. Further, the presence of
a number of breaks in each series at level values suggests that the trend breaks are temporary
or ‘short-term’ in nature, and not permanent or ‘long term’, which broadly matches with the
behavior exhibited in the plots. As regards to returns, we can conclude that, in respect of
stability, all the five series have not been affected by demonetization in the same way since no

International Econometric Review (IER)
51
break has been found for BSE SENSEX, BSE Auto, and BSE Reality, and although one break
has been found for each of BSE BANEX and BSE Smallcap, the break dates are found to be
before demonetization.
Model A
Variable Coefficient Standard error t-statistic p-value
Constant 10.073 0.00300 3051.431 0.000
Linear trend 0.001 0.00003 38.118 0.000
D1 -0.102 0.00500 -19.023 0.000
Model B
Constant 10.103 0.003058 3304.215 0.000
Linear trend 0.001 0.000020 40.931 0.000
D2 -0.066 0.004000 -15.822 0.000
Model C
Constant 10.10400 0.00500 2070.105 0.000
Linear trend 0.00060 0.00004 16.760 0.000
D3 -0.00005 0.00010 -0.575 0.566
Model D
Constant 10.082000 0.003000 2991.784 0.000
Linear trend 0.001000 0.000030 33.038 0.000
D1 -0.115000 0.005390 -21.408 0.000
D3
0.000416 0.000100 6.930 0.000
Table 3.7A Estimated Trend Models for BSE SENSEX based on Full Sample
Model A
Variable Coefficient Standard error t-statistic p-value
Constant 9.710 0.00500 2024.678 0.000
Linear trend 0.002 0.00004 45.470 0.000
D1 -0.143 0.00800 -18.410 0.000
Model B
Constant 9.753 0.005000 2035.168 0.000
Linear trend 0.001 0.000030 48.656 0.000
D2 -0.081 0.007000 -12.228 0.000
Model C
Constant 9.74600 0.00700 1418.694 0.000
Linear trend 0.00100 0.00050 25.163 0.000
D3 -0.00030 0.00010 -2.827 0.005
Model D
Constant 9.716000 0.005000 1898.499 0.000
Linear trend 0.002000 0.000040 39.920 0.000
D1 -0.153000 0.008248 -18.540 0.000
D3
0.000300 0.000100 3.312 0.001
Table 3.7B Estimated Trend Models for BSE BANEX based on Full Sample.
Model A
Variable Coefficient Standard error t-statistic p-value
Constant 9.715 0.01700 555.414 0.000
Linear trend 0.001 0.00010 10.485 0.000
D1 -0.161 0.02800 -5.677 0.000
Model B
Constant 9.767 0.016000 630.020 0.000
Linear trend 0.001 0.000100 10.088 0.000
D2 -0.031 0.021000 -1.450 0.149
Model C
Constant 9.71200 0.01800 534.401 0.000
Linear trend 0.00100 0.00010 10.409 0.000
D3 -0.00200 0.00030 -5.369 0.000
Model D
Constant 9.689000 0.018700 518.025 0.000
Linear trend 0.002000 0.000200 11.160 0.000
D1 -0.122000 0.030000 -4.067 0.000
D3
-0.001000 0.000300 -3.645 0.001
Table 3.7C Estimated Trend Models for BSE Auto Index based on Full Sample

Mukhopadhyay and Nityananda Sarkar-Demonetization and Its Effects … Econometric Analysis
52
Model A
Variable Coefficient Standard error t-statistic p-value
Constant 6.979 0.01800 395.202 0.000
Linear trend 0.002 0.00010 17.167 0.000
D1 -0.311 0.02900 10.797 0.000
Model B
Constant 7.070 0.015000 481.870 0.000
Linear trend 0.001 0.000100 18.521 0.000
D2 -0.232 0.020000 -11.780 0.000
Model C
Constant 7.12500 0.02100 342.966 0.000
Linear trend 0.00100 0.00020 4.258 0.000
D3 0.00100 0.00040 3.847 0.000
Model D
Constant 7.046000 0.017000 410.991 0.000
Linear trend 0.002000 0.000100 12.559 0.000
D1 -0.402000 0.027000 -14.770 0.000
D3
-0.003000 0.000300 9.708 0.000
Table 3.7D Estimated Trend Models for BSE Reality Index based on Full Sample
Model A
Variable Coefficient Standard error t-statistic p-value
Constant 9.192 0.005000 1723.344 0.000
Linear trend 0.002 0.000040 36.109 0.000
D1 0.107 0.008700 -12.392 0.000
Model B
Constant 9.223 0.0040000 2175.726 0.000
Linear trend 0.001 0.0000200 53.310 0.000
D2 -0.087 0.0060000 -15.022 0.000
Model C
Constant 9.240000 0.006510 1419.256 0.000
Linear trend 0.001000 0.000100 20.005 0.000
D3 0.000400 0.000100 3.560 0.000
Model D
Constant 9.213000 0.0050300 1831.592 0.000
Linear trend 0.001000 0.0001000 32.223 0.000
D1 -0.139000 0.0080000 -17.217 0.000
D3
-0.001000 0.0001000 10.748 0.000
Table 3.7E Estimated Trend Models for BSE Smallcap Index based on Full Sample
Now, reporting on the trend models, we note from the estimated coefficients presented in Tables
3.7A through 3.7E that for all the five models, the constant, time trend and demonetization
dummy are significant for all the five series with the exception of the coefficient of D3 in case
of Model C for BSE SENSEX and that of D2 in case of Model B for BSE Auto.
The impact of demonetization was found to remain effective for a period ranging from 2 to 4
months (January to March 2017) for these series. The coefficient associated with D2 was found
to be negative and statistically significant for these series implying that demonetization led to
a fall in stock prices of these series. It may be mentioned here that the basic model that we have
considered in case of the Bai Perron test includes a constant and a trend term. Further, all the
five series are found to have the coefficient associated with intercept dummy, D1, to be
significantly negative implying a strong effect of demonetization in pulling down the level
values of the series. The slope dummy, however, is found to have differing effects across the
five series. For example, the slope dummy has no significant impact on trend for BSE SENSEX,
but has strong negative effect for BSE Auto and BSE BANKEX as well as strong positive effect
for BSE Realty and BSE Small cap.

International Econometric Review (IER)
53
3.2. Stationary Models for Pre- and post- Demonetization Periods
Apart from the analyses as discussed in the preceding section, an exercise was undertaken to
examine if the univariate models for returns on these indices have changed after this important
monetary policy decision. The purpose was to find if this very rare major decision which acted
like a huge shock to the Indian economy since it was announced all of a sudden without even
any inkling at any level by any source, and the impact of which was hitherto unknown and the
nation was taken completely off-guard, had any effect in the returns models. This exercise of
finding the models with stationary data based on the assumed date has been done from
consideration of intervention analysis where the date of intervention is always assumed to be
known. Treating this act of demonetization as a major monetary intervention by the
Government of India for achieving some very important goals for the Indian economy, we
merely wanted to find the impact of this intervention, if any, on the returns model. Accordingly,
we obtained the ‘best’ univariate model for each of five returns series for both the pre- and post-
demonetization periods. These estimated models are presented in equations (3.1) through (3.8)
below.
Pre-demonetization period (returns on BSE SENSEX)
tr1̂ = 4,1̂162.0006.0 tr (3.1)
(0.867) (2.406)**
Post-demonetization period (returns on BSE SENSEX)
tr1̂ = 3,1̂169.0007.0 tr (3.2)
(1.233) (2.017)**
Pre-demonetization period (returns on BSE BANKEX)
tr2̂ = 9,24,21,2ˆ165.0ˆ16.0ˆ157.0001.0 ttt rrr (3.3)
(1.15) (2.305)** (2.345)** (2.465)**
Post-demonetization period (returns on BSE BANKEX)
tr2̂ = 3,1̂140.0001.0 tr (3.4)
(1.195) (1.657)*
Pre-demonetization period (returns on BSE Reality)
tr4̂ = 5,44,43,41,4ˆ144.0ˆ233.0ˆ144.0ˆ135.0001.0 tttt rrrr (3.5)
(0.101) (1.769)* (1.928)* (3.059)*** (1.841)*
+ 9,48,47,4ˆ218.0ˆ137.0ˆ125.0 ttt rrr
(1.692)* (1.828)* (2.879)***
Post-demonetization period (returns on BSE Reality)
tr4̂ = 9,43,4ˆ133.0ˆ193.0003.0 tt rr (3.6)
(1.634) (2.537)** (1.748)*
Pre-demonetization period (returns on BSE Smallcap)
tr5̂ = 1,5̂133.0003.0 tr (3.7)
(0.382) (1.910)*

Mukhopadhyay and Nityananda Sarkar-Demonetization and Its Effects … Econometric Analysis
54
Post-demonetization period (returns on BSE Smallcap)
tr5̂ = 3,5̂171.0001.0 tr (3.8)
(0.171) (2.058)**
Note: No lag value has been found to be significant for returns on BSE Auto Index.
(*, ** and *** indicate significance at 10%, 5% and 1% levels, respectively.)
It is clear from these equations that in case of four returns series viz., BSE SENSEX, BSE
BANKEX, BSE Reality, and BSE Smallcap the lagged structures of the models on returns have
changed in the pre- and post-demonetization periods which suggest that the underlying
autocorrelation process for each of returns series has changed in these two periods. The ‘best’
models in these two sub-periods were obtained as special AR(4) and AR(3) models in the two
sub-periods, respectively, in case of BSE SENSEX returns. It is observed that for returns on
BSE SENSEX, the 4th lag is significant in pre-demonetization period whereas in the post-
demonetization period it is the 3rd lag. For BSE BANKEX, lags 1, 4 and 9 are significant at 5%
level of significance in the pre-demonetization period, but in the post-demonetization period
only the 3rd lag is significant, that too at 10% level only. Similarly, the difference in the
stationary models in the two sub-periods are found for the returns on BSE Reality and BSE
Smallcap indices, as indicated in equations (3.5) through (3.8). Finally, no lagged term has been
found to be significant for the periods for returns on BSE Auto, and hence the conclusion is that
this series is white noise in both the sub-periods, implying that the change in values of BSE
auto index is completely random, and hence in that sense there is no effect of demonetization
in case of this returns series.
3.3. Change in the Status on Stationarity/Nonstationarity due to Demonetization
Lastly, we now discuss the impact of demonetization in terms of change in the status of the
index series in respect of a basic characteristic of any time series viz., stationarity. To that end,
we have performed the ADF unit root tests on all the five time series at level values for both
the pre-and post- demonetization periods to find whether consequent upon demonetization the
status of the series in terms of stationarity/nonstationarity has changed or not. These results are
presented in Table 3.8.
Pre-demonetization period Post-demonetization period
Index ADF test statistic p-value ADF test statistic p-value
BSE SENSEX -3.551 0.037 -4.241 0.005
BSE BANKEX -3.475 0.045 -3.383 0.058
BSE Auto -4.592 0.001 -4.316 0.004
BSE Reality -2.426 0.365 -3.031 0.12
BSE Smallcap -4.128 0.006 -4.770 0.000
Table 3.8 Results of Unit Root Test at Level Values for Pre-and Post- Demonetization Periods
Notes: p-values are taken from Mackinnon (1996); constant and deterministic trend terms have been found to be
significant in each series.
It is observed from this table that BSE SENSEX series has a unit root at 1% level of significance
and hence it is nonstationary in the pre-demonetized period. However, we also note that the null
of ‘unit root’ is rejected at 1% level of significance in the post-demonetization period. But, in
the post-demonetization period, the estimate of the coefficient attached to the linear trend term
in the ADF estimating equation is found to be 0.0002 which is significant at 1% level of
significance. Hence, the series is nonstationary in the sense of being trend stationary only in the

International Econometric Review (IER)
55
post-demonetization period. Thus, it may be concluded that even after demonetization, the
status of this series has remained nonstationary although of trend stationary kind only. Almost
similar is the case with BSE Auto and BSE Smallcap. For these two indices, unit root is not
significant in both the sub-periods, but the deterministic linear trend has been found to be
significant at 1% level of significance. Thus, it may be concluded that there has been no change
in this basic property of time series for these two indices even after demonetization with both
the series being trend stationary process in both the sub-periods. Insofar as BSE BANEX and
BSE Reality are concerned, it is clear from Table 3.8 that both are nonstationary in both the
sub-periods. The ADF test statistic values for these two series are -3.475 and -2.426,
respectively, in the pre-demonetization period, which are insignificant at 1% level.
Thus both have unit roots in the pre-demonetized period. Same is the conclusion in the post-
demonetized period as well for both the series. Based on these findings, we can conclude that
insofar as this fundamental property of time series is concerned, demonetization as
unanticipated monetary shock has made some impact only in case of one out of the five series
considered viz., BSE SENSEX, in the sense that this series has become trend stationary only
after demonetization.
4. CONCLUSIONS
This paper has carried out a preliminary time series analysis using daily-level data covering the
period 1 January 2016 to 31 May 2017, to study the impacts, if any, of implementation of the
important monetary policy of demonetization in India on BSE SENSEX which is the most well-
known overall stock index of India and four major financial sectoral indices viz., BSE
BANKEX, BSE Auto, BSE Reality, and BSE Smallcap. The findings show that, based on full
sample, all the series are integrated of order one implying that all are nonstationay at level
values but stationary at their first difference values. The test for existence of multiple structural
break points shows that while there is more than one break in all the five series at their level
values, there is only one structural break after demonetization.
For all the index series, the constant term, linear trend term and demonetization dummy variable
in the five trend models considered have been found to be significant with the sole exception
of dummy variable being insignificant in Model C for BSE SENSEX and Model B for BSE
Auto. This, of course, shows the impact of demonetization on the trend behavior of all the
series. However, no break has been found in the first difference values i.e., for returns, on BSE
SENSEX, BSE Auto and BSE Reality. As regards the remaining two returns series i.e., returns
on BSE BANEX and BSE Smallcap, one break has been found to be significant for each at 5%
level of significance, but both the estimated break dates are before demonetization. Further,
some changes have also been observed in the stationary models for the two sub-periods of pre-
and post-demonetization -- for all but BSE Auto index. Finally, except for BSE SENSEX series,
no change in the status of stationarity/nonstationarity in the pre- and post- demonetization
periods has been found in the other series. Even for BSE SENSEX, the series has remained
nonstationary in both the pre- and post-demonetization periods, the only difference being that
it has become trend stationary only in the post-demonetization period. Overall, it may thus be
concluded that except for occurrence of one structural break after demonetization which is also
captured in the estimated trend models for all the five series, and some changes in returns model
after demonetization for some series, no other major impact of this very important financial
decision of demonetization by the Government of India has been found in any of the five
financial sectors considered in this study.

Mukhopadhyay and Nityananda Sarkar-Demonetization and Its Effects … Econometric Analysis
56
REFERENCES
Ahmed, M., G. Haider and A. Zaman (2017). Detecting Structural Change with
Heteroskedasticity. Communications in Statistics-Theory and Methods, 46 (17), 10446–
455.
Andrews, D.W.K. (1993). Tests for parameter instability and structural change with unknown
change point. Econometrica, 61, 821–856.
Bai, J., and P. Perron (1998). Estimating and Testing Linear Models with Multiple Structural
Changes. Econometrica, 66 (1), 47–78.
Bai, J., and P. Perron (2001). Multiple and Structural Change Models: A Simulation Analysis.
Columbia University Press.
Bai, J., and P. Perron (2003). Computation and Analysis of Multiple Structural Change Model.
Journal of Applied Econometrics, 18, 1–22.
Chow, G.C. (1960). Tests of Equality Between Sets of Coefficients in Two Linear Regressions.
Econometrica, 28 (3), 591–605.
Dasgupta, D. (2016). Theoretical Analysis of Demonetization. Economic and Political Weekly,
51 (51), 67 - 71.
Ioannidis, C. and A. Kontonikas (2006). Monetary Policy and the stock market: Some
International Evidence. Working Paper. University of Glasgow, Glasgow.
Kiyotaki, N. and R. Wright (1989). On Money as a Medium of Exchange. The Journal of
Political Economy, 87 (4), 927–954.
Maasoumi, E., A. Zaman and M. Ahmed (2010). Tests for Structural Change, Aggregation, and
Homogeneity. Economic Modeling, 27 (6), 1382–1391.
MacKinnon, J.G. (1996). Numerical distribution functions for unit root and cointegration tests.
Journal of applied econometrics, 11 (6), 601–618.
Muthulakshmi, E.K. and G. Kalaimani (2016). Impact of Demonetization on Indian Economy.
IOSR Journal of Humanities and Social Sciences, 50–54.
Nelson, C.R. and C.I. Plosser (1982). Trends and random walks in macroeconomic time series:
Some evidences and implications. Journal of Monetary Economics, 10, 139–62.
Rao, K., S. Mukherjee, S. Kumar, D.P. Sengupta, S. Tandon and S. Nayudu (2016).
Demonetization: Impact on the Indian Economy. NIPFP, Working Paper No. 182. New
Delhi.
Rogoff, Kenneth S. (1998). Foreign and Underground Demand for Euro Notes: Blessing or
Curse? Economic Policy, 26, 263–303.

International Econometric Review (IER)
57
Rogoff, Kenneth S. (2002). The Surprising Popularity of Paper Currency. Finance and
Development 39 (1), 56–7.
Rogoff, Kenneth S. (2014). Costs and benefits to phasing out paper currency. NBER
Macroeconomics Annual Conference. Harvard University Press.
Rogoff, Kenneth S. (2016). The Curse of Cash. Princeton: Princeton University Press.