Embed Size (px)
Citation preview
PRELIMINARY
Please do not cite without authors permission.
SOVEREIGN WEALTH FUND PORTFOLIOS
November, 2010
ABSTRACT
Using a novel dataset of Sovereign Wealth Fund (SWF) investments in public equities, private firms, private equity and real estate, we test for the importance of various objectives. We find that financial investor objectives help to explain their investment decisions, but there is great variation across funds. Considering state industrial planning as an alternative objective significantly increases explanatory power, particularly for the less-transparent funds. Consistent with this objective, SWFs are more likely to invest with larger stakes bringing control in particular industries (especially finance, but also transport, telecommunications and energy) and in particular regions (the Middle East and Asia).

Sovereign wealth funds (SWFs) control $2.7 to $3.2 trillion in assets (GAO, 2008). They
are large, have few short-term liabilities, and are free to invest in multiple asset classes. They
have the potential to impact global capital allocation, but how they do so depends upon their
objectives. We assemble a novel data set of SWF portfolio holdings. We analyze their portfolios,
and try to understand the investment objectives driving those portfolio decisions.
We distinguish two broad objectives: financial portfolio investment vs. industrial
planning allocations. SWFs could be motivated solely by securing appropriately risk-adjusted
financial returns. This view predicts broad industry and geographic diversification in their
portfolios, as well as across alternative types of risky assets. An alternative possibility is that
they are best thought of as industrial planners, using their allocations of risky assets to try to
achieve state planning and other political objectives. This objective predicts more domestic and
regional investments, and more focused industry allocations consistent with announced planning
objectives.
We assemble time series holdings across risky asset classes for all of the important
sovereign wealth funds from 1999-2008, including the less transparent Middle Eastern and Asian
funds. We include funds with more than $10 billion in assets as of 2007, which results in 20
funds averaging $116 billion per fund with $2.03 trillion in assets under management and $1.43
trillion in risky assets under management. Our data go beyond holdings of international publicly
traded firms to include firm or property-level data for public and privately held assets, complete
with a time-series calculation of value. These non-public market holdings are significant, with
private equities and real estate accounting for as much as public equity investments (and more
than two times the international public equity holdings). Incorporating such assets not only
avoids an omitted variable problem in considering portfolio choices, but is needed to capture
potential industrial planning objectives.
The dependent variable which we try to explain is SWF (risky) portfolio weight in an
asset class across industries (thirteen industry categories) or industry-geographies (thirteen
industries crossed with seven world regions). Since holdings are sticky, we need to address
within-SWF serial correlation. We implement two conservative methods – a model where we

1
cluster errors at the 20 SWF level and a GLS-AR1 model. We do not incorporate fixed income
holdings of SWFs into our analysis, as choices on the level and type of fixed income instruments
are much more likely to depend heavily on other fixed income holdings on the government
balance sheet outside our analysis (e.g. central bank).
The main variables we use to identify the ability of financial portfolio objectives to
explain these allocation choices are world market capitalization weights and mean weights of an
international sample of 90 large pension plans meeting the same size criteria we impose on
SWFs. Using the pension plan data also allows us to incorporate potential home bias in
allocations coming through the measures of financial investor objectives. We calculate a home
bias using the pension data and then re-home bias each SWF-year pension allocation as if the
pension fund were located in the SWF country of the observation. Finally, we introduce a third
set of variables related to the riskiness in the shadow portfolio of the SWF coming from the non-
financial wealth of the state, as the state as owner of the SWF has many other sources of non-
financial wealth, and models of portfolio choice with non-financial income (e.g. Bodie, Merton
and Samuelson (1992)) suggest this will affect portfolio decisions. We focus on the implied
hedging motive coming from considering the non-financial income risk.
We find that the benchmark financial portfolio measures have significant explanatory
power. The capitalization benchmark has power in explaining SWF choices across asset classes
with different risk characteristics, in particular, the significant weight on private equities and real
estate in world capitalization helping to capture the significant weight on those assets classes in
SWF portfolios. The (home-biased) pension fund has power in explaining the allocation within
asset classes across regions and industries. Considering financial objectives alone, we do not find
that SWF managers act to hedge non-financial income risk.
The alternative hypothesis we test is that portfolio allocation choices are driven by a
desire to achieve industrial planning objectives. What distinguishes SWFs from other
institutional investors is that they are owned and controlled by the state with few short-term
liabilities, implying that the state could use these vehicles to pursue planning or other political
objectives. Many countries state a desire to develop industries to help diversify their economic
base by focusing on industries that will reduce overall income volatility or provide sustainable
2
employment for local citizens. Similarly, they state a desire to develop basic physical and
financial infrastructure to facilitate development of such industries. Countries also state a desire
to expand in areas where they already have skill and potentially superior information. It is
certainly possible that these statements may be a cover for politically-motivated investment, but
it does give a predicted direction to their portfolio allocation.
We measure the incentive and execution of planning goals with two main variables. The
first is an indicator for industries highlighted in government (not SWF) national strategic plans.
The second is measure of perceived skill, which we construct as the percentage of domestic
investments in the industry invested with controlling stake. To avoid endogeneity, we impose the
mean SWF percentage if there are no investments in that industry by the SWF. The importance
of planning objectives we also hypothesize depends upon the perceived need for such activity.
To explore this possibility we interact our planning variables with a measure of the time until the
natural resource wealth source runs out (e.g. years of oil reserves). We also allow for the
possibility that the likelihood that SWF will engage in skill investing will depend upon the
boards experience.
We find that our measures to capture planning objectives also have significant
explanatory power. Strategic plan targeted industries receive significantly greater allocations as
well as those industries where the state has some perceived skill. The tilt toward industries
mentioned for industrial development in the national strategic plans (not SWF mandates) is
especially pronounced for countries whose incentive to diversify may be larger – those whose oil
reserves are running out sooner. We also find that SWFs allocate portfolios to reflect their
perceived skill less when board members are more experienced in asset management.
The value of allowing for the possibility that SWFs pursue both objectives is seen most
clearly when we combine both measures in the same regression and see the significant increase
in the incremental explanatory power. In our toughest test looking at the industry-geography
choices we find that measures of financial objectives produce an r-squared of 7.7 percent,
measures of planning objectives provide an r-squared of 6.1 percent, and including both leads to
explanatory power of 14.2 percent. In our industry regressions, where we collapse the
geographic dimension, we have r-squared of 27.4 percent. These patterns are consistent with
3
financial portfolio investment and industrial planning representing different dimensions to the
same fund and/or with a heterogeneity of objectives across funds.
To disentangle these possibilities, we look separately at the explanatory power of
financial portfolio and industrial planning variables for each fund and decompose the r-squared
based on the objective (discarding the covariance). This decomposition paints an important
picture of the heterogeneity across funds. For some funds, measures of financial portfolio
objectives capture almost all of the explained variance. We find that, as expected, Alaska, GIC
Singapore and Norway Global look very much like financial investors (75-80% of the empirical
prediction comes from applying the financial portfolio investor estimates). Two big Middle
eastern funds, ADIA and Duabi Holding, also load more strongly on the financial portfolio
investor. In contrast, for most of the smaller SWFs as well as Singapore Temasek, the
Investment Corporation of Dubai, Kuwait and China, industrial planning measures account for
over half of the variation. A set of three Middle Eastern SWFs seem to have dual objectives,
with both financial portfolio and industrial planning variables playing a large role in explaining
their portfolios. If we just look across the full set of large Middle Funds, we do a good job of
explaining their portfolios as a whole, particularly because we allow for industrial planning
objectives as well that account for 33-43% of the explained variation. These results suggest the
power of these multiple objectives in their allocation choices.
The empirical importance of planning objectives leads to additional predictions about
control rights SWFs will seek in making their investments. If financial objectives dominate,
diversification pushes towards limiting the stakes in particular firms. With planning objectives,
the goal is to extract information or apply skill, and/or to expand activity even if this does not
lead to financial returns. In all cases, control rights will be important. In the context of our data,
such concerns lead to predictions that control rights will be more important (i) for SWFs where
planning objectives play a larger role, (ii) for domestic investments where planning objectives
are ultimately realized, and (iii) for industries central to a plan.
We find evidence in support of all of these predictions. Summary statistics show that
SWFs own 4.3% and 6.4% of public equity in Asia and the Middle East respectively and 12 % of
private equity whereas portfolio investor benchmarks predict stakes of less than one percent.
4
Almost all of these domestic holdings are active, where we identify active as having a 5% stake
or greater. In contrast, SWFs own much smaller portions of public market in the West, on the
order of 1-2%. They own 4.8% of worldwide public equity in finance companies, and 70% of
this is invested actively. They also invest actively in transport, energy and transport
manufacturing. These are some of the most commonly cited industries in strategic plans. We
also test for the power of planning objectives to explain the variation in ownership across
industries and geographies, finding strong evidence that the r-squared for planning predicts
higher ownership concentration, as does measures for industrial planning, and home country
dummies.
In sum, we conclude that you can understand SWFs much better by considering their
choices driven both by portfolio investor objectives and by industrial planning objectives. These
results suggest that we think about SWFs and their potential impact differently. It suggests that
we need to acknowledge and address the significant heterogeneity across funds. The most
transparent funds like Norway that pursue relatively pure portfolio investor objectives are simply
not representative of the group as a whole.
This paper is complementary to a growing literature on sovereign wealth funds. A
number of papers have focused on SWF investments in international public equities (e.g.
Bortolotti, Fotak, Megginson and Miracky (2009), Kotter and Lel (2008), Dewenter, Han and
Malatesta (2008), and Fernandes (2009)) and have used this data to document industry and
geographical focus as well as testing for potential agency costs by correlating proxies for fund
governance with short and long window returns around announced SWF investments.1
Bernstein, Lerner and Schoar (2009) have focused on a set of private investments by SWF, and
have exploited the timing of these investments and their implied returns to test for political,
developmental and agency agendas. The main finding is weakness in SWF returns and a
negative correlation between fund governance and returns, concluding that the evidence is least
consistent with a developmental objective. Our paper differs from these in using a larger set of
investments (simultaneously consider international and domestic traded equities, private equities,
investments in private equity and real estate), in exploring tilts in these broader portfolios, as
well as considering and testing for the empirical importance of economic objectives that predict 1 Bortolotti, Fotak, Megginson and Miracky (2009) provides a summary of this literature.
5
tilt in portfolios. This provides more nuanced conclusions about SWFs that capture some of the
important heterogeneity across these funds. In focusing on portfolios, our paper is closer to
Chhaochharia and Laeven (2008), with important distinctions being that we are looking at their
full portfolio rather than restricting attention to their international holdings of public equities, our
investigation of a much larger (and different set) of SWFs and our consideration of a wide range
of economic motivations for explaining portfolio choices.
The rest of the paper is organized as follows. Section I describes the data for constructing
the SWF portfolios and summarizes the overall portfolio values. Section II describes alternative
objectives that might be driving portfolio choices, introduces measures to capture these
objectives in the data, and introduces univariate comparisons of SWF funds against these
measures. In section III we test the financial investor and industrial planner hypotheses. We
discuss implications of these results in section IV and conclude in section V.
I SWFs and Portfolio Data
There are a number of state-owned entities that are active in global financial markets.
Central banks tasked with stabilization usually accumulate and invest foreign exchange reserves
in international fixed income. State-owned operating companies often use their profits to extend
operations worldwide through acquisitions. State-owned pension funds accumulate savings from
individuals and employ them, often internationally, with clear liabilities to existing and future
pensioners. The SWFs that have become the focus of most attention in recent years belong to
none of these categories. They are instead a state-owned investment company, claiming a long
time horizon and consequently the ability to invest in a wide range of asset classes.
To capture these distinctions in our data collection we restrict our attention to those
SWFs that satisfy a commonly used definition in the literature (the Monitor Group definition of a
sovereign wealth fund, included as appendix A). We further limit our attention to the non-
stabilization portions of SWF portfolios, which leads us to exclude from analysis any funds that
have a purely stabilization motive. Specifically, we restrict our attention to the risky portfolios
that we define to exclude fixed income. Such a filter, for example, leads us not to examine a
Chilean fund sometimes described as a SWF that has all of its portfolio in highly liquid fixed

6
income securities. Finally, we restrict our attention to funds with significant investments, which
we classify as having at least $10 billion in assets under management in public reports as of end
of year 2007. These requirements lead us to focus on 20 funds that we identify in Table 1.2 This
list of funds accounts for almost all of the money in SWFs; namely, $2.33 trillion in end-of-year
2008 wealth according to Preqin (2009), even after recent losses. We gather data on their
investments from 1990 until 2008, focusing in this paper on the 1999-2008 where there are more
funds and the data quality is better.
Funds in our sample are the largest, most important and widely recognized SWFs. These
include old funds, such as the Kuwait Investment Authority, that had its origins back in 1953, as
well as recently formed funds such as the China Investment Corporation, founded in 2007.
These funds differ not only in age, but also in the primary source of wealth. Many funds,
particularly in the Middle East, and the few western funds from Norway and Alaska, rely on
wealth arising from natural resource extraction. Others, particularly in Asia such as Singapore’s
Temasek and GIC, use as the basis for their funds savings, foreign currency reserves from trade
surpluses as well as the transfer of wealth with legacy state-owned companies. Finally, we do
not employ any filter based on ex ante transparency, which across funds is low.3 A few funds
(e.g., Norway and Alaska) do disclose their holdings, but these are the exception rather than the
rule. Even among some high transparency funds (e.g., Singapore’s Temasek), transparency does
not imply a disclosure of the fund’s portfolio.
To put together portfolios, we start at the most direct source, the SWF itself. Like other
private investors, SWFs are not required to disclose their portfolios. Some disclose their target
asset allocations in percentages, and they all must disclose large stake holdings in public equity
as required by regulatory agencies. They often do disclose ownership in select domestic private
endeavors (such as building projects) and previously state-owned entities like utilities or
2 Abu Dhabi Investment Authority (ADIA), Abu Dhabi Investment Council (ADIC), Alaska Permanent Reserve Fund, Bahrain Mumtalakat Fund, China Investment Corporation (CIC), Dubai Holdings, Dubai World, Government of Singapore Investment Corporation (GIC), International Petroleum Investment Corporation of Abu Dhabi (IPIC), Investment Corporation of Dubai, Kuwait Investment Authority (KIA), Khazanah Nasional of Malaysia, Libya Investment Authority (LIA), Mubadala Development of Abu Dhabi, Norway Government Pension Fund- Local, Norway Government Pension Fund - Global, Qatar Investment Authority (QIA), and Temasek Holdings of Singapore. This draft does not include data for one of these funds -- Khazanah Nasional of Malaysia. 3 Two of the more commonly used measures of transparency are the Linaburg Maduaell transparency scores, available at swfinstitute.com and the Truman governance scores (Truman, 2007, 2008).

7
transport. Even when a SWF reveals holding equity in a company, the stake held is often not
given, and almost always the SWF does not provide a private valuation.
The holdings that are not disclosed are not transparent or easily accessible, but we found
that a great number of them are not totally under the radar of public knowledge. The data
challenge we undertake is to uncover the existence of a holding, often from range of agencies
that specialize in gathering information on financial markets. With this information we then do a
case study on each company via international news sources to fill-in missing ownership stakes
and transaction histories, dynamically valuing all public companies, private companies,
properties, and private equity fund investments, and then doing broad sweeping searches to make
sure we did not miss anything. In doing so we are very careful to identify all subsidiaries of the
SWF, as often the investments are in the name of a subsidiary rather than the corporate parent.
For domestic and regional public equity holdings we use local sources such as The
Business Times of Singapore and AME and Zawya (both Middle Eastern business sources). These
sources provide much more comprehensive information on activities and holdings than is
available if one restricts attention to standard international sources like Capital IQ or Thomson
One Banker. Second, we spend as much attention on gathering enough information to identify,
value and determine the ownership stake in private investments as for investments in public
equities. Finally, as the public has learned from the challenges facing Dubai, real estate holdings
can be significant across SWFs and we use a variety of approaches to value the investments in
active as well as properties under development. Because the reconstruction of the portfolios has
been a lengthy process, we relegate details of these efforts to the appendix.
Table 1 summarizes the results of this data collection effort for 20084, showing that we
have identified investments accounting for 2.03 trillion, just 13 percent less than the public
estimates of 2.33 trillion (columns 1-2). Our calculated total is based on more than 26,000
unique companies and even more transactions (we have multiple transactions for many
companies) in public equities, private equities and real estate. Not surprisingly, the gap between
our estimates and public estimates is greatest for the least transparent and large funds of Kuwait
and the Abu Dhabi Investment Authority, where public estimates also have significant variance.
4 We have all years from 1998-2008; the choice of presenting 2008 figures in Table 1 is just for clarity of exposition.
8
While we have undoubtedly missed some investments where there is very little publicly
available information as to the extent and nature of investments such as hedge fund investments,
these data are to our understanding the most comprehensive micro based accounting of SWF
investments available to date.
In columns 3-6 of Table 1 we break down our 2.03 trillion estimate along three
dimensions. Column 3 reports the value in the risky portfolio in public equities, private equities
and real estate for which we know the individual investments or know enough to identify
industry and geography for these investments. A portion of these amounts are indexed public
equities; we infer the industry and geography of these investments by utilizing decompositions of
global and local market indexes. In column 4 we identify the number of individual companies,
private equity funds and properties used in arriving at these totals for risky investments, with a
much greater number naturally coming from Alaska and Norway as these funds provide specific
holding of even very small stakes. For many of these companies we have multiple transactions,
as over time the company has increased or decreased its stakes. In column 5 we report our
estimate of fixed income holdings and in column 6 hedge funds/other alternatives holdings (not
including real estate and private equity) respectively. To produce these last two columns we use
either the exact amounts in these classes provided for those funds which produce such detail or
can be inferred from public statements (e.g. Alaska, Norway, CIC, Libya), and when this is not
available we take the value of the risky assets which we have identified and apply the percentage
in such categories given by the SWF as to how much fall in fixed income and other alternatives
asset classes. As mentioned above, because fixed income holdings may be used for stabilization
purposes, or are close substitutes for other government funds in central banks that are used for
such purposes, we do not consider them in the analysis of risky portfolios we now turn our
attention to.
II Objectives
Having assembled the requisite data on SWF investment portfolios, we now identify the
measures we use to capture portfolio investment versus industrial planning objectives.
II.1 Primary Measures for Portfolio Investor Objectives
9
The stated objectives of many, if not most, of the SWFs is to maximize risk-adjusted
returns.5 This is also the view of the objectives of SWFs according to many in the financial
community.6 To capture portfolio investor objectives, we use two benchmarks.
The first benchmark we employ is the proportion of world capitalized value in the asset
class, geography and industry. For equities we use the world market capitalization from all
traded companies in Datastream broken down by industry and country and do this for each year
in our dataset. For real estate, we take advantage of an investment advisor method that calculates
investable real estate as a function of GDP (Prudential Real Estate Investors, 2010).7
The calculation of the capitalized value of investable world private equity is more
challenging. We use data from Orbis on private companies in Europe and then extrapolate
findings from here for other geographies.8 Orbis provides data for an extensive set of private
companies across eastern and western Europe, much of it drawing on disclosure requirements
from European tax authorities.9 This source consistently reports company revenues, and we
combine this with a private firm revenue multiple of 0.7073 calculated in Moskowitz and
Vissing-Jorgensen (2002) to produce valuations that we then aggregate to fourteen industries.
This suggests the capitalization of private companies is 2.5 times public equities. For non-
European countries aside from the US, we take this ratio of private equity-to-public equity
capitalization found in Europe (specific for each of the fourteen industries) and apply this to each
country’s public market capitalization by industry. For the United States, we use Moskowitz and
Vissing-Jorgensen (2005) calculated ratio of private-to-public equity capitalization of 0.79
public equities, consistent with the higher fraction of assets in public markets in the US. 5 The Norwegian Government Pension Fund, for example, states “The Fund shall be safely managed based on the objective of high return subject to moderate risk.” And the Alaska Permanent Fund’s goal is to achieve a “five percent real (above inflation) rate of return in accordance with the Prudent Expert Rule.”5 Similar language is employed by less transparent funds. The Abu Dhabi Investment Authority, for example states “ADIA’s decisions are based solely on its economic objectives of delivering sustained long-term financial returns.” The China Investment Corporation states in its annual report that “Our mission is to make long-term investments that maximize risk-adjusted financial returns for the benefit of the State, our shareholder.” 5 6 For example, “At the end of the day, sovereign wealth funds are just institutional investors that look to make returns for their shareholders," Hani Kablawi, Bank of New York Mellon Corp, Dec 7, 2009 7 Prudential real estate investors calculates the value of the commercial real estate market as: Value of Real Estate = 45% x GDP x (GDH/Threshold GDH)^1/3, where GDH is per capita GDP and threshold GDP is, for countries with less than the threshold GDP, defined as $20,000 in 2000, adjusted for inflation to be $24,921 in 2009. In 2009, Prudential applied ad hoc adjustments to Singapore, Hong Kong, and the United Kingdom, as well as to the Gulf States. Without a series of adjustments from Prudential, we phased out the Gulf States adjustment prior back to 2006 and kept the other adjustment throughout our sample. 8 Orbis is a Bureu Van Dijk database that includes all companies in AMADEUS. 9 We limit our search to active, private companies with more than 1,000,000 USD in revenues in their last reporting year. We use hand and computer searches to avoid duplicate companies and companies that are not investable (e.g. the Post Office which is 100 percent state-owned).

10
As a second benchmark we use the allocation of large pension plans that meet similar
criteria as our SWFs – they have $10 billion in assets in 2007 and invest across a range of asset
classes.10 This data is drawn from CEM benchmarking, a Toronto based consultancy that
collects information on allocations, costs and returns for a large sample of international pension
plans from 1990-2008. The CEM dataset, used in a number of recent papers (French (2009),
Dyck and Pomorski (2010) and Bauer and Frehen (2008)), has data on pension fund holdings for
716 funds over the period 1992-2008. In 2008, 345 pension funds participated, accounting for
$4.8 trillion in assets, with $2.3 trillion coming from non-US funds. Requiring that funds have
over $10 billion in assets in 2007 restricts our attention to 90 pension funds that meet this criteria
in 2007.
We use CEM data to construct the pension fund benchmark portfolio. CEM provides the
asset class percentage breakdowns directly for each pension fund. Within public equities and real
estate, CEM has information on the geographic breakdown of assets to the United States, EAFE
(Europe, Australia and Far East) and emerging markets. Within these geographies, most funds
indicate that they benchmark to the MSCI index for that region. We reproduce individual
companies (and thus countries and industries) of the MSCI indexes annually with IShares
portfolios, which are designed to track the MSCI indexes with minimal tracking error.
An important facet of pension investing is a home bias in investments, which we
agnostically take as a feature of the pension allocations. CEM provides more detail on geography
for Canadian pension funds, which we use to construct a time series of pension home bias (as a
percentage of the portfolio). We want to have this home bias in our pension plan benchmark. To
accomplish this in our tests we first de-home bias each of the 90 pension fund portfolios by
reducing the exposure to the pension fund home country in proportion to Canadian home bias
percentage and then, for each SWF, we home bias the allocations to the home country of each
SWF, making a benchmark pension allocation as if the pension fund resided in, e.g., Singapore,
the Emirates or Kuwait.
10 Dyck and Pomorski (2010) show that larger funds are more likely to have higher allocations to alternatives, even controlling for liquidity risk. We can empirically control for potential differences in investment horizon by including a variable for the percentage of liabilities associated with retirees, which is a reasonable proxy for the time horizon of the fund.

11
The final piece is to allocate geography and industry breakdowns for private equity. As a
measure of the industry and geographic mix of private equity investment, we use data from
Capital IQ. Finally, we impose the home bias in private equity fund investing implied by the
Canadian pension funds.
II.2 Univariate Comparisons of SWF and Financial Investor Benchmarks
Table 2 presents the SWF risky portfolio weights and shows these weights by geographic
region. In panel B we present data on regional allocations for our two portfolio investor
benchmark portfolios to provide a basis for comparison. To construct panel A, for each SWF we
first create a time-series average from the years covered and then take an equally weighted
average across SWFs. The non-public parts of SWF portfolios are large with the combined
private equities and real estate account for almost half the portfolio equaling 48% of the
portfolio. And the public equities allocation we report is an overstatement of investments where
SWF have potential control rights, for it includes large indexed positions by SWFs like ADIA,
Kuwait and GIC Singapore, as well as the quasi-indexed investments of Norway and Alaska.11
The extent of the investments in non-public equities makes them quite distinct from pension plan
investors. As we report in Panel B, large pension plans have only 15 percent allocations to these
alternative asset classes, 5 percent in private equities and 10 percent in real estate and other real
assets. While a significant overweighting relative to pension plans, panel B also shows us that
this is an underweighting relative to world capitalization, where investable private equities and
real estate, given our estimates described above account for 52 percent and 16 percent of
available risky assets worldwide.
The limited ability of portfolio investor objectives to explain these portfolios is evident in
the geographical focus of their portfolios in table 2. Public equity allocations are skewed
towards the home regions of SWFs with 13.1 percent of equities targeted on Asian firms,
whereas world equity capitalization would have this at just 3.9 percent and pension plan
allocations only allocate 2.9 percent. For the Middle East, SWFs invest 7.7 percent of their
public equity allocations to this region, whereas world and pension plan capitalizations never
11 Norway invests relatively small stakes in a large number of companies (7,900 in 2008) and only has stakes in excess of 5 percent in 3 companies.
12
exceed 1 percent (0.6 and 0.9 percent respectively). The value of our data collection on private
equities and real estate is to show that the distortions in public equities are a significant
understatement of the tilts in their portfolios. This is seen most clearly in comparing the
allocations to the middle East where SWF allocations to these regions account for 14.6 percent of
their portfolios in both private equity and real estate, and the combined sum of 28.6 percent of
their portfolios to these regions eclipses the 1 percent and 0.4 percent that sum to just 1.4 percent
using world capitalization benchmarks. The bottom line from this analysis is provided in
columns 5 and 6 of panel A where we present the difference between SWF portfolios and our
two benchmarks by regions, with Asia receiving 9.5 percent (19.6) greater allocation than the
capitalization (pension plan) benchmark, and the Middle East receiving 34.9 percent (35.9)
greater.
Another way to see if financial investor objectives explain SWF portfolios is to look at
whether the industrial patterns in their portfolio allocations are similar. We summarize the
differences between SWF allocations and these financial investor benchmarks in their industrial
mix in columns 5 and 6 of panel A. This shows significant differences in industrial patterns,
most notably overweighting in a few industries. Probably most surprising is the overweighting
of energy, with an allocation that exceeds pension plan allocations by 6.4 percent, 76 percent
higher than the pension plan allocation to this industry, and this is 11.4 percent higher than the
world market capitalization in this sector. We see similar patterns in overweighting both
benchmarks in transportation, with a 7.1 percent greater allocation than the pension plan
benchmark and a 6.0 percent greater difference than the capitalization benchmark, equivalent to
470 percent (270) greater than pension plan allocation (capitalization).
Taken together, this preliminary data paints a different picture of SWFs. It suggests that
they are different than portfolio investors, weighting private equities heavily and, as we will
show later, taking significant stakes by company. Second, it suggests that they focus on regional
rather than Western markets. Accounting for real estate investments, which are predominantly
local, further reinforces the importance of domestic assets in SWF portfolios. And it is precisely
in these companies where ownership stakes are largest. Third, it suggests the impact might be
greatest for specific industries, rather than equally spread out across all industries.

13
II.3 Secondary Measures for Portfolio Investor Objectives: Non-Financial Income Hedging
Variables
While the comparative statistics suggest financial objectives have only a limited ability
to explain investment allocations, this may be a limit of the measures we have used. There is a
non-financial income risk literature that emphasizes how financial allocations can be influenced
by the presence of non-financial income, hedging this non-financial income risk through their
financial portfolios. 12 The nation-states that own SWFs also have non-financial income that is
captured in their gross domestic product. The non-financial income risk literature predicts, first,
that SWFs should have a lower appetite for risk if the variance of national income is high,
assuming a positive correlation between income and risky asset returns, or vice versa if the
correlation between income and risky assets is negative. Following Massa and Siminov (2006),
we construct StDev(National Income)*Sign as the standard deviation of SWF home country
income times the sign of the correlation of the GDP with the market global return. Interestingly,
since oil rich countries often do well during periods of down financial markets, this predicts that
countries dependent on oil income might prefer investments with more systematic risk.
Second, this literature predicts that SWFs should adjust allocations toward industries or
geographies negatively correlated or uncorrelated with their national income stream. For
example, this implies that SWFs with national income heavily influenced by trends in oil income
would have an incentive to avoid financial investments with returns highly correlated with oil.
We try to capture this possible hedging of their financial investments by constructing the 19
year, rolling correlation of SWF country GDP and value weighted returns in the geography-
industry sector. As in the variance variable, the sign of the relationship between GDP and market
returns matters. Again following Massa and Siminov (2006), we split the correlation effect
according to whether national income is positively or negatively correlated with returns. The
patterns in industry allocation from table 3, particularly the overweighting in energy, provide a
12 Guiso, Jappelli, and Terlizzese (1996), Heaton and Lucas (2000), Vissing-Jorgensen (2002) look at fixed income versus equity allocations and find evidence for hedging the variance of non-financial income with portfolios exposure to equities, but little-to-no evidence of hedging of the correlation of income with the market. Dimmock (2009) finds that universities with greater non-financial income risk shift endowments towards fixed income and away from alternative assets. Massa and Siminov (2006) offer evidence that investors in fact tilt their portfolios toward industries and geographies correlated with their non-financial income sources of risk, offering an explanation that such behavior reflects investing toward greater familiarity in an information-constrained world.
14
preliminary indication that this hedging may not be evident, but we will leave a more definitive
assessment to our regression estimates that we explore below.
We introduce a third variable that might affect hedging through the SWF – the level of
foreign reserves expressed as a fraction of GDP. The idea here is that countries will be more
willing to take on risky positions if they have a significant amount of reserves and we use the
most comprehensive measure of such reserves, including reserves held by the central bank.
Most of the non-financial income literature focuses on individuals’ portfolio choice
between fixed income and public equities; in these dimensions the notion of hedging away from
risk (away from equity) is fairly straightforward. In our case, we have multiple risky asset
classes. Dimmock (2009), in studying endowments, also considers multiple risky asset classes.
His approach to understanding income risk hedging is to allow hedging to be identified uniquely
for each asset class. At times we follow a similar approach, restricting our attention to public or
private equities separately. We also employ a second method of multiplying the hedge variables
by the industry-geography betas to see whether hedging alters the appetite for beta-measured
risk. This method is straightforward and appealing for public equities. For real estate, we use
publicly traded real estate industry betas for the entire real estate holdings.13 For private equity,
we use the public equity betas and multiply each industry-geography beta times 1.73, the beta
estimate from Hall and Woodward (2007).14
II.4 Industrial Planner Objectives and Measures
The financial investor perspective ignores an essential feature of SWFs - they are owned
by the state. As Ang (2010) emphasizes, this makes their management fundamentally different
from ordinary investment management companies, and to maintain legitimacy they need to
attend to wider political and economic factors.
We hypothesize, and then examine, that states use SWFs to achieve industrial planning
objectives, using these vehicles as one tool to achieve specified national developmental goals 13 This is imperfect in that the real estate betas from the market will be higher than for private property holdings, but since beta risk for real estate is not a perfect concept for portfolio risk, we think the bias goes in the correcting direction. 14 The beta estimates for venture capital range from less than 1 to 3.2. Buyout is thought to be closer to 1. We cannot disentangle private equity in buyout versus venture, although the bulk of firms are startup, and thus choose to use Hall and Woodward’s (2007), relatively conservative venture estimate of 1.73 for both.
15
and/or exploiting perceived skills the state has in particular industries. In short, we are asking
whether at least part of their portfolio operates either explicitly or implicitly as a sort of
sovereign development fund. We do this, in part, because this is what a number of funds
explicitly say is motivating their investment patterns. For example, Mubadala, an Abu Dhabi
SWF states: “Mubadala is a catalyst for economic diversification of Abu Dhabi.”15 It has bought
stakes in foreign companies, and/or established domestic joint ventures with the desire to exploit
foreign firms knowledge and skill and bring them to bear for domestic development purposes.
Or consider the statement of the objectives behind the largest CIC controlled holding that “was
established to invest exclusively in domestic state-owned financial institutions on behalf of the
state in order to improve governance and preserve and enhance the value of state-owned
financial assets.” 16
The desire to use a sovereign wealth fund to pursue developmental objectives can be
rationalized on social welfare grounds, although it need not be driven by such logic and could
emerge for other political reasons. This can also be seen as an alternative hedging strategy, but
instead of predicting not investing in industries highly correlated with current income risk, it
predicts investing in industries that have the long-run potential to diversify the employment
returns to the economy. In the short run, these industries may even be highly correlated with their
background risk. A developmental agenda may be social welfare maximizing if the overall
returns to its citizens are higher because sector development enhances the present value of future
returns to human capital or because citizens benefit from a more diversified economy. For
example, investments that generate spillover effects on local companies by enhancing
transmission of knowledge and technology may increase the returns to the stock of domestic
human capital. Or it may be that society utility (not just financial wealth) may be higher when
labor income is less tied to a dominant income sector (e.g., oil).
The SWF may also be used as a tool to exploit perceived skills the state has in particular
industries or superior information it has about particular industries. For a number of countries,
the initial ‘endowment’ of the fund includes state-owned enterprises that may or may not be
partially privatized, or alternatively the state has controlling stakes in enterprises for many years. 15 Mubadala Annual Report 2008. 16 This industrial planning perspective has been underemphasized in the academic literature, but has not been ignored in policy-oriented papers (e.g. Santiso (2009)).
16
This close proximity to industries may lead SWF managers to believe they have superior
information or skill about the industry, and they may seek to exploit this in their investment
patterns, producing a geographic or industry tilt to their portfolios. For example, Temasek of
Singapore was given the state’s stake in Singapore airlines, and Temasek’s subsequent
investments in a series of airlines in the region could be related to a perceived ability and
knowledge in this sector. This argument is closely related to the explanation offered for the
patterns of investing in Massa and Siminov (2006).
We construct state industrial planner variables to attempt to capture the presence of
industrial planning objectives, and the industry or geographic direction in such objectives. Our
primary measure of industrial planning is based on the existence of a national (not SWF)
strategic plan for the nation, and if so the specific industries highlighted in that plan. We search
for a plan that predates our data and code things straightforwardly with dummy variables if one
of our fourteen industries is featured prominently in the industrial plan. These plans tend to
feature vertical industries targeted for development, as well as in some cases industries like
finance and telecommunications, that are viewed as infrastructure and aid in development across
a set of industries.
The second state planning variable we construct we label Skill and this is intended to
capture the possibility that the state possesses information and potentially skills in that industry
and is willing to take active positions to capitalize on that knowledge. Here we take advantage
of the fact that we have also collected information on the ownership stakes in all investments.
The skill variable in an industry can take a value between 0 and 1 and is based on the proportion
of the domestic investment in that industry that is invested with controlling stake in the prior year
(where we define a controlling stake as a stake over 20%). Note, this is not based on the level of
investment in that sector, solely on whether the proportion of the assets in that sector where the
state has control. To avoid extreme values, for industries in which the SWF has no investment,
we use the mean proportion from all SWFs.
In looking at industrial planning objectives we are not assuming that all SWFs will have
this as a significant objective. Some funds organization design and charters for example forbid
them from making domestic investments (e.g. Norway Pension Fund Global), and this makes it
17
far less likely that they will be used as a tool for industrial planning. We also recognize that the
strength of this objective is likely to depend upon a variety of additional factors that can increase
the perceived need to enhance development or exploit skill. We attempt to capture these factors
by introducing a measure of the time until the natural resource wealth source is going to run out
(e.g. years of oil reserves) and alternatively if an economy is starting with a very skewed pattern
of production (level of diversification). We also allow for the possibility that the focus on
planning will be dependent upon the skills and experience of the board tasked with overseeing
the SWF. To do this we identify all board members and identify measures of their experience
and politicization. As measures of experience we look at four dimensions: their level of
education, whether their education was abroad, at whether they had prior operational or
investment management experience at home or abroad.
As a final note, we recognize that the fact of state ownership of SWFs might lead SWF
managers to pursue this objective poorly, or that they may also pursue other political or personal
objectives or face additional constraints in trying to realize their objectives. For now we focus
solely on the industrial planning objective to see what power this has in explaining allocation,
and leave questions of ability to realize, and possibly additional objectives to future work (e.g.
Dyck and Morse (2010b)).
II.5 Specification & Summary Statistics
To explore the power of financial and industrial planner objectives to explain patterns in
portfolio allocation we employ a simple linear specification:
bft bft bft bftX S .
In particular, we regress the SWF portfolio weight ω on financial investor benchmark
variables X and state industrial planner variables S. We include 20 SWFs denoted by index f,
unbalanced covering the years 1998-2008 with time denoted t. To simplify discussion, we refer
to the asset class-industry-geography “bin” as b, with at most three asset classes (private equity,
public equity, real estate), seven geographies (including the home country) and thirteen
industries for the equities asset classes and just one industry for real estate. Thus, at most there
are 2x7x13+1x7= 189 bins in which a SWF can invest its risky portfolio.

18
Following on the discussion above, we employ a number of measures to capture financial
investor objectives (X) and State industrial planner objectives (IP). These measures are:
(X.1) Capitalization benchmark: Mean Asset Class allocation,
(X.2) Capitalization: Bin allocation (which sum to 1 across bins),
(X.3) Pension Fund benchmark: Mean Asset Class allocation,
(X.4) Pension Fund: Bin allocation (which sum to 1 across bins),
(X.5) Correlation of the industry-geography bin’s performance with the SWF country
GDP (Corr(GDP,IndustryRegion))+, scaled by the log of national income over the
SWF time series average portfolio size, if the sign of the correlation of the bin’s
performance with SFW country GDP is positive, or zero otherwise,
(X.6) Correlation of the industry-geography bin’s performance with the SWF county
GDP (Corr(GDP, IndustryRegion))—, scaled by the log of national income over
the SWF time series average portfolio size, if the sign of the correlation of the
bin’s performance with SFW country GDP is negative, or zero otherwise,
(X.7) Standard deviation of SWF country GDP, (StDev(GDP)*Sign), scaled by log of
national income over the SWF time series average portfolio size, times the sign of
the correlation of country GDP with world market returns,
(X.8) Log of Foreign Reserves divided by national income.
IP.1 Whether or not the industry is in the country strategic Industrial Plan
IP.2 Importance of Industrial Plan. The primary measure we use is the
number of years until the natural resource is predicted to run out for those SWFs
reliant on natural resource wealth to fund the SWF and zero otherwise. As a
robustness check, we also examine the current diversification of the economy,
defined as the sum of the squared shares in 9 industry categories using data for
2005.
IP.3 Perceived Skill of the SWF in the industry, defined as the percentage of
domestic investment in the industry invested with control (>20% stake), or the
mean of skill across all SWFs if the particular SWF does not invest in the bin
industry.
19
IP.4 Perceived Skill times Board Experience
In Table 4 we provide summary statistics for variables not introduced previously.
While largely self-explanatory, we draw your attention to a few important features of
these variables. We include the average benchmark allocations to the asset class (X.1, X.3) as
separate variables from the overall allocation weights to bins so that we can investigate
allocations across asset classes. Second, as noted earlier the pension fund benchmarks have built-
in home bias specific to the SWF, whereas the capitalization benchmark does not. Third, we
scale the hedging variables by GDP to reflect the importance of hedging to the portfolio
following, e.g., Heaton and Lucas (2000).
III Results
III.1 Econometric approach
Given that positions are often held for long periods of time, SWFs no doubt have serial
correlation in asset allocations. To capture this, our main regressions use a very conservative
model in which we cluster standard errors at the SWF level following Bertrand, Duflo and
Mullainathan (2004). We also employ a less conservative way to capture the same correlation
concern, implementing a GLS model with an AR1 component, estimated in the two-step (Prais-
Winsten) method in which the serial correlation parameter is first estimated from residuals and
then inserted in the equation.17
III.2 Estimations
17 We recognize that technically a cleaner implementation would involve a model in which a portfolio adding-up condition is implemented via a constrained system (e.g., McGuire and Weiss (1976) applied to portfolios in Dimmock (2009)). Because of the limited number of SWFs, particularly in the clustered standard errors model that we use for our main specification, we do not have sufficient observations to implement this model. What we can and did do, was to follow the approach of Beckwith (1972) by examining robustness of our findings to a model in which one bin (real estate) is left out, such that the residual can force the adding-up. Since this did not have a material effect on our results, and forces coefficients to be interpreted as comparisons to the omitted categories, we do not follow this approach in our main specifications.

20
We estimate two main sets of regressions in tables 5 and 6 using data from 20 SWFs
where we have an unbalanced panel with an average of 6 years of data per SWF. In the first set
of regressions in table 5 we focus solely on SWF allocations across industries, collapsing the
geography dimension. In the second set of regressions in table 6 we make a more demanding
test of the explanatory power provided by objectives, looking at industry and geography and
asset class, increasing the number of bins.
In Table 5 column 1 we see the importance of financial objectives as these variables
alone produce an r-squared of 19.1 percent. Consistent with data in table 2 and 3, some of the
power comes from the ability of the statistically significant capitalization benchmark to explain
choices across asset class, but within the asset class what is most important is the pension
benchmark. However, this is an overstatement of the ability to explain choices using financial
variables alone because our hedging variables come in with the opposite to the predicted sign, a
fact we return to below. In column 2 we see that industrial planner objectives similarly have
power to explain patterns in industry choices producing an r-squared of 11 percent with
significant signs on all variables, consistent with our expectations. This is particularly powerful
as a number of the planner variables are expected to have no power for SWFs in countries
without strategic plans, or that do not rely upon natural resource wealth to fund the SWFs.
The statistically significant coefficients on all of our IP variables in column 2 also show
that SWFs allocate a significantly greater proportion of their portfolios to industries identified in
national strategic plans, and in those sectors where they have potential skill or superior
information. Moreover, we find that the importance of industrial planning depends upon the
perceived need to focus on planning, with a significant negative interaction with the years until
the oil reserves are going to run out indicating that countries are more inclined to focus on
planning when they have limited time left in their natural resource. In unreported regressions we
also examined the impact of replacing oil reserves with existing diversification as another
measure of need, finding similar results on the interaction but since these two country-level
variables were highly correlated, we cannot include them in the same regression. Finally, we
find that the importance of perceived skill in driving industry choices is influenced by the level
of experience on the board, with the negative and significant coefficient showing that the tilt

21
towards industries with perceived skill is most pronounced in the boards with the least
experience.
We see the real value of considering both portfolio investor and industrial planning
objectives in column 3. Including both variables boosts our explained variation to 27.4 percent,
consistent with the two sets of objectives picking up different dimensions. Again, the industrial
planner variables are strongly significant and have identical signs. The important change in
column 3 is that we find encouraging results in the financial investor hedging. In particular, once
the industrial planning is incorporated, SWFs appear to take on more risk if they have greater
country foreign reserves, and SWFs whose income is negatively correlated with the world
market (oil countries) hedge toward more risk, consistent with theory.
Column 4 reproduces the results of column 3 using the Prais-Winsten AR-1 GLS
estimation. Note that the serial correlation rho (reported at the bottom of the table) is substantial,
at 0.858, as we would expect. However, this specification produces very similar results to
column 3, with less conservative standard errors. It does reinforce the robustness of these results.
The final four columns look within the allocations of public equity (columns 5-6) and
private equity (columns 7-8). We only include the pension benchmark because the capitalization
benchmark across industries within an asset class has no power (and with the clustering, we need
to be somewhat parsimonious). The pension benchmark is very large in magnitude and
significant for public equities and weaker for private equities. Hedging is almost absent. The
industrial planning variables show up strongly significant in both public and private equity, with
the role of the strategic industrial plan being augmented in private equity.18 In fact, because of
the importance of industrial plan for private equity allocations, the R-Square is higher in the
private equity specifications (0.210) than the public equity ones (0.146).
In Table 6, we re-examine the ability of portfolio investor and industrial planner
perspectives to explain variation in allocations, this time focusing on the more demanding
industry choice across geography. Recall that geography includes the home country as one
region, and that the pension benchmark is home-biased as if it were a pension fund in the SWF
18 We will discuss the economic meaning of these coefficients in a future draft. We apologize for the omission.
22
country. We find similar patterns in results. Measures of financial objectives provide significant
explanatory power producing an r-squared of 7.7 percent, while leaving much to be explained.
The pension benchmark keep their significant power across geographies, while the capitalization
benchmarks provide more puzzling results, producing a negative and significant sign.19
Industrial planning variables similarly have explanatory power, producing an r-squared of 6.1
percent. Combining measures to capture these two different objectives significantly increases
the explanatory power up to 14.2 percent, more than the sum of the two regressions alone and
consistent with the two objectives picking up different dimensions. These results are robust to
the GLS-AR1 specification, as shown in column 4.
As we saw in table 5, the industrial planner variables come in significant and with the
predicted signs. Here we add an additional interaction, of skill interacted with a dummy variable
to capture if the geography is the home country. The significant positive sign here suggests that
SWFs are most likely to tilt towards industries where they have skill if the industry is located in
the home country. The estimated coefficients allow us to say more. The majority of the
economic magnitude on perceived skill is for investing at home. Perceived Skill* Domestic has
a coefficient of 2.807 relative to 0.470 without the interaction. Nevertheless, both coefficients are
positive and significant. SWFs are six times more likely to use perceived skill at home, but they
do significantly tilt their portfolios abroad to perceived alpha industries.
Columns 5-8 repeat the exercise from Table 5 of just looking within the public equities
portfolio (columns 5-6) and then within private equities (7-8). Here, we find that the pension
allocations fail at being able to explain the private equity portfolio. We find some evidence for
correlation hedging, in both public and private equities. The industrial planning variables also
seem to explain the portfolio allocations in both public and private equities, although the
perceived skill variables are much weaker in public equities in the AR specification.
III.3 Heterogeneity in the Importance of Financial and Industrial Planning Objectives
These patterns are consistent with these two objectives capturing different dimensions to
the same fund, and/or the heterogeneity across funds in these objectives. To disentangle these
19 Given this puzzling result, we exclude the capitalization benchmarks from the remaining specifications.

23
possibilities we look separately at the explanatory power of these financial and industrial
planning variables for each fund and decompose the r-squared based on the objective.
To explore heterogeneity we begin by breaking down R-Square:
2
2
ˆ ˆ- 1 1 FI IPSSE
R SquareSST
ˆ ˆ, , and FI IP respectively refer to (without fund, time and asset-class-industry-geography
bin subscripts) the SWF portfolio allocation (the dependent variable), the predicted portfolio
weight using just the financial investor variables, the predicted portfolio weight using just the
industrial planning variables and the average allocation (which equals 1 divided by the number
of bins). The summation is over all observations in a general setting, but we are going to do this
summation over all observations for each SWF, creating an R-SquareSWF. With a little algebra,
we decompose the R-square into three components:
2
ˆ ˆ2- - - 1 FI IP
FI IPR Square R Square R Square
,
In short, an R-Square for each of the set of objective variables and then a “covariance R-Square”,
the part of the explained sum of square errors which both variables explain.
Figure 1 presents the results of this decomposition, focusing on column 3, Table 6 results.
As we noted in the prior section, the financial investor and industrial planner model explains
14.2 percent of the variation in risky portfolio holdings across industries and three asset classes.
This does not mean that the model does equivalently well across SWFs. In Figure 1, the first bar
(the medium grey/blue one) presents the R-SquareSWF, with the SWFs ordered on this variable.
The model fits the portfolios best for the Kazakh Global Fund (a pure indexer). Some other
portfolios are explained extremely well by the model, including SWFs one might guess – GIC
Singapore, Alaska, and Norway – and including ones one might not expect – Bahrain, Qatar, all
three Dubai funds, Kuwait, Mubadala and ADIA.
The remaining two bars in Figure 1 allow us to show is that the SWFs explained
extremely well by the model are primarily financial investors, but the large Middle Eastern
24
SWFs explained still quite well are a mix of state planners and financial investors. For ease of
exposition, we start by looking at the large SWFs (>$50 billion), for whom the model explains at
least 10 percent of the portfolio variation. Within this group, GIC Singapore, Norway, and ADIA
are primarily explained by financial investor variables. A second set of these large funds, Qatar
and Dubai World, have a third-to- half of their variation explained by industrial planning. For the
final set of large funds, Kuwait, Investment Corporation of Dubai, Dubai Holding, and Singapore
Temasek, the industrial planning variables explain the majority of explained variation. Together,
these two groups of SWFs account for $650 billion in wealth by our estimates, of which $553
billion is invested in risky assets. The smaller funds are more polar: most are industrial planning
focused with the exception of Kazakhstan Global, Alaska, and Mubadala.
IV Planning and Ownership Stakes
Recognizing the importance of industrial planning objectives generates additional
predictions about the size of SWF stakes. Where SWFs have industrial planning objectives they
will be more interested in assembling larger stakes that provide them information or influence to
address their planning goals. In particular control rights are more important for SWFs where
planning objectives play a larger role, and are predicted to be greatest for domestic investments
where planning objectives are ultimately realized, and for industries central to a plan. To explore
these predictions, in Table 7 we look again at the regions and industries and arrive at some
preliminary assessments as to the real impact of SWFs.
We find support for all of these predictions. Table 7 panel A shows allocations by
region. Consistent with expectations, active stakes are most likely in the two regions home to
most SWFs of Asia and the Middle East, with 80% or greater of the stakes having control rights.
In addition we document that SWFs own 4.3% and 6.4% of public equity in Asia and the Middle
East respectively and 12 % of private equity whereas portfolio investor benchmarks predict
stakes of less than one percent. They own much smaller portions of public market in the West,
on the order of 1-2%. In panel B we explore industry allocation. Here we see that a few
industries stand out in terms of active investing. These include finance (where more than 70 %
of statkes are invested actively) as well as energy, transportation, and transportation

25
manufacturing.20 Across these main four industries, SWFs hold active investments with control
interest in 70% of the asset value; these assets account for 3% of world private and public
capitalization for these four industries.21
In Table 8 we test for the ability of planning objectives to help explain the variation we
observe in ownership stakes across industries and geographies. In this regression the dependent
variable is the size of the stake in that firm in that year. We include a variety of control
variables, including a dummy for the asset classes of private equity and for real estate where we
know stakes are larger, and measures of portfolio investor objectives (capitalization benchmark,
pension benchmark). The control variables come in as expected, with allocations that look like
capitalization benchmark having lower stakes consistent with a focus on diversification. The
positive significant on the pension benchmark captures the home bias to pension allocaitons, as
we see with the significance going away when we include a home country dummy.
Our predictions on ownership stake focus on the planning variables. To investigate the
impact of planning objectives we introduce various measures starting with the r squared
explained by the planning measures alone (column 1) with a home dummy (column 3), then
replacing the r squared with strategic plan variables and interaction with measure of the need for
planning alone (column 2) and with a home dummy (column 4) and repeating columns 3 and 4
with industry dummies (column 5 and column 6). As was suggested by the summary statistics,
all of the planning measures have the predicted sign and are statistically significant.
V Conclusion
In this paper we have assembled a novel data set of SWF portfolio holdings. We analyze
their portfolios, and try to understand the investment objectives driving those portfolio decisions.
20 From having done case studies on all of these companies, the reason for this fact seems to be that SWFs a combination of SWFs’ inheriting state owned enterprises and SWFs using the personnel inherited from running state-owned enterprises to seek investments in sector in which they believe to have expertise.
21 In the next draft, we will show that the financial investor SWFs (i.e. the Western ones) are not the funds dominating the Asian and Middle Eastern markets and are not the funds investing with active control interests. Rather, it is the Middle Eastern funds and Singaporean Temasek for whom our state planning variables have explanatory power and who invest with active control interest in a concentrated set of (state planned) industries. It is not the fact that these SWFs are Middle Eastern that is the relevant take-away, but that these funds do have both industrial agenda and enough capital to impact industries and regional markets.

26
We distinguish two broad objectives: portfolio investment vs. industrial planning allocation. We
then introduce measures to capture these objectives and examine their power to explain portfolio
allocations.
One view is that they are motivated solely by securing appropriately risk-adjusted
financial returns, predicting broad industry and geographic diversification in their portfolios, as
well as across alternative types of risky assets. This portfolio investor view has power to explain
portions of their portfolio allocations, but leaves much to be explained. We find that considering
the possibility that portions of their portfolios are driven by a desire to achieve industrial
planning objectives provides significant additional explanatory power. This objective predicts
more domestic and regional investments, and more focused allocations consistent with
announced planning objectives, and we also see this in the data. Considering both objectives
also helps us to understand better the heterogeneity across funds, with some driven solely by
portfolio investor objectives, others by industrial planning objectives, and many apparently
addressing both. State industrial planning is important for all of the large Middle Eastern and
some of the Asian SWFS.
Showing that funds pursue industrial planning objectives does not mean that they
necessarily do this well, or that this is the best mechanism to achieve these objectives. The
attempt to achieve planning objectives by taking equity stakes in private companies also raises
questions whether this is the best mechanism to achieve these objectives, and how sustainable is
this approach. There are alternatives, including direct state subsidies delivered either through
state owned enterprises or through direct subsidies to private firms. This could very well be
done poorly, or a mechanism that provides some political cover for other activities. Looking
solely at portfolios cannot address these questions, but we need to turn to returns, a topic we pick
up in ongoing work (Dyck and Morse (2010)).

27
Appendix A – What is a SWF?
We employ a commonly used definition provided by the Monitor group, which defines
SWF to be: (a) wholly owned by a sovereign government, but organized separately from the
central bank or finance ministry; (b) an investment fund rather than an operating company; (c) an
investor that makes international and domestic investments in variety of risky assets, (d) and is
charged with seeking a commercial return; and (e) a wealth fund rather than a pension fund – not
financed with contributions from pensioners and does not have a stream of liabilities committed
to individual citizens and state-owned enterprises.
Appendix B – SWF Portfolio Data Collection
The strategy to re-construct hidden portfolios has three steps. First we identify all of the
subsidiaries acting as the investing entities. SWFs usually only partially disclose their
organizational structure delineating the names of the investing entities underneath the SWF. We
cross-reference our entity list with subsidiaries listed in Bloomberg, Capital IQ, Zawya,
Thomson, and the SWF Institute. To ascertain that we capture the all SWF entities which are
making investments of any magnitude for the parent SWF, we work backwards from the known
portfolio companies owned by the SWF. Knowing these companies allows us to search Factiva
news articles and SDC transaction data to identify the exact entity doing the investing. Our
overlap is high across these methods, but each step added more entities and allowed us to
understand the relationships among entities.
Second, we search for transactions and ownership data involving these entities through a
host of possible sources – including entity websites, Amadeus, Bloomberg, Capital IQ, Compact
D, Datastream, Dealscan, Dow Jones Zawya, Edgar/SEC, Galante’s Alternative Investment
Sources, SDC/Thomson One Banker, and Venture Xpert. These sources do not capture all of the
investments and usually do not give us the value of the holdings unless the transaction is a high-
profile event. However, the union of transactions and holdings captured in these data sources
provide a starting point for performing case studies of each transaction. By this we mean that for
each company the SWF supposedly invests in, we search extensively in world news sources (via
Factiva and Google in multiple languages sometimes) to ensure that we have multiple records of
the initial transaction or certification that the holding exists, that we reconcile any increases in
stake or divestments with additional transactions, and that we can put a stake on each holding. In

28
the process, we get a very detailed picture of the SWF’s operations and are often led to additional
investments made by the funds either from articles on known transactions or via broad sweep
searches.
Third, we value the holdings dynamically. The valuation of each company at each point
in time is particularly tricky. For publicly traded companies, this is a straightforward task, and a
dynamic picture of equity stakes is sufficient. However the private equity and real estate
holdings require some assumptions. In particular, the best that we can often do is the equity stake
(usually), an initial transaction value (sometimes) and yearly revenue or net income numbers
(often) for the company to which we apply an industry-region multiple. When we only observe
revenue numbers for some points in time, we have to infer growth with the industry. We mark
these for incorporating this forcing in the analysis. If we are missing financials altogether, we use
output measures (e.g., dry weight tons for shipping and passengers for airlines), which we try to
capture yearly. Although our valuations are far from perfect, we think that our errors will not
create biases in the residual portfolio and note that our errors are likely to be the greatest for the
smaller companies in the portfolios who are less likely to issues newswires on performance or
publish financials.
The next step is to value each of the assets dynamically for the three asset classes. For
publicly traded companies, this is a straightforward task; we simply download stock trading data
from Thomson and Bloomberg and apply the prices or market capitalizations to the dynamic
picture of shares held or equity stakes.
For direct private equity holdings, we have a few different levels of data availability and
thus approaches. If we know the investment and divestment amount (or a valuation at an IPO),
we calculate the gross return and allocate this return over time scaled to be proportional to the
three-digit SIC code return for the region.22 If we observe the investment, the percentage held,
and either a revenue, income or asset figure, we calculate a firm-specific multiple at the point of
investment to allow the investment to grow with the firm. If we observe only the percentage held
and a revenue, income or asset figure, we apply the three-digit industry multiple specific to
region and year. Within these last two scenarios, when we lack the financials data, we capture
22 The return for year t is exp(ln(X/YearsHeld)*IndustryReturnt, where X is the investment gross return (divestment divided by the investment) scaled by the region industry return over the period. The regions are defined as Asia, Europe, Latin America, Middle East & Africa, North America, Pacific and home country. To calculate the region returns and the region multiples, we use all firms in the Thomson OneBanker database, which includes Worldscope and Datastream data.

29
yearly output measures (e.g., dry weight tons for shipping and passengers for airlines) and apply
up publicly traded comparables output-to-value multiples. Finally, in the few cases in which we
only know the investment amount and nothing else, we apply industry growth for the region.
The third asset class needing valuations are properties. As in private equity, if we know
the transacted prices of buying and selling a completed structure, we calculate the gross return
and allocate this return over time scaled to the real estate return for the regional area. If we know
the purchase price only, we grow the transacted price with the regional area return for the years
held. If we know when a property was purchased but not the price, we use heuristics valuation
based on property size, location and type, assuming that all properties are class A commercial,
residential, retail, or lodging. After looking up the sizes in Factiva, Google or Zawya, we convert
all size measures (e.g., apartment units, retail spaces, hotel rooms) to square footage and use the
Collier data for region price per square foot for the transacted year as the purchase price. We
then grow this value with the region area growth rate.

30
References Abu Dhabi Annual Review 2009, http://www.adia.ae/En/News/media_review.aspx Ang, Andrew, 2010, “The Four Benchmarks of Sovereign Wealth Funds,” Columbia Business School Working Paper. Bauer, Rob and Rik Frehen, 2008,“The Performance of US Pension Funds: New Insights into the Agency Cost Debate,” SSRN Working paper. Bernardo Bortolotti, Veljko Fotak, William Megginson and William Miracky. 2009. "Sovereign Wealth Fund Investment Patterns and Performance." Working Paper. Bernstein, Shai, Josh Lerner and Antoinette Schoar, 2009. “The Investment Strategies of Sovereign Wealth Funds,” Working Paper, Harvard University. Bertrand, Duflo and Mullainathan (2004) Bodie, D., R. Merton and W. Samuelson,1992, “Labor supply flexibility and portfolio choice in a life cyle model, “ Journal of Economic Dynamics and Control, 16, 427-449, Brown, Keith C., Lorenzo Garlappi, and Cristian Tiu. 2008. “Does Asset Allocation Influence Portfolio Performance?: Evidence from University Endowment Funds.” University of Texas Working Paper. Chan, Kalok, Vicentiu Covrig and Lilian Ng, 2005, “What Determins the Domestic Bias? Evidence from Mutual Fund Equity Allocations Worldwide” Journal of Finance, Vol. LX, No. 3, 1495-1534. Chhaochharia, Vidhi and Luc Laeven. 2008 “Sovereign Wealth Funds: Their Investment Strategies and Performance.” Working Paper. China Investment Corporation, 2008, Annual Report 2008, http://www.china-inv.cn/cicen/include/resources/CIC_2008_annualreport_en.pdf Dimmock, S. 2009, “Background Risk and University Endowment Funds,” working paper, Michigan State University. French, Kenneth, 2009, “The Cost of Active Investing,” Journal of Finance.

31
General Accounting Office. 2008. “Sovereign Wealth Funds: Publicly Available Data on Sizes and Investments for Some Funds Are Limited,” GAO 08 946. Gollier, C. And J. W. Pratt, 1996, “Risk Vulnerability and the Tempering Effect of Background Risk,” Econometrica , 64, 1109-1123. Guiso, Jappelli, and Terlizzese, 1996 Heaton, John and Debra Lucas, 2000. International Financial Services London. 2008. "Sovereign Wealth Funds 2008." International Financial Services London: IFSL Research Paper. April. Lakonishak, A. Shleifer, and R. Vishny 1992, Massa, Massimo and Andrei Simonov. 2006. “Hedging, Familiarity and Portfolio Choice”; Review of Financial Studies Merton, R., 1992, “Optimal Investment Strategies for University Endowment Funds,” in R. Merton (ed.) Continuous Time Finance – Revised Editision, Blackwell: Malden, MA. Moskowitz, Tobias and Annette Vissing-Jorgensen, 2002. AER Moskowitz, Tobias and Annette Vissing-Jorgensen, 2005. JF Santiso, J, 2009. “Sovereign Development Funds: Financial Actors in the Shifting Wealth of Nations,” Chapter 16, New Perspectives on Sovereign Asset Management, editor Malan Rietveld Sovereign Wealth Fund Institute. 2008. "Linaburg-Maduell Transparency Index." Accessed August 7, 2008. Available from http://www.swfinstitute.org/research/transparencyindex.php. Truman, Edwin M. 2007. "Sovereign Wealth Funds: The Need for Greater Transparency and Accountability." Peterson Institute Policy Brief No. PB07-6. August. U.S. Congress. 2008. House. Committee on Financial Services. Subcommittee on Domestic and International Monetary Policy, Trade, and Technology and Subcommittee on Capital Markets, Insurance, and Government Sponsored Enterprises. Foreign Government Investment in the U.S. Economy and Financial Sector: Joint Hearing, 110th Congress, March 5. Weiss, Martin, 2008. “Sovereign Wealth Funds: Background and Policy Issues for Congress”Congressional Research Services RL34336.
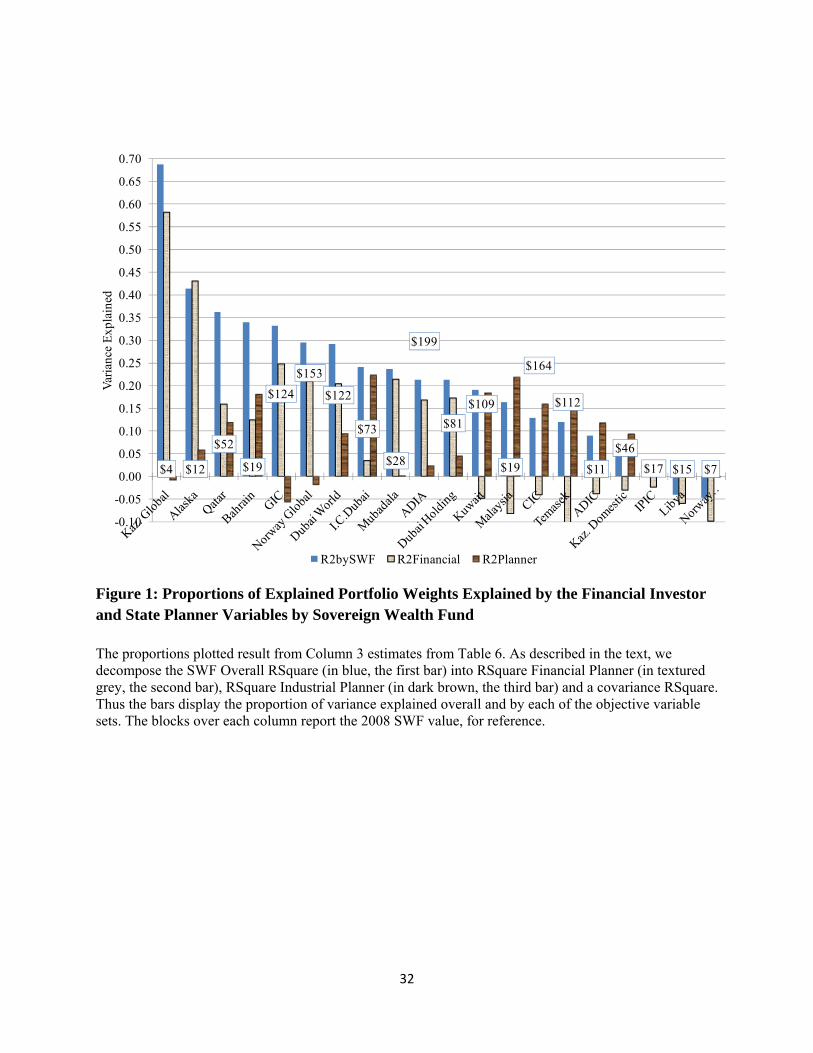
32
Figure 1: Proportions of Explained Portfolio Weights Explained by the Financial Investor and State Planner Variables by Sovereign Wealth Fund
The proportions plotted result from Column 3 estimates from Table 6. As described in the text, we decompose the SWF Overall RSquare (in blue, the first bar) into RSquare Financial Planner (in textured grey, the second bar), RSquare Industrial Planner (in dark brown, the third bar) and a covariance RSquare. Thus the bars display the proportion of variance explained overall and by each of the objective variable sets. The blocks over each column report the 2008 SWF value, for reference.
$4 $12
$52
$19
$124
$153
$122
$73
$28
$199
$81
$109
$19
$164
$112
$11
$46
$17 $15 $7
-0.10
-0.05
0.00
0.05
0.10
0.15
0.20
0.25
0.30
0.35
0.40
0.45
0.50
0.55
0.60
0.65
0.70
Var
ianc
e E
xpla
ined
R2bySWF R2Financial R2Planner
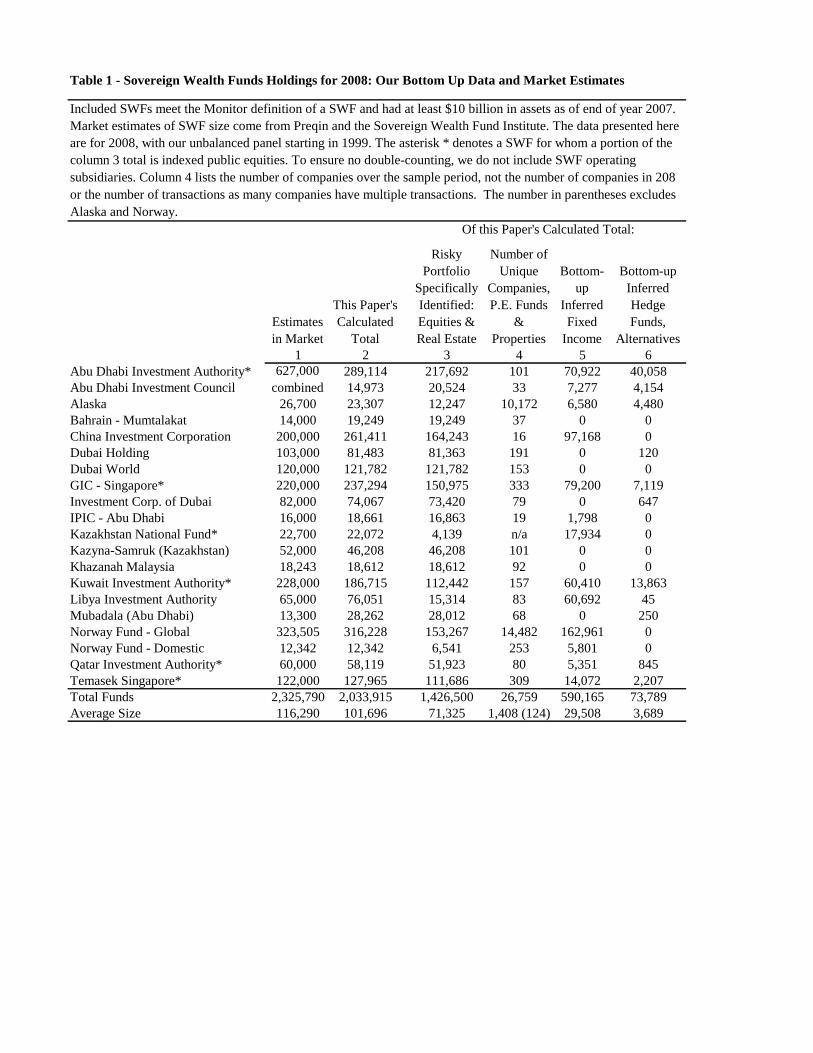
Table 1 - Sovereign Wealth Funds Holdings for 2008: Our Bottom Up Data and Market Estimates
Estimates
in Market
This Paper's
Calculated
Total
Risky
Portfolio
Specifically
Identified:
Equities &
Real Estate
Number of
Unique
Companies,
P.E. Funds
&
Properties
Bottom-
up
Inferred
Fixed
Income
Bottom-up
Inferred
Hedge
Funds,
Alternatives
1 2 3 4 5 6
Abu Dhabi Investment Authority* 289,114 217,692 101 70,922 40,058
Abu Dhabi Investment Council 14,973 20,524 33 7,277 4,154
Alaska 26,700 23,307 12,247 10,172 6,580 4,480
Bahrain - Mumtalakat 14,000 19,249 19,249 37 0 0
China Investment Corporation 200,000 261,411 164,243 16 97,168 0
Dubai Holding 103,000 81,483 81,363 191 0 120
Dubai World 120,000 121,782 121,782 153 0 0
GIC - Singapore* 220,000 237,294 150,975 333 79,200 7,119
Investment Corp. of Dubai 82,000 74,067 73,420 79 0 647
IPIC - Abu Dhabi 16,000 18,661 16,863 19 1,798 0
Kazakhstan National Fund* 22,700 22,072 4,139 n/a 17,934 0
Kazyna-Samruk (Kazakhstan) 52,000 46,208 46,208 101 0 0
Khazanah Malaysia 18,243 18,612 18,612 92 0 0
Kuwait Investment Authority* 228,000 186,715 112,442 157 60,410 13,863
Libya Investment Authority 65,000 76,051 15,314 83 60,692 45
Mubadala (Abu Dhabi) 13,300 28,262 28,012 68 0 250
Norway Fund - Global 323,505 316,228 153,267 14,482 162,961 0
Norway Fund - Domestic 12,342 12,342 6,541 253 5,801 0
Qatar Investment Authority* 60,000 58,119 51,923 80 5,351 845
Temasek Singapore* 122,000 127,965 111,686 309 14,072 2,207
Total Funds 2,325,790 2,033,915 1,426,500 26,759 590,165 73,789
Average Size 116,290 101,696 71,325 1,408 (124) 29,508 3,689
627,000
combined
Included SWFs meet the Monitor definition of a SWF and had at least $10 billion in assets as of end of year 2007.
Market estimates of SWF size come from Preqin and the Sovereign Wealth Fund Institute. The data presented here
are for 2008, with our unbalanced panel starting in 1999. The asterisk * denotes a SWF for whom a portion of the
column 3 total is indexed public equities. To ensure no double-counting, we do not include SWF operating
subsidiaries. Column 4 lists the number of companies over the sample period, not the number of companies in 208
or the number of transactions as many companies have multiple transactions. The number in parentheses excludes
Alaska and Norway.
Of this Paper's Calculated Total:

Table 2: Geography of SWF and Benchmark Portfolio Allocations
Panel A: Average SWF Allocations (in percent of portfolio)
Excess over Excess over
Public Equity Private Equity Real Estate Total Capitalization Pension Fund
Asia (excl Japan & Middle East) 0.131 0.093 0.007 0.231 0.095 0.196
Europe 0.170 0.048 0.010 0.228 -0.112 -0.011
Latin America 0.006 0.000 0.000 0.006 -0.051 0.001
Middle East & Africa 0.077 0.146 0.146 0.369 0.349 0.359
North America 0.108 0.005 0.018 0.130 -0.164 -0.369
Pacific 0.029 0.005 0.006 0.039 -0.115 -0.073
Total 0.520 0.296 0.187 1 0 0
Panel B: Benchmark Allocations (in percent of portfolio)
Public Equity Private Equity Real Estate Total Public Equity Private Equity Real Estate Total
Asia (excl Japan & Middle East) 0.039 0.085 0.012 0.136 0.029 0.006 0.035
Europe 0.096 0.181 0.062 0.339 0.227 0.012 0.239
Latin America 0.010 0.041 0.006 0.056 0.004 0.000 0.005
Middle East & Africa 0.006 0.010 0.004 0.020 0.009 0.000 0.010
North America 0.135 0.106 0.053 0.294 0.465 0.035 0.500
Pacific 0.039 0.094 0.021 0.154 0.111 0.001 0.112
Total 0.324 0.516 0.160 1 0.846 0.054 0.100 1
Table A presents the equally weighted SWF portfolio allocations, where each SWF is based on its time series average. As a
point of reference we present in panel B the same allocations based on world market capitalization and for the CEM
sample of large pension plans that meet our same size criteria of having at least $10 billion in assets in 2007. In panel B
the median pension benchmark real estate allcoation is indexed to the home country, and thus the region is left blank. The
last two columns of panel A show the difference between the average SWF allocations and the capitalization and the home-
biased pension fund benchmarks.
SWF Allocations
Capitalization Benchmark Allocations Pension Fund Benchmark Allocations

Table 3: Industry Breakdown of SWF and Benchmark Portfolio Allocations
Panel A: Average SWF Allocations (in percent of portfolio)
Excess over Excess over
Public Equity Private Equity Real Estate Total Capitalization Pension Fund
Consumer Goods 0.018 0.008 0.026 -0.012 -0.027
Consumer Services 0.049 0.020 0.069 -0.264 -0.034
Energy 0.051 0.097 0.148 0.114 0.064
Fabricated Products 0.007 0.000 0.007 -0.019 -0.027
Finance 0.163 0.044 0.207 0.100 0.011
Food 0.015 0.003 0.018 0.000 -0.006
Healthcare 0.025 0.003 0.028 -0.004 -0.056
Materials 0.028 0.023 0.051 -0.028 -0.011
Real Estate 0.001 0 0.188 0.188 0.012 0.087
Technology 0.022 0.005 0.027 -0.014 -0.058
Telecommunications 0.061 0.011 0.073 0.032 0.001
Transportation 0.036 0.050 0.086 0.060 0.071
Transportation Manufacturing 0.019 0.012 0.031 0.005 -0.013
Utilities 0.028 0.014 0.042 0.019 0.000
Total 0.520 0.292 0.188 1 0.0 0.0
Panel B: Benchmark Allocations (in percent of portfolio)
Public Equity Private Equity Real Estate Total Public Equity Private Equity Real Estate Total
Consumer Goods 0.020 0.018 0.038 0.050 0.003 0.053
Consumer Services 0.043 0.290 0.333 0.096 0.007 0.103
Energy 0.027 0.007 0.034 0.078 0.005 0.084
Fabricated Products 0.007 0.019 0.026 0.033 0.001 0.034
Finance 0.065 0.042 0.107 0.185 0.010 0.196
Food 0.009 0.009 0.018 0.022 0.002 0.024
Healthcare 0.027 0.005 0.032 0.079 0.006 0.085
Materials 0.023 0.055 0.079 0.058 0.003 0.062
Real Estate 0.004 0.012 0.160 0.176 0.001 0.000 0.100 0.102
Technology 0.028 0.013 0.041 0.080 0.005 0.084
Telecommunications 0.034 0.007 0.041 0.067 0.005 0.072
Transportation 0.007 0.019 0.026 0.014 0.001 0.015
Transportation Manufacturing 0.015 0.011 0.026 0.042 0.002 0.044
Utilities 0.015 0.008 0.023 0.040 0.003 0.043
Total 0.324 0.516 0.160 1 0.846 0.054 0.100 1
Capitalization Benchmark Allocations Pension Fund Benchmark Allocations
Table A presents the equally weighted SWF portfolio allocations, where each SWF is based on its time series average. As a
point of reference we present in panel B the same allocations based on world market capitalization and for the CEM
sample of large pension plans that meet our same size criteria of having at least $10 billion in assets in 2007. The last two
columns of panel A show the difference between the average SWF allocations and the capitalization and the home-biased
pension fund benchmarks.
SWF Allocations
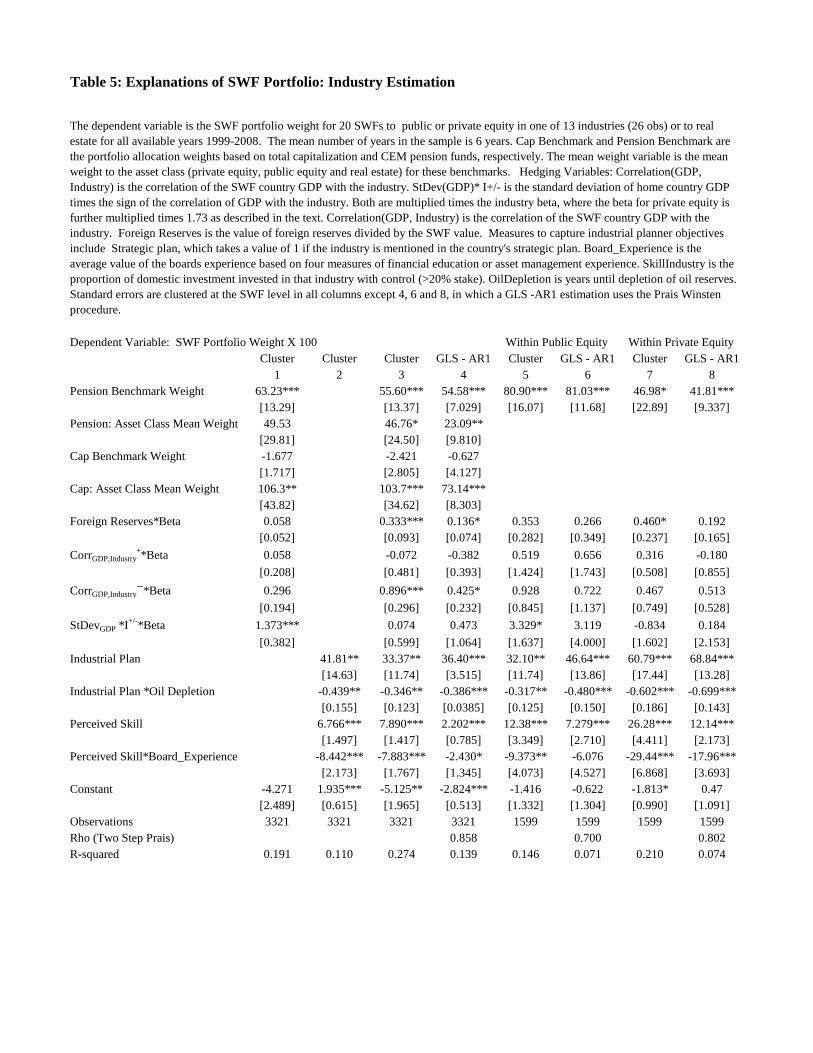
Table 5: Explanations of SWF Portfolio: Industry Estimation
Dependent Variable: SWF Portfolio Weight X 100
Cluster Cluster Cluster GLS - AR1 Cluster GLS - AR1 Cluster GLS - AR1
1 2 3 4 5 6 7 8
Pension Benchmark Weight 63.23*** 55.60*** 54.58*** 80.90*** 81.03*** 46.98* 41.81***
[13.29] [13.37] [7.029] [16.07] [11.68] [22.89] [9.337]
Pension: Asset Class Mean Weight 49.53 46.76* 23.09**
[29.81] [24.50] [9.810]
Cap Benchmark Weight -1.677 -2.421 -0.627
[1.717] [2.805] [4.127]
Cap: Asset Class Mean Weight 106.3** 103.7*** 73.14***
[43.82] [34.62] [8.303]
Foreign Reserves*Beta 0.058 0.333*** 0.136* 0.353 0.266 0.460* 0.192
[0.052] [0.093] [0.074] [0.282] [0.349] [0.237] [0.165]
CorrGDP,Industry+*Beta 0.058 -0.072 -0.382 0.519 0.656 0.316 -0.180
[0.208] [0.481] [0.393] [1.424] [1.743] [0.508] [0.855]
CorrGDP,Industry—
*Beta 0.296 0.896*** 0.425* 0.928 0.722 0.467 0.513
[0.194] [0.296] [0.232] [0.845] [1.137] [0.749] [0.528]
StDevGDP *I+/-
*Beta 1.373*** 0.074 0.473 3.329* 3.119 -0.834 0.184
[0.382] [0.599] [1.064] [1.637] [4.000] [1.602] [2.153]
Industrial Plan 41.81** 33.37** 36.40*** 32.10** 46.64*** 60.79*** 68.84***
[14.63] [11.74] [3.515] [11.74] [13.86] [17.44] [13.28]
Industrial Plan *Oil Depletion -0.439** -0.346** -0.386*** -0.317** -0.480*** -0.602*** -0.699***
[0.155] [0.123] [0.0385] [0.125] [0.150] [0.186] [0.143]
Perceived Skill 6.766*** 7.890*** 2.202*** 12.38*** 7.279*** 26.28*** 12.14***
[1.497] [1.417] [0.785] [3.349] [2.710] [4.411] [2.173]
Perceived Skill*Board_Experience -8.442*** -7.883*** -2.430* -9.373** -6.076 -29.44*** -17.96***
[2.173] [1.767] [1.345] [4.073] [4.527] [6.868] [3.693]
Constant -4.271 1.935*** -5.125** -2.824*** -1.416 -0.622 -1.813* 0.47
[2.489] [0.615] [1.965] [0.513] [1.332] [1.304] [0.990] [1.091]
Observations 3321 3321 3321 3321 1599 1599 1599 1599
Rho (Two Step Prais) 0.858 0.700 0.802
R-squared 0.191 0.110 0.274 0.139 0.146 0.071 0.210 0.074
The dependent variable is the SWF portfolio weight for 20 SWFs to public or private equity in one of 13 industries (26 obs) or to real
estate for all available years 1999-2008. The mean number of years in the sample is 6 years. Cap Benchmark and Pension Benchmark are
the portfolio allocation weights based on total capitalization and CEM pension funds, respectively. The mean weight variable is the mean
weight to the asset class (private equity, public equity and real estate) for these benchmarks. Hedging Variables: Correlation(GDP,
Industry) is the correlation of the SWF country GDP with the industry. StDev(GDP)* I+/- is the standard deviation of home country GDP
times the sign of the correlation of GDP with the industry. Both are multiplied times the industry beta, where the beta for private equity is
further multiplied times 1.73 as described in the text. Correlation(GDP, Industry) is the correlation of the SWF country GDP with the
industry. Foreign Reserves is the value of foreign reserves divided by the SWF value. Measures to capture industrial planner objectives
include Strategic plan, which takes a value of 1 if the industry is mentioned in the country's strategic plan. Board_Experience is the
average value of the boards experience based on four measures of financial education or asset management experience. SkillIndustry is the
proportion of domestic investment invested in that industry with control (>20% stake). OilDepletion is years until depletion of oil reserves.
Standard errors are clustered at the SWF level in all columns except 4, 6 and 8, in which a GLS -AR1 estimation uses the Prais Winsten
procedure.
Within Public Equity Within Private Equity

Table 6: Explanations of SWF Portfolio: Industry-Geography Estimation
Dependent Variable: SWF Portfolio Weight X 100
Cluster Cluster Cluster GLS - AR1 Cluster GLS - AR1 Cluster GLS - AR1
1 2 3 4 5 6 7 8
Pension Benchmark Weight 56.09*** 57.61*** 49.60*** 41.41*** 32.29*** -2.942 -1.785
[14.45] [13.03] [2.287] [9.380] [4.335] [4.618] [3.490]
Pension: Asset Class Mean Weight 58.28** 53.44** 29.82***
[20.93] [18.88] [7.493]
Cap Benchmark Weight -10.35**
[4.708]
Cap: Asset Class Mean Weight 113.7** 105.9** 72.16***
[48.67] [37.85] [7.387]
Foreign Reserves*Beta -0.0088* 0.0104 -0.00124 -0.0172 -0.0163 -0.00673 -0.0096
[0.0046] [0.0068] [0.0073] [0.0237] [0.0324] [0.0151] [0.0165]
CorrGDP,IndustryRegion+*Beta -0.023 -0.026 -0.044 -0.240* -0.267 -0.188*** -0.159*
[0.026] [0.043] [0.046] [0.131] [0.174] [0.063] [0.094]
CorrGDP,IndustryRegion—
*Beta -0.001 -0.017 -0.007 0.019 0.004 0.046 -0.004
[0.008] [0.019] [0.020] [0.060] [0.092] [0.037] [0.046]
StDevGDP *I+/-
*Beta -0.168*** -0.068 -0.035 -0.287* -0.270 -0.069 -0.065
[0.035] [0.048] [0.082] [0.147] [0.297] [0.108] [0.165]
Industrial Plan 3.194*** 3.094*** 4.645*** 5.260** 7.401*** 6.949*** 11.20***
[1.037] [0.876] [0.268] [1.967] [0.715] [2.325] [0.695]
Industrial Plan *Oil Depletion -0.031** -0.029*** -0.047*** -0.047** -0.072*** -0.062** -0.110***
[0.012] [0.010] [0.003] [0.022] [0.008] [0.025] [0.008]
Perceived Skill 0.470*** 0.553*** 0.118 0.953** 0.439 2.933*** 1.553***
[0.148] [0.166] [0.115] [0.357] [0.393] [0.576] [0.332]
Perceived Skill*Domestic 2.807*** 3.022*** 1.068*** 6.169*** 4.304*** 6.212** 1.576***
[0.653] [0.801] [0.104] [1.557] [0.369] [2.598] [0.307]
Perceived Skill*Board_Experience -0.965*** -0.896*** -0.278 -1.423*** -0.887 -4.259*** -2.598***
[0.172] [0.184] [0.196] [0.467] [0.649] [0.872] [0.558]
Constant -0.652* 0.308*** -0.872** -0.449*** 0.068 0.320*** 0.0624 0.388***
[0.362] [0.070] [0.312] [0.072] [0.174] [0.123] [0.117] [0.113]
Observations 23247 23247 23247 23247 11193 11193 11193 11193
Rho (Two Step Prais) 0.866 0.701 0.794
R-squared 0.077 0.061 0.142 0.052 0.098 0.038 0.127 0.038
The dependent variable is the SWF portfolio weight for 20 SWFs to public or private equity in one of 13 industries (26 obs) or to real
estate and 7 geographies for the years covered by that SWF. Thus the observations are 20 SWFs X 27 industry-asset class combinations X
6 years X 7 geographies. The mean number of years in the sample is 6 years. Cap Benchmark and Pension Benchmark are the portfolio
allocation weights based on total capitalization and CEM pension funds, respectively. The mean weight variable is the mean weight to the
asset class (private equity, public equity and real estate) for these benchmarks. Hedging Variables: Correlation(GDP, Industry) is the
correlation of the SWF country GDP with the industry. StDev(GDP)* I+/- is the standard deviation of home country GDP times the sign of
the correlation of GDP with the industry. Both are multiplied times the industry beta, where the beta for private equity is further multiplied
times 1.73 as described in the text. Correlation(GDP, Industry) is the correlation of the SWF country GDP with the industry. Foreign
Reserves is the value of foreign reserves divided by the SWF value. Measures to capture industrial planner objectives include Strategic
plan, which takes a value of 1 if the industry is mentioned in the country's strategic plan. Board_Experience is the average value of the
boards experience based on four measures of financial education or asset management experience. SkillIndustry is the proportion of
domestic investment invested in that industry with control (>20% stake). OilDepletion is years until depletion of oil reserves. Standard
errors are clustered at the SWF level in all columns except 4, 6 and 8, in which a GLS -AR1 estimation uses the Prais Winsten procedure.
Within Public Equity Within Private Equity
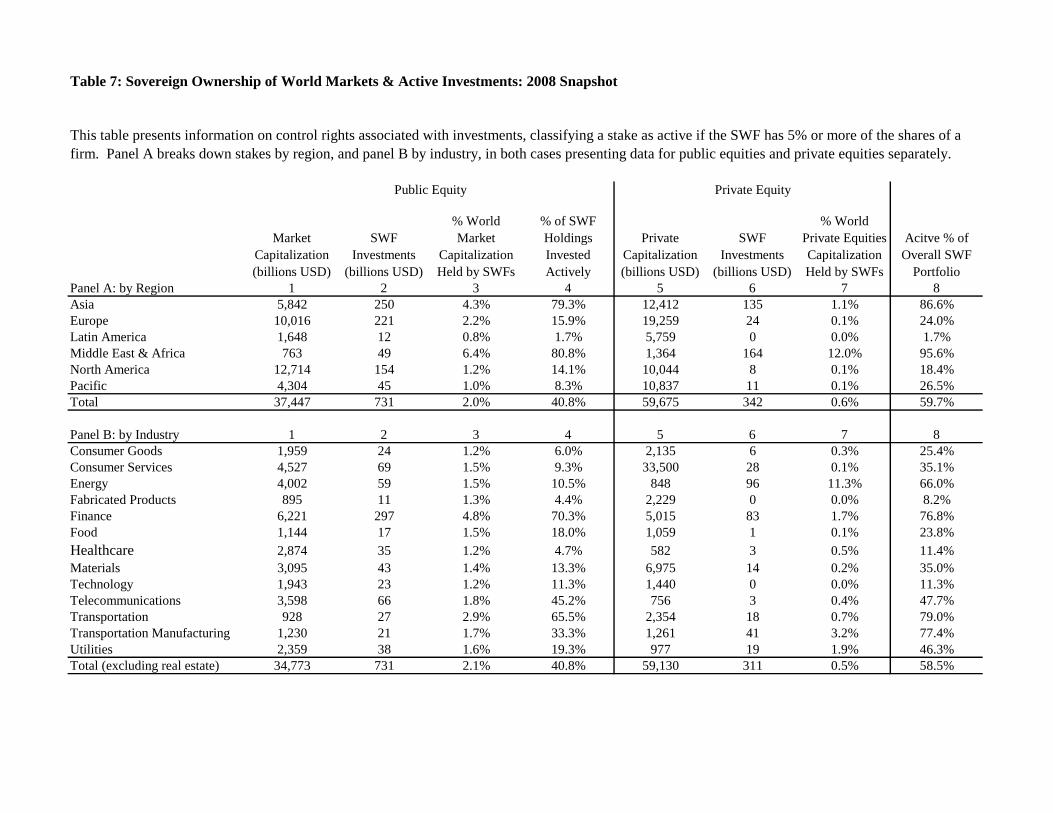
Table 7: Sovereign Ownership of World Markets & Active Investments: 2008 Snapshot
Market
Capitalization
(billions USD)
SWF
Investments
(billions USD)
% World
Market
Capitalization
Held by SWFs
% of SWF
Holdings
Invested
Actively
Private
Capitalization
(billions USD)
SWF
Investments
(billions USD)
% World
Private Equities
Capitalization
Held by SWFs
Panel A: by Region 1 2 3 4 5 6 7 8
Asia 5,842 250 4.3% 79.3% 12,412 135 1.1% 86.6%
Europe 10,016 221 2.2% 15.9% 19,259 24 0.1% 24.0%
Latin America 1,648 12 0.8% 1.7% 5,759 0 0.0% 1.7%
Middle East & Africa 763 49 6.4% 80.8% 1,364 164 12.0% 95.6%
North America 12,714 154 1.2% 14.1% 10,044 8 0.1% 18.4%
Pacific 4,304 45 1.0% 8.3% 10,837 11 0.1% 26.5%
Total 37,447 731 2.0% 40.8% 59,675 342 0.6% 59.7%
Panel B: by Industry 1 2 3 4 5 6 7 8
Consumer Goods 1,959 24 1.2% 6.0% 2,135 6 0.3% 25.4%
Consumer Services 4,527 69 1.5% 9.3% 33,500 28 0.1% 35.1%
Energy 4,002 59 1.5% 10.5% 848 96 11.3% 66.0%
Fabricated Products 895 11 1.3% 4.4% 2,229 0 0.0% 8.2%
Finance 6,221 297 4.8% 70.3% 5,015 83 1.7% 76.8%
Food 1,144 17 1.5% 18.0% 1,059 1 0.1% 23.8%
Healthcare 2,874 35 1.2% 4.7% 582 3 0.5% 11.4%
Materials 3,095 43 1.4% 13.3% 6,975 14 0.2% 35.0%
Technology 1,943 23 1.2% 11.3% 1,440 0 0.0% 11.3%
Telecommunications 3,598 66 1.8% 45.2% 756 3 0.4% 47.7%
Transportation 928 27 2.9% 65.5% 2,354 18 0.7% 79.0%
Transportation Manufacturing 1,230 21 1.7% 33.3% 1,261 41 3.2% 77.4%
Utilities 2,359 38 1.6% 19.3% 977 19 1.9% 46.3%
Total (excluding real estate) 34,773 731 2.1% 40.8% 59,130 311 0.5% 58.5%
This table presents information on control rights associated with investments, classifying a stake as active if the SWF has 5% or more of the shares of a
firm. Panel A breaks down stakes by region, and panel B by industry, in both cases presenting data for public equities and private equities separately.
Public Equity Private Equity
Acitve % of
Overall SWF
Portfolio
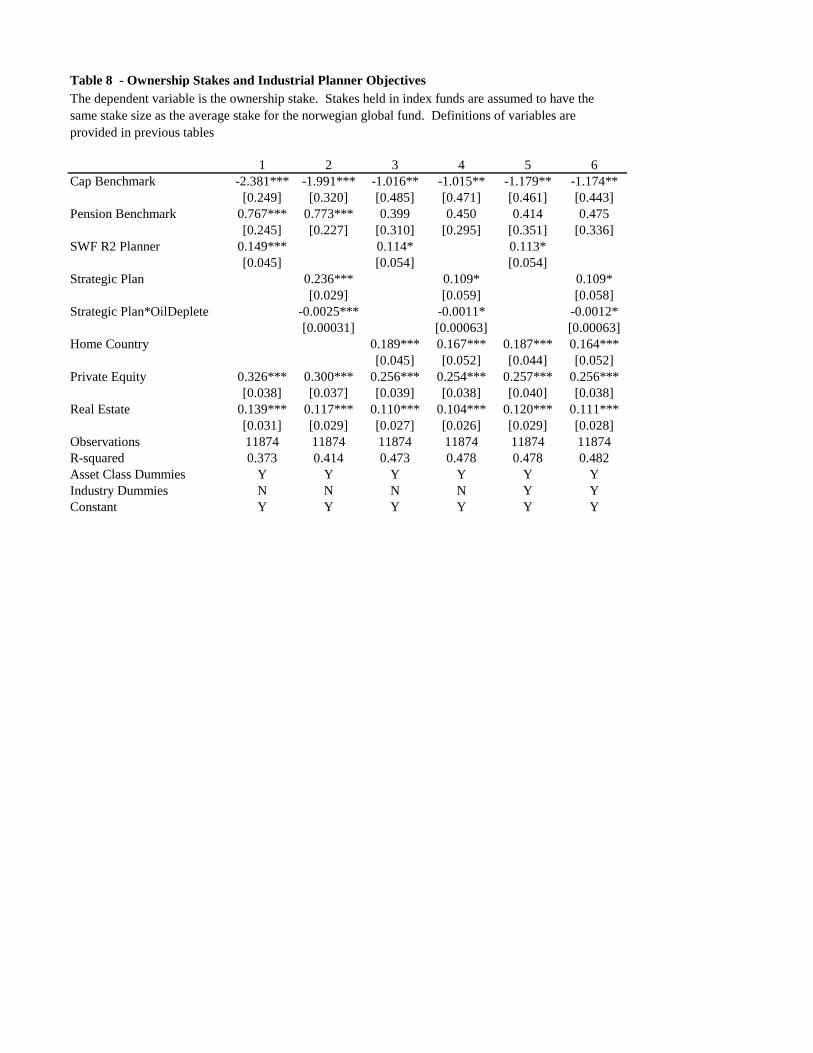
Table 8 - Ownership Stakes and Industrial Planner Objectives
1 2 3 4 5 6
Cap Benchmark -2.381*** -1.991*** -1.016** -1.015** -1.179** -1.174**
[0.249] [0.320] [0.485] [0.471] [0.461] [0.443]
Pension Benchmark 0.767*** 0.773*** 0.399 0.450 0.414 0.475
[0.245] [0.227] [0.310] [0.295] [0.351] [0.336]
SWF R2 Planner 0.149*** 0.114* 0.113*
[0.045] [0.054] [0.054]
Strategic Plan 0.236*** 0.109* 0.109*
[0.029] [0.059] [0.058]
Strategic Plan*OilDeplete -0.0025*** -0.0011* -0.0012*
[0.00031] [0.00063] [0.00063]
Home Country 0.189*** 0.167*** 0.187*** 0.164***
[0.045] [0.052] [0.044] [0.052]
Private Equity 0.326*** 0.300*** 0.256*** 0.254*** 0.257*** 0.256***
[0.038] [0.037] [0.039] [0.038] [0.040] [0.038]
Real Estate 0.139*** 0.117*** 0.110*** 0.104*** 0.120*** 0.111***
[0.031] [0.029] [0.027] [0.026] [0.029] [0.028]
Observations 11874 11874 11874 11874 11874 11874
R-squared 0.373 0.414 0.473 0.478 0.478 0.482
Asset Class Dummies Y Y Y Y Y Y
Industry Dummies N N N N Y Y
Constant Y Y Y Y Y Y
The dependent variable is the ownership stake. Stakes held in index funds are assumed to have the
same stake size as the average stake for the norwegian global fund. Definitions of variables are
provided in previous tables