Embed Size (px)
Citation preview
SOUTH DOWNS NATIONAL PARK Climate Change Adaptation Plan
South Downs Centre North Street Midhurst West Sussex GU29 9DH
T: 01730 814810 SOUTHDOWNS.GOV.UK
2 South Downs National Park
SOUTH DOWNS NATIONAL PARK Climate Change Adaptation Plan
Pond dipping in July ©SDNPA/ Mischa Haller
Climate Change Adaptation Plan 3
CONTENTSIntroduction 04
The National Park Partnership Management Plan
06
Why produce a climate change adaptation plan?
07
Building resilience into ecological networks
08
The Adaptation Approach (methodology)
09
Evidence Base 10
National level projections till 2050 11
Primary habitats vulnerable to climate change
12
Impacts and observed changes on key National Park assets and interests
13
Ecosystem Services and climate change 20
Assessment of the risks and opportunities
22
Summary of high risk impacts over short, medium and long term
24
Interdependencies, barriers and opportunities
25
Next Steps – Implementing and reviewing the Action Plan
26
AnnexesAnnex 1 – Ecosystem Service Impacts 28
Annex 2 – Assessment of the principal climate change risks and opportunities
38
Annex 3 – Climate Change Action Plan 80
Annex 4 – Policy responses to climate change within the Partnership Management Plan (PMP)
98
Annex 5 – Bibliography 100
4 South Downs National Park Climate Change Adaptation Plan 5
INTRODUCTIONClimate change is one of the principal drivers of environmental change for the South Downs National Park in the future. Its impacts are likely to be significant and profound across a whole range of areas and assets. The impact upon some of the key Ecosystem Services of the National Park are also potentially significant.
At the upper range of current predictions we may start to exceed the thresholds at which these services function adequately. The current understanding of environmental limits is insufficient, but in terms of planning adaptive responses we have adopted a precautionary approach1.
Change is inevitable, and the ability of natural systems to be resilient or adapt to climate change varies. Planning for adaptation requires ‘adjustment in natural or human systems in response to actual or expected climatic stimuli or their effects, which moderate harm or exploits beneficial opportunities’ (Intergovernmental Panel on Climate Change, 2007).
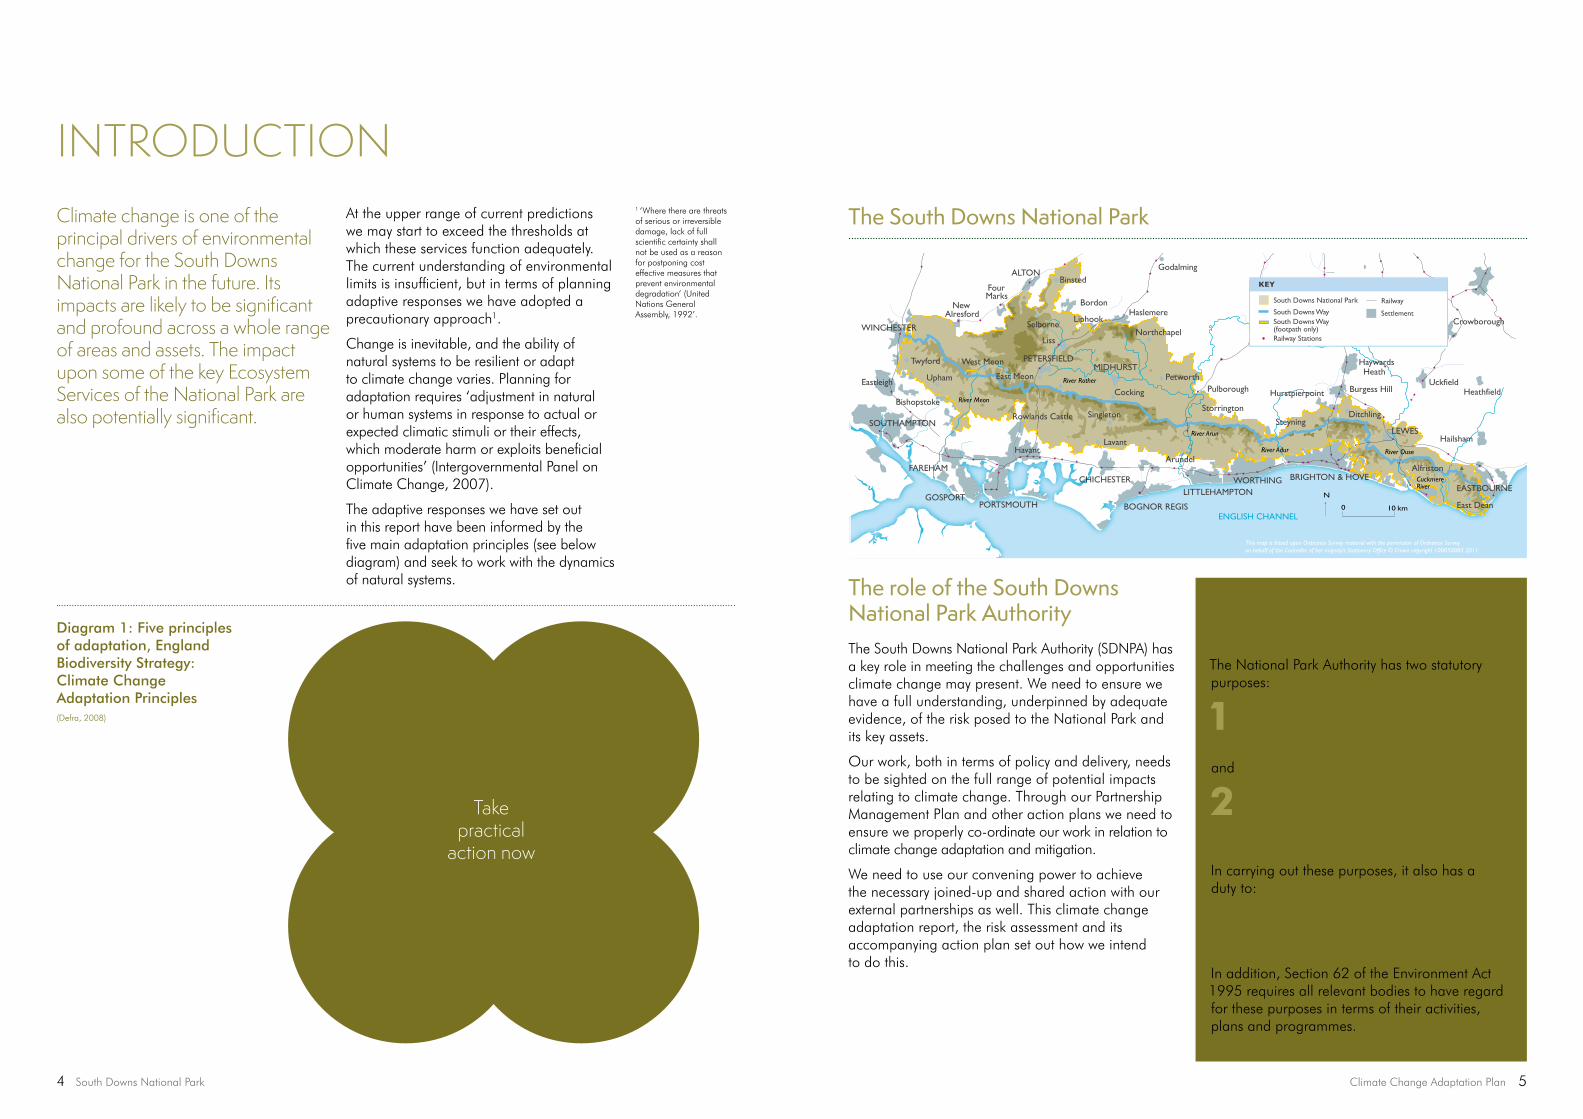
The adaptive responses we have set out in this report have been informed by the five main adaptation principles (see below diagram) and seek to work with the dynamics of natural systems.
1 ‘Where there are threats of serious or irreversible damage, lack of full scientific certainty shall not be used as a reason for postponing cost effective measures that prevent environmental degradation’ (United Nations General Assembly, 1992’.
Diagram 1: Five principles of adaptation, England Biodiversity Strategy: Climate Change Adaptation Principles(Defra, 2008)
Take practical
action now
Maintain and increase ecological resilience
Accommodate change
Develop knowledge and plan strategically
Integrate action across
all sectors
ENGLISH CHANNEL0 10 km
N
A31
River Rother
River Meon
River Arun
River Ouse
Godalming
Hailsham
HeathfieldHurstpierpoint
EASTBOURNE
Alfriston
LEWES
East Dean
DitchlingSteyning
Singleton
Lavant
HaywardsHeath
EASTCRAWLEYGRINSTEAD
HorshamCrowborough
Uckfield
Selborne
Liss
Upham
Twyford
Eastleigh
Bishopstoke
Havant
WINCHESTER
CHICHESTER
BOGNOR REGIS
LITTLEHAMPTONWORTHING BRIGHTON & HOVE
Storrington
PulboroughPetworth
MIDHURST
Cocking
East Meon
West Meon
HaslemereBordon
Burgess Hill
Northchapel
SOUTHAMPTON
FAREHAM
GOSPORTPORTSMOUTH
PETERSFIELD
ALTON
FourMarks
NewAlresford
Rowlands Castle
Arundel
Liphook
Binsted
This map is based upon Ordnance Survey material with the permission of Ordnance Surveyon behalf of the Controller of her majesty’s Stationery Office © Crown copyright 100050083 2011
CuckmereRiver
River Adur
KEY
South Downs National Park
South Downs Way
Railway
Railway Stations
South Downs Way(footpath only)
Settlement
The South Downs National Park
The Purposes and Duty of the National Park AuthorityThe National Park Authority has two statutory purposes:
1 ‘To conserve and enhance the natural beauty, wildlife and cultural heritage of the National Park area’;
and
2 ‘To promote opportunities for the understanding and enjoyment of the special qualities of the National Park by the public’;
In carrying out these purposes, it also has a duty to:
‘Seek to foster the economic and social well-being of the local communities within the National Park’.
In addition, Section 62 of the Environment Act 1995 requires all relevant bodies to have regard for these purposes in terms of their activities, plans and programmes.
The role of the South Downs National Park AuthorityThe South Downs National Park Authority (SDNPA) has a key role in meeting the challenges and opportunities climate change may present. We need to ensure we have a full understanding, underpinned by adequate evidence, of the risk posed to the National Park and its key assets.
Our work, both in terms of policy and delivery, needs to be sighted on the full range of potential impacts relating to climate change. Through our Partnership Management Plan and other action plans we need to ensure we properly co-ordinate our work in relation to climate change adaptation and mitigation.
We need to use our convening power to achieve the necessary joined-up and shared action with our external partnerships as well. This climate change adaptation report, the risk assessment and its accompanying action plan set out how we intend to do this.
6 South Downs National Park Climate Change Adaptation Plan 7
THE NATIONAL PARK PARTNERSHIP MANAGEMENT PLANIn terms of its plan making and policies we, the SDNPA, have sought to develop an integrated approach to managing land, water and the living resources of the National Park. It also seeks to promote their conservation and sustainable use, to ensure that these essential natural services are protected and enhanced now and for the future.
The Partnership Management Plan (PMP) for the South Downs was published in 2013. It is the first over-arching five year strategy for the South Downs National Park. Preparation of the PMP was led and co-ordinated by the National Park Authority working jointly with a high-level stakeholder group – the South Downs Partnership and with extensive public consultation.
The PMP sets out a long-term vision for the National Park. It includes 11 outcomes which provide a framework for communities, landowners, charities, businesses and public bodies to work together to make this vision and these outcomes a reality. The PMP also drives the Authority’s own business and operational plans, and provides the starting point for the development of the policies in our Local Plan document.
southdowns.gov.uk/pmp
Core Values and Guiding Principles from the PMP that are relevant to this adaptation plan
‘Living within environmental limits – considering the impact on the environment’This adaptation report and action plan is about identifying the risks relating to climate change and how they might impact upon the environmental, social and economic assets of the National Park. This is fundamentally about living within environmental limits – either through highlighting mitigation or adaptation responses.
‘Ensuring a strong healthy and just society – considering social cohesion and wellbeing’ Environmental impacts, driven by climate change, are also likely to have significant impacts on society, health and well-being. The requirement placed on us to report covers social impacts as well – as far as they relate to our purposes and duty.
‘Achieving a sustainable economy – considering impacts on or contribution to a sustainable economy’
The requirement to report also covers the impact on the rural economy and how resilience for the future might be built in through adaptive responses.
‘Promoting good governance – considering how to encourage active participation’ The requirement to report also means that we need to identify risks associated with climate change and plan effectively to mitigate or adapt in response to those challenges. This reflects and promotes good governance. The Adaptation Report, once completed, is a mechanism through which we can encourage action by actively communicating the findings of the report.
‘Using evidence to support proposals – taking account of the precautionary principle’. The adaptation report will need to be properly evidenced to meet the requirements being placed on us by the Climate Change Act and the Adaptation Reporting Powers being exercised by the Secretary of State. It needs to be based upon the best available science and the UK Climate Impacts Projections (UKCIP) and national level risk assessment. As it requires us to think about building adaptive responses for the future, it is taking full account of the precautionary principle.
The Climate Change Act (2008) gave a new directive power to the Secretary of State for Environment, Food & Rural Affairs. This allows them to ask public authorities, statutory bodies and other organisations performing functions of a public nature, to report on their progress in adapting to climate change. This is known as the Adaptation Reporting Power (ARP). The ARP places a requirement on these bodies to produce a report that sets out how they are responding to the risks and impacts presented by climate change to their core business.
In July 2013, the government published the first National Adaptation Programme. This summary report was based upon data from the first ‘Adaptation Plan’ reporting round. Based upon current modelled projections, it sets out the current challenges
in building resilience to climate change across sectors, taking into account the full range of social, economic and environmental impacts.
The UK government is preparing to update the UK Climate Change Risk Assessment and the supporting evidence reports in 2017. To inform this process, the Secretary of State for Environment, Food & Rural Affairs invited the National Park Authorities to undertake a second round of reporting. The SDNPA formally agreed to participate in this.
Voluntary guidance on how to produce an Adaptation Report was issued to all reporting authorities giving them advice on:
n Assessing the current and predicted impacts of climate change in relation to their purposes and statutory functions;
n Preparing proposals and policy responses to adapt adequately to the risks to their business that relate to climate change;
n Co-operating with other reporting authorities to achieve that purpose.
The structure and approach taken in this report has been informed by Defra’s reporting guidance. The previous National Adaptation Programme report also provided a good basis for defining some of the principle topic heading and focal areas.
The reports submitted through the second round will help the government assess the level of capacity within each sector to develop adaptive responses. The information provided will also inform the review of the National Climate Change Risk Assessment in any updates of the Adaptation Programme thereafter.
WHY PRODUCE A CLIMATE CHANGE ADAPTATION PLAN?
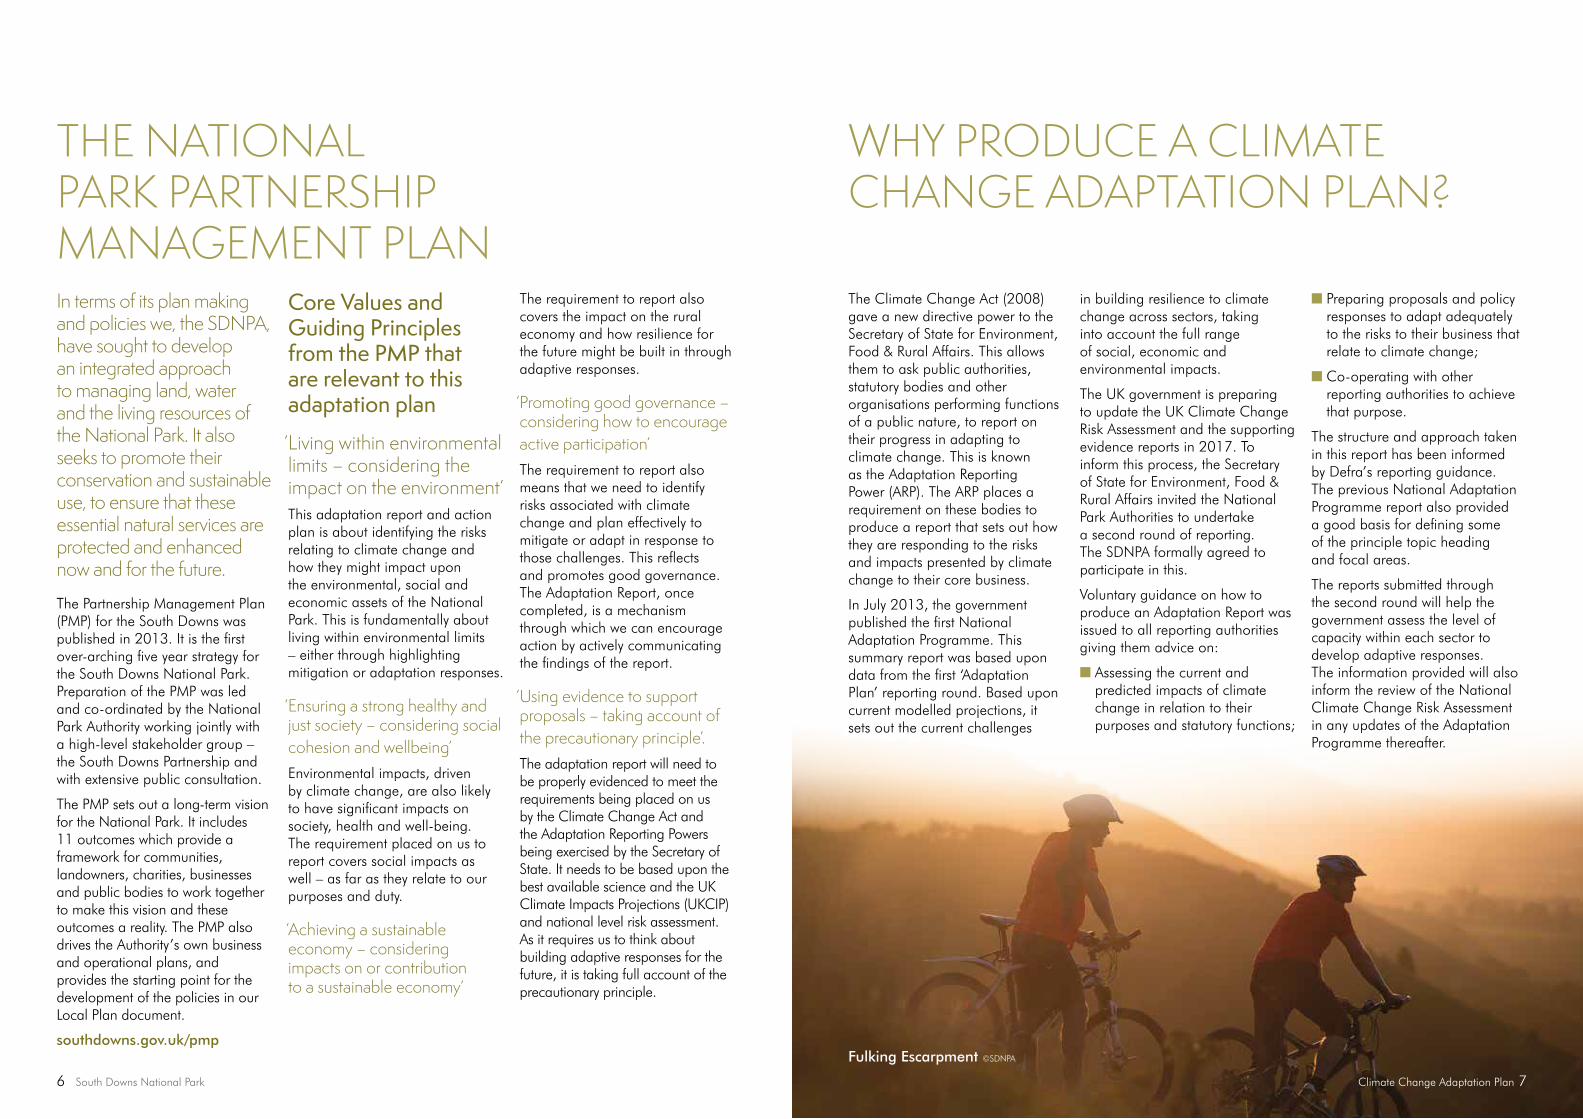
Fulking Escarpment ©SDNPA

8 South Downs National Park Climate Change Adaptation Plan 9
Through our involvement in the National Parks England Climate Change Working Group we benefitted greatly from the experience accrued by the other National Parks in developing their first round reports. Our approach has been informed by the best practice identified as a result of this exercise.
For the preparation of our Adaptation Report and Action Plan we have required expertise and input from across the SDNPA as well as from external partners. This has been achieved through establishing a ‘task and finish’ group that brought together the relevant expertise from a wide constituency. We have also run a number of workshop events to facilitate joint working.
In order to fulfil the requirement to report properly, we initially scoped the areas that were most relevant for us to report on. An initial exercise was carried out to map our principal policy responses and delivery within the South Downs Partnership Management Plan against the focal areas set out in the National Adaptation Programme.
This identified the principal areas that we considered were necessary to address within the report, and gave us a broad framework within which to structure the report.
In developing our adaptation approach, a major requirement was to undertake a risk assessment across the breadth of our business. This was developed from our current evidence baseline and sought to identify the impacts upon the key assets of the National Park. It also looked across relevant sectors that are central to the landscape of the National Park such as farming, forestry and other principal land uses.
We have tried to assess the likely impacts upon Ecosystem Services and the functions which are provided by the natural environment that benefit society.
In terms of a broad methodology we have sought to:
1Core areas of high conservation value – rare or important habitats or areas that are of high ecological value or deliver important ecosystem services.
2Corridors or stepping stones – provide a mosaic of habitats allowing species to move between core areas and supporting ecosystem service function.
3 Restoration areas – creating new high value areas that restore habitats and ecosystem service functions.
4 Buffer Zones – that protect core areas from adverse impacts in the wider environment.
5Sustainable use areas – parts of surrounding land that are managed in a sustainable and wildlife friendly way.
BUILDING RESILIENCE INTO ECOLOGICAL NETWORKS
THE ADAPTATION APPROACH (METHODOLOGY)
Biodiversity 2020: A strategy for England’s wildlife and ecosystem services (2011) sets out some priority actions that seek to increase resilience to climate change, and suggests we actively review our responses over time. Key to this is the need to establish ‘more coherent and resilient ecological networks on land that safeguard ecosystem services for the benefit of wildlife and people’.
To achieve this the strategy recommends a spatially based approach and landscape scale action. The risk and opportunity assessment, which is annexed to this report, sets out these challenges as fully as possible. It also sets out an action plan for how we might seek to address the most significant effects, or make best use of new opportunities.
Five components of an ecological network:
Coherent =Has all the necessary elements and its value is more than the sum of its component parts.
Resilience =Able to absorb, resist or recover from disturbances or damage from natural influences, human activities (including climate change) while continuing to provide ecosystem services.
Identify the key assets and features of the National Park.
Assess vulnerability of key assets and features of the National Park.
Consider sectoral impacts for principle land uses such as farming and forestry.
Assess the impacts based upon current climate change projections
Score these risks and opportunities based upon likelihood, impact and risk for the short, medium and long term.
Identify current policy responses and highlight any gaps.
Identify adaptation options (potential delivery/actions).
Assess the acceptability of those options, their interdependencies, and the potential barriers to delivery.
Identify planned actions for the short, medium and long term (delivery/actions).
Climate Change Adaptation Plan 1110 South Downs National Park
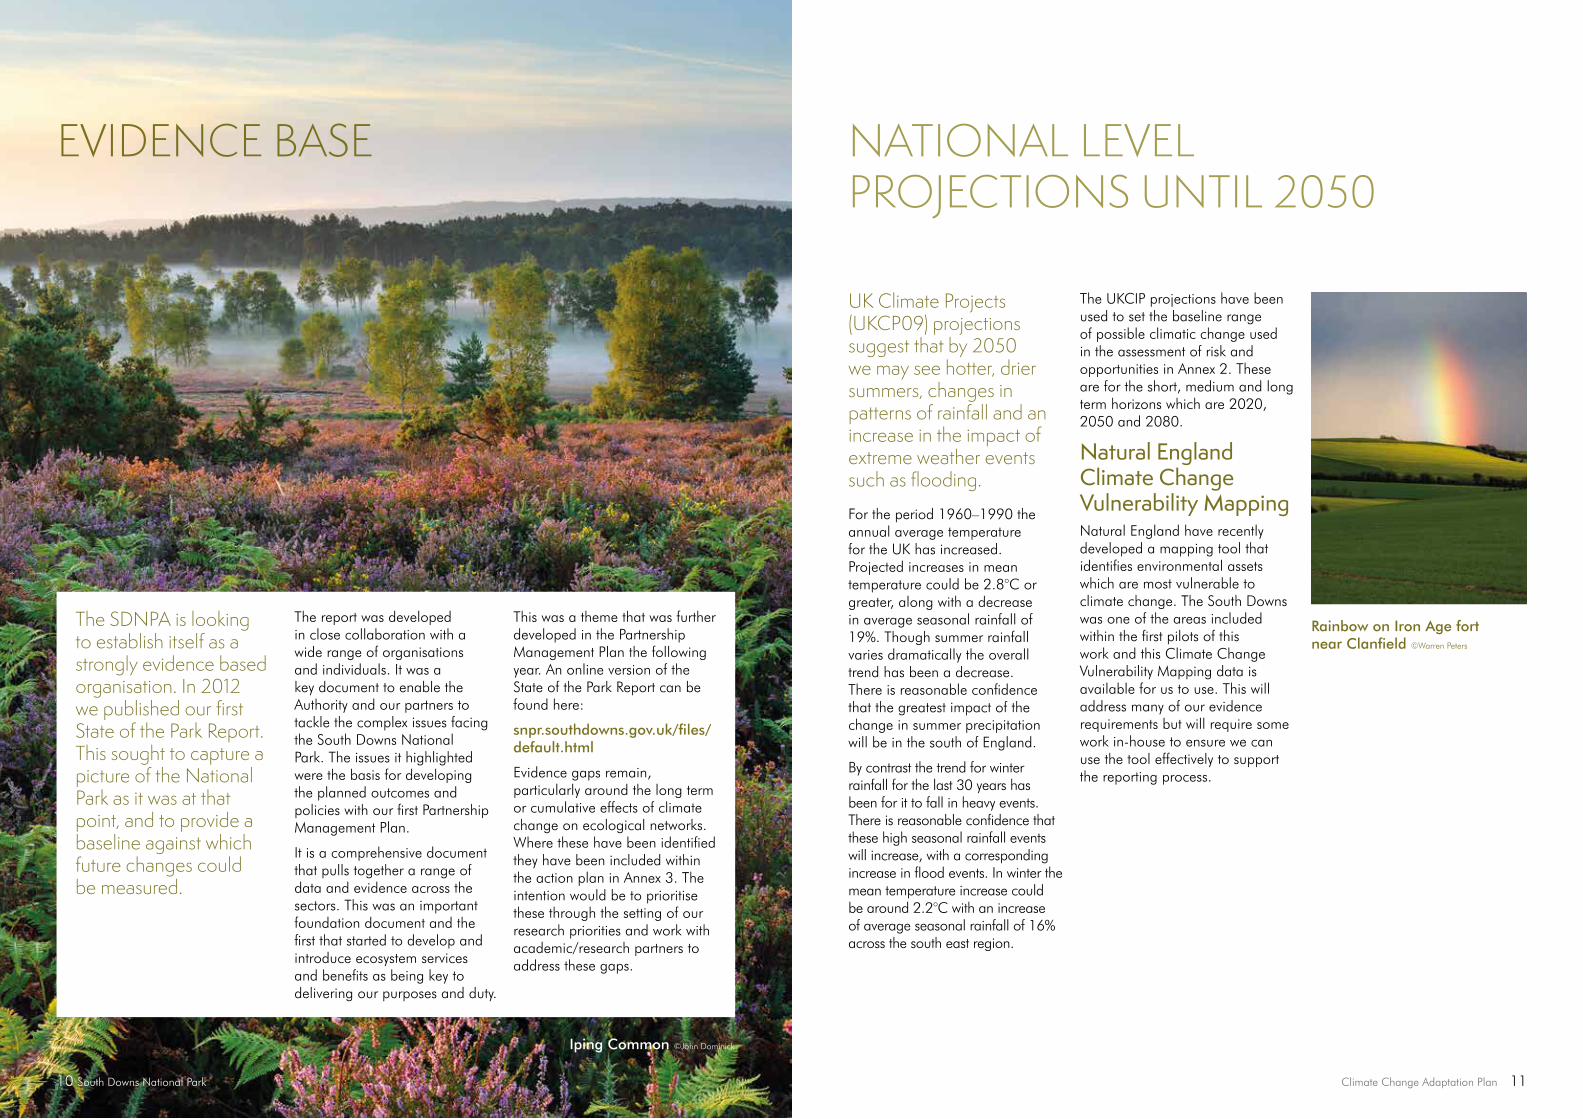
The SDNPA is looking to establish itself as a strongly evidence based organisation. In 2012 we published our first State of the Park Report. This sought to capture a picture of the National Park as it was at that point, and to provide a baseline against which future changes could be measured.
The report was developed in close collaboration with a wide range of organisations and individuals. It was a key document to enable the Authority and our partners to tackle the complex issues facing the South Downs National Park. The issues it highlighted were the basis for developing the planned outcomes and policies with our first Partnership Management Plan.
It is a comprehensive document that pulls together a range of data and evidence across the sectors. This was an important foundation document and the first that started to develop and introduce ecosystem services and benefits as being key to delivering our purposes and duty.
This was a theme that was further developed in the Partnership Management Plan the following year. An online version of the State of the Park Report can be found here:
snpr.southdowns.gov.uk/files/default.html
Evidence gaps remain, particularly around the long term or cumulative effects of climate change on ecological networks. Where these have been identified they have been included within the action plan in Annex 3. The intention would be to prioritise these through the setting of our research priorities and work with academic/research partners to address these gaps.
Iping Common ©John Dominick
EVIDENCE BASE NATIONAL LEVEL PROJECTIONS UNTIL 2050
UK Climate Projects (UKCP09) projections suggest that by 2050 we may see hotter, drier summers, changes in patterns of rainfall and an increase in the impact of extreme weather events such as flooding.
For the period 1960–1990 the annual average temperature for the UK has increased. Projected increases in mean temperature could be 2.8°C or greater, along with a decrease in average seasonal rainfall of 19%. Though summer rainfall varies dramatically the overall trend has been a decrease. There is reasonable confidence that the greatest impact of the change in summer precipitation will be in the south of England.
By contrast the trend for winter rainfall for the last 30 years has been for it to fall in heavy events. There is reasonable confidence that these high seasonal rainfall events will increase, with a corresponding increase in flood events. In winter the mean temperature increase could be around 2.2°C with an increase of average seasonal rainfall of 16% across the south east region.
The UKCIP projections have been used to set the baseline range of possible climatic change used in the assessment of risk and opportunities in Annex 2. These are for the short, medium and long term horizons which are 2020, 2050 and 2080.
Natural England Climate Change Vulnerability MappingNatural England have recently developed a mapping tool that identifies environmental assets which are most vulnerable to climate change. The South Downs was one of the areas included within the first pilots of this work and this Climate Change Vulnerability Mapping data is available for us to use. This will address many of our evidence requirements but will require some work in-house to ensure we can use the tool effectively to support the reporting process.
Rainbow on Iron Age fort near Clanfield ©Warren Peters
12 South Downs National Park Climate Change Adaptation Plan 13
Observed changes in species phenology2
According to the Central England Climate (CET) record, during the last ten years the plant growing season has been an average of 29 days longer then the climatological period 1961–1990. Between the period 1861 and 1890 the average was 244 days, for the period 2006–2015 the average growing season has been 280 days. Six of the ten longest growing seasons recorded have fallen within the last 30 years, with the longest 336 days being recorded in 2014 (Met Office, 2016)
The CET series also reveals another climatic trend, which is that the number of days of air frost – where the temperature dips below 0° – has been declining. The average number of air frost days for the period 2006–2015 has dropped by 16.6% when compared with the period 1961–1990 (Met Office, 2016).
There has been a trend towards warmer springs in recent decades which has meant that biological events such as flowering, budding and egg laying/hatching have been occurring earlier. This rate of change may vary between species so affecting the interactions between species (LWEC, 2013).
In terrestrial ecosystems there is an observed earlier occurrence of spring seasonal events in plants and animals. There has also been a corresponding shift in later occurrence of autumn seasonal events. The timing of such events in plants is shifting, with 78% of leafing and flowering records showing an advance between 1971 and 2000. The average advance of spring and summer has been between 2.5 and 4 days per decade and the pollen season starts (of average) 10 days earlier than in the 1960s.
Ground flora in woodland may be impacted by earlier leafing and development of the woodland canopy as a result of advancing seasonal events.
Many animal groups have seen their life cycles advance in recent decades including frogs spawning, birds nesting and the arrival of migrant birds. The breeding season for many temperature sensitive species such as butterflies, dragonflies and beetles has also been lengthening.
2 Phenology is the study of periodic plant and animal life cycle events and how these are influenced by seasonal and inter-annual variations in climate, as well as habitat factors (such as elevation).
IMPACTS AND OBSERVED CHANGES ON KEY NATIONAL PARK ASSETS AND INTERESTS
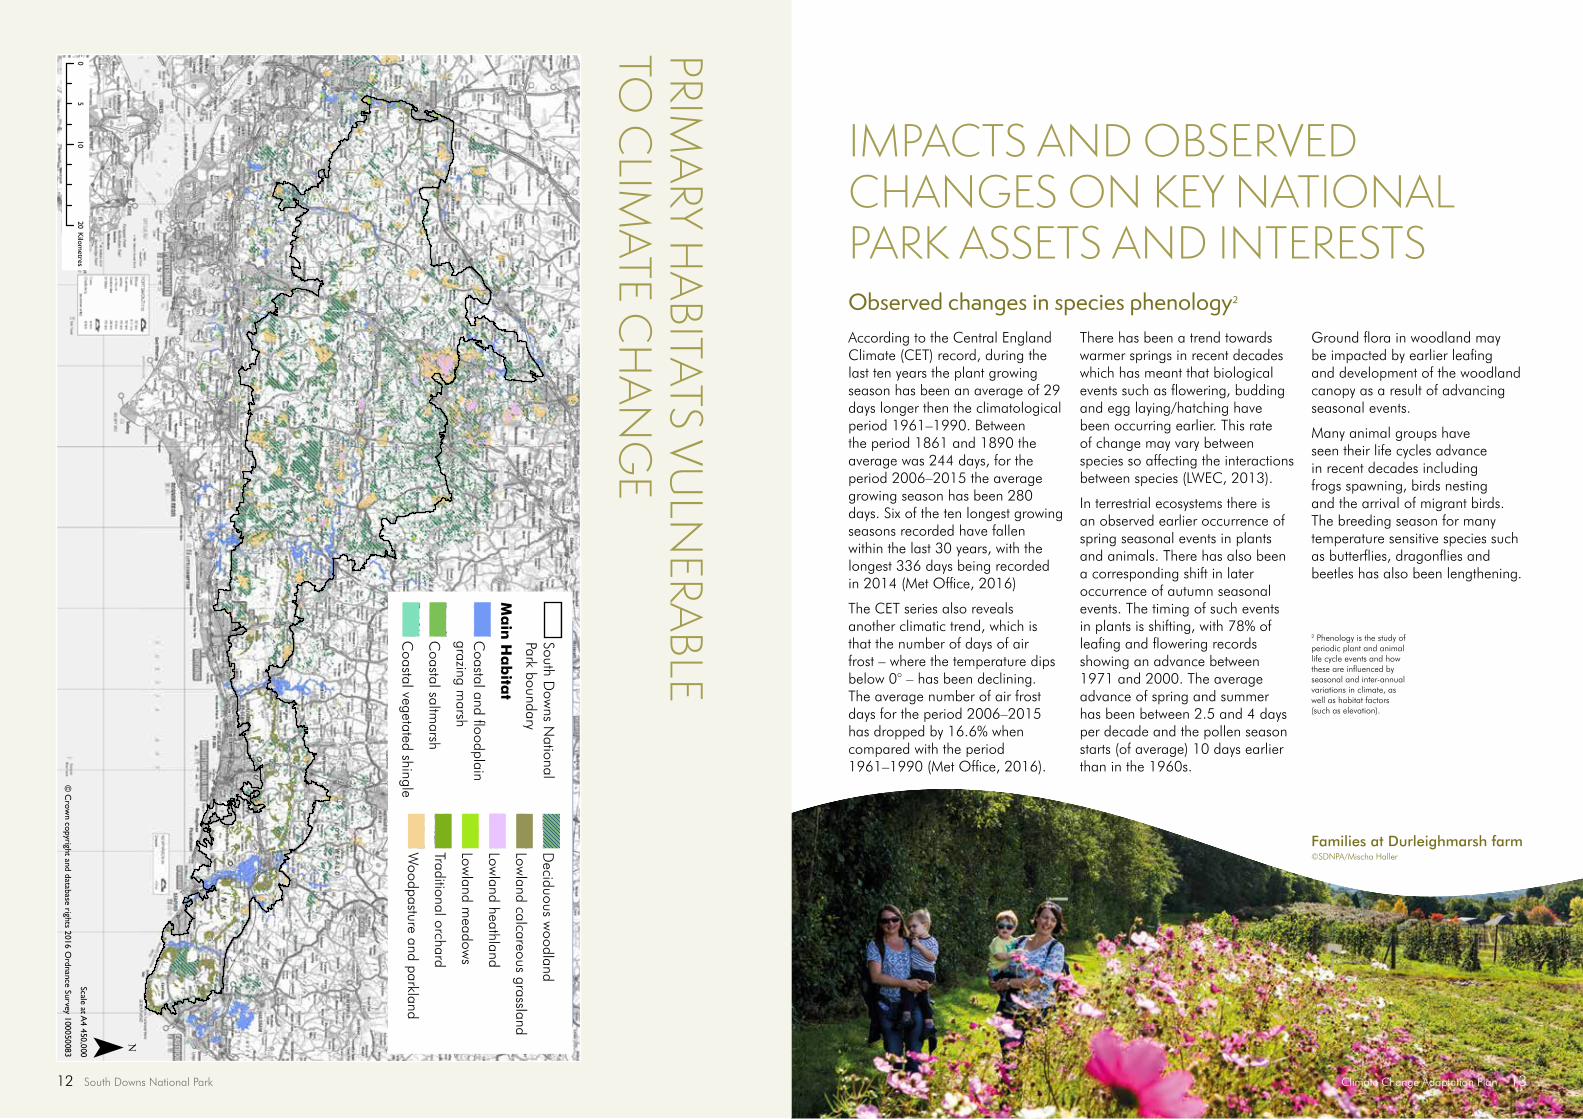
PRIMA
RY HA
BITATS VULN
ERABLE
TO C
LIMATE C
HA
NG
E
Families at Durleighmarsh farm ©SDNPA/Mischa Haller
Scale at A4 450,000
© C
rown copyright and database rights 2016 O
rdnance Survey 100050083
Primary H
abitats Vulnerable to Clim
ate Change
South Dow
ns National Park boundary
Main H
abitCoastal and floodplain grazing m
arsh
Coastal saltm
arsh
Coastal vegetated shingle
Deciduous w
oodland
Lowland calcareous grassland
Lowland heathland
Lowland m
eadows
Traditional orchard
Woodpasture and parkland
010
205
Kilom
etres
¯Scale at A
4 450,000
© C
rown copyright and database rights 2016 O
rdnance Survey 100050083
Primary H
abitats Vulnerable to Clim
ate Change
South Dow
ns National Park boundary
Main H
abitCoastal and floodplain grazing m
arsh
Coastal saltm
arsh
Coastal vegetated shingle
Deciduous w
oodland
Lowland calcareous grassland
Lowland heathland
Lowland m
eadows
Traditional orchard
Woodpasture and parkland
010
205
Kilom
etres
¯
South Dow
ns National
Park boundary
Ma
in H
ab
itat
Scale at A4 450,000
© C
rown copyright and database rights 2016 O
rdnance Survey 100050083
Primary H
abitats Vulnerable to Clim
ate Change
South Dow
ns National Park boundary
Main H
abitCoastal and floodplain grazing m
arsh
Coastal saltm
arsh
Coastal vegetated shingle
Deciduous w
oodland
Lowland calcareous grassland
Lowland heathland
Lowland m
eadows
Traditional orchard
Woodpasture and parkland
010
205
Kilom
etres
¯
Coastal and floodplain
grazing marsh
Scale at A4 450,000
© C
rown copyright and database rights 2016 O
rdnance Survey 100050083
Primary H
abitats Vulnerable to Clim
ate Change
South Dow
ns National Park boundary
Main H
abitCoastal and floodplain grazing m
arsh
Coastal saltm
arsh
Coastal vegetated shingle
Deciduous w
oodland
Lowland calcareous grassland
Lowland heathland
Lowland m
eadows
Traditional orchard
Woodpasture and parkland
010
205
Kilom
etres
¯
Coastal saltm
arsh
Scale at A4 450,000
© C
rown copyright and database rights 2016 O
rdnance Survey 100050083
Primary H
abitats Vulnerable to Clim
ate Change
South Dow
ns National Park boundary
Main H
abitCoastal and floodplain grazing m
arsh
Coastal saltm
arsh
Coastal vegetated shingle
Deciduous w
oodland
Lowland calcareous grassland
Lowland heathland
Lowland m
eadows
Traditional orchard
Woodpasture and parkland
010
205
Kilom
etres
¯
Coastal vegetated shingle
Scale at A4 450,000
© C
rown copyright and database rights 2016 O
rdnance Survey 100050083
Primary H
abitats Vulnerable to Clim
ate Change
South Dow
ns National Park boundary
Main H
abitCoastal and floodplain grazing m
arsh
Coastal saltm
arsh
Coastal vegetated shingle
Deciduous w
oodland
Lowland calcareous grassland
Lowland heathland
Lowland m
eadows
Traditional orchard
Woodpasture and parkland
010
205
Kilom
etres
¯
Deciduous w
oodland
Scale at A4 450,000
© C
rown copyright and database rights 2016 O
rdnance Survey 100050083
Primary H
abitats Vulnerable to Clim
ate Change
South Dow
ns National Park boundary
Main H
abitCoastal and floodplain grazing m
arsh
Coastal saltm
arsh
Coastal vegetated shingle
Deciduous w
oodland
Lowland calcareous grassland
Lowland heathland
Lowland m
eadows
Traditional orchard
Woodpasture and parkland
010
205
Kilom
etres
¯
Lowland calcareous grassland
Scale at A4 450,000
© C
rown copyright and database rights 2016 O
rdnance Survey 100050083
Primary H
abitats Vulnerable to Clim
ate Change
South Dow
ns National Park boundary
Main H
abitCoastal and floodplain grazing m
arsh
Coastal saltm
arsh
Coastal vegetated shingle
Deciduous w
oodland
Lowland calcareous grassland
Lowland heathland
Lowland m
eadows
Traditional orchard
Woodpasture and parkland
010
205
Kilom
etres
¯
Lowland heathlandScale at A
4 450,000
© C
rown copyright and database rights 2016 O
rdnance Survey 100050083
Primary H
abitats Vulnerable to Clim
ate Change
South Dow
ns National Park boundary
Main H
abitCoastal and floodplain grazing m
arsh
Coastal saltm
arsh
Coastal vegetated shingle
Deciduous w
oodland
Lowland calcareous grassland
Lowland heathland
Lowland m
eadows
Traditional orchard
Woodpasture and parkland
010
205
Kilom
etres
¯
Lowland m
eadowsScale at A
4 450,000
© C
rown copyright and database rights 2016 O
rdnance Survey 100050083
Primary H
abitats Vulnerable to Clim
ate Change
South Dow
ns National Park boundary
Main H
abitCoastal and floodplain grazing m
arsh
Coastal saltm
arsh
Coastal vegetated shingle
Deciduous w
oodland
Lowland calcareous grassland
Lowland heathland
Lowland m
eadows
Traditional orchard
Woodpasture and parkland
010
205
Kilom
etres
¯
Traditional orchardScale at A4 450,000
© C
rown copyright and database rights 2016 O
rdnance Survey 100050083
Primary H
abitats Vulnerable to Clim
ate Change
South Dow
ns National Park boundary
Main H
abitCoastal and floodplain grazing m
arsh
Coastal saltm
arsh
Coastal vegetated shingle
Deciduous w
oodland
Lowland calcareous grassland
Lowland heathland
Lowland m
eadows
Traditional orchard
Woodpasture and parkland
010
205
Kilom
etres
¯
Woodpasture and parkland
14 South Downs National Park Climate Change Adaptation Plan 15
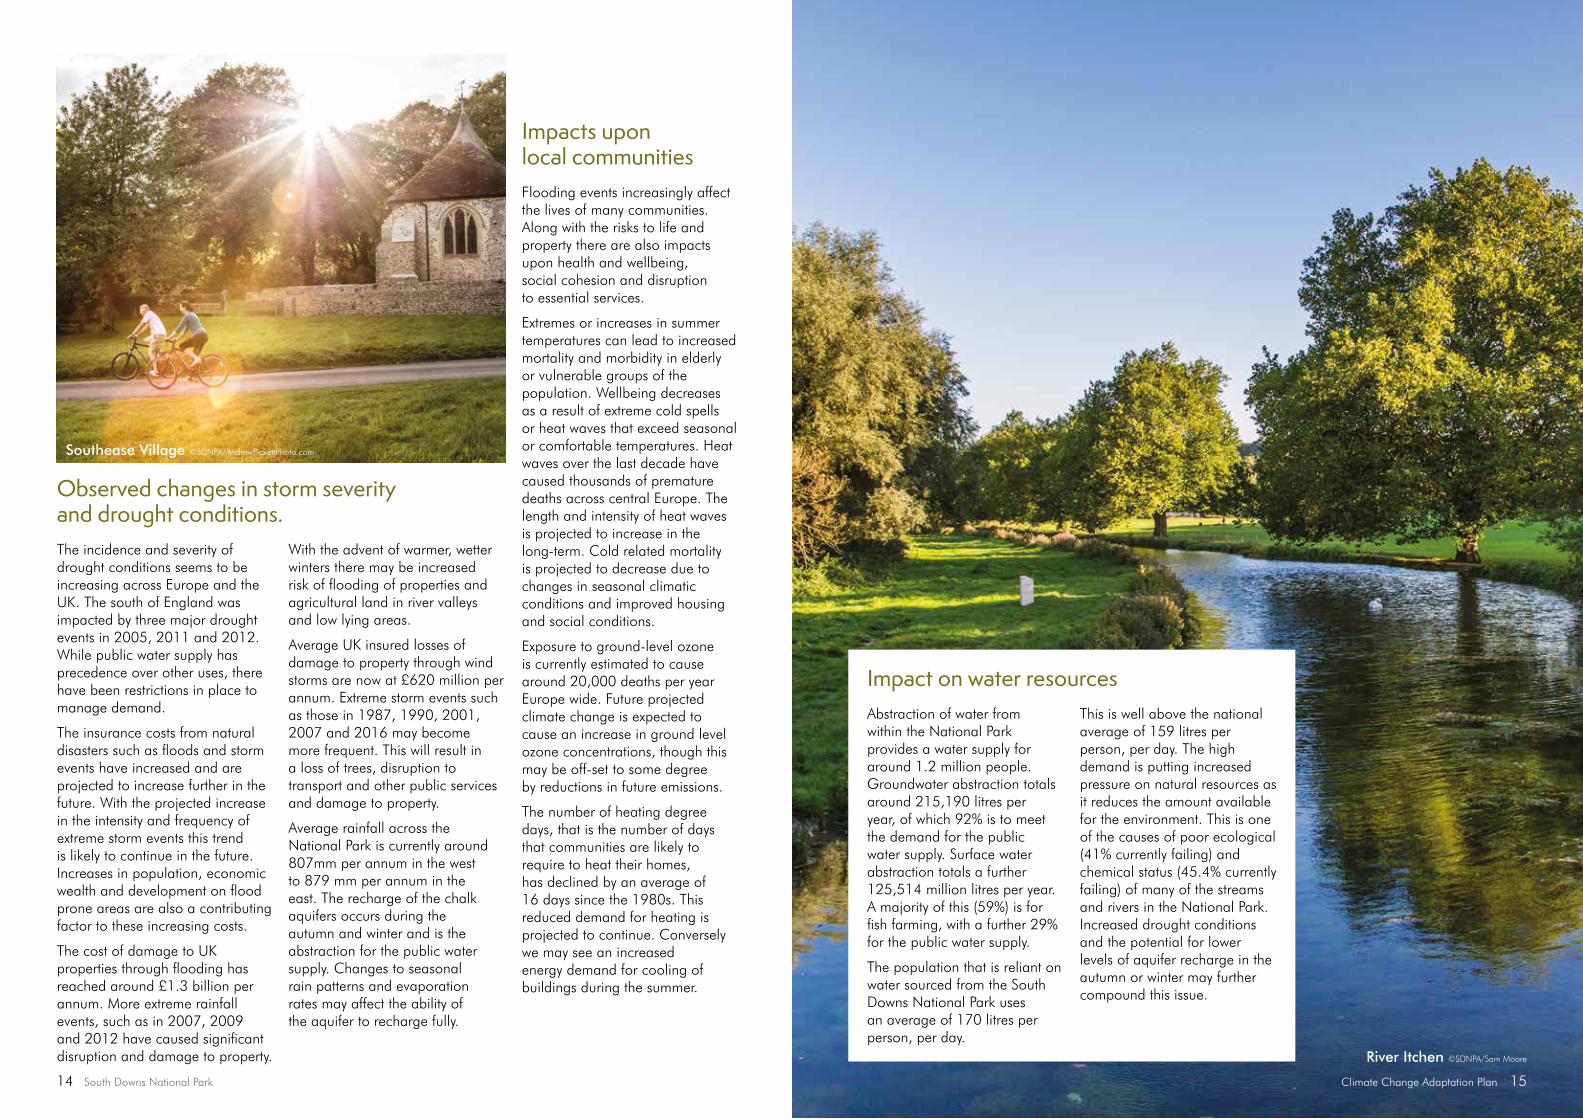
Impact on water resourcesAbstraction of water from within the National Park provides a water supply for around 1.2 million people. Groundwater abstraction totals around 215,190 litres per year, of which 92% is to meet the demand for the public water supply. Surface water abstraction totals a further 125,514 million litres per year. A majority of this (59%) is for fish farming, with a further 29% for the public water supply.
The population that is reliant on water sourced from the South Downs National Park uses an average of 170 litres per person, per day.
This is well above the national average of 159 litres per person, per day. The high demand is putting increased pressure on natural resources as it reduces the amount available for the environment. This is one of the causes of poor ecological (41% currently failing) and chemical status (45.4% currently failing) of many of the streams and rivers in the National Park. Increased drought conditions and the potential for lower levels of aquifer recharge in the autumn or winter may further compound this issue.
River Itchen ©SDNPA/Sam Moore
Observed changes in storm severity and drought conditions.The incidence and severity of drought conditions seems to be increasing across Europe and the UK. The south of England was impacted by three major drought events in 2005, 2011 and 2012. While public water supply has precedence over other uses, there have been restrictions in place to manage demand.
The insurance costs from natural disasters such as floods and storm events have increased and are projected to increase further in the future. With the projected increase in the intensity and frequency of extreme storm events this trend is likely to continue in the future. Increases in population, economic wealth and development on flood prone areas are also a contributing factor to these increasing costs.
The cost of damage to UK properties through flooding has reached around £1.3 billion per annum. More extreme rainfall events, such as in 2007, 2009 and 2012 have caused significant disruption and damage to property.
With the advent of warmer, wetter winters there may be increased risk of flooding of properties and agricultural land in river valleys and low lying areas.
Average UK insured losses of damage to property through wind storms are now at £620 million per annum. Extreme storm events such as those in 1987, 1990, 2001, 2007 and 2016 may become more frequent. This will result in a loss of trees, disruption to transport and other public services and damage to property.
Average rainfall across the National Park is currently around 807mm per annum in the west to 879 mm per annum in the east. The recharge of the chalk aquifers occurs during the autumn and winter and is the abstraction for the public water supply. Changes to seasonal rain patterns and evaporation rates may affect the ability of the aquifer to recharge fully.
Impacts upon local communitiesFlooding events increasingly affect the lives of many communities. Along with the risks to life and property there are also impacts upon health and wellbeing, social cohesion and disruption to essential services.
Extremes or increases in summer temperatures can lead to increased mortality and morbidity in elderly or vulnerable groups of the population. Wellbeing decreases as a result of extreme cold spells or heat waves that exceed seasonal or comfortable temperatures. Heat waves over the last decade have caused thousands of premature deaths across central Europe. The length and intensity of heat waves is projected to increase in the long-term. Cold related mortality is projected to decrease due to changes in seasonal climatic conditions and improved housing and social conditions.
Exposure to ground-level ozone is currently estimated to cause around 20,000 deaths per year Europe wide. Future projected climate change is expected to cause an increase in ground level ozone concentrations, though this may be off-set to some degree by reductions in future emissions.
The number of heating degree days, that is the number of days that communities are likely to require to heat their homes, has declined by an average of 16 days since the 1980s. This reduced demand for heating is projected to continue. Conversely we may see an increased energy demand for cooling of buildings during the summer.
Southease Village ©SDNPA/AndrewPickettPhoto.com
16 South Downs National Park Climate Change Adaptation Plan 17
Observed impacts from invasive species and pathogens3 The pattern of introduction for non-native species has remained consistent, however climatic change is favouring the spread of some species once they have established. There are a number of natural species colonisations that can be attributed to warming such as the southern emerald damselfly. The risk posed by invasive species, pests and pathogens may be increased by an increase in climatic compatibility, especially with milder winters.
Increases in temperature has also favoured some species that are the vector for disease. The biting midge Culicoides imicola is typically a southern European species but it has been extending its range north in recent years and as a result it has contributed to the spread of bluetongue virus in UK livestock. Climate change will increase the risk of other diseases and pathogens expanding their range into the UK.
3 An infectious agent such as a virus, bacterium, fungus or micro-organism that can cause disease or impact upon species health.
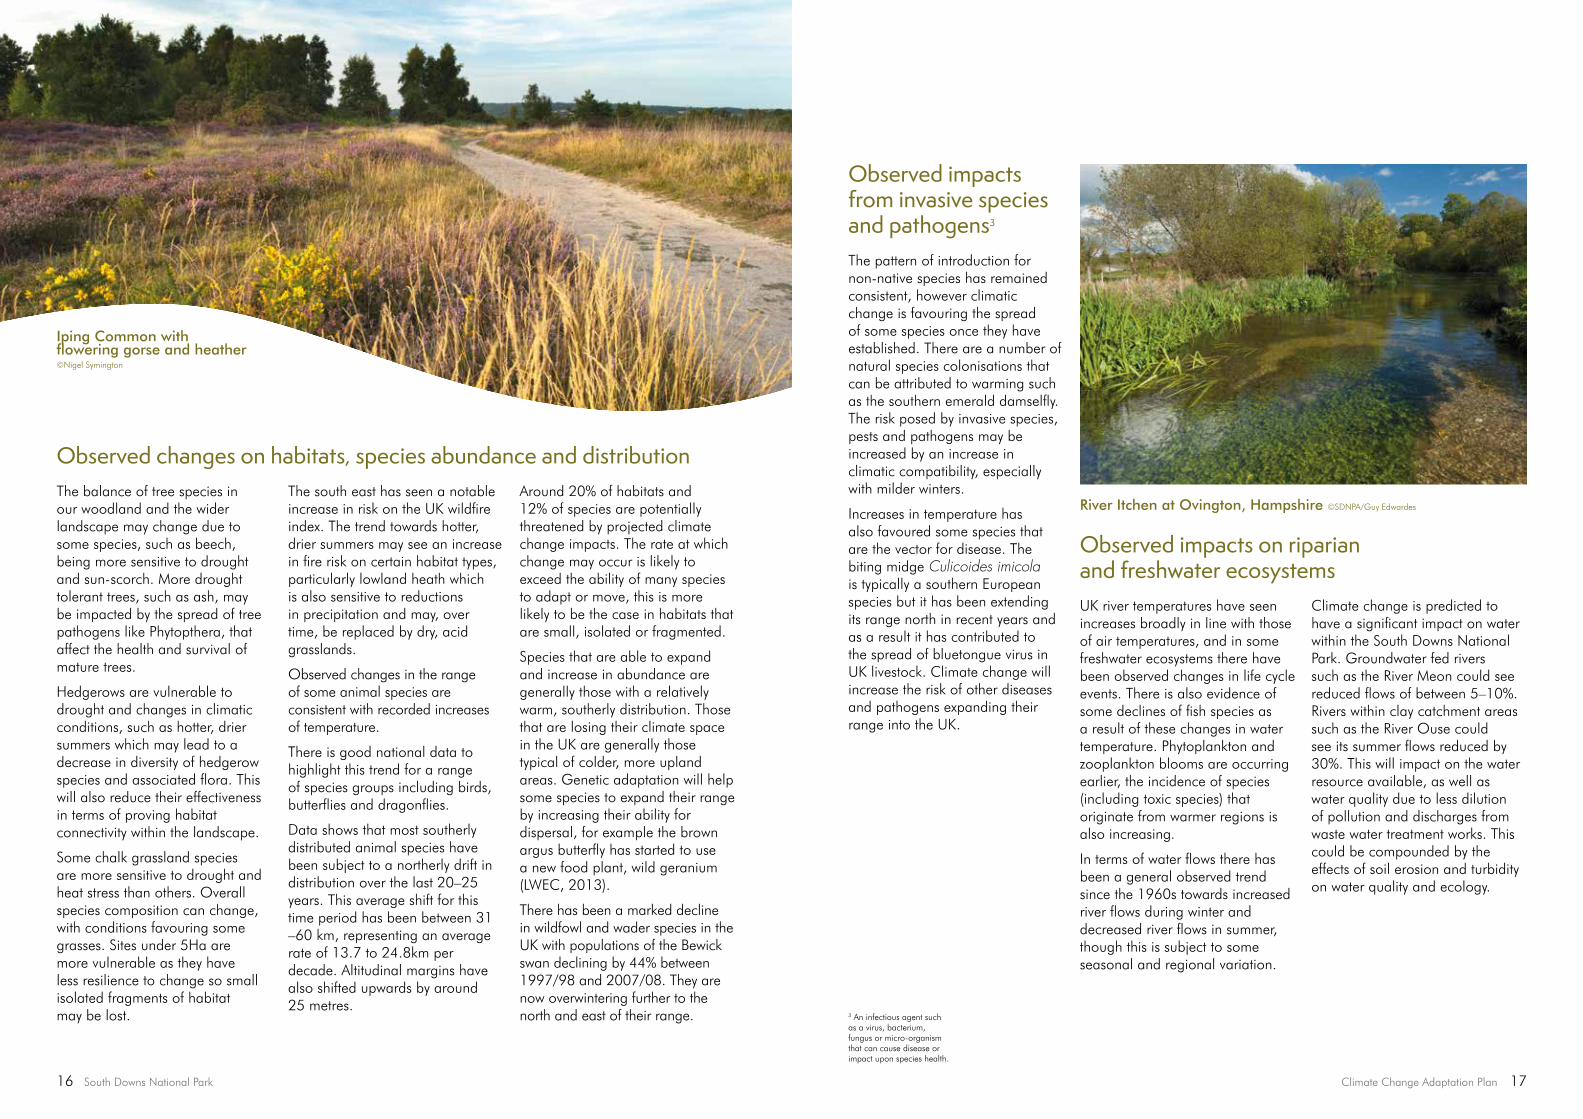
Observed impacts on riparian and freshwater ecosystemsUK river temperatures have seen increases broadly in line with those of air temperatures, and in some freshwater ecosystems there have been observed changes in life cycle events. There is also evidence of some declines of fish species as a result of these changes in water temperature. Phytoplankton and zooplankton blooms are occurring earlier, the incidence of species (including toxic species) that originate from warmer regions is also increasing.
In terms of water flows there has been a general observed trend since the 1960s towards increased river flows during winter and decreased river flows in summer, though this is subject to some seasonal and regional variation.
Climate change is predicted to have a significant impact on water within the South Downs National Park. Groundwater fed rivers such as the River Meon could see reduced flows of between 5–10%. Rivers within clay catchment areas such as the River Ouse could see its summer flows reduced by 30%. This will impact on the water resource available, as well as water quality due to less dilution of pollution and discharges from waste water treatment works. This could be compounded by the effects of soil erosion and turbidity on water quality and ecology.
River Itchen at Ovington, Hampshire ©SDNPA/Guy Edwardes
Observed changes on habitats, species abundance and distributionThe balance of tree species in our woodland and the wider landscape may change due to some species, such as beech, being more sensitive to drought and sun-scorch. More drought tolerant trees, such as ash, may be impacted by the spread of tree pathogens like Phytopthera, that affect the health and survival of mature trees.
Hedgerows are vulnerable to drought and changes in climatic conditions, such as hotter, drier summers which may lead to a decrease in diversity of hedgerow species and associated flora. This will also reduce their effectiveness in terms of proving habitat connectivity within the landscape.
Some chalk grassland species are more sensitive to drought and heat stress than others. Overall species composition can change, with conditions favouring some grasses. Sites under 5Ha are more vulnerable as they have less resilience to change so small isolated fragments of habitat may be lost.
The south east has seen a notable increase in risk on the UK wildfire index. The trend towards hotter, drier summers may see an increase in fire risk on certain habitat types, particularly lowland heath which is also sensitive to reductions in precipitation and may, over time, be replaced by dry, acid grasslands.
Observed changes in the range of some animal species are consistent with recorded increases of temperature.
There is good national data to highlight this trend for a range of species groups including birds, butterflies and dragonflies.
Data shows that most southerly distributed animal species have been subject to a northerly drift in distribution over the last 20–25 years. This average shift for this time period has been between 31 –60 km, representing an average rate of 13.7 to 24.8km per decade. Altitudinal margins have also shifted upwards by around 25 metres.
Around 20% of habitats and 12% of species are potentially threatened by projected climate change impacts. The rate at which change may occur is likely to exceed the ability of many species to adapt or move, this is more likely to be the case in habitats that are small, isolated or fragmented.
Species that are able to expand and increase in abundance are generally those with a relatively warm, southerly distribution. Those that are losing their climate space in the UK are generally those typical of colder, more upland areas. Genetic adaptation will help some species to expand their range by increasing their ability for dispersal, for example the brown argus butterfly has started to use a new food plant, wild geranium (LWEC, 2013).
There has been a marked decline in wildfowl and wader species in the UK with populations of the Bewick swan declining by 44% between 1997/98 and 2007/08. They are now overwintering further to the north and east of their range.
Iping Common with flowering gorse and heather ©Nigel Symington
Climate Change Adaptation Plan 1918 South Downs National Park
Observed impacts upon sea levels and coastal zonesTide gauge measurements show a mean sea-level rise of around 1.7mm per year as fairly constant over the course of the 20th century. Remote sensing data from satellites have shown an increase in this rise to around 3mm per year in the last 20 years. This is not uniform and some locations, and corresponding vertical movement of land, are experiencing much greater average rises in sea level.
On the south coast the observed sea level rise between 1970 and 2000 has been around 50mm and now averages around 3mm per year. If this trend continues, combined with an increase in seasonal storm events, the effectiveness of coastal defences may be reduced. This will increase the risk of coastal flooding, and the sea level rise may also affect the natural functioning of tidal rivers and estuaries.
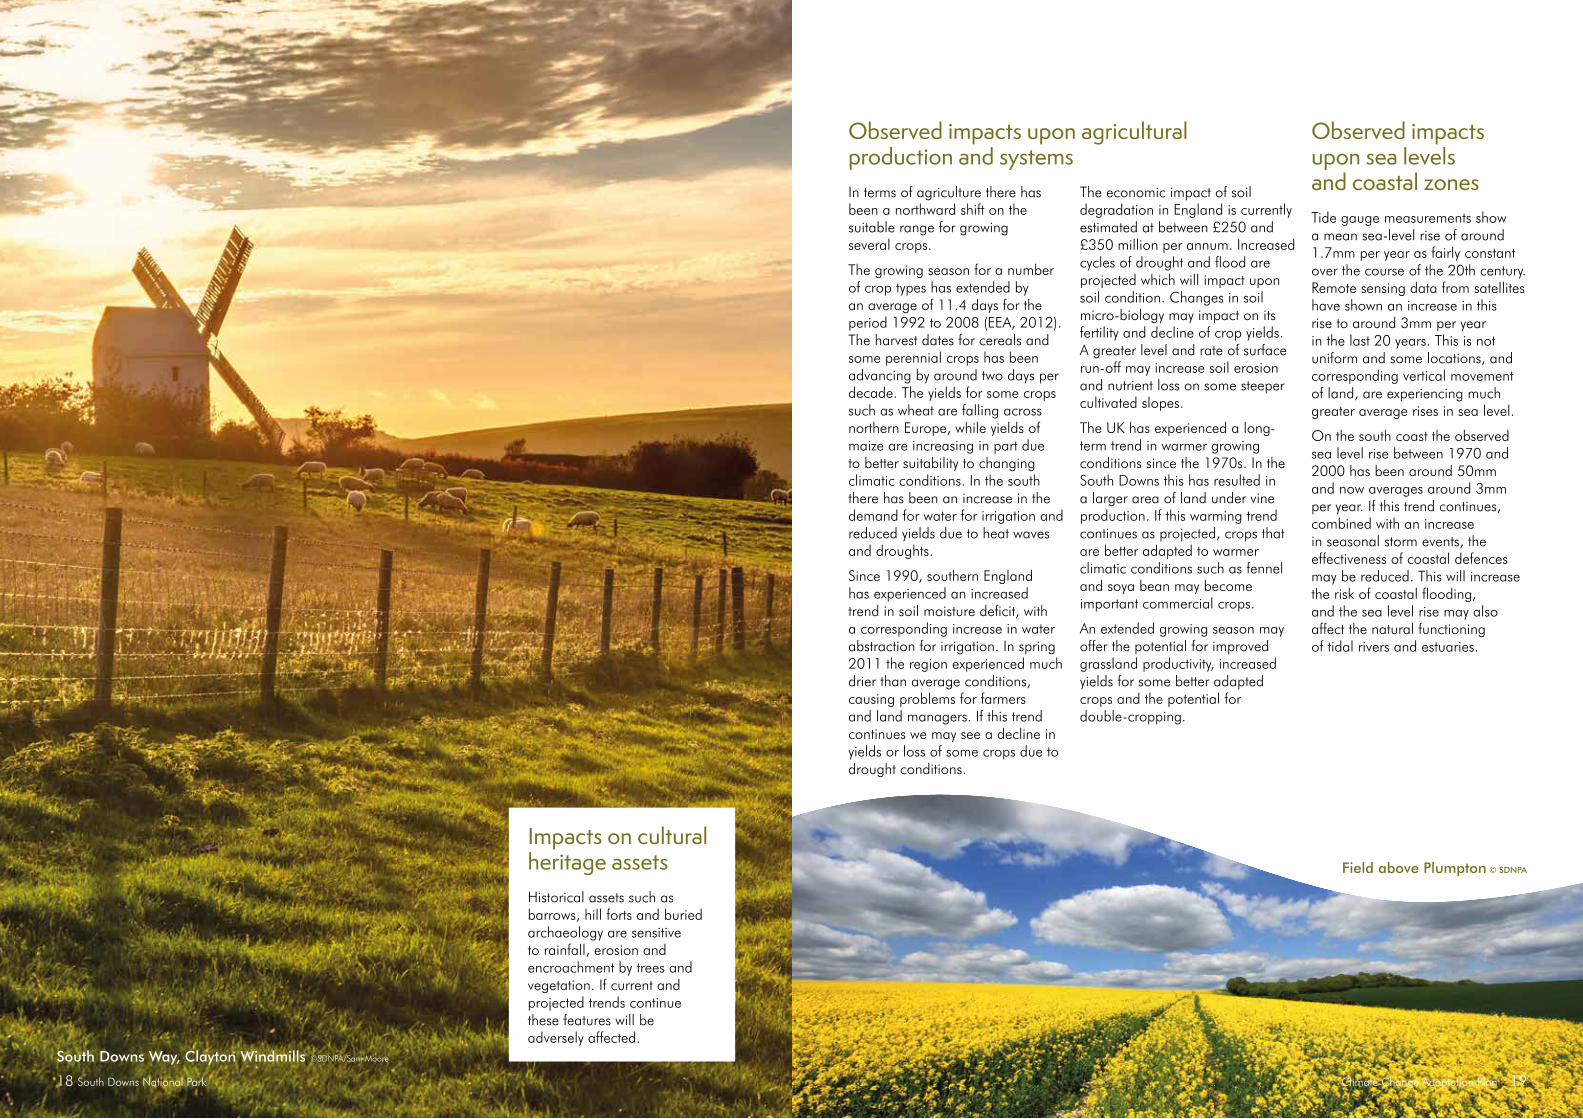
Observed impacts upon agricultural production and systemsIn terms of agriculture there has been a northward shift on the suitable range for growing several crops.
The growing season for a number of crop types has extended by an average of 11.4 days for the period 1992 to 2008 (EEA, 2012). The harvest dates for cereals and some perennial crops has been advancing by around two days per decade. The yields for some crops such as wheat are falling across northern Europe, while yields of maize are increasing in part due to better suitability to changing climatic conditions. In the south there has been an increase in the demand for water for irrigation and reduced yields due to heat waves and droughts.
Since 1990, southern England has experienced an increased trend in soil moisture deficit, with a corresponding increase in water abstraction for irrigation. In spring 2011 the region experienced much drier than average conditions, causing problems for farmers and land managers. If this trend continues we may see a decline in yields or loss of some crops due to drought conditions.
The economic impact of soil degradation in England is currently estimated at between £250 and £350 million per annum. Increased cycles of drought and flood are projected which will impact upon soil condition. Changes in soil micro-biology may impact on its fertility and decline of crop yields. A greater level and rate of surface run-off may increase soil erosion and nutrient loss on some steeper cultivated slopes.
The UK has experienced a long-term trend in warmer growing conditions since the 1970s. In the South Downs this has resulted in a larger area of land under vine production. If this warming trend continues as projected, crops that are better adapted to warmer climatic conditions such as fennel and soya bean may become important commercial crops.
An extended growing season may offer the potential for improved grassland productivity, increased yields for some better adapted crops and the potential for double-cropping.
Field above Plumpton © SDNPA
Impacts on cultural heritage assetsHistorical assets such as barrows, hill forts and buried archaeology are sensitive to rainfall, erosion and encroachment by trees and vegetation. If current and projected trends continue these features will be adversely affected.
South Downs Way, Clayton Windmills ©SDNPA/Sam Moore
20 South Downs National Park Climate Change Adaptation Plan 21
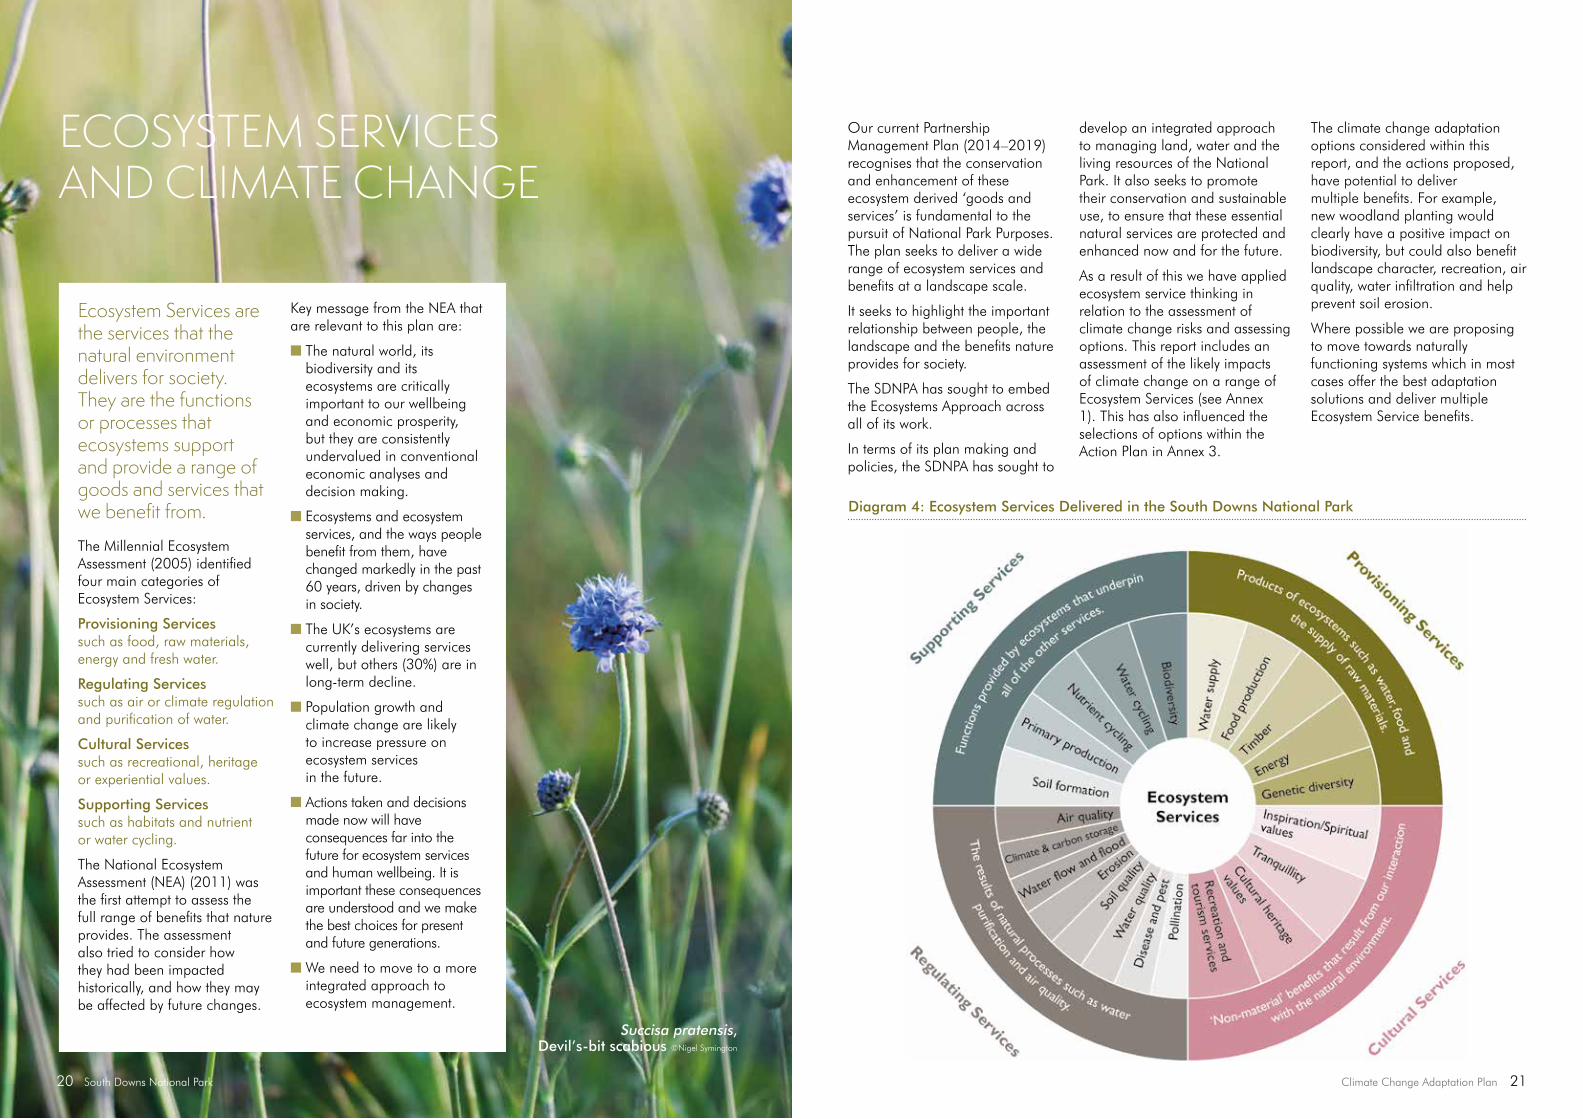
Diagram 4: Ecosystem Services Delivered in the South Downs National Park
Our current Partnership Management Plan (2014–2019) recognises that the conservation and enhancement of these ecosystem derived ‘goods and services’ is fundamental to the pursuit of National Park Purposes. The plan seeks to deliver a wide range of ecosystem services and benefits at a landscape scale.
It seeks to highlight the important relationship between people, the landscape and the benefits nature provides for society.
The SDNPA has sought to embed the Ecosystems Approach across all of its work.
In terms of its plan making and policies, the SDNPA has sought to
develop an integrated approach to managing land, water and the living resources of the National Park. It also seeks to promote their conservation and sustainable use, to ensure that these essential natural services are protected and enhanced now and for the future.
As a result of this we have applied ecosystem service thinking in relation to the assessment of climate change risks and assessing options. This report includes an assessment of the likely impacts of climate change on a range of Ecosystem Services (see Annex 1). This has also influenced the selections of options within the Action Plan in Annex 3.
The climate change adaptation options considered within this report, and the actions proposed, have potential to deliver multiple benefits. For example, new woodland planting would clearly have a positive impact on biodiversity, but could also benefit landscape character, recreation, air quality, water infiltration and help prevent soil erosion.
Where possible we are proposing to move towards naturally functioning systems which in most cases offer the best adaptation solutions and deliver multiple Ecosystem Service benefits.
ECOSYSTEM SERVICES AND CLIMATE CHANGE
Succisa pratensis, Devil’s-bit scabious ©Nigel Symington
Ecosystem Services are the services that the natural environment delivers for society. They are the functions or processes that ecosystems support and provide a range of goods and services that we benefit from.
The Millennial Ecosystem Assessment (2005) identified four main categories of Ecosystem Services:
Provisioning Services such as food, raw materials, energy and fresh water.
Regulating Services such as air or climate regulation and purification of water.
Cultural Services such as recreational, heritage or experiential values.
Supporting Services such as habitats and nutrient or water cycling.
The National Ecosystem Assessment (NEA) (2011) was the first attempt to assess the full range of benefits that nature provides. The assessment also tried to consider how they had been impacted historically, and how they may be affected by future changes.
Key message from the NEA that are relevant to this plan are:
n The natural world, its biodiversity and its ecosystems are critically important to our wellbeing and economic prosperity, but they are consistently undervalued in conventional economic analyses and decision making.
n Ecosystems and ecosystem services, and the ways people benefit from them, have changed markedly in the past 60 years, driven by changes in society.
n The UK’s ecosystems are currently delivering services well, but others (30%) are in long-term decline.
n Population growth and climate change are likely to increase pressure on ecosystem services in the future.
n Actions taken and decisions made now will have consequences far into the future for ecosystem services and human wellbeing. It is important these consequences are understood and we make the best choices for present and future generations.
n We need to move to a more integrated approach to ecosystem management.
22 South Downs National Park Climate Change Adaptation Plan 23
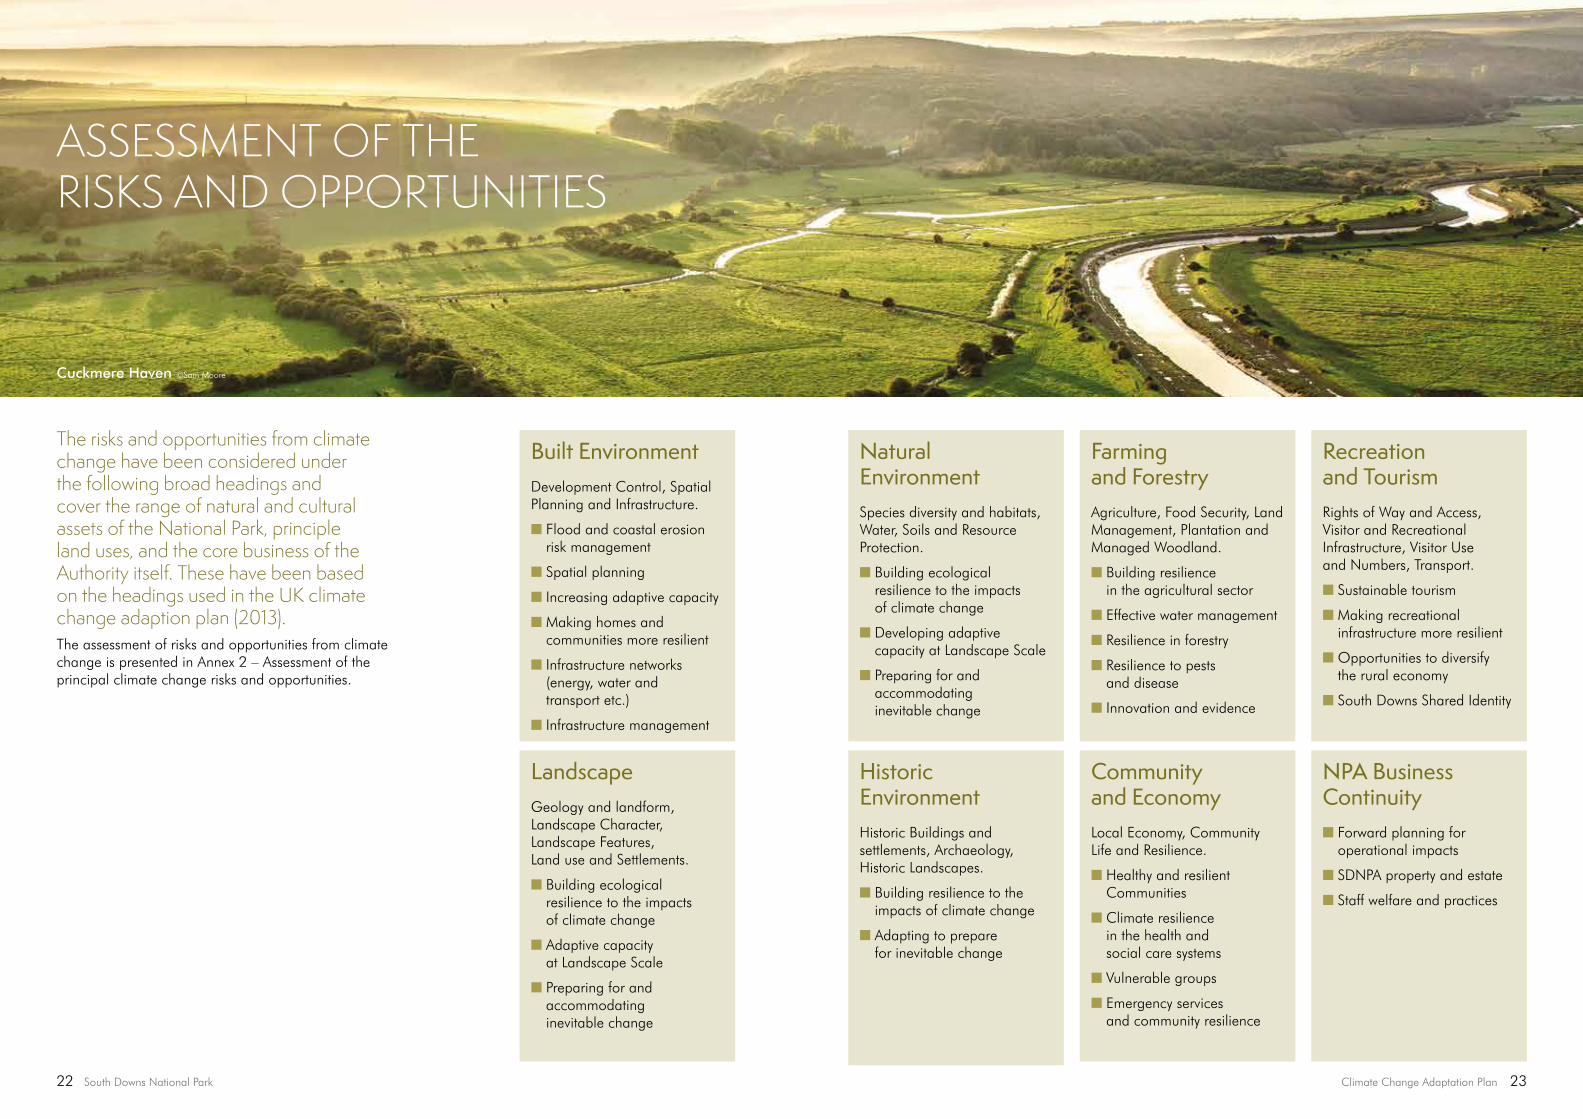
Historic EnvironmentHistoric Buildings and settlements, Archaeology, Historic Landscapes.
n Building resilience to the impacts of climate change
n Adapting to prepare for inevitable change
The risks and opportunities from climate change have been considered under the following broad headings and cover the range of natural and cultural assets of the National Park, principle land uses, and the core business of the Authority itself. These have been based on the headings used in the UK climate change adaption plan (2013).The assessment of risks and opportunities from climate change is presented in Annex 2 – Assessment of the principal climate change risks and opportunities.
Recreation and TourismRights of Way and Access, Visitor and Recreational Infrastructure, Visitor Use and Numbers, Transport.
n Sustainable tourism
n Making recreational infrastructure more resilient
n Opportunities to diversify the rural economy
n South Downs Shared Identity
Farming and ForestryAgriculture, Food Security, Land Management, Plantation and Managed Woodland.
n Building resilience in the agricultural sector
n Effective water management
n Resilience in forestry
n Resilience to pests and disease
n Innovation and evidence
Natural EnvironmentSpecies diversity and habitats, Water, Soils and Resource Protection.
n Building ecological resilience to the impacts of climate change
n Developing adaptive capacity at Landscape Scale
n Preparing for and accommodating inevitable change
NPA Business Continuityn Forward planning for
operational impacts
n SDNPA property and estate
n Staff welfare and practices
Community and EconomyLocal Economy, Community Life and Resilience.
n Healthy and resilient Communities
n Climate resilience in the health and social care systems
n Vulnerable groups
n Emergency services and community resilience
ASSESSMENT OF THE RISKS AND OPPORTUNITIES
Built EnvironmentDevelopment Control, Spatial Planning and Infrastructure.
n Flood and coastal erosion risk management
n Spatial planning
n Increasing adaptive capacity
n Making homes and communities more resilient
n Infrastructure networks (energy, water and transport etc.)
n Infrastructure management
LandscapeGeology and landform, Landscape Character, Landscape Features, Land use and Settlements.
n Building ecological resilience to the impacts of climate change
n Adaptive capacity at Landscape Scale
n Preparing for and accommodating inevitable change
Cuckmere Haven ©Sam Moore
Climate Change Adaptation Plan 2524 South Downs National Park
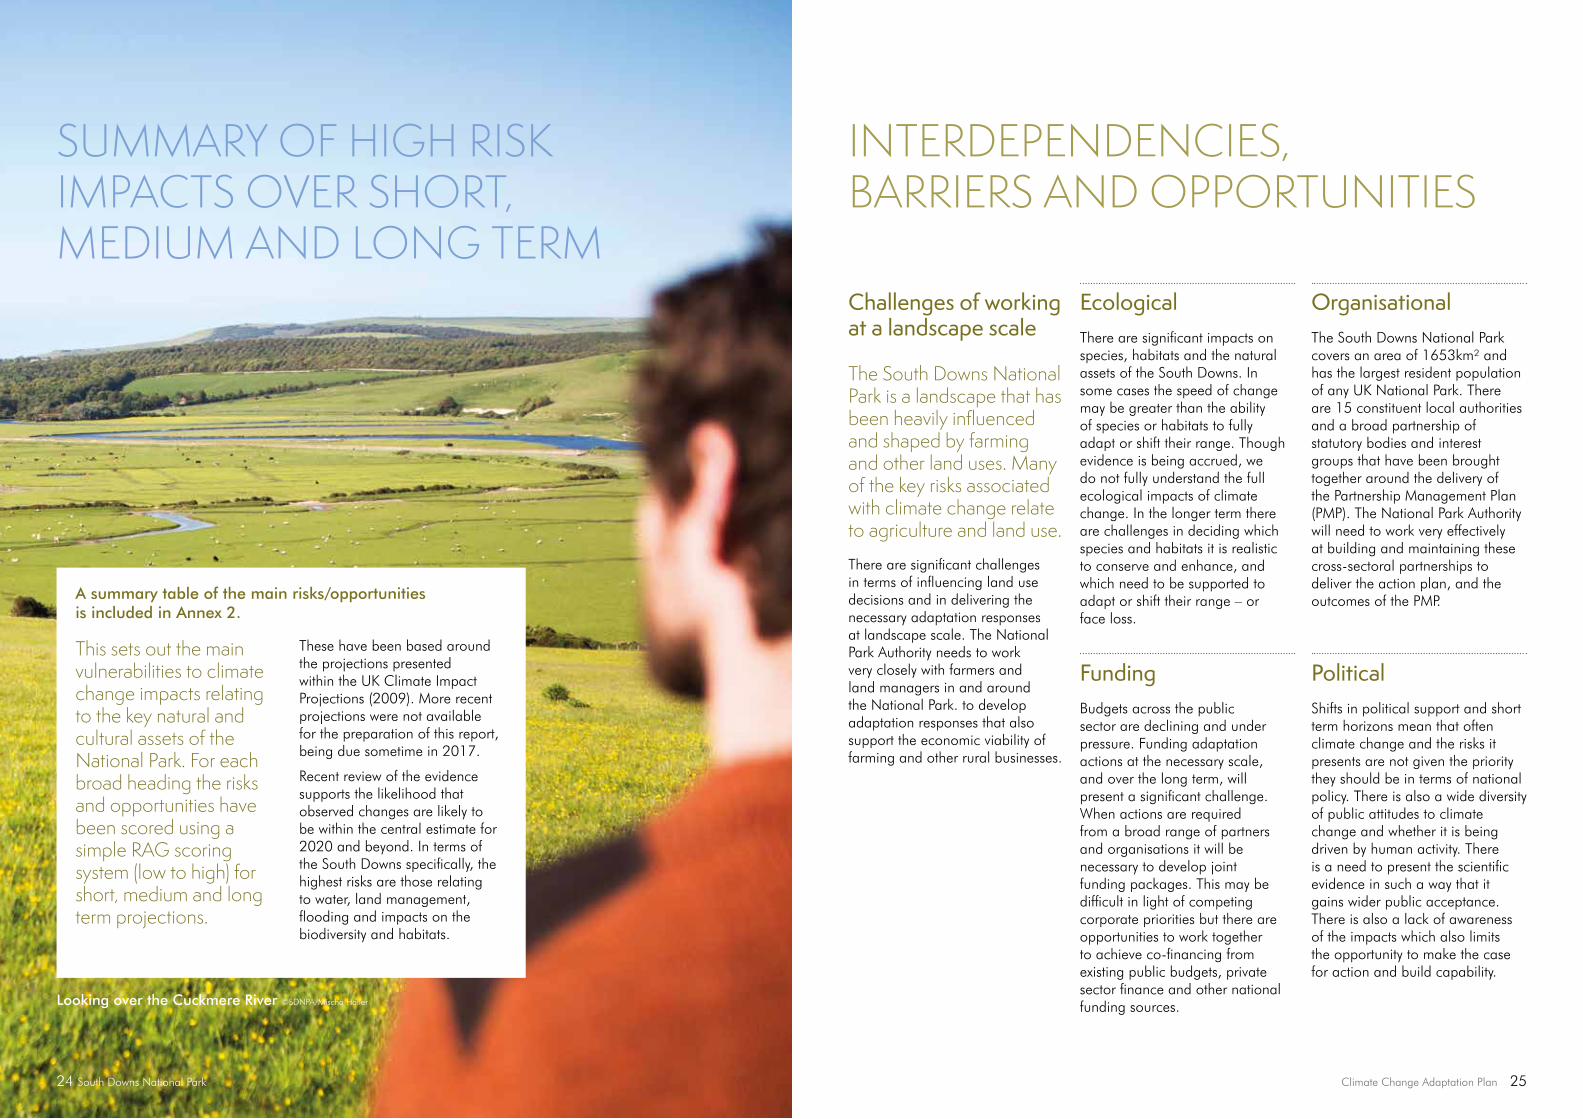
A summary table of the main risks/opportunities is included in Annex 2.
This sets out the main vulnerabilities to climate change impacts relating to the key natural and cultural assets of the National Park. For each broad heading the risks and opportunities have been scored using a simple RAG scoring system (low to high) for short, medium and long term projections.
These have been based around the projections presented within the UK Climate Impact Projections (2009). More recent projections were not available for the preparation of this report, being due sometime in 2017.
Recent review of the evidence supports the likelihood that observed changes are likely to be within the central estimate for 2020 and beyond. In terms of the South Downs specifically, the highest risks are those relating to water, land management, flooding and impacts on the biodiversity and habitats.
SUMMARY OF HIGH RISK IMPACTS OVER SHORT, MEDIUM AND LONG TERM
Challenges of working at a landscape scale
The South Downs National Park is a landscape that has been heavily influenced and shaped by farming and other land uses. Many of the key risks associated with climate change relate to agriculture and land use.
There are significant challenges in terms of influencing land use decisions and in delivering the necessary adaptation responses at landscape scale. The National Park Authority needs to work very closely with farmers and land managers in and around the National Park. to develop adaptation responses that also support the economic viability of farming and other rural businesses.
OrganisationalThe South Downs National Park covers an area of 1653km² and has the largest resident population of any UK National Park. There are 15 constituent local authorities and a broad partnership of statutory bodies and interest groups that have been brought together around the delivery of the Partnership Management Plan (PMP). The National Park Authority will need to work very effectively at building and maintaining these cross-sectoral partnerships to deliver the action plan, and the outcomes of the PMP.
PoliticalShifts in political support and short term horizons mean that often climate change and the risks it presents are not given the priority they should be in terms of national policy. There is also a wide diversity of public attitudes to climate change and whether it is being driven by human activity. There is a need to present the scientific evidence in such a way that it gains wider public acceptance. There is also a lack of awareness of the impacts which also limits the opportunity to make the case for action and build capability.
EcologicalThere are significant impacts on species, habitats and the natural assets of the South Downs. In some cases the speed of change may be greater than the ability of species or habitats to fully adapt or shift their range. Though evidence is being accrued, we do not fully understand the full ecological impacts of climate change. In the longer term there are challenges in deciding which species and habitats it is realistic to conserve and enhance, and which need to be supported to adapt or shift their range – or face loss.
Funding Budgets across the public sector are declining and under pressure. Funding adaptation actions at the necessary scale, and over the long term, will present a significant challenge. When actions are required from a broad range of partners and organisations it will be necessary to develop joint funding packages. This may be difficult in light of competing corporate priorities but there are opportunities to work together to achieve co-financing from existing public budgets, private sector finance and other national funding sources.
INTERDEPENDENCIES, BARRIERS AND OPPORTUNITIES
Looking over the Cuckmere River ©SDNPA/Mischa Haller

26 South Downs National Park Climate Change Adaptation Plan 27
The action plan that appears in Annex 3 is based upon the best current evidence – both observed and projected – and aims to set a long-term horizon for planned actions. Many of the risks and opportunities identified through this adaptation report require actions over the medium to long term (up to 2030 and beyond).
This is well beyond the current Partnership Management Plan (PMP) cycle, and through to the end of the expected lifecycle of the current Local Plan document. In many cases these actions will need to be carried forward into subsequent Management Plan and Corporate Plan cycles.
In the short term the risk assessment and action plan will help to inform the review and set priorities for the next PMP (post 2019). The action plan will also inform the development of the next 5 Year Corporate Plan (2016–2021) for impacts that relate to business continuity, property and estate or staff welfare for the National Park Authority specifically.
Looking ahead, the risk assessment and action plan will also need to be kept under review as climate change impacts that have been considered may occur over a shorter timescale than originally projected.
Over the longer term other risks may materialise that were not considered or planned for. It is considered sensible to review this in tandem with the PMP cycle so that planned adaptation responses can be built into our delivery framework.
In terms of delivering climate change adaptation at a truly landscape scale, we will also need to look beyond our boundary. The South Downs National Park Authority will look to work collaboratively with the other Protected Landscapes and adjoining Areas of Outstanding Natural Beauty. This will help to develop a strategic approach and deliver adaptation responses across organisational, sectoral and geographic boundaries. By using the collective power of the protected landscapes, and their statutory Management Plans as a delivery mechanism, we can face up to the challenges and opportunities that climate change presents.
NEXT STEPS: IMPLEMENTING & REVIEWING THE ACTION PLAN
St Catherine’s Hill, nr. Winchester and Cheriton ©Sam Moore
Define planning purpose and scope
Assess climate impact and vulnerabilities
Review goals, objectives and
strategies
Identify possible adaptation options
Evaluate and select adaptation options
Implement actions and monitor results
Diagram 5: Climate-smart planning cycle
Review vulnerabilities
Review goals, objectives and
strategies
Climate-Smart Conservation: Putting Adaptation Principles into Practice (National Wildlife Federation, 2014).
28 South Downs National Park Climate Change Adaptation Plan: Annex 1 29
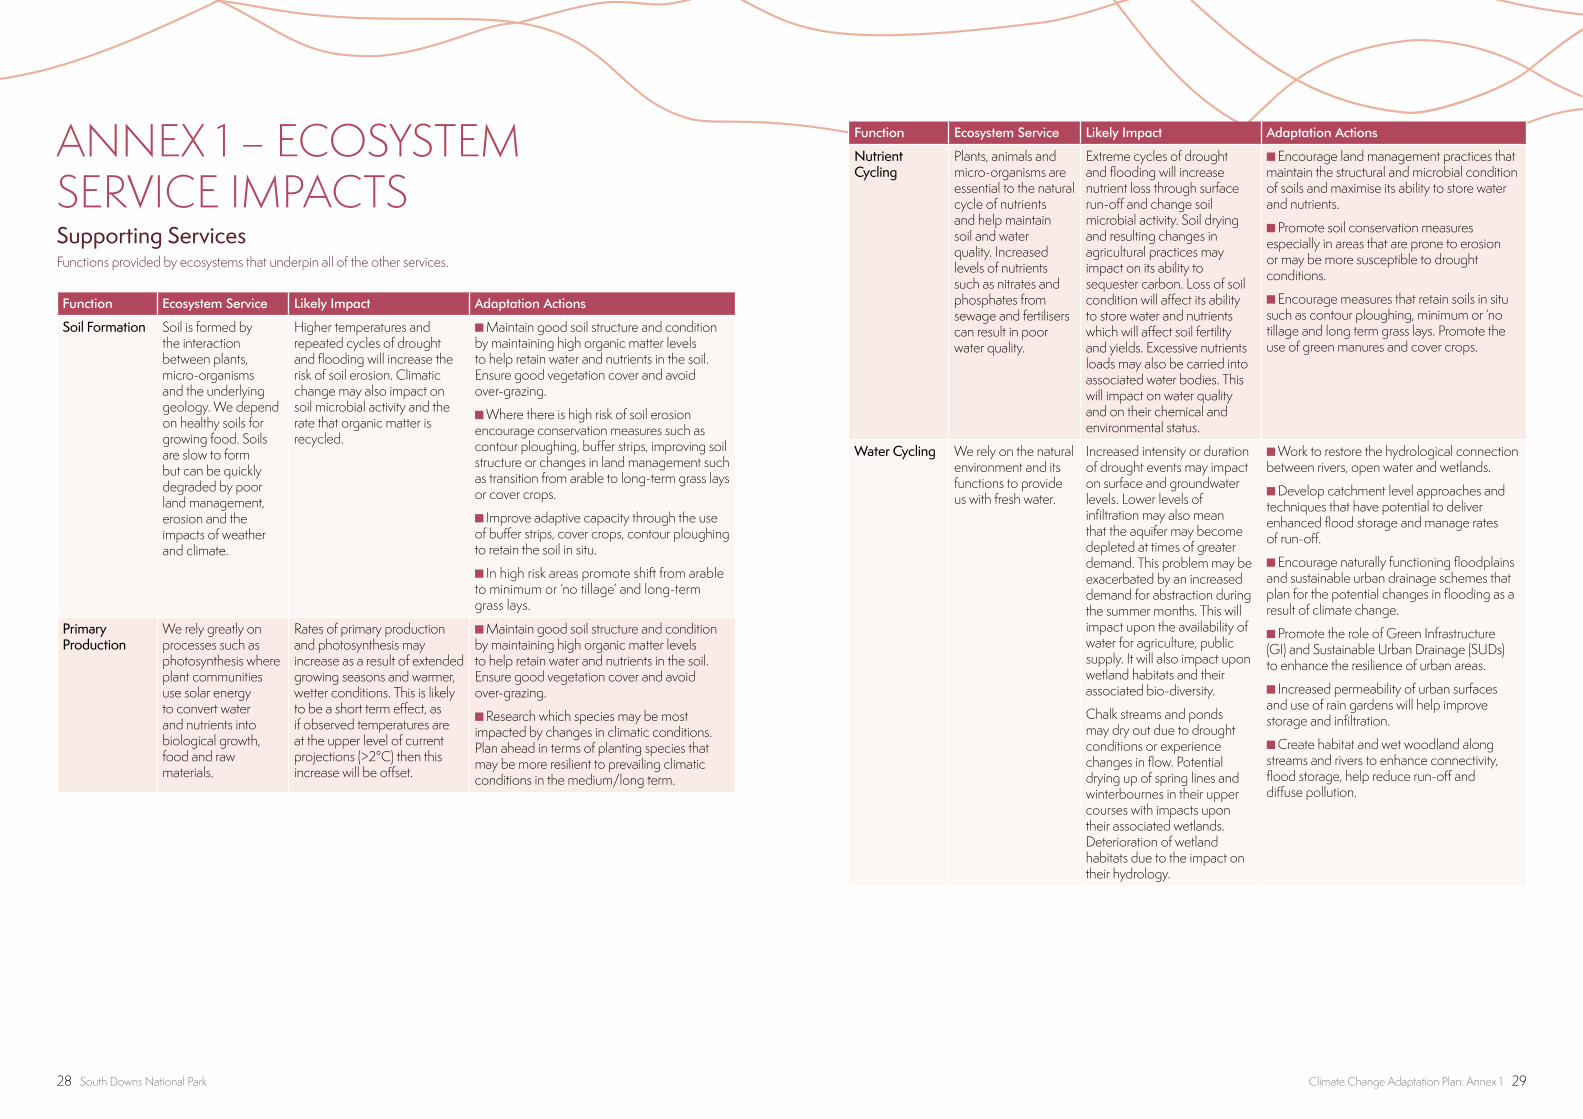
ANNEX 1 – ECOSYSTEM SERVICE IMPACTS
Function Ecosystem Service Likely Impact Adaptation Actions
Soil Formation Soil is formed by the interaction between plants, micro-organisms and the underlying geology. We depend on healthy soils for growing food. Soils are slow to form but can be quickly degraded by poor land management, erosion and the impacts of weather and climate.
Higher temperatures and repeated cycles of drought and flooding will increase the risk of soil erosion. Climatic change may also impact on soil microbial activity and the rate that organic matter is recycled.
n Maintain good soil structure and condition by maintaining high organic matter levels to help retain water and nutrients in the soil. Ensure good vegetation cover and avoid over-grazing.
n Where there is high risk of soil erosion encourage conservation measures such as contour ploughing, buffer strips, improving soil structure or changes in land management such as transition from arable to long-term grass lays or cover crops.
n Improve adaptive capacity through the use of buffer strips, cover crops, contour ploughing to retain the soil in situ.
n In high risk areas promote shift from arable to minimum or ‘no tillage’ and long-term grass lays.
Primary Production
We rely greatly on processes such as photosynthesis where plant communities use solar energy to convert water and nutrients into biological growth, food and raw materials.
Rates of primary production and photosynthesis may increase as a result of extended growing seasons and warmer, wetter conditions. This is likely to be a short term effect, as if observed temperatures are at the upper level of current projections (>2°C) then this increase will be offset.
n Maintain good soil structure and condition by maintaining high organic matter levels to help retain water and nutrients in the soil. Ensure good vegetation cover and avoid over-grazing.
n Research which species may be most impacted by changes in climatic conditions. Plan ahead in terms of planting species that may be more resilient to prevailing climatic conditions in the medium/long term.
Function Ecosystem Service Likely Impact Adaptation Actions
Nutrient Cycling
Plants, animals and micro-organisms are essential to the natural cycle of nutrients and help maintain soil and water quality. Increased levels of nutrients such as nitrates and phosphates from sewage and fertilisers can result in poor water quality.
Extreme cycles of drought and flooding will increase nutrient loss through surface run-off and change soil microbial activity. Soil drying and resulting changes in agricultural practices may impact on its ability to sequester carbon. Loss of soil condition will affect its ability to store water and nutrients which will affect soil fertility and yields. Excessive nutrients loads may also be carried into associated water bodies. This will impact on water quality and on their chemical and environmental status.
n Encourage land management practices that maintain the structural and microbial condition of soils and maximise its ability to store water and nutrients.
n Promote soil conservation measures especially in areas that are prone to erosion or may be more susceptible to drought conditions.
n Encourage measures that retain soils in situ such as contour ploughing, minimum or ‘no tillage and long term grass lays. Promote the use of green manures and cover crops.
Water Cycling We rely on the natural environment and its functions to provide us with fresh water.
Increased intensity or duration of drought events may impact on surface and groundwater levels. Lower levels of infiltration may also mean that the aquifer may become depleted at times of greater demand. This problem may be exacerbated by an increased demand for abstraction during the summer months. This will impact upon the availability of water for agriculture, public supply. It will also impact upon wetland habitats and their associated bio-diversity.
Chalk streams and ponds may dry out due to drought conditions or experience changes in flow. Potential drying up of spring lines and winterbournes in their upper courses with impacts upon their associated wetlands. Deterioration of wetland habitats due to the impact on their hydrology.
n Work to restore the hydrological connection between rivers, open water and wetlands.
n Develop catchment level approaches and techniques that have potential to deliver enhanced flood storage and manage rates of run-off.
n Encourage naturally functioning floodplains and sustainable urban drainage schemes that plan for the potential changes in flooding as a result of climate change.
n Promote the role of Green Infrastructure (GI) and Sustainable Urban Drainage (SUDs) to enhance the resilience of urban areas.
n Increased permeability of urban surfaces and use of rain gardens will help improve storage and infiltration.
n Create habitat and wet woodland along streams and rivers to enhance connectivity, flood storage, help reduce run-off and diffuse pollution.
Supporting ServicesFunctions provided by ecosystems that underpin all of the other services.
30 South Downs National Park Climate Change Adaptation Plan: Annex 1 31
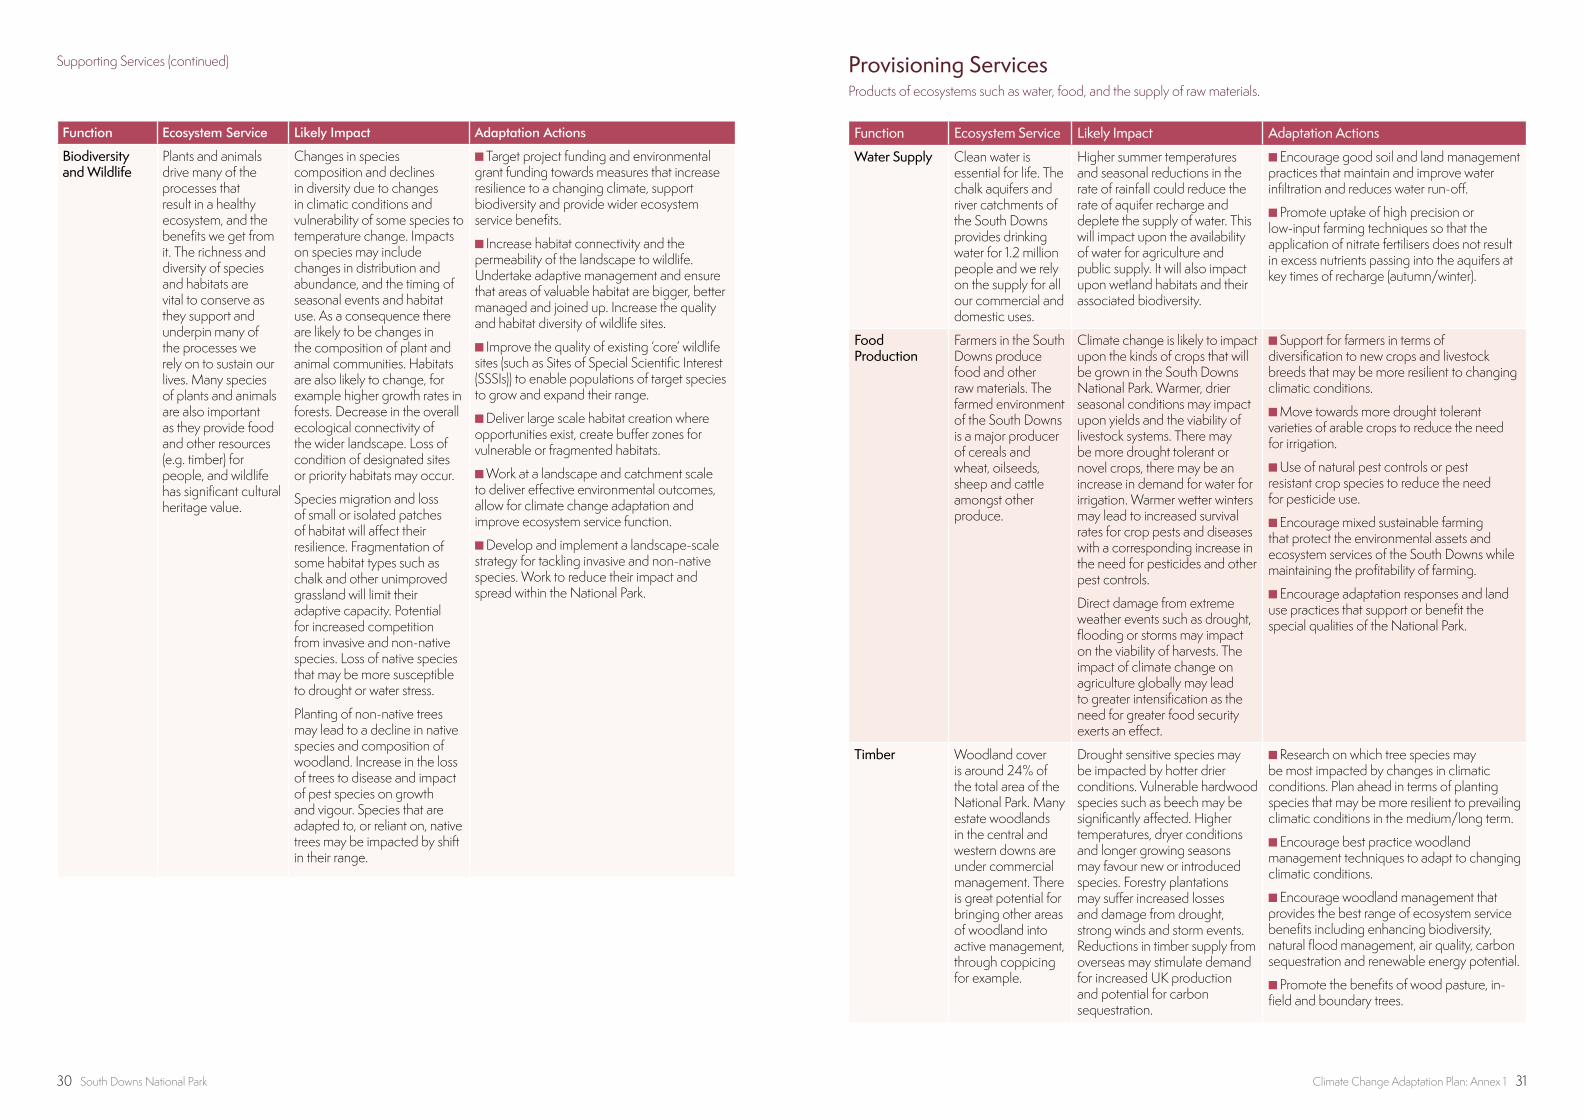
Function Ecosystem Service Likely Impact Adaptation Actions
Biodiversity and Wildlife
Plants and animals drive many of the processes that result in a healthy ecosystem, and the benefits we get from it. The richness and diversity of species and habitats are vital to conserve as they support and underpin many of the processes we rely on to sustain our lives. Many species of plants and animals are also important as they provide food and other resources (e.g. timber) for people, and wildlife has significant cultural heritage value.
Changes in species composition and declines in diversity due to changes in climatic conditions and vulnerability of some species to temperature change. Impacts on species may include changes in distribution and abundance, and the timing of seasonal events and habitat use. As a consequence there are likely to be changes in the composition of plant and animal communities. Habitats are also likely to change, for example higher growth rates in forests. Decrease in the overall ecological connectivity of the wider landscape. Loss of condition of designated sites or priority habitats may occur.
Species migration and loss of small or isolated patches of habitat will affect their resilience. Fragmentation of some habitat types such as chalk and other unimproved grassland will limit their adaptive capacity. Potential for increased competition from invasive and non-native species. Loss of native species that may be more susceptible to drought or water stress.
Planting of non-native trees may lead to a decline in native species and composition of woodland. Increase in the loss of trees to disease and impact of pest species on growth and vigour. Species that are adapted to, or reliant on, native trees may be impacted by shift in their range.
n Target project funding and environmental grant funding towards measures that increase resilience to a changing climate, support biodiversity and provide wider ecosystem service benefits.
n Increase habitat connectivity and the permeability of the landscape to wildlife. Undertake adaptive management and ensure that areas of valuable habitat are bigger, better managed and joined up. Increase the quality and habitat diversity of wildlife sites.
n Improve the quality of existing ‘core’ wildlife sites (such as Sites of Special Scientific Interest (SSSIs)) to enable populations of target species to grow and expand their range.
n Deliver large scale habitat creation where opportunities exist, create buffer zones for vulnerable or fragmented habitats.
n Work at a landscape and catchment scale to deliver effective environmental outcomes, allow for climate change adaptation and improve ecosystem service function.
n Develop and implement a landscape-scale strategy for tackling invasive and non-native species. Work to reduce their impact and spread within the National Park.
Provisioning ServicesProducts of ecosystems such as water, food, and the supply of raw materials.
Function Ecosystem Service Likely Impact Adaptation Actions
Water Supply Clean water is essential for life. The chalk aquifers and river catchments of the South Downs provides drinking water for 1.2 million people and we rely on the supply for all our commercial and domestic uses.
Higher summer temperatures and seasonal reductions in the rate of rainfall could reduce the rate of aquifer recharge and deplete the supply of water. This will impact upon the availability of water for agriculture and public supply. It will also impact upon wetland habitats and their associated biodiversity.
n Encourage good soil and land management practices that maintain and improve water infiltration and reduces water run-off.
n Promote uptake of high precision or low-input farming techniques so that the application of nitrate fertilisers does not result in excess nutrients passing into the aquifers at key times of recharge (autumn/winter).
Food Production
Farmers in the South Downs produce food and other raw materials. The farmed environment of the South Downs is a major producer of cereals and wheat, oilseeds, sheep and cattle amongst other produce.
Climate change is likely to impact upon the kinds of crops that will be grown in the South Downs National Park. Warmer, drier seasonal conditions may impact upon yields and the viability of livestock systems. There may be more drought tolerant or novel crops, there may be an increase in demand for water for irrigation. Warmer wetter winters may lead to increased survival rates for crop pests and diseases with a corresponding increase in the need for pesticides and other pest controls.
Direct damage from extreme weather events such as drought, flooding or storms may impact on the viability of harvests. The impact of climate change on agriculture globally may lead to greater intensification as the need for greater food security exerts an effect.
n Support for farmers in terms of diversification to new crops and livestock breeds that may be more resilient to changing climatic conditions.
n Move towards more drought tolerant varieties of arable crops to reduce the need for irrigation.
n Use of natural pest controls or pest resistant crop species to reduce the need for pesticide use.
n Encourage mixed sustainable farming that protect the environmental assets and ecosystem services of the South Downs while maintaining the profitability of farming.
n Encourage adaptation responses and land use practices that support or benefit the special qualities of the National Park.
Timber Woodland cover is around 24% of the total area of the National Park. Many estate woodlands in the central and western downs are under commercial management. There is great potential for bringing other areas of woodland into active management, through coppicing for example.
Drought sensitive species may be impacted by hotter drier conditions. Vulnerable hardwood species such as beech may be significantly affected. Higher temperatures, dryer conditions and longer growing seasons may favour new or introduced species. Forestry plantations may suffer increased losses and damage from drought, strong winds and storm events. Reductions in timber supply from overseas may stimulate demand for increased UK production and potential for carbon sequestration.
n Research on which tree species may be most impacted by changes in climatic conditions. Plan ahead in terms of planting species that may be more resilient to prevailing climatic conditions in the medium/long term.
n Encourage best practice woodland management techniques to adapt to changing climatic conditions.
n Encourage woodland management that provides the best range of ecosystem service benefits including enhancing biodiversity, natural flood management, air quality, carbon sequestration and renewable energy potential.
n Promote the benefits of wood pasture, in-field and boundary trees.
Supporting Services (continued)
32 South Downs National Park Climate Change Adaptation Plan: Annex 1 33
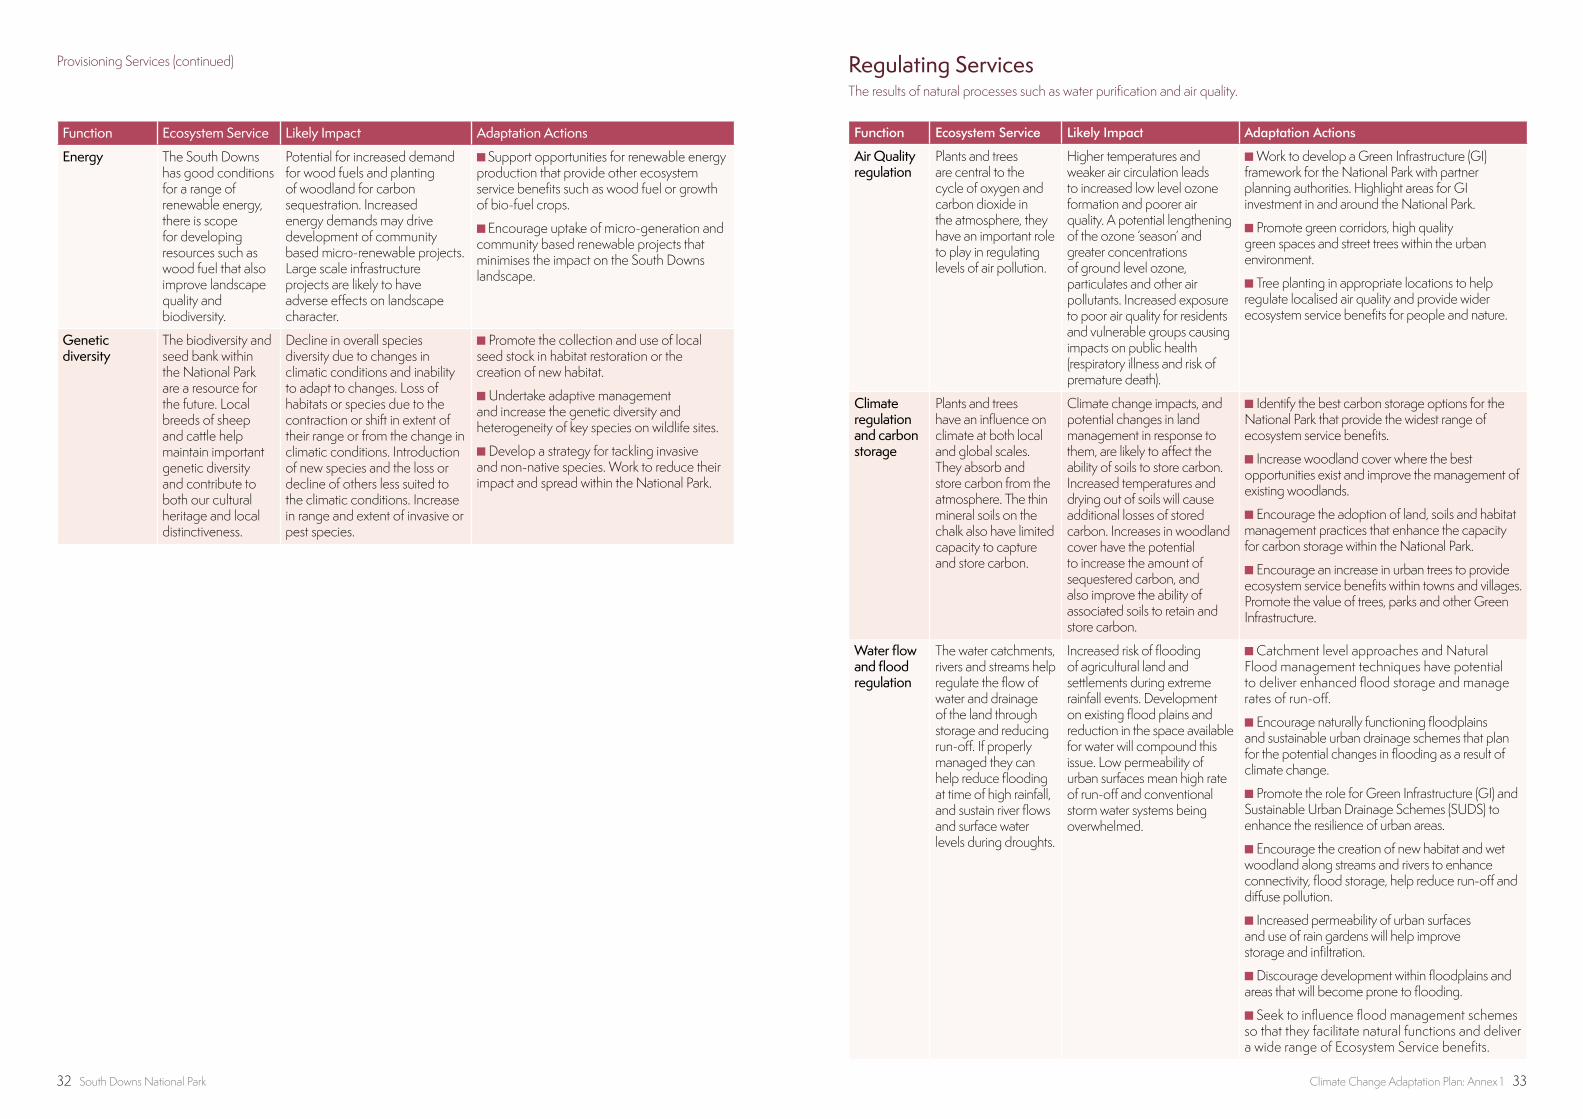
Regulating ServicesThe results of natural processes such as water purification and air quality.
Function Ecosystem Service Likely Impact Adaptation Actions
Air Quality regulation
Plants and trees are central to the cycle of oxygen and carbon dioxide in the atmosphere, they have an important role to play in regulating levels of air pollution.
Higher temperatures and weaker air circulation leads to increased low level ozone formation and poorer air quality. A potential lengthening of the ozone ‘season’ and greater concentrations of ground level ozone, particulates and other air pollutants. Increased exposure to poor air quality for residents and vulnerable groups causing impacts on public health (respiratory illness and risk of premature death).
n Work to develop a Green Infrastructure (GI) framework for the National Park with partner planning authorities. Highlight areas for GI investment in and around the National Park.
n Promote green corridors, high quality green spaces and street trees within the urban environment.
n Tree planting in appropriate locations to help regulate localised air quality and provide wider ecosystem service benefits for people and nature.
Climate regulation and carbon storage
Plants and trees have an influence on climate at both local and global scales. They absorb and store carbon from the atmosphere. The thin mineral soils on the chalk also have limited capacity to capture and store carbon.
Climate change impacts, and potential changes in land management in response to them, are likely to affect the ability of soils to store carbon. Increased temperatures and drying out of soils will cause additional losses of stored carbon. Increases in woodland cover have the potential to increase the amount of sequestered carbon, and also improve the ability of associated soils to retain and store carbon.
n Identify the best carbon storage options for the National Park that provide the widest range of ecosystem service benefits.
n Increase woodland cover where the best opportunities exist and improve the management of existing woodlands.
n Encourage the adoption of land, soils and habitat management practices that enhance the capacity for carbon storage within the National Park.
n Encourage an increase in urban trees to provide ecosystem service benefits within towns and villages. Promote the value of trees, parks and other Green Infrastructure.
Water flow and flood regulation
The water catchments, rivers and streams help regulate the flow of water and drainage of the land through storage and reducing run-off. If properly managed they can help reduce flooding at time of high rainfall, and sustain river flows and surface water levels during droughts.
Increased risk of flooding of agricultural land and settlements during extreme rainfall events. Development on existing flood plains and reduction in the space available for water will compound this issue. Low permeability of urban surfaces mean high rate of run-off and conventional storm water systems being overwhelmed.
n Catchment level approaches and Natural Flood management techniques have potential to deliver enhanced flood storage and manage rates of run-off.
n Encourage naturally functioning floodplains and sustainable urban drainage schemes that plan for the potential changes in flooding as a result of climate change.
n Promote the role for Green Infrastructure (GI) and Sustainable Urban Drainage Schemes (SUDS) to enhance the resilience of urban areas.
n Encourage the creation of new habitat and wet woodland along streams and rivers to enhance connectivity, flood storage, help reduce run-off and diffuse pollution.
n Increased permeability of urban surfaces and use of rain gardens will help improve storage and infiltration.
n Discourage development within floodplains and areas that will become prone to flooding.
n Seek to influence flood management schemes so that they facilitate natural functions and deliver a wide range of Ecosystem Service benefits.
Function Ecosystem Service Likely Impact Adaptation Actions
Energy The South Downs has good conditions for a range of renewable energy, there is scope for developing resources such as wood fuel that also improve landscape quality and biodiversity.
Potential for increased demand for wood fuels and planting of woodland for carbon sequestration. Increased energy demands may drive development of community based micro-renewable projects. Large scale infrastructure projects are likely to have adverse effects on landscape character.
n Support opportunities for renewable energy production that provide other ecosystem service benefits such as wood fuel or growth of bio-fuel crops.
n Encourage uptake of micro-generation and community based renewable projects that minimises the impact on the South Downs landscape.
Genetic diversity
The biodiversity and seed bank within the National Park are a resource for the future. Local breeds of sheep and cattle help maintain important genetic diversity and contribute to both our cultural heritage and local distinctiveness.
Decline in overall species diversity due to changes in climatic conditions and inability to adapt to changes. Loss of habitats or species due to the contraction or shift in extent of their range or from the change in climatic conditions. Introduction of new species and the loss or decline of others less suited to the climatic conditions. Increase in range and extent of invasive or pest species.
n Promote the collection and use of local seed stock in habitat restoration or the creation of new habitat.
n Undertake adaptive management and increase the genetic diversity and heterogeneity of key species on wildlife sites.
n Develop a strategy for tackling invasive and non-native species. Work to reduce their impact and spread within the National Park.
Provisioning Services (continued)
34 South Downs National Park Climate Change Adaptation Plan: Annex 1 35
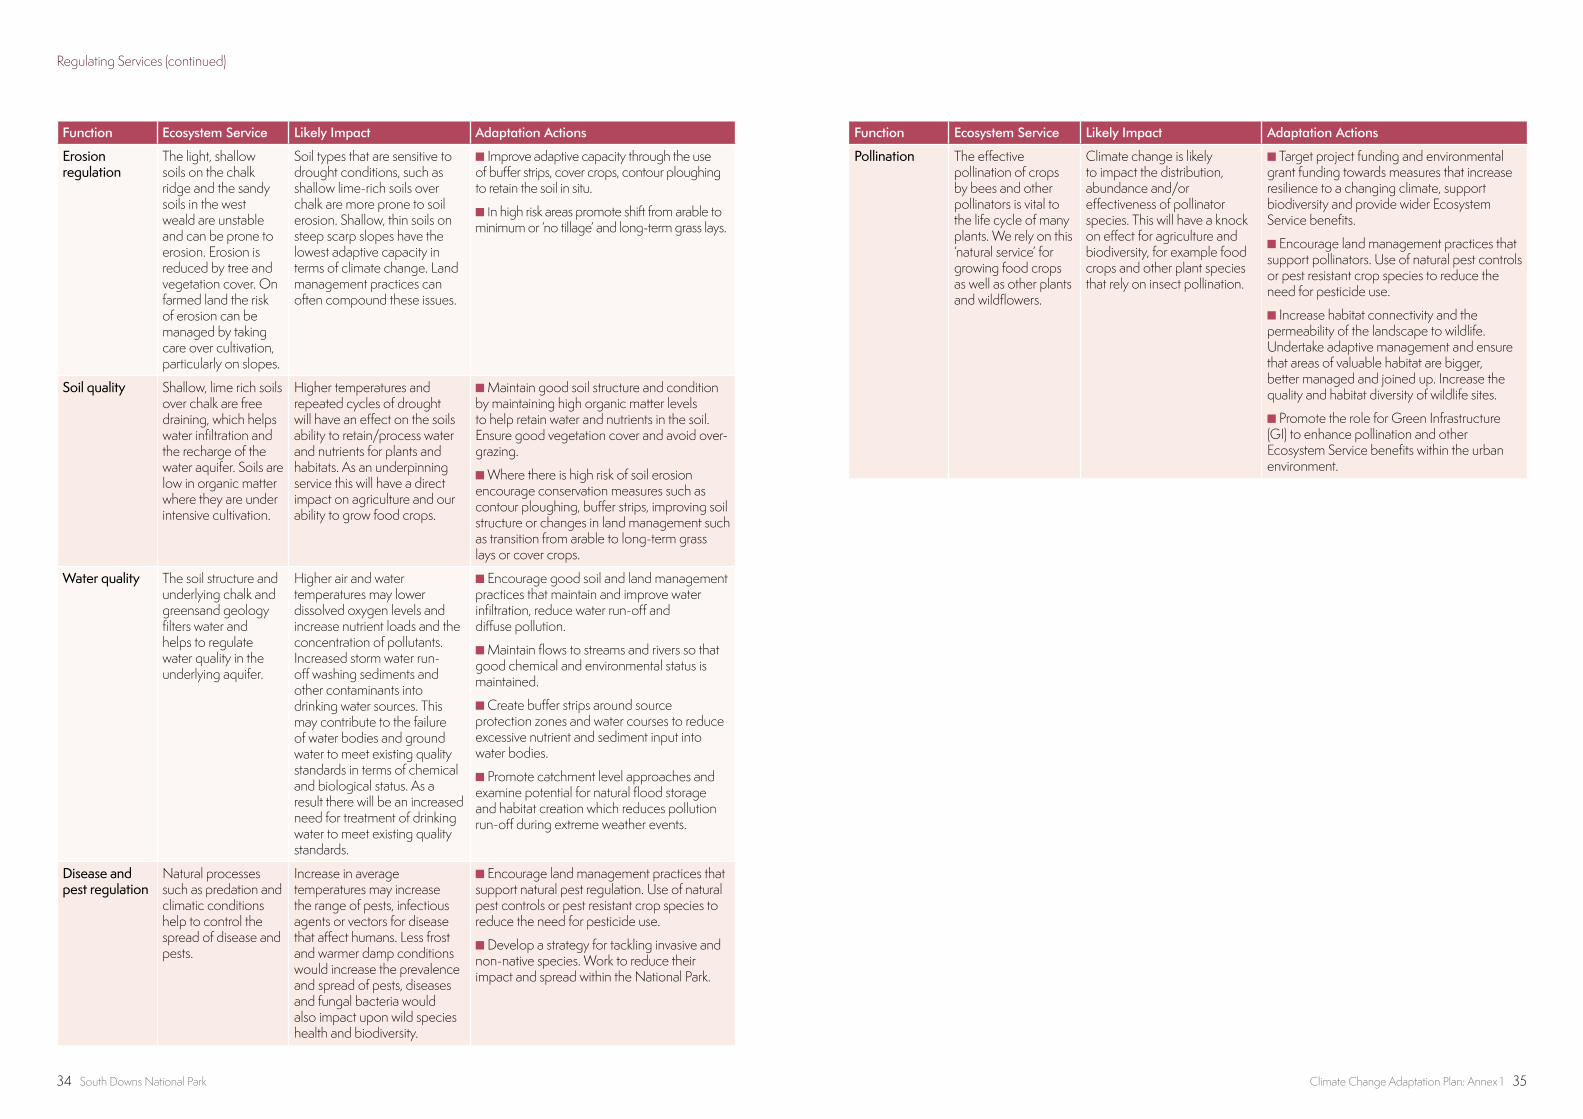
Function Ecosystem Service Likely Impact Adaptation Actions
Erosion regulation
The light, shallow soils on the chalk ridge and the sandy soils in the west weald are unstable and can be prone to erosion. Erosion is reduced by tree and vegetation cover. On farmed land the risk of erosion can be managed by taking care over cultivation, particularly on slopes.
Soil types that are sensitive to drought conditions, such as shallow lime-rich soils over chalk are more prone to soil erosion. Shallow, thin soils on steep scarp slopes have the lowest adaptive capacity in terms of climate change. Land management practices can often compound these issues.
n Improve adaptive capacity through the use of buffer strips, cover crops, contour ploughing to retain the soil in situ.
n In high risk areas promote shift from arable to minimum or ‘no tillage’ and long-term grass lays.
Soil quality Shallow, lime rich soils over chalk are free draining, which helps water infiltration and the recharge of the water aquifer. Soils are low in organic matter where they are under intensive cultivation.
Higher temperatures and repeated cycles of drought will have an effect on the soils ability to retain/process water and nutrients for plants and habitats. As an underpinning service this will have a direct impact on agriculture and our ability to grow food crops.
n Maintain good soil structure and condition by maintaining high organic matter levels to help retain water and nutrients in the soil. Ensure good vegetation cover and avoid over-grazing.
n Where there is high risk of soil erosion encourage conservation measures such as contour ploughing, buffer strips, improving soil structure or changes in land management such as transition from arable to long-term grass lays or cover crops.
Water quality The soil structure and underlying chalk and greensand geology filters water and helps to regulate water quality in the underlying aquifer.
Higher air and water temperatures may lower dissolved oxygen levels and increase nutrient loads and the concentration of pollutants. Increased storm water run-off washing sediments and other contaminants into drinking water sources. This may contribute to the failure of water bodies and ground water to meet existing quality standards in terms of chemical and biological status. As a result there will be an increased need for treatment of drinking water to meet existing quality standards.
n Encourage good soil and land management practices that maintain and improve water infiltration, reduce water run-off and diffuse pollution.
n Maintain flows to streams and rivers so that good chemical and environmental status is maintained.
n Create buffer strips around source protection zones and water courses to reduce excessive nutrient and sediment input into water bodies.
n Promote catchment level approaches and examine potential for natural flood storage and habitat creation which reduces pollution run-off during extreme weather events.
Disease and pest regulation
Natural processes such as predation and climatic conditions help to control the spread of disease and pests.
Increase in average temperatures may increase the range of pests, infectious agents or vectors for disease that affect humans. Less frost and warmer damp conditions would increase the prevalence and spread of pests, diseases and fungal bacteria would also impact upon wild species health and biodiversity.
n Encourage land management practices that support natural pest regulation. Use of natural pest controls or pest resistant crop species to reduce the need for pesticide use.
n Develop a strategy for tackling invasive and non-native species. Work to reduce their impact and spread within the National Park.
Function Ecosystem Service Likely Impact Adaptation Actions
Pollination The effective pollination of crops by bees and other pollinators is vital to the life cycle of many plants. We rely on this ‘natural service’ for growing food crops as well as other plants and wildflowers.
Climate change is likely to impact the distribution, abundance and/or effectiveness of pollinator species. This will have a knock on effect for agriculture and biodiversity, for example food crops and other plant species that rely on insect pollination.
n Target project funding and environmental grant funding towards measures that increase resilience to a changing climate, support biodiversity and provide wider Ecosystem Service benefits.
n Encourage land management practices that support pollinators. Use of natural pest controls or pest resistant crop species to reduce the need for pesticide use.
n Increase habitat connectivity and the permeability of the landscape to wildlife. Undertake adaptive management and ensure that areas of valuable habitat are bigger, better managed and joined up. Increase the quality and habitat diversity of wildlife sites.
n Promote the role for Green Infrastructure (GI) to enhance pollination and other Ecosystem Service benefits within the urban environment.
Regulating Services (continued)

36 South Downs National Park Climate Change Adaptation Plan: Annex 1 37
Cultural Services‘Non-material’ benefits that result from our interaction with the natural environment.
Function Ecosystem Service Likely Impact Adaptation Actions
Inspiration/Spiritual values
The South Downs is renowned for the beauty of its landscapes and its sense of place. They have provided inspiration for many famous artists and writers. They continue to provide people with the opportunity to understand and enjoy its special qualities. To escape, be inspired, and find spiritual renewal.
Changes in the distinctive form and landscape character over time. Changes as a result of different climatic conditions may introduce new variation in colours and textures within the landscape and affect its visual character. Potential for long-term change in the style, pattern or location of built development may alter existing settlement patterns and character. Impacts on landscape character and on iconic or distinctive views within and from the National Park. Potential effect on expansive views and open skylines from incongruous features or development.
n Take a ‘landscape led’ approach to developing the Local Plan document for the National Park area.
n Develop strong Development Management policies that seek to protect and enhance the landscape character and iconic or important views within the National Park.
n Work to influence positive impact on landscape character and ecosystem function though these assets while recognising that landscape character will still change or alter over time.
Tranquillity Tranquility is considered to be a state of calm, quietude and is associated with a feeling of peace. It relates to quality of life, and there is good scientific evidence that it also helps to promote health and well-being.
It is a perceptual quality of the landscape, and is influenced by things that people can both see and hear in the landscape around them. It is recognised as a special quality of the South Downs National Park. In a busy and pressured region it is a resource that is greatly valued by residents and visitor alike.
Pressure for development in and around the National Park may impact on areas of high tranquillity. Honeypot sites and popular visitor attractions may become increasingly crowded with a loss of amenity and tranquillity. This may lead to a decline in relative tranquillity across the National Park and a loss of experiential quality within the landscape.
n Improve data and evidence by mapping the areas that have the greatest, or least, tranquillity across the National Park. Use this data to help protect and enhance the areas of highest tranquillity.
n Develop strong Development Control policies that seek to protect relative tranquillity within the National Park. Avoid intrusive development that will impact on areas of high tranquillity.
n Work with constituent local authorities to manage and lessen the impacts of light pollution and retain areas of dark night skies. Promote their importance through the designation and promotion of the ‘Dark Night Skies’ Reserve within the National Park.
Function Ecosystem Service Likely Impact Adaptation Actions
Cultural Heritage values
There are traces of human influence and settlement in the South Downs from Mesolithic hunter gatherers and early agriculture through to modern times. This represents a huge time depth within the landscape. The National Park has a rich historic heritage in terms of its art, culture, ancient monuments and historic buildings. This has great social value, as well as an economic value.
Key historic assets may be vulnerable to damage from changes in climatic conditions or increased incidence or severity of storm events. Impact upon the integrity of buried archaeology particularly where there may be waterlogged features that are best preserved in situ. Damage to buried archaeology from waterlogging or increased soil erosion from run-off exposing sites or damaging stratigraphy, artefacts or evidence.
n Improve data and evidence on the climate change impacts upon heritage assets across the National Park. Use this data to develop solutions that enhance the resilience of historic assets and help protect them for the future.
Recreation and tourism services
Recreation and tourism is a significant feature of the area with an extensive network of access routes, popular beauty spots and visitor attractions. The area attracts 39 million recreational day visits per year and makes a significant contribution to the health and well-being of visitors and residents alike.
Rights of way and access corridors become difficult to use or impassable due to poor ground conditions or flooding. Loss of path amenity and more path maintenance required to keep them usable and clear of overgrowth. Bridges, riverside paths and other access infrastructure may be damaged or lost due to flooding or increased riverbank erosion.
n Work with partners and recreation interest groups to manage and promote recreational access and to provide a greater variety of recreational activities.
n Promote opportunities for local and small businesses and help develop a stronger local tourism economy especially in the sectors of food, drink and accommodation.
n Ensure that the potential benefits to the rural economy from increased number of domestic and UK tourists with greater viability for tourism businesses away from the core summer season.
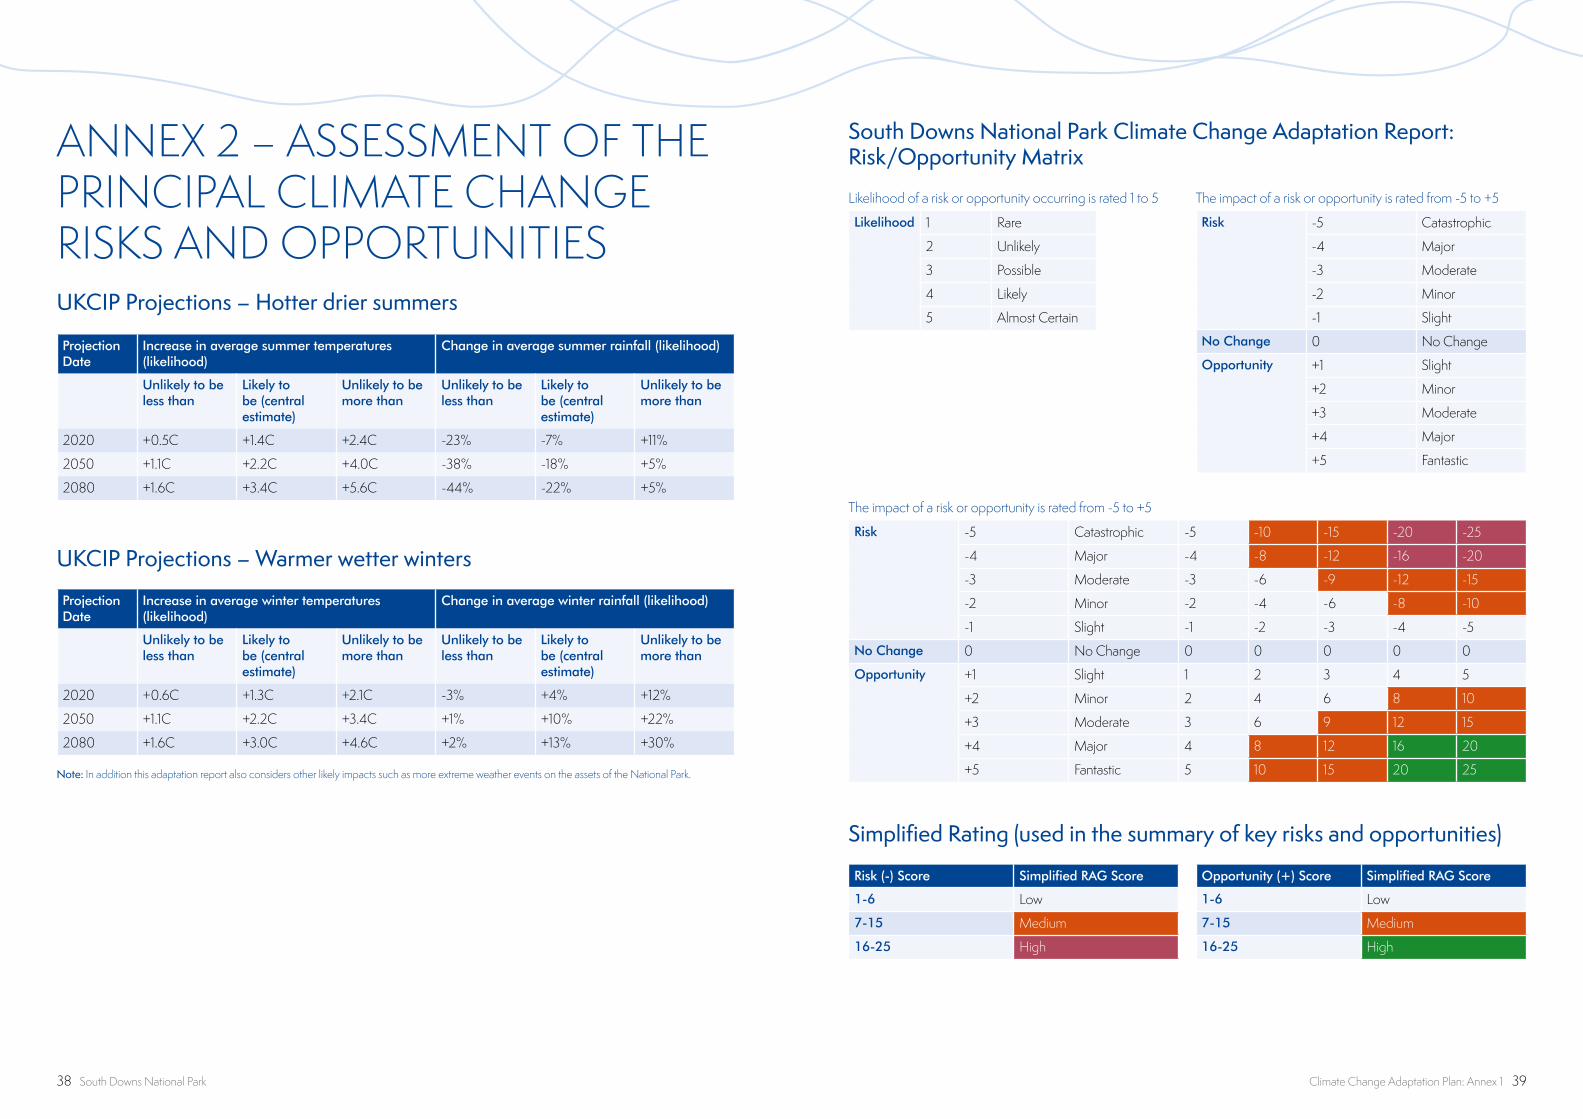
38 South Downs National Park Climate Change Adaptation Plan: Annex 1 39
ANNEX 2 – ASSESSMENT OF THE PRINCIPAL CLIMATE CHANGE RISKS AND OPPORTUNITIES
Projection Date
Increase in average summer temperatures (likelihood)
Change in average summer rainfall (likelihood)
Unlikely to be less than
Likely to be (central estimate)
Unlikely to be more than
Unlikely to be less than
Likely to be (central estimate)
Unlikely to be more than
2020 +0.5C +1.4C +2.4C -23% -7% +11%
2050 +1.1C +2.2C +4.0C -38% -18% +5%
2080 +1.6C +3.4C +5.6C -44% -22% +5%
Projection Date
Increase in average winter temperatures (likelihood)
Change in average winter rainfall (likelihood)
Unlikely to be less than
Likely to be (central estimate)
Unlikely to be more than
Unlikely to be less than
Likely to be (central estimate)
Unlikely to be more than
2020 +0.6C +1.3C +2.1C -3% +4% +12%
2050 +1.1C +2.2C +3.4C +1% +10% +22%
2080 +1.6C +3.0C +4.6C +2% +13% +30%
UKCIP Projections – Hotter drier summers
UKCIP Projections – Warmer wetter winters
Note: In addition this adaptation report also considers other likely impacts such as more extreme weather events on the assets of the National Park.
Risk -5 Catastrophic
-4 Major
-3 Moderate
-2 Minor
-1 Slight
No Change 0 No Change
Opportunity +1 Slight
+2 Minor
+3 Moderate
+4 Major
+5 Fantastic
Risk -5 Catastrophic -5 -10 -15 -20 -25
-4 Major -4 -8 -12 -16 -20
-3 Moderate -3 -6 -9 -12 -15
-2 Minor -2 -4 -6 -8 -10
-1 Slight -1 -2 -3 -4 -5
No Change 0 No Change 0 0 0 0 0
Opportunity +1 Slight 1 2 3 4 5
+2 Minor 2 4 6 8 10
+3 Moderate 3 6 9 12 15
+4 Major 4 8 12 16 20
+5 Fantastic 5 10 15 20 25
Likelihood 1 Rare
2 Unlikely
3 Possible
4 Likely
5 Almost Certain
Risk (-) Score Simplified RAG Score
1-6 Low
7-15 Medium
16-25 High
Opportunity (+) Score Simplified RAG Score
1-6 Low
7-15 Medium
16-25 High
South Downs National Park Climate Change Adaptation Report: Risk/Opportunity Matrix
Simplified Rating (used in the summary of key risks and opportunities)
The impact of a risk or opportunity is rated from -5 to +5
The impact of a risk or opportunity is rated from -5 to +5
Likelihood of a risk or opportunity occurring is rated 1 to 5
Cultural Services‘Non-material’ benefits that result from our interaction with the natural environment.
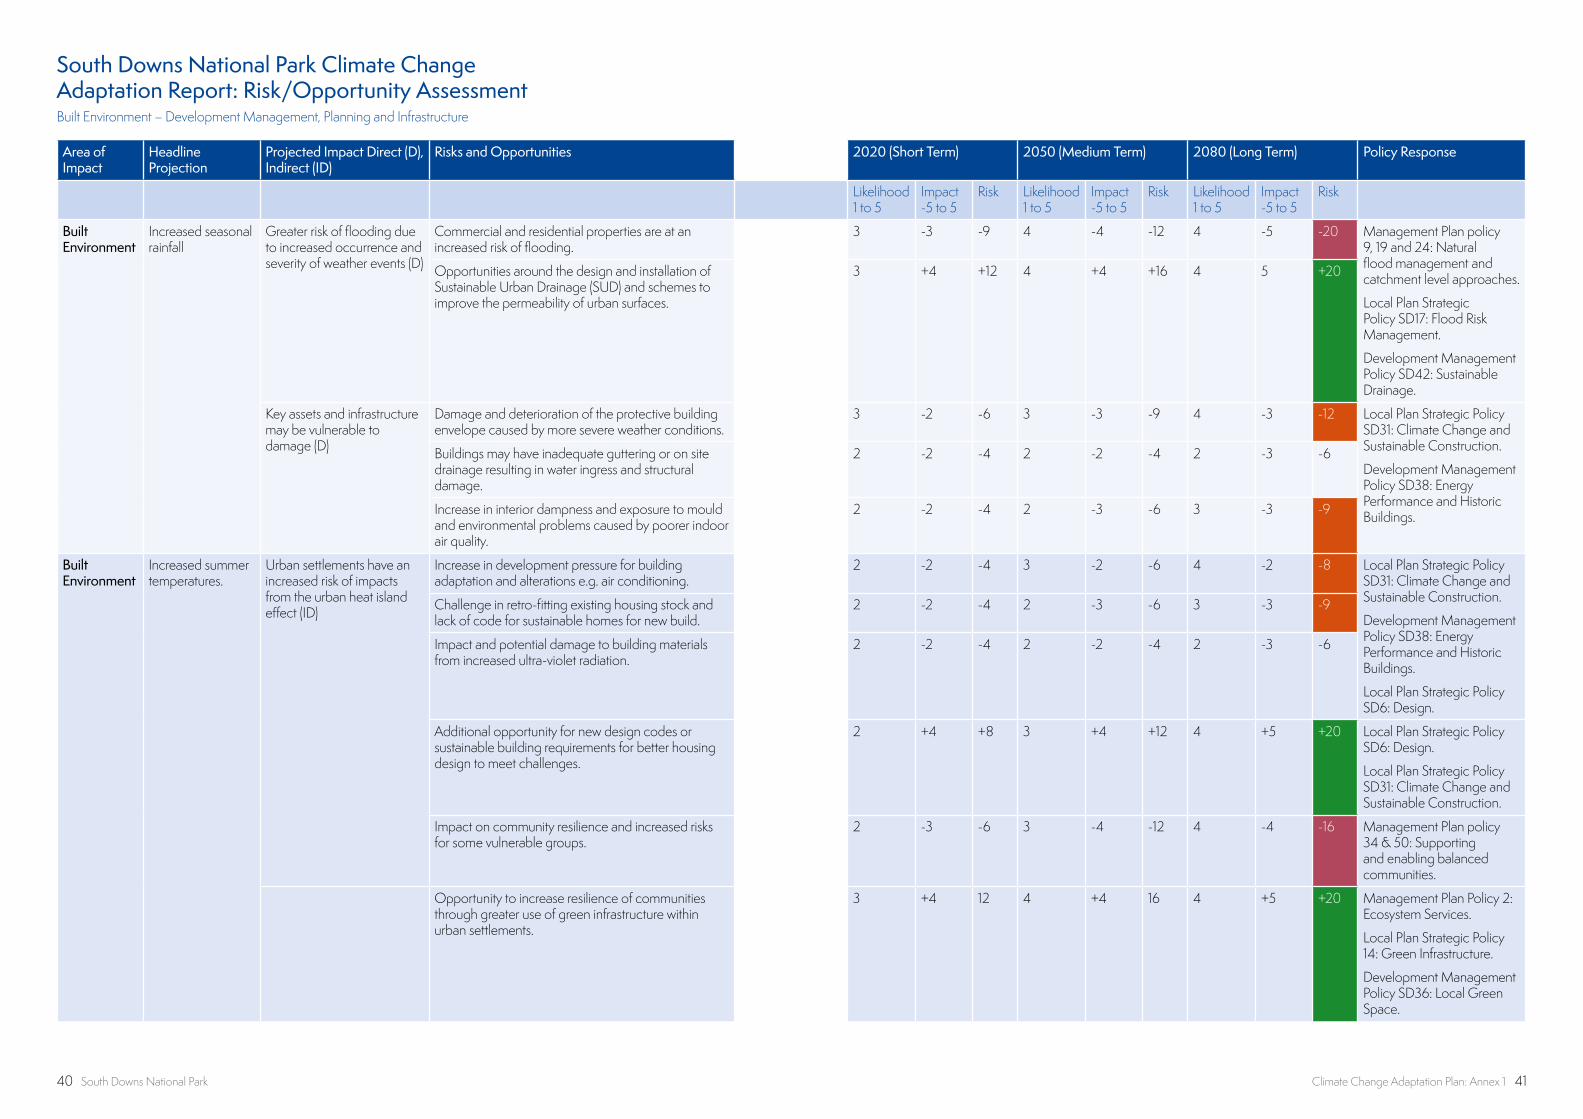
40 South Downs National Park Climate Change Adaptation Plan: Annex 1 41
Area of Impact
Headline Projection
Projected Impact Direct (D), Indirect (ID)
Risks and Opportunities 2020 (Short Term) 2050 (Medium Term) 2080 (Long Term) Policy Response
Likelihood 1 to 5
Impact -5 to 5
Risk Likelihood 1 to 5
Impact -5 to 5
Risk Likelihood 1 to 5
Impact -5 to 5
Risk
Built Environment
Increased seasonal rainfall
Greater risk of flooding due to increased occurrence and severity of weather events (D)
Commercial and residential properties are at an increased risk of flooding.
3 -3 -9 4 -4 -12 4 -5 -20 Management Plan policy 9, 19 and 24: Natural flood management and catchment level approaches.
Local Plan Strategic Policy SD17: Flood Risk Management.
Development Management Policy SD42: Sustainable Drainage.
Opportunities around the design and installation of Sustainable Urban Drainage (SUD) and schemes to improve the permeability of urban surfaces.
3 +4 +12 4 +4 +16 4 5 +20
Key assets and infrastructure may be vulnerable to damage (D)
Damage and deterioration of the protective building envelope caused by more severe weather conditions.
3 -2 -6 3 -3 -9 4 -3 -12 Local Plan Strategic Policy SD31: Climate Change and Sustainable Construction.
Development Management Policy SD38: Energy Performance and Historic Buildings.
Buildings may have inadequate guttering or on site drainage resulting in water ingress and structural damage.
2 -2 -4 2 -2 -4 2 -3 -6
Increase in interior dampness and exposure to mould and environmental problems caused by poorer indoor air quality.
2 -2 -4 2 -3 -6 3 -3 -9
Built Environment
Increased summer temperatures.
Urban settlements have an increased risk of impacts from the urban heat island effect (ID)
Increase in development pressure for building adaptation and alterations e.g. air conditioning.
2 -2 -4 3 -2 -6 4 -2 -8 Local Plan Strategic Policy SD31: Climate Change and Sustainable Construction.
Development Management Policy SD38: Energy Performance and Historic Buildings.
Local Plan Strategic Policy SD6: Design.
Challenge in retro-fitting existing housing stock and lack of code for sustainable homes for new build.
2 -2 -4 2 -3 -6 3 -3 -9
Impact and potential damage to building materials from increased ultra-violet radiation.
2 -2 -4 2 -2 -4 2 -3 -6
Additional opportunity for new design codes or sustainable building requirements for better housing design to meet challenges.
2 +4 +8 3 +4 +12 4 +5 +20 Local Plan Strategic Policy SD6: Design.
Local Plan Strategic Policy SD31: Climate Change and Sustainable Construction.
Impact on community resilience and increased risks for some vulnerable groups.
2 -3 -6 3 -4 -12 4 -4 -16 Management Plan policy 34 & 50: Supporting and enabling balanced communities.
Opportunity to increase resilience of communities through greater use of green infrastructure within urban settlements.
3 +4 12 4 +4 16 4 +5 +20 Management Plan Policy 2: Ecosystem Services.
Local Plan Strategic Policy 14: Green Infrastructure.
Development Management Policy SD36: Local Green Space.
South Downs National Park Climate Change Adaptation Report: Risk/Opportunity AssessmentBuilt Environment – Development Management, Planning and Infrastructure

42 South Downs National Park Climate Change Adaptation Plan: Annex 1 43
Area of Impact
Headline Projection
Projected Impact Direct (D), Indirect (ID)
Risks and Opportunities 2020 (Short Term) 2050 (Medium Term) 2080 (Long Term) Policy Response
Likelihood 1 to 5
Impact -5 to 5
Risk Likelihood 1 to 5
Impact -5 to 5
Risk Likelihood 1 to 5
Impact -5 to 5
Risk
Air quality impact (ID) Higher temperatures and weaker air circulation leads to increased low level ozone formation and poorer air quality.
3 -3 -9 3 -4 -12 3 -4 -16 Local Plan Strategic Policy 14: Green Infrastructure.
Management Plan Policy 2 & 4: Ecosystem Services and habitat connectivity.
Management Plan policy 38: Reduced car travel.
Development Management Policy SD58: Air Quality.
Potential lengthening of the ozone ‘season’ and concentration of ground level ozone, particulates and other air pollutants.
3 -4 -12 4 -4 -16 4 -5 -20
Increased exposure to poor air quality for residents and vulnerable groups causing impacts on public health (respiratory illness and risk of premature death).
3 -4 -12 4 -4 -16 4 -5 -20
Increased pressure on the public water supply with the projected growth in development (D)
Increase in the incidence and severity of drought conditions could lead to water shortages.
3 -3 -9 3 -4 -12 4 -4 -16 Management Plan Policies 2, 23 & 25: Ecosystem Services, promoting water efficiency and working with water companies to ensure a sustainable supply.
Local Plan Strategic Policy SD15: Aquifers.
Opportunity to influence water company’s forward plans and to actively promote sustainable patterns of water use across the sectors.
3 +3 +9 3 +4 +12 4 +4 +16
Key assets and infrastructure may be vulnerable to damage (D)
Buildings & infrastructure may be at an increased fire risk due to seasonal changes in climatic conditions.
2 -3 -6 3 -3 -9 4 -3 -12
Energy Production
Hotter drier summers
Longer hours of sunlight Increased potential for solar or PV energy production, lower reliance on the national grid.
2 +3 +6 3 +4 +12 4 +5 +20 Management Plan Policy 56: Renewable Energy.
Local Plan Strategic Policy SD31: Climate Change and sustainable construction.
Development Management Policy SD56: Renewable Energy.
Development Management Policy SD54: Supporting infrastructure development.
Higher demand for fitting solar and PV, changes in the design of buildings.
2 +3 +6 3 +3 +9 3 +4 +12
Lower summer rainfall Reduced viability of micro-hydro in some locations. 2 -2 -4 2 -3 -6 2 -3 -6
Warmer wetter winters
Higher winter rainfall Higher rainfall and head of water would increase the viability of micro-hydro in some locations.
2 +2 +4 3 +3 +9 3 +4 +12
Increase in incidence and severity of seasonal storm events
Risk of damage to local energy infrastructure.
Increased outages of local energy supplies, damage to infrastructure, power lines being bought down.
3 -2 -6 3 -3 -9 4 -3 -12
Mitigation and climate change responses
Adaptation of energy infrastructure in response to climate change, need for greater resilience to withstand changes in climatic conditions (ID)
Landscape character may be impacted by changes to the energy infrastructure and new technology to meet the needs of greater resilience e.g. large scale wind or solar farms.
3 -3 -9 4 -3 -12 4 -4 -16 Management Plan Outcome & Policy 1: Conserving and enhancing Landscape Character and resilience to climate change.
Sea Level Rise
Increase in incidence and severity of seasonal storm events
Increased risk of flooding due to sea level rise (D)
Low lying coastal areas and settlements at risk from flooding and inundation by the sea.
3 -4 -12 4 -4 -16 4 -5 -20 Local Plan Strategic Policy SD10: Open Coast and SD17: Flood risk management.
Increased risk of loss of heritage assets or archaeological sites from flooding or inundation by the sea.
3 -2 -6 3 -3 -9 4 -3 -12 Management Plan Policy 9: Protection of heritage assets.
Built environment (continued)

44 South Downs National Park Climate Change Adaptation Plan: Annex 1 45
Area of Impact
Headline Projection
Projected Impact Direct (D), Indirect (ID)
Risks and Opportunities 2020 (Short Term) 2050 (Medium Term) 2080 (Long Term) Policy Response
Likelihood 1 to 5
Impact -5 to 5
Risk Likelihood 1 to 5
Impact -5 to 5
Risk Likelihood 1 to 5
Impact -5 to 5
Risk
Reduced effectiveness of existing infrastructure or natural defences (D)
Loss of low lying land and habitat from coastal squeeze. Increased erosion and sedimentation.
4 -3 -12 4 -4 -16 4 -5 -20 Management Plan Outcome 2: Adaptive capacity in the Landscape.
Management Plan Policy 2: Ecosystem Services.
Management Plan Policy 6: Natural processes and resilience in marine habitats. Policy 7: Sustainable management of the coast.
Local Plan Strategic Policy SD10: Open Coast and SD17: Flood risk management.
Enhanced or heavily engineered coastal flood defences could further impair natural functioning systems and cause knock on problems in other areas of coastline.
3 -4 -12 4 -4 -16 4 -5 -20
Inundation and flooding from more frequent storms and sea level rise may damage or disrupt water and waste management systems.
3 -4 -12 4 -4 -16 4 -5 -20
Opportunity for coastal re-alignment schemes and ‘making space for water’ to re-establish more natural functioning systems and to create new habitat.
3 +4 +12 4 +4 +16 4 +5 +20
Saltwater intrusion causing increased salinity of both surface and groundwater in coastal areas. (ID)
Impact upon the quality and availability of drinking water supplies in coastal areas.
3 -3 -9 3 -4 -12 3 -4 -12 Management Plan Policy 23: Sustainability of water resources.
Local Plan Strategic Policy SD15: Aquifers.
Coastal Squeeze Existing developed land becoming inundated or being lost through coastal erosion.
Pressure on the NPA to allow development on areas that are currently protected as adjoining areas are affected by sea level rise.
3 -4 -12 4 -4 -16 4 -5 -20 Management Plan Outcome 2: Adaptive capacity in the Landscape.
Management Plan Policy 6: Natural processes and resilience in marine habitats. Policy 7: Sustainable management of the coast.
Local Plan Core Policy SD1: Sustainable Development.
Local Plan Strategic Policy SD10: Open Coast and SD17: Flood risk management.
Conflict between different land uses may increase ‘less space, more pressure’
Restricted availability of land may result in greater planning or land use pressure on the National Park.
2 -4 -8 3 -4 -12 4 -4 -16
Coastal Erosion
Increase in incidence and severity of seasonal storm events
Increased erosion of chalk cliffs from increase in storm and wave impact (D)
Risk to property and farmland along the top of the chalk cliffs.
3 -2 -6 3 -3 -9 3 -4 -12 Management Plan Policy 6: Natural processes and resilience in marine habitats.
Policy 7: Sustainable management of the coast.
Loss of cliff top habitats on the undeveloped coast line. 3 -2 -6 3 -3 -9 3 -4 -12
Loss of cliff top paths and other recreational and cultural assets.
2 -3 -6 3 -3 -9 3 -4 -12
Spatial Planning
Mitigation responses to climate change
Landscape character may be impacted by new infrastructure development (ID)
Increased development of renewable energy technology and other large infrastructure projects.
2 -3 -6 3 -3 -9 3 -4 -12 Management Plan Outcome & Policy 1: Conserving and enhancing Landscape Character and resilience to climate change.Cumulative change in land
use patterns and management as a response to climate change impacts. (ID)
The undeveloped character of the South Downs, especially the open and expansive views from the chalk scarps, may be affected.
2 -4 -8 3 -4 -12 4 -4 -16
Built environment (continued)
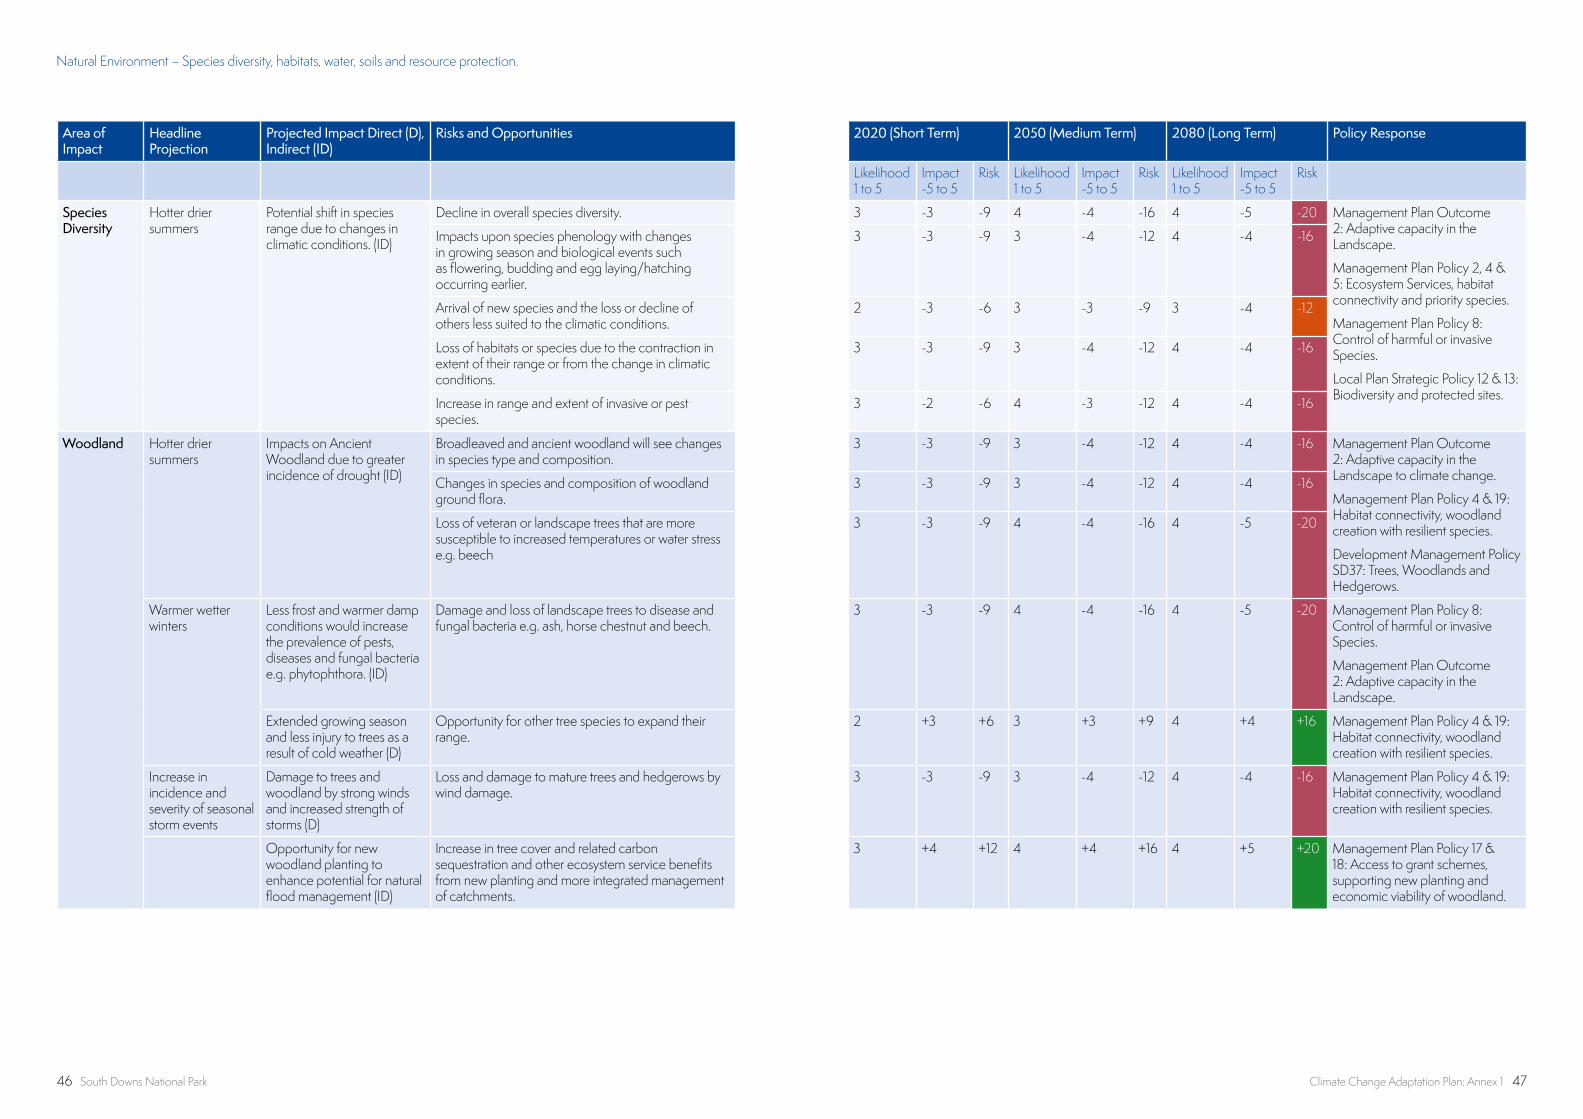
46 South Downs National Park Climate Change Adaptation Plan: Annex 1 47
Area of Impact
Headline Projection
Projected Impact Direct (D), Indirect (ID)
Risks and Opportunities 2020 (Short Term) 2050 (Medium Term) 2080 (Long Term) Policy Response
Likelihood 1 to 5
Impact -5 to 5
Risk Likelihood 1 to 5
Impact -5 to 5
Risk Likelihood 1 to 5
Impact -5 to 5
Risk
Species Diversity
Hotter drier summers
Potential shift in species range due to changes in climatic conditions. (ID)
Decline in overall species diversity. 3 -3 -9 4 -4 -16 4 -5 -20 Management Plan Outcome 2: Adaptive capacity in the Landscape.
Management Plan Policy 2, 4 & 5: Ecosystem Services, habitat connectivity and priority species.
Management Plan Policy 8: Control of harmful or invasive Species.
Local Plan Strategic Policy 12 & 13: Biodiversity and protected sites.
Impacts upon species phenology with changes in growing season and biological events such as flowering, budding and egg laying/hatching occurring earlier.
3 -3 -9 3 -4 -12 4 -4 -16
Arrival of new species and the loss or decline of others less suited to the climatic conditions.
2 -3 -6 3 -3 -9 3 -4 -12
Loss of habitats or species due to the contraction in extent of their range or from the change in climatic conditions.
3 -3 -9 3 -4 -12 4 -4 -16
Increase in range and extent of invasive or pest species.
3 -2 -6 4 -3 -12 4 -4 -16
Woodland Hotter drier summers
Impacts on Ancient Woodland due to greater incidence of drought (ID)
Broadleaved and ancient woodland will see changes in species type and composition.
3 -3 -9 3 -4 -12 4 -4 -16 Management Plan Outcome 2: Adaptive capacity in the Landscape to climate change.
Management Plan Policy 4 & 19: Habitat connectivity, woodland creation with resilient species.
Development Management Policy SD37: Trees, Woodlands and Hedgerows.
Changes in species and composition of woodland ground flora.
3 -3 -9 3 -4 -12 4 -4 -16
Loss of veteran or landscape trees that are more susceptible to increased temperatures or water stress e.g. beech
3 -3 -9 4 -4 -16 4 -5 -20
Warmer wetter winters
Less frost and warmer damp conditions would increase the prevalence of pests, diseases and fungal bacteria e.g. phytophthora. (ID)
Damage and loss of landscape trees to disease and fungal bacteria e.g. ash, horse chestnut and beech.
3 -3 -9 4 -4 -16 4 -5 -20 Management Plan Policy 8: Control of harmful or invasive Species.
Management Plan Outcome 2: Adaptive capacity in the Landscape.
Extended growing season and less injury to trees as a result of cold weather (D)
Opportunity for other tree species to expand their range.
2 +3 +6 3 +3 +9 4 +4 +16 Management Plan Policy 4 & 19: Habitat connectivity, woodland creation with resilient species.
Increase in incidence and severity of seasonal storm events
Damage to trees and woodland by strong winds and increased strength of storms (D)
Loss and damage to mature trees and hedgerows by wind damage.
3 -3 -9 3 -4 -12 4 -4 -16 Management Plan Policy 4 & 19: Habitat connectivity, woodland creation with resilient species.
Opportunity for new woodland planting to enhance potential for natural flood management (ID)
Increase in tree cover and related carbon sequestration and other ecosystem service benefits from new planting and more integrated management of catchments.
3 +4 +12 4 +4 +16 4 +5 +20 Management Plan Policy 17 & 18: Access to grant schemes, supporting new planting and economic viability of woodland.
Natural Environment – Species diversity, habitats, water, soils and resource protection.
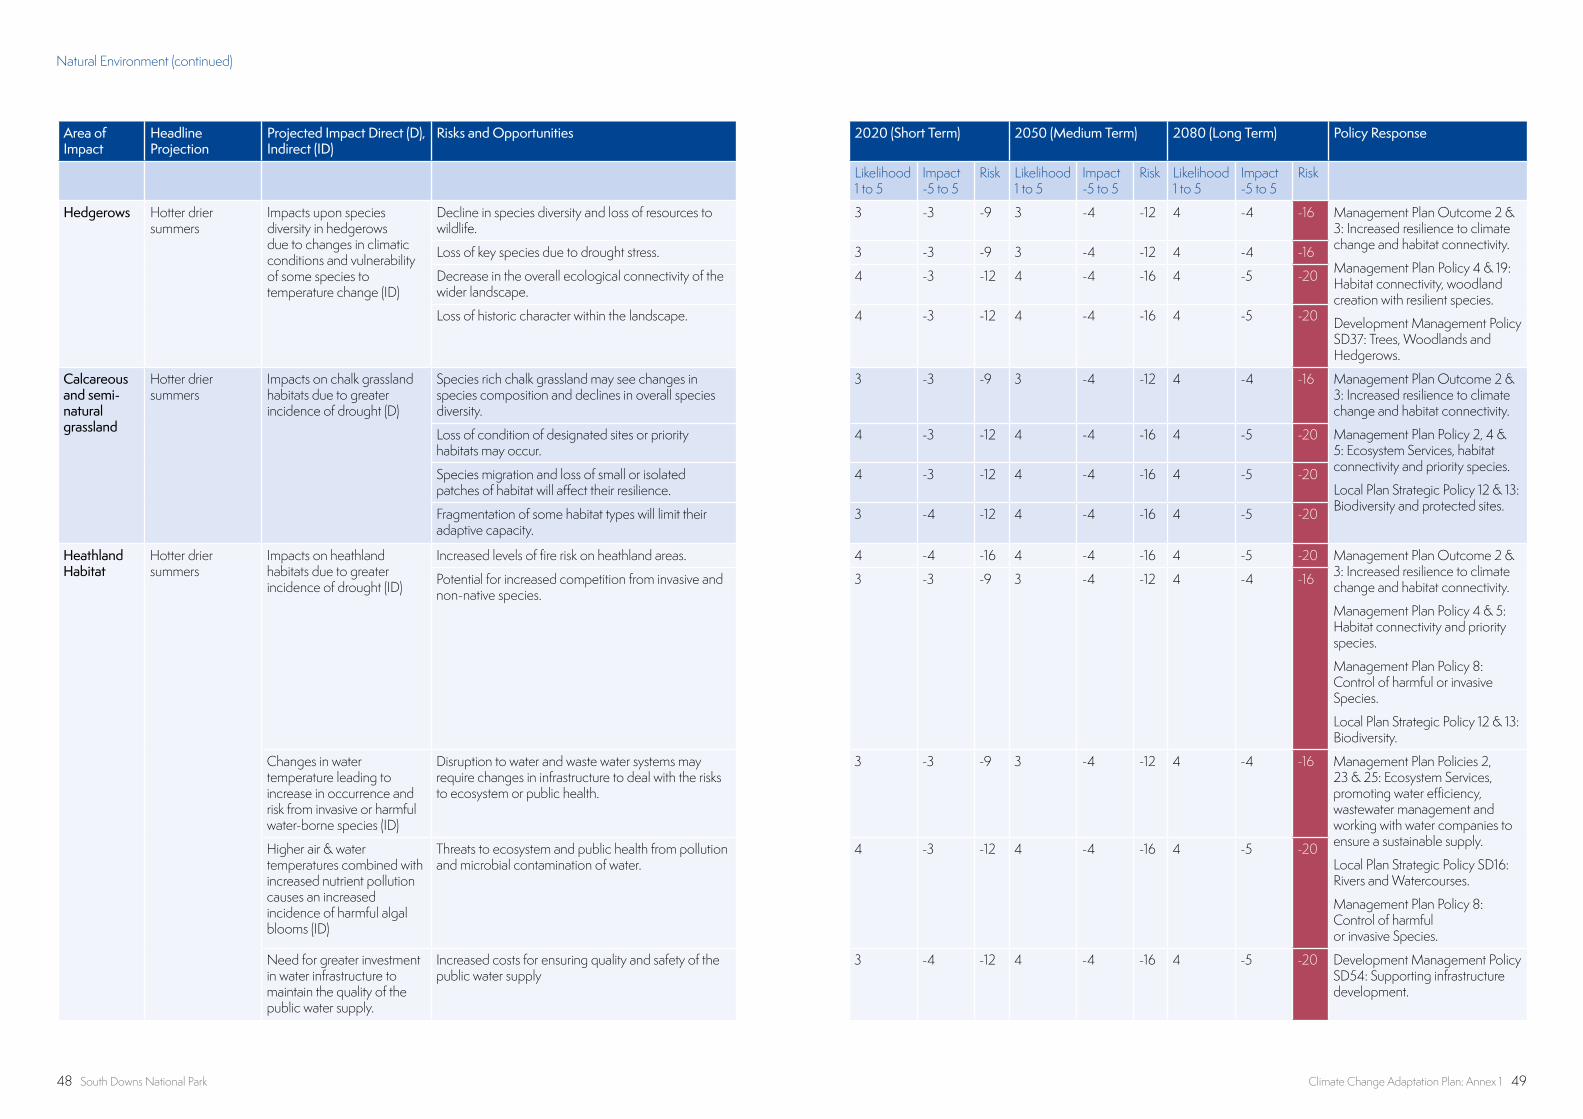
48 South Downs National Park Climate Change Adaptation Plan: Annex 1 49
Area of Impact
Headline Projection
Projected Impact Direct (D), Indirect (ID)
Risks and Opportunities 2020 (Short Term) 2050 (Medium Term) 2080 (Long Term) Policy Response
Likelihood 1 to 5
Impact -5 to 5
Risk Likelihood 1 to 5
Impact -5 to 5
Risk Likelihood 1 to 5
Impact -5 to 5
Risk
Hedgerows Hotter drier summers
Impacts upon species diversity in hedgerows due to changes in climatic conditions and vulnerability of some species to temperature change (ID)
Decline in species diversity and loss of resources to wildlife.
3 -3 -9 3 -4 -12 4 -4 -16 Management Plan Outcome 2 & 3: Increased resilience to climate change and habitat connectivity.
Management Plan Policy 4 & 19: Habitat connectivity, woodland creation with resilient species.
Development Management Policy SD37: Trees, Woodlands and Hedgerows.
Loss of key species due to drought stress. 3 -3 -9 3 -4 -12 4 -4 -16
Decrease in the overall ecological connectivity of the wider landscape.
4 -3 -12 4 -4 -16 4 -5 -20
Loss of historic character within the landscape. 4 -3 -12 4 -4 -16 4 -5 -20
Calcareous and semi-natural grassland
Hotter drier summers
Impacts on chalk grassland habitats due to greater incidence of drought (D)
Species rich chalk grassland may see changes in species composition and declines in overall species diversity.
3 -3 -9 3 -4 -12 4 -4 -16 Management Plan Outcome 2 & 3: Increased resilience to climate change and habitat connectivity.
Management Plan Policy 2, 4 & 5: Ecosystem Services, habitat connectivity and priority species.
Local Plan Strategic Policy 12 & 13: Biodiversity and protected sites.
Loss of condition of designated sites or priority habitats may occur.
4 -3 -12 4 -4 -16 4 -5 -20
Species migration and loss of small or isolated patches of habitat will affect their resilience.
4 -3 -12 4 -4 -16 4 -5 -20
Fragmentation of some habitat types will limit their adaptive capacity.
3 -4 -12 4 -4 -16 4 -5 -20
Heathland Habitat
Hotter drier summers
Impacts on heathland habitats due to greater incidence of drought (ID)
Increased levels of fire risk on heathland areas. 4 -4 -16 4 -4 -16 4 -5 -20 Management Plan Outcome 2 & 3: Increased resilience to climate change and habitat connectivity.
Management Plan Policy 4 & 5: Habitat connectivity and priority species.
Management Plan Policy 8: Control of harmful or invasive Species.
Local Plan Strategic Policy 12 & 13: Biodiversity.
Potential for increased competition from invasive and non-native species.
3 -3 -9 3 -4 -12 4 -4 -16
Changes in water temperature leading to increase in occurrence and risk from invasive or harmful water-borne species (ID)
Disruption to water and waste water systems may require changes in infrastructure to deal with the risks to ecosystem or public health.
3 -3 -9 3 -4 -12 4 -4 -16 Management Plan Policies 2, 23 & 25: Ecosystem Services, promoting water efficiency, wastewater management and working with water companies to ensure a sustainable supply.
Local Plan Strategic Policy SD16: Rivers and Watercourses.
Management Plan Policy 8: Control of harmful or invasive Species.
Higher air & water temperatures combined with increased nutrient pollution causes an increased incidence of harmful algal blooms (ID)
Threats to ecosystem and public health from pollution and microbial contamination of water.
4 -3 -12 4 -4 -16 4 -5 -20
Need for greater investment in water infrastructure to maintain the quality of the public water supply.
Increased costs for ensuring quality and safety of the public water supply
3 -4 -12 4 -4 -16 4 -5 -20 Development Management Policy SD54: Supporting infrastructure development.
Natural Environment (continued)
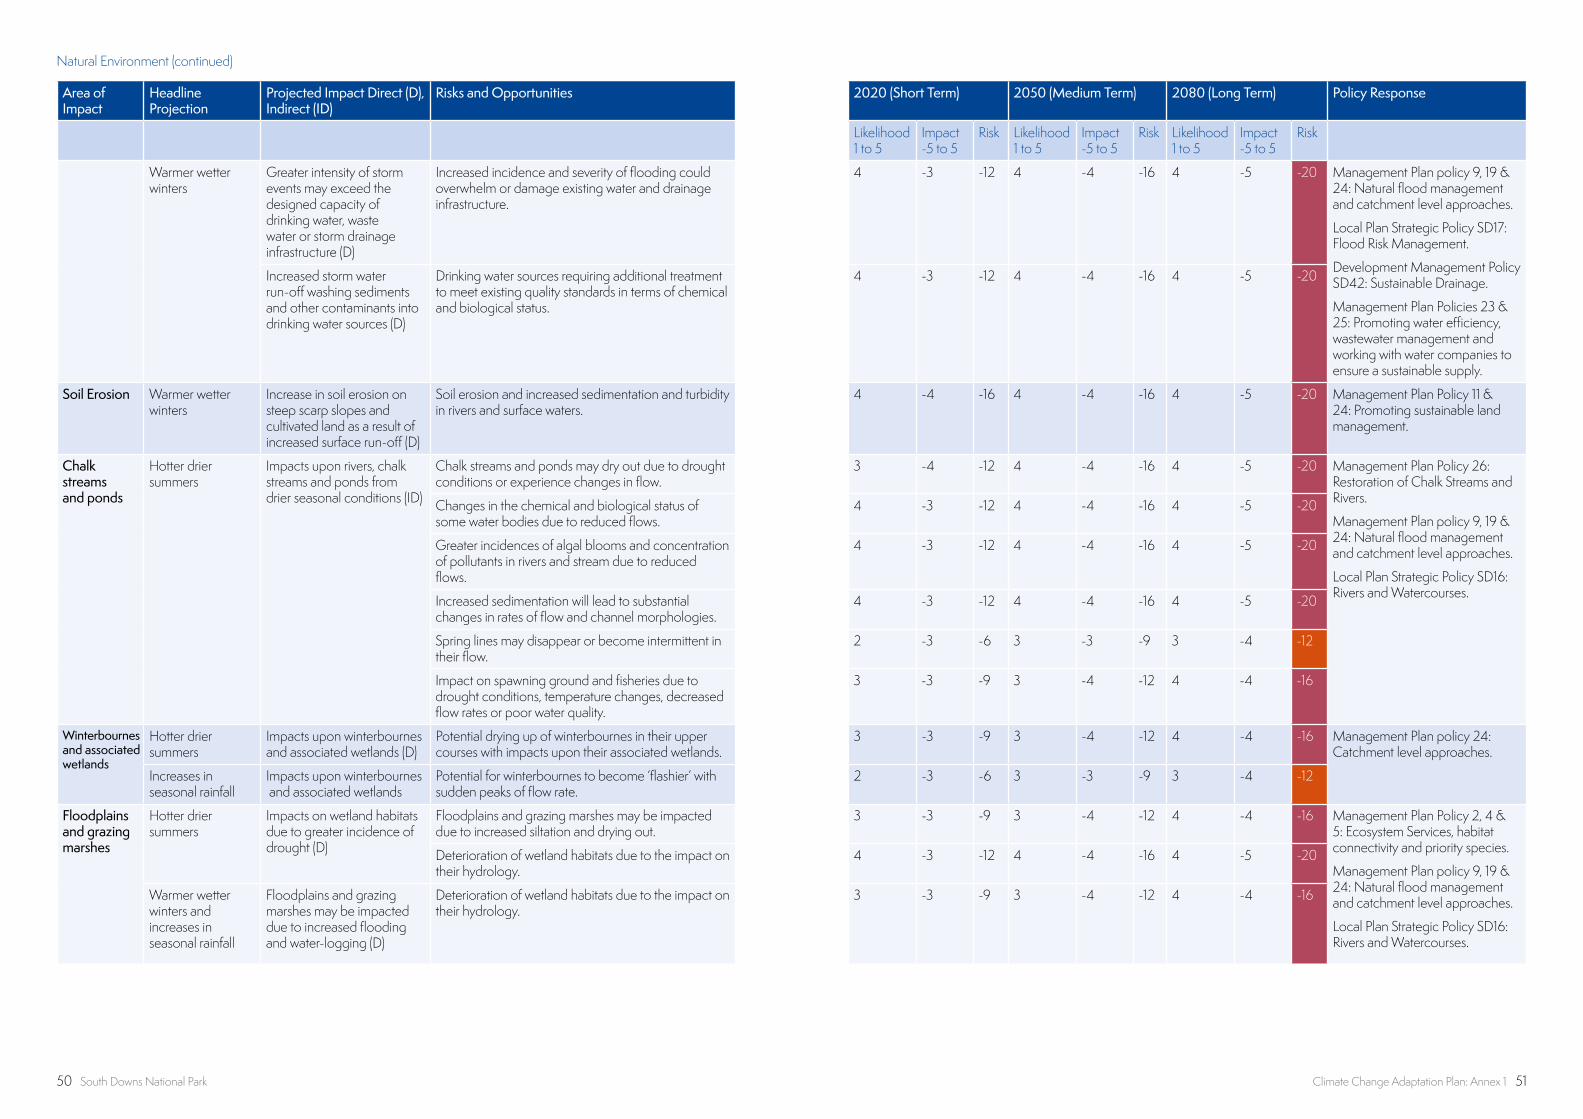
50 South Downs National Park Climate Change Adaptation Plan: Annex 1 51
Area of Impact
Headline Projection
Projected Impact Direct (D), Indirect (ID)
Risks and Opportunities 2020 (Short Term) 2050 (Medium Term) 2080 (Long Term) Policy Response
Likelihood 1 to 5
Impact -5 to 5
Risk Likelihood 1 to 5
Impact -5 to 5
Risk Likelihood 1 to 5
Impact -5 to 5
Risk
Warmer wetter winters
Greater intensity of storm events may exceed the designed capacity of drinking water, waste water or storm drainage infrastructure (D)
Increased incidence and severity of flooding could overwhelm or damage existing water and drainage infrastructure.
4 -3 -12 4 -4 -16 4 -5 -20 Management Plan policy 9, 19 & 24: Natural flood management and catchment level approaches.
Local Plan Strategic Policy SD17: Flood Risk Management.
Development Management Policy SD42: Sustainable Drainage.
Management Plan Policies 23 & 25: Promoting water efficiency, wastewater management and working with water companies to ensure a sustainable supply.
Increased storm water run-off washing sediments and other contaminants into drinking water sources (D)
Drinking water sources requiring additional treatment to meet existing quality standards in terms of chemical and biological status.
4 -3 -12 4 -4 -16 4 -5 -20
Soil Erosion Warmer wetter winters
Increase in soil erosion on steep scarp slopes and cultivated land as a result of increased surface run-off (D)
Soil erosion and increased sedimentation and turbidity in rivers and surface waters.
4 -4 -16 4 -4 -16 4 -5 -20 Management Plan Policy 11 & 24: Promoting sustainable land management.
Chalk streams and ponds
Hotter drier summers
Impacts upon rivers, chalk streams and ponds from drier seasonal conditions (ID)
Chalk streams and ponds may dry out due to drought conditions or experience changes in flow.
3 -4 -12 4 -4 -16 4 -5 -20 Management Plan Policy 26: Restoration of Chalk Streams and Rivers.
Management Plan policy 9, 19 & 24: Natural flood management and catchment level approaches.
Local Plan Strategic Policy SD16: Rivers and Watercourses.
Changes in the chemical and biological status of some water bodies due to reduced flows.
4 -3 -12 4 -4 -16 4 -5 -20
Greater incidences of algal blooms and concentration of pollutants in rivers and stream due to reduced flows.
4 -3 -12 4 -4 -16 4 -5 -20
Increased sedimentation will lead to substantial changes in rates of flow and channel morphologies.
4 -3 -12 4 -4 -16 4 -5 -20
Spring lines may disappear or become intermittent in their flow.
2 -3 -6 3 -3 -9 3 -4 -12
Impact on spawning ground and fisheries due to drought conditions, temperature changes, decreased flow rates or poor water quality.
3 -3 -9 3 -4 -12 4 -4 -16
Winterbournes and associated wetlands
Hotter drier summers
Impacts upon winterbournes and associated wetlands (D)
Potential drying up of winterbournes in their upper courses with impacts upon their associated wetlands.
3 -3 -9 3 -4 -12 4 -4 -16 Management Plan policy 24: Catchment level approaches.
Increases in seasonal rainfall
Impacts upon winterbournes and associated wetlands
Potential for winterbournes to become ‘flashier’ with sudden peaks of flow rate.
2 -3 -6 3 -3 -9 3 -4 -12
Floodplains and grazing marshes
Hotter drier summers
Impacts on wetland habitats due to greater incidence of drought (D)
Floodplains and grazing marshes may be impacted due to increased siltation and drying out.
3 -3 -9 3 -4 -12 4 -4 -16 Management Plan Policy 2, 4 & 5: Ecosystem Services, habitat connectivity and priority species.
Management Plan policy 9, 19 & 24: Natural flood management and catchment level approaches.
Local Plan Strategic Policy SD16: Rivers and Watercourses.
Deterioration of wetland habitats due to the impact on their hydrology.
4 -3 -12 4 -4 -16 4 -5 -20
Warmer wetter winters and increases in seasonal rainfall
Floodplains and grazing marshes may be impacted due to increased flooding and water-logging (D)
Deterioration of wetland habitats due to the impact on their hydrology.
3 -3 -9 3 -4 -12 4 -4 -16
Natural Environment (continued)
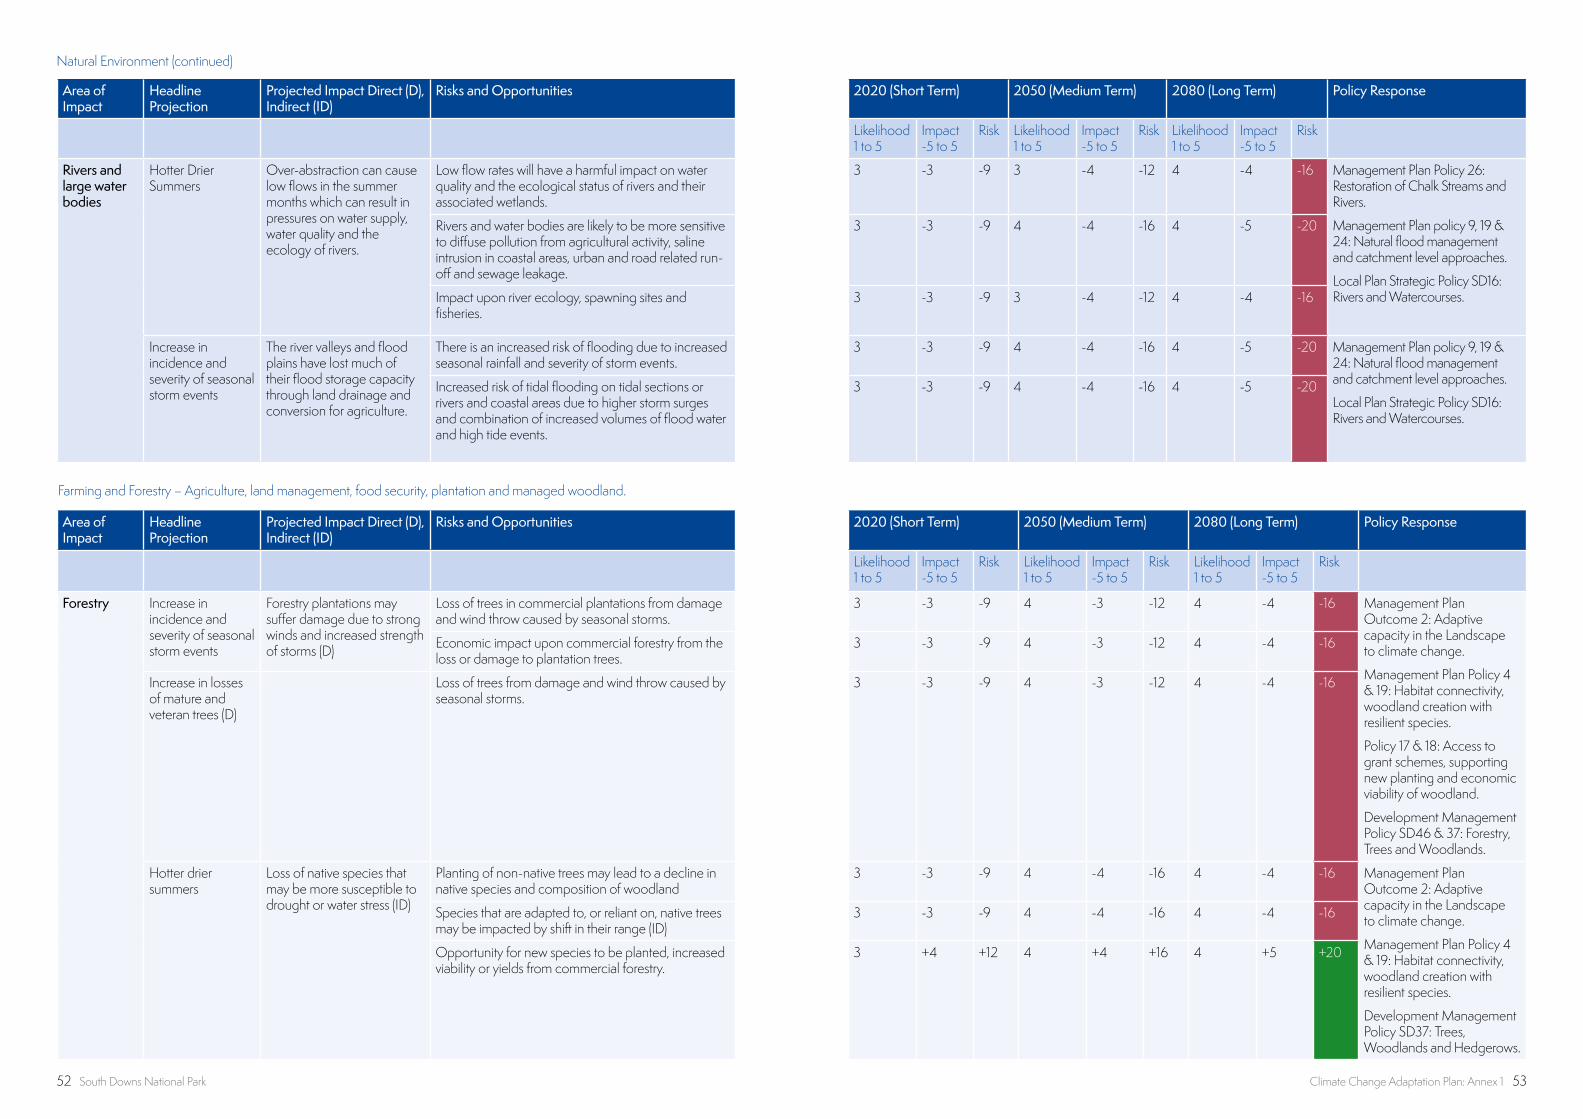
52 South Downs National Park Climate Change Adaptation Plan: Annex 1 53
Farming and Forestry – Agriculture, land management, food security, plantation and managed woodland.
Area of Impact
Headline Projection
Projected Impact Direct (D), Indirect (ID)
Risks and Opportunities 2020 (Short Term) 2050 (Medium Term) 2080 (Long Term) Policy Response
Likelihood 1 to 5
Impact -5 to 5
Risk Likelihood 1 to 5
Impact -5 to 5
Risk Likelihood 1 to 5
Impact -5 to 5
Risk
Forestry Increase in incidence and severity of seasonal storm events
Forestry plantations may suffer damage due to strong winds and increased strength of storms (D)
Loss of trees in commercial plantations from damage and wind throw caused by seasonal storms.
3 -3 -9 4 -3 -12 4 -4 -16 Management Plan Outcome 2: Adaptive capacity in the Landscape to climate change.
Management Plan Policy 4 & 19: Habitat connectivity, woodland creation with resilient species.
Policy 17 & 18: Access to grant schemes, supporting new planting and economic viability of woodland.
Development Management Policy SD46 & 37: Forestry, Trees and Woodlands.
Economic impact upon commercial forestry from the loss or damage to plantation trees.
3 -3 -9 4 -3 -12 4 -4 -16
Increase in losses of mature and veteran trees (D)
Loss of trees from damage and wind throw caused by seasonal storms.
3 -3 -9 4 -3 -12 4 -4 -16
Hotter drier summers
Loss of native species that may be more susceptible to drought or water stress (ID)
Planting of non-native trees may lead to a decline in native species and composition of woodland
3 -3 -9 4 -4 -16 4 -4 -16 Management Plan Outcome 2: Adaptive capacity in the Landscape to climate change.
Management Plan Policy 4 & 19: Habitat connectivity, woodland creation with resilient species.
Development Management Policy SD37: Trees, Woodlands and Hedgerows.
Species that are adapted to, or reliant on, native trees may be impacted by shift in their range (ID)
3 -3 -9 4 -4 -16 4 -4 -16
Opportunity for new species to be planted, increased viability or yields from commercial forestry.
3 +4 +12 4 +4 +16 4 +5 +20
Area of Impact
Headline Projection
Projected Impact Direct (D), Indirect (ID)
Risks and Opportunities 2020 (Short Term) 2050 (Medium Term) 2080 (Long Term) Policy Response
Likelihood 1 to 5
Impact -5 to 5
Risk Likelihood 1 to 5
Impact -5 to 5
Risk Likelihood 1 to 5
Impact -5 to 5
Risk
Rivers and large water bodies
Hotter Drier Summers
Over-abstraction can cause low flows in the summer months which can result in pressures on water supply, water quality and the ecology of rivers.
Low flow rates will have a harmful impact on water quality and the ecological status of rivers and their associated wetlands.
3 -3 -9 3 -4 -12 4 -4 -16 Management Plan Policy 26: Restoration of Chalk Streams and Rivers.
Management Plan policy 9, 19 & 24: Natural flood management and catchment level approaches.
Local Plan Strategic Policy SD16: Rivers and Watercourses.
Rivers and water bodies are likely to be more sensitive to diffuse pollution from agricultural activity, saline intrusion in coastal areas, urban and road related run-off and sewage leakage.
3 -3 -9 4 -4 -16 4 -5 -20
Impact upon river ecology, spawning sites and fisheries.
3 -3 -9 3 -4 -12 4 -4 -16
Increase in incidence and severity of seasonal storm events
The river valleys and flood plains have lost much of their flood storage capacity through land drainage and conversion for agriculture.
There is an increased risk of flooding due to increased seasonal rainfall and severity of storm events.
3 -3 -9 4 -4 -16 4 -5 -20 Management Plan policy 9, 19 & 24: Natural flood management and catchment level approaches.
Local Plan Strategic Policy SD16: Rivers and Watercourses.
Increased risk of tidal flooding on tidal sections or rivers and coastal areas due to higher storm surges and combination of increased volumes of flood water and high tide events.
3 -3 -9 4 -4 -16 4 -5 -20
Natural Environment (continued)
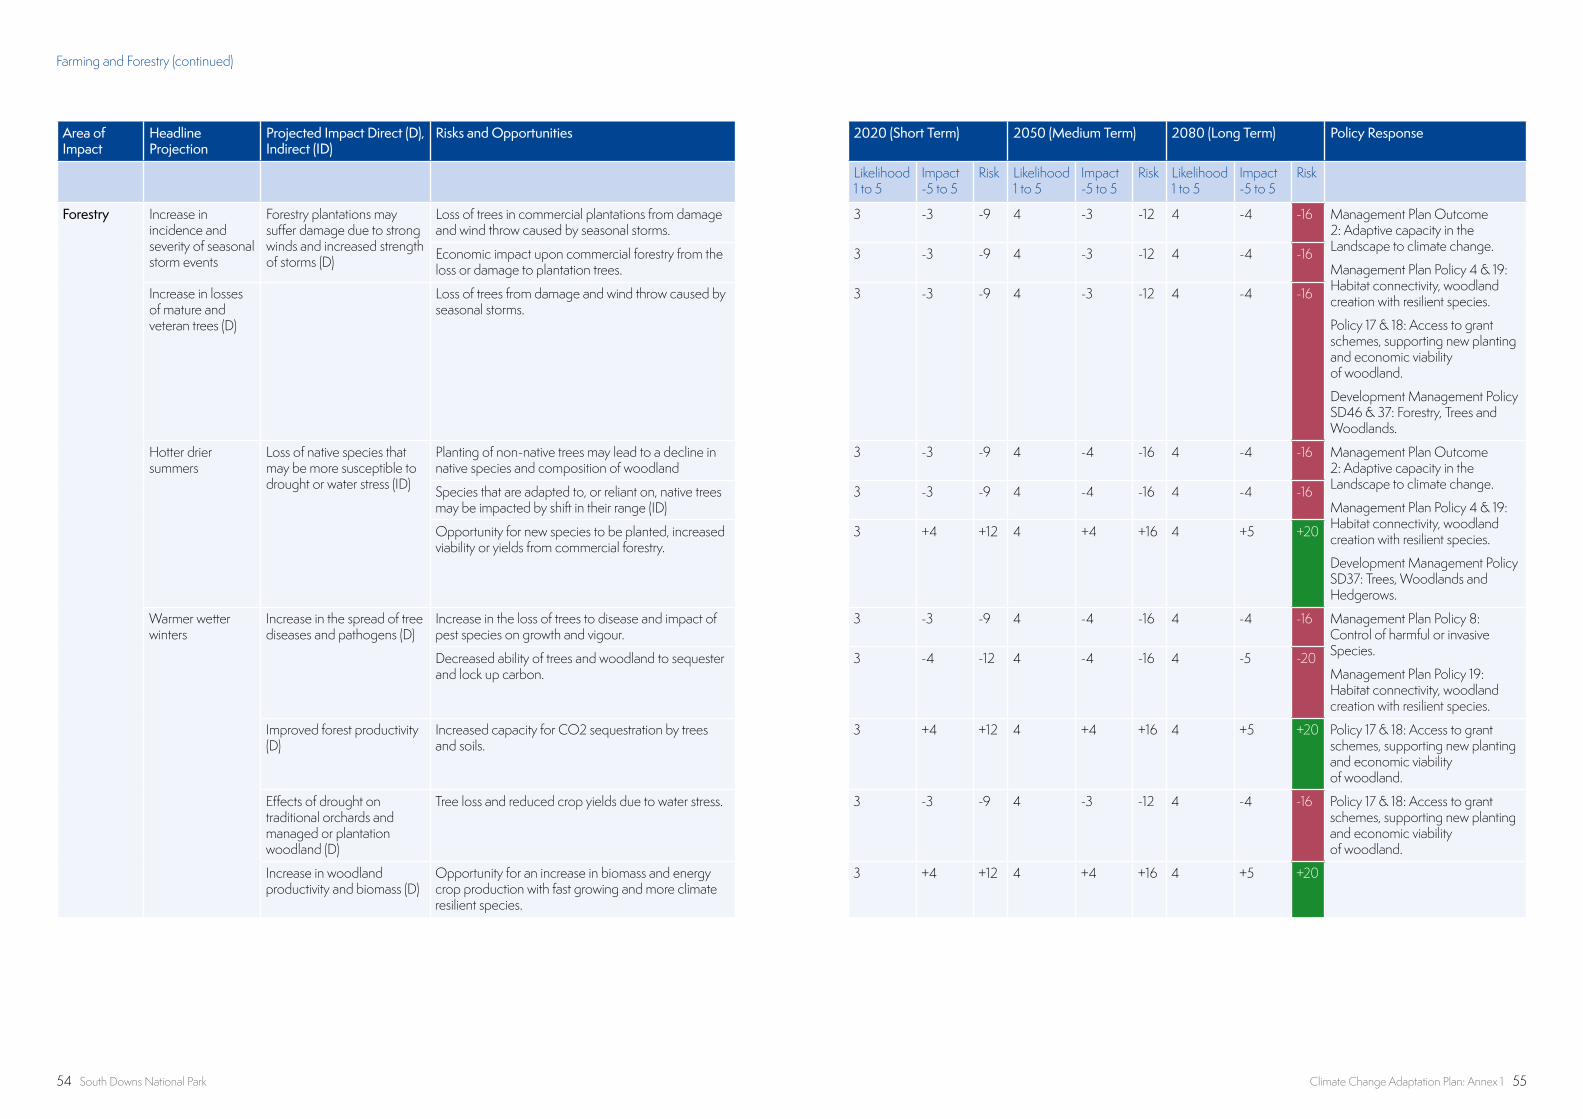
54 South Downs National Park Climate Change Adaptation Plan: Annex 1 55
Area of Impact
Headline Projection
Projected Impact Direct (D), Indirect (ID)
Risks and Opportunities 2020 (Short Term) 2050 (Medium Term) 2080 (Long Term) Policy Response
Likelihood 1 to 5
Impact -5 to 5
Risk Likelihood 1 to 5
Impact -5 to 5
Risk Likelihood 1 to 5
Impact -5 to 5
Risk
Forestry Increase in incidence and severity of seasonal storm events
Forestry plantations may suffer damage due to strong winds and increased strength of storms (D)
Loss of trees in commercial plantations from damage and wind throw caused by seasonal storms.
3 -3 -9 4 -3 -12 4 -4 -16 Management Plan Outcome 2: Adaptive capacity in the Landscape to climate change.
Management Plan Policy 4 & 19: Habitat connectivity, woodland creation with resilient species.
Policy 17 & 18: Access to grant schemes, supporting new planting and economic viability of woodland.
Development Management Policy SD46 & 37: Forestry, Trees and Woodlands.
Economic impact upon commercial forestry from the loss or damage to plantation trees.
3 -3 -9 4 -3 -12 4 -4 -16
Increase in losses of mature and veteran trees (D)
Loss of trees from damage and wind throw caused by seasonal storms.
3 -3 -9 4 -3 -12 4 -4 -16
Hotter drier summers
Loss of native species that may be more susceptible to drought or water stress (ID)
Planting of non-native trees may lead to a decline in native species and composition of woodland
3 -3 -9 4 -4 -16 4 -4 -16 Management Plan Outcome 2: Adaptive capacity in the Landscape to climate change.
Management Plan Policy 4 & 19: Habitat connectivity, woodland creation with resilient species.
Development Management Policy SD37: Trees, Woodlands and Hedgerows.
Species that are adapted to, or reliant on, native trees may be impacted by shift in their range (ID)
3 -3 -9 4 -4 -16 4 -4 -16
Opportunity for new species to be planted, increased viability or yields from commercial forestry.
3 +4 +12 4 +4 +16 4 +5 +20
Warmer wetter winters
Increase in the spread of tree diseases and pathogens (D)
Increase in the loss of trees to disease and impact of pest species on growth and vigour.
3 -3 -9 4 -4 -16 4 -4 -16 Management Plan Policy 8: Control of harmful or invasive Species.
Management Plan Policy 19: Habitat connectivity, woodland creation with resilient species.
Decreased ability of trees and woodland to sequester and lock up carbon.
3 -4 -12 4 -4 -16 4 -5 -20
Improved forest productivity (D)
Increased capacity for CO2 sequestration by trees and soils.
3 +4 +12 4 +4 +16 4 +5 +20 Policy 17 & 18: Access to grant schemes, supporting new planting and economic viability of woodland.
Effects of drought on traditional orchards and managed or plantation woodland (D)
Tree loss and reduced crop yields due to water stress. 3 -3 -9 4 -3 -12 4 -4 -16 Policy 17 & 18: Access to grant schemes, supporting new planting and economic viability of woodland.
Increase in woodland productivity and biomass (D)
Opportunity for an increase in biomass and energy crop production with fast growing and more climate resilient species.
3 +4 +12 4 +4 +16 4 +5 +20
Farming and Forestry (continued)
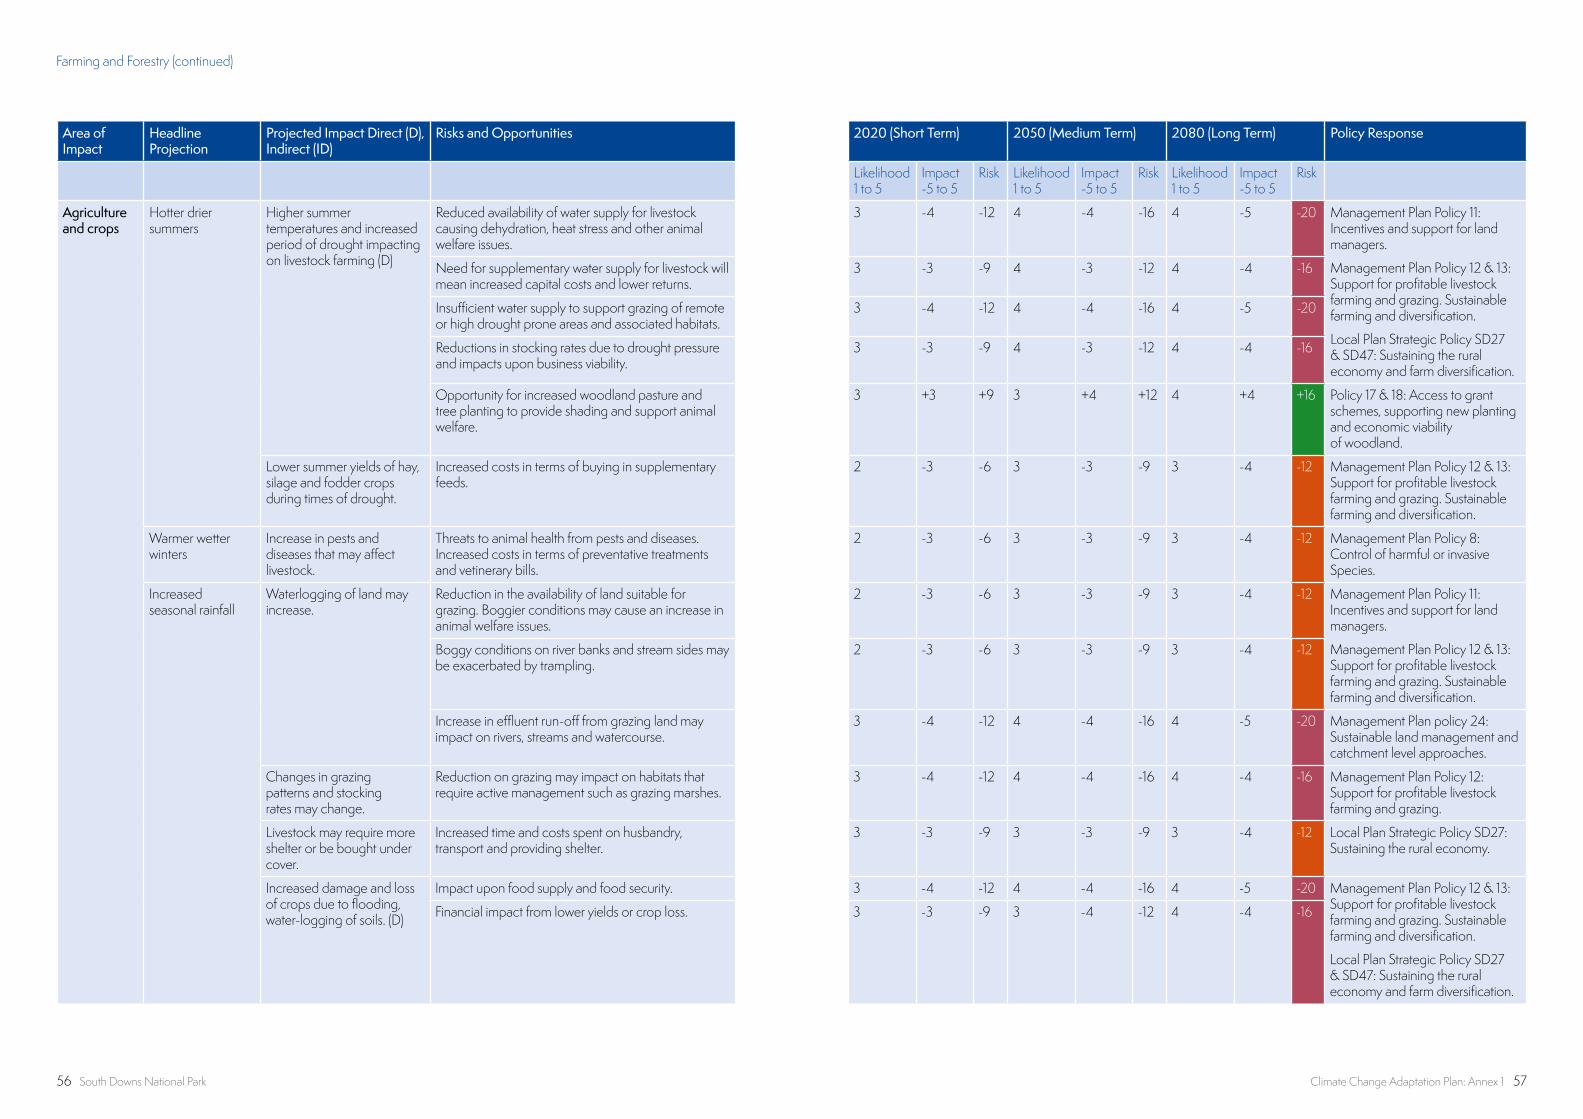
56 South Downs National Park Climate Change Adaptation Plan: Annex 1 57
Area of Impact
Headline Projection
Projected Impact Direct (D), Indirect (ID)
Risks and Opportunities 2020 (Short Term) 2050 (Medium Term) 2080 (Long Term) Policy Response
Likelihood 1 to 5
Impact -5 to 5
Risk Likelihood 1 to 5
Impact -5 to 5
Risk Likelihood 1 to 5
Impact -5 to 5
Risk
Agriculture and crops
Hotter drier summers
Higher summer temperatures and increased period of drought impacting on livestock farming (D)
Reduced availability of water supply for livestock causing dehydration, heat stress and other animal welfare issues.
3 -4 -12 4 -4 -16 4 -5 -20 Management Plan Policy 11: Incentives and support for land managers.
Management Plan Policy 12 & 13: Support for profitable livestock farming and grazing. Sustainable farming and diversification.
Local Plan Strategic Policy SD27 & SD47: Sustaining the rural economy and farm diversification.
Need for supplementary water supply for livestock will mean increased capital costs and lower returns.
3 -3 -9 4 -3 -12 4 -4 -16
Insufficient water supply to support grazing of remote or high drought prone areas and associated habitats.
3 -4 -12 4 -4 -16 4 -5 -20
Reductions in stocking rates due to drought pressure and impacts upon business viability.
3 -3 -9 4 -3 -12 4 -4 -16
Opportunity for increased woodland pasture and tree planting to provide shading and support animal welfare.
3 +3 +9 3 +4 +12 4 +4 +16 Policy 17 & 18: Access to grant schemes, supporting new planting and economic viability of woodland.
Lower summer yields of hay, silage and fodder crops during times of drought.
Increased costs in terms of buying in supplementary feeds.
2 -3 -6 3 -3 -9 3 -4 -12 Management Plan Policy 12 & 13: Support for profitable livestock farming and grazing. Sustainable farming and diversification.
Warmer wetter winters
Increase in pests and diseases that may affect livestock.
Threats to animal health from pests and diseases. Increased costs in terms of preventative treatments and vetinerary bills.
2 -3 -6 3 -3 -9 3 -4 -12 Management Plan Policy 8: Control of harmful or invasive Species.
Increased seasonal rainfall
Waterlogging of land may increase.
Reduction in the availability of land suitable for grazing. Boggier conditions may cause an increase in animal welfare issues.
2 -3 -6 3 -3 -9 3 -4 -12 Management Plan Policy 11: Incentives and support for land managers.
Management Plan Policy 12 & 13: Support for profitable livestock farming and grazing. Sustainable farming and diversification.
Boggy conditions on river banks and stream sides may be exacerbated by trampling.
2 -3 -6 3 -3 -9 3 -4 -12
Increase in effluent run-off from grazing land may impact on rivers, streams and watercourse.
3 -4 -12 4 -4 -16 4 -5 -20 Management Plan policy 24: Sustainable land management and catchment level approaches.
Changes in grazing patterns and stocking rates may change.
Reduction on grazing may impact on habitats that require active management such as grazing marshes.
3 -4 -12 4 -4 -16 4 -4 -16 Management Plan Policy 12: Support for profitable livestock farming and grazing.
Livestock may require more shelter or be bought under cover.
Increased time and costs spent on husbandry, transport and providing shelter.
3 -3 -9 3 -3 -9 3 -4 -12 Local Plan Strategic Policy SD27: Sustaining the rural economy.
Increased damage and loss of crops due to flooding, water-logging of soils. (D)
Impact upon food supply and food security. 3 -4 -12 4 -4 -16 4 -5 -20 Management Plan Policy 12 & 13: Support for profitable livestock farming and grazing. Sustainable farming and diversification.
Local Plan Strategic Policy SD27 & SD47: Sustaining the rural economy and farm diversification.
Financial impact from lower yields or crop loss. 3 -3 -9 3 -4 -12 4 -4 -16
Farming and Forestry (continued)
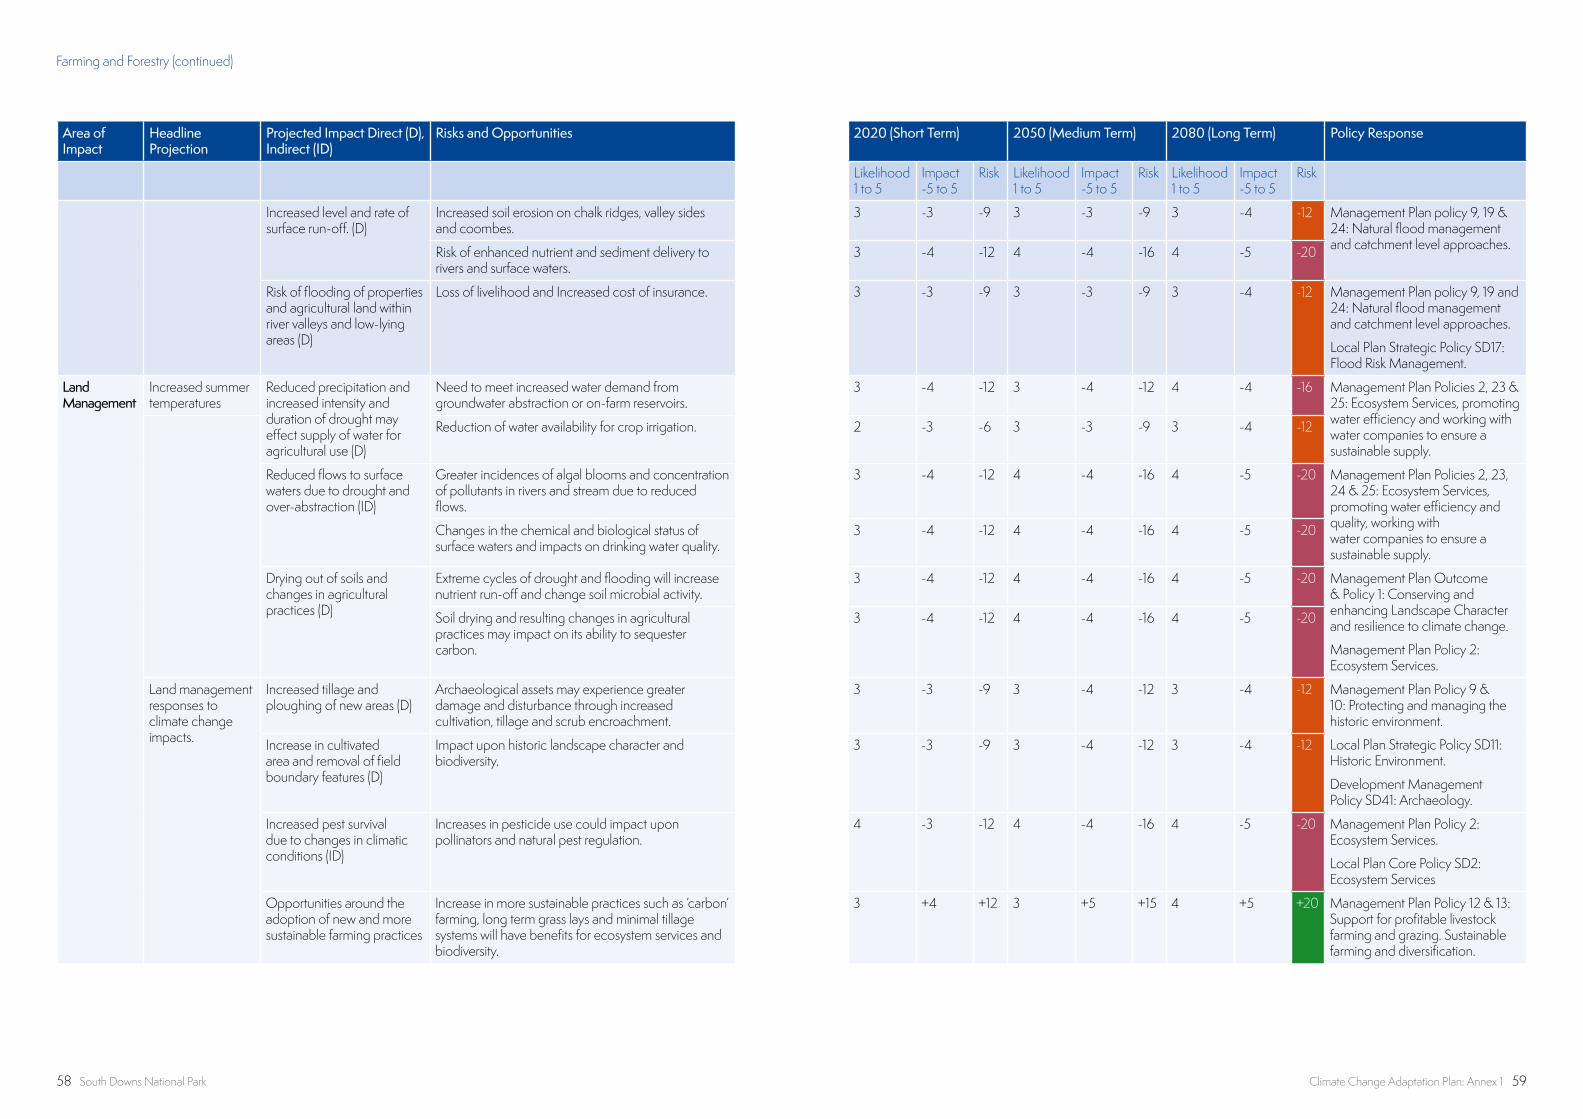
58 South Downs National Park Climate Change Adaptation Plan: Annex 1 59
Area of Impact
Headline Projection
Projected Impact Direct (D), Indirect (ID)
Risks and Opportunities 2020 (Short Term) 2050 (Medium Term) 2080 (Long Term) Policy Response
Likelihood 1 to 5
Impact -5 to 5
Risk Likelihood 1 to 5
Impact -5 to 5
Risk Likelihood 1 to 5
Impact -5 to 5
Risk
Increased level and rate of surface run-off. (D)
Increased soil erosion on chalk ridges, valley sides and coombes.
3 -3 -9 3 -3 -9 3 -4 -12 Management Plan policy 9, 19 & 24: Natural flood management and catchment level approaches.Risk of enhanced nutrient and sediment delivery to
rivers and surface waters.3 -4 -12 4 -4 -16 4 -5 -20
Risk of flooding of properties and agricultural land within river valleys and low-lying areas (D)
Loss of livelihood and Increased cost of insurance. 3 -3 -9 3 -3 -9 3 -4 -12 Management Plan policy 9, 19 and 24: Natural flood management and catchment level approaches.
Local Plan Strategic Policy SD17: Flood Risk Management.
Land Management
Increased summer temperatures
Reduced precipitation and increased intensity and duration of drought may effect supply of water for agricultural use (D)
Need to meet increased water demand from groundwater abstraction or on-farm reservoirs.
3 -4 -12 3 -4 -12 4 -4 -16 Management Plan Policies 2, 23 & 25: Ecosystem Services, promoting water efficiency and working with water companies to ensure a sustainable supply.
Reduction of water availability for crop irrigation. 2 -3 -6 3 -3 -9 3 -4 -12
Reduced flows to surface waters due to drought and over-abstraction (ID)
Greater incidences of algal blooms and concentration of pollutants in rivers and stream due to reduced flows.
3 -4 -12 4 -4 -16 4 -5 -20 Management Plan Policies 2, 23, 24 & 25: Ecosystem Services, promoting water efficiency and quality, working with water companies to ensure a sustainable supply.
Changes in the chemical and biological status of surface waters and impacts on drinking water quality.
3 -4 -12 4 -4 -16 4 -5 -20
Drying out of soils and changes in agricultural practices (D)
Extreme cycles of drought and flooding will increase nutrient run-off and change soil microbial activity.
3 -4 -12 4 -4 -16 4 -5 -20 Management Plan Outcome & Policy 1: Conserving and enhancing Landscape Character and resilience to climate change.
Management Plan Policy 2: Ecosystem Services.
Soil drying and resulting changes in agricultural practices may impact on its ability to sequester carbon.
3 -4 -12 4 -4 -16 4 -5 -20
Land management responses to climate change impacts.
Increased tillage and ploughing of new areas (D)
Archaeological assets may experience greater damage and disturbance through increased cultivation, tillage and scrub encroachment.
3 -3 -9 3 -4 -12 3 -4 -12 Management Plan Policy 9 & 10: Protecting and managing the historic environment.
Local Plan Strategic Policy SD11: Historic Environment.
Development Management Policy SD41: Archaeology.
Increase in cultivated area and removal of field boundary features (D)
Impact upon historic landscape character and biodiversity.
3 -3 -9 3 -4 -12 3 -4 -12
Increased pest survival due to changes in climatic conditions (ID)
Increases in pesticide use could impact upon pollinators and natural pest regulation.
4 -3 -12 4 -4 -16 4 -5 -20 Management Plan Policy 2: Ecosystem Services.
Local Plan Core Policy SD2: Ecosystem Services
Opportunities around the adoption of new and more sustainable farming practices
Increase in more sustainable practices such as ‘carbon’ farming, long term grass lays and minimal tillage systems will have benefits for ecosystem services and biodiversity.
3 +4 +12 3 +5 +15 4 +5 +20 Management Plan Policy 12 & 13: Support for profitable livestock farming and grazing. Sustainable farming and diversification.
Farming and Forestry (continued)
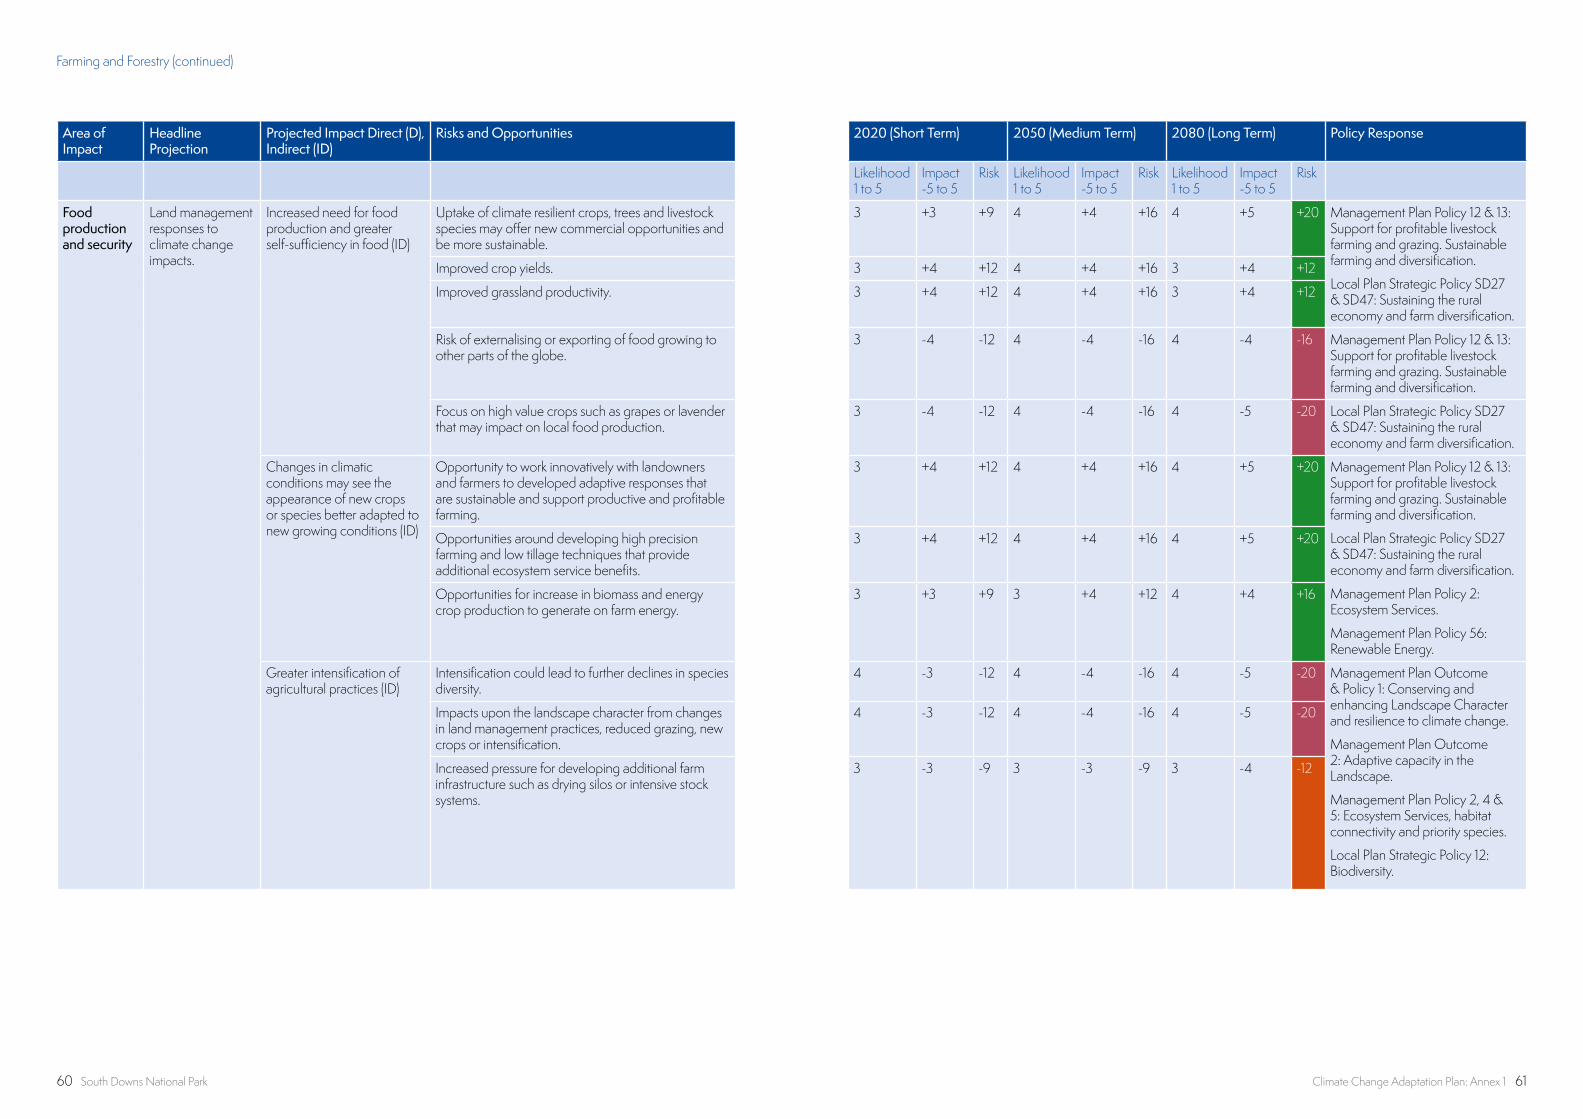
60 South Downs National Park Climate Change Adaptation Plan: Annex 1 61
Area of Impact
Headline Projection
Projected Impact Direct (D), Indirect (ID)
Risks and Opportunities 2020 (Short Term) 2050 (Medium Term) 2080 (Long Term) Policy Response
Likelihood 1 to 5
Impact -5 to 5
Risk Likelihood 1 to 5
Impact -5 to 5
Risk Likelihood 1 to 5
Impact -5 to 5
Risk
Food production and security
Land management responses to climate change impacts.
Increased need for food production and greater self-sufficiency in food (ID)
Uptake of climate resilient crops, trees and livestock species may offer new commercial opportunities and be more sustainable.
3 +3 +9 4 +4 +16 4 +5 +20 Management Plan Policy 12 & 13: Support for profitable livestock farming and grazing. Sustainable farming and diversification.
Local Plan Strategic Policy SD27 & SD47: Sustaining the rural economy and farm diversification.
Improved crop yields. 3 +4 +12 4 +4 +16 3 +4 +12
Improved grassland productivity. 3 +4 +12 4 +4 +16 3 +4 +12
Risk of externalising or exporting of food growing to other parts of the globe.
3 -4 -12 4 -4 -16 4 -4 -16 Management Plan Policy 12 & 13: Support for profitable livestock farming and grazing. Sustainable farming and diversification.
Focus on high value crops such as grapes or lavender that may impact on local food production.
3 -4 -12 4 -4 -16 4 -5 -20 Local Plan Strategic Policy SD27 & SD47: Sustaining the rural economy and farm diversification.
Changes in climatic conditions may see the appearance of new crops or species better adapted to new growing conditions (ID)
Opportunity to work innovatively with landowners and farmers to developed adaptive responses that are sustainable and support productive and profitable farming.
3 +4 +12 4 +4 +16 4 +5 +20 Management Plan Policy 12 & 13: Support for profitable livestock farming and grazing. Sustainable farming and diversification.
Local Plan Strategic Policy SD27 & SD47: Sustaining the rural economy and farm diversification.
Management Plan Policy 2: Ecosystem Services.
Management Plan Policy 56: Renewable Energy.
Opportunities around developing high precision farming and low tillage techniques that provide additional ecosystem service benefits.
3 +4 +12 4 +4 +16 4 +5 +20
Opportunities for increase in biomass and energy crop production to generate on farm energy.
3 +3 +9 3 +4 +12 4 +4 +16
Greater intensification of agricultural practices (ID)
Intensification could lead to further declines in species diversity.
4 -3 -12 4 -4 -16 4 -5 -20 Management Plan Outcome & Policy 1: Conserving and enhancing Landscape Character and resilience to climate change.
Management Plan Outcome 2: Adaptive capacity in the Landscape.
Management Plan Policy 2, 4 & 5: Ecosystem Services, habitat connectivity and priority species.
Local Plan Strategic Policy 12: Biodiversity.
Impacts upon the landscape character from changes in land management practices, reduced grazing, new crops or intensification.
4 -3 -12 4 -4 -16 4 -5 -20
Increased pressure for developing additional farm infrastructure such as drying silos or intensive stock systems.
3 -3 -9 3 -3 -9 3 -4 -12
Farming and Forestry (continued)
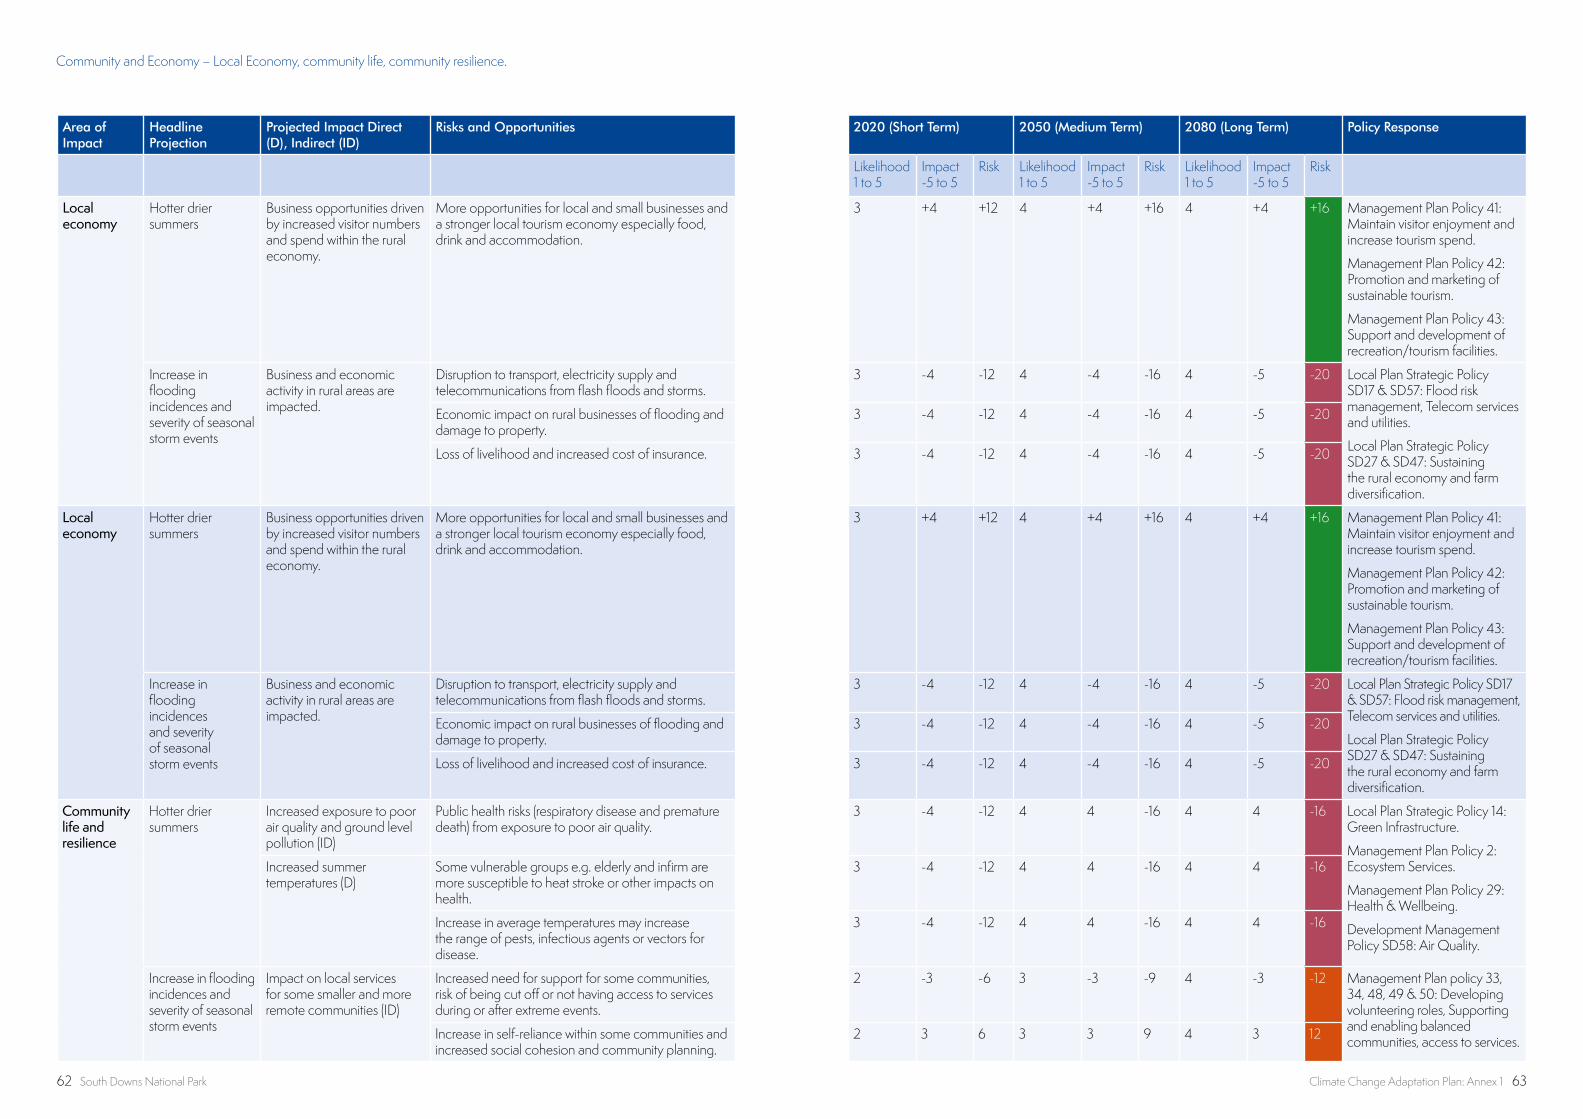
62 South Downs National Park Climate Change Adaptation Plan: Annex 1 63
Area of Impact
Headline Projection
Projected Impact Direct (D), Indirect (ID)
Risks and Opportunities 2020 (Short Term) 2050 (Medium Term) 2080 (Long Term) Policy Response
Likelihood 1 to 5
Impact -5 to 5
Risk Likelihood 1 to 5
Impact -5 to 5
Risk Likelihood 1 to 5
Impact -5 to 5
Risk
Local economy
Hotter drier summers
Business opportunities driven by increased visitor numbers and spend within the rural economy.
More opportunities for local and small businesses and a stronger local tourism economy especially food, drink and accommodation.
3 +4 +12 4 +4 +16 4 +4 +16 Management Plan Policy 41: Maintain visitor enjoyment and increase tourism spend.
Management Plan Policy 42: Promotion and marketing of sustainable tourism.
Management Plan Policy 43: Support and development of recreation/tourism facilities.
Increase in flooding incidences and severity of seasonal storm events
Business and economic activity in rural areas are impacted.
Disruption to transport, electricity supply and telecommunications from flash floods and storms.
3 -4 -12 4 -4 -16 4 -5 -20 Local Plan Strategic Policy SD17 & SD57: Flood risk management, Telecom services and utilities.
Local Plan Strategic Policy SD27 & SD47: Sustaining the rural economy and farm diversification.
Economic impact on rural businesses of flooding and damage to property.
3 -4 -12 4 -4 -16 4 -5 -20
Loss of livelihood and increased cost of insurance. 3 -4 -12 4 -4 -16 4 -5 -20
Community life and resilience
Hotter drier summers
Increased exposure to poor air quality and ground level pollution (ID)
Public health risks (respiratory disease and premature death) from exposure to poor air quality.
3 -4 -12 4 4 -16 4 4 -16 Local Plan Strategic Policy 14: Green Infrastructure.
Management Plan Policy 2: Ecosystem Services.
Management Plan Policy 29: Health & Wellbeing.
Development Management Policy SD58: Air Quality.
Increased summer temperatures (D)
Some vulnerable groups e.g. elderly and infirm are more susceptible to heat stroke or other impacts on health.
3 -4 -12 4 4 -16 4 4 -16
Increase in average temperatures may increase the range of pests, infectious agents or vectors for disease.
3 -4 -12 4 4 -16 4 4 -16
Increase in flooding incidences and severity of seasonal storm events
Impact on local services for some smaller and more remote communities (ID)
Increased need for support for some communities, risk of being cut off or not having access to services during or after extreme events.
2 -3 -6 3 -3 -9 4 -3 -12 Management Plan policy 33, 34, 48, 49 & 50: Developing volunteering roles, Supporting and enabling balanced communities, access to services.Increase in self-reliance within some communities and
increased social cohesion and community planning.2 3 6 3 3 9 4 3 12
Community and Economy – Local Economy, community life, community resilience.

64 South Downs National Park Climate Change Adaptation Plan: Annex 1 65
Area of Impact
Headline Projection Projected Impact Direct (D), Indirect (ID)
Risks and Opportunities 2020 (Short Term) 2050 (Medium Term) 2080 (Long Term) Policy Response
Likelihood 1 to 5
Impact -5 to 5
Risk Likelihood 1 to 5
Impact -5 to 5
Risk Likelihood 1 to 5
Impact -5 to 5
Risk
Geology, soils and landform
Hotter drier summers
Drier ground conditions caused by higher summer temperatures and occurrences of drought.
Soils less stable and more prone to erosion, exposure of bare chalk and other substrates.
3 -3 -9 3 -3 -12 3 -4 -12 Management Plan Policy 2: Ecosystem Services.
Management Plan Policy 11 & 24: Promoting sustainable land management.
Local Plan Core Policy SD2: Ecosystem Services.
Higher temperatures and repeated cycles of drought will have an effect on the soils ability to retain/process water and nutrients for plants and habitats.
3 -4 -12 4 -4 -16 4 -5 -20
Warmer wetter winters
Increased saturation of the ground and soils.
Less slope stability and impacts on soil microbial condition.
3 -3 -9 4 -3 -12 4 -4 -16 Management Plan Policy 2: Ecosystem Services.
Management Plan Policy 11 & 24: Promoting sustainable land management.
Local Plan Core Policy SD2: Ecosystem Services.
Increased seasonal rainfall
Increased saturation of the ground and soils.
Less slope stability and more transit of soils and sediments into rivers and watercourses.
3 -4 -12 4 -4 -16 4 4 -16
Increased turbidity, water contamination and impact upon river habitats.
3 -4 -12 4 -4 -16 4 5 -20
Increase in incidence and severity of seasonal storm events
Greater vulnerability of substrates and soils to be washed away or subside.
Increased sedimentation of rivers and watercourse near to areas of high erosion risk.
3 -4 -12 4 -4 -16 4 4 -16 Management Plan Policy 2: Ecosystem Services.
Management Plan Policy 11 & 24: Promoting sustainable land management.
Management Plan & Local Plan Policy 2: Ecosystem Services.
Landslides and rock falls become more frequent. 3 -4 -12 4 -4 -16 4 4 -16
The natural function of flood plains or watercourses may be affected by increased sedimentation affecting channel morphology and rates of flow.
3 -4 -12 4 -4 -16 4 4 -16
Rivers carry increased sediment load and deposit more silt onto its floodplain. Potential for improved fertility on gazing marshes.
3 +3 +9 3 +4 +12 4 +4 +16
Impact of climate change on geomorphological process.
Changes in the extent or condition of chalk outcrops, cliffs, coombes and dry valleys from changes in natural processes over time.
Changes in the distinctive form and landscape character over time.
2 -3 -6 3 -3 -9 3 -4 -12 Management Plan Outcome & Policy 1: Conserving and enhancing Landscape Character and resilience to climate change.
Management Plan & Local Plan Policy 2: Ecosystem Services.
Local Plan Strategic Policy SD5: Landscape Character.
Impact on fluvial geomorphology erosion rates, drying of river beds and streams, increased silt deposition from flash floods and storms
Changes in the distinctive form and landscape character over time.
2 -3 -6 3 -3 -9 3 -4 -12
Landscape – Geology, soils, landform, landscape character, landscape features, land-use and settlements.
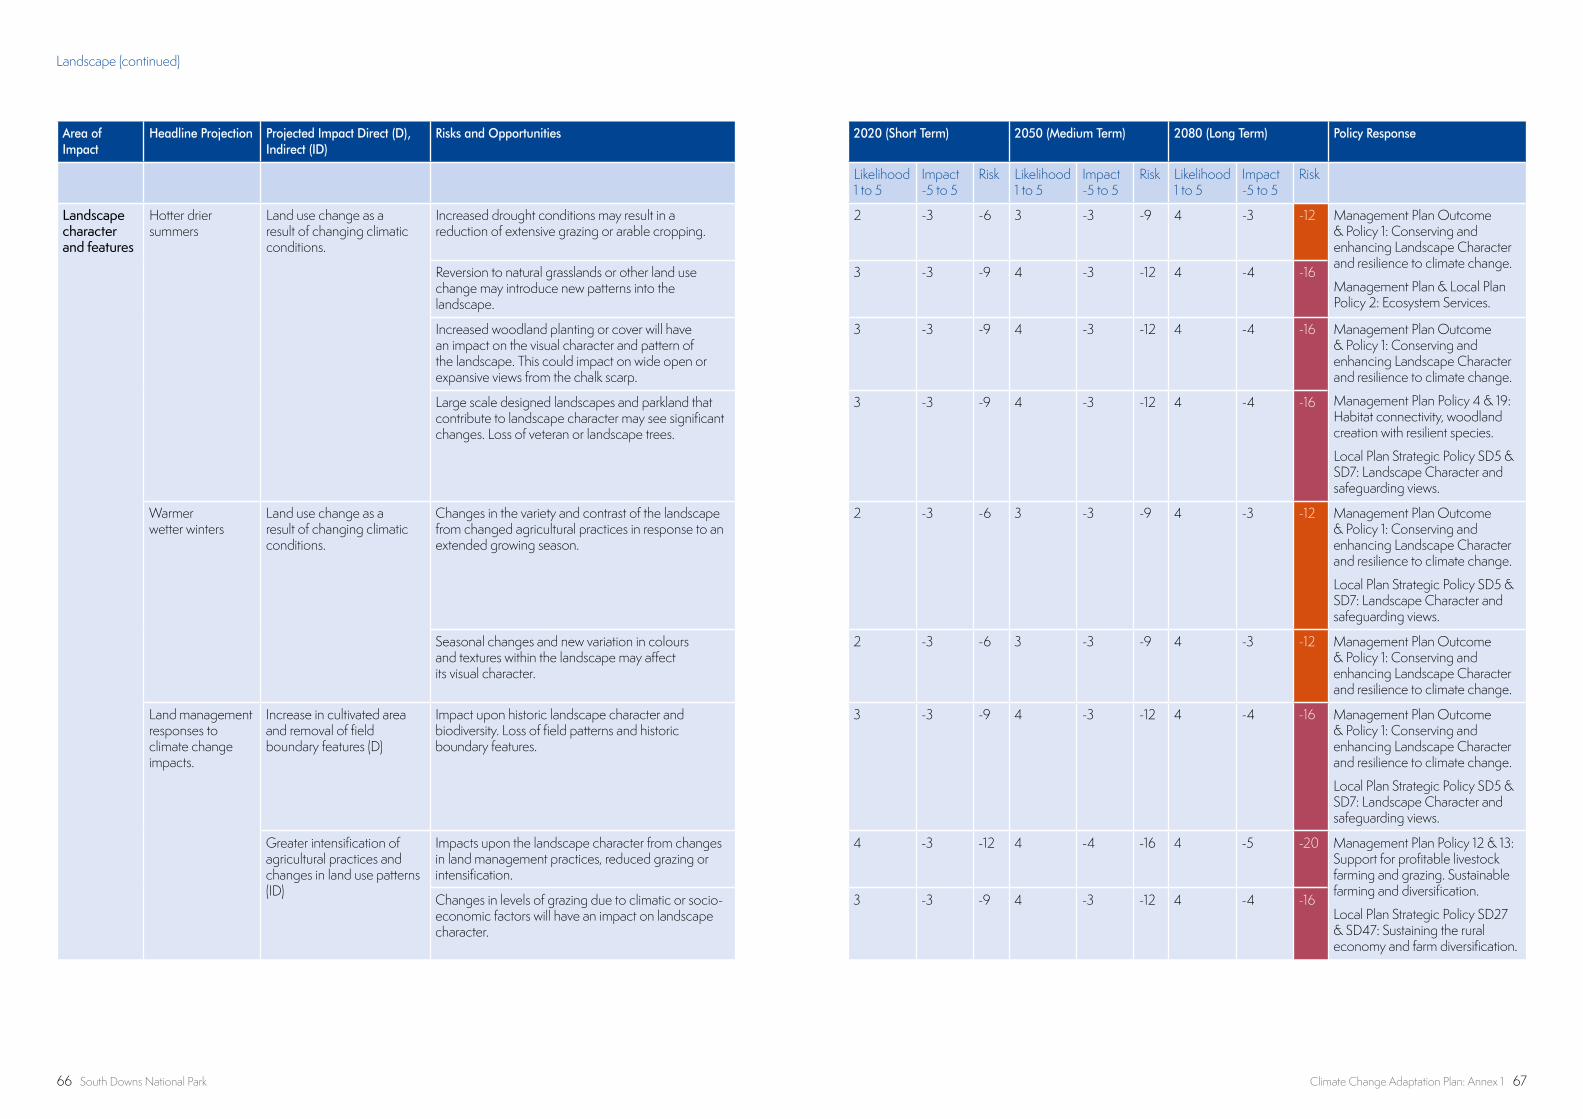
66 South Downs National Park Climate Change Adaptation Plan: Annex 1 67
Area of Impact
Headline Projection Projected Impact Direct (D), Indirect (ID)
Risks and Opportunities 2020 (Short Term) 2050 (Medium Term) 2080 (Long Term) Policy Response
Likelihood 1 to 5
Impact -5 to 5
Risk Likelihood 1 to 5
Impact -5 to 5
Risk Likelihood 1 to 5
Impact -5 to 5
Risk
Landscape character and features
Hotter drier summers
Land use change as a result of changing climatic conditions.
Increased drought conditions may result in a reduction of extensive grazing or arable cropping.
2 -3 -6 3 -3 -9 4 -3 -12 Management Plan Outcome & Policy 1: Conserving and enhancing Landscape Character and resilience to climate change.
Management Plan & Local Plan Policy 2: Ecosystem Services.
Reversion to natural grasslands or other land use change may introduce new patterns into the landscape.
3 -3 -9 4 -3 -12 4 -4 -16
Increased woodland planting or cover will have an impact on the visual character and pattern of the landscape. This could impact on wide open or expansive views from the chalk scarp.
3 -3 -9 4 -3 -12 4 -4 -16 Management Plan Outcome & Policy 1: Conserving and enhancing Landscape Character and resilience to climate change.
Management Plan Policy 4 & 19: Habitat connectivity, woodland creation with resilient species.
Local Plan Strategic Policy SD5 & SD7: Landscape Character and safeguarding views.
Large scale designed landscapes and parkland that contribute to landscape character may see significant changes. Loss of veteran or landscape trees.
3 -3 -9 4 -3 -12 4 -4 -16
Warmer wetter winters
Land use change as a result of changing climatic conditions.
Changes in the variety and contrast of the landscape from changed agricultural practices in response to an extended growing season.
2 -3 -6 3 -3 -9 4 -3 -12 Management Plan Outcome & Policy 1: Conserving and enhancing Landscape Character and resilience to climate change.
Local Plan Strategic Policy SD5 & SD7: Landscape Character and safeguarding views.
Seasonal changes and new variation in colours and textures within the landscape may affect its visual character.
2 -3 -6 3 -3 -9 4 -3 -12 Management Plan Outcome & Policy 1: Conserving and enhancing Landscape Character and resilience to climate change.
Land management responses to climate change impacts.
Increase in cultivated area and removal of field boundary features (D)
Impact upon historic landscape character and biodiversity. Loss of field patterns and historic boundary features.
3 -3 -9 4 -3 -12 4 -4 -16 Management Plan Outcome & Policy 1: Conserving and enhancing Landscape Character and resilience to climate change.
Local Plan Strategic Policy SD5 & SD7: Landscape Character and safeguarding views.
Greater intensification of agricultural practices and changes in land use patterns (ID)
Impacts upon the landscape character from changes in land management practices, reduced grazing or intensification.
4 -3 -12 4 -4 -16 4 -5 -20 Management Plan Policy 12 & 13: Support for profitable livestock farming and grazing. Sustainable farming and diversification.
Local Plan Strategic Policy SD27 & SD47: Sustaining the rural economy and farm diversification.
Changes in levels of grazing due to climatic or socio-economic factors will have an impact on landscape character.
3 -3 -9 4 -3 -12 4 -4 -16
Landscape (continued)
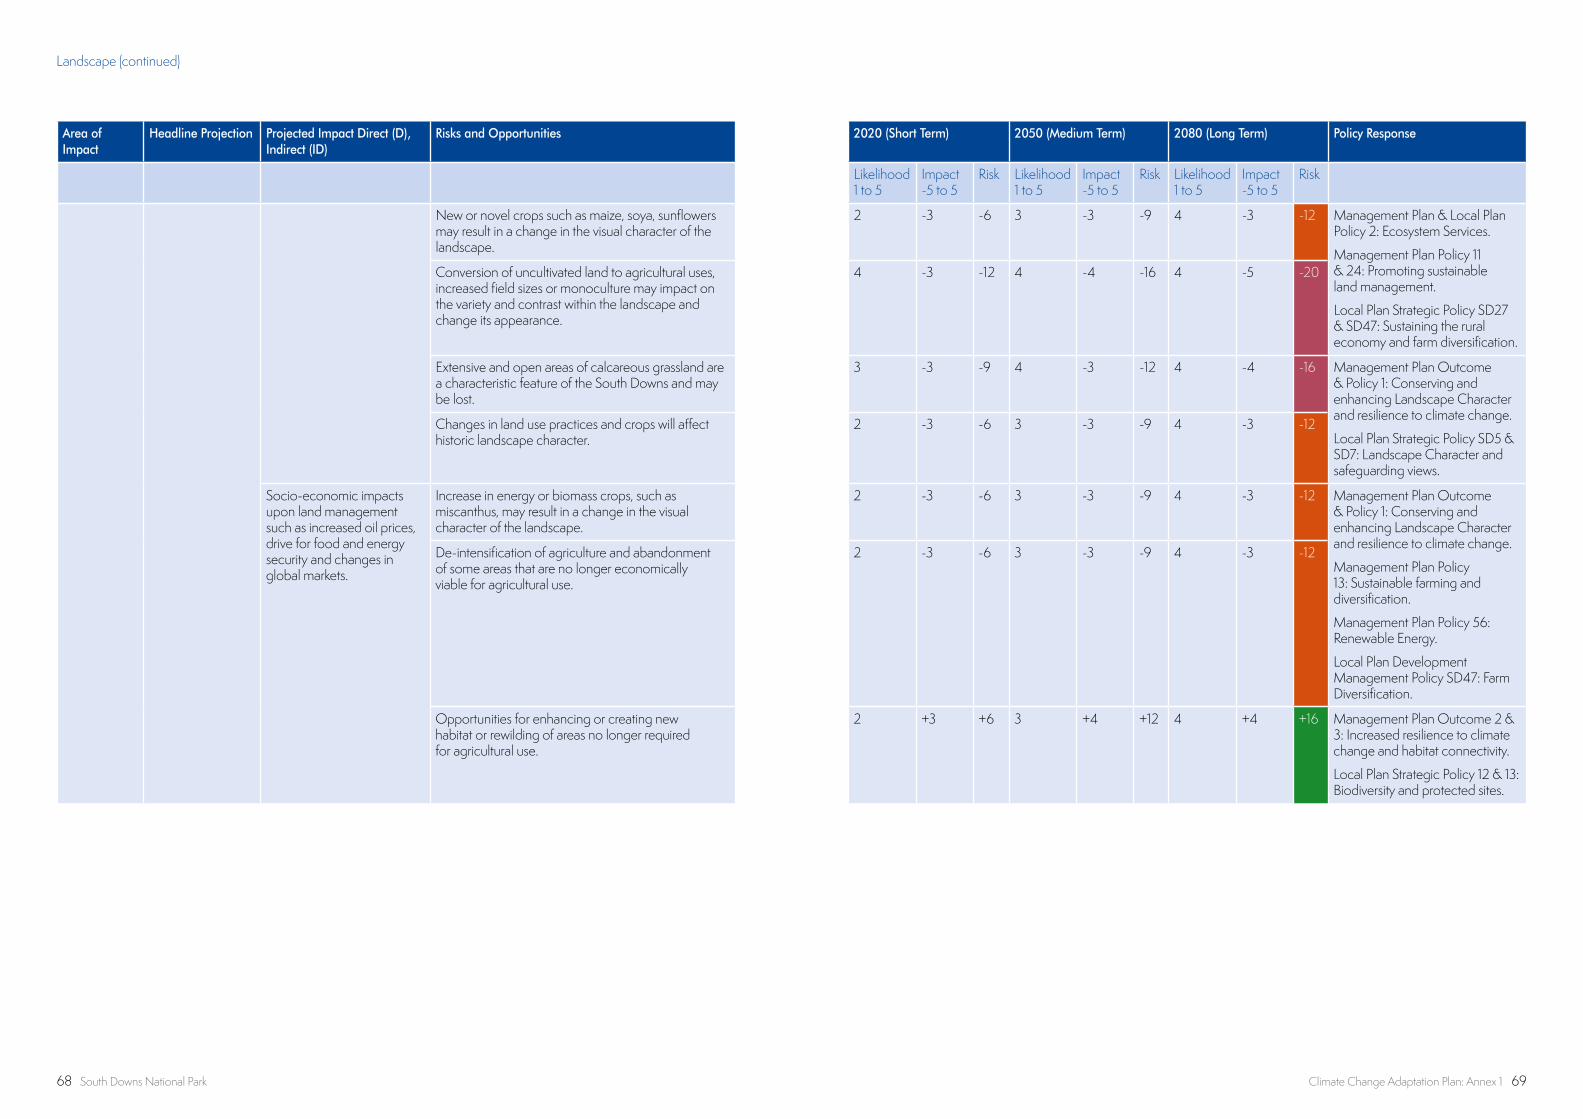
68 South Downs National Park Climate Change Adaptation Plan: Annex 1 69
Area of Impact
Headline Projection Projected Impact Direct (D), Indirect (ID)
Risks and Opportunities 2020 (Short Term) 2050 (Medium Term) 2080 (Long Term) Policy Response
Likelihood 1 to 5
Impact -5 to 5
Risk Likelihood 1 to 5
Impact -5 to 5
Risk Likelihood 1 to 5
Impact -5 to 5
Risk
New or novel crops such as maize, soya, sunflowers may result in a change in the visual character of the landscape.
2 -3 -6 3 -3 -9 4 -3 -12 Management Plan & Local Plan Policy 2: Ecosystem Services.
Management Plan Policy 11 & 24: Promoting sustainable land management.
Local Plan Strategic Policy SD27 & SD47: Sustaining the rural economy and farm diversification.
Conversion of uncultivated land to agricultural uses, increased field sizes or monoculture may impact on the variety and contrast within the landscape and change its appearance.
4 -3 -12 4 -4 -16 4 -5 -20
Extensive and open areas of calcareous grassland are a characteristic feature of the South Downs and may be lost.
3 -3 -9 4 -3 -12 4 -4 -16 Management Plan Outcome & Policy 1: Conserving and enhancing Landscape Character and resilience to climate change.
Local Plan Strategic Policy SD5 & SD7: Landscape Character and safeguarding views.
Changes in land use practices and crops will affect historic landscape character.
2 -3 -6 3 -3 -9 4 -3 -12
Socio-economic impacts upon land management such as increased oil prices, drive for food and energy security and changes in global markets.
Increase in energy or biomass crops, such as miscanthus, may result in a change in the visual character of the landscape.
2 -3 -6 3 -3 -9 4 -3 -12 Management Plan Outcome & Policy 1: Conserving and enhancing Landscape Character and resilience to climate change.
Management Plan Policy 13: Sustainable farming and diversification.
Management Plan Policy 56: Renewable Energy.
Local Plan Development Management Policy SD47: Farm Diversification.
De-intensification of agriculture and abandonment of some areas that are no longer economically viable for agricultural use.
2 -3 -6 3 -3 -9 4 -3 -12
Opportunities for enhancing or creating new habitat or rewilding of areas no longer required for agricultural use.
2 +3 +6 3 +4 +12 4 +4 +16 Management Plan Outcome 2 & 3: Increased resilience to climate change and habitat connectivity.
Local Plan Strategic Policy 12 & 13: Biodiversity and protected sites.
Landscape (continued)
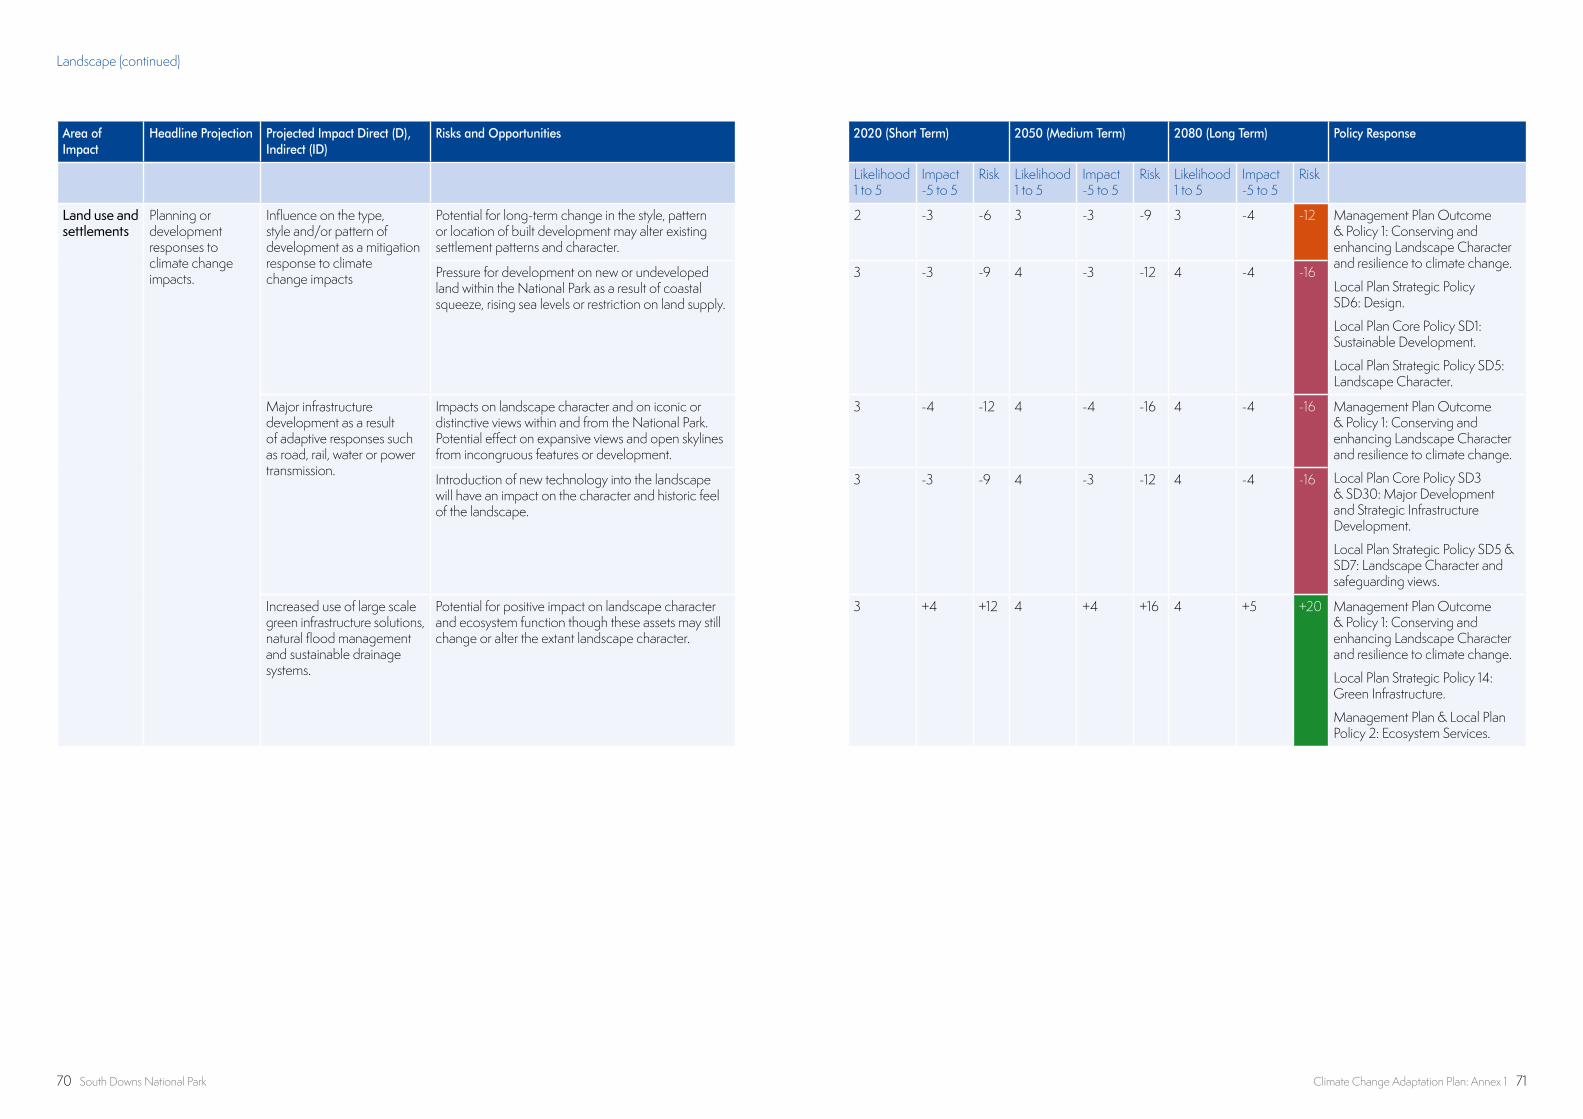
70 South Downs National Park Climate Change Adaptation Plan: Annex 1 71
Area of Impact
Headline Projection Projected Impact Direct (D), Indirect (ID)
Risks and Opportunities 2020 (Short Term) 2050 (Medium Term) 2080 (Long Term) Policy Response
Likelihood 1 to 5
Impact -5 to 5
Risk Likelihood 1 to 5
Impact -5 to 5
Risk Likelihood 1 to 5
Impact -5 to 5
Risk
Land use and settlements
Planning or development responses to climate change impacts.
Influence on the type, style and/or pattern of development as a mitigation response to climate change impacts
Potential for long-term change in the style, pattern or location of built development may alter existing settlement patterns and character.
2 -3 -6 3 -3 -9 3 -4 -12 Management Plan Outcome & Policy 1: Conserving and enhancing Landscape Character and resilience to climate change.
Local Plan Strategic Policy SD6: Design.
Local Plan Core Policy SD1: Sustainable Development.
Local Plan Strategic Policy SD5: Landscape Character.
Pressure for development on new or undeveloped land within the National Park as a result of coastal squeeze, rising sea levels or restriction on land supply.
3 -3 -9 4 -3 -12 4 -4 -16
Major infrastructure development as a result of adaptive responses such as road, rail, water or power transmission.
Impacts on landscape character and on iconic or distinctive views within and from the National Park. Potential effect on expansive views and open skylines from incongruous features or development.
3 -4 -12 4 -4 -16 4 -4 -16 Management Plan Outcome & Policy 1: Conserving and enhancing Landscape Character and resilience to climate change.
Local Plan Core Policy SD3 & SD30: Major Development and Strategic Infrastructure Development.
Local Plan Strategic Policy SD5 & SD7: Landscape Character and safeguarding views.
Introduction of new technology into the landscape will have an impact on the character and historic feel of the landscape.
3 -3 -9 4 -3 -12 4 -4 -16
Increased use of large scale green infrastructure solutions, natural flood management and sustainable drainage systems.
Potential for positive impact on landscape character and ecosystem function though these assets may still change or alter the extant landscape character.
3 +4 +12 4 +4 +16 4 +5 +20 Management Plan Outcome & Policy 1: Conserving and enhancing Landscape Character and resilience to climate change.
Local Plan Strategic Policy 14: Green Infrastructure.
Management Plan & Local Plan Policy 2: Ecosystem Services.
Landscape (continued)

72 South Downs National Park Climate Change Adaptation Plan: Annex 1 73
Area of Impact
Headline Projection
Projected Impact Direct (D), Indirect (ID)
Risks and Opportunities 2020 (Short Term) 2050 (Medium Term) 2080 (Long Term) Policy Response
Likelihood 1 to 5
Impact -5 to 5
Risk Likelihood 1 to 5
Impact -5 to 5
Risk Likelihood 1 to 5
Impact -5 to 5
Risk
Historic buildings & settlements
Hotter drier summers
Key historic assets may be vulnerable to damage (D)
Historic buildings may be at an increased fire risk due to seasonal changes in climatic conditions.
2 -4 -8 3 -4 -12 3 -4 -12 Local Plan Strategic Policy SD31: Climate Change and Sustainable Construction.
Local Plan Strategic Policy SD11: Historic Environment.
Development Management Policy SD38: Energy Performance and Historic Buildings.
Increase in pressure for building adaptation and alterations e.g. air conditioning that may be unsympathetic to their built character.
2 -3 -6 3 -3 -9 3 -3 -9
Impact and potential damage to historic building materials and contents from increased ultra-violet radiation.
2 -3 -6 3 -3 -9 3 -3 -9
Warmer wetter winters
Key historic assets may be vulnerable to damage (D)
Historic buildings may become more susceptible to decay and damage from damp and higher humidity.
2 -3 -6 3 -3 -9 4 -3 -12 Local Plan Strategic Policy SD31: Climate Change and Sustainable Construction.
Management Plan Policy 9 & 10: Protection of the historic environment and management of heritage assets.
Local Plan Strategic Policy SD11: Historic Environment.
Development Management Policy SD38: Energy Performance and Historic Buildings.
Development Management Policy SD39: Conservation Areas.
Less weathering or damage to historic buildings from reduced occurrences of freeze/thawing.
2 +3 +6 3 +3 +9 4 +3 +12
Increased potential for building adaptation and alterations that are unsympathetic to the character e.g. double/triple glazing, exterior cladding and external alterations.
2 -3 -6 3 -3 -9 4 -3 -12
Historic buildings may have inadequate guttering or on site drainage resulting in water ingress and structural damage.
3 -2 -6 3 -3 -9 3 -3 -9
Increase in interior dampness and exposure to mould and environmental problems caused by poorer indoor air quality.
2 -3 -6 3 -3 -9 3 -4 -12
Increase risk in infestation from wood boring beetles and other pest species that can damage or destroy the fabric of historic buildings.
2 -3 -6 3 -3 -9 3 -4 -12
Increased seasonal rainfall
Cultural Heritage assets may be impacted by increased rain fall or flooding.
Damage and deterioration of heritage assets caused by flooding or waterlogging.
3 -3 -9 3 -4 -12 4 -4 -16 Management Plan Policy 9 & 10: Protection of the historic environment and management of heritage assets.
Local Plan Strategic Policy SD11: Historic Environment.
Increase in incidence and severity of seasonal storm events
Damage to historic buildings caused by severe weather conditions.
Damage and deterioration of the protective building envelope caused by more severe weather conditions.
2 -3 -6 3 -3 -9 3 -4 -12
Archaeology Hotter drier summers
Reduction in soil moisture content
Impact upon the integrity of buried archaeology particularly where there may be waterlogged features that are best preserved in situ.
2 -3 -6 3 -3 -9 3 -4 -12 Management Plan & Local Plan Policy 2: Ecosystem Services.
Management Plan Policy 9 & 10: Protection of the historic environment and management of heritage assets.
Local Plan Strategic Policy SD11: Historic Environment.
Development Management Policy SD41: Archaeology.
Warmer wetter winters
Changes in preservation conditions caused by higher humidity and soil moisture and PH during the autumn/winter.
2 -3 -6 3 -3 -9 3 -4 -12
Increased seasonal rainfall
Rising water table as a result of higher seasonal rainfall events.
Changes in preservation conditions caused by fluctuations in the water table may damage archaeological sites or evidence.
3 -3 -9 3 -4 -12 4 -4 -16
Increase in incidence and severity of seasonal storm events
Damage to buried archaeology from waterlogging or increased soil erosion from run-off exposing sites or damaging stratigraphy, artefacts or evidence.
3 -3 -9 3 -4 -12 4 -4 -16
Historic Environment – Historic buildings, historic assets, archaeology and historic landscapes.
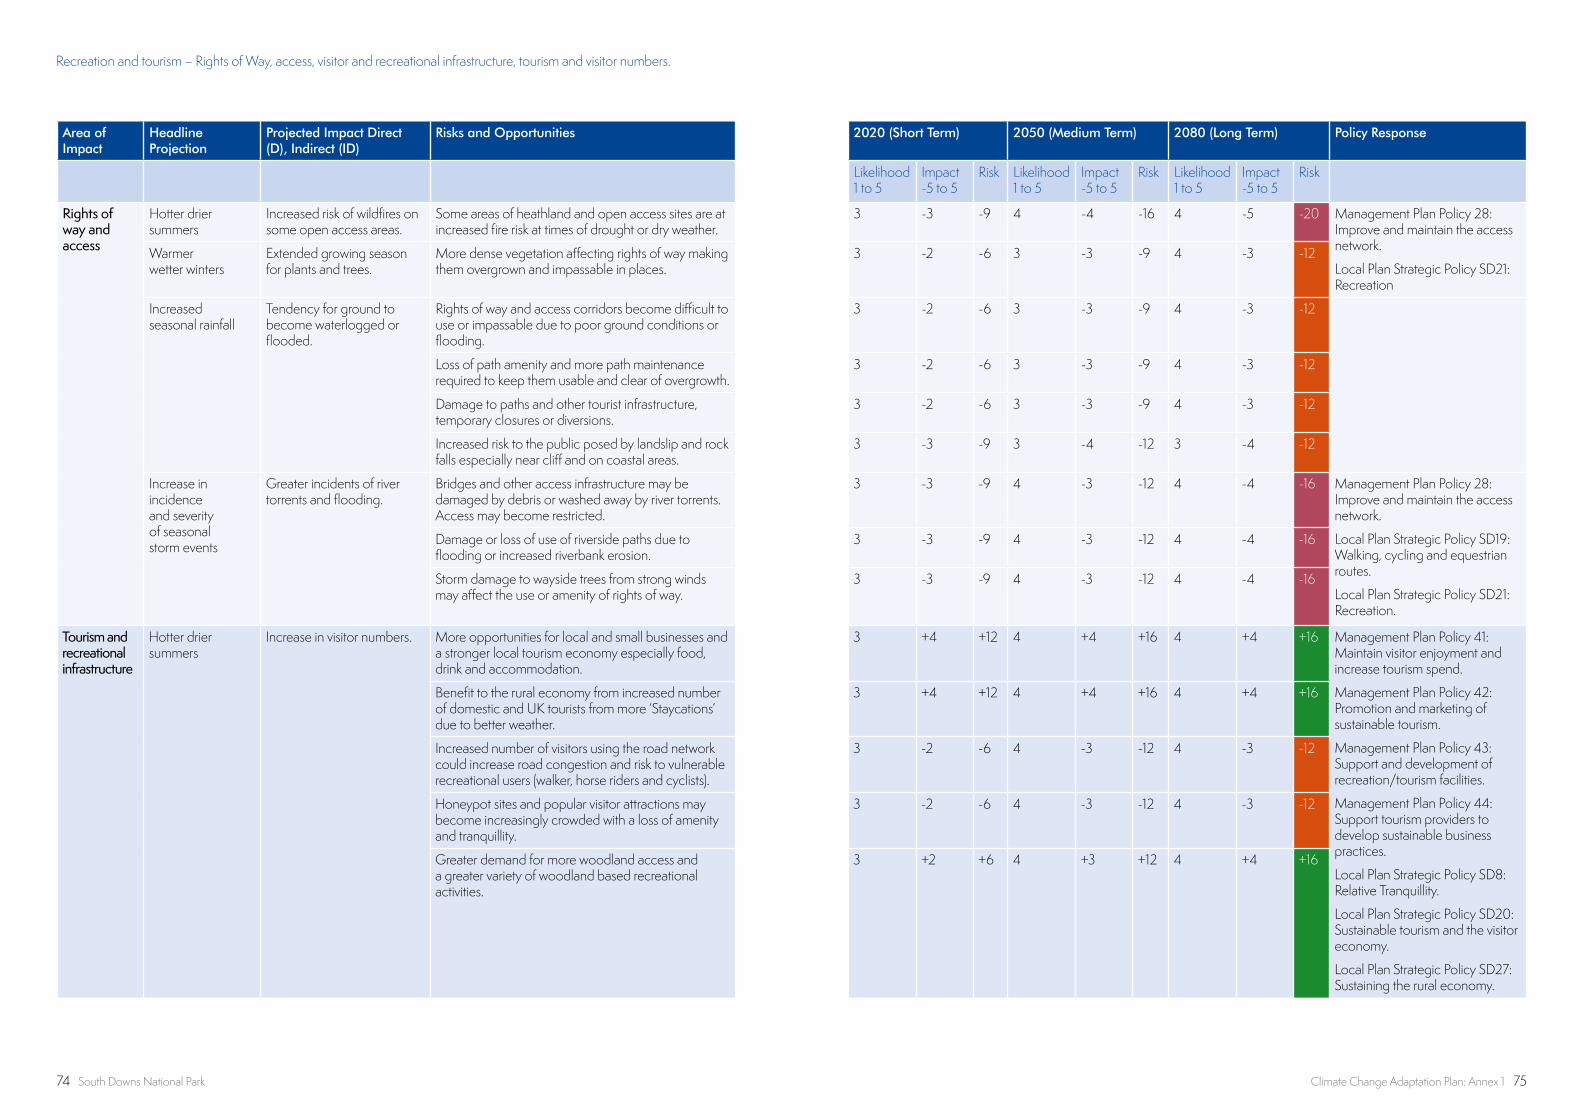
74 South Downs National Park Climate Change Adaptation Plan: Annex 1 75
Area of Impact
Headline Projection
Projected Impact Direct (D), Indirect (ID)
Risks and Opportunities 2020 (Short Term) 2050 (Medium Term) 2080 (Long Term) Policy Response
Likelihood 1 to 5
Impact -5 to 5
Risk Likelihood 1 to 5
Impact -5 to 5
Risk Likelihood 1 to 5
Impact -5 to 5
Risk
Rights of way and access
Hotter drier summers
Increased risk of wildfires on some open access areas.
Some areas of heathland and open access sites are at increased fire risk at times of drought or dry weather.
3 -3 -9 4 -4 -16 4 -5 -20 Management Plan Policy 28: Improve and maintain the access network.
Local Plan Strategic Policy SD21: Recreation
Warmer wetter winters
Extended growing season for plants and trees.
More dense vegetation affecting rights of way making them overgrown and impassable in places.
3 -2 -6 3 -3 -9 4 -3 -12
Increased seasonal rainfall
Tendency for ground to become waterlogged or flooded.
Rights of way and access corridors become difficult to use or impassable due to poor ground conditions or flooding.
3 -2 -6 3 -3 -9 4 -3 -12
Loss of path amenity and more path maintenance required to keep them usable and clear of overgrowth.
3 -2 -6 3 -3 -9 4 -3 -12
Damage to paths and other tourist infrastructure, temporary closures or diversions.
3 -2 -6 3 -3 -9 4 -3 -12
Increased risk to the public posed by landslip and rock falls especially near cliff and on coastal areas.
3 -3 -9 3 -4 -12 3 -4 -12
Increase in incidence and severity of seasonal storm events
Greater incidents of river torrents and flooding.
Bridges and other access infrastructure may be damaged by debris or washed away by river torrents. Access may become restricted.
3 -3 -9 4 -3 -12 4 -4 -16 Management Plan Policy 28: Improve and maintain the access network.
Local Plan Strategic Policy SD19: Walking, cycling and equestrian routes.
Local Plan Strategic Policy SD21: Recreation.
Damage or loss of use of riverside paths due to flooding or increased riverbank erosion.
3 -3 -9 4 -3 -12 4 -4 -16
Storm damage to wayside trees from strong winds may affect the use or amenity of rights of way.
3 -3 -9 4 -3 -12 4 -4 -16
Tourism and recreational infrastructure
Hotter drier summers
Increase in visitor numbers. More opportunities for local and small businesses and a stronger local tourism economy especially food, drink and accommodation.
3 +4 +12 4 +4 +16 4 +4 +16 Management Plan Policy 41: Maintain visitor enjoyment and increase tourism spend.
Management Plan Policy 42: Promotion and marketing of sustainable tourism.
Management Plan Policy 43: Support and development of recreation/tourism facilities.
Management Plan Policy 44: Support tourism providers to develop sustainable business practices.
Local Plan Strategic Policy SD8: Relative Tranquillity.
Local Plan Strategic Policy SD20: Sustainable tourism and the visitor economy.
Local Plan Strategic Policy SD27: Sustaining the rural economy.
Benefit to the rural economy from increased number of domestic and UK tourists from more ‘Staycations’ due to better weather.
3 +4 +12 4 +4 +16 4 +4 +16
Increased number of visitors using the road network could increase road congestion and risk to vulnerable recreational users (walker, horse riders and cyclists).
3 -2 -6 4 -3 -12 4 -3 -12
Honeypot sites and popular visitor attractions may become increasingly crowded with a loss of amenity and tranquillity.
3 -2 -6 4 -3 -12 4 -3 -12
Greater demand for more woodland access and a greater variety of woodland based recreational activities.
3 +2 +6 4 +3 +12 4 +4 +16
Recreation and tourism – Rights of Way, access, visitor and recreational infrastructure, tourism and visitor numbers.
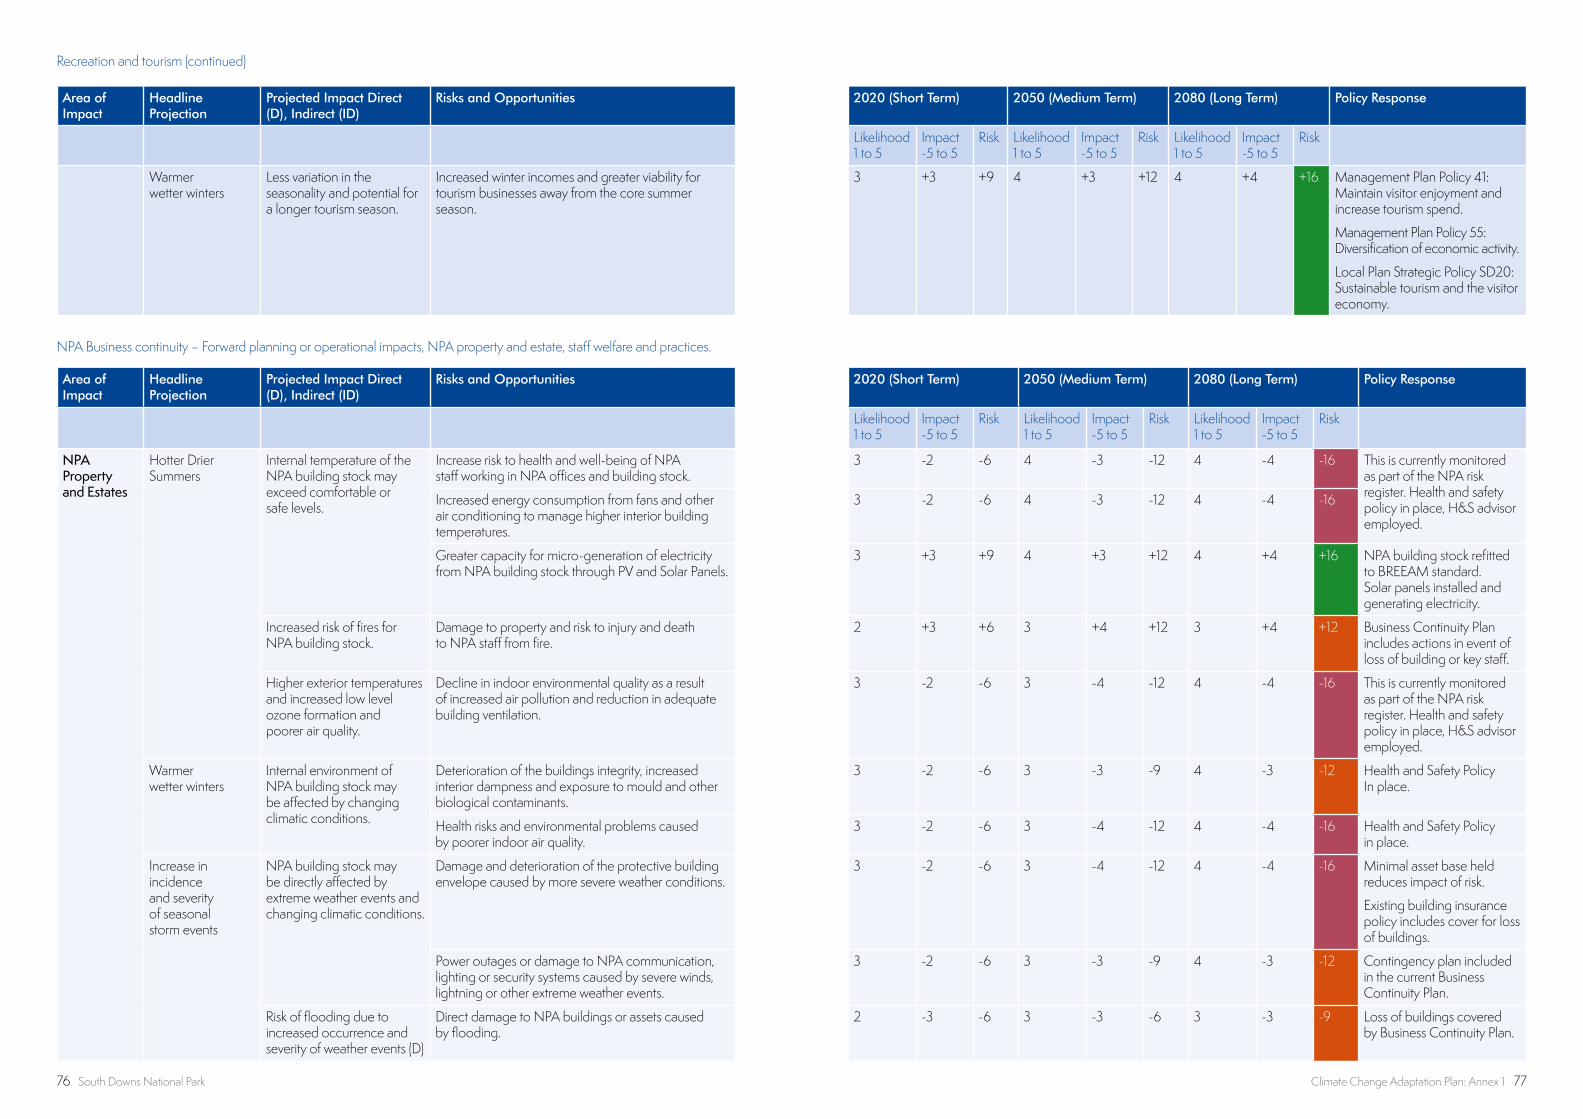
76 South Downs National Park Climate Change Adaptation Plan: Annex 1 77
Area of Impact
Headline Projection
Projected Impact Direct (D), Indirect (ID)
Risks and Opportunities 2020 (Short Term) 2050 (Medium Term) 2080 (Long Term) Policy Response
Likelihood 1 to 5
Impact -5 to 5
Risk Likelihood 1 to 5
Impact -5 to 5
Risk Likelihood 1 to 5
Impact -5 to 5
Risk
NPA Property and Estates
Hotter Drier Summers
Internal temperature of the NPA building stock may exceed comfortable or safe levels.
Increase risk to health and well-being of NPA staff working in NPA offices and building stock.
3 -2 -6 4 -3 -12 4 -4 -16 This is currently monitored as part of the NPA risk register. Health and safety policy in place, H&S advisor employed.
Increased energy consumption from fans and other air conditioning to manage higher interior building temperatures.
3 -2 -6 4 -3 -12 4 -4 -16
Greater capacity for micro-generation of electricity from NPA building stock through PV and Solar Panels.
3 +3 +9 4 +3 +12 4 +4 +16 NPA building stock refitted to BREEAM standard. Solar panels installed and generating electricity.
Increased risk of fires for NPA building stock.
Damage to property and risk to injury and death to NPA staff from fire.
2 +3 +6 3 +4 +12 3 +4 +12 Business Continuity Plan includes actions in event of loss of building or key staff.
Higher exterior temperatures and increased low level ozone formation and poorer air quality.
Decline in indoor environmental quality as a result of increased air pollution and reduction in adequate building ventilation.
3 -2 -6 3 -4 -12 4 -4 -16 This is currently monitored as part of the NPA risk register. Health and safety policy in place, H&S advisor employed.
Warmer wetter winters
Internal environment of NPA building stock may be affected by changing climatic conditions.
Deterioration of the buildings integrity, increased interior dampness and exposure to mould and other biological contaminants.
3 -2 -6 3 -3 -9 4 -3 -12 Health and Safety Policy In place.
Health risks and environmental problems caused by poorer indoor air quality.
3 -2 -6 3 -4 -12 4 -4 -16 Health and Safety Policy in place.
Increase in incidence and severity of seasonal storm events
NPA building stock may be directly affected by extreme weather events and changing climatic conditions.
Damage and deterioration of the protective building envelope caused by more severe weather conditions.
3 -2 -6 3 -4 -12 4 -4 -16 Minimal asset base held reduces impact of risk.
Existing building insurance policy includes cover for loss of buildings.
Power outages or damage to NPA communication, lighting or security systems caused by severe winds, lightning or other extreme weather events.
3 -2 -6 3 -3 -9 4 -3 -12 Contingency plan included in the current Business Continuity Plan.
Risk of flooding due to increased occurrence and severity of weather events (D)
Direct damage to NPA buildings or assets caused by flooding.
2 -3 -6 3 -3 -6 3 -3 -9 Loss of buildings covered by Business Continuity Plan.
Area of Impact
Headline Projection
Projected Impact Direct (D), Indirect (ID)
Risks and Opportunities 2020 (Short Term) 2050 (Medium Term) 2080 (Long Term) Policy Response
Likelihood 1 to 5
Impact -5 to 5
Risk Likelihood 1 to 5
Impact -5 to 5
Risk Likelihood 1 to 5
Impact -5 to 5
Risk
Warmer wetter winters
Less variation in the seasonality and potential for a longer tourism season.
Increased winter incomes and greater viability for tourism businesses away from the core summer season.
3 +3 +9 4 +3 +12 4 +4 +16 Management Plan Policy 41: Maintain visitor enjoyment and increase tourism spend.
Management Plan Policy 55: Diversification of economic activity.
Local Plan Strategic Policy SD20: Sustainable tourism and the visitor economy.
Recreation and tourism (continued)
NPA Business continuity – Forward planning or operational impacts, NPA property and estate, staff welfare and practices.
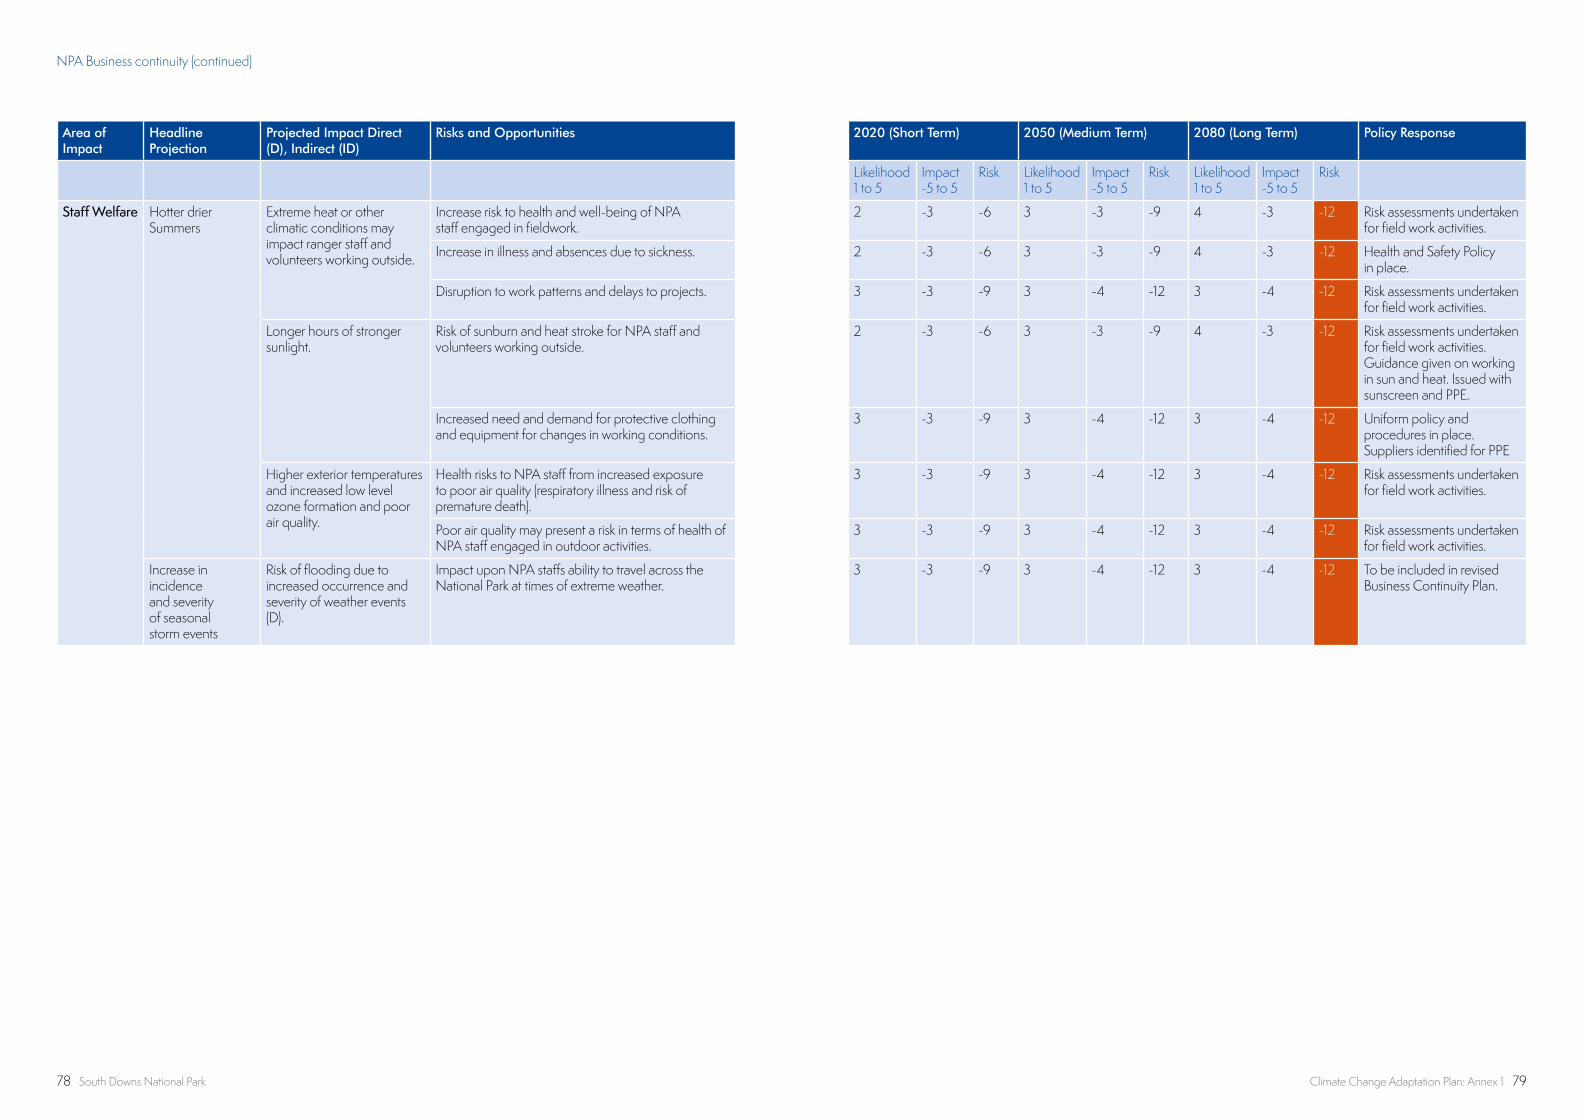
78 South Downs National Park Climate Change Adaptation Plan: Annex 1 79
Area of Impact
Headline Projection
Projected Impact Direct (D), Indirect (ID)
Risks and Opportunities 2020 (Short Term) 2050 (Medium Term) 2080 (Long Term) Policy Response
Likelihood 1 to 5
Impact -5 to 5
Risk Likelihood 1 to 5
Impact -5 to 5
Risk Likelihood 1 to 5
Impact -5 to 5
Risk
Staff Welfare Hotter drier Summers
Extreme heat or other climatic conditions may impact ranger staff and volunteers working outside.
Increase risk to health and well-being of NPA staff engaged in fieldwork.
2 -3 -6 3 -3 -9 4 -3 -12 Risk assessments undertaken for field work activities.
Increase in illness and absences due to sickness. 2 -3 -6 3 -3 -9 4 -3 -12 Health and Safety Policy in place.
Disruption to work patterns and delays to projects. 3 -3 -9 3 -4 -12 3 -4 -12 Risk assessments undertaken for field work activities.
Longer hours of stronger sunlight.
Risk of sunburn and heat stroke for NPA staff and volunteers working outside.
2 -3 -6 3 -3 -9 4 -3 -12 Risk assessments undertaken for field work activities. Guidance given on working in sun and heat. Issued with sunscreen and PPE.
Increased need and demand for protective clothing and equipment for changes in working conditions.
3 -3 -9 3 -4 -12 3 -4 -12 Uniform policy and procedures in place. Suppliers identified for PPE
Higher exterior temperatures and increased low level ozone formation and poor air quality.
Health risks to NPA staff from increased exposure to poor air quality (respiratory illness and risk of premature death).
3 -3 -9 3 -4 -12 3 -4 -12 Risk assessments undertaken for field work activities.
Poor air quality may present a risk in terms of health of NPA staff engaged in outdoor activities.
3 -3 -9 3 -4 -12 3 -4 -12 Risk assessments undertaken for field work activities.
Increase in incidence and severity of seasonal storm events
Risk of flooding due to increased occurrence and severity of weather events (D).
Impact upon NPA staffs ability to travel across the National Park at times of extreme weather.
3 -3 -9 3 -4 -12 3 -4 -12 To be included in revised Business Continuity Plan.
NPA Business continuity (continued)

80 South Downs National Park Climate Change Adaptation Plan: Annex 1 81
ANNEX 3 – CLIMATE CHANGE ACTION PLANBuilt Environment
Area of Impact
Projected risk or opportunity
Ambition/ Planned Action
Lead Partner/Partnership
Planned Timeframe
Built Environment
n Commercial and residential properties are at an increased risk of flooding.n Opportunities around the design and installation of Sustainable Urban Drainage (SUD) and schemes to improve the permeability of urban surfaces.n Additional opportunity for new design codes or sustainable building requirements for better housing design to meet challenges.n Impact on community resilience and increased risks for some vulnerable groups.n Fragmentation of responsibility for flood management makes an integrated approach difficult.
Discourage development within floodplains and areas that will become prone to flooding. Seek to influence flood management schemes so that they facilitate natural functions and deliver a wide range of Ecosystem Service benefits.
Develop catchment level approaches and Natural Flood management techniques have potential to deliver enhanced flood storage and manage rates of run-off.
Encourage naturally functioning floodplains and sustainable urban drainage schemes that plan for the potential changes in flooding as a result of climate change.
Promote the role for Green Infrastructure (GI) and Sustainable Urban Drainage Schemes (SUDS) to enhance the resilience of urban areas. Increased permeability of urban surfaces and use of rain gardens will help improve storage and infiltration. Encourage long-term management and integration with wider catchment level approaches.
SDNPA, Local Authority Partners, Environment Agency, Developers
Current Management Plan and Local Plan cycle.Carry Forward into next Management Plan cycle 2019 – 2024
Area of Impact
Projected risk or opportunity
Ambition/ Planned Action
Lead Partner/Partnership
Planned Timeframe
Develop design codes that result in more sustainable building and schemes, with the best design, layout and materials to make them resilient to climate change. Incorporate passive solar gain, PV, landscaping, grey water storage and other features.
Encourage an increase in urban trees to provide ecosystem service benefits within towns and villages. Promote the value of trees, parks and other Green Infrastructure.
Encourage the creation of new habitat and wet woodland along streams and rivers to enhance connectivity, flood storage, help reduce run-off and diffuse pollution.
Air Quality n Opportunity to increase resilience of communities through greater use of green infrastructure within urban settlements.n Higher temperatures and weaker air circulation leads to increased low level ozone formation and poorer air quality.n Potential lengthening of the ozone ‘season’ and concentration of ground level ozone, particulates and other air pollutants. n Increased exposure to poor air quality for residents and vulnerable groups causing impacts on public health (respiratory illness and risk of premature death).
Work to develop a Green Infrastructure (GI) framework for the National Park with partner planning authorities. Highlight areas for GI investment in and around the National Park.
Promote green corridors, high quality green spaces and street trees within the urban environment to improve capacity for regulating air quality, providing shade and helping to manage the ‘urban heat island’ effect at a local level.
Tree planting in appropriate locations to help regulate localised air quality and provide wider ecosystem service benefits for people and nature.
SDNPA, Local Authority Partners, Environment Agency, Developers
Current Management Plan and Local Plan cycle.Carry Forward into next Management Plan cycle 2019 – 2024
Public Water Supply
n Increase in the incidence and severity of drought conditions could lead to water shortages.n Opportunity to influence water company’s forward plans and to actively promote sustainable patterns of water use across the sectors.
Opportunity to influence water company’s forward plans and to actively promote sustainable patterns of water use across the sectors.
Work with water companies to promote water efficiency measures and technologies for the public in and around the National Park.
SDNPA, Water Companies, Parish Councils and Community Groups.
Water Company resource Planning Round (2019 onwards)
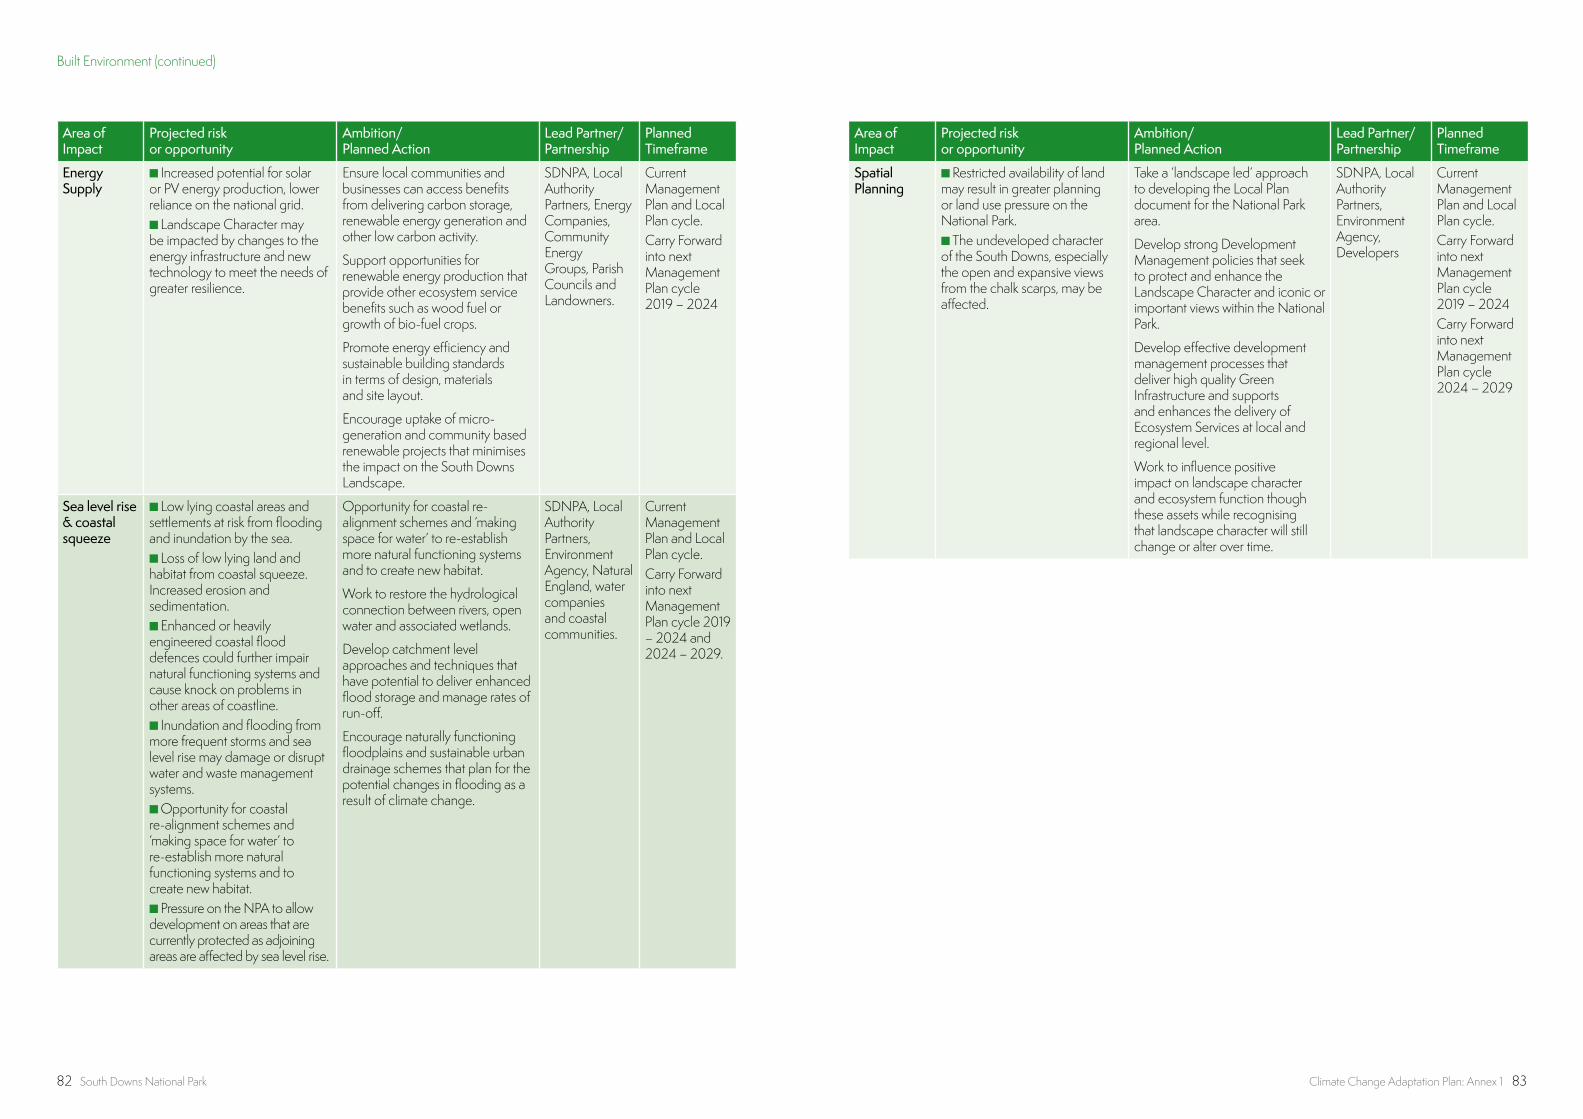
82 South Downs National Park Climate Change Adaptation Plan: Annex 1 83
Area of Impact
Projected risk or opportunity
Ambition/ Planned Action
Lead Partner/Partnership
Planned Timeframe
Energy Supply
n Increased potential for solar or PV energy production, lower reliance on the national grid.n Landscape Character may be impacted by changes to the energy infrastructure and new technology to meet the needs of greater resilience.
Ensure local communities and businesses can access benefits from delivering carbon storage, renewable energy generation and other low carbon activity.
Support opportunities for renewable energy production that provide other ecosystem service benefits such as wood fuel or growth of bio-fuel crops.
Promote energy efficiency and sustainable building standards in terms of design, materials and site layout.
Encourage uptake of micro-generation and community based renewable projects that minimises the impact on the South Downs Landscape.
SDNPA, Local Authority Partners, Energy Companies, Community Energy Groups, Parish Councils and Landowners.
Current Management Plan and Local Plan cycle.Carry Forward into next Management Plan cycle 2019 – 2024
Sea level rise & coastal squeeze
n Low lying coastal areas and settlements at risk from flooding and inundation by the sea.n Loss of low lying land and habitat from coastal squeeze. Increased erosion and sedimentation.n Enhanced or heavily engineered coastal flood defences could further impair natural functioning systems and cause knock on problems in other areas of coastline.n Inundation and flooding from more frequent storms and sea level rise may damage or disrupt water and waste management systems.n Opportunity for coastal re-alignment schemes and ‘making space for water’ to re-establish more natural functioning systems and to create new habitat.n Pressure on the NPA to allow development on areas that are currently protected as adjoining areas are affected by sea level rise.
Opportunity for coastal re-alignment schemes and ‘making space for water’ to re-establish more natural functioning systems and to create new habitat.
Work to restore the hydrological connection between rivers, open water and associated wetlands.
Develop catchment level approaches and techniques that have potential to deliver enhanced flood storage and manage rates of run-off.
Encourage naturally functioning floodplains and sustainable urban drainage schemes that plan for the potential changes in flooding as a result of climate change.
SDNPA, Local Authority Partners, Environment Agency, Natural England, water companies and coastal communities.
Current Management Plan and Local Plan cycle.Carry Forward into next Management Plan cycle 2019 – 2024 and 2024 – 2029.
Area of Impact
Projected risk or opportunity
Ambition/ Planned Action
Lead Partner/Partnership
Planned Timeframe
Spatial Planning
n Restricted availability of land may result in greater planning or land use pressure on the National Park.n The undeveloped character of the South Downs, especially the open and expansive views from the chalk scarps, may be affected.
Take a ‘landscape led’ approach to developing the Local Plan document for the National Park area.
Develop strong Development Management policies that seek to protect and enhance the Landscape Character and iconic or important views within the National Park.
Develop effective development management processes that deliver high quality Green Infrastructure and supports and enhances the delivery of Ecosystem Services at local and regional level.
Work to influence positive impact on landscape character and ecosystem function though these assets while recognising that landscape character will still change or alter over time.
SDNPA, Local Authority Partners, Environment Agency, Developers
Current Management Plan and Local Plan cycle.Carry Forward into next Management Plan cycle 2019 – 2024Carry Forward into next Management Plan cycle 2024 – 2029
Built Environment (continued)

84 South Downs National Park Climate Change Adaptation Plan: Annex 1 85
Area of Impact
Projected risk or opportunity
Ambition/ Planned Action
Lead Partner/Partnership
Planned Timeframe
Species Diversity
n Decline in overall species diversity. n Loss of habitats or species due to the contraction in extent of their range or from the change in climatic conditions.n Increase in range and extent
of invasive or pest species.
To increase understanding of climate change, and its impacts on the priority habitat and species within the South Downs National Park, and what can be done to adapt to changes. Consider the multi-functional benefits provided by habitats in decision making,
Undertake adaptive management and increase the genetic diversity and heterogeneity of key species on wildlife sites. Promote the collection and use of appropriate seed stock in habitat restoration or the creation of new habitat.
Increase habitat connectivity and the permeability of the landscape to wildlife. Undertake adaptive management and ensure that areas of valuable habitat are bigger, better managed and joined up. SDNPA to promote delivery at landscape scale.
Increase the quality and habitat diversity of wildlife sites. Deliver large scale habitat creation where opportunities exist, create buffer zones for vulnerable or fragmented habitats.
Develop a strategy for tackling invasive and non-native species. Work to reduce their impact and spread within the National Park.
SDNPA, Natural England, Wildlife Trust, Farmers and Landowners.
Current Management Plan and Local Plan cycle.Carry Forward into next Management Plan cycle 2019 – 2024
Natural Environment
Area of Impact
Projected risk or opportunity
Ambition/ Planned Action
Lead Partner/Partnership
Planned Timeframe
Woodland n Broadleaved and ancient woodland will see changes in species type and composition.n Changes in species and composition of woodland ground flora.n Loss of landscape trees that are more susceptible to increased temperatures or water stress e.g. beechn Damage and loss of landscape trees to disease and fungal bacteria e.g. ash, horse chestnut and beech.n Opportunity for other tree species to expand their range.n Loss and damage to mature trees and hedgerows by wind damage.n Increase in tree cover and related carbon sequestration and other ecosystem service benefits from new planting and more integrated management of catchments.
Research which species may be most impacted by changes in climatic conditions. Plan ahead in terms of planting species that may be more resilient to prevailing climatic conditions in the medium/long term.
Encourage and support appropriate woodland management with estates and woodland owners through working with woodland partners, developing Whole Estate Plans and other suitable delivery/funding mechanisms.
Identify the best carbon storage options for the National Park that provide the widest range of ecosystem service benefits.
Encourage best practice in terms of bio-security measures to prevent the spread of diseases and pests.
Increase woodland cover where the best opportunities exist and improve the management of existing woodlands. Create new wet woodland habitat along streams and rivers to enhance connectivity, flood storage, help reduce run-off and diffuse pollution.
Encourage the adoption of land, soils and habitat management practices that enhance the capacity for carbon storage within the National Park.
Encourage an increase in urban trees to provide ecosystem service benefits within towns and villages. Promote the value of trees, parks and other Green Infrastructure.
Forestry Commission, Forest Research, Natural England, Woodland Trust, Farmers and Landowners.
Current Management Plan and Local Plan cycle.Carry Forward into next Management Plan cycle 2019 – 2024 and 2024 – 2029.
Water – Aquifer recharge
n Lower levels of infiltration mean that the aquifer may become depleted at times of greater demand. n Problem may be exacerbated by an increased demand for abstraction during the summer months.
Opportunity to influence water company’s forward plans and to actively promote sustainable patterns of water use across the sectors.
Work with water companies to promote water efficiency measures for the public in and around the National Park.
SDNPA, Water Companies, Environment Agency, Parish Councils and Community Groups.
Water Company resource Planning Round (2019 onwards)
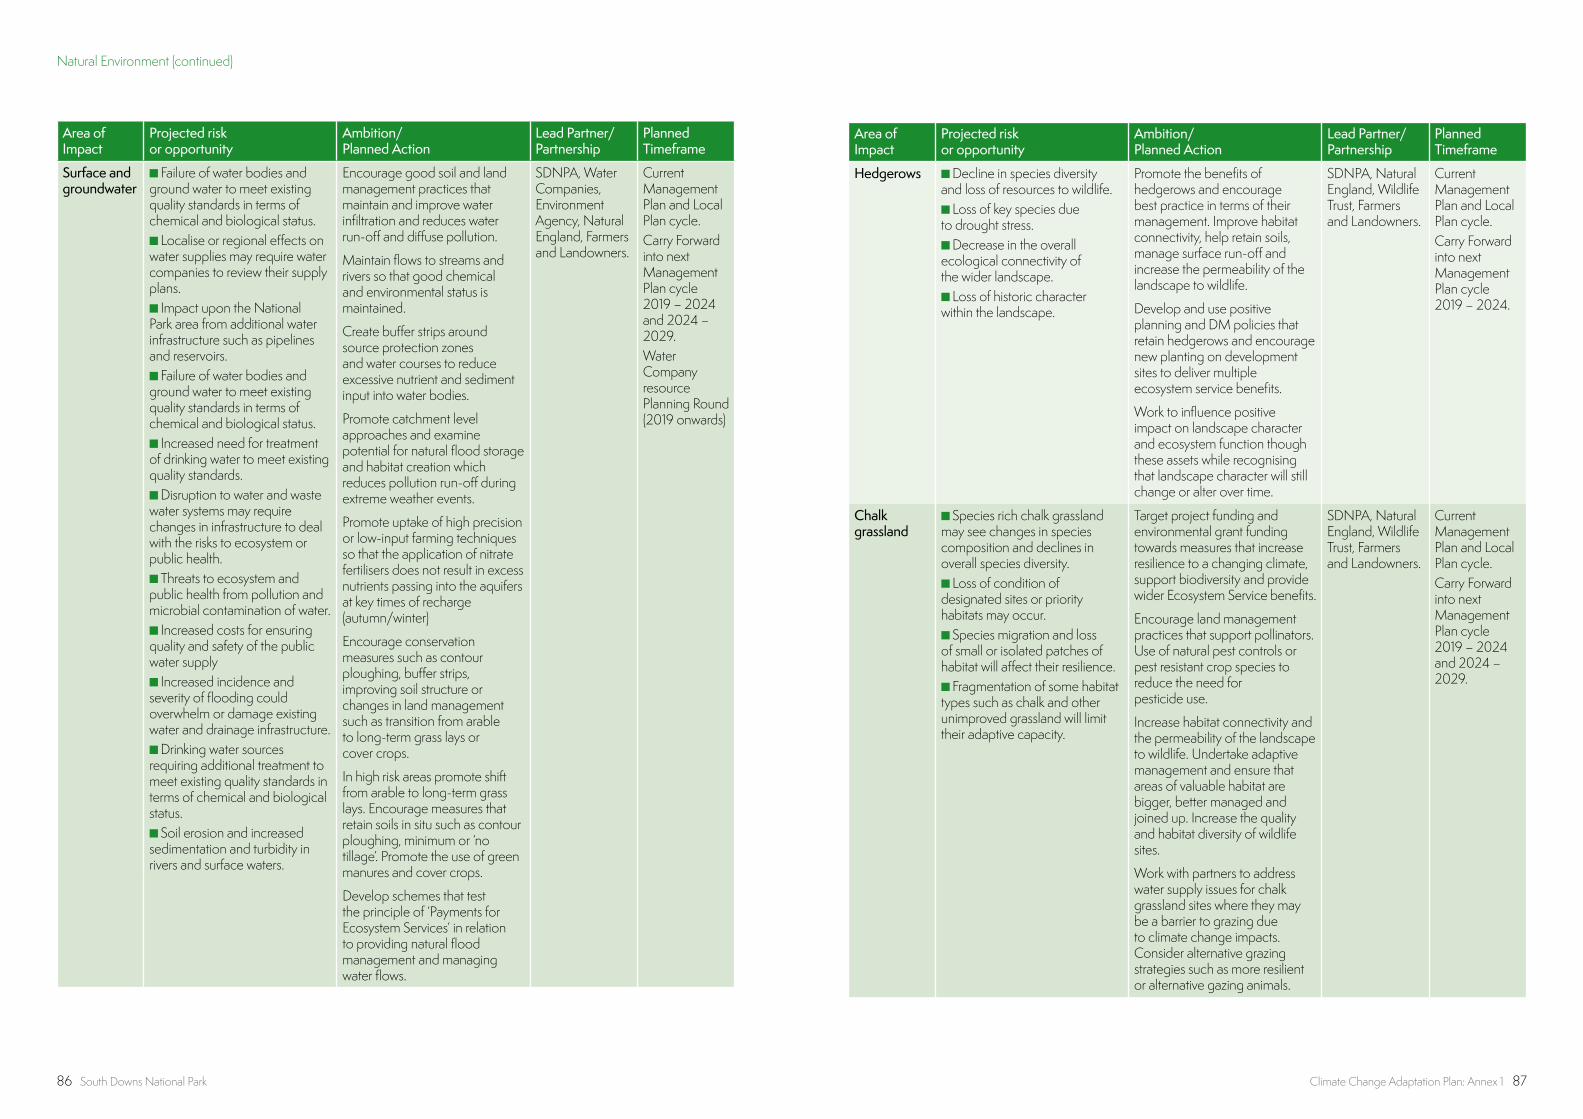
86 South Downs National Park Climate Change Adaptation Plan: Annex 1 87
Area of Impact
Projected risk or opportunity
Ambition/ Planned Action
Lead Partner/Partnership
Planned Timeframe
Surface and groundwater
n Failure of water bodies and ground water to meet existing quality standards in terms of chemical and biological status.n Localise or regional effects on water supplies may require water companies to review their supply plans.n Impact upon the National Park area from additional water infrastructure such as pipelines and reservoirs.n Failure of water bodies and ground water to meet existing quality standards in terms of chemical and biological status.n Increased need for treatment of drinking water to meet existing quality standards.n Disruption to water and waste water systems may require changes in infrastructure to deal with the risks to ecosystem or public health.n Threats to ecosystem and public health from pollution and microbial contamination of water.n Increased costs for ensuring quality and safety of the public water supplyn Increased incidence and severity of flooding could overwhelm or damage existing water and drainage infrastructure.n Drinking water sources requiring additional treatment to meet existing quality standards in terms of chemical and biological status.n Soil erosion and increased sedimentation and turbidity in rivers and surface waters.
Encourage good soil and land management practices that maintain and improve water infiltration and reduces water run-off and diffuse pollution.
Maintain flows to streams and rivers so that good chemical and environmental status is maintained.
Create buffer strips around source protection zones and water courses to reduce excessive nutrient and sediment input into water bodies.
Promote catchment level approaches and examine potential for natural flood storage and habitat creation which reduces pollution run-off during extreme weather events.
Promote uptake of high precision or low-input farming techniques so that the application of nitrate fertilisers does not result in excess nutrients passing into the aquifers at key times of recharge (autumn/winter)
Encourage conservation measures such as contour ploughing, buffer strips, improving soil structure or changes in land management such as transition from arable to long-term grass lays or cover crops.
In high risk areas promote shift from arable to long-term grass lays. Encourage measures that retain soils in situ such as contour ploughing, minimum or ‘no tillage’. Promote the use of green manures and cover crops.
Develop schemes that test the principle of ‘Payments for Ecosystem Services’ in relation to providing natural flood management and managing water flows.
SDNPA, Water Companies, Environment Agency, Natural England, Farmers and Landowners.
Current Management Plan and Local Plan cycle.Carry Forward into next Management Plan cycle 2019 – 2024 and 2024 – 2029.Water Company resource Planning Round (2019 onwards)
Area of Impact
Projected risk or opportunity
Ambition/ Planned Action
Lead Partner/Partnership
Planned Timeframe
Hedgerows n Decline in species diversity and loss of resources to wildlife.n Loss of key species due to drought stress.n Decrease in the overall ecological connectivity of the wider landscape.n Loss of historic character within the landscape.
Promote the benefits of hedgerows and encourage best practice in terms of their management. Improve habitat connectivity, help retain soils, manage surface run-off and increase the permeability of the landscape to wildlife.
Develop and use positive planning and DM policies that retain hedgerows and encourage new planting on development sites to deliver multiple ecosystem service benefits.
Work to influence positive impact on landscape character and ecosystem function though these assets while recognising that landscape character will still change or alter over time.
SDNPA, Natural England, Wildlife Trust, Farmers and Landowners.
Current Management Plan and Local Plan cycle.Carry Forward into next Management Plan cycle 2019 – 2024.
Chalk grassland
n Species rich chalk grassland may see changes in species composition and declines in overall species diversity.n Loss of condition of designated sites or priority habitats may occur.n Species migration and loss of small or isolated patches of habitat will affect their resilience.n Fragmentation of some habitat types such as chalk and other unimproved grassland will limit their adaptive capacity.
Target project funding and environmental grant funding towards measures that increase resilience to a changing climate, support biodiversity and provide wider Ecosystem Service benefits.
Encourage land management practices that support pollinators. Use of natural pest controls or pest resistant crop species to reduce the need for pesticide use.
Increase habitat connectivity and the permeability of the landscape to wildlife. Undertake adaptive management and ensure that areas of valuable habitat are bigger, better managed and joined up. Increase the quality and habitat diversity of wildlife sites.
Work with partners to address water supply issues for chalk grassland sites where they may be a barrier to grazing due to climate change impacts. Consider alternative grazing strategies such as more resilient or alternative gazing animals.
SDNPA, Natural England, Wildlife Trust, Farmers and Landowners.
Current Management Plan and Local Plan cycle.Carry Forward into next Management Plan cycle 2019 – 2024 and 2024 – 2029.
Natural Environment (continued)
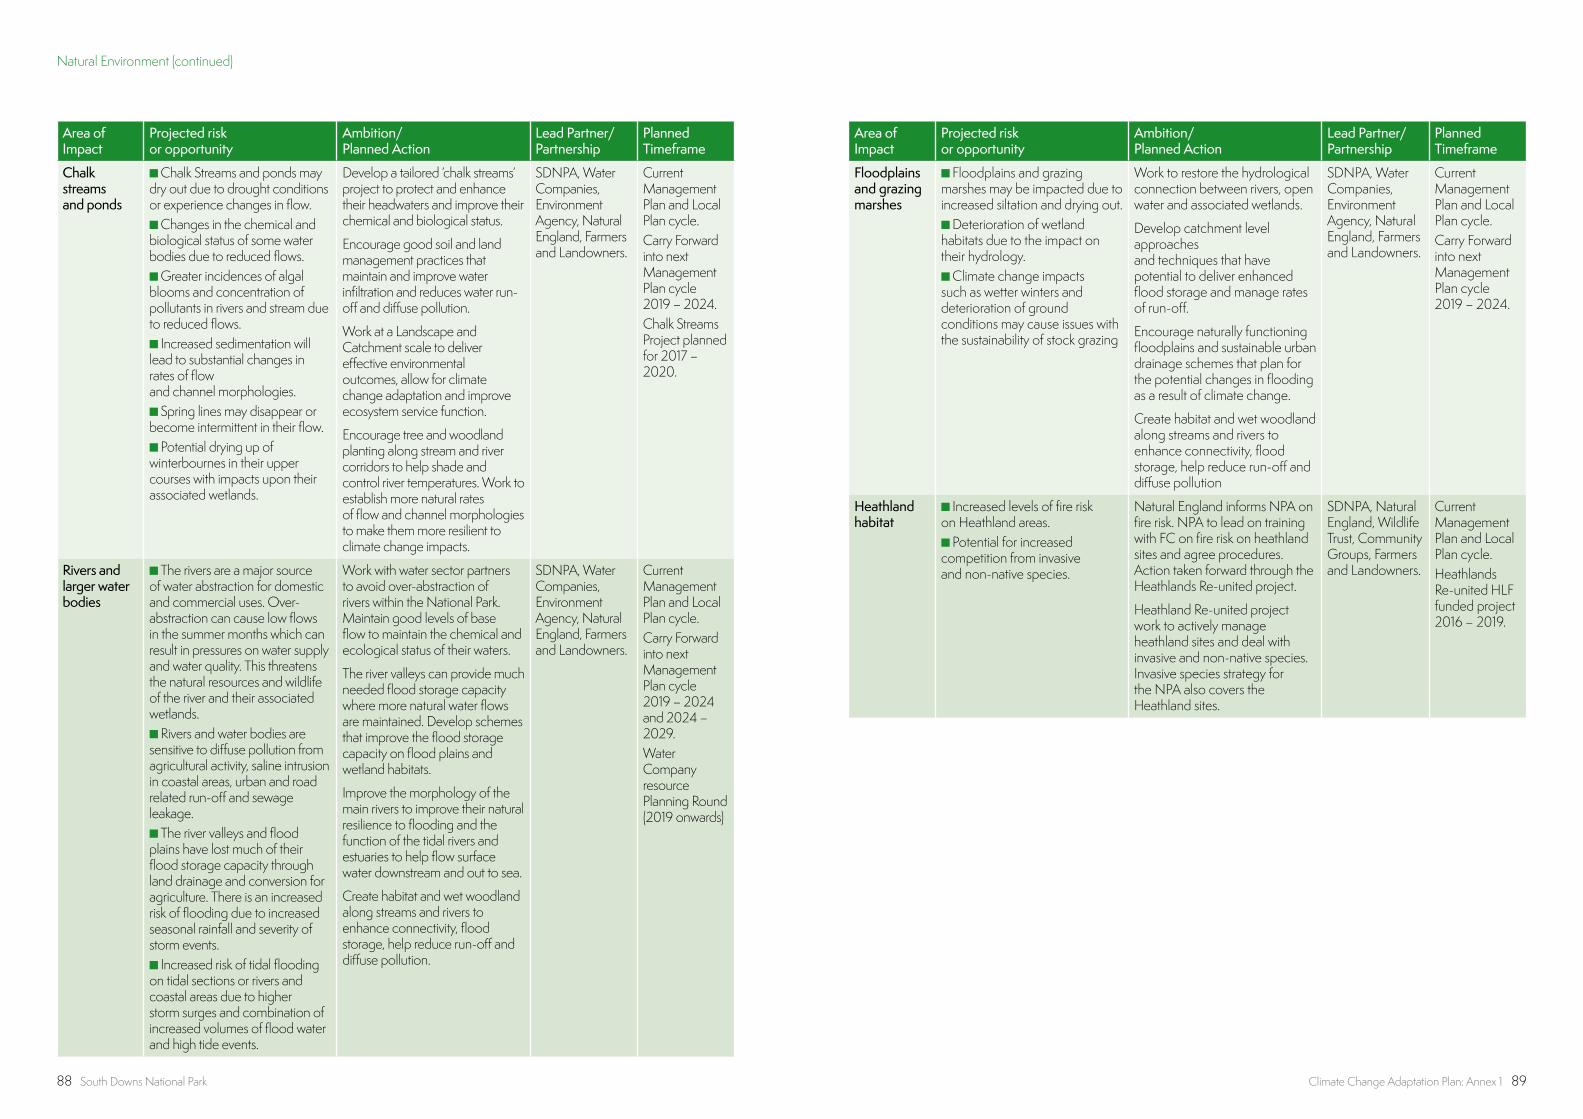
88 South Downs National Park Climate Change Adaptation Plan: Annex 1 89
Area of Impact
Projected risk or opportunity
Ambition/ Planned Action
Lead Partner/Partnership
Planned Timeframe
Chalk streams and ponds
n Chalk Streams and ponds may dry out due to drought conditions or experience changes in flow.n Changes in the chemical and biological status of some water bodies due to reduced flows.n Greater incidences of algal blooms and concentration of pollutants in rivers and stream due to reduced flows.n Increased sedimentation will lead to substantial changes in rates of flow and channel morphologies.n Spring lines may disappear or become intermittent in their flow.n Potential drying up of winterbournes in their upper courses with impacts upon their associated wetlands.
Develop a tailored ‘chalk streams’ project to protect and enhance their headwaters and improve their chemical and biological status.
Encourage good soil and land management practices that maintain and improve water infiltration and reduces water run-off and diffuse pollution.
Work at a Landscape and Catchment scale to deliver effective environmental outcomes, allow for climate change adaptation and improve ecosystem service function.
Encourage tree and woodland planting along stream and river corridors to help shade and control river temperatures. Work to establish more natural rates of flow and channel morphologies to make them more resilient to climate change impacts.
SDNPA, Water Companies, Environment Agency, Natural England, Farmers and Landowners.
Current Management Plan and Local Plan cycle.Carry Forward into next Management Plan cycle 2019 – 2024.Chalk Streams Project planned for 2017 – 2020.
Rivers and larger water bodies
n The rivers are a major source of water abstraction for domestic and commercial uses. Over-abstraction can cause low flows in the summer months which can result in pressures on water supply and water quality. This threatens the natural resources and wildlife of the river and their associated wetlands.n Rivers and water bodies are sensitive to diffuse pollution from agricultural activity, saline intrusion in coastal areas, urban and road related run-off and sewage leakage. n The river valleys and flood plains have lost much of their flood storage capacity through land drainage and conversion for agriculture. There is an increased risk of flooding due to increased seasonal rainfall and severity of storm events. n Increased risk of tidal flooding on tidal sections or rivers and coastal areas due to higher storm surges and combination of increased volumes of flood water and high tide events.
Work with water sector partners to avoid over-abstraction of rivers within the National Park. Maintain good levels of base flow to maintain the chemical and ecological status of their waters.
The river valleys can provide much needed flood storage capacity where more natural water flows are maintained. Develop schemes that improve the flood storage capacity on flood plains and wetland habitats.
Improve the morphology of the main rivers to improve their natural resilience to flooding and the function of the tidal rivers and estuaries to help flow surface water downstream and out to sea.
Create habitat and wet woodland along streams and rivers to enhance connectivity, flood storage, help reduce run-off and diffuse pollution.
SDNPA, Water Companies, Environment Agency, Natural England, Farmers and Landowners.
Current Management Plan and Local Plan cycle.Carry Forward into next Management Plan cycle 2019 – 2024 and 2024 – 2029.Water Company resource Planning Round (2019 onwards)
Area of Impact
Projected risk or opportunity
Ambition/ Planned Action
Lead Partner/Partnership
Planned Timeframe
Floodplains and grazing marshes
n Floodplains and grazing marshes may be impacted due to increased siltation and drying out.n Deterioration of wetland habitats due to the impact on their hydrology.n Climate change impacts such as wetter winters and deterioration of ground conditions may cause issues with the sustainability of stock grazing
Work to restore the hydrological connection between rivers, open water and associated wetlands.
Develop catchment level approaches and techniques that have potential to deliver enhanced flood storage and manage rates of run-off.
Encourage naturally functioning floodplains and sustainable urban drainage schemes that plan for the potential changes in flooding as a result of climate change.
Create habitat and wet woodland along streams and rivers to enhance connectivity, flood storage, help reduce run-off and diffuse pollution
SDNPA, Water Companies, Environment Agency, Natural England, Farmers and Landowners.
Current Management Plan and Local Plan cycle.Carry Forward into next Management Plan cycle 2019 – 2024.
Heathland habitat
n Increased levels of fire risk on Heathland areas.n Potential for increased competition from invasive and non-native species.
Natural England informs NPA on fire risk. NPA to lead on training with FC on fire risk on heathland sites and agree procedures. Action taken forward through the Heathlands Re-united project.
Heathland Re-united project work to actively manage heathland sites and deal with invasive and non-native species. Invasive species strategy for the NPA also covers the Heathland sites.
SDNPA, Natural England, Wildlife Trust, Community Groups, Farmers and Landowners.
Current Management Plan and Local Plan cycle.Heathlands Re-united HLF funded project 2016 – 2019.
Natural Environment (continued)
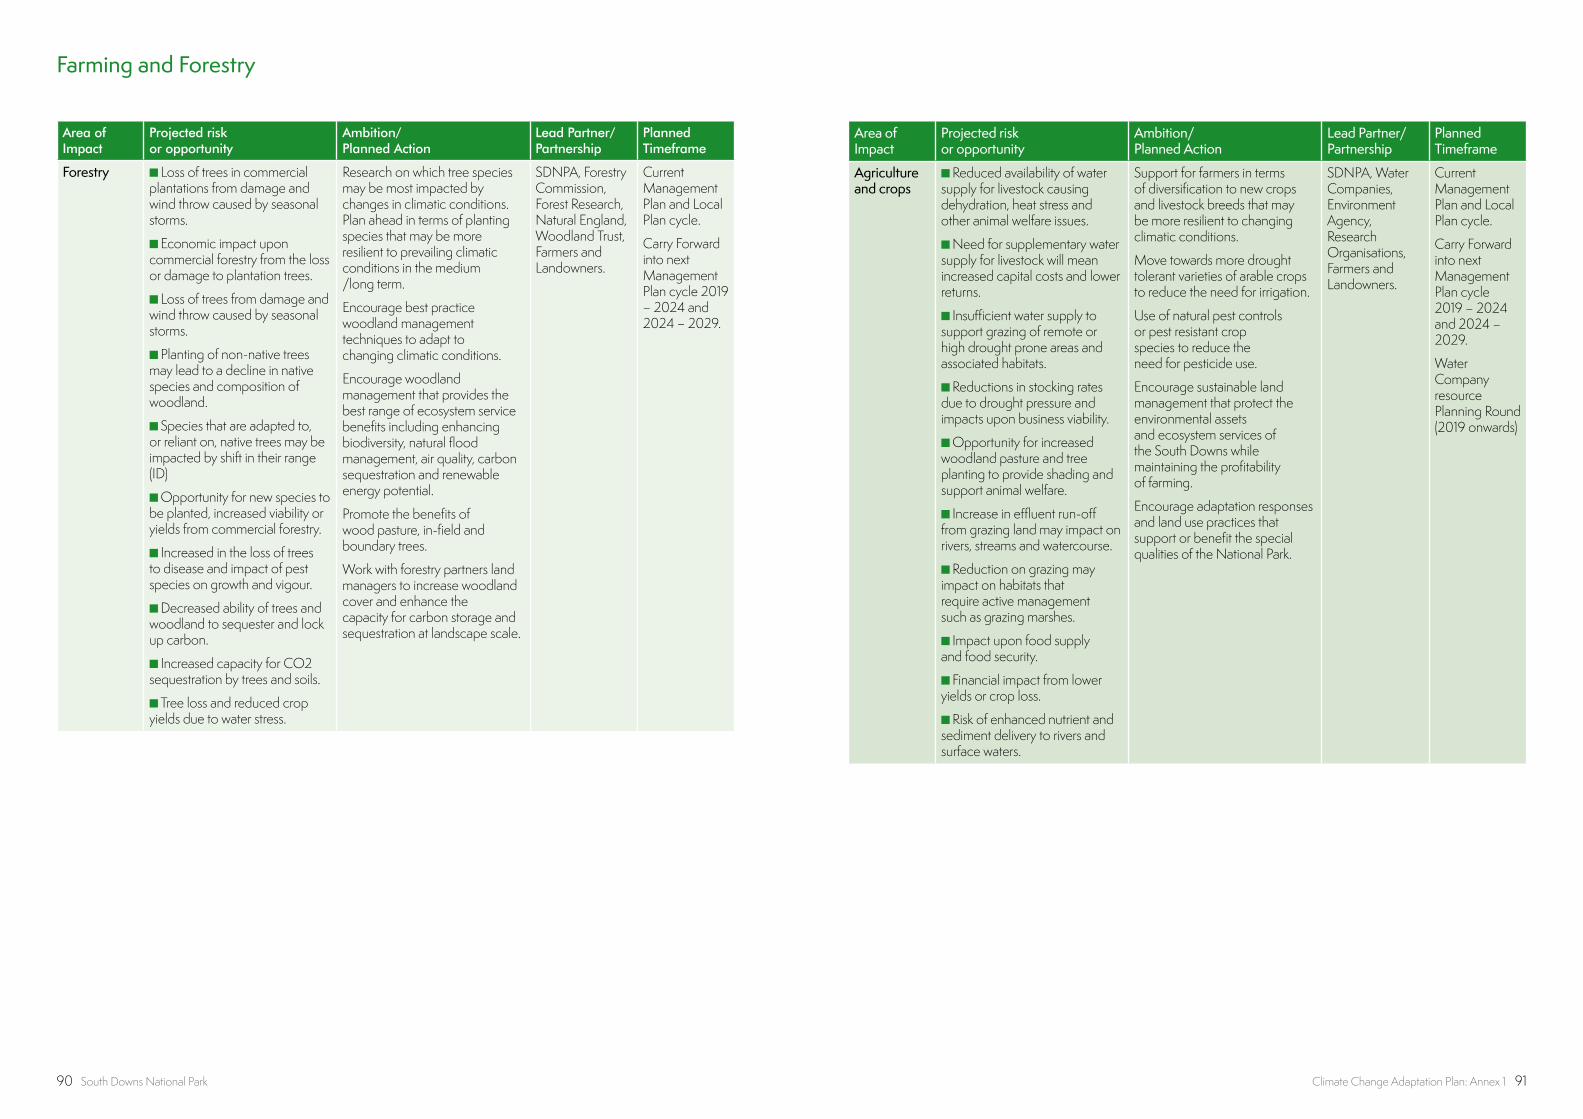
90 South Downs National Park Climate Change Adaptation Plan: Annex 1 91
Area of Impact
Projected risk or opportunity
Ambition/ Planned Action
Lead Partner/Partnership
Planned Timeframe
Forestry n Loss of trees in commercial plantations from damage and wind throw caused by seasonal storms.
n Economic impact upon commercial forestry from the loss or damage to plantation trees.
n Loss of trees from damage and wind throw caused by seasonal storms.
n Planting of non-native trees may lead to a decline in native species and composition of woodland.
n Species that are adapted to, or reliant on, native trees may be impacted by shift in their range (ID)
n Opportunity for new species to be planted, increased viability or yields from commercial forestry.
n Increased in the loss of trees to disease and impact of pest species on growth and vigour.
n Decreased ability of trees and woodland to sequester and lock up carbon.
n Increased capacity for CO2 sequestration by trees and soils.
n Tree loss and reduced crop yields due to water stress.
Research on which tree species may be most impacted by changes in climatic conditions. Plan ahead in terms of planting species that may be more resilient to prevailing climatic conditions in the medium /long term.
Encourage best practice woodland management techniques to adapt to changing climatic conditions.
Encourage woodland management that provides the best range of ecosystem service benefits including enhancing biodiversity, natural flood management, air quality, carbon sequestration and renewable energy potential.
Promote the benefits of wood pasture, in-field and boundary trees.
Work with forestry partners land managers to increase woodland cover and enhance the capacity for carbon storage and sequestration at landscape scale.
SDNPA, Forestry Commission, Forest Research, Natural England, Woodland Trust, Farmers and Landowners.
Current Management Plan and Local Plan cycle.
Carry Forward into next Management Plan cycle 2019 – 2024 and 2024 – 2029.
Farming and Forestry
Area of Impact
Projected risk or opportunity
Ambition/ Planned Action
Lead Partner/Partnership
Planned Timeframe
Agriculture and crops
n Reduced availability of water supply for livestock causing dehydration, heat stress and other animal welfare issues.
n Need for supplementary water supply for livestock will mean increased capital costs and lower returns.
n Insufficient water supply to support grazing of remote or high drought prone areas and associated habitats.
n Reductions in stocking rates due to drought pressure and impacts upon business viability.
n Opportunity for increased woodland pasture and tree planting to provide shading and support animal welfare.
n Increase in effluent run-off from grazing land may impact on rivers, streams and watercourse.
n Reduction on grazing may impact on habitats that require active management such as grazing marshes.
n Impact upon food supply and food security.
n Financial impact from lower yields or crop loss.
n Risk of enhanced nutrient and sediment delivery to rivers and surface waters.
Support for farmers in terms of diversification to new crops and livestock breeds that may be more resilient to changing climatic conditions.
Move towards more drought tolerant varieties of arable crops to reduce the need for irrigation.
Use of natural pest controls or pest resistant crop species to reduce the need for pesticide use.
Encourage sustainable land management that protect the environmental assets and ecosystem services of the South Downs while maintaining the profitability of farming.
Encourage adaptation responses and land use practices that support or benefit the special qualities of the National Park.
SDNPA, Water Companies, Environment Agency, Research Organisations, Farmers and Landowners.
Current Management Plan and Local Plan cycle.
Carry Forward into next Management Plan cycle 2019 – 2024 and 2024 – 2029.
Water Company resource Planning Round (2019 onwards)
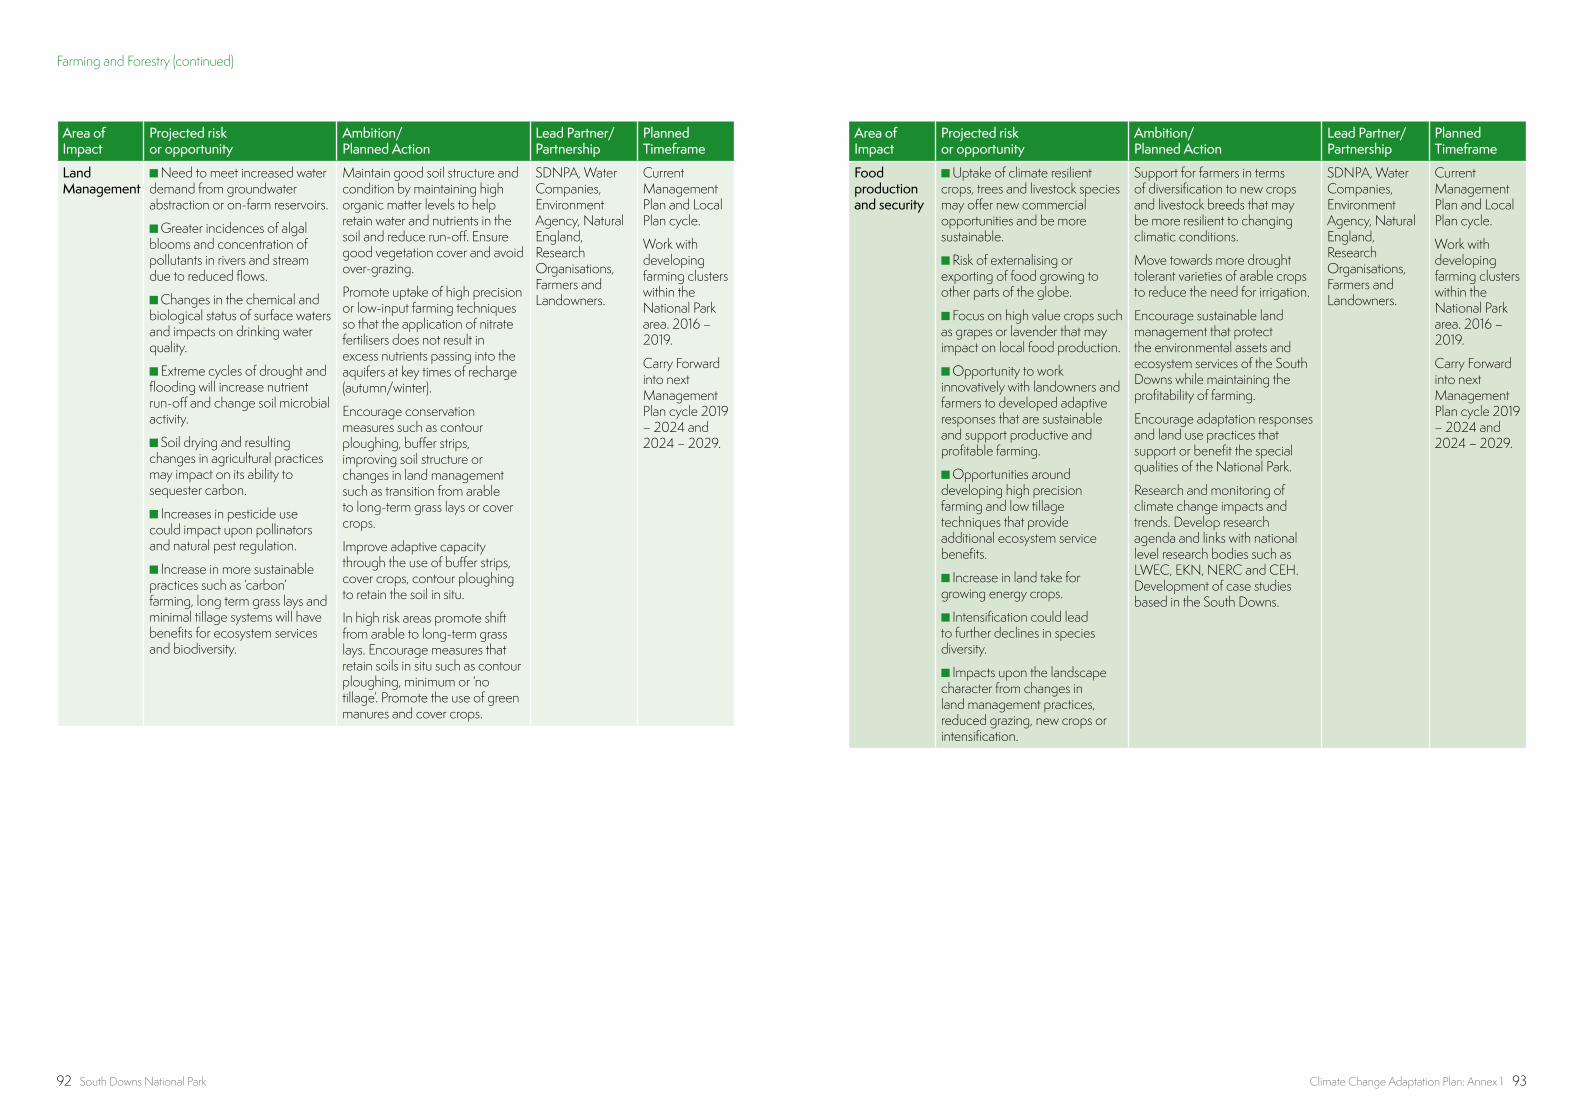
92 South Downs National Park Climate Change Adaptation Plan: Annex 1 93
Area of Impact
Projected risk or opportunity
Ambition/ Planned Action
Lead Partner/Partnership
Planned Timeframe
Land Management
n Need to meet increased water demand from groundwater abstraction or on-farm reservoirs.
n Greater incidences of algal blooms and concentration of pollutants in rivers and stream due to reduced flows.
n Changes in the chemical and biological status of surface waters and impacts on drinking water quality.
n Extreme cycles of drought and flooding will increase nutrient run-off and change soil microbial activity.
n Soil drying and resulting changes in agricultural practices may impact on its ability to sequester carbon.
n Increases in pesticide use could impact upon pollinators and natural pest regulation.
n Increase in more sustainable practices such as ‘carbon’ farming, long term grass lays and minimal tillage systems will have benefits for ecosystem services and biodiversity.
Maintain good soil structure and condition by maintaining high organic matter levels to help retain water and nutrients in the soil and reduce run-off. Ensure good vegetation cover and avoid over-grazing.
Promote uptake of high precision or low-input farming techniques so that the application of nitrate fertilisers does not result in excess nutrients passing into the aquifers at key times of recharge (autumn/winter).
Encourage conservation measures such as contour ploughing, buffer strips, improving soil structure or changes in land management such as transition from arable to long-term grass lays or cover crops.
Improve adaptive capacity through the use of buffer strips, cover crops, contour ploughing to retain the soil in situ.
In high risk areas promote shift from arable to long-term grass lays. Encourage measures that retain soils in situ such as contour ploughing, minimum or ‘no tillage’. Promote the use of green manures and cover crops.
SDNPA, Water Companies, Environment Agency, Natural England, Research Organisations, Farmers and Landowners.
Current Management Plan and Local Plan cycle.
Work with developing farming clusters within the National Park area. 2016 – 2019.
Carry Forward into next Management Plan cycle 2019 – 2024 and 2024 – 2029.
Area of Impact
Projected risk or opportunity
Ambition/ Planned Action
Lead Partner/Partnership
Planned Timeframe
Food production and security
n Uptake of climate resilient crops, trees and livestock species may offer new commercial opportunities and be more sustainable.
n Risk of externalising or exporting of food growing to other parts of the globe.
n Focus on high value crops such as grapes or lavender that may impact on local food production.
n Opportunity to work innovatively with landowners and farmers to developed adaptive responses that are sustainable and support productive and profitable farming.
n Opportunities around developing high precision farming and low tillage techniques that provide additional ecosystem service benefits.
n Increase in land take for growing energy crops.
n Intensification could lead to further declines in species diversity.
n Impacts upon the landscape character from changes in land management practices, reduced grazing, new crops or intensification.
Support for farmers in terms of diversification to new crops and livestock breeds that may be more resilient to changing climatic conditions.
Move towards more drought tolerant varieties of arable crops to reduce the need for irrigation.
Encourage sustainable land management that protect the environmental assets and ecosystem services of the South Downs while maintaining the profitability of farming.
Encourage adaptation responses and land use practices that support or benefit the special qualities of the National Park.
Research and monitoring of climate change impacts and trends. Develop research agenda and links with national level research bodies such as LWEC, EKN, NERC and CEH. Development of case studies based in the South Downs.
SDNPA, Water Companies, Environment Agency, Natural England, Research Organisations, Farmers and Landowners.
Current Management Plan and Local Plan cycle.
Work with developing farming clusters within the National Park area. 2016 – 2019.
Carry Forward into next Management Plan cycle 2019 – 2024 and 2024 – 2029.
Farming and Forestry (continued)
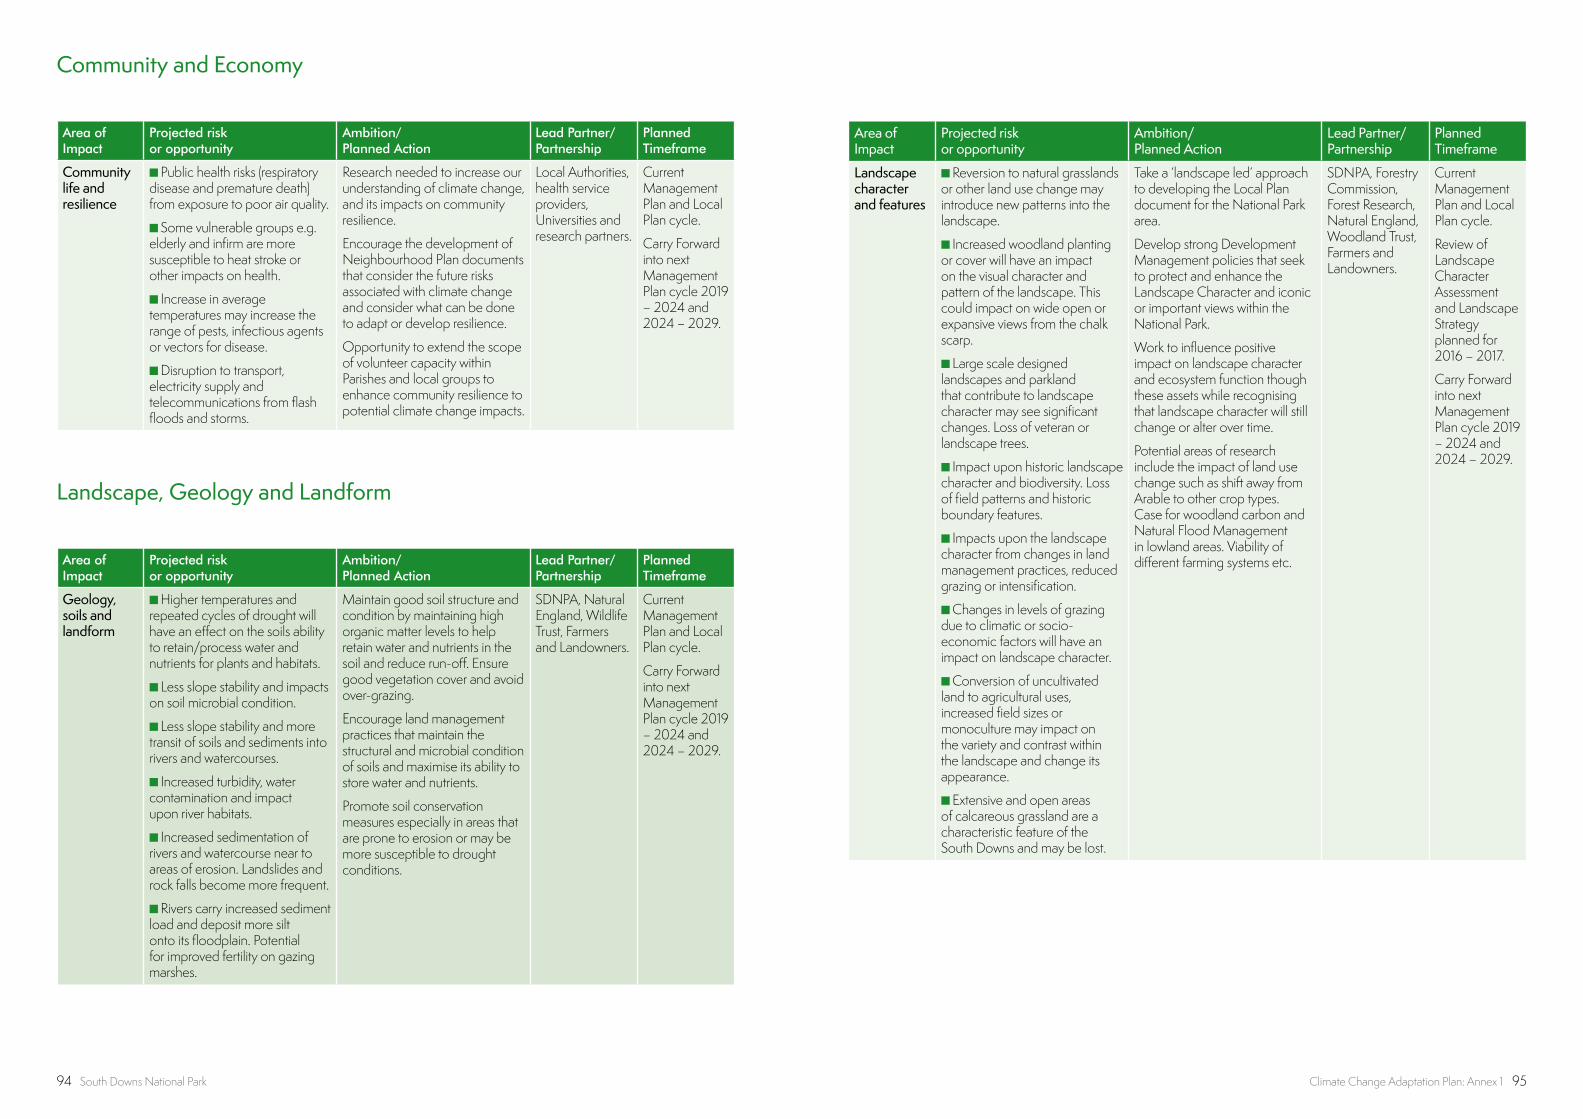
94 South Downs National Park Climate Change Adaptation Plan: Annex 1 95
Area of Impact
Projected risk or opportunity
Ambition/ Planned Action
Lead Partner/Partnership
Planned Timeframe
Community life and resilience
n Public health risks (respiratory disease and premature death) from exposure to poor air quality.
n Some vulnerable groups e.g. elderly and infirm are more susceptible to heat stroke or other impacts on health.
n Increase in average temperatures may increase the range of pests, infectious agents or vectors for disease.
n Disruption to transport, electricity supply and telecommunications from flash floods and storms.
Research needed to increase our understanding of climate change, and its impacts on community resilience.
Encourage the development of Neighbourhood Plan documents that consider the future risks associated with climate change and consider what can be done to adapt or develop resilience.
Opportunity to extend the scope of volunteer capacity within Parishes and local groups to enhance community resilience to potential climate change impacts.
Local Authorities, health service providers, Universities and research partners.
Current Management Plan and Local Plan cycle.
Carry Forward into next Management Plan cycle 2019 – 2024 and 2024 – 2029.
Community and Economy
Area of Impact
Projected risk or opportunity
Ambition/ Planned Action
Lead Partner/Partnership
Planned Timeframe
Geology, soils and landform
n Higher temperatures and repeated cycles of drought will have an effect on the soils ability to retain/process water and nutrients for plants and habitats.
n Less slope stability and impacts on soil microbial condition.
n Less slope stability and more transit of soils and sediments into rivers and watercourses.
n Increased turbidity, water contamination and impact upon river habitats.
n Increased sedimentation of rivers and watercourse near to areas of erosion. Landslides and rock falls become more frequent.
n Rivers carry increased sediment load and deposit more silt onto its floodplain. Potential for improved fertility on gazing marshes.
Maintain good soil structure and condition by maintaining high organic matter levels to help retain water and nutrients in the soil and reduce run-off. Ensure good vegetation cover and avoid over-grazing.
Encourage land management practices that maintain the structural and microbial condition of soils and maximise its ability to store water and nutrients.
Promote soil conservation measures especially in areas that are prone to erosion or may be more susceptible to drought conditions.
SDNPA, Natural England, Wildlife Trust, Farmers and Landowners.
Current Management Plan and Local Plan cycle.
Carry Forward into next Management Plan cycle 2019 – 2024 and 2024 – 2029.
Landscape, Geology and Landform
Area of Impact
Projected risk or opportunity
Ambition/ Planned Action
Lead Partner/Partnership
Planned Timeframe
Landscape character and features
n Reversion to natural grasslands or other land use change may introduce new patterns into the landscape.
n Increased woodland planting or cover will have an impact on the visual character and pattern of the landscape. This could impact on wide open or expansive views from the chalk scarp.
n Large scale designed landscapes and parkland that contribute to landscape character may see significant changes. Loss of veteran or landscape trees.
n Impact upon historic landscape character and biodiversity. Loss of field patterns and historic boundary features.
n Impacts upon the landscape character from changes in land management practices, reduced grazing or intensification.
n Changes in levels of grazing due to climatic or socio-economic factors will have an impact on landscape character.
n Conversion of uncultivated land to agricultural uses, increased field sizes or monoculture may impact on the variety and contrast within the landscape and change its appearance.
n Extensive and open areas of calcareous grassland are a characteristic feature of the South Downs and may be lost.
Take a ‘landscape led’ approach to developing the Local Plan document for the National Park area.
Develop strong Development Management policies that seek to protect and enhance the Landscape Character and iconic or important views within the National Park.
Work to influence positive impact on landscape character and ecosystem function though these assets while recognising that landscape character will still change or alter over time.
Potential areas of research include the impact of land use change such as shift away from Arable to other crop types. Case for woodland carbon and Natural Flood Management in lowland areas. Viability of different farming systems etc.
SDNPA, Forestry Commission, Forest Research, Natural England, Woodland Trust, Farmers and Landowners.
Current Management Plan and Local Plan cycle.
Review of Landscape Character Assessment and Landscape Strategy planned for 2016 – 2017.
Carry Forward into next Management Plan cycle 2019 – 2024 and 2024 – 2029.
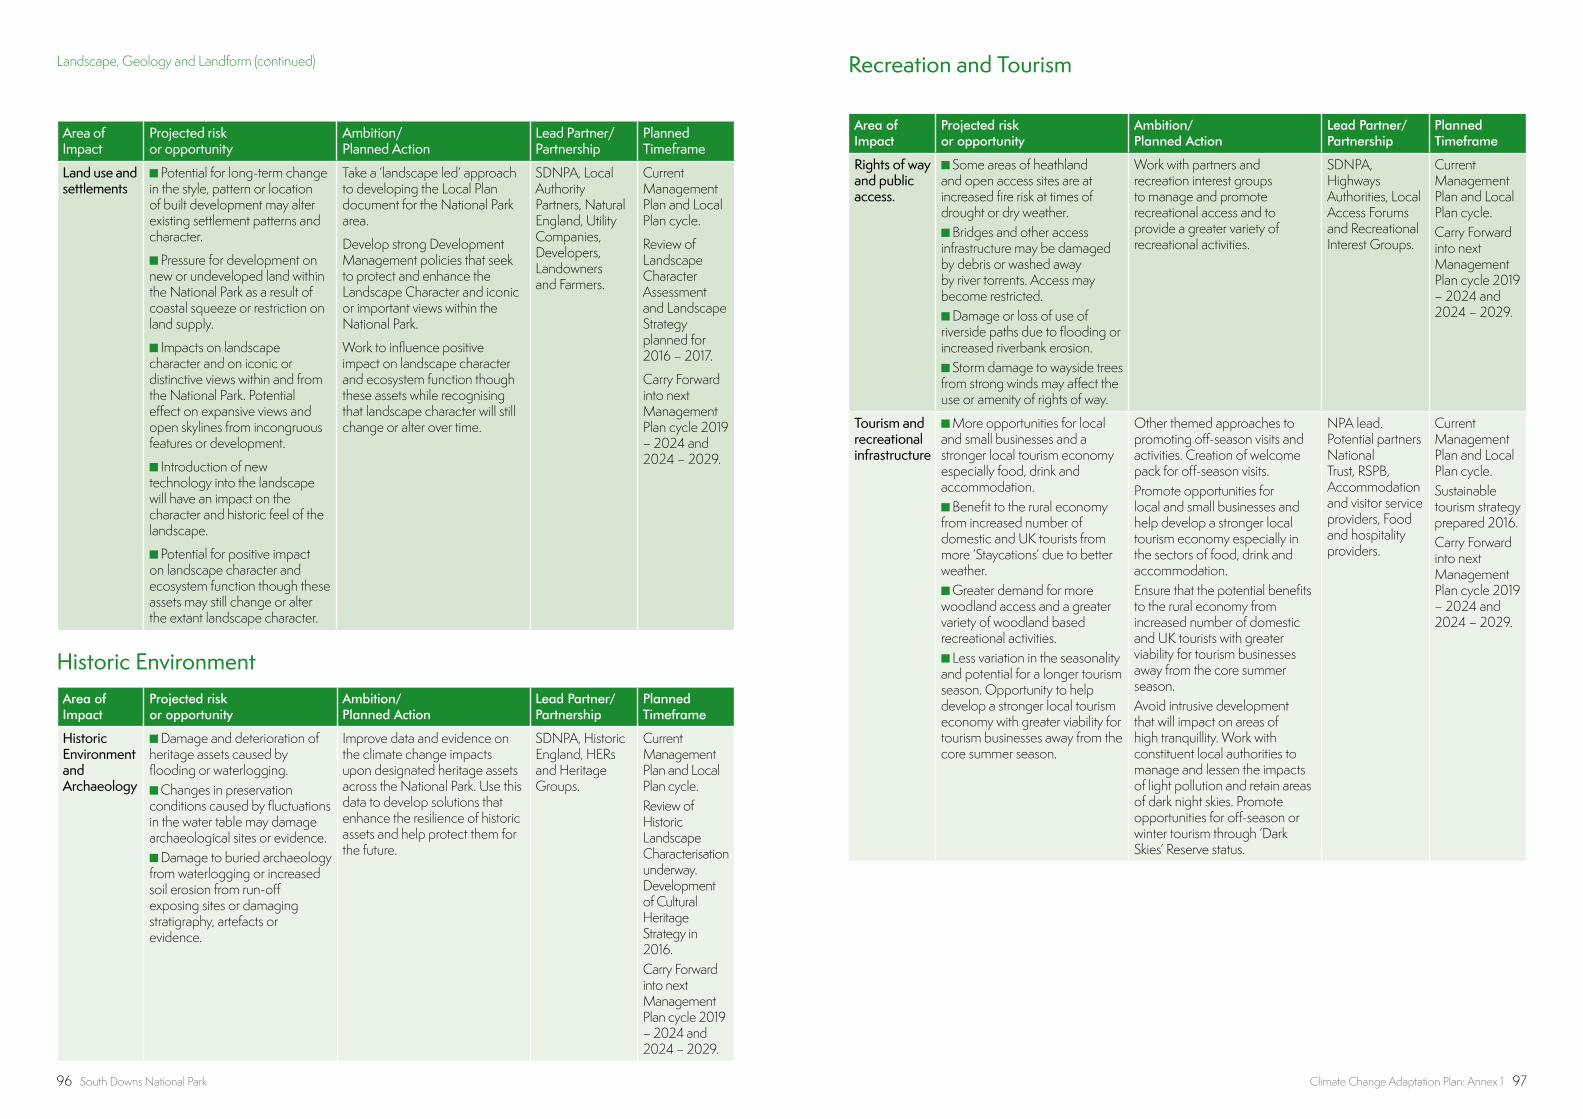
96 South Downs National Park Climate Change Adaptation Plan: Annex 1 97
Area of Impact
Projected risk or opportunity
Ambition/ Planned Action
Lead Partner/Partnership
Planned Timeframe
Land use and settlements
n Potential for long-term change in the style, pattern or location of built development may alter existing settlement patterns and character.
n Pressure for development on new or undeveloped land within the National Park as a result of coastal squeeze or restriction on land supply.
n Impacts on landscape character and on iconic or distinctive views within and from the National Park. Potential effect on expansive views and open skylines from incongruous features or development.
n Introduction of new technology into the landscape will have an impact on the character and historic feel of the landscape.
n Potential for positive impact on landscape character and ecosystem function though these assets may still change or alter the extant landscape character.
Take a ‘landscape led’ approach to developing the Local Plan document for the National Park area.
Develop strong Development Management policies that seek to protect and enhance the Landscape Character and iconic or important views within the National Park.
Work to influence positive impact on landscape character and ecosystem function though these assets while recognising that landscape character will still change or alter over time.
SDNPA, Local Authority Partners, Natural England, Utility Companies, Developers, Landowners and Farmers.
Current Management Plan and Local Plan cycle.
Review of Landscape Character Assessment and Landscape Strategy planned for 2016 – 2017.
Carry Forward into next Management Plan cycle 2019 – 2024 and 2024 – 2029.
Area of Impact
Projected risk or opportunity
Ambition/ Planned Action
Lead Partner/Partnership
Planned Timeframe
Rights of way and public access.
n Some areas of heathland and open access sites are at increased fire risk at times of drought or dry weather.n Bridges and other access infrastructure may be damaged by debris or washed away by river torrents. Access may become restricted.n Damage or loss of use of riverside paths due to flooding or increased riverbank erosion.n Storm damage to wayside trees from strong winds may affect the use or amenity of rights of way.
Work with partners and recreation interest groups to manage and promote recreational access and to provide a greater variety of recreational activities.
SDNPA, Highways Authorities, Local Access Forums and Recreational Interest Groups.
Current Management Plan and Local Plan cycle.Carry Forward into next Management Plan cycle 2019 – 2024 and 2024 – 2029.
Tourism and recreational infrastructure
n More opportunities for local and small businesses and a stronger local tourism economy especially food, drink and accommodation.n Benefit to the rural economy from increased number of domestic and UK tourists from more ‘Staycations’ due to better weather.n Greater demand for more woodland access and a greater variety of woodland based recreational activities.n Less variation in the seasonality and potential for a longer tourism season. Opportunity to help develop a stronger local tourism economy with greater viability for tourism businesses away from the core summer season.
Other themed approaches to promoting off-season visits and activities. Creation of welcome pack for off-season visits.Promote opportunities for local and small businesses and help develop a stronger local tourism economy especially in the sectors of food, drink and accommodation. Ensure that the potential benefits to the rural economy from increased number of domestic and UK tourists with greater viability for tourism businesses away from the core summer season.Avoid intrusive development that will impact on areas of high tranquillity. Work with constituent local authorities to manage and lessen the impacts of light pollution and retain areas of dark night skies. Promote opportunities for off-season or winter tourism through ‘Dark Skies’ Reserve status.
NPA lead. Potential partners National Trust, RSPB, Accommodation and visitor service providers, Food and hospitality providers.
Current Management Plan and Local Plan cycle.Sustainable tourism strategy prepared 2016.Carry Forward into next Management Plan cycle 2019 – 2024 and 2024 – 2029.
Area of Impact
Projected risk or opportunity
Ambition/ Planned Action
Lead Partner/Partnership
Planned Timeframe
Historic Environment and Archaeology
n Damage and deterioration of heritage assets caused by flooding or waterlogging.n Changes in preservation conditions caused by fluctuations in the water table may damage archaeological sites or evidence.n Damage to buried archaeology from waterlogging or increased soil erosion from run-off exposing sites or damaging stratigraphy, artefacts or evidence.
Improve data and evidence on the climate change impacts upon designated heritage assets across the National Park. Use this data to develop solutions that enhance the resilience of historic assets and help protect them for the future.
SDNPA, Historic England, HERs and Heritage Groups.
Current Management Plan and Local Plan cycle.Review of Historic Landscape Characterisation underway. Development of Cultural Heritage Strategy in 2016.Carry Forward into next Management Plan cycle 2019 – 2024 and 2024 – 2029.
Historic Environment
Landscape, Geology and Landform (continued) Recreation and Tourism
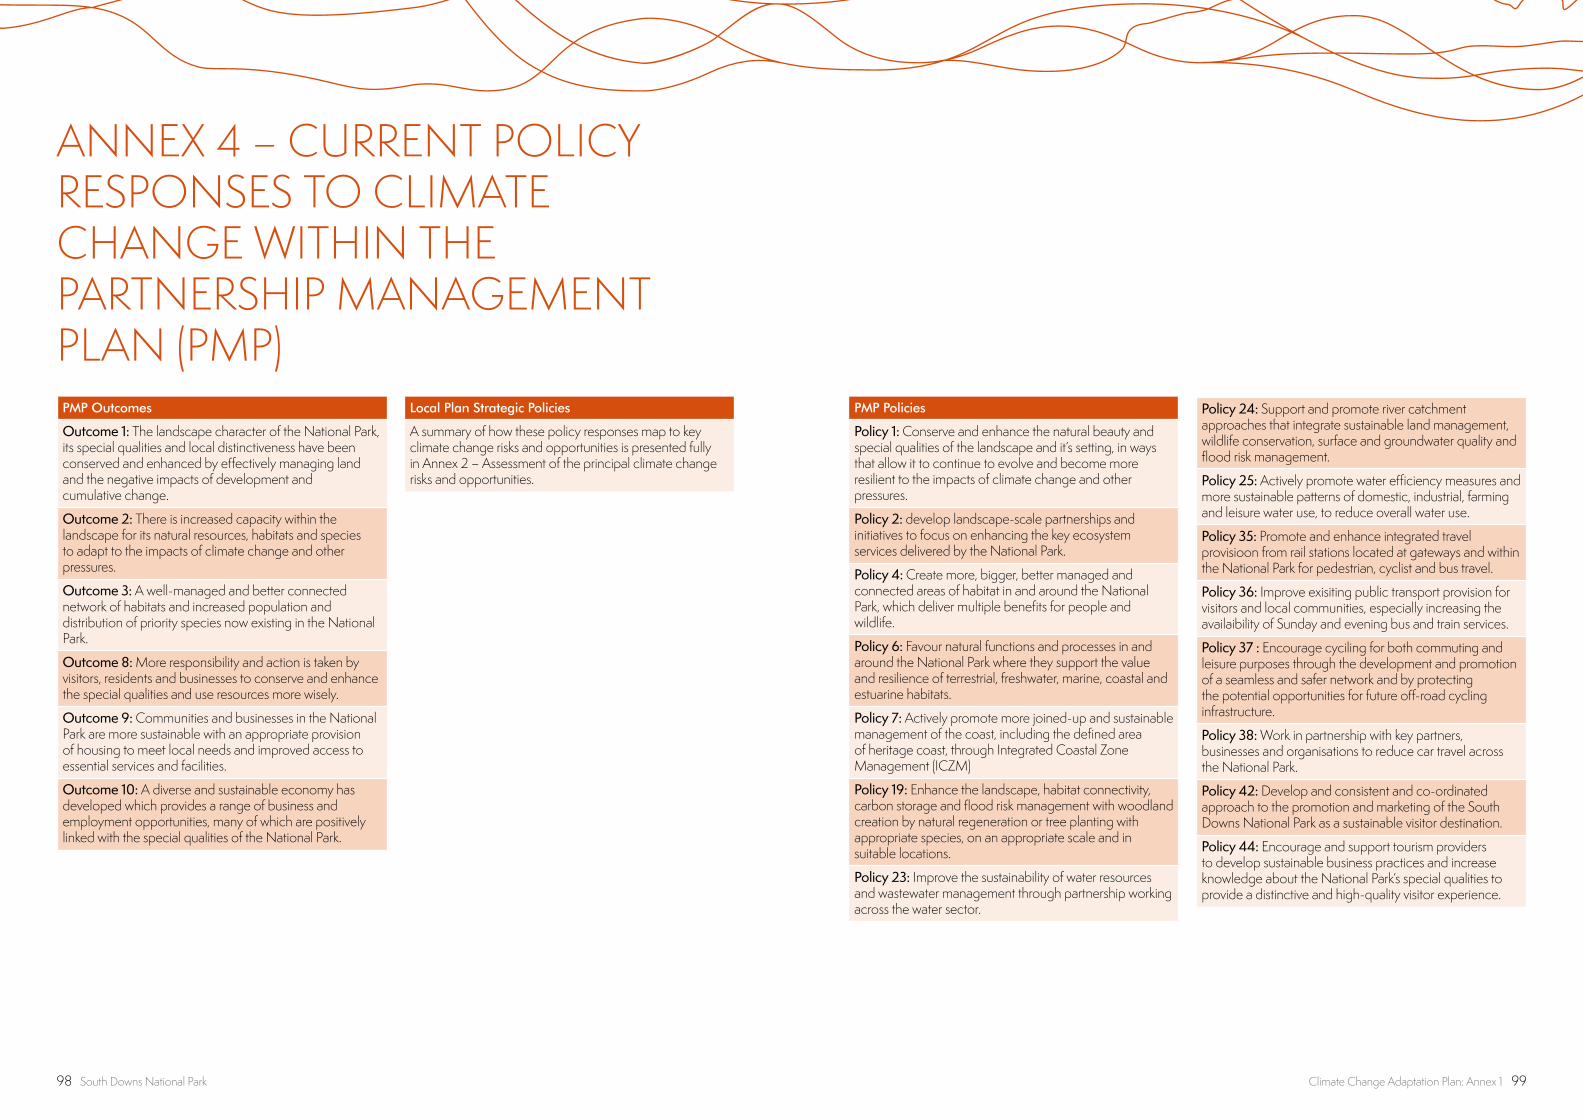
98 South Downs National Park Climate Change Adaptation Plan: Annex 1 99
PMP Outcomes
Outcome 1: The landscape character of the National Park, its special qualities and local distinctiveness have been conserved and enhanced by effectively managing land and the negative impacts of development and cumulative change.
Outcome 2: There is increased capacity within the landscape for its natural resources, habitats and species to adapt to the impacts of climate change and other pressures.
Outcome 3: A well-managed and better connected network of habitats and increased population and distribution of priority species now existing in the National Park.
Outcome 8: More responsibility and action is taken by visitors, residents and businesses to conserve and enhance the special qualities and use resources more wisely.
Outcome 9: Communities and businesses in the National Park are more sustainable with an appropriate provision of housing to meet local needs and improved access to essential services and facilities.
Outcome 10: A diverse and sustainable economy has developed which provides a range of business and employment opportunities, many of which are positively linked with the special qualities of the National Park.
Local Plan Strategic Policies
A summary of how these policy responses map to key climate change risks and opportunities is presented fully in Annex 2 – Assessment of the principal climate change risks and opportunities.
PMP Policies
Policy 1: Conserve and enhance the natural beauty and special qualities of the landscape and it’s setting, in ways that allow it to continue to evolve and become more resilient to the impacts of climate change and other pressures.
Policy 2: develop landscape-scale partnerships and initiatives to focus on enhancing the key ecosystem services delivered by the National Park.
Policy 4: Create more, bigger, better managed and connected areas of habitat in and around the National Park, which deliver multiple benefits for people and wildlife.
Policy 6: Favour natural functions and processes in and around the National Park where they support the value and resilience of terrestrial, freshwater, marine, coastal and estuarine habitats.
Policy 7: Actively promote more joined-up and sustainable management of the coast, including the defined area of heritage coast, through Integrated Coastal Zone Management (ICZM)
Policy 19: Enhance the landscape, habitat connectivity, carbon storage and flood risk management with woodland creation by natural regeneration or tree planting with appropriate species, on an appropriate scale and in suitable locations.
Policy 23: Improve the sustainability of water resources and wastewater management through partnership working across the water sector.
Policy 24: Support and promote river catchment approaches that integrate sustainable land management, wildlife conservation, surface and groundwater quality and flood risk management.
Policy 25: Actively promote water efficiency measures and more sustainable patterns of domestic, industrial, farming and leisure water use, to reduce overall water use.
Policy 35: Promote and enhance integrated travel provisioon from rail stations located at gateways and within the National Park for pedestrian, cyclist and bus travel.
Policy 36: Improve exisiting public transport provision for visitors and local communities, especially increasing the availaibility of Sunday and evening bus and train services.
Policy 37 : Encourage cyciling for both commuting and leisure purposes through the development and promotion of a seamless and safer network and by protecting the potential opportunities for future off-road cycling infrastructure.
Policy 38: Work in partnership with key partners, businesses and organisations to reduce car travel across the National Park.
Policy 42: Develop and consistent and co-ordinated approach to the promotion and marketing of the South Downs National Park as a sustainable visitor destination.
Policy 44: Encourage and support tourism providers to develop sustainable business practices and increase knowledge about the National Park’s special qualities to provide a distinctive and high-quality visitor experience.
ANNEX 4 – CURRENT POLICY RESPONSES TO CLIMATE CHANGE WITHIN THE PARTNERSHIP MANAGEMENT PLAN (PMP)
100 South Downs National Park
ANNEX 5 – BIBLIOGRAPHYUsing Thermal Lidar to identify trees under drought and disease stress – www.thermolidar.comMorecroft, M. and Speakman, L (eds.) (2013) ‘Terrestrial Biodiversity Climate Change Impacts Summary Report’; Living With Environmental Change.
Department of Environment, Food and Rural Affairs (2013) England Biodiversity Strategy: Climate Change Adaptation Principles – Conserving biodiversity in a changing climate; Defra
Department of Environment, Food and Rural Affairs (2013) Adaptation Reporting Power: Voluntary Guidance to New Reporting Authorities on how to Produce an Adaptation Report; Defra
Met Office, Hadley Centre (2014) ‘Too hot, too cold, too wet, too dry: Drivers and impacts of seasonal weather in the UK March’; Met Office
European Environment Agency (2012) ‘Summary Report: Climate change, impacts and vulnerability in Europe 2012’; EEA
Environment Agency (2014) ‘Evidence briefing: IPPC report on climate change impacts and adaptation, EA
Social Research Institute (2014) ‘Preparing for the worst or hoping for the best? British priorities on Climate Change adaptation’; Ipsos MORI
Natural England (2013)’ Assessing the potential consequences of climate change for England’s landscapes: the South Downs National Park’; Natural England General Publication
Natural England (2014) ‘National biodiversity climate change vulnerability model’; NE
Natural England (2011) ‘Commissioned Report: Adapting Conservation to a Changing Climate’
Natural England General Publication (NECR081).
Natural England (2012) ‘Natural England’s climate change risk assessment and adaptation plan’; Natural England General Publication (CR318).
Natural England (2012) ‘Natural England’s climate change risk assessment: Annexes’; Natural England General Publication (CR318).
Climate UK (2012) ‘A Summary of Climate Change Risks for South East England’, Climate South East.
Met Office (2012) ‘The UK Climate Change Risk Assessment 2012: Evidence Report’, Defra.
Met Office (2012) ‘The UK Climate Change Risk Assessment 2012: Evidence Report Annex A & Annex B’, Defra.
UK Climate Change Risk Assessment (2012) ‘Summary of the Key Findings from the UK Climate Change Risk Assessment’; Defra.
HM Government (2013) ‘The National Adaptation Programme: Making the country resilient to a changing climate’; Defra.
HM Government (2013) ‘The National Adaptation Programme: Analytical Annex – Economics of the National Adaptation Programme’ ; Defra.
Natural England and RSPB (2014) ‘Climate change adaptation manual’; Natural England General Publication (NE546).
Lancaster Environment Centre (2013) ‘Review of National Park Climate Change mitigation policies and strategies’; Small World Consulting.
UKCIP (2013). The UKCIP Adaptation Wizard v 4.0. UKCIP, Oxford www.ukcip.org.uk/wizard