Embed Size (px)
Citation preview
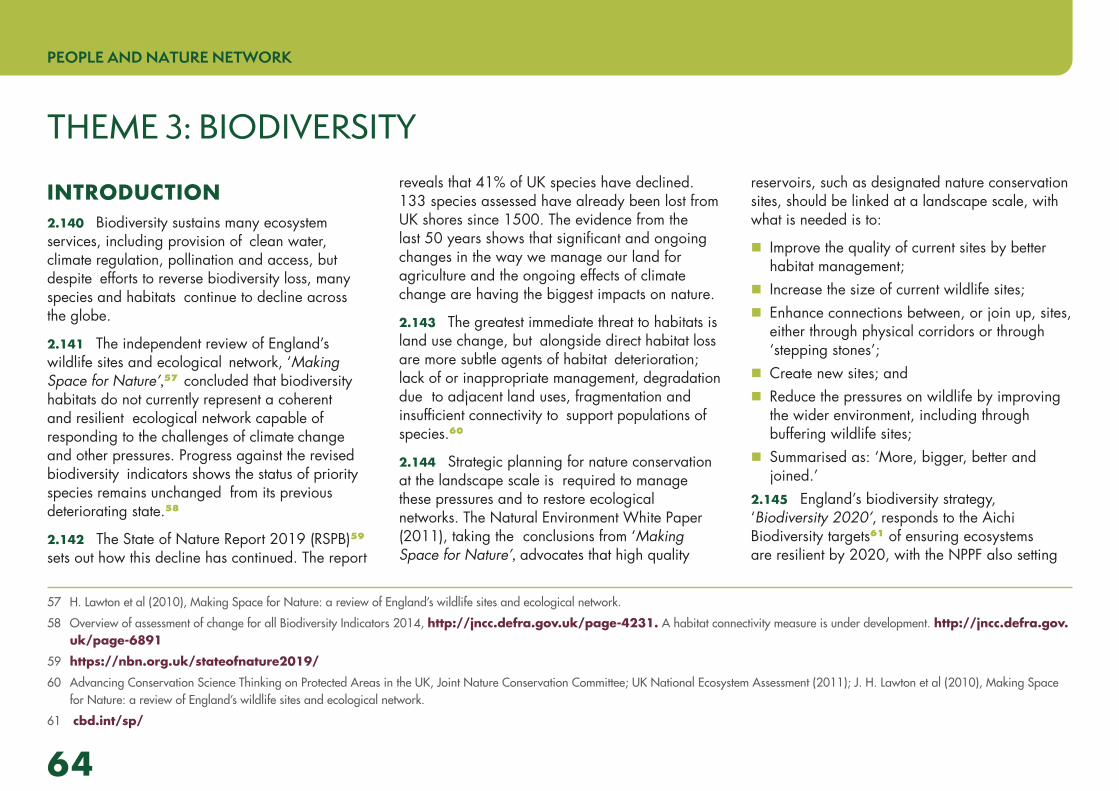
THEME 3: BIODIVERSITY
57 H. Lawton et al (2010), Making Space for Nature: a review of England’s wildlife sites and ecological network.
58 Overview of assessment of change for all Biodiversity Indicators 2014, http://jncc.defra.gov.uk/page-4231. A habitat connectivity measure is under development. http://jncc.defra.gov.uk/page-6891
59 https://nbn.org.uk/stateofnature2019/
60 Advancing Conservation Science Thinking on Protected Areas in the UK, Joint Nature Conservation Committee; UK National Ecosystem Assessment (2011); J. H. Lawton et al (2010), Making Space for Nature: a review of England’s wildlife sites and ecological network.
61 cbd.int/sp/
INTRODUCTION2.140 Biodiversity sustains many ecosystem services, including provision of clean water, climate regulation, pollination and access, but despite efforts to reverse biodiversity loss, many species and habitats continue to decline across the globe.
2.141 The independent review of England’s wildlife sites and ecological network, ‘Making Space for Nature’,57 concluded that biodiversity habitats do not currently represent a coherent and resilient ecological network capable of responding to the challenges of climate change and other pressures. Progress against the revised biodiversity indicators shows the status of priority species remains unchanged from its previous deteriorating state.58
2.142 The State of Nature Report 2019 (RSPB)59 sets out how this decline has continued. The report
reveals that 41% of UK species have declined. 133 species assessed have already been lost from UK shores since 1500. The evidence from the last 50 years shows that significant and ongoing changes in the way we manage our land for agriculture and the ongoing effects of climate change are having the biggest impacts on nature.
2.143 The greatest immediate threat to habitats is land use change, but alongside direct habitat loss are more subtle agents of habitat deterioration; lack of or inappropriate management, degradation due to adjacent land uses, fragmentation and insufficient connectivity to support populations of species.60
2.144 Strategic planning for nature conservation at the landscape scale is required to manage these pressures and to restore ecological networks. The Natural Environment White Paper (2011), taking the conclusions from ‘Making Space for Nature’, advocates that high quality
reservoirs, such as designated nature conservation sites, should be linked at a landscape scale, with what is needed is to:
� Improve the quality of current sites by better habitat management;
� Increase the size of current wildlife sites; � Enhance connections between, or join up, sites, either through physical corridors or through ‘stepping stones’;
� Create new sites; and � Reduce the pressures on wildlife by improving the wider environment, including through buffering wildlife sites;
� Summarised as: ‘More, bigger, better and joined.’
2.145 England’s biodiversity strategy, ‘Biodiversity 2020’, responds to the Aichi Biodiversity targets61 of ensuring ecosystems are resilient by 2020, with the NPPF also setting
64
PEOPLE AND NATURE NETWORK
out that in delivering sustainable development a net gain for biodiversity should be secured. These strategies are further supported by the Governments 25 Year Environment Plan (2018)62 and the draft Environment Bill.
2.146 The 25 Year Environment Plan sets targets for a resilient network of land water and sea. On the land and in freshwaters the 25 Year Plan seeks to restore to favourable condition 75% of protected sites, restoring 500,000ha of priority habitat outside the protected sites; taking action to recover important lost species; increasing woodland by 180,000ha by 2042. All of this work will be captured in the Nature Recovery Network objective which is also set out in the 25 Year Plan.
2.147 The commitments for a nature recovery network and an additional 500,000ha of priority habitat seek to achieve a major step change in nature conservation in accordance with the challenges set out in the Lawton Report.
62 gov.uk/government/publications/25-year-environment-plan
63 http://sussexlnp.org.uk/wp-content/uploads/2019/12/Natural-Capital-Investment-Strategy_ADOPTED_Final_Dec2019.pdf
64 Sites of Importance for Nature Conservation/Sites of Nature Conservation Importance, identified by county Wildlife Trusts.
2.148 At a local level Sussex Local Nature Partnership are developing the Natural Capital Investment Strategy63 which integrates with the work of the PANN, particularly on Accessible Natural Green Space and Health and Well Being. The strategy will guide its approach to directing investment in nature across the terrestrial, coastal and marine environments for the next 5 year period and beyond.
2.149 Green infrastructure has an important role to play in achieving these targets. The concept of seeking multiple benefits from green infrastructure offers opportunities to increase biodiversity value in a planned manner which support the creation of landscape scale networks. Green infrastructure also offers particular opportunities to bring nature into urban centres, not only making urban areas better for wildlife, but also allowing people to come into contact with nature.
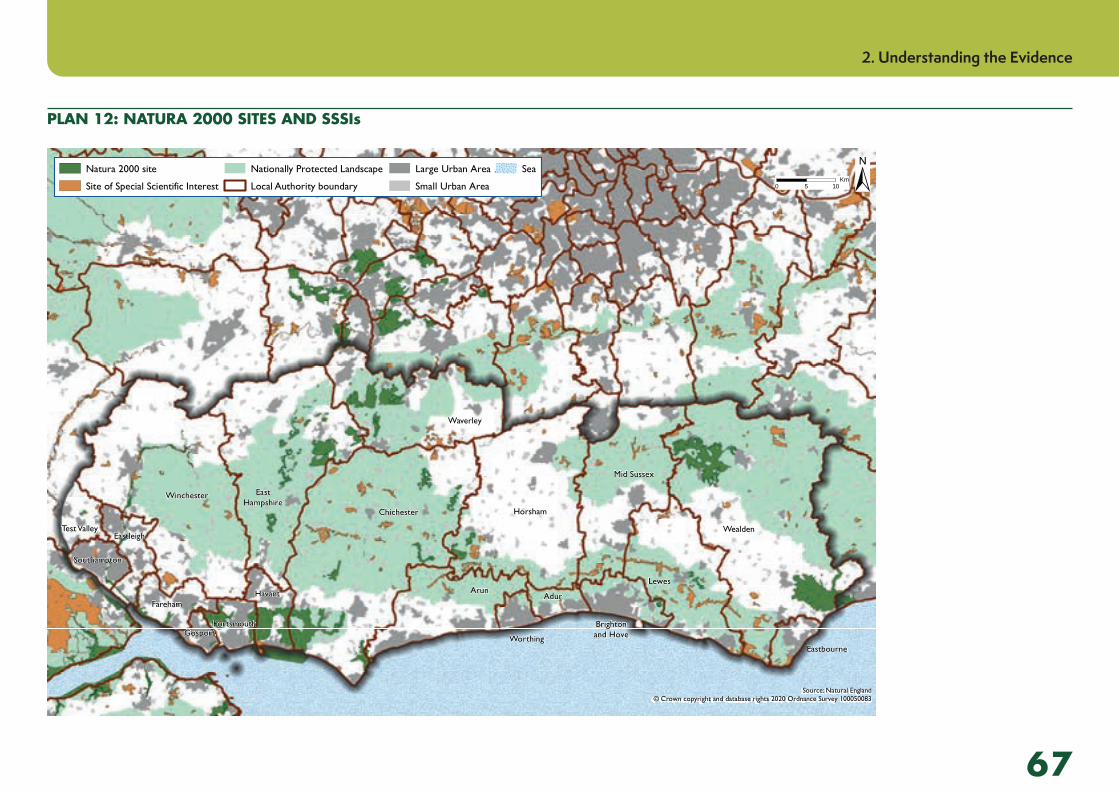
DESCRIPTION OF THE NETWORK AREA AND ANALYSIS2.150 The nature conservation value of the Network area is varied. It is host to many priority habitats and species and with its biodiversity interest intrinsically linked to the landscape and cultural heritage. A summary of designations is shown in Table 3 and Plan 12.
2.151 Running from west to east across the Network area is the ridge of the South Downs, historically the iconic sheep-grazed Downland linking the Heritage Coast at Beachy Head to Winchester. There are several Special Areas of Conservation (SAC) of international importance, along with many Sites of Special Scientific Interest (SSSI). Many more sites have been identified at county level as being important (SINCs/SNCIs).64
2. Understanding the Evidence
65
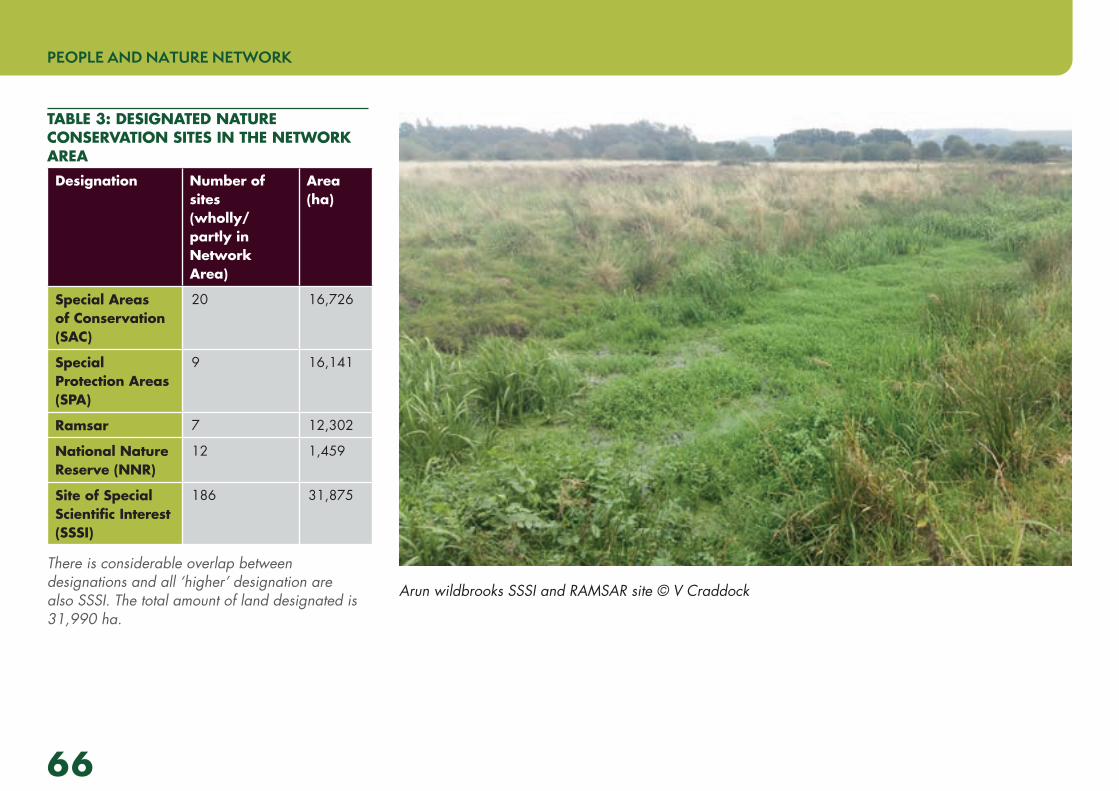
TABLE 3: DESIGNATED NATURE CONSERVATION SITES IN THE NETWORK AREA Designation Number of
sites (wholly/ partly in Network Area)
Area (ha)
Special Areas of Conservation (SAC)
20 16,726
Special Protection Areas (SPA)
9 16,141
Ramsar 7 12,302
National Nature Reserve (NNR)
12 1,459
Site of Special Scientific Interest (SSSI)
186 31,875
There is considerable overlap between designations and all ‘higher’ designation are also SSSI. The total amount of land designated is 31,990 ha.
Arun wildbrooks SSSI and RAMSAR site © V Craddock
66
PEOPLE AND NATURE NETWORK
PLAN 12: NATURA 2000 SITES AND SSSIs
Southampton
Brightonand Hove
Portsmouth
EastHampshire
Waverley
Mid Sussex
Test ValleyEastleigh
Winchester
Gosport
FarehamHavant
Worthing
Adur
Lewes
Chichester Horsham
Arun
Wealden
Eastbourne
Source: Natural England© Crown copyright and database rights 2020 Ordnance Survey 100050083
Natura 2000 site
Site of Special Scientific Interest
Nationally Protected Landscape
Local Authority boundary
Large Urban Area
Small Urban Area
Sea ±0 5 10Km
2. Understanding the Evidence
67
2.152 The South Downs Way Ahead Nature Improvement Area (NIA) focused on the calcareous (chalk) grassland habitat that comprise the ridge of the South Downs. The vision is for ‘A better connected chalk ecosystem, sustainably managed to enhance biodiversity and people’s well- being for now and the future’. The NIA brought together 29 partners between 2012-15 to implement a landscape-scale approach to bring about biodiversity improvements and securing population gains for the rare Duke of Burgundy butterfly. Although the pilot period has ended, the NIA partners will continue to work together.
2.153 The greensand of the Western Weald produces important lowland heathland habitats. There is a concentration of sites, many internationally designated, running north east between Liss and the Godalming area. A chain of heathland sites also runs along the River Rother between Petersfield and Pulborough. To the north east of the Network area, in the High Weald Area of Outstanding Natural Beauty is Ashdown Forest, an extensive and internationally important area of heathland and woodland.
2.154 The river valleys intersect the South Downs running north to south, from the chalk rivers of the Itchen and Meon in the west, through to the Adur, Arun, Ouse and Cuckmere and the Pevensey levels in the far east of the Network area. Also in the east, where the Downs meet the sea, are the
65 Areas which have been continuously wooded since at least 1600AD.
iconic chalk cliffs of the Seven Sisters and Beachy Head, that comprise the Seaford to Beachy Head SSSI and where the intertidal portion west of Beachy Head is designated as part of the Beachy Head West Marine Conservation Zone and East of Beachy Head is also now designated a MCZ. The River Rother follows the foot of the scarp flowing west to east to join the Arun and the River Wey flows northwards from northern East Hampshire. All of these rivers are important habitats for a diverse range of species and form blue-green corridors.
2.155 There are large areas of woodland, particularly in central Chichester District, to the north of East Hampshire and in the High Weald AONB, the most wooded part of England. Much of this diverse resource is ancient woodland65 of many types, including the beech hanger woodlands in Hampshire and yew woodland at Kingley Vale, both SACs, the historic parklands with wooded pasture (Petworth) and wet floodplain woodlands. There are also large areas of plantation on former ancient woodland sites. The coastal plain and the area between the South Downs National Park and the High Weald AONB are far less wooded.
St Catherines Hill, Winchester © Sam Moore
68
PEOPLE AND NATURE NETWORK
PLAN 13: BIODIVERSITY OPPORTUNITY AREAS, MAIN PRIORITY HABITATS AND DESIGNATED NATURE CONSERVATION SITES
Southampton
Brightonand Hove
Portsmouth
EastHampshire
Waverley
Mid Sussex
Test ValleyEastleigh
Winchester
Gosport
FarehamHavant
Worthing
Adur
Lewes
Chichester
Horsham
Arun
Wealden
Eastbourne
Source: Natural England; HBIC; SxBRC© Crown copyright and database rights 2020 Ordnance Survey 100050083
Coastal and floodplain grazing marsh
Coastal saltmarsh
Coastal sand dunes
Coastal vegetated shingle
Deciduous woodland
Good quality semi-improved grassland
Lowland calcareous grassland
Lowland dry acid grassland
Lowland fens
Lowland heathland
Lowland meadows
Maritime cliff and slope
Mudflats
Purple moor grass and rush pastures
Reedbeds
Saline lagoons
Traditional orchard
SSSI/NNR
Natura/Ramsar site
Biodiversity Opportunity Area
Local Authority boundary
Large Urban Area
Small Urban Area
Sea
±0 5 10Km
2. Understanding the Evidence
69
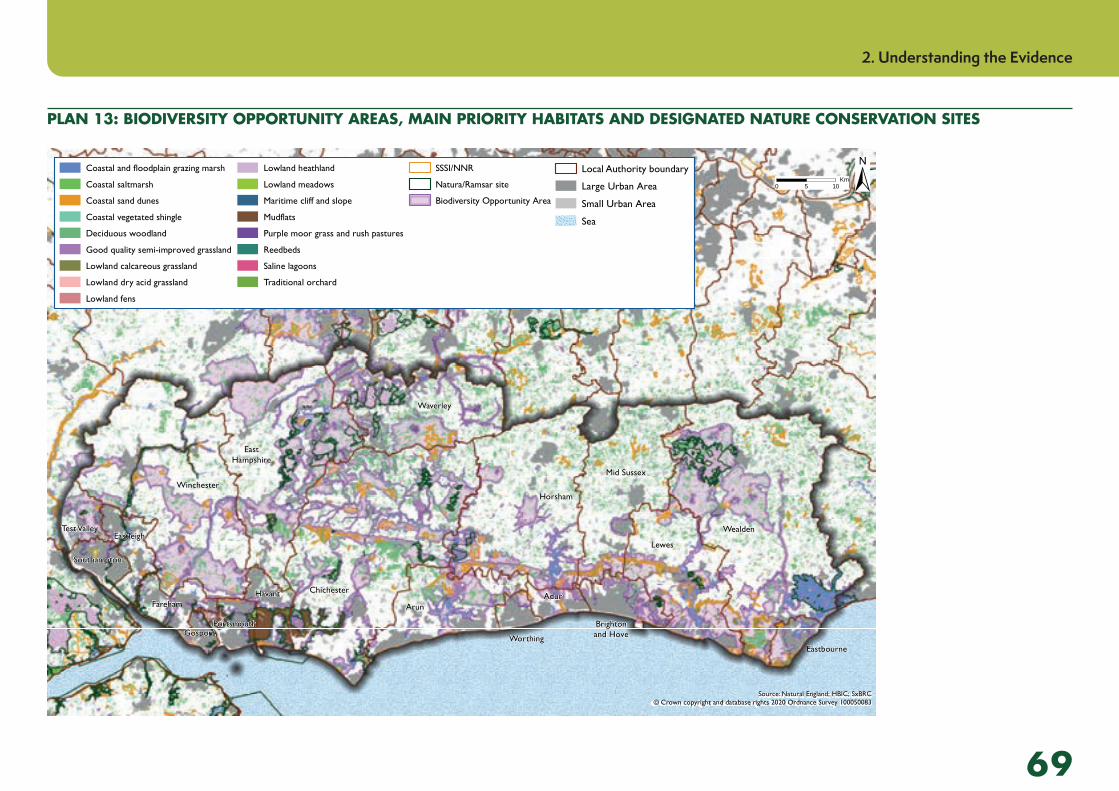
ECOLOGICAL CONNECTIVITY2.156 In 2008, through wide consultation and evidence review, the first landscape scale approach to identifying priority areas for biodiversity enhancement was carried out and a number of ‘Biodiversity Opportunity Areas’ (BOAs) were documented.66 Previously, the South East Wildlife Trusts had published priority areas for reconnecting ecological networks, which is being taken forward in the Living Landscapes Programme (Plan 13).67
2.157 Natural England (NE) also recognises habitats of ‘principal importance’ for nature conservation, with a target to bring 90% of these priority habitats into favourable condition by 2020. BOAs and priority habitats are shown in Plan 12.
2.158 Further work has been carried out to understand better ecological networks. A comprehensive study has been carried out in the South Downs National Park, assessing the connectivity of priority habitats and identifying habitat opportunity areas based on connectivity principles. The approach taken linked with existing modelling carried out for heathland and
66 By the South East Biodiversity Forum.
67 The Wildlife Trusts in the South East (2007), A Living Landscape for the South East.
68 https://documents.hants.gov.uk/biodiversity/MappingtheHampshireEcologicalNetworkFinalReport.pdf
69 https://naturalengland-defra.opendata.arcgis.com/datasets/natural-england-national-priority-focus-areas
70 Water Vole, Woodland Bats, Barn Owl, North Lapwing, Chalkhill Blue butterfly, Dormice.
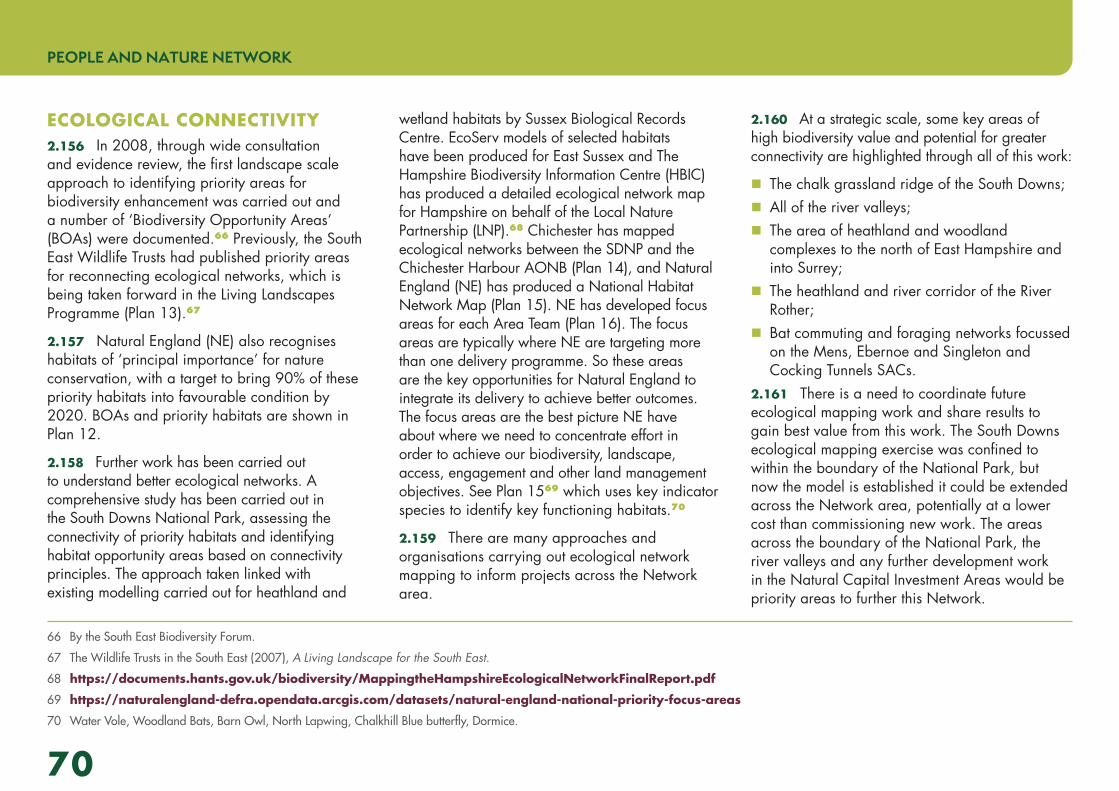
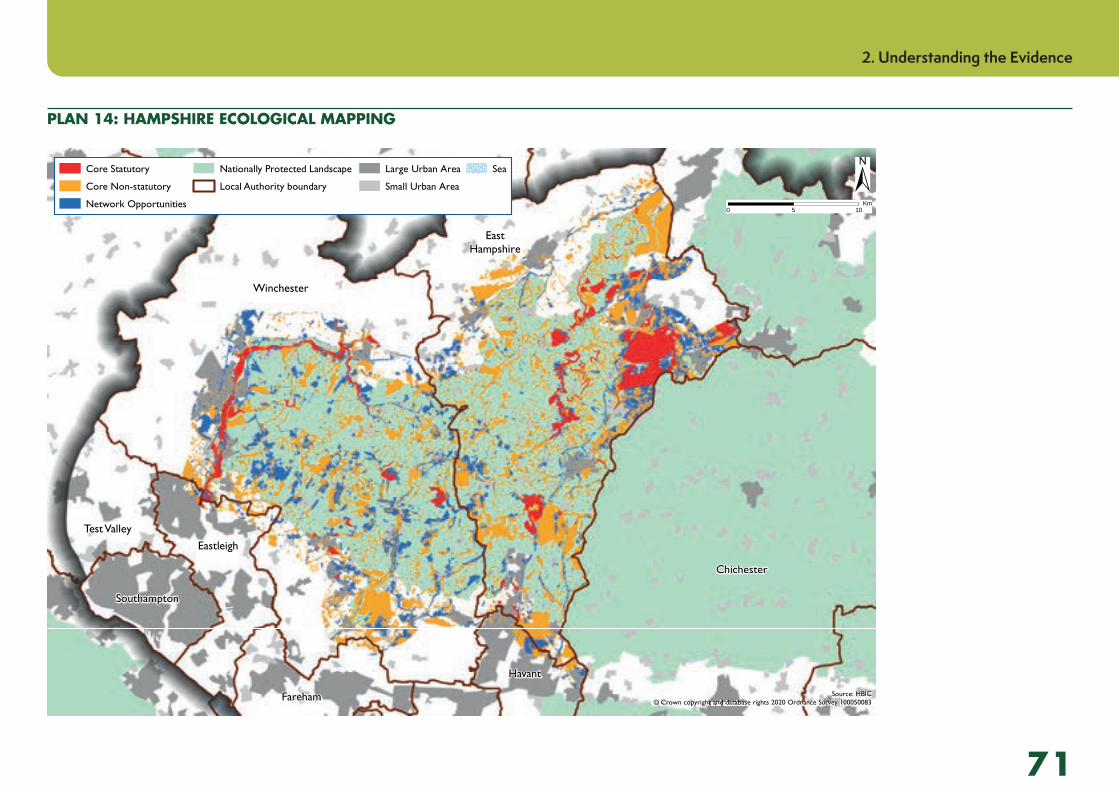
wetland habitats by Sussex Biological Records Centre. EcoServ models of selected habitats have been produced for East Sussex and The Hampshire Biodiversity Information Centre (HBIC) has produced a detailed ecological network map for Hampshire on behalf of the Local Nature Partnership (LNP).68 Chichester has mapped ecological networks between the SDNP and the Chichester Harbour AONB (Plan 14), and Natural England (NE) has produced a National Habitat Network Map (Plan 15). NE has developed focus areas for each Area Team (Plan 16). The focus areas are typically where NE are targeting more than one delivery programme. So these areas are the key opportunities for Natural England to integrate its delivery to achieve better outcomes. The focus areas are the best picture NE have about where we need to concentrate effort in order to achieve our biodiversity, landscape, access, engagement and other land management objectives. See Plan 1569 which uses key indicator species to identify key functioning habitats.70
2.159 There are many approaches and organisations carrying out ecological network mapping to inform projects across the Network area.
2.160 At a strategic scale, some key areas of high biodiversity value and potential for greater connectivity are highlighted through all of this work:
� The chalk grassland ridge of the South Downs; � All of the river valleys; � The area of heathland and woodland complexes to the north of East Hampshire and into Surrey;
� The heathland and river corridor of the River Rother;
� Bat commuting and foraging networks focussed on the Mens, Ebernoe and Singleton and Cocking Tunnels SACs.
2.161 There is a need to coordinate future ecological mapping work and share results to gain best value from this work. The South Downs ecological mapping exercise was confined to within the boundary of the National Park, but now the model is established it could be extended across the Network area, potentially at a lower cost than commissioning new work. The areas across the boundary of the National Park, the river valleys and any further development work in the Natural Capital Investment Areas would be priority areas to further this Network.
70
PEOPLE AND NATURE NETWORK
PLAN 14: HAMPSHIRE ECOLOGICAL MAPPING
Southampton
EastHampshire
Test ValleyEastleigh
Winchester
Fareham
Havant
Chichester
Source: HBIC© Crown copyright and database rights 2020 Ordnance Survey 100050083
Core Statutory
Core Non-statutory
Network Opportunities
Nationally Protected Landscape
Local Authority boundary
Large Urban Area
Small Urban Area
Sea ±0 5 10
Km
2. Understanding the Evidence
71
PLAN 15: NATIONAL HABITAT NETWORK MAP
Contains OS data © Crown Copyright and database right 2019
Source: Natural England© Crown copyright and database rights 2020 Ordnance Survey 100050083
National Habitat Networks - Priority Restoration
Fragmentation Action Zone
Potential Network Join
National Habitat Networks
Primary Habitat
Associated Habitats
Restorable Habitat
Habitat Restoration-Creation
Network Enhacement Zone 1
Network Enhancement Zone 2
Nationally Protected Landscape
County boundary
Sea±0 5 10
Km
72
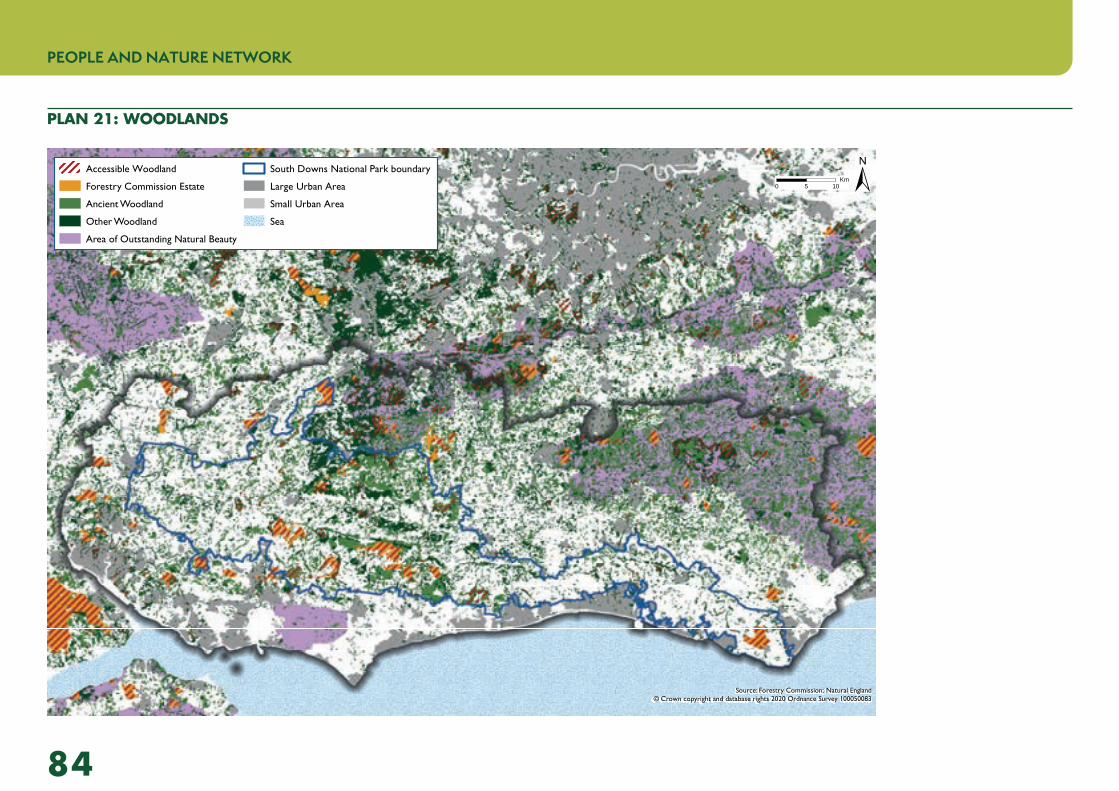
PEOPLE AND NATURE NETWORK

PLAN 16: NATURAL ENGLAND FOCUS AREAS MAP
ShelteredCoast
ThamesBasin Heaths
HampshireHighlands
Wealden Meadowsand Grasslands
PevenseyMarshes
ChichesterHarbours
and Pagham
South Downs
Woodsand
Parks
Woods andParks
New Forest
Woods andParks
Woods andParks
Woods andParks
South Downs
Surrey Hills
Source: Natural England© Crown copyright and database rights 2020 Ordnance Survey 100050083
Natural England Priority Focus Area
Chichester Harbours and Pagham
Hampshire Highlands
New Forest
Pevensey Marshes
Sheltered Coast
South Downs
Surrey Hills
Thames Basin Heaths
Wealden Meadows and Grasslands
Woods and Parks
South Downs National Park boundary
Local Authority boundary
Large Urban Area
Small Urban Area
Sea
±0 5 10Km
2. Understanding the Evidence
73
RECREATION AND URBAN EDGE PRESSURES2.162 The debate and evidence relating to recreation and wildlife is complex, but it is clear that on some sites recreational access can have a detrimental effect on biodiversity through effects such as trampling, disturbance, erosion or general degradation such as litter and anti-social behaviour. Urban edge sites in particular can be subject to a high level of impacts including fly-tipping, arson, motor vehicle use and damage to infrastructure preventing habitat management.
2.163 Habitat Regulations Assessments for European designated sites consider this issue. The Hampshire and Isle of Wight Wildlife Trust71 and two reports for the South Downs National Park72 have also investigated this issue.
2.164 In the Access Network and Accessible Natural Greenspace (ANG) Study two types of site were recorded; both European designated sites for which a Habitat Regulations Assessment indicated that recreation could have an effect on the protected species or habitats and sites highlighted through discussion with the South Downs National Park officers, Natural England, the National Trust and the Wildlife Trusts of Sussex and Hampshire and Isle of Wight.
71 Hampshire and Isle of Wight Wildlife Trust (2012), Fresh Air and Exercise.
72 South Downs National Park, Visitor Survey 2012, Environment Element, Final Report and the Access Network and Accessible Natural Greenspace (ANG) Study (2013).
2.165 Plans 17 and 18 show sites identified as potentially sensitive to recreation in relation to the overall provision of ANG sites.
2.166 Some key areas emerge from this research:
� Visitor management across the entire coastal area needs careful consideration of greenspace provision due to increases in housing, e.g. north of Adur-Worthing, which has the lowest density of ANG and little urban greenspace and where five sites were identified;
� Chichester and Pagham Harbours are in an area with low provision of rights of way and accessible natural greenspace and, although mitigation measures to relieve visitor pressure on the European designated sites are being taken forward separately, further accessible greenspace would support these measures;
� The European sites of Thursley, Wealden Heaths Phase II SPA and Shortheath Common SAC have been assessed as sensitive to recreational pressure, with mitigation measures proposed. However, several further sites were identified as potentially sensitive, supporting the recommendation in the East Hampshire Green Infrastructure Strategy (2013) for a cross-boundary approach to visitor management;
� The Winchester Green Infrastructure Study recognises a deficit in Local Nature Reserves,
with potentially recreation sensitive sites in and around the city. The Open Spaces Strategy (2015) found a small surplus of informal green space within the town.
� The Solent Recreation Mitigation Partnership enables the 15 surrounding local authorities to collectively address recreational impacts on the 3 Solent SPAs due to new housing development.
2.167 In taking forward more local level green infrastructure planning, further investigation could include:
� Understanding how much of the open space network consists of biodiversity sites; which of these are potentially sensitive; and how favourable opportunities are to link to sites in close proximity to create bigger more joined up habitat;
� Identifying sites which serve a high population for which there is limited other open space;
� Building the evidence base to understand better both visitors and impacts;
� Cross-boundary green infrastructure, especially provision of larger sites – sites in one local authority area will serve visitors from an adjacent area;
� Developing more integrated approaches to creation of attractive and accessible areas
74
PEOPLE AND NATURE NETWORK
close to where people live – those seeking recreational space, or even a degree of ‘naturalness’, may not necessarily need high quality biodiversity sites. Other approaches to increase access may help to relieve pressure.
� Working with Neighbourhood Plan groups to help them incorporate green infrastructure planning within Neighbourhood Development Plans. All NDPs have to be consistent with the Local Plan so where there is a Local Plan policy on GI this would still be relevant. Incorporating GI with the NDP however would enable communities to express more local needs and requirements and aspirations.
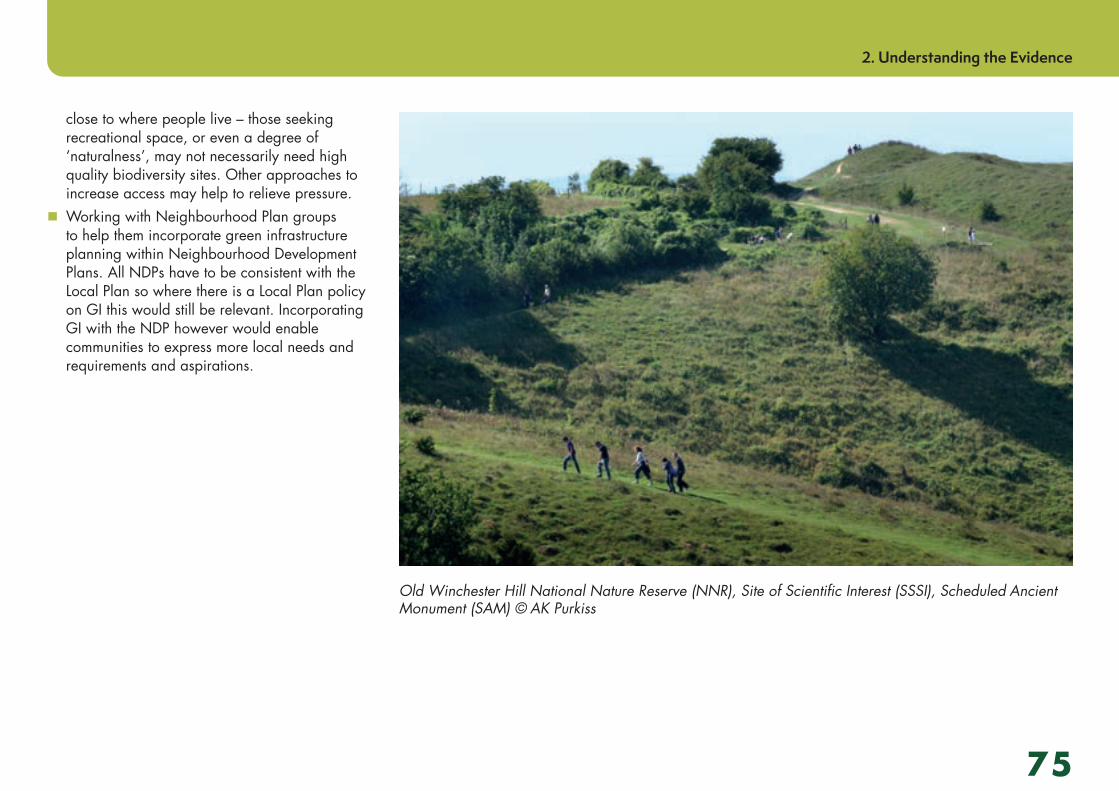
Old Winchester Hill National Nature Reserve (NNR), Site of Scientific Interest (SSSI), Scheduled Ancient Monument (SAM) © AK Purkiss
2. Understanding the Evidence
75
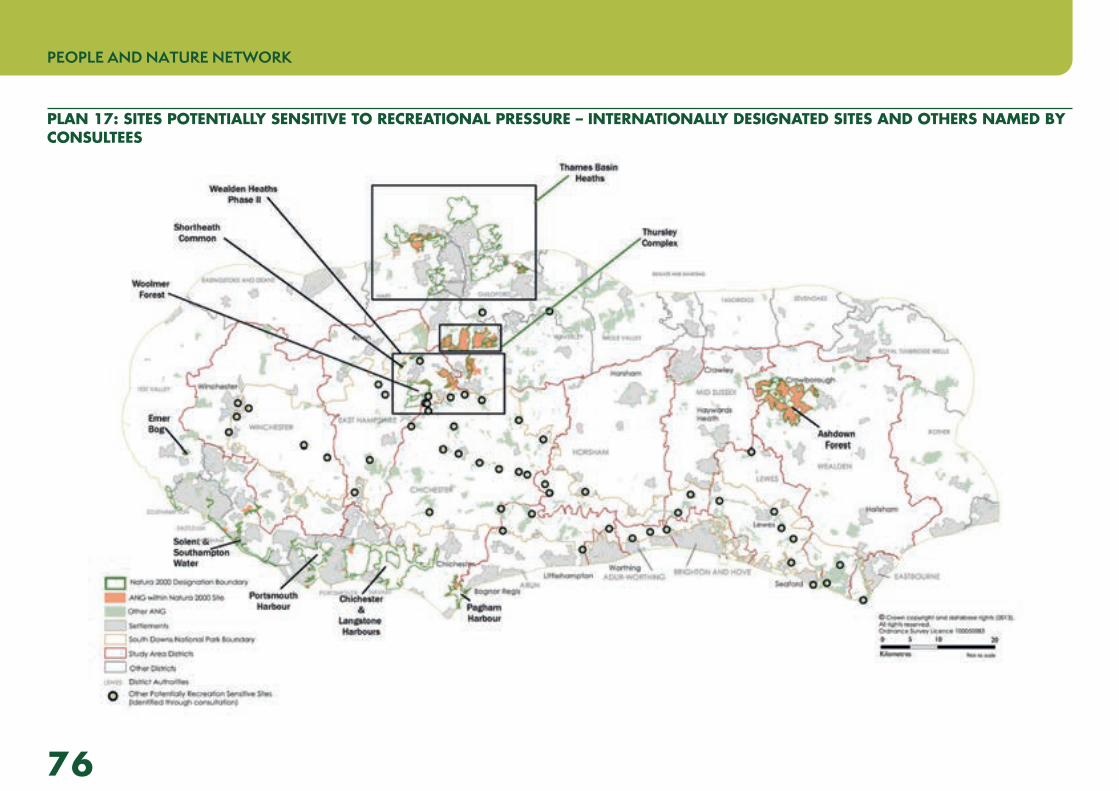
PLAN 17: SITES POTENTIALLY SENSITIVE TO RECREATIONAL PRESSURE – INTERNATIONALLY DESIGNATED SITES AND OTHERS NAMED BY CONSULTEES
76
PEOPLE AND NATURE NETWORK
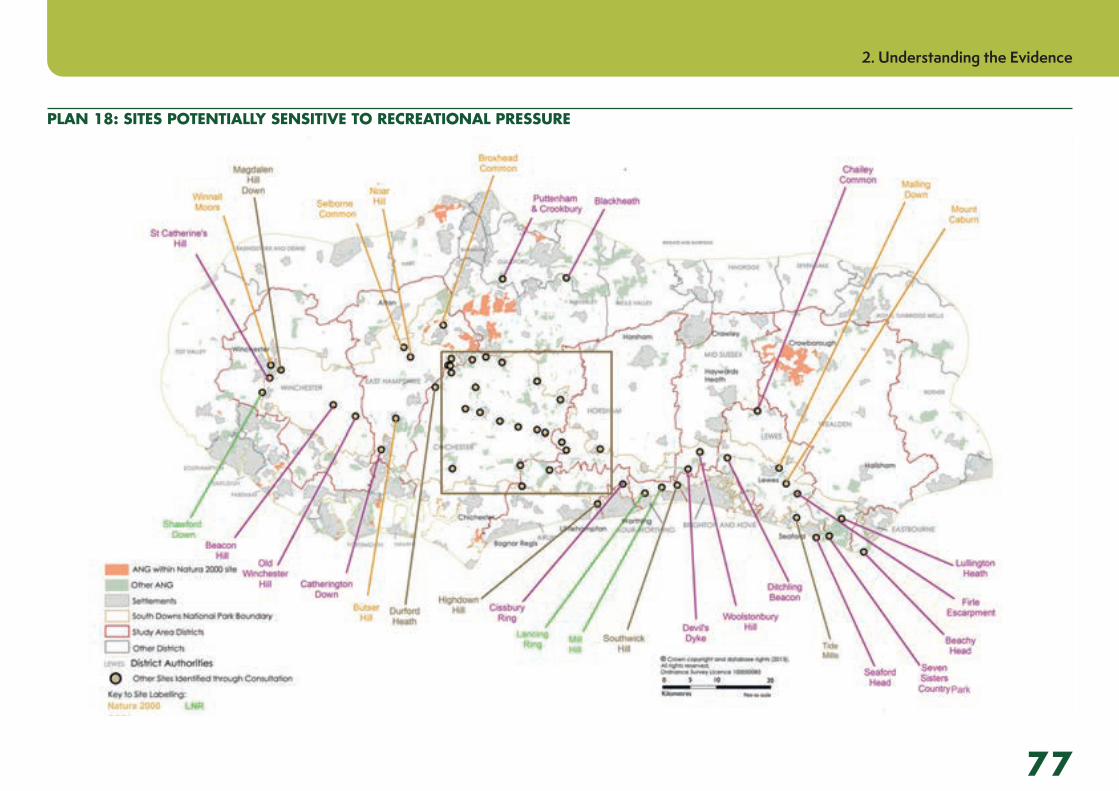
PLAN 18: SITES POTENTIALLY SENSITIVE TO RECREATIONAL PRESSURE
2. Understanding the Evidence
77

LINKS TO ECOSYSTEM SERVICES2.168 Biodiversity is a supporting ecosystem service. There is growing evidence that the stability of ecosystem service provision improves with greater biodiversity. Overall, however, there has been significant biodiversity loss in the last 50 years, with the main drivers being land use change and pollution.73
2.169 The Geographic Information Systems (GIS) EcoServ-GIS model has been used in the evidence base for biodiversity.
2.170 EcoServ-GIS uses spatial data, such as greenspaces, habitats, landscape character, along with socio-economic data to show where ecosystem services occur and to indicate levels of demand (need) for a given ecosystem service and the capacity of the ecosystem to deliver that service.
2.171 Two models were run to include in the evidence base for this theme.Pollination Services (see below) and Carbon Storage (see page 85 onwards)
POLLINATION SERVICES
2.172 Wild pollinators such as bees and wild insects are vital in sustaining crop production. Land use is important in sustaining these pollinating species, with natural and semi-natural habitats providing additional sources
73 National Ecosystem Assessment (2011), Chapter 4, Biodiversity.
of pollination. Although the relationship of the many species of pollinators with the landscape is highly complex, studies have indicated the distance that pollinators tend to travel and have shown that urban landscapes do not necessarily impact negatively on pollinators. Different habitats provide more or less resource; for example pollinators can use all of grassland, but tend to use only the edge of woodlands. These factors are used by EcoServ-GIS to model the capacity of the ecosystems to provide pollination services. The demand (need) for pollination services is generating by identifying agricultural land, allotments and orchards, with the assumption that the need is greatest on or directly adjacent to that land and declines as the distance from this land decreases.
2.173 The modelling highlighted clearly the arable areas of the Network area; in Winchester, along the South Downs and the coastal plain area between Chichester and Bognor Regis, see Plan 19. While there were a few isolated areas where high demand was being met by existing ecosystems, in most areas there is capacity to improve this function. The need for this service extends to the urban edges, particularly apparent around Bognor Regis, the coastal towns, Chichester and Winchester. Urban edge greenspace in these areas should therefore consider improvements to pollination services and urban green infrastructure initiatives could
also help to support the pollinators needed for allotments within towns.
2.174 Those areas shown are:
� Pollination High Demand – High Capacity are areas where there is a high need for pollination services and the ecosystems are performing well in providing this. These areas should be conserved and protected;
� Pollination High Demand – Low Capacity are those areas where there is a high need for pollination services but the performance of ecosystems in providing this could be improved. Pollination capacity in ecosystems should be increased.
� Pollination Service Benefitting Areas – These are areas where there is some need for pollination services along with some capacity in existing ecosystems to deliver this.
78
PEOPLE AND NATURE NETWORK
PLAN 19: ECOSERV-GIS – POLLINATION
Southampton
Brightonand Hove
Portsmouth
EastHampshire
Waverley
Mid Sussex
Test ValleyEastleigh
Winchester
Gosport
FarehamHavant
Worthing
Adur
Lewes
Chichester Horsham
Arun
Wealden
Eastbourne
Source: EcoServ-GIS, Sussex Biodiversity Records Centre (2015)© Crown copyright and database rights 2020 Ordnance Survey 100050083
±0 5 10Km
South Downs National Park boundary
Local Authority boundary
Large Urban Area
Small Urban Area
SeaPollination - ESBA Management Zones Prioritised
Maintain/Improve/Assess
Protect / Maintain
2. Understanding the Evidence
79
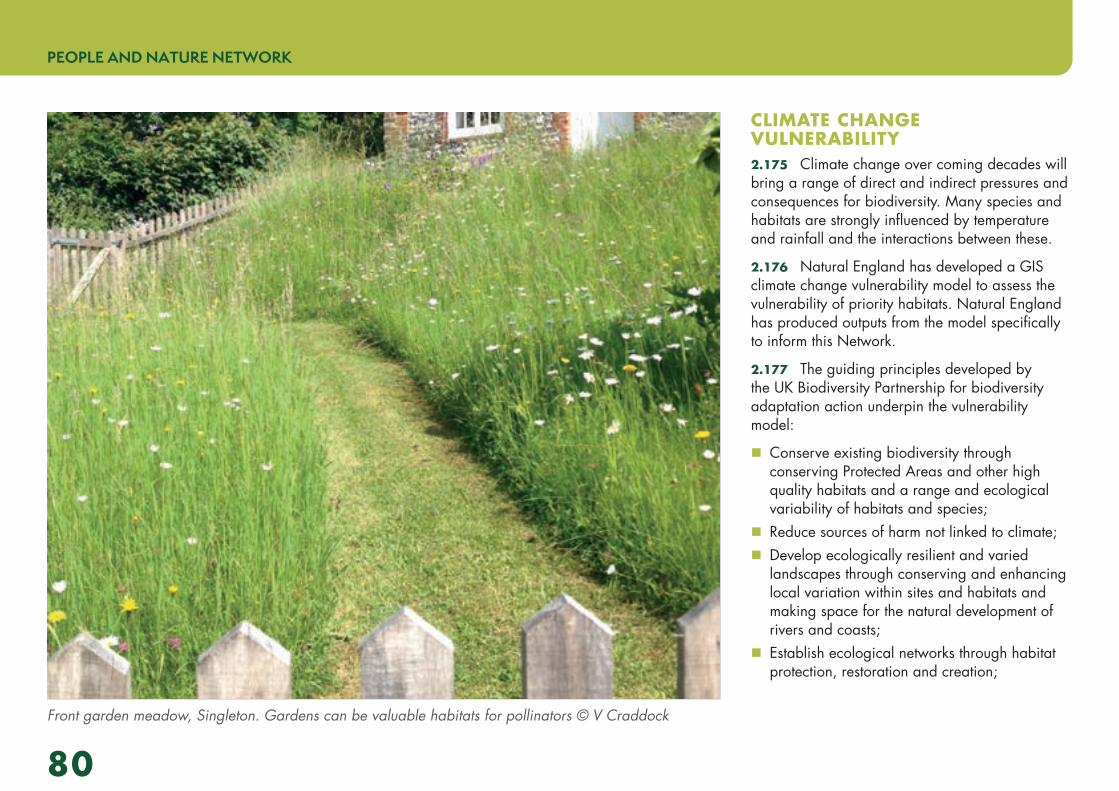
Front garden meadow, Singleton. Gardens can be valuable habitats for pollinators © V Craddock
CLIMATE CHANGE VULNERABILITY2.175 Climate change over coming decades will bring a range of direct and indirect pressures and consequences for biodiversity. Many species and habitats are strongly influenced by temperature and rainfall and the interactions between these.
2.176 Natural England has developed a GIS climate change vulnerability model to assess the vulnerability of priority habitats. Natural England has produced outputs from the model specifically to inform this Network.
2.177 The guiding principles developed by the UK Biodiversity Partnership for biodiversity adaptation action underpin the vulnerability model:
� Conserve existing biodiversity through conserving Protected Areas and other high quality habitats and a range and ecological variability of habitats and species;
� Reduce sources of harm not linked to climate; � Develop ecologically resilient and varied landscapes through conserving and enhancing local variation within sites and habitats and making space for the natural development of rivers and coasts;
� Establish ecological networks through habitat protection, restoration and creation;
80
PEOPLE AND NATURE NETWORK
� Make sound decisions based on analysis of the causes of change and respond to changing conservation priorities;
� Integrate adaptation and mitigation measures into conservation management, planning and practice.
2.178 This Network has the potential to support the delivery of these principles.
2.179 The model uses four measurements which, when combined, provide an overall assessment of vulnerability to climate change.
� Sensitivity to Change: classifies each priority habitat as high, medium or low sensitivity to climate change impact based on scientific literature and expert judgement;
� Habitat Fragmentation: measures how isolated or aggregated areas of the same habitat are and how permeable the surrounding landscape is. Larger patches of habitat can support larger population and are less susceptible to extremes and better connections allow species to move in the landscape;
� Topographic Heterogeneity: incorporates variations in height and aspect, as less variation can increase vulnerability;
� Management and Condition: assesses habitat condition based on SSSI condition and consultation and current negative impacts which are not linked to climate change, as these can increase vulnerability.
2.180 The overall vulnerability mapping for all priority habitats across the Network area is shown in Plan 20. Additional mapping is available for each priority habitat to further inform future planning.
2.181 The most sensitive habitats were along the river valleys, the Pevensey Levels and the wetland and coastal areas around Pagham and Chichester Harbours. Of mid sensitivity were extensive areas in north east East Hampshire and along the Rother catchment, on the coastal plain and to the west of Burgess Hill. Habitat fragmentation was high in many parts of the Network area, with lower fragmentation in some areas of north east East Hampshire and on the South Downs north of Chichester.
2.182 Overall, taking all four parameters, the most climate change vulnerable areas are indicated to be:
� All of the river valleys; � The coast and coastal plain around Chichester and Pagham Harbours;
� North east East Hampshire and the Rother and Western Streams Catchment (although this is a mixed picture and in some areas there is low vulnerability);
� The area between the High Weald AONB and South Downs National Park.
NATURE IN URBAN AREAS2.183 This is where GI is likely to have the highest human benefit and providing resources are put in place to support the community, ecological networks could be created on a local basis.
2.184 Urban areas have fragmented patches of habitat, with many breaks in connectivity and large areas of potentially hospitable greenspace; gardens, verges, institutional sites and recreational sites where the land is not necessary managed with nature in mind. Connecting the tree canopy of urban areas provides an above-ground network for wildlife.
2.185 There are advantages in improving wildlife in urban areas. For biodiversity, permeability created across an otherwise impenetrable area, especially through enhancing existing connected routes such as green or blue corridors, will increase connections around and outside the urban area. For people there are learning and Health and Wellbeing benefits in experiencing nature close to home.
2.186 Across the Network area, there is generally less accessible natural greenspace in urban areas, but there are opportunities to increase the biodiversity value of existing greenspace with altered management, for example wildflower meadows, native rather than ornamental tree planting and re-naturalising urban watercourses.
2. Understanding the Evidence
81
PLAN 20: BIODIVERSITY CLIMATE CHANGE VULNERABILITY
Southampton
Brightonand Hove
Portsmouth
EastHampshire
Waverley
Mid Sussex
Test ValleyEastleigh
Winchester
Gosport
FarehamHavant
Worthing
Adur
Lewes
Chichester
Horsham
Arun
Wealden
Eastbourne
Source: Natural England© Crown copyright and database rights 2020 Ordnance Survey 100050083
Maximum Vulnerability - Most vulnerable
Overall Vulnerability
0 - 0.3
0.3 - 0.9
0.9 - 1.2
1.2 - 1.8
1.8 - 3
Nationally Protected Landscape
Local Authority boundary
Sea±0 5 10
Km
82
PEOPLE AND NATURE NETWORK
2.187 The Brighton and Lewes Downs Biosphere is taking forward urban biodiversity enhancement projects and offers opportunities to expand initiatives through the coastal towns and across the Network area. Itree Eco should be a new paragraph
2.188 Itree eco74 provides an easily accessible programme for evaluating the environmental contribution that urban trees provide in terms of ecosystem services. It provides these Functional Analyses:
� Pollution removal and human health impacts � Carbon sequestration and storage � Avoided runoff � Building energy effects � Tree bio emissions
WOODLAND2.189 Woodlands can deliver many green infrastructure and ecosystem services functions; biodiversity, timber and fuel, recreation, carbon sequestration, improvements in air quality and urban cooling. Plan 21 shows woodland in the Network area.
2.190 Lack of management has historically been a key issue for woodland habitats. Within the protected landscapes of the South Downs
74 62: itreetools.org/eco/index.php
75 southdowns.gov.uk/planning/planning-policy/national-park-local-plan/evidence-and-supporting-documents/viewshed-analysis/
National Park and the High Weald AONB, where there is the greatest woodland cover of the Network area, there are active projects to support landowners in managing woodland. There are areas outside of the protected landscapes where there is concentration of woodland where the approach might be beneficial, for example in the area between the National park and High Weald AONB outside of both protected areas.
2.191 The South Downs ecological network mapping shows potential for improving connectivity along the foot of the scarp slope, especially at the southern end of the River Rother catchment and the area in northern East Hampshire district, both for deciduous woodland and beech-yew woodland. It also hints at potential to the east of Burgess Hill, but does not produce results beyond the National Park boundary. There are many small woodlands in this area and further connection could support access to greenspace for these two urban areas and link the protected landscapes.
2.192 In West Sussex, The Mens SAC and Ebernoe Common SAC have international importance as habitat for bat species in particular. This area of the National Park is of great importance for bats.
2.193 To the south of the National Park, north of the coastal plain, are several large woodland
estates, several with public access, but which are effectively cut off from the residents of the coast due to the A27. There may be scope in the western area of Arun/Chichester to extend woodland cover south of the A27 in the coastal plain/downs transition area, subject to retaining the important landscape character of this area. There may be potential for improving woodland connectivity and increasing recreational access in the area to the north east of Worthing to provide additional recreational area in this access-deficient area, subject again to landscape character constraints. Decisions regarding the suitability of changes to land-use and land cover can be supported by a range of ‘tools’, including Landscape Character Assessments.
2.194 The National Park Authority is developing View Characterisation (or ‘Viewshed’)75 which provides evidence on views and view types within the National Park. This should help assess the visual impact of changes and developments in the landscape; and by mapping existing important views it should be possible to identify areas where views should be retained.
2.195 There is also potential for increasing ecosystem services benefits and woodland cover is a key parameter in the EcoServ-GIS outputs of climate regulation, carbon storage and noise regulation.
2. Understanding the Evidence
83
PLAN 21: WOODLANDS
Source: Forestry Commission; Natural England© Crown copyright and database rights 2020 Ordnance Survey 100050083
±0 5 10Km
Accessible Woodland
Forestry Commission Estate
Ancient Woodland
Other Woodland
Area of Outstanding Natural Beauty
South Downs National Park boundary
Large Urban Area
Small Urban Area
Sea
84
PEOPLE AND NATURE NETWORK
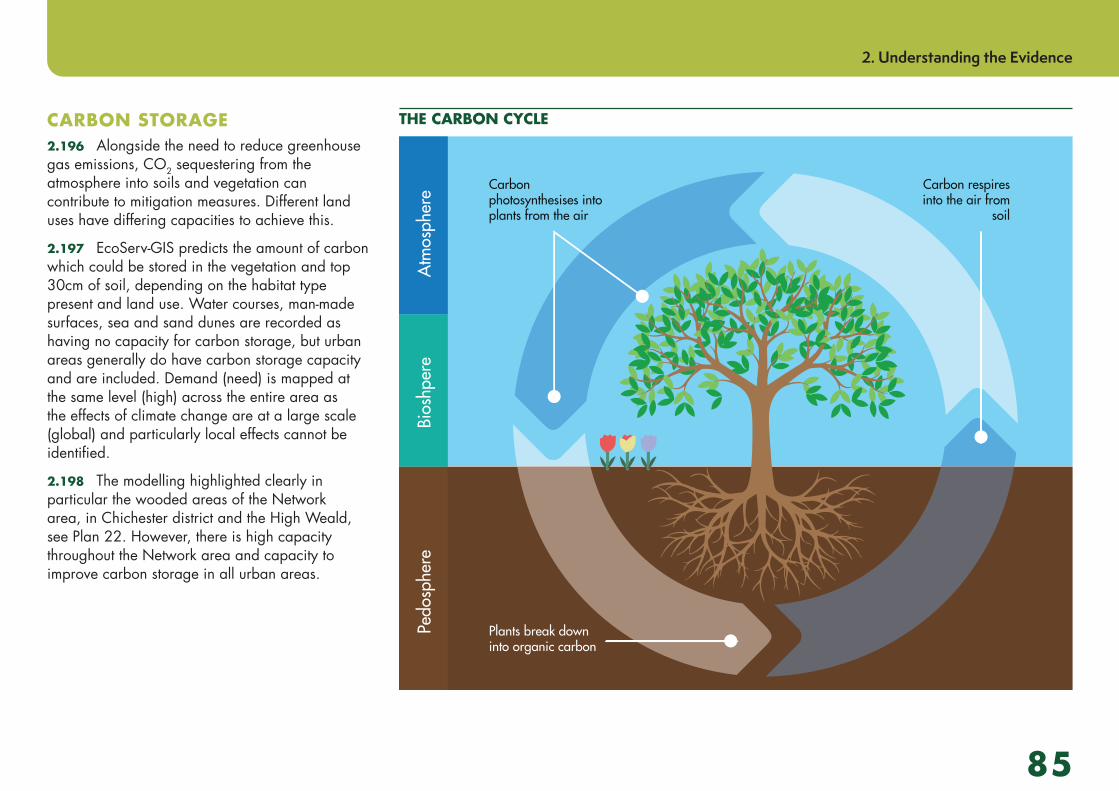
CARBON STORAGE
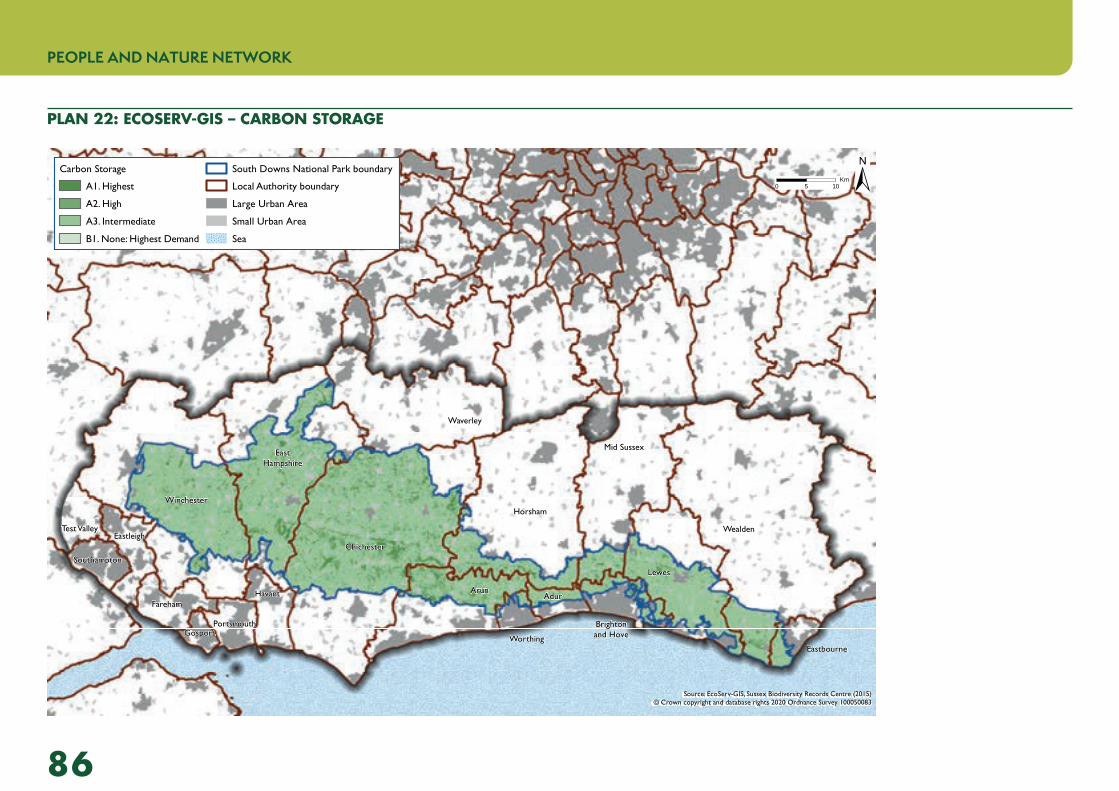
2.196 Alongside the need to reduce greenhouse gas emissions, CO2 sequestering from the atmosphere into soils and vegetation can contribute to mitigation measures. Different land uses have differing capacities to achieve this.
2.197 EcoServ-GIS predicts the amount of carbon which could be stored in the vegetation and top 30cm of soil, depending on the habitat type present and land use. Water courses, man-made surfaces, sea and sand dunes are recorded as having no capacity for carbon storage, but urban areas generally do have carbon storage capacity and are included. Demand (need) is mapped at the same level (high) across the entire area as the effects of climate change are at a large scale (global) and particularly local effects cannot be identified.
2.198 The modelling highlighted clearly in particular the wooded areas of the Network area, in Chichester district and the High Weald, see Plan 22. However, there is high capacity throughout the Network area and capacity to improve carbon storage in all urban areas.
THE CARBON CYCLE
Atm
osph
ere Carbon
photosynthesises into plants from the air
Plants break down into organic carbon
Carbon respires into the air from
soil
Bios
hper
ePe
dosp
here
2. Understanding the Evidence
85
PLAN 22: ECOSERV-GIS – CARBON STORAGE
Southampton
Brightonand Hove
Portsmouth
EastHampshire
Waverley
Mid Sussex
Test ValleyEastleigh
Winchester
Gosport
FarehamHavant
Worthing
Adur
Lewes
Chichester
Horsham
Arun
Wealden
Eastbourne
Source: EcoServ-GIS, Sussex Biodiversity Records Centre (2015)© Crown copyright and database rights 2020 Ordnance Survey 100050083
Carbon Storage
A1. Highest
A2. High
A3. Intermediate
B1. None: Highest Demand
South Downs National Park boundary
Local Authority boundary
Large Urban Area
Small Urban Area
Sea
±0 5 10Km
86
PEOPLE AND NATURE NETWORK
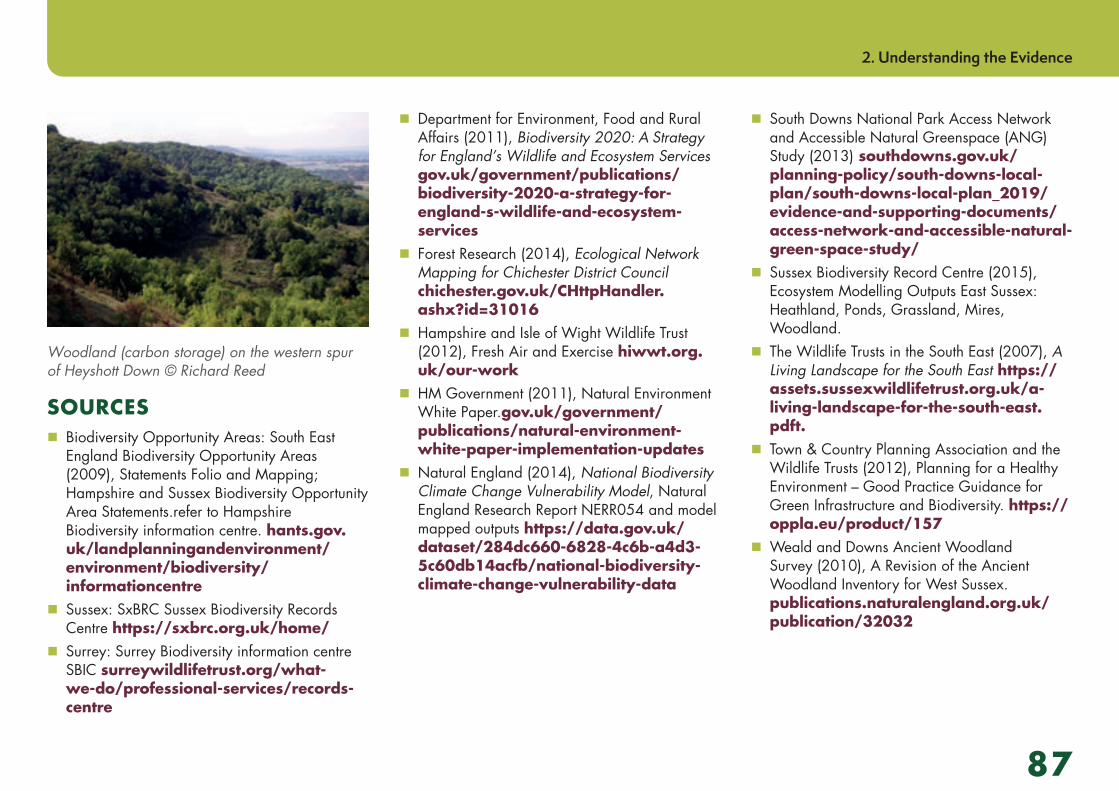
Woodland (carbon storage) on the western spur of Heyshott Down © Richard Reed
SOURCES � Biodiversity Opportunity Areas: South East England Biodiversity Opportunity Areas (2009), Statements Folio and Mapping; Hampshire and Sussex Biodiversity Opportunity Area Statements.refer to Hampshire Biodiversity information centre. hants.gov.uk/landplanningandenvironment/environment/biodiversity/informationcentre
� Sussex: SxBRC Sussex Biodiversity Records Centre https://sxbrc.org.uk/home/
� Surrey: Surrey Biodiversity information centre SBIC surreywildlifetrust.org/what-we-do/professional-services/records-centre
� Department for Environment, Food and Rural Affairs (2011), Biodiversity 2020: A Strategy for England’s Wildlife and Ecosystem Services gov.uk/government/publications/biodiversity-2020-a-strategy-for-england-s-wildlife-and-ecosystem-services
� Forest Research (2014), Ecological Network Mapping for Chichester District Council chichester.gov.uk/CHttpHandler.ashx?id=31016
� Hampshire and Isle of Wight Wildlife Trust (2012), Fresh Air and Exercise hiwwt.org.uk/our-work
� HM Government (2011), Natural Environment White Paper.gov.uk/government/publications/natural-environment-white-paper-implementation-updates
� Natural England (2014), National Biodiversity Climate Change Vulnerability Model, Natural England Research Report NERR054 and model mapped outputs https://data.gov.uk/dataset/284dc660-6828-4c6b-a4d3-5c60db14acfb/national-biodiversity-climate-change-vulnerability-data
� South Downs National Park Access Network and Accessible Natural Greenspace (ANG) Study (2013) southdowns.gov.uk/planning-policy/south-downs-local-plan/south-downs-local-plan_2019/evidence-and-supporting-documents/access-network-and-accessible-natural-green-space-study/
� Sussex Biodiversity Record Centre (2015), Ecosystem Modelling Outputs East Sussex: Heathland, Ponds, Grassland, Mires, Woodland.
� The Wildlife Trusts in the South East (2007), A Living Landscape for the South East https://assets.sussexwildlifetrust.org.uk/a-living-landscape-for-the-south-east.pdft.
� Town & Country Planning Association and the Wildlife Trusts (2012), Planning for a Healthy Environment – Good Practice Guidance for Green Infrastructure and Biodiversity. https://oppla.eu/product/157
� Weald and Downs Ancient Woodland Survey (2010), A Revision of the Ancient Woodland Inventory for West Sussex. publications.naturalengland.org.uk/publication/32032
2. Understanding the Evidence
87