Embed Size (px)
Citation preview
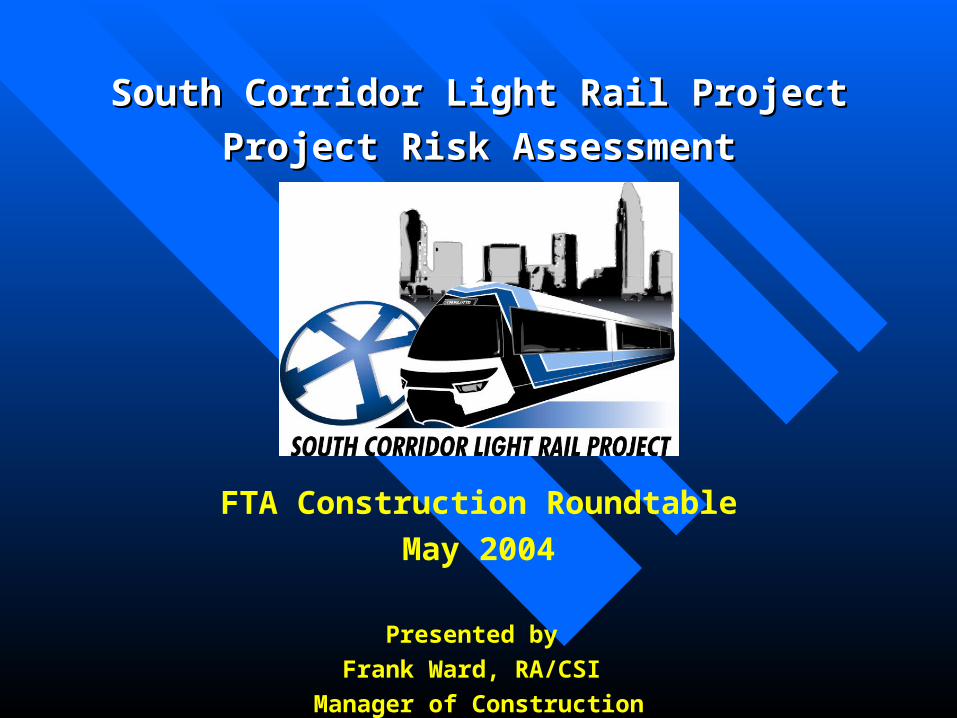
South Corridor Light Rail ProjectSouth Corridor Light Rail Project
Project Risk AssessmentProject Risk Assessment
FTA Construction Roundtable
May 2004
Presented by
Frank Ward, RA/CSI
Manager of Construction
Presentation OutlinePresentation Outline
Project OverviewProject Overview BackgroundBackground Risk Assessment Workshop Risk Assessment Workshop Risk Assessment ReportRisk Assessment Report Risk MitigationRisk Mitigation Current ActivitiesCurrent Activities Lessons LearnedLessons Learned
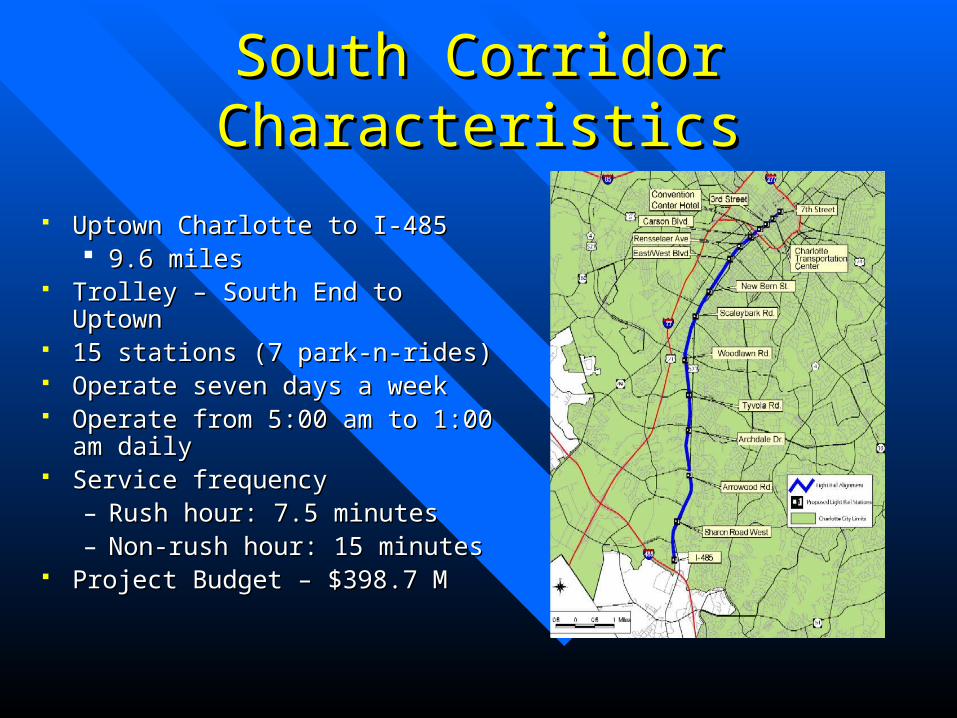
Uptown Charlotte to I-485 Uptown Charlotte to I-485 9.6 miles9.6 miles
Trolley – South End to UptownTrolley – South End to Uptown 15 stations (7 park-n-rides)15 stations (7 park-n-rides) Operate seven days a weekOperate seven days a week Operate from 5:00 am to 1:00 Operate from 5:00 am to 1:00
am dailyam daily Service frequencyService frequency
– Rush hour: 7.5 minutesRush hour: 7.5 minutes– Non-rush hour: 15 minutesNon-rush hour: 15 minutes
Project Budget – $398.7 MProject Budget – $398.7 M
South Corridor South Corridor CharacteristicsCharacteristics
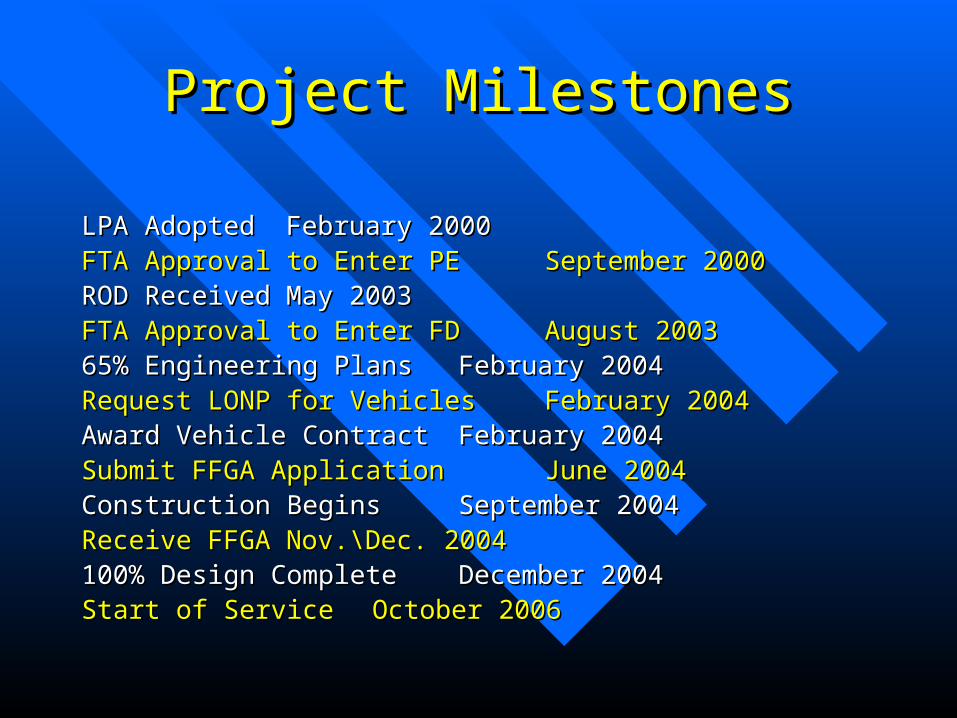
Project MilestonesProject Milestones
LPA AdoptedLPA Adopted February 2000February 2000FTA Approval to Enter PEFTA Approval to Enter PE September 2000September 2000ROD ReceivedROD Received May 2003May 2003FTA Approval to Enter FDFTA Approval to Enter FD August 2003August 200365% Engineering Plans65% Engineering Plans February 2004February 2004Request LONP for VehiclesRequest LONP for Vehicles February 2004February 2004Award Vehicle ContractAward Vehicle Contract February 2004February 2004Submit FFGA Application Submit FFGA Application June 2004June 2004Construction Begins Construction Begins September 2004September 2004Receive FFGAReceive FFGA Nov.\Dec. 2004Nov.\Dec. 2004100% Design Complete100% Design Complete December 2004December 2004Start of Service Start of Service October 2006October 2006

BackgroundBackground
FTA requires conduct of Project Risk FTA requires conduct of Project Risk Assessment (RA) as condition of Final Assessment (RA) as condition of Final Design approval (August 2003)Design approval (August 2003)
Prepare for RA Workshop (Sept. 2003)Prepare for RA Workshop (Sept. 2003)– PMOC creates 41 Project Cost Units (PCU)PMOC creates 41 Project Cost Units (PCU)– PMOC creates Risk RegisterPMOC creates Risk Register– CATS distributes cost to 41 PCUsCATS distributes cost to 41 PCUs– CATS identifies risks by PCUCATS identifies risks by PCU
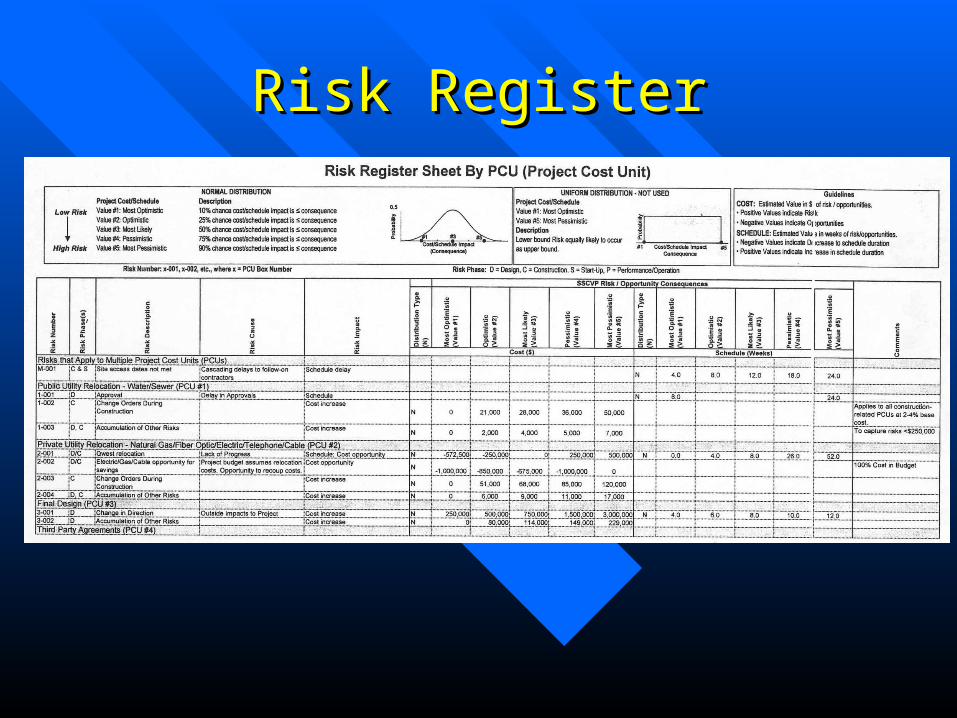
Risk RegisterRisk Register
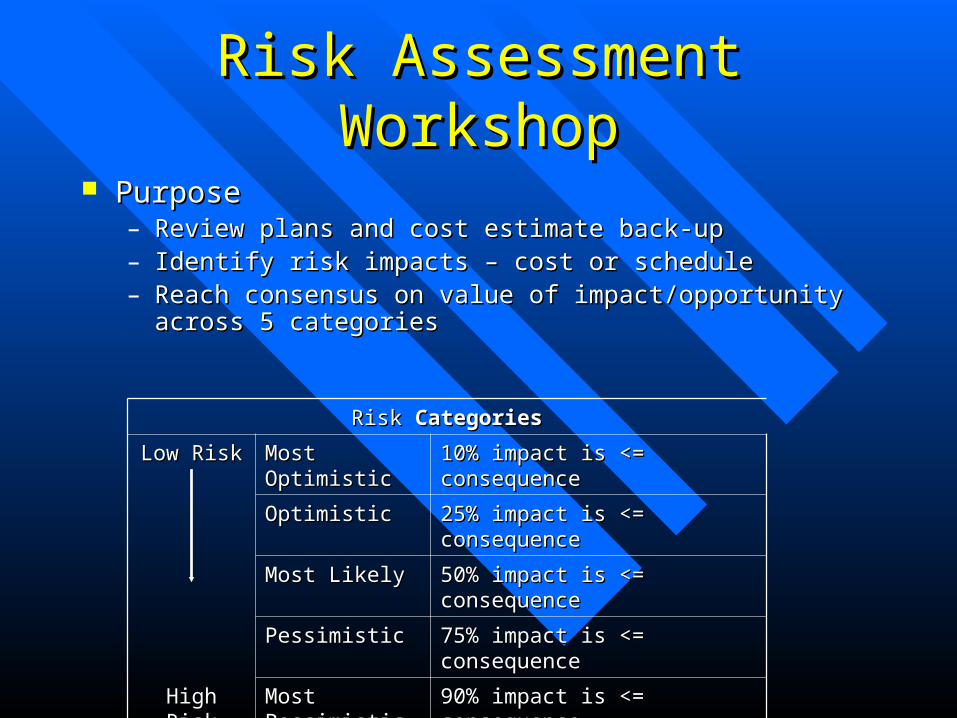
Risk Assessment Risk Assessment WorkshopWorkshop
PurposePurpose– Review plans and cost estimate back-upReview plans and cost estimate back-up– Identify risk impacts – cost or scheduleIdentify risk impacts – cost or schedule– Reach consensus on value of impact/opportunity Reach consensus on value of impact/opportunity
across 5 categoriesacross 5 categories
Risk Risk CategoriesCategories
Low RiskLow Risk Most Most OptimisticOptimistic
10% impact is <= 10% impact is <= consequenceconsequence
OptimisticOptimistic 25% impact is <= 25% impact is <= consequenceconsequence
Most LikelyMost Likely 50% impact is <= 50% impact is <= consequenceconsequence
PessimisticPessimistic 75% impact is <= 75% impact is <= consequenceconsequence
High RiskHigh Risk Most Most PessimisticPessimistic
90% impact is <= 90% impact is <= consequenceconsequence
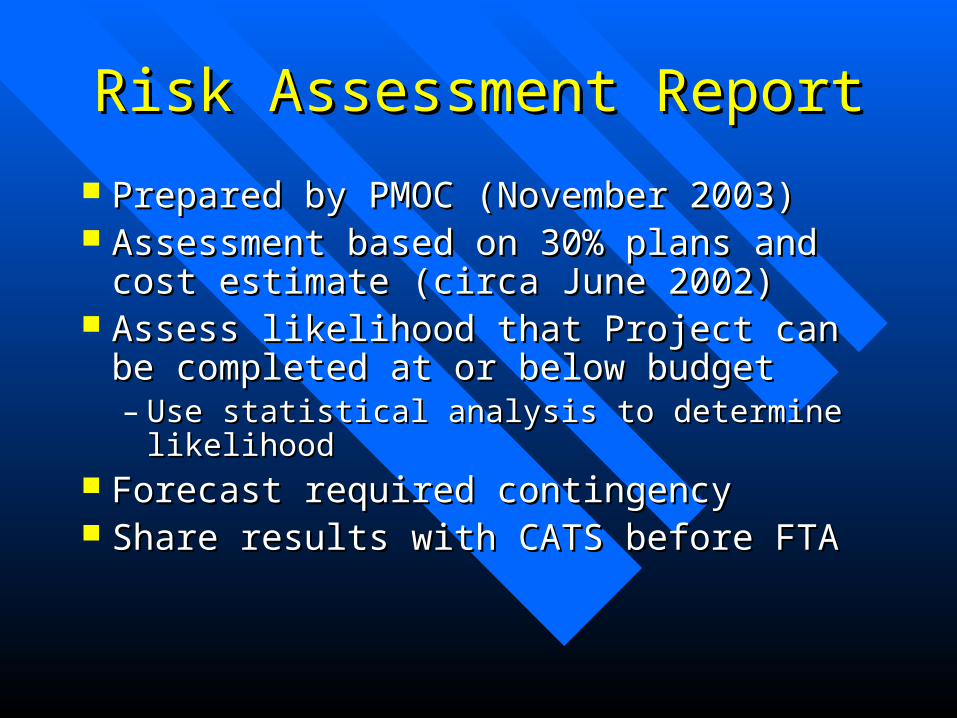
Risk Assessment ReportRisk Assessment Report
Prepared by PMOC (November 2003)Prepared by PMOC (November 2003) Assessment based on 30% plans Assessment based on 30% plans
and cost estimate (circa June 2002)and cost estimate (circa June 2002) Assess likelihood that Project can be Assess likelihood that Project can be
completed at or below budget completed at or below budget – Use statistical analysis to determine Use statistical analysis to determine
likelihoodlikelihood Forecast required contingencyForecast required contingency Share results with CATS before FTAShare results with CATS before FTA
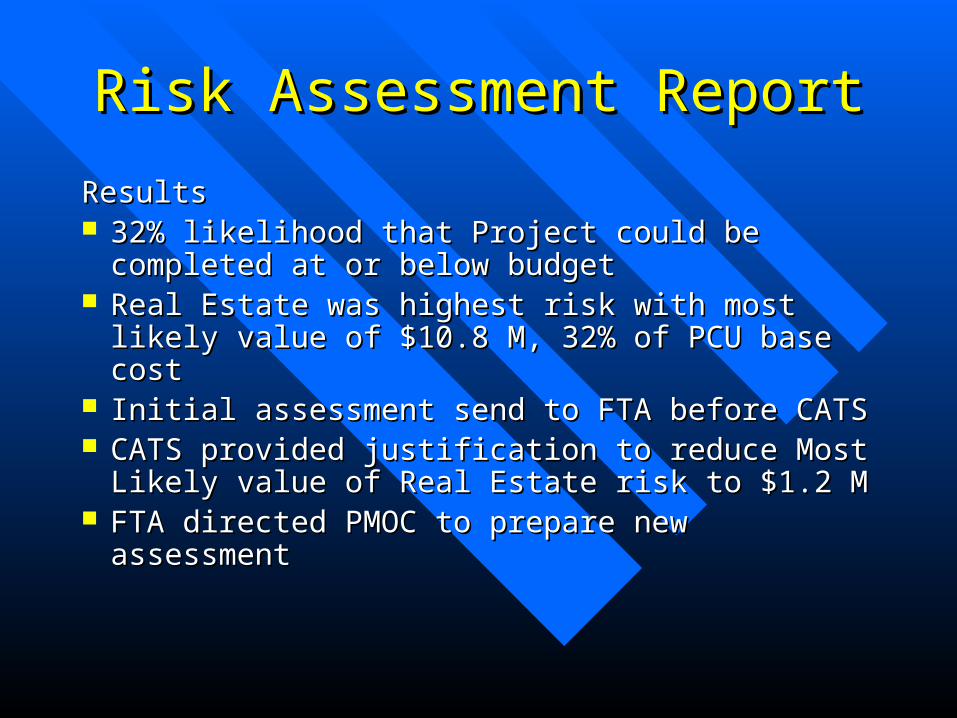
Risk Assessment ReportRisk Assessment Report
ResultsResults 32% likelihood that Project could be 32% likelihood that Project could be
completed at or below budgetcompleted at or below budget Real Estate was highest risk with most likely Real Estate was highest risk with most likely
value of $10.8 M, 32% of PCU base costvalue of $10.8 M, 32% of PCU base cost Initial assessment send to FTA before CATSInitial assessment send to FTA before CATS CATS provided justification to reduce Most CATS provided justification to reduce Most
Likely value of Real Estate risk to $1.2 MLikely value of Real Estate risk to $1.2 M FTA directed PMOC to prepare new FTA directed PMOC to prepare new
assessmentassessment
Risk Assessment ReportRisk Assessment Report
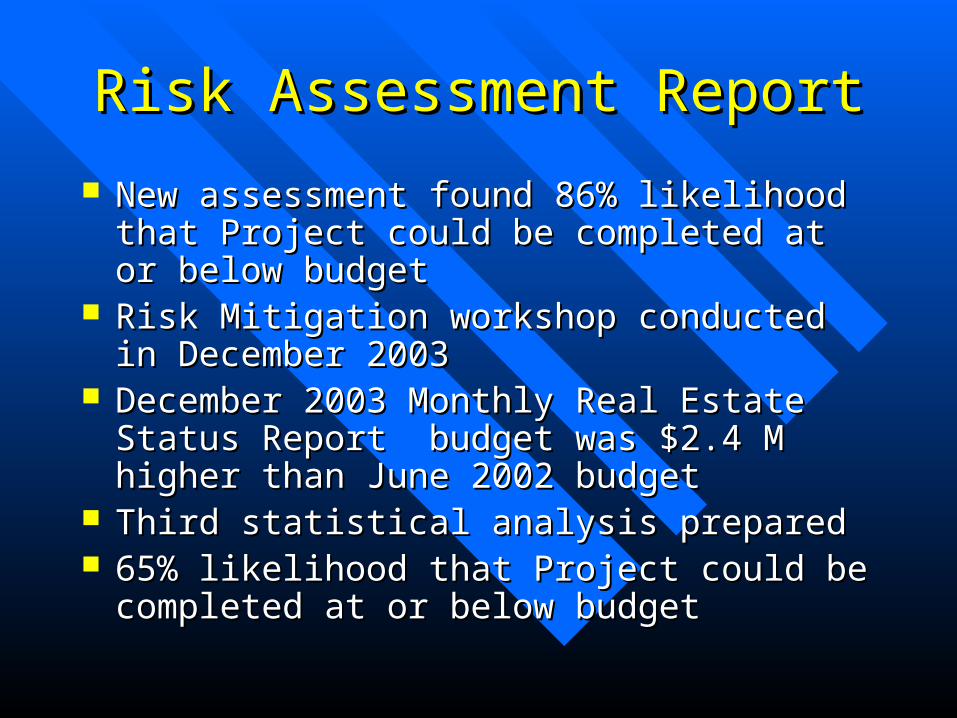
New assessment found 86% likelihood New assessment found 86% likelihood that Project could be completed at or that Project could be completed at or below budgetbelow budget
Risk Mitigation workshop conducted in Risk Mitigation workshop conducted in December 2003December 2003
December 2003 Monthly Real Estate December 2003 Monthly Real Estate Status Report budget was $2.4 M higher Status Report budget was $2.4 M higher than June 2002 budgetthan June 2002 budget
Third statistical analysis preparedThird statistical analysis prepared 65% likelihood that Project could be 65% likelihood that Project could be
completed at or below budgetcompleted at or below budget
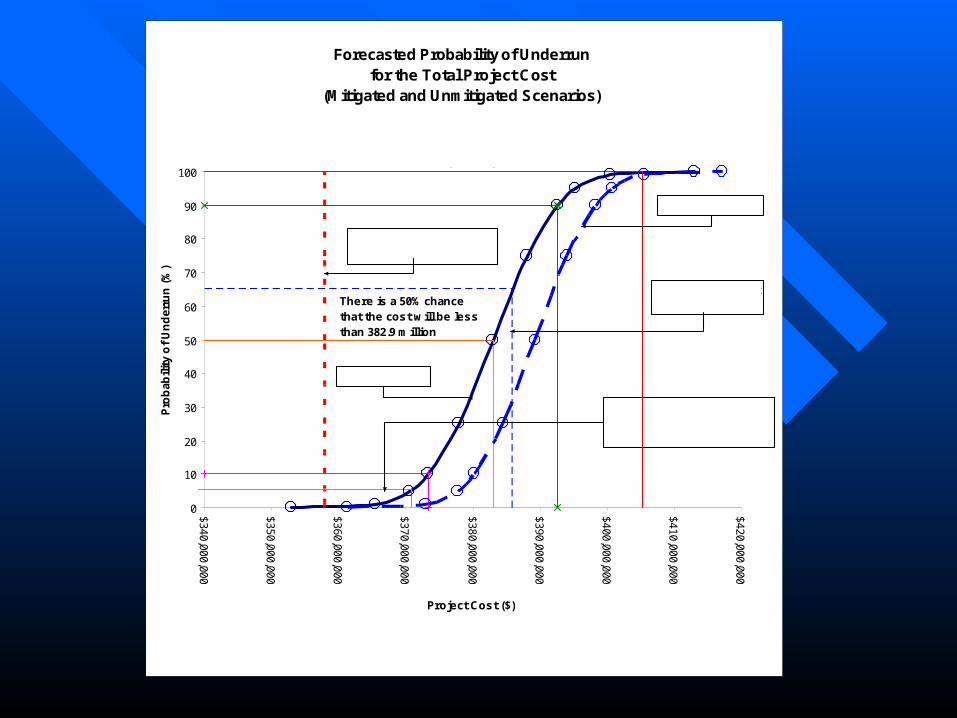
Forecasted Probability of Underrun for the Total Project Cost
(Mitigated and Unmitigated Scenarios)
0
10
20
30
40
50
60
70
80
90
100
$340,000,000
$350,000,000
$360,000,000
$370,000,000
$380,000,000
$390,000,000
$400,000,000
$410,000,000
$420,000,000
Project Cost ($)
Pro
bab
ility
of
Un
der
run
(%
)
There is a 50% chance that the cost w ill be less than 382.9 million
There is a 90% chance that the cost w ill be less than 392.6 million
There is a 10% chance that the cost w ill be less than 373.3 million
Total CATS Budget = 385.9 million
CATS Base Cost Budget = 357.9 million
FTA Core Accountability Ceiling = 405.2 million
Before Mitigation
After Mitigation
CATS Budget w ith No Unallocated Contingency =
371.0 million
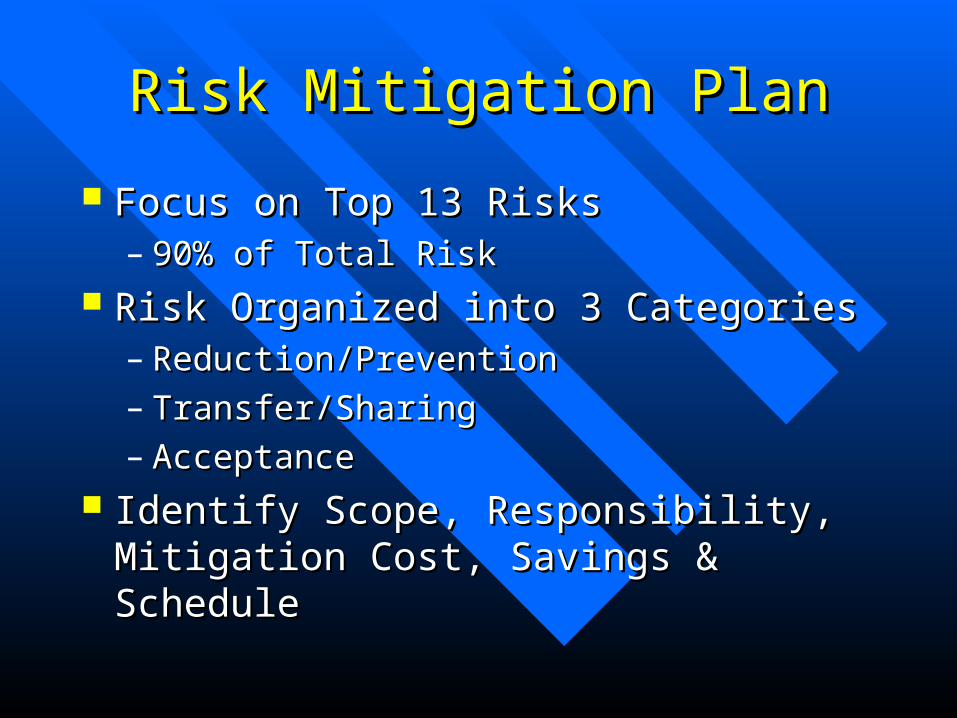
Risk Mitigation PlanRisk Mitigation Plan
Focus on Top 13 RisksFocus on Top 13 Risks– 90% of Total Risk90% of Total Risk
Risk Organized into 3 CategoriesRisk Organized into 3 Categories– Reduction/PreventionReduction/Prevention– Transfer/SharingTransfer/Sharing– AcceptanceAcceptance
Identify Scope, Responsibility, Identify Scope, Responsibility, Mitigation Cost, Savings & ScheduleMitigation Cost, Savings & Schedule
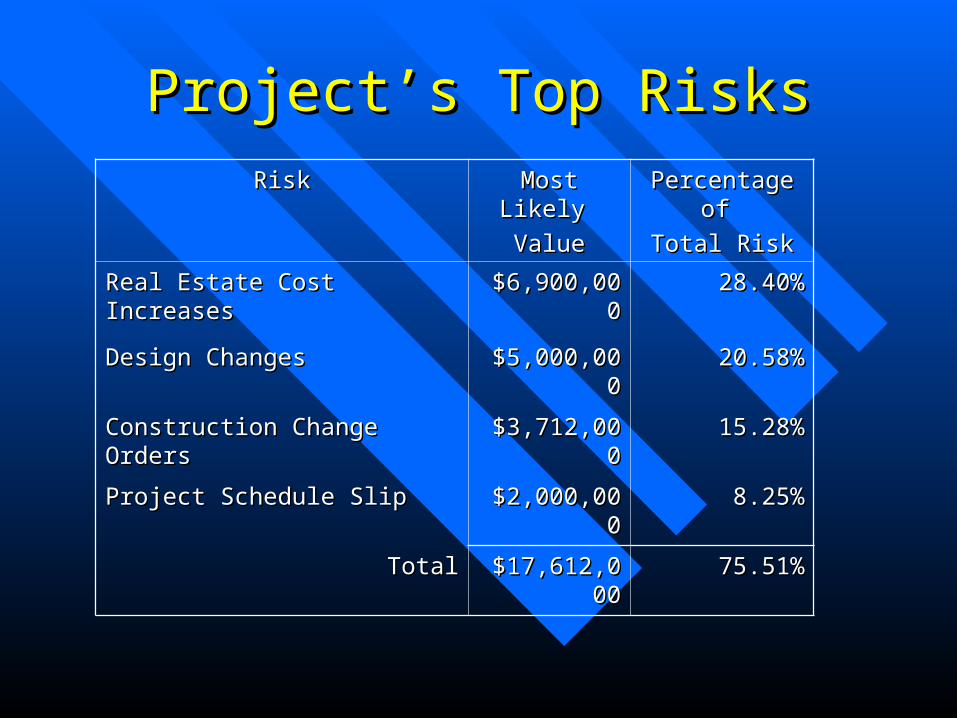
Project’s Top RisksProject’s Top RisksRiskRisk Most Likely Most Likely
ValueValuePercentage Percentage
of of
Total RiskTotal Risk
Real Estate Cost IncreasesReal Estate Cost Increases $6,900,000$6,900,000 28.40%28.40%
Design ChangesDesign Changes $5,000,000$5,000,000 20.58%20.58%
Construction Change OrdersConstruction Change Orders $3,712,000$3,712,000 15.28%15.28%
Project Schedule SlipProject Schedule Slip $2,000,000$2,000,000 8.25%8.25%
TotalTotal $17,612,00$17,612,0000
75.51%75.51%
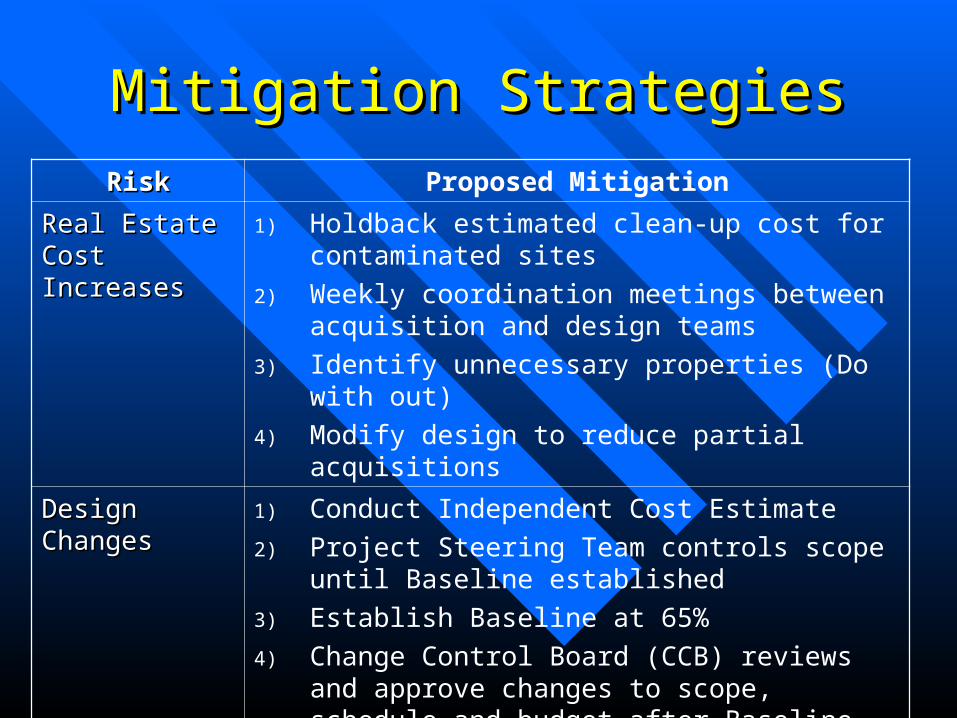
Mitigation StrategiesMitigation StrategiesRiskRisk Proposed Mitigation
Real Estate Real Estate Cost Cost IncreasesIncreases
1) Holdback estimated clean-up cost for contaminated sites
2) Weekly coordination meetings between acquisition and design teams
3) Identify unnecessary properties (Do with out)
4) Modify design to reduce partial acquisitions
Design Design ChangesChanges
1) Conduct Independent Cost Estimate2) Project Steering Team controls scope until
Baseline established3) Establish Baseline at 65%4) Change Control Board (CCB) reviews and
approve changes to scope, schedule and budget after Baseline

Mitigation StrategiesMitigation StrategiesRiskRisk Mitigation StrategyMitigation Strategy
Construction Construction Change Change OrdersOrders
1) CCB reviews internal and outside agency driven change orders
2) Redesign3) Third party change order review4) Partnering5) Dispute Resolution Board Resolution Board
Project Project Schedule SlipSchedule Slip
Accept RiskAccept Risk
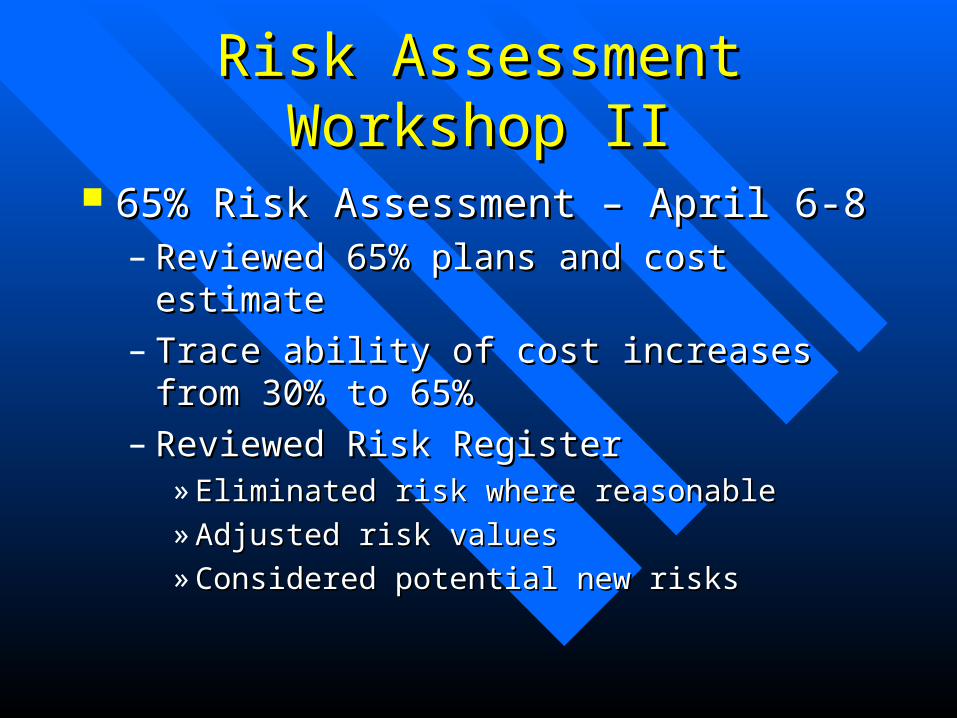
Risk Assessment Risk Assessment Workshop IIWorkshop II
65% Risk Assessment – April 6-865% Risk Assessment – April 6-8– Reviewed 65% plans and cost Reviewed 65% plans and cost
estimateestimate– Trace ability of cost increases from Trace ability of cost increases from
30% to 65%30% to 65%– Reviewed Risk RegisterReviewed Risk Register
» Eliminated risk where reasonableEliminated risk where reasonable» Adjusted risk valuesAdjusted risk values» Considered potential new risksConsidered potential new risks
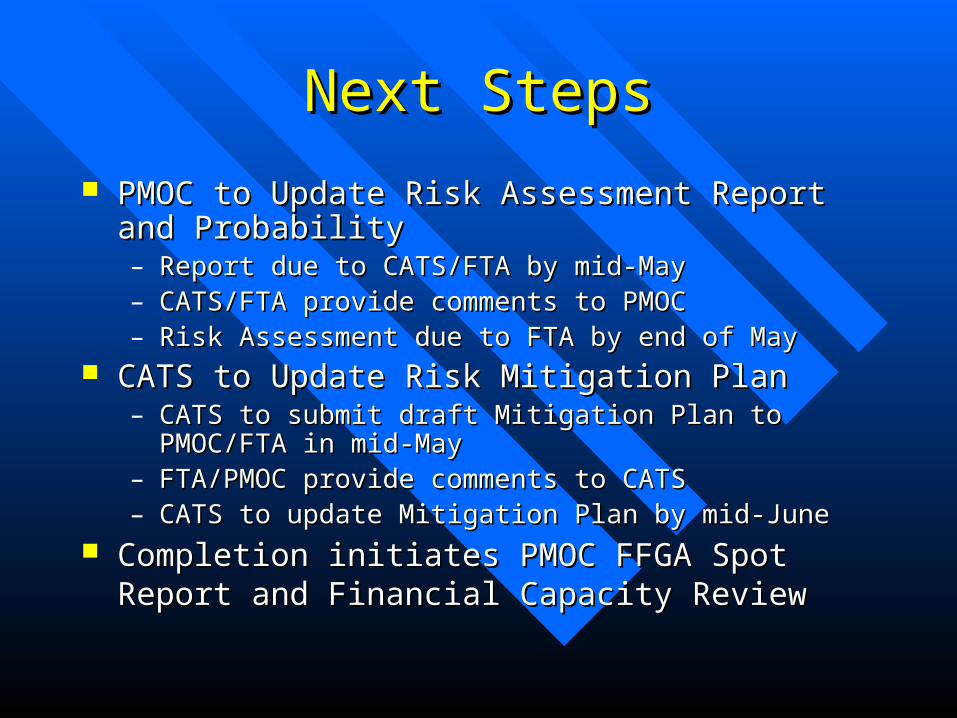
Next StepsNext Steps
PMOC to Update Risk Assessment Report and PMOC to Update Risk Assessment Report and ProbabilityProbability– Report due to CATS/FTA by mid-MayReport due to CATS/FTA by mid-May– CATS/FTA provide comments to PMOCCATS/FTA provide comments to PMOC– Risk Assessment due to FTA by end of MayRisk Assessment due to FTA by end of May
CATS to Update Risk Mitigation PlanCATS to Update Risk Mitigation Plan– CATS to submit draft Mitigation Plan to PMOC/FTA in CATS to submit draft Mitigation Plan to PMOC/FTA in
mid-Maymid-May– FTA/PMOC provide comments to CATSFTA/PMOC provide comments to CATS– CATS to update Mitigation Plan by mid-JuneCATS to update Mitigation Plan by mid-June
Completion initiates PMOC FFGA Spot Report Completion initiates PMOC FFGA Spot Report and Financial Capacity Reviewand Financial Capacity Review

Lessons LearnedLessons Learned
Agencies must understand assessment Agencies must understand assessment “intent”“intent”
Risk values should be based on historical Risk values should be based on historical datadata
Agencies should be involved in report Agencies should be involved in report developmentdevelopment
Agencies should have opportunity to Agencies should have opportunity to review RA Team qualifications review RA Team qualifications
Assessment took tremendous amount of Assessment took tremendous amount of staff and consultant time and provided staff and consultant time and provided minimal benefitminimal benefit
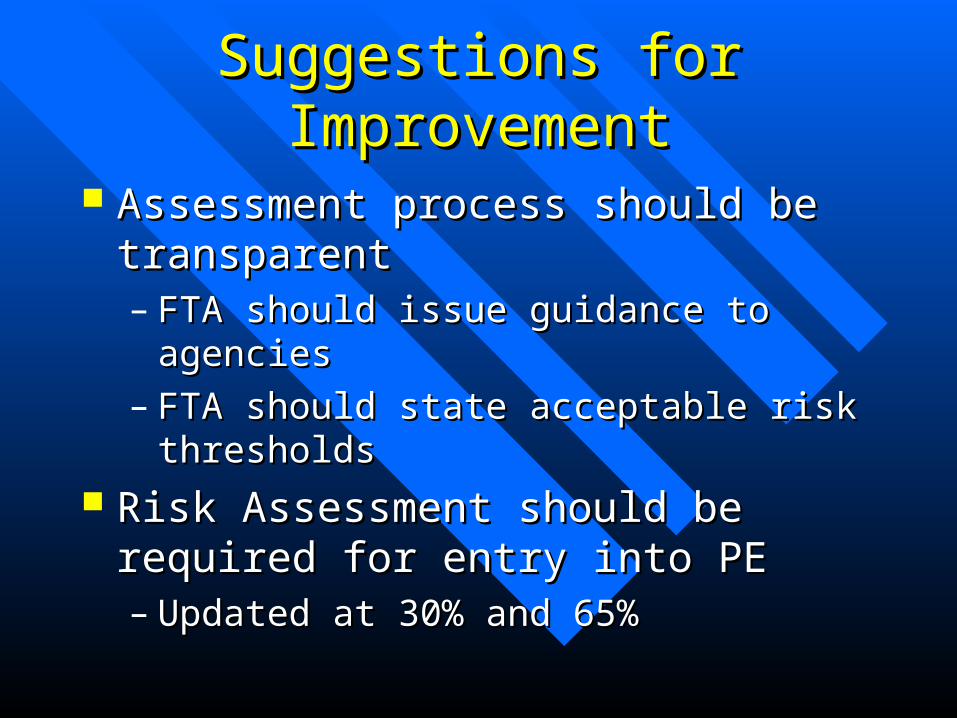
Suggestions for Suggestions for ImprovementImprovement
Assessment process should be Assessment process should be transparenttransparent– FTA should issue guidance to FTA should issue guidance to
agenciesagencies– FTA should state acceptable risk FTA should state acceptable risk
thresholds thresholds Risk Assessment should be Risk Assessment should be
required for entry into PErequired for entry into PE– Updated at 30% and 65%Updated at 30% and 65%