Embed Size (px)
Citation preview

South African
Sugar Technologists'
Association
Proceedings
of the
FORTY-FOURTH
ANNUAL CONGRESS
HELD AT MOUNT EDGECOMBE
15th-19th JUNE, 1970
The Copyright of these papers is the property of the Association
The Association does not hold itself responsible for any of the opinions
expressed in papers published herein
Published by
South African Sugar Technologists'
Association
SOUTH AFRICAN SUGAR ASSOCIATION EXPERIMENT STATION
MOUNT EDGECOMBE, NATAL
PRICE FOR EXTRA COPIES R5.00
Printed in the Republic of South Africa by The Natal Witness (Pty) Ltd.
Proc. Annual Cong. S. Afr. Sugar Tech. Ass. No. 44 pp. 1-216 Durban, 1970

Proceedings of The South African Sugar Technologists' Association —June 1970
THE SOUTH AFRICAN SUGAR TECHNOLOGISTS' ASSOCIATION
The South African Sugar Technologists' Association was
founded in 1926. It is an organisation of technical
workers and others directly interested in the technical
aspect of the South African Sugar Industry. It operates
under the aegis of the South African Sugar Association,
but is governed under its own constitution by a Council
elected by its members.
The office of the Association is situated on premises
kindly made available to it by the South African Sugar
Association at the latter's Experiment Station at Mount
Edgecombe.
Proceedings of the South African Sugar Technologists' Association — June 1970
CONTENTS
FRONTISPIECE ii
THE SOUTH AFRICAN SUGAR TECHNOLOGISTS' ASSOCIATION V
OFFICERS OF THE SOUTH AFRICAN SUGAR TECHNOLOGISTS' ASSOCIATION vii
LIST OF MEMBERS AND GUESTS viii
OPENING ADDRESS by D R . G. S. J. KUSCHKE ix
REPLY by M R . A. A. LLOYD xii
PRESIDENTIAL ADDRESS xii
REPLY by M R . i. B. ALEXANDER xvii
SI UNITS IN THE SUGAR FACTORY by G. N. ALLAN AND A. VAN HENGEL 21
CONTAINERISATION by D. S. WILKES 30
T H E FACTORY BALANCE by S.A.S.T.A. CHEMICAL CONTROL COMMITTEE 33
A FACTORY CHLORIDE BALANCE by A. W. MACGILLIVRAY 36
A SOLIDS BALANCE INVESTIGATION by E. L. MULLER . 40
SYRUP WEIGHING AT EMPANGENI by R. D. ARCHIBALD AND M. A. KARLSON 46
D R Y SOLIDS, SPINDLE AND REFRACTIVE BRIX DATA by G. D. M C G R A T H 48
SOME IMPRESSIONS OF THE SUGAR INDUSTRIES OF MAURITIUS AND REUNION by J. R. GUNN 51
NOTES ON AIR POLLUTION IN THE SUGAR INDUSTRY by B. ST. C MOOR 54
WATER CONSERVATION IN SUGAR MILLS by D. J. L. HULETT 57
STAINLESS STEEL IN THE SOUTH AFRICAN SUGAR INDUSTRY by C G. W. ROFFEY AND I. A. ELSDON-DEW . . 60
THE INTERDEPENDENCE OF CANE PREPARATION, PARTICLE SIZE, DISPLACEABILITY, AND LIQUID HOLDUP IN FIXED BED DIFFUSERS b y R . W . REIN . . . . . . 6 4
T H E MUTUAL CLARIFICATION PROJECT—PROGRESS REPORT No . 2 by L.M.S.A. JULLIENNE, M. MATIC AND M. TEOKAROVIC 71
COMPOSITION OF SOUTH AFRICAN FINAL MOLASSES by A. W. MACGILLIVRAY AND M. MATIC 81
FACTORS AFFECTING ENZYMATIC STARCH HYDROLYSIS IN SUGAR SOLUTIONS by I. A. SMITH 88
DECOMPOSITION PRODUCTS OF ENZYMATIC STARCH HYDROLYSIS by J. BRUIN 94
THE ISOLATION AND PARTIAL CHARACTERISATION OF OLIGOSACCHARIDES IN REFINERY MOLASSES by P. G. MOREL DU BOIL, K. J. SCHAFFLER, G. W. COMRIE AND D. M. OOSTHUIZEN 98
SOME ASPECTS OF FACTORY OPERATION AT THE TONGAAT SUGAR COMPANY FACTORY by G. G. CARTER, W. S. GRAHAM AND B. ST. C. MOOR 104
TRIALS ON B.M.A. CONTINUOUS CENTRIFUGALS by G. G. CARTER 108
IMBIBITION RE-CYCLING by M. H. PHIPSON . 1 1 4
SUMMARY OF AGRICULTURAL DATA: SUGARCANE CROP 1968/69 AND 1969/70 by i. L. DU TOIT AND M. G. MURDOCH 117
OPTIMUM IRRIGATION LEVELS FOR CANE UNDER BURNT AND TRASHED CONDITIONS Ay J. M. GOSNELL . . 121
SOME ASPECTS OF THE USE OF PLASTIC PIPING IN LAND DRAINAGE by B. PITHEY 131
STOOL POPULATIONS AND YIELD OF SUGARCANE UNDER IRRIGATED CONDITIONS AT PONGOLA by i. P. BOYCE 136
THE TONGAAT FIELD DIARY — A USEFUL MANAGEMENT TOOL by J. N. S. H I L L 144
THE RESULTS OF PRE-EMERGENCE HERBICIDE SCREENING TRIALS FOR SUGARCANE IN NATAL by F. E. RICHARDSON 148
A COMPARISON OF METHODS OF PHOSPHATE APPLICATION TO RATOON CANE by P. K. MOBERLY AND G. H. WOOD . 155
SOIL STERILIZATION AND THE GROWTH OF TOPS AND ROOTS AT THE MOUNT EDGECOMBE ROOT LABORATORY by J. GLOVER 162
PERKINSIELLA SACCHARICIDA KIRKALDY (HOM: DELPHA-CIDAE) AN INSECT PEST OF SUGARCANE IN SOUTHERN A F R I C A ^ R . H . G . H A R R I S 169
ALUMINIUM TOXICITY — A GROWTH LIMITING FACTOR IN SOME NATAL SANDS by M. E. SUMNER . . . . 1 7 6
THE EFFECT OF SILICA ON CANE GROWTH by P. DU PREEZ 183
T H E INFLUENCE OF WATTLE-BRUSH BURNING ON CANE GROWTH by J. H. MEYER 189
A COMPARISON OF THE EFFECTS OF UREA AND SULPHATE OF AMMONIA ON SUGARCANE by J. M. GOSNELL . . 200
LEAF SCALD DISEASE OF SUGARCANE IN SOUTH AFRICA by G. ROTH AND G. M. THOMSON 204
WEATHER REPORT FOR THE YEAR 1ST JUNE, 1969 — 31ST MAY, 1970 b y J . GLOVER . . . . . . 208

Proceedings of The South African Sugar Technologists' Association —June 1970 vn
OFFICERS 1970-71
President T. G. CLEASBY
Hon. Secretary (Mrs.) M. WELLS
Life Patron DR. H. H. DOODS
Vice-President J. B. ALEXANDER
Hon. Technical Secretary D. J. COLLINGWOOD
Former Presidents
1926-27 M. Mc MASTER 1927-28 M. Mc MASTER 1928-29 H. H. DODDS 1929-30 H. H. DODDS 1930-31 G. S. MOBERLY 1931-32 G. C. DYMOND 1932-33 G. C. DYMOND 1933-34 B. E. D. PEARCE 1934-35 E. CAMDEN-SMITH 1935-36 G. C. WILSON 1936-37 G. C. WILSON 1937-38 J. RAULT 1938-39 P. MURRAY 1939-40 P. MURRAY 1940-41 E. P. HEDLEY
1941-42 1942-43 1943-44 1944-45 1945-46 1946-47 1947-48 1948-49 1949-50 1950-51 1951-52 1952-53 1953-54 1954-55 1955-56
F. W. HAYES A. MCMARTIN G. BOOTH G. S. MOBERLY G. S. MOBERLY W. BUCHANAN W. BUCHANAN J. L. DU TOIT H. H. DODDS A. MCMARTIN G. C. DYMOND G. C. DYMOND G. C. DYMOND G. C. DYMOND J. B. GRANT
1956-57 1957-58 1958-59 1959-60 1960-61 1961-62 1962-63 1963-64 1964-65 1965-66 1966-67 1967-68 1968-69 1969-70
J. B. GRANT J. P. N. BENTLEY J. P.N. BENTLEY J. P. N. BENTLEY J. L. DU TOIT J. L. DU TOIT J. L. DU TOIT J. R. GUNN J. R. GUNN J. R. GUNN L. F. CHIAZZARI L. F. CHIAZZARI T. G. CLEASBY T. G. CLEASBY
Former Vice-Presidents
1926-27 1927-28 1928-29 1929-30 1930-31 1931-32 1932-33
L. E. ROUILLARD H. H. DODDS G. S. MOBERLY G. S. MOBERLY G. C DYMOND A. C. WATSON A. C. WATSON
1934-34 J" G. C. DYMOND "\ E. CAMDEN-SMITH
1934-35 1935-36 1936-37 1937-38 1938-39 1939-40 1940-41
B. E. D. PEARCE E. CAMDEN-SMITH J. RAULT P. MURRAY E. P. HEDLEY E. P. HEDLEY F. W. HAYES
1941-42 1942-43 1943-44 1944-45 1945-46 1946-47 1947-48 1948^19 1949-50 1950-51 1951-52 1952-53 1953-54 1954-55 1955-56
{
A. MCMARTIN 1956-57 G. BOOTH 1957-58 F. B. MACBETH 1958-59 G. BOOTH 1959-60 W. BUCHANAN 1960-61 G. C. DYMOND 1961-62 G. C. DYMOND 1962-63 G. C. DYMOND 1963-64 J. L. DU TOIT 1964-65 O. W. M. PEARCE 1965-66 O. W. M. PEARCE 1966-67 K. DOUWES-DEKKER 1967-68 J. B. GRANT 1968-69 K. DOUWES-DEKKER 1969-70 G. C. DYMOND
W. G. GALBRAITH
W. G. GALBRAITH J. L. DU TOIT J. L. DU TOIT J. L. DU TOIT J. DICK J. P. N. BENTLEY J. P. N. BENTLEY L. F. CHIAZZARI L. F. CHIAZZARI L. F. CHIAZZARI T. G. CLEASBY T. G. CLEASBY J. B. ALEXANDER J. B. ALEXANDER
J. B. ALEXANDER G. S. BARTLETT J. P. N. BENTLEY L. F. CHIAZZARI
Council of the Association
T. G. CLEASBY D. J. COLLING WOOD J. L. DU TOIT J. R. GUNN
D. J. L. HULETT W. B. KRAMER T. R. LOUDON M. MATIC
G.W. SHUKER G. D. THOMPSON J. WILSON
viii Proceedings of The South African Sugar Technologists' Association — June
List of members and guests who attended the
Forty-fourth Congress 15th-19th June, 1970
ABEL, E. J. M. ALEXANDER, H. P. ALEXANDER, J. B. ALEXANDER, K. E. F. ALLAN, G. N. ANDERSON, J. ANDERSON, N. ANDRIES, P. A. ASHE, G. G.
BAILEY, E. D. BANI ABBASSI, N. BARNES, A. C. BARTLETT, G. S. BAX, G. BEATER, B. E. BENTLEY, J. P. N. BERGH, P. BISHOP, R. T. BLACK, W. B. BLAKE, B. V. BOAST, W. B. BOND, R. S. BOOYSEN, S. S. BOURNE, J. H. BOWES, N. I. BOYCE, J. P. BRETT, P. G. C. BREWITT, A. J . D. BRIGGS, R. H. BROKENSHA, M. A. BROMLEY, C. K. BROWNE, E. L. BROWN, J. W. BROWN, P. W. BROUARD, J. E. P. BRUCE, N. E. BRUIJN, J. BUCHANAN, E. J. BULLOCK, J. S. BURNS, R. F. BYARD, W. E. BYRNE, L. G.
CAIRNS, P. A. CAMDEN-SMITH, D. CAMPBELL, R. CARGILL, J. M. CARNEGIE, A. J. M. CARR, R. J. CARREYETT R. A. CARTER, G. G. CHADWICK, J. K. CHANCE, W. J. F. CHIAZZARI, L. F. CHRISTIANSON, W. O. CLEASBY, T. G. CLUTTERBUCK, N. F. COETZEE, D. J. COLE, E.
COLLINGWOOD, D. J . COLLINGWOOD, R. J. COMRIE, G. W. CONUN, G. H. COURTS, B. COUVE, J. COVAS, T. CROOKES, D. V. CROOKES, L. N. CROOKES, P. J. CROOKES, P. J. M.
DANESH DEZFULI, A. R. DAHL, R. G. DAVIES, W. F. DAWES, V. H. DECKER, G. DEDEKIND, E. T. J. DENNY, M. E. DENT, C. E. D'HOTMANDE VlLLIERS, O Mc. D. DICK, J. DICK, J. DODDS, H. H. DOUGLAS, E. DOVEY, P. A. DUCKWORTH, J. R. DUNSMORE, (MRS.) A. DURANDT, H. K. DEFROBERVILLE, P. DE RAUVILLE, F. DE ROBILLARD, P. M. DE RUYTER, A. J. M . J . DE LA FAYE, G. DU TOIT, J. L. DU PREEZ, P.
EDRISSI, S. M. H. EDWARDS, B. R. EDWARDS, J. ELLIOTT, H. F. ELLIS, (MRS.) E.
FAGAN, R. C. FARQUHARSON, J. B. FAYDHERBE, R. E. FERNS, W. FOKKENS, F. FORD, R. H. FOTHERINGHAM, H. FRANCIS, D. W. FRANGS, G. B. FREAN, N. H. FREAMS, G.
GlLHLLAN, E. C. GIRDLER, J. GIRLING, L. A. GLISSON, F. G. GLOVER, J. GOSNELL, J. M. GOURLEY, I. N. GRAHAM, W. S. GRANGER, J. B. GREENFIELD, M. S. GRICE, L. D. C.
HAGE, P. HAEE, N. G. HALL, D. M. HALSE, C. G. HALSE, R. H. HALSTEAD, E. HAMLYN, D. HAMMOND, A. G. HAMMOND, G. P. HANKINSON, A. D. HARDIE, J. G. HAREL, J-P. HARMSWORTH, J. HARRIS, R. H. G. HARRIS, V. G. HAVEMANN, C. H. HAYSOM, G. D. L.
HEBBLETHWAITE, J. HELINGA, D. N. HEMPSON, W. J. HILL, D. R. HILL, J. N. S. HILL, T. I. HOEKSTRA, R. G. HOLTON, S. G. HOPKINS, T. HOWES, A. M. HULETT, D. J. L. HULETT, H. B. W. HULETT, J. R. HUNTLEY, J. K.
IRLE, E.
JAMES, G. L. JEHRING, G. JENKINS, E. B. JENNINGS, R. JOHNSTON, H. W. JOHNSTON, M. A. JONES, F. R. JULLIENNE, A.
KARLSON, M. A. KELLERMAN, G. H. KING, N. C. KING, S. KING, S. T. N. KOENIG, M. J. P. KOENIG, P. KRAMER, F. A. KRAMER, W. B. KRUMM, (MRS.) G. KUSCHKE, G. S. J.
LAAPER, J. N. LABUSCHAGNE, A. W. LAMUSSE, A. LAMUSSE, J. P. LANDREY, O. P. LAUGHTON, (MISS) M. LAX, R. LEANDY, C. A. LECLEZIO, R. LESUR, G. LINDEGGER, R. LINTER, J. LIONETT, R. E. LONG, A. C. LOUDON, T. R. LUND, G.
MACGRATH, G. MACGREGOR, W. I. MACVICAR, C. N. MAGASINER, N. MANDY, S. MANN, Q. V. LABAT MARC. MARKHAM, R. J. MARSHALL, D. MARTENS, W. MARTIN, J. MARTIN, W. MATIC, M. MEYER, G. H. MEYER, J. H. MEYER, N.
MITCHELL-INNES, MISS L. MOBERLY, P. K. MORGAN, C. E. MORGAN, M. MOOR, B. ST. C. MOREL DU BOIL, MISS P. MORRIS, B. S. MORRISON, E. MORRISON, K. F. MORTAZANI, S. N. MULDOON, R. MULLER, E. L. MURDOCH, M. G. MURRAY, J. P. M A C GILLIVRAY, A. W. Me KENNA, A. Mc NAUGHTON, A.
NORTH-COOMBES, S.
ODENDAAL, C. J. O 'DONOVAN, G. P. DIGBYOVENS, R. OLDFIELD, J. S. B. ORCHARD, E. R.
PALMER, J. H. K. PAYN, G. C. PEARCE, O. W. M. PEARSON, C. H. O. PENFOLD, V. PENNEFATHER, M. PERK, C. G. M. PERSHOUSE, G. V. PHEASANT, B. PHIPSON, M. H. PITHY, L. B. POLE, R. PREEN, B. V. PRESTON, W. H. PRINCE, P. PRINGLE, D. H. PSIFIS, A. M.
RABE, A. RAFFRAY, C. G. RANK, J. N. RAULT, J. RAVAISOU, G. B. REIN, P. W. RENAUD, C. L. RENNIE, L. L. RENTON, R. RIC-HANSEN, R. W. RICHARDSON, F. E. RISHWORTH, A. W. RITCHIE, G. A. D. ROBERTSON, J. M. RODGER, B. ROSTRON, H. ROTH, G. ROUTLEDGE, D. A. RUSK, G.
SAUZIER, J. SAVILLE, R. F. SAYERS, A. D. SCHAFFLER, K. J. SEMPILL, N. D. SCHMIDT, C. G. SCHMIDT, H.
SCHUMANN, G. T. SERRURIER, C. SHARP, W. SHERRARD, C. D. SHUKER, G. W. SINGERY, L. C. SIMMS, C. H. SMITH, I. A. SMIT, J. DU T. SOFFIANTINI, V. A. SOUCHON, C. L. A. SOUCHON, G. H. SOUCHON, M. H. T. STATHAM, R. STEAD, B. A. STENDER, O. STEFFEN, J. E. L. STEIN, A. G. STEWART, B. STEWART, MISS P. STEWART, M. J. STRACHAN, D. W. STRACHAN, MRS. E. R. STROVER, R. M. SUMNER, M. E.
TAYFIELD, D. TAYLOR, A. J. M. TOEKAROVIC, M. 1 HERON, C. H. B. THOMAS, J. P. THOMSON, G. M. THOMSON, MISS S. THOMPSON, G. D. TOMLINSON, K. TOY, W. F. TURNER, Q. A.
VANIS, M. VINTON, MISS J. VAN DOKKUM, J. VAN HENGEL, A. VAN NlEKERK, G. J. VAN DER POL, C . VAN DER RIET, F. E. VON DE MEDEN, E.
WADE, D. C. WALSH, W. H. WARNE, D. E. WATSON, V. WELLS, MRS. M. WESSELS, M. H. WHITEHEAD, C. WILKES, D. WILKES, MRS. H. WILKINSON, A. D. WILLIAMS, A. WILLIAMS, A. H. WILLIAMS, J. WILSHER, J. P. WILSON, B. T. WISE, C. T. WISE, P. WOOD, R. A. WORMALD, T. C. WORTHINGTON, R.
YOUNG, C. M.
ZADRKZIL, M. W.
Jk
FORTY-FOURTH ANNUAL CONGRESS
Proceedings of the Forty-fourth Annual Congress of the South African Sugar Technologists' Association, held at the South African Sugar Association's Experiment Station, Mount Edgecombe, from the 15th to 19th June, 1970.
-June 1970
NNUAL CONGRESS
,ial Congress of the South African Sugar the South African Sugar Association's ibe, from the 15th to 19th June, 1970.
Proceedings of The South African Sugar Technologists'' Association
The President: Ladies and Gentlemen — I have great pleasure in asking Dr. G. S. J. Kuschke, Chairman of the Industrial Development Corporation, to open our Forty-fourth Annual Congress.
OPENING ADDRESS Dr. Kuschke: Mr. President, Dr. Dodds, Ladies
and Gentlemen. In view of the traditional and vital place of agriculture in the South African economy as earner of foreign exchange and supplier of raw materials, the South African Sugar Industry can be proud of its record.
Its achievements demonstrate that the challenges facing many of the industries in the coming decade can be met successfully, if approached with imagination and determination.
Countries, and even regions within countries, are differently endowed with productive resources. Some may be richer than others in their wealth of capital, other countries may benefit from the size, skills and initiative of their people. Mineral wealth or good soil and climate for agricultural production may give others an advantage.
A combination of a country's wealth of these resources and, the way in which they are applied inevitably shape its growth pattern.
A country endowed with resources to facilitate a sizable agriculture sector, and equally well endowed with mineral weath provides its industry with a strong base for advancement.
In the initial stages of a country's economic development, this usually takes the form of export earnings by agriculture and mining to pay for the much needed imports of capital equipment. With this the country can start to build railroads, telecommunication and other infrastructural facilities. Equally important, these earnings can also pay for the machinery needed to start factories.
As manufacturing expands the relationship between agriculture, mining and other sectors becomes more complex. Agricultural and mining products go into manufacturing industry as raw materials. As a matter of fact, the presence of these raw materials at advantageous prices is a vital base for the establishment of the factories.
Manufacturing progressively pulls people into employment and higher income brackets, which enlarges the market for agricultural and other products. Thus,
the whole process of growth and industrialisation is launched.
South Africa has already advanced a long way on the road of industrialisation. This must to a large extent be ascribed to the country's relatively favourable position in respect of the various productive resources.
However, all development and growth are determined by the limitations imposed by available resources. We are all aware of their nature: inter alia, shortages in skilled labour, capital, water, transport.
In some resources we have abundance, such as some minerals, and the wonderful climate which is really too good so that it brings the problems of water supply and consistent agricultural production.
It is into this frame that we have to fit our canvas and paint the economic picture as we see it.
Although climatic conditions and the quality of our soil limit us to intensive cultivation of only 10% of the total surface area of the country, the agricultural sector is more vital to our economy and, in particular to manufacturing industry, than the 11 % contribution the Gross Domestic Product tends to tell.
Agriculture is as much as it ever was, a vital member of our economic family, and in 1967 produced goods to the value of some Rl 500 million.
In that year (the latest for which figures are available) no less than 52% or R781 million went as raw materials for our domestic manufacturing industry. Agricultural exports amounted to R271 million.
Agricultural raw materials bought by manufacturing in 1967 constituted 21.9% of industry's total demand for raw materials.
In that same year, 1967, the food processing industry in the Republic produced goods to the value of Rl 257 million and exported R184 million.
Exports of agricultural products in the ten-year period of 1958 to 1968 amounted to 24% of our total exports excluding gold.
These earnings were equal to 71% of total imports of machinery (excluding motorcars, etc.).
The roots of agriculture in South Africa's international trade go deep. A large proportion of South Africa's exports of manufactured products has agriculture as its base. To illustrate this we need mention only one sector, the food processing
X Proceedings of The South African Sugar Technologists' Association — June 1970
industry, which represents 25% of the total exports of manufactured products.
The impact of agriculture on our economy as a whole and the manufacturing industry in particular is therefore considerable, and the well-being of one can not be divorced from the other.
A projection to the end of this decade indicates by 1979:
Gross value of agricultural production, R2 400 million.
Supply to domestic industry, Rl 250 million. Gross value of food processing output, R2 300
million. Exports of agricultural products, R440 million. Exports of processed agricultural products, R350
million. This is perhaps not dramatic growth, but it is solid
growth, and therefore provides a sound foundation. And there is nothing to stop it growing.
On the contrary, more sophisticated methods and management, mechanisation and use of industrial products such as fertilizers, weed-killers, dips and other chemical products, will ensure intensity of farming growth and steadily enhanced productivity. Similarly, greater productivity of the labour employed has already made for better results, and this will continue steadily.
The same pattern applies to our mining industry, even though we might for a moment exclude the role of the dominant gold mining industry from our calculations.
We estimate the contribution of the mining sector (excluding gold) to Gross Domestic Product at only 4%, but supplies of raw materials to manufacturing amounts to 7% of total demand. At the same time export earnings amounted to 24% of total exports (excluding gold) for the period 1958 to 1968. Therefore as earner of foreign exchange mining (excluding gold), is of the same magnitude as agriculture. In the same period (1958-1968) exports of manufactured products amounted to 50% of total exports (excluding gold), while the contribution of manufacturing to Gross Domestic Product was 28% in 1968.
The total export performance in manufactured goods is therefore almost exactly equal to the combined results of agricultural and mining exports, excluding gold. This, however, is not enough since the negative contribution by industry to our balance of payments at present amounts to R450 million per annum and on the expected and desired growth rate, assuming the present import/export ratio is to be maintained, would amount to Rl 100 million deficit per annum by the end of this decade. This therefore demands a considerable improved performance by industry.
From the foregoing, it is clear that the considerable advances in South Africa's manufacturing industry would not have been possible without the particular characteristics, and qualities of our agricultural and mining sectors.
However, the past 20 years have demonstrated to us that South Africa's economic future will largely depend on the advances of manufacturing industry. This will also benefit agriculture through the income
generating effect of a rapid industrial expansion. This does not only mean that an increase in the income of people presently employed, will occur, but the large numbers of our growing population presenting themselves for employment will be given their rightful privilege of working and making their contribution to the Republic's economy, and at the same time enhancing their standard of living.
Economic growth does not come by itself. Obstacles are many and we must continuously plan our course to make the best use of our resources. This we can already see in our efforts, especially this year, to conserve our scarce water resources.
In the years to come, South Africa will be forced to increase its exports, not only of agricultural and mining products, but particularly those of manufactured goods. The earnings of our gold mining industry, which in the past supplied the bulk of our foreign exchange earnings, may diminish in the years to come.
Incidentally, I do not believe that this will be the case, given an aggressive marketing and research approach for industrial and other non-monetary uses of gold. Be all that as it may, in the period 1958-68, gold -supplied 38.3% of South Africa's exports (including gold).
Our ever-expanding imports demand an improved export performance, which will have to come from minerals, agricultural products and above all manufactured goods. There is still an arms-length, and virtually disinterested, approach to exports by most of our manufacturers. I find this disturbing indeed since a day of reckoning will come if manufacturing industry does not balance its import/export account. Manufacturing industry cannot expect to be riding on the backs of other sectors in so far as export earnings are concerned. The deficit caused by industry's imports must be
filled by greater exports of manufactured articles. This objective must become a national philosophy, and a way of life—but it needs effort and application.
To enable our manufactured products to compete successfully on the international market, we will have to keep costs at the lowest possible level at each stage of the production process. This can only be attained with continuous productivity gains.
Drought and other natural phenomena makes this not easy to attain in the agricultural sector. However, viewed over the long term, our farming community has succeeded in this. In the period 1947/48 to 1966/67 the physical volume of agricultural production increased at an average rate of 4% per annum. At the same time total acreage increased only marginally which implies substantial increases in productivity, if measured in this way. However, increases in production are not attained that easily, as you know better than I do. The farming community had to incur heavy expenses in respect of modern farming equipment, fertilizers and all other tools which research introduced on the farm. It therefore, does not necessarily follow that unit production costs decreased in this period.
For the future, efforts in research will be important to keep production costs as low as possible.
-JUM 1970 Proceedings of The South African Sugar Technologists'' Association
This is not only true from the profit point of view, but productivity gains in agriculture have a direct bearing on the competitiveness of a large proportion of South Africa's exports.
The years to come will not be without obstacles. Agriculture and the manufacturing industry will have to find ways and means to overcome the harmful effects should Britain enter the European Comman Market.
Less developed countries all over the world are awakening to modern farming methods. Although most of their production is, and for years to come will be confined to, their respective home markets, the present world supply and demand position will change as a result.
Some countries also will find it advantageous to enter the export markets, which will mean keener
, competition facing traditional world suppliers. As these countries will probably produce at lower labour costs than the more advanced countries, traditional suppliers will have to rely on efficiency and increasing productivity.
In a world which continuously requires of us adjustments to changing conditions and, in view of the traditional and vital place of agriculture in the South African economy as earner of foreign exchange and supplier of raw materials, the South African Sugar Industry indeed can be proud of its record.
The achievements of the Sugar Industry demonstrate that the challenges facing many of our industries in the coming decade can be met successfully, if approached with imagination and determination.
In this respect I want to mention your achievement of increasing your position as a sugar exporter from seventh in 1965 to fourth in 1969. This was achieved in the most adverse of conditions. After relatively high world prices in the early years of the decade, dramatic increases in production and exports were achieved in a time of extremely low international prices. Your determination and those of the government to fix your sights on the long-term benefits to be derived from this, resulted in South Africa now being one of the major sugar producers of the world.
The excellent results of your sterling efforts now also deserve better international prices, and we hope with you that these will improve to the benefit of your Industry.
It is significant that this success could not have been achieved without breaching the barriers which face so many industries through the relative smallness of the South African market. Although the home market assisted in your strategy, perhaps particularly as a result of the local price policy, the international market is the only one which could absorb the rapid expansion in production.
This is demonstrated by the change in reliance on the home market. Whereas the home market consumed 66% of total production in 1960 and only 34% was exported, today 52%, is exported and only 48% is consumed locally.
Another achievement was the diversification in export markets effected during the nineteen sixties.
In 1960 88% of sugar exports went to the U.K., Rhodesia and Canada. In 1968 77% of total exports went to Japan, Canada and the United States.
These achievements made Sugar one of the fastest growing sectors in South African agriculture. In the period 1960 to 1969 the Sugar Industry grew at an average annual rate of no less than 7.7% compared with all agriculture advancing at 4% per annum.
Agricultural exports increased at a rate of 6% per annum since 1960. This was enhanced by the growth in exports of sugar at a rate of 8%, per annum. This is indeed phenomenal—and may your success continue.
Research, and combined as well as individual efforts by grower, miller and research officer to make the Sugar Industry the most efficient one in agriculture, all played a role in your achievements. Many sectors of industry and agriculture can take a lesson from the way in which the Sugar Industry incurred, without hesitation, expenditure on research. Expenditure on research in your industry amounted to R1.5 million in 1967/68 of which the industry contributed R1.4 million.
This money was certainly put to good use, as is illustrated by the fact that yield per acre increased at an average rate of 2.1",', per annum over the period 1947-1967.
At the same time research contributed to increased efficiency and productivity in the use of water and labour, the increase in the sucrose content of sugarcane, better use' of soils, cane-breeding and several other aspects.
The South African Sugar Industry is in high esteem among the world producers, and the advisory work you do for neighbouring states is in the best tradition of research and the advancement of less developed countries.
In all our growth and development we have to look into the future.
The picture I see is that South Africa will continue to provide its growing population with a rising income and standard of living. The present Gross Domestic Product per capita of- our population of R19 million is R530 per annum, and I believe that it will be some Rl 500 per capita per annum by the year 2000.
Our total population will exceed 40 million by that time but on this projection and expectation this large population will have a per capital Gross Domestic Product equivalent to the average for Europe today.
I do not know what the saturation point of sugar consumption per capita may be but it seems to be of the order of 45 kg. per annum per person.
This would mean that the Sugar Industry will have a domestic market of some 2 million tons by the year 2000.
This is approximaately equal to the present production in the Republic. It is, however, unthinkable that there will be no further increase in production, or that there will be no exports by that time because the local market has absorbed the full output. It is
Xll Proceedings of The South African Sugar Technologists' Assocation —June 1970
probably true that South Africa's acreage for sugar production is limited and increases will therefore have to rely on increased yields per acre. This once again highlights the emphasis and continued efforts in the field of research.
South Africa's Sugar Industry must continue to supply the world market and remain a substantial earner of foreign exchange. Optimistic forward projections indicate that the market should be there through the combination of total population growth of the world and the enhancement of the standard of living of the many millions throughout the world who are not yet substantial consumers.
The United Nations projects a population in AD 2000 of 6 200 million. Total sugar consumption at that lime for the world as a whole, calculated at South Africa's present consumption level, would mean a demand in excess of 200 million tons per annum. This is more than three times the present world production.
There is no doubt that new areas elsewhere in the world will come into cultivation and that technical knowledge will continue to increase the yields. South Africa cannot participate to a meaningful extent in production expansion through increases in acreage under cultivation and it will therefore have to maintain its position through increased yield and efficiency.
The performance of our Sugar Industry to date leads one to say with complete confidence that our country will maintain its position as a supplier of sugar to the local market but also remain an exporter at high level.
A large market tends to bring new products into the supply area and the Sugar Industry will at all times have to take note of possible future competition from artificial sweeteners. There have been threats in this direction in the past and there has probably been a breathing space through the banning of the use of cyclamates in the United States of America. This will, however, not be the last word in what could be a very lucrative market.
The future competitive position of our Sugar Industry will therefore depend on price and a very vigilant marketing policy which must needs be built on an efficient and low-cost operation.
It gives me great pleasure to declare your Congress open.
Mr. A. A. Lloyd, in reply to Dr. Kuschke's opening address:
Mr. President, Dr. Dodds, Dr. Kuschke, Ladies and Gentlemen.
Our Association has established a reputation for the distinguished guest speakers who have done us the honour of opening its Annual Conference.
They have come from within our own country and from overseas and we have been privileged to hear eminent scientists, doctors, professors and directors of research.
But seldom, if ever, have we had the unique experience of listening to a man who in 1970 stands among the leaders of industrial development in a country which is among world leaders in this field.
I regard it therefore, as a great privilege to have been invited to express on behalf of our Association, our sincere thanks and appreciation to Dr. Kuschke, for his most stimulating, inspiring and thoughtful address to us this morning.
He and I have a few things in common. If we may accept the findings of the Financial Mail, who elected him "Business Man of the Year in 1967" — then I can safely say that neither of us own a yacht, nor a sprawling country estate — nor were we millionaires — at least not in 1967. The share market has probably ensured that this happy state is less likely in 1970.
But from these negative similarities the pattern changes, and I, being somewhat of a specialist in sugar, find it quite impossible to match the brilliance of his industrial and business record since 30 years ago he forsook an academic career offered under a Rhodes scholarship.
Since the departure from the scene of Dr. van der Bijl and Dr. Hendrink van Eck, a new leader of industry has arisen. How else can I describe a man who today not only directs the policy of the Industrial Development Corporation as its chairman after 21 years of dynamic contribution, but today is chairman of 16 companies, director of 31 others and serves on the Prime Minister's scientific and economic advisory board; the Orange River project as President of the Institute of Management and in numerous other capacities.
It takes me all my time to concentrate on sugar, but our distinguished guest is deeply involved in carpets, china, cellulose, chemicals, coal, oil and gas. He is concerned with textiles, porcelain, aluminium, zinc, platinum, iron, steel, pulp and paper. His interests include shipping and aircraft, phosphate and knitware, water and electricity, metals and minerals, banking and finance.
This is a breathtaking record of a man who by hard work, big thinking, meticulous planning and collective inspiration of a staff of over 100 executives, coupled with an enlightened approach to management which is noted for its fluency, drive and success, has made an enormous contribution to the industrial development of our country.
We are indeed fortunate to have been afforded the opportunity of hearing an outstanding speaker who is said to deliver 30 addresses every year.
He has brought to our industry a breadth of vision and infused us with his own spirit. For this we are most sincerely grateful to him for the sacrifice of valuable time to come here and address us today.
On your behalf, I thank Dr. Kuschke most warmly for a great contribution to the success of our 44th Congress which he has so ably declared open.
PRESIDENTIAL ADDRESS
Dr. Dodds, Dr. and Mrs. Kuschke, distinguished guests, fellow technologists.
In rising to address you as your President for the second time, my task of finding a subject has been made easier by the Government's decision to
-June 1970 Proceedings of The South African Sugar Technologists' Association
declare 1970 as Water Year. A great deal has already been written and said about it, but I feel as technologists and as an industry, the subject of water is so important that one more contribution — I hope an objective one — will not be out of place.
Let be say at the outset that the idea of focusing attention on water in this way, and at this time, is most commendable. What is important, however, are the results which will follow the detailed deliberations which are taking place and, in particular, their impact on the sugar industry. Water Year 1970 is a subject which gives me an opportunity of highlighting a number of the submissions made by the Sugar Industry to the Commission of Inquiry into Water Resources during 1967 and 1968 and which, I understand, will shortly be presenting its findings to the Government. This information involves facts and figures accumulated by a large number of people, and I would like to gratefully acknowledge their work. At a personal level I am able to utilise a contribution I made on behalf of the South African Sugar Technologists' Association at the Symposium recently held in Durban to mark Water Year 1970. The economy of effort appeals to me and I hope it will not detract from the importance of what I have to say.
To quote from one of the Water Year publications: "Water is basic, it is cheap, it is bountiful and always available". Have you ever thought what would happen the day you turned on the tap and there was no more water? Or too little water for a bath? Or too little to keep a factory going? South Africa is a land of plenty. Its mineral resources are virtually unlimited. On the African Continent it is the undisputed leader in all spheres. The most important factor that will affect its future growth is water. South Africa's water shortage is not a problem that arose overnight. The country's natural water resources remained constant whilst its population and economy grew spectacularly — a process that creates greater demand day by day.
Our average rainfall is 460 mm (220 million mor-gen feet) per year, of which 91% evaporates or transpires and only 20 million morgen feet reaches our rivers. Of the 20 million morgen feet, we can, with all the methods available now and in the future, store at the utmost 10 million morgen feet in our dams for use when necessary. It is estimated that our population will double itself within the next thirty years. At the present rate of consumption we will then need 11 million morgen feet per year. That means that within thirty years we will have a yearly shortage of 1 million morgen feet. This is then the challenge — to change the estimated future water shortage despite rising costs into a surplus so that South Africa's economic growth will not be retarded. The best brains here and abroad are being employed to meet this challenge. A master water plan for the entire country is being drawn up at present. Numerous possibilities are being investigated — research on the purification and re-use of municipal and industrial effluent has already reached an advanced stage. The de-salting of sea water, coupled with the development of nuclear power stations, can become
a reality in the near future. The possibility of better and sensible utilisation of underground resources is being investigated. The evaporation of water in reservoirs can be limited. Ingenious methods of leading water from one catchment a r e a to another can be utilised. Despite the investigation of these and other possibilities, it is clear that water is not only the concern of the government scientists and other leaders. "Success will ultimately depend on how each individual uses water."
The Sugar Industry requires water for domestic, industrial and agricultural purposes. It is very fortunate that, at the present time, it is in only limited competition for water from other users . Industrial expansion in Natal, however, will lead, to a growing demand for water. Good supplies of w a t e r are available in the larger rivers such as t h e Umfolozi, Tugela, Umkomaas and the Umzimkulu, and we will see later that an increased use of water from these rivers will not seriously affect the Suga r Industry. On the other hand, industrial expansion on any of the smaller rivers, without the provision for storage, will be damaging to the Industry as surplus water is not available.
The growing demand for urban water supplies to satisfy the increasing number and size of towns and villages, including holiday resorts, scattered throughout the Sugar Industry, will be a growing threat to the traditional water supplies available to the Industry, particularly as these towns a n d villages look to the smaller rivers on which the Sugar Industry is entirely dependent to satisfy their growing demands. It is interesting to note that the North Coas t Regional Water Supply Corporation estimates t h a t within the foreseeable future they will require as much as 30 cusecs to satisfy their commitments between Durban and Tongaat. This water is not available without storage.
Of the total water used today, agriculture uses 82%. This high proportion is regarded with envy by industrial and domestic users. Agriculture will have to justify the use of this high proportion to an ever increasing extent in the future. It has a responsibility to utilise this water wi th a much greater efficiency than it does today b u t I, for one, cannot see the agricultural proportion decreasing to any extent if we are not only to satisfy people's thirst but also to feed them.
Agriculture has another responsibility in view of the fact that only 9% of the country's total rainfall finds its way into the rivers and streams and only A\% can be stored. Approximately 91 % is absorbed by the soil and is entirely available for crop and pastures. Agriculture's responsibility is to use this God-given water as effectively as possible and to produce the maximum amount of food and essential raw products. Because the Sugar Industry in South Africa has developed in a marginal rainfall area, it has a great deal to teach agriculture generally about the efficient use of rainfall by well established principles such as deep land preparation, mulching and drought resistant varieties.
The water requirement of sugar c a n e is better known than for any other commercial c rop . Potential
XIV Proceedings of The South African Sugar Technologists' Assocation — June 1970
evapotranspiration (Et) or the maximum water requirement of sugar cane has been measured accurately by means of Lysimeters in South Africa and in several overseas sugarcane growing countries. Repeated experiments on the North Coast have shown that Et can be reliably estimated in this area on the basis of the U.S.W.B. Class A pan evaporation using a I : 1 ratio. Further work has shown that the 1 : 1 ratio holds good for all practical purposes where sugar cane is grown. Mean daily estimates of water requirements for fully canopied cane can be calculated for each day, week or month of the year. It is therefore possible to get a reliable estimate of the water deficits for crop production in the various regions where cane is grown.
Field practice demands that a very thorough exploitation of available moisture in the surface strata of soil takes place before irrigation water is reapplied. It has been shown that this does not limit the transpiration from crops on deep sandy-textured soil but on heavier soils having low hydraulic conductivity, wilting may occur soon after irrigation during periods of high evaporative demand. Under these conditions, actual evapotranspiration will fall progressively below the potential level and the growth of the plant will suffer.
The average result of a large number of irrigation experiments in Natal indicate that approximately one ton of cane is obtained per acre for each inch of irrigation applied. In 15 crops harvested over the past ten years, the application of 16" water per annum has resulted in the production of an additional 15 tons cane per acre. In these experiments a wide range of ratios from 0.4 to 1.6 tons of cane per inch of water applied is not entirely unexpected. Good rainfall conditions tend to make irrigation water applications inefficient and result in low ratios being obtained. In contrast, dryland cane may suffer so severely in extremely dry years that the apparent response to irrigation becomes inflated due to mortality of stalks when no irrigation water is applied. This results in high ratios being obtained.
Water duty is defined as the area which is irrigated per cusec of water pumped or removed from the source at the time of peak water use by the crop. The South African Sugar Association Experiment Station provides an advisory service which recommends water duties on the basis of the method of irrigation to be used; the rainfall probabilities for the area concerned; the predicted E, for the area; the total available moisture holding capacity of the soil in the effective rooting depth; and the duration of daily irrigation operations.
Recommended water duties have varied from 70 acres per cusec in the Eastern Transvaal for furrow irrigation to 200 acres per cusec on the Natal Coast deep soil requiring supplementary irrigation by overhead sprinklers. Recent work, however, at the Pon-gola Research Station has shown that the most economical water duties by overhead sprinkler irrigation is far higher than was originally envisaged. There is no reason why this should not hold good for other crops and, if it is the case, it could make an important contribution to the more economical
use of water by agriculture. Supplementary irrigation is practised in areas
where the rainfall is between 35" and 45" per annum on about 53 000 acres, whilst full irrigation is applied in areas where the rainfall is less than 30" on about 74 000 acres, mainly in the Eastern Transvaal and Pongola. Data from the Sugar Industry Central Board's survey on cane production giving the areas under irrigation in each of the four main regions of the Sugar Industry is:
North and South Coasts 41,200 acres Zululand 24500 acres Northern N a t a l and Eastern
Transvaal (including the Nkwa-leni Valley) 62 000 acres
Natal Midlands 250 acres The scope for the future development in irrigation
will, in the main, depend on the availability of water. The supplementary and full irrigation of sugarcane can be economically viable in a large number of areas. In the case of the majority of sugar mills in the Industry, the area under cane can only decrease as a result of land being required for housing and industrial development, limited alternative crop production and for a variety of other reasons. The loss of these cane supplies can only be made up by more intensive cultivation. Improved varieties and agronomic practices will, no doubt, result in improved yields, but again it must be stressed that water is the main limiting factor, and major increases in yield result from the application of irrigation water.
It has been conservatively estimated that if adequate water supplies were available, up to 50 000 acres could immediately be brought under economical supplementary irrigation in Natal. This does not include major expansion of the area under full irrigation in Northern Natal and Pongola. This represents a minimum of 600 000 tons of cane to the Industry where management, transport and sugar factories already exist. In order to exploit this potential, water conservation is essential.
Water consumption by South African sugar factories varies considerably from one mill to another depending on the design. At most factories, water consumption includes domestic water for the community and, in some cases, this extends to a complete town with additional industry.
As far as water management is concerned, one can differentiate between three types of factories:
(a) complete recycling of cooling water, (b) partly recycling of cooling water, (c) no recycling of cooling water.-
If a factory operates with a complete recycling system of cooling water, more water is discharged by the mill than is taken in as a large amount of water enters with the cane. The amount of water present in cane is approximately 69%. Of this water, 15% remains in the bagasse and a negligible quantity leaves the mill in the form of molasses. So an amount of water equal to 54% of the amount of cane processed by a factory is evaporated and recovered or discharged as condensate. For every 100 tons of cane per hour this amounts to 10 800 gallons
-June 1970 Proceedings of The South African Sugar Technologists'" Association
per hour or \ cusec. In the case of part or no recycling factories, the
water discharged, which is the sum of the overflow cooling, boiler blow-off and blow-down and floor and tank washing, approximates to the total water required to operate the factory less the domestic requirements. Sugar factories therefore quite independent of the degree of water recycling, consume only small quantities of water. The water discharged is either returned to its source or usefully used for irrigation.
The message from Water Year 1970, however, is that in the future all factories will be required to use water more effectively and, in the long run, complete recycling and the maximum re-use of water will be enforced.
The fact that nearly all sugar factories presently return water to rivers and streams is another important factor in the efficient use of water. "We all know that there is no such thing as pollution of rivers and streams by factories."
The Sugar Industry has always been conscious of problems associated with and caused by river pollution. It has collaborated with the National Institute of Water Research Department of the C.S.I.R. in studying river pollution by sugar factories. Detailed microbiological and hydrological investigations are in progress on individual rivers with the full co-operation of the South African Sugar Millers' Association, through its Sugar Milling Research Institute and also individual companies.
One of the express aims of Water Year 1970 is to focus attention on the pollution of water sources, and industrialists generally are going to have to face up to effluent problems or accept the severest action. The greatest pollution of rivers, however, is tragically from the country's greatest asset — soil. Taking into consideration Water Year, the new Soil Conservation Act and all the talk by organised (and disorganised) agriculture, I am convinced that insufficient work is being done to tackle this problem objectively. As somebody said at the Durban Water Symposium, the approach has been wrong in the past. Soil conservation has been promoted as a duty to make a future way of life possible. This is nonsense, as the blatant disregard for conserving land is a crime and should b.e punished as severely as the industrialist who allows effluent to pollute rivers and streams. More money will have to be spent and there will have to be greater co-operation between Agriculture, the Department of Agricultural Technical Services, Water Affairs and Bantu Administration if pollution of rivers by soil is to be avoided.
Having discussed the use of water by the Sugar Industry, we will now turn our attention to the water supplies available to the Sugar Industry. We will see how limiting these supplies are in terms of the Mean Annual Run-off, Normal flows and Minimum low flows of rivers on which the Sugar Industry depends.
The rivers flowing through the Natal Sugar Industry excluding the Eastern Transvaal are the Pongola, Mkuze, Umsinduse and Umsinere, Hlu-hluwe and Ingweni, Umfolozi, Enselini, Nyalazi, Umhlatuzi. Amatikulu, Tugela, Sinkwazi and
Nonoti, Umvoti, Umhlali, Tongaat, Umhloti, Umhlanga, Umgeni, Umlaas, Illovo, Umkomaas, Ifafa, Umzumbe, Umtwalumi and Umpanbanyoni and the Umzimkulu.
The records of river flows in Natal are very limited and cover relatively short periods, thus only approximate estimates can be made of their run-off potentials. It is estimated that the annual run-off of Natal rivers is between 8 000 000 and 10 000 000 acre ft. per annum, almost twice that of the Orange River. The mean total run-off pattern during the year has been estimated to vary from a maximum of approximately 20 000 cusecs in December, January, February and March, to a run-off of 3 000 to 7 000 cusecs in May, June, July, August and September.
The main areas of good run-off lie along the Drakensberg and, to a lesser extent, in the mist belt North and North-West of Pietermaritzburg. By far the most important river in the province is the Tugela which has an estimated mean annual run-off of approximately 3 600 000 acre ft. Other large rivers are the Umfolozi (M.A.R. 1 000 000 acre ft.), the Umzimkulu (M.A.R. 800 000 acre ft.), the Umkomaas (M.A.R. 800 000 acre ft.), the Umgeni (M.A.R. 600 000 acre ft.) and the Pongola (M.A.R. 700 000 acre ft.).
These six major rivers account for over 80% of the available water in Natal, and the remaining twenty or so rivers are all small with mean annual run-offs usually under 200 000 acre ft. The total discharge of the Natal rivers vary tremendously from year to year and also from month to month. It happens quite often that 50% or more of the annual discharge can occur within two months of the year.
The rivers of Natal can broadly be classified into those which can be utilised by the Sugar Industry and those which cannot.
The Tugela River passes through the cane belt in a very narrow gorge and not more than a dozen cane farms lie along its banks within easy pumping distance. Steep and high valley sides make pumping costly, and it is only a few miles from the mouth that the countryside becomes flatter. Except for industrial sites, this river can be of very little use to the Sugar Industry until such time as cheap hydro-electric power or even atomic power becomes available. The Tugela Basin development will place increasing demands on the flow of this river.
The Umzimkulu River also passes through the sugar growing areas in narrow and deep gorges and in a very narrow neck with only a few farms along its banks. A mill already exists at its mouth and the potential for irrigation is small.
The Umkomaas River, also on the South Coast, again has cut a deep narrow valley and is of little value to the Sugar Industry. It is already supporting some industrial development.
The Umgeni River is heavily committed to supplying Durban and Pietermaritzburg and offers little further prospect for the Sugar Industry.
The Umfolozi River provides better prospects for irrigation. This river is noted for the amount of silt carried in times of flood. Dam sites exist but the silt load is such that dam construction could not
XVI Proceedings of The South African Sugar Technologists' Association —June 1970
be undertaken until the catchment area, which lies mainly in Bantu Reserves, can be stabilised for conservation measures. Flooding and sand-silt deposition on the Umfolozi Flats is a serious problem.
It is therefore a fact that Natal's five largest rivers are only of very limited use at the present time to the Sugar Industry, and these rivers account for approximately 75% of the available water in Natal.
The total annual flow of all the remaining rivers and streams is estimated to be less than 3 000 000 acre ft. per annum. The majority of these rivers have a mean annual run-off of less than 200 000 acre ft. per annum and run dry or have very low flows during the winter months or drought periods.
Estimations have shown that the Sugar Industry is entirely dependent on water which flows into the areas used for sugarcane cultivation as the mean annual run-off from areas actually under sugarcane falls far short of the Sugar Industry's requirements for industrial, urban and agricultural purposes. The Sugar Industry is therefore concerned with any development requiring water between the areas of sugarcane cultivation and the source of the rivers, as it will adversely affect the water resources of the Sugar Industry. Developments in the Bantu areas have a particular significance in this respect.
Attempts have been made to summarise the present and future use of water from the rivers serving the Sugar Industry in Natal. The mean annual runoff (M.A.R.) has been calculated from rainfall records and the nature and area of the catchment. The M.A.R. has been converted into an average flow and one-third M.A.R. has been taken as the runoff during a dry year and an estimated normal flow of the river. Where figures have been available, recorded low flows have been considered.
In spite of the fact that the figures used are, at best, approximations due to paucity of factual data, a number of very important facts emerge which are vital to the Sugar Industry.
Practically all the rivers serving the Sugar Industry cannot meet the present and/or the anticipated future demand for water. An exception is the Umvoti River which still has potential for further irrigation of European, Bantu and Indian cane lands. All the water from this river should be reserved for the Sugar Industry.
The rivers which cannot satisfy the demand are the Mkuze, Hluhluwe, Nyalazi, Enseleni, Umhla-tuzi, Amatikulu, Sinkwazi, Nonoti, Umhlali, Tongaat, Umhloti, Umhlanga, Umlaas, Illovo Umzumbe and the Ifafa — a formidable list.
In all cases the recorded low flow falls below the present water requirements. In a large number of cases the estimated average low flows fall below the present water requirements and, in all cases, below the estimated future requirements.
In support of the figures referred to above, the growing number of petitions presented to the Department of Water Affairs to construct dams is testimony to the fact that rivers serving the Natal Sugar Industry cannot meet the present demand for water for increasing periods of every year.
A memorandum was presented to the Department of Water Affairs in August, 1966, by the North Coast Regional Water Supply Corporation, Timberit Wood-board Limited and The Tongaat Sugar Company Limited, which explained the fact that the river was no longer able to meet the present demand for water, and in view of projected development, particularly the development of Verulam as an Indian residential and industrial area, the construction of a dam was essential.
The flow of the Umhloti River has been gauged at Oakford Priory since 1953. At the present time, 36 cusecs is required at Oakford, and it has been estimated that 60 cusecs will be required by 1970. It is interesting to note that had assured draw-off been available then, in 1970, 45 cusecs would have been required.
Taking the period 1952/53 to 1964/65, the Umhloti • has failed to satisfy even the present demand for water during the six summer months, from September to April, in nine years out of the last twelve. The situation is much worse during winter. The need for a dam on the Umhloti River has been realised by the Department of Water Affairs, but there seems little likelihood of it being completed before 1975. Until this happens, there can be little, if any, Indian development in the Ottawa/Verulam complex.
Cane growers of the Amatikulu Mill Group made representation in 1965 in regard to a proposed dam on the Amatikulu River. Favourable reports of the dam site have been received and flow records are being kept.
It is understood that petitions on behalf of farmers in the Nkwaleni Valley have reached a stage where the Department of Water Affairs is actively studying the feasibility of constructing a dam. Specific farmers in the lower reaches have made representations regarding flooding and sand depositions on good agricultural land due to erosion and poor farming methods in the upper catchment of this river.
The Tongaat River provides water for industry, agriculture and the township of Tongaat. In order to secure these supplies, my own company has constructed two private dams of over 700 000000 gallons total capacity on a tributary of the Tongaat River.
The Illovo River was the subject of a survey by the Town and Regional Planning Commission of Natal in 1960. Since this investigation, a growing demand for water, particularly by the Amanzimtoti township, has embarrassed the Illovo Sugar Company which draws water for industrial and agricultural purposes.
A petition on behalf of farmers riparian to the Hluhluwe River led to the construction of a dam on the river in 1965. This is the only Government dam constructed within the Sugar Industry.
The Pongola Mill Group have repeatedly approached the Department of Water Affairs regarding the water shortage, particularly during spring and early summer, which has resulted in reduced crops. Notwithstanding the construction of the Josini
— June 1970 XVH Proceedings of The South African Sugar Technologists' Association
Dam, they have asked for a dam to be constructed to ensure their own water supplies.
The present situation is highly unsatisfactory, and increasing attention must be paid to the growing water shortages on rivers serving the Sugar Industry.
What can be done to alleviate the situation? The majority of rivers serving the Sugar Industry
have good dam sites, although some of them are situated in the Bantu Reserves.
The Town and Regional Planning Commission have authorised two firms of consultants to investigate the possibilities of dam sites in Natal on the South Coast, the North Coast and Zululand. These reports cover preliminary investigations only, and possible sites have been selected by studying aerial photographs and contour maps, and only brief visits were made to many, but not necessarily all the sites. Further preliminary surveys will be required to examine these sites in more detail and calculations made regarding the cost of construction and water charges. The dams which would probably receive priority are those which would benefit the widest cross-section of the community, i.e. the multiple projects serving industry, municipalities and farming.
It appears that the silt load of Natal rivers is higher than the other provinces. The run-off from all the Natal rivers is about 25% of the country's total, but the amount of silt carried is 42%, thus the building of dams in this province is probably more complicated than in the others in that additional provision must be made to by-pass silt-laden storm water, e.g. Nagle Dam, or considerable proportion of dams' storage capacity must be taken up in siltation.
Underground water resources are exercising the minds of hydrologists throughout the world to an increasing extent.
A number of factors influence the amount and availability of groundwater supplies from underlying rock formations. These include the amount of rainfall falling on an area, the topography and vegetation of the area, the nature of the underlying rocks, structures in these rocks and the presence or otherwise of igneous intrusions within these rocks. It is generally agreed that the prospects for large underground water supplies in Natal is not as good as it is in other areas of South Africa. Nonetheless, in my opinion, the true potential of underground water resources should be investigated.
An additional source of water for the Sugar Industry which is not strictly true groundwater lies in the lower courses of all the rivers of the region. These rivers all contain alluvial infill of the order of 120 ft. deep at their mouths. It is even deeper in the case of the large rivers. The larger the river the further the alluvial infill extends inland but, in general, rock floors only appear in the river bed some three to four miles inland from the seas.
It should prove possible to sink wellpoints into this alluvial sand and abstract a considerable amount of water from it, for as is generally known, a very large percentage of total river flow can take place in its sandy bed. This aspect is being actively ex
plored by one sugar company at the present time. Ladies and gentlemen — These are the facts. In
Water Year 1970, the rivers and streams on which the industry is dependent are already over-committed. To date the Government has been persuaded to build only one dam which serves a limited number of growers who are a considerable distance from their nearest mill.
If we superimpose on this, the fact that by the year 2000 South Africa's population will be between 30 000 000 and 40 000 000, also that we must anticipate a dramatic improvement in the standard of living of a larger proportion of our population. Again we expect Natal's industrial development to continue at a rate above the average for the whole of South Africa. There are schemes afoot to divert the flow of Natal rivers into the Transvaal (and if this is practical, why not the Umzimkulu to the Cape and/or Transkei!). I have stated that approximately 75% of Natal's water resources are of limited use to the Sugar Industry due to the situation of the main rivers.
Bearing all these facts in mind, can we imagine the industry's water resources in ten and twenty years' time — the situation is frightening beyond comprehension. The water we extract from the cane will not even be our own if we do> not act now and act as an Industry, for there is a great deal to be done.
Since I became associated with Water Year 1970, I have had a growing conviction that this project must result in an industrial awakening to the paucity of its water supplies and a resolution to do something positive about them.
I believe one possible answer is to entrench in the Industry's organisation a Water Resources Board or Committee. Logically it could be under the direction and guidance of one or more of the Industry's Technological Organisations. What would this committee do? In my opinion, it would employ or retain experts to advise the Industry and its members on all matters relating to water resources. It would act as a watchdog jealously guarding the Industry's rightful water supplies. It would progressively study the rivers and streams on which the Industry depends and plan, in principle, to optimise these water resources to the benefit of the Industry. It would co-ordinate action by individual members of the Industry. It could advise on matters of conservation and pollution. Lastly, but not least, it would promote the importance of diminishing water resources relative to the growth of South Africa within the Industry itself.
Mr. J. B. Alexander, in reply to the President's address:
Mr. President, Dr. Dodds, Dr. Kuschke, Ladies and Gentlemen.
We have rather come to take for granted the eloquence and wisdom of our President's speeches. This morning's address was no exception for though most of us have recently been made well aware of the value of water and the ever increasing concern regarding its conservation within our country, I believe that nothing talks like the hard statistics which we have heard this morning. When I say

XV111 Proceedings of The South African Sugar Technologists'' Association — June 1970
"hard" statistics it is perhaps debatable whether certain of the statistics were not more vital than hard.
The stark facts should leave us all in no doubt that the proper use of water is not just the problem of the Karoo farmer, but a challenge to each and every one of us, whether we are large or small users of this valuable commodity. The findings of the Commission of Inquiry confirm the unique degree of partnership which exists in our Sugar Industry and if we are to remain a virile and competitive industry we must work together to find the most economic and equitable utilisation of the resource which you, Mr. President, so rightly highlight as the main limiting factor to our whole industry.
You have drawn attention to the fact that the old requirement of a sugar factory having to be situated on a river is unnecessary. The point has
been adequately demonstrated by several factories in Natal which have had to change to a system whereby the only make up water taken in by the factory is in the incoming cane.
The word "change" reminds me of resistance to change which you stressed in last year's address. I think that all of us must guard against the "R.C Factor" for it is highly likely that we will be faced with some degree of change in the near future as a result of the Commission of Inquiry into the Sugar Industry.
The sooner we can adjust to changed circumstances the shorter will be the pain of change and the sooner will the attainable benefit be derived.
Mr. President, I am sure I speak on behalf of all those present when I express my thanks to you for a most thought provoking address.
Proceedings of The South African Sugar Technologists'1 Association — June 1970 1
FORTY-FIFTH ANNUAL SUMMARY OF LABORATORY REPORTS OF SUGAR FACTORIES IN SOUTHERN AFRICA COVERING THE 1969 — 1970 SEASON
by CHARLES G. M. PERK
Sugar Milling Research Institute
Note: Except where otherwise stated, all data in this summary are as declared by the factories in their final laboratory reports.
INTRODUCTION
The final manufacturing results of the sugar factories reporting regularly to the Sugar Milling Research Institute have been compiled again in a number of tables which are to be found at the back of this summary. These tables contain the following data: •
Table A: Final Production of the S.A. Factories specified according to the grades of sugar made by each mill.
Table B: Tons of sugar made and tons of cane crushed, composition and varieties of cane crushed, rainfall, throughputs and time account; performances.
Table C: Sucrose balance, analysis of juices, syrup, filter cake and of final molasses.
Table D: Data regarding masses cuites and their exhaustions; consumption of clarifying agents and of additional fuels.
Table E: Comparative manufacturing results of recent years (S.A. Factories).
Table F: Average manufacturing results of S.A. factories by monthly periods for the 1969-1970 season.
Table G: Comparative data of S.A. factories from 1925 to 1969.
Note: We take this opportunity to draw special attention to the last two tables which give a comprehensive review of the last season and of the results from 1925 onwards.
In addition to these seven main tables, there are many
smaller tables in the text to illustrate the discussions of the different subjects.
METRICATION
At the request of the Metrication Committee, the present summary is still based on British Units. However, where Metric Units would have led to different figures, the latter are also shown.
To transfer the different weights, volumes and terms from British Units into Metric Units the following conversion factors were used:
MULTIPLY BY TO OBTAIN Tons of 2,000 lbs 0.907185 Metric Tons Cubic feet 0.02832 m3
Cu ft per short ton 0.031217 m3 per metric ton Lbs per cu ft 16.018 kgm"3
Btuperlb 2.3261 kJ kg-1
Lbs/hr/cu ft T.R.V. 16.018 kgh"1 m"3 T.R.V. Lbs/hr/sq ft E.D.A. 4.8824 kgtr1 mr2 E.D.A.
Note: T.R.V. stands for Total Roller Volume of the milling tandem(s). E.D.A. stands for Effective Drainage Area of the diffuser.
The Lower Calorific Value (or L.C.V.) of Bagasse:
British Units: 7 650—18S—86. 4W Btu/lb bagasse
Metric (SI) Units: 17 795-42S—201S kJkgr1
bagasse "S" stands for sucrose % bagasse "W" stands for moisture % bagasse
2 Proceedings of The South African Sugar Technologists' Association — June 1970
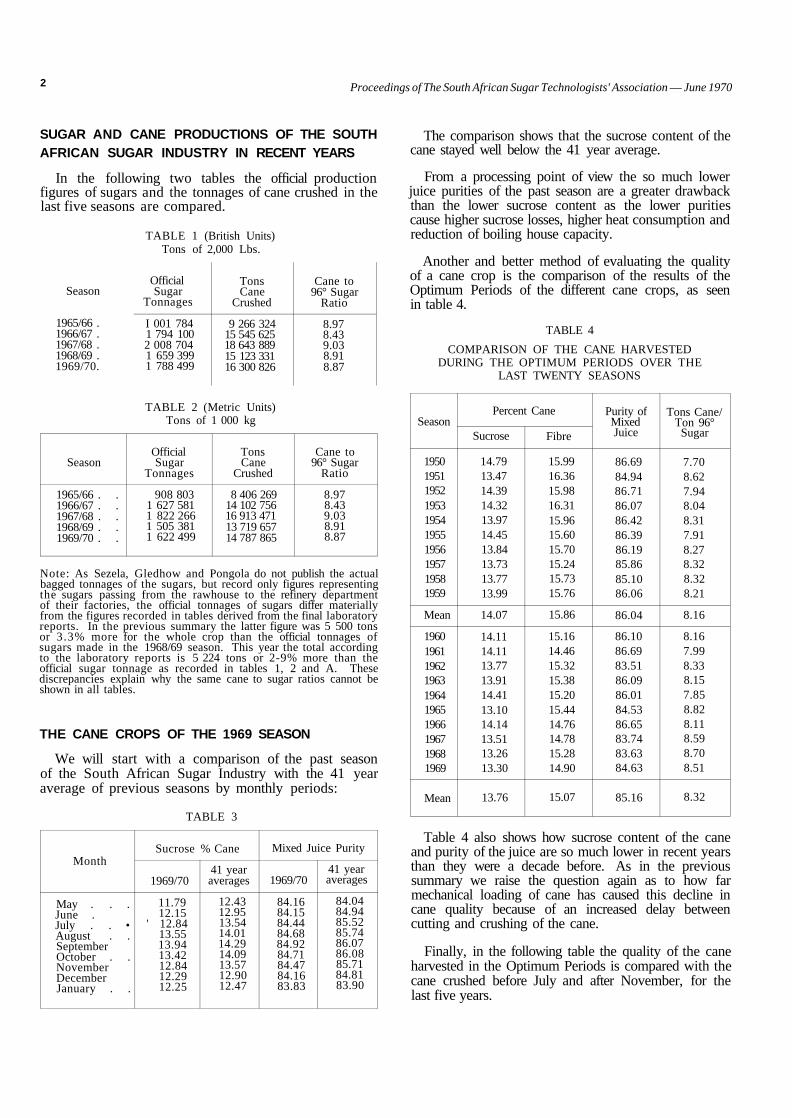
SUGAR AND CANE PRODUCTIONS OF THE SOUTH AFRICAN SUGAR INDUSTRY IN RECENT YEARS
In the following two tables the official production figures of sugars and the tonnages of cane crushed in the last five seasons are compared.
TABLE 1 (British Units) Tons of 2,000 Lbs.
Season
1965/66 . 1966/67 . 1967/68 . 1968/69 . 1969/70.
Official Sugar
Tonnages
I 001 784 1 794 100 2 008 704 1 659 399 1 788 499
Tons Cane
Crushed
9 266 324 15 545 625 18 643 889 15 123 331 16 300 826
Cane to 96° Sugar
Ratio
8.97 8.43 9.03 8.91 8.87
TABLE 2 (Metric Units) Tons of 1 000 kg
Season
1965/66 . . 1966/67 . . 1967/68 . . 1968/69 . . 1969/70 . .
Official Sugar
Tonnages
908 803 1 627 581 1 822 266 1 505 381 1 622 499
Tons Cane
Crushed
8 406 269 14 102 756 16 913 471 13 719 657 14 787 865
Cane to 96° Sugar
Ratio
8.97 8.43 9.03 8.91 8.87
Note: As Sezela, Gledhow and Pongola do not publish the actual bagged tonnages of the sugars, but record only figures representing the sugars passing from the rawhouse to the refinery department of their factories, the official tonnages of sugars differ materially from the figures recorded in tables derived from the final laboratory reports. In the previous summary the latter figure was 5 500 tons or 3.3% more for the whole crop than the official tonnages of sugars made in the 1968/69 season. This year the total according to the laboratory reports is 5 224 tons or 2-9% more than the official sugar tonnage as recorded in tables 1, 2 and A. These discrepancies explain why the same cane to sugar ratios cannot be shown in all tables.
THE CANE CROPS OF THE 1969 SEASON
We will start with a comparison of the past season of the South African Sugar Industry with the 41 year average of previous seasons by monthly periods:
TABLE 3
Month
May . . . June . July . . • August . . September October . . November December January . .
Sucrose % Cane
1969/70
11.79 12.15
' 12.84 13.55 13.94 13.42 12.84 12.29 12.25
41 year averages
12.43 12.95 13.54 14.01 14.29 14.09 13.57 12.90 12.47
Mixed Juice Purity
1969/70
84.16 84.15 84.44 84.68 84.92 84.71 84.47 84.16 83.83
41 year averages
84.04 84.94 85.52 85.74 86.07 86.08 85.71 84.81 83.90
The comparison shows that the sucrose content of the cane stayed well below the 41 year average.
From a processing point of view the so much lower juice purities of the past season are a greater drawback than the lower sucrose content as the lower purities cause higher sucrose losses, higher heat consumption and reduction of boiling house capacity.
Another and better method of evaluating the quality of a cane crop is the comparison of the results of the Optimum Periods of the different cane crops, as seen in table 4.
TABLE 4
COMPARISON OF THE CANE HARVESTED DURING THE OPTIMUM PERIODS OVER THE
LAST TWENTY SEASONS
Season
1950 1951 1952 1953 1954 1955 1956 1957 1958 1959
Mean
1960 1961 1962 1963 1964 1965 1966 1967 1968 1969
Mean
Percent Cane
Sucrose
14.79 13.47 14.39 14.32 13.97 14.45 13.84 13.73 13.77 13.99
14.07
14.11 14.11 13.77 13.91 14.41 13.10 14.14 13.51 13.26 13.30
13.76
Fibre
15.99 16.36 15.98 16.31 15.96 15.60 15.70 15.24 15.73 15.76
15.86
15.16 14.46 15.32 15.38 15.20 15.44 14.76 14.78 15.28 14.90
15.07
Purity of Mixed Juice
86.69 84.94 86.71 86.07 86.42 86.39 86.19 85.86 85.10 86.06
86.04
86.10 86.69 83.51 86.09 86.01 84.53 86.65 83.74 83.63 84.63
85.16
Tons Cane/ Ton 96°
Sugar
7.70 8.62 7.94 8.04 8.31 7.91 8.27 8.32 8.32 8.21
8.16
8.16 7.99 8.33 8.15 7.85 8.82 8.11 8.59 8.70 8.51
8.32
Table 4 also shows how sucrose content of the cane and purity of the juice are so much lower in recent years than they were a decade before. As in the previous summary we raise the question again as to how far mechanical loading of cane has caused this decline in cane quality because of an increased delay between cutting and crushing of the cane.
Finally, in the following table the quality of the cane harvested in the Optimum Periods is compared with the cane crushed before July and after November, for the last five years.
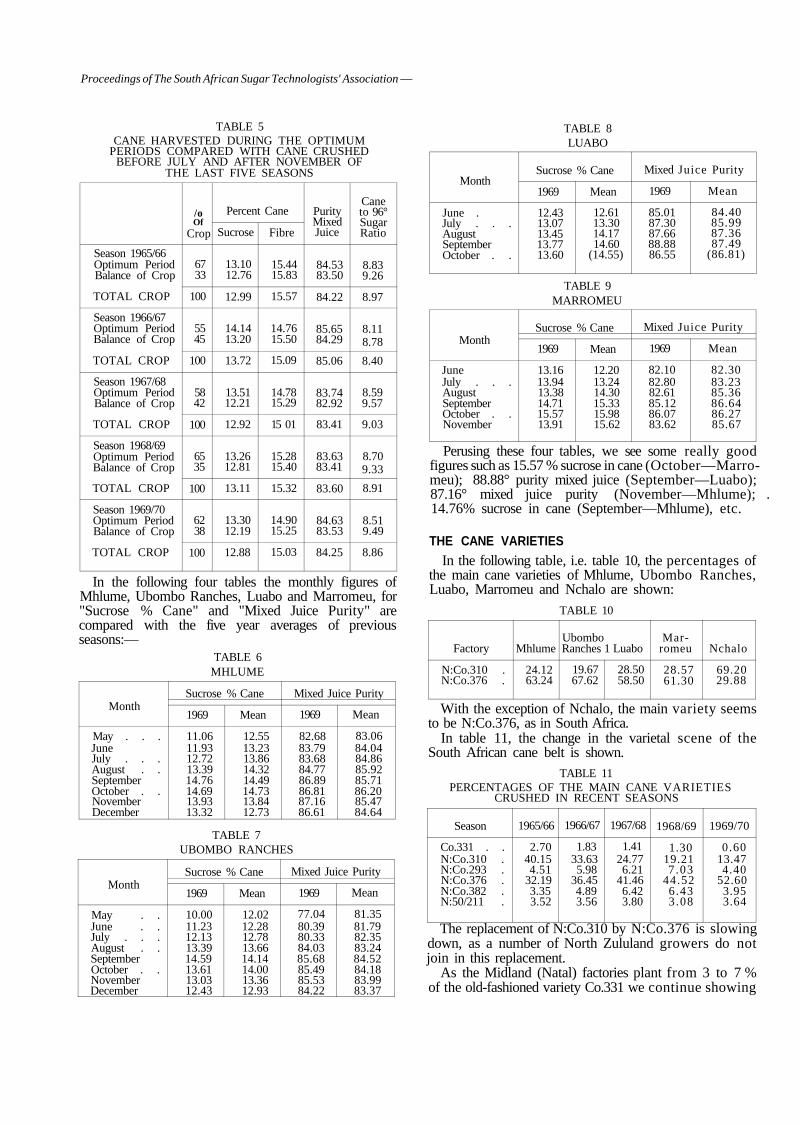
Proceedings of The South African Sugar Technologists' Association —
TABLE 5 CANE HARVESTED DURING THE OPTIMUM
PERIODS COMPARED WITH CANE CRUSHED BEFORE JULY AND AFTER NOVEMBER OF
THE LAST FIVE SEASONS
Season 1965/66 Optimum Period Balance of Crop
TOTAL CROP
Season 1966/67 Optimum Period Balance of Crop
TOTAL CROP
Season 1967/68 Optimum Period Balance of Crop
TOTAL CROP
Season 1968/69 Optimum Period Balance of Crop
TOTAL CROP
Season 1969/70 Optimum Period Balance of Crop
TOTAL CROP
/o Of
Crop
67 33
100
55 45
100
58 42
100
65 35
100
62 38
100
Percent Cane
Sucrose
13.10 12.76
12.99
14.14 13.20
13.72
13.51 12.21
12.92
13.26 12.81
13.11
13.30 12.19
12.88
Fibre
15.44 15.83
15.57
14.76 15.50
15.09
14.78 15.29
15 01
15.28 15.40
15.32
14.90 15.25
15.03
Purity Mixed Juice
84.53 83.50
84.22
85.65 84.29
85.06
83.74 82.92
83.41
83.63 83.41
83.60
84.63 83.53
84.25
Cane to 96° Sugar Ratio
8.83 9.26
8.97
8.11 8.78
8.40
8.59 9.57
9.03
8.70 9.33
8.91
8.51 9.49
8.86
In the following four tables the monthly figures of Mhlume, Ubombo Ranches, Luabo and Marromeu, for "Sucrose % Cane" and "Mixed Juice Purity" are compared with the five year averages of previous seasons:—
TABLE 6 MHLUME
Month
May . . . June July . . . August . . September October . . November December
Sucrose % Cane
1969
11.06 11.93 12.72 13.39 14.76 14.69 13.93 13.32
Mean
12.55 13.23 13.86 14.32 14.49 14.73 13.84 12.73
Mixed Juice Purity
1969
82.68 83.79 83.68 84.77 86.89 86.81 87.16 86.61
Mean
83.06 84.04 84.86 85.92 85.71 86.20 85.47 84.64
TABLE 7 UBOMBO RANCHES
Month
May . . June . . July . . . August . . September October . . November December
Sucrose % Cane
1969
10.00 11.23 12.13 13.39 14.59 13.61 13.03 12.43
Mean
12.02 12.28 12.78 13.66 14.14 14.00 13.36 12.93
Mixed Juice Purity
1969
77.04 80.39 80.33 84.03 85.68 85.49 85.53 84.22
Mean
81.35 81.79 82.35 83.24 84.52 84.18 83.99 83.37
TABLE 8 LUABO
Month
June . July . . . August September October . .
Sucrose % Cane
1969
12.43 13.07 13.45 13.77 13.60
Mean
12.61 13.30 14.17 14.60
(14.55)
Mixed Juice Purity
1969
85.01 87.30 87.66 88.88 86.55
Mean
84.40 85.99 87.36 87.49
(86.81)
TABLE 9 MARROMEU
Month
June July . . . August September October . . November
Sucrose % Cane
1969
13.16 13.94 13.38 14.71 15.57 13.91
Mean
12.20 13.24 14.30 15.33 15.98 15.62
Mixed Juice Purity
1969
82.10 82.80 82.61 85.12 86.07 83.62
Mean
82.30 83.23 85.36 86.64 86.27 85.67
Perusing these four tables, we see some really good figures such as 15.57 % sucrose in cane (October—Marromeu); 88.88° purity mixed juice (September—Luabo); 87.16° mixed juice purity (November—Mhlume); . 14.76% sucrose in cane (September—Mhlume), etc.
THE CANE VARIETIES
In the following table, i.e. table 10, the percentages of the main cane varieties of Mhlume, Ubombo Ranches, Luabo, Marromeu and Nchalo are shown:
TABLE 10
Factory
N:Co.310 . N:Co.376 .
Mhlume
24.12 63.24
Ubombo Ranches 1 Luabo
19.67 67.62
28.50 58.50
Marromeu
28.57 61.30
Nchalo
69.20 29.88
With the exception of Nchalo, the main variety seems to be N:Co.376, as in South Africa.
In table 11, the change in the varietal scene of the South African cane belt is shown.
TABLE 11 PERCENTAGES OF THE MAIN CANE VARIETIES
CRUSHED IN RECENT SEASONS
Season
Co.331 . . N:Co.310 . N:Co.293 . N:Co.376 . N:Co.382 . N:50/211 .
1965/66
2.70 40.15 4.51
32.19 3.35 3.52
1966/67
1.83 33.63 5.98
36.45 4.89 3.56
1967/68
1.41 24.77 6.21
41.46 6.42 3.80
1968/69
1.30 19.21 7 .03
44.52 6.43 3 .08
1969/70
0.60 13.47 4.40
52.60 3.95 3.64
The replacement of N:Co.310 by N:Co.376 is slowing down, as a number of North Zululand growers do not join in this replacement.
As the Midland (Natal) factories plant from 3 to 7 % of the old-fashioned variety Co.331 we continue showing
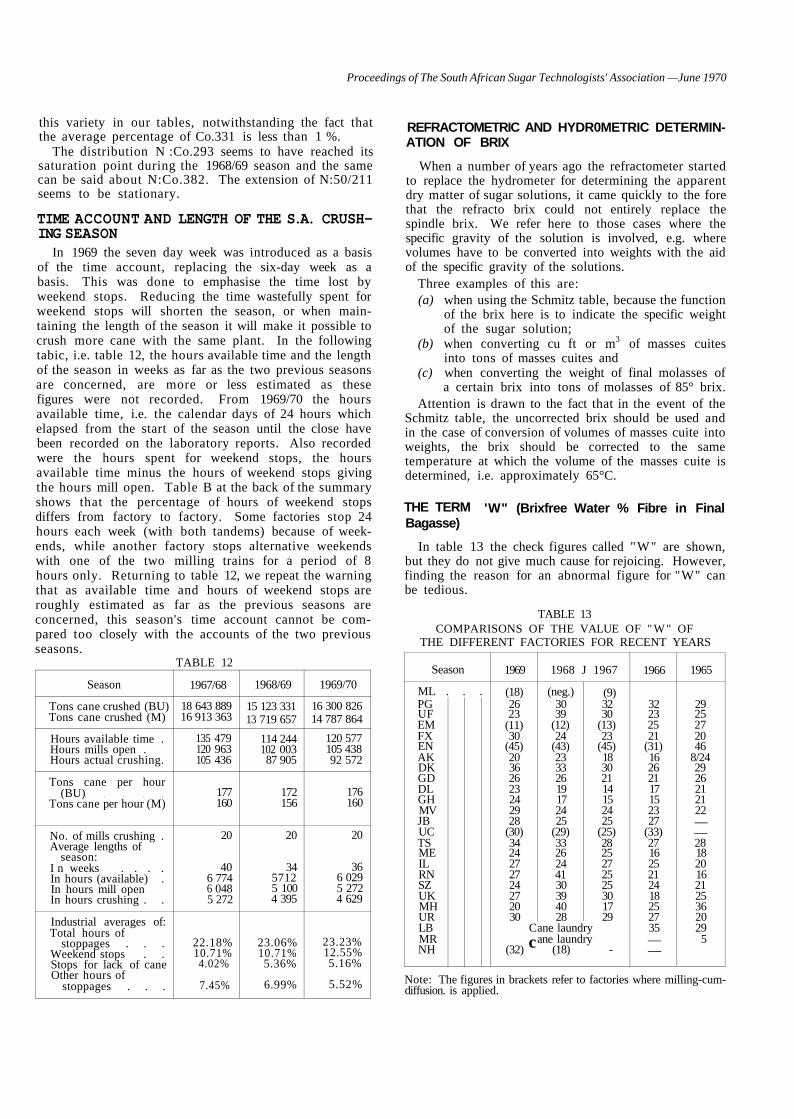
Proceedings of The South African Sugar Technologists' Association —June 1970
this variety in our tables, notwithstanding the fact that the average percentage of Co.331 is less than 1 %.
The distribution N :Co.293 seems to have reached its saturation point during the 1968/69 season and the same can be said about N:Co.382. The extension of N:50/211 seems to be stationary.
TIME ACCOUNT AND LENGTH OF THE S.A. CRUSHING SEASON
In 1969 the seven day week was introduced as a basis of the time account, replacing the six-day week as a basis. This was done to emphasise the time lost by weekend stops. Reducing the time wastefully spent for weekend stops will shorten the season, or when maintaining the length of the season it will make it possible to crush more cane with the same plant. In the following tabic, i.e. table 12, the hours available time and the length of the season in weeks as far as the two previous seasons are concerned, are more or less estimated as these figures were not recorded. From 1969/70 the hours available time, i.e. the calendar days of 24 hours which elapsed from the start of the season until the close have been recorded on the laboratory reports. Also recorded were the hours spent for weekend stops, the hours available time minus the hours of weekend stops giving the hours mill open. Table B at the back of the summary shows that the percentage of hours of weekend stops differs from factory to factory. Some factories stop 24 hours each week (with both tandems) because of weekends, while another factory stops alternative weekends with one of the two milling trains for a period of 8 hours only. Returning to table 12, we repeat the warning that as available time and hours of weekend stops are roughly estimated as far as the previous seasons are concerned, this season's time account cannot be compared too closely with the accounts of the two previous seasons.
TABLE 12
Season
Tons cane crushed (BU) Tons cane crushed (M)
Hours available time . Hours mills open . Hours actual crushing.
Tons cane per hour (BU)
Tons cane per hour (M)
No. of mills crushing . Average lengths of
season: I n weeks . . . . In hours (available) . In hours mill open In hours crushing . .
Industrial averages of: Total hours of
stoppages . . . Weekend stops . . Stops for lack of cane Other hours of
stoppages . . .
1967/68
18 643 889 16 913 363
135 479 120 963 105 436
177 160
20
40 6 774 6 048 5 272
22.18% 10.71% 4.02%
7.45%
1968/69
15 123 331 13 719 657
114 244 102 003 87 905
172 156
20
34 5712 5 100 4 395
23.06% 10.71% 5.36%
6.99%
1969/70
16 300 826 14 787 864
120 577 105 438 92 572
176 160
20
36 6 029 5 272 4 629
23.23% 12.55% 5.16%
5.52%
REFRACTOMETRIC AND HYDR0METRIC DETERMINATION OF BRIX
When a number of years ago the refractometer started to replace the hydrometer for determining the apparent dry matter of sugar solutions, it came quickly to the fore that the refracto brix could not entirely replace the spindle brix. We refer here to those cases where the specific gravity of the solution is involved, e.g. where volumes have to be converted into weights with the aid of the specific gravity of the solutions.
Three examples of this are: (a) when using the Schmitz table, because the function
of the brix here is to indicate the specific weight of the sugar solution;
(b) when converting cu ft or m3 of masses cuites into tons of masses cuites and
(c) when converting the weight of final molasses of a certain brix into tons of molasses of 85° brix.
Attention is drawn to the fact that in the event of the Schmitz table, the uncorrected brix should be used and in the case of conversion of volumes of masses cuite into weights, the brix should be corrected to the same temperature at which the volume of the masses cuite is determined, i.e. approximately 65°C.
'W" (Brixfree Water % Fibre in Final THE TERM Bagasse)
In table 13 the check figures called "W" are shown, but they do not give much cause for rejoicing. However, finding the reason for an abnormal figure for "W" can be tedious.
TABLE 13 COMPARISONS OF THE VALUE OF "W" OF
THE DIFFERENT FACTORIES FOR RECENT YEARS
Season
ML . . . PG UF EM FX EN AK DK GD DL GH MV JB UC TS ME IL RN SZ UK MH UR LB MR NH
1969
(18) 26 23
(11) 30
(45) 20 36 26 23 24 29 28
(30) 34 24 27 27 24 27 20 30
C c (32)
1968 J 1967
(neg.) 30 39
(12) 24
(43) 23 33 26 19 17 24 25
(29) 33 26 24 41 30 39 40 28
(9) 32 30
(13) 23
(45) 18 30 21 14 15 24 25
(25) 28 25 27 25 25 30 17 29
ane laundry ane laundry
(18) -
1966
32 23 25 21
(31) 16 26 21 17 15 23 27
(33) 27 16 25 21 24 18 25 27 35 — —
1965
29 25 27 20 46
8/24 29 26 21 21 22 — — 28 18 20 16 21 25 36 20 29 5
Note: The figures in brackets refer to factories where milling-cum-diffusion. is applied.
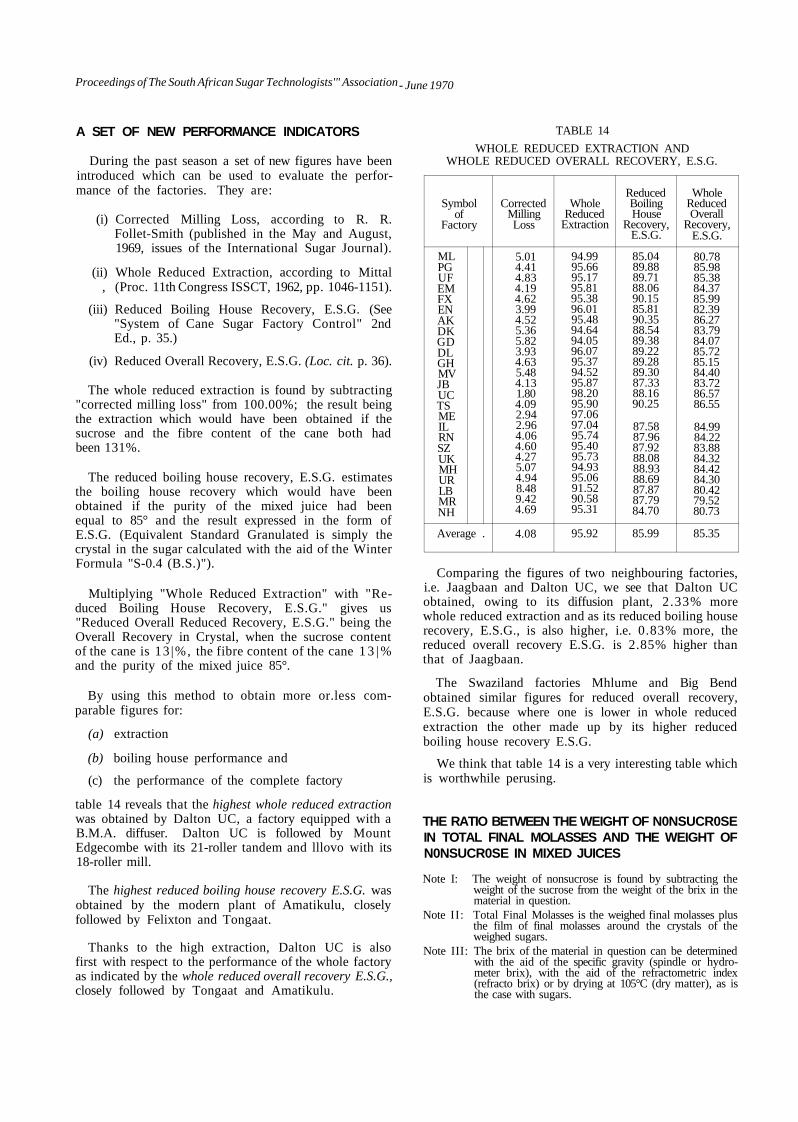
- June 1970 Proceedings of The South African Sugar Technologists'" Association
A SET OF NEW PERFORMANCE INDICATORS
During the past season a set of new figures have been introduced which can be used to evaluate the performance of the factories. They are:
(i) Corrected Milling Loss, according to R. R. Follet-Smith (published in the May and August, 1969, issues of the International Sugar Journal).
(ii) Whole Reduced Extraction, according to Mittal , (Proc. 11th Congress ISSCT, 1962, pp. 1046-1151).
(iii) Reduced Boiling House Recovery, E.S.G. (See "System of Cane Sugar Factory Control" 2nd Ed., p. 35.)
(iv) Reduced Overall Recovery, E.S.G. (Loc. cit. p. 36).
The whole reduced extraction is found by subtracting "corrected milling loss" from 100.00%; the result being the extraction which would have been obtained if the sucrose and the fibre content of the cane both had been 131%.
The reduced boiling house recovery, E.S.G. estimates the boiling house recovery which would have been obtained if the purity of the mixed juice had been equal to 85° and the result expressed in the form of E.S.G. (Equivalent Standard Granulated is simply the crystal in the sugar calculated with the aid of the Winter Formula "S-0.4 (B.S.)").
Multiplying "Whole Reduced Extraction" with "Reduced Boiling House Recovery, E.S.G." gives us "Reduced Overall Reduced Recovery, E.S.G." being the Overall Recovery in Crystal, when the sucrose content of the cane is 13 |%, the fibre content of the cane 1 3 | % and the purity of the mixed juice 85°.
By using this method to obtain more or.less comparable figures for:
(a) extraction
(b) boiling house performance and
(c) the performance of the complete factory
table 14 reveals that the highest whole reduced extraction was obtained by Dalton UC, a factory equipped with a B.M.A. diffuser. Dalton UC is followed by Mount Edgecombe with its 21-roller tandem and lllovo with its 18-roller mill.
The highest reduced boiling house recovery E.S.G. was obtained by the modern plant of Amatikulu, closely followed by Felixton and Tongaat.
Thanks to the high extraction, Dalton UC is also first with respect to the performance of the whole factory as indicated by the whole reduced overall recovery E.S.G., closely followed by Tongaat and Amatikulu.
TABLE 14
WHOLE REDUCED EXTRACTION AND WHOLE REDUCED OVERALL RECOVERY, E.S.G.
Symbol of
Factory
ML PG UF EM FX EN AK DK GD DL GH MV JB UC TS ME IL RN SZ UK MH UR LB MR NH
Average .
Corrected Milling Loss
5.01 4.41 4.83 4.19 4.62 3.99 4.52 5.36 5.82 3.93 4.63 5.48 4.13 1.80 4.09 2.94 2.96 4.06 4.60 4.27 5.07 4.94 8.48 9.42 4.69
4.08
Whole Reduced
Extraction
94.99 95.66 95.17 95.81 95.38 96.01 95.48 94.64 94.05 96.07 95.37 94.52 95.87 98.20 95.90 97.06 97.04 95.74 95.40 95.73 94.93 95.06 91.52 90.58 95.31
95.92
Reduced Boiling House
Recovery, E.S.G.
85.04 89.88 89.71 88.06 90.15 85.81 90.35 88.54 89.38 89.22 89.28 89.30 87.33 88.16 90.25
87.58 87.96 87.92 88.08 88.93 88.69 87.87 87.79 84.70
85.99
Whole Reduced Overall
Recovery, E.S.G.
80.78 85.98 85.38 84.37 85.99 82.39 86.27 83.79 84.07 85.72 85.15 84.40 83.72 86.57 86.55
84.99 84.22 83.88 84.32 84.42 84.30 80.42 79.52 80.73
85.35
Comparing the figures of two neighbouring factories, i.e. Jaagbaan and Dalton UC, we see that Dalton UC obtained, owing to its diffusion plant, 2.33% more whole reduced extraction and as its reduced boiling house recovery, E.S.G., is also higher, i.e. 0.83% more, the reduced overall recovery E.S.G. is 2.85% higher than that of Jaagbaan.
The Swaziland factories Mhlume and Big Bend obtained similar figures for reduced overall recovery, E.S.G. because where one is lower in whole reduced extraction the other made up by its higher reduced boiling house recovery E.S.G.
We think that table 14 is a very interesting table which is worthwhile perusing.
THE RATIO BETWEEN THE WEIGHT OF N0NSUCR0SE IN TOTAL FINAL MOLASSES AND THE WEIGHT OF N0NSUCR0SE IN MIXED JUICES
Note I: The weight of nonsucrose is found by subtracting the weight of the sucrose from the weight of the brix in the material in question.
Note II: Total Final Molasses is the weighed final molasses plus the film of final molasses around the crystals of the weighed sugars.
Note III: The brix of the material in question can be determined with the aid of the specific gravity (spindle or hydrometer brix), with the aid of the refractometric index (refracto brix) or by drying at 105°C (dry matter), as is the case with sugars.
6 Proceedings of The South African Sugar Technologists'1 Association — June 1970
To add to the confusion we have the problem that the mixed juice of pure milling factories cannot truly be compared with the mixed juice of a milling-cum-diffusion factory. In the latter case approximately 40% of the mixed juice has passed some kind of juice clarification inside the diffuser. We have only to point to the fact that the percentage of filter cake discharged from a milling-cum-diffusion factory is only 3/5th of that of a pure milling factory.
It would therefore be a good idea to compare non-sucrose in total final molasses with nonsucrose in clarified juice. However, here again we have the difficulty that some factories use the refracto brix for the boiling house products, while most of the mills use the spindle brix throughout. If we want to compare the effect of diffusion on (he nonsucrose ratio we should divide the factories into four groups:
(a) pure milling and spindle brix
(b) pure milling and refracto brix
(c) diffusion and spindle brix
(d) diffusion and refracto brix
TABLE 15 NONSUCROSE RATIOS BASED ON CLARIFIED JUICE
(a)
PG 0.926
UF 0.924
DK 0.954
GD 0.901
GH 0.970
MV 0.996
JB 0.993
IL 0.982
RN 0.950
SZ 0.992
UK 0,996
UR 0.918
LB 0.829
MR 0.825
(b)
FX 0.839
AK 0.823
DL 0.833
ME H.T.M.
MH 0.826
TS 0.829
— — — _
— _ _ —
(c)
UC 0.940
EN 0.946
— — — — — — — — — — — —
(d)
ML 0.836
EM 0.887
NH 1.031
— — — — — — — — — — —
Table 15 gives us quite a different picture to that of the following table, i.e. table 16, where we tried to make the different factories comparable by converting the outgoing nonsucrose of all factories to "spindle brix nonsucrose", like the nonsucrose in mixed juice of all factories.
TABLE 16
NONSUCROSE RATIOS OF MILLING FACTORIES COMPARED WITH THOSE OF MILLING-CUM-DIFFUSION
ONES ("BRIX" IN MIXED JUICE AND IN WEIGHED FINAL MOLASSES DETERMINED
WITH THE AID OF THE HYDROMETER)
Pure Milling Factories
Mill
PG UF FX AK DK GD DL GH MV JB TS IL RN SZ UK MH UR LB MR
Average
Ratio
0.82 0.85 0.79 0.82 0.90 0.86 0.84 0.84 0.89 0.87 0.85 0.87 0.82 0.92 0.88 0.85 0.85
• 0.92 0.74
0.85
Diffusion Factories
Mill
ML EM EN UC
Average
NH
Ratio
0.94 0.88 0.95 0.88
0.91
1.06
Note: The N.S. Ratio of Nchalo was not included into the average for diffusion factories because of doubt regarding its final molasses weight.
Table 16 gives us the impression that the diffusion factories produce more final molasses than commensurate with the purity of the mixed juice, but table 15 does not confirm this.
Although using clarified juice as a starting point makes the different factories better comparable, it still does not take into account something that might happen in the diffuser. In this respect using clarified juice as base is not any better than using mixed juice.
Of course we could also try to compare the differences in purities between first expressed juice and clarified juice in order to make out if diffusion leads to a greater portion of nonsucrose in the juice than in the event of pure milling. However here we will meet the difficulty that the drop in purity between first and last expressed juices depends on many factors, for example in the case of pure milling on the degree of cleanliness of the tandem. Further there is the effect of the degree of extraction on this drop. In addition the curve described by the drop in purity by increased pressure and extraction is not the same for every cane.
The staff of Dalton UC is convinced that the treatment of the press water, i.e. the method of clarification applied to the juice squeezed out by the dewatering mill(s), has a great effect. During the period that the press water was returned directly to the diffuser (bypassing the press water clarifier) the nonsucrose ratio
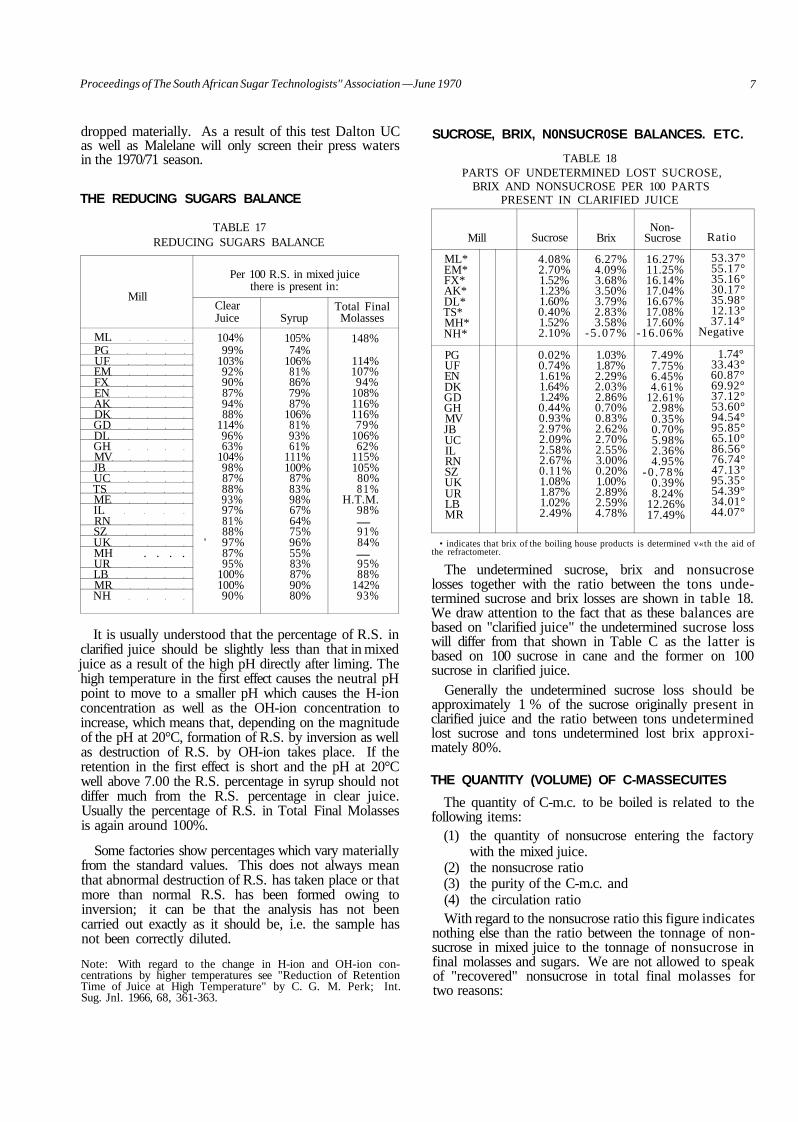
Proceedings of The South African Sugar Technologists'' Association —June 1970 7
dropped materially. As a result of this test Dalton UC as well as Malelane will only screen their press waters in the 1970/71 season.
THE REDUCING SUGARS BALANCE
TABLE 17 REDUCING SUGARS BALANCE
Mill
ML PG UF EM FX EN AK DK GD DL GH MV JB UC TS ME IL RN SZ UK MH . . . . UR LB MR NH
Per 100 R.S. in mixed juice there is present in:
Clear Juice
104% 99%
103% 92% 90% 87% 94% 88%
114% 96% 63%
104% 98% 87% 88% 93% 97% 81% 88%
' 97% 87% 95%
100% 100% 90%
Syrup
105% 74%
106% 81% 86% 79% 87%
106% 81% 93% 61%
111% 100% 87% 83% 98% 67% 64% 75% 96% 55% 83% 87% 90% 80%
Total Final Molasses
148%
114% 107% 94%
108% 116% 116% 79%
106% 62%
115% 105% 80% 81%
H.T.M. 98% — 91% 84% — 95% 88%
142% 93%
It is usually understood that the percentage of R.S. in clarified juice should be slightly less than that in mixed juice as a result of the high pH directly after liming. The high temperature in the first effect causes the neutral pH point to move to a smaller pH which causes the H-ion concentration as well as the OH-ion concentration to increase, which means that, depending on the magnitude of the pH at 20°C, formation of R.S. by inversion as well as destruction of R.S. by OH-ion takes place. If the retention in the first effect is short and the pH at 20°C well above 7.00 the R.S. percentage in syrup should not differ much from the R.S. percentage in clear juice. Usually the percentage of R.S. in Total Final Molasses is again around 100%.
Some factories show percentages which vary materially from the standard values. This does not always mean that abnormal destruction of R.S. has taken place or that more than normal R.S. has been formed owing to inversion; it can be that the analysis has not been carried out exactly as it should be, i.e. the sample has not been correctly diluted.
Note: With regard to the change in H-ion and OH-ion concentrations by higher temperatures see "Reduction of Retention Time of Juice at High Temperature" by C. G. M. Perk; Int. Sug. Jnl. 1966, 68, 361-363.
SUCROSE, BRIX, N0NSUCR0SE BALANCES. ETC.
TABLE 18 PARTS OF UNDETERMINED LOST SUCROSE,
BRIX AND NONSUCROSE PER 100 PARTS PRESENT IN CLARIFIED JUICE
Mill
ML* EM* FX* AK* DL* TS* MH* NH*
PG UF EN DK GD GH MV JB UC IL RN SZ UK UR LB MR
Sucrose
4.08% 2.70% 1.52% 1.23% 1.60% 0.40% 1.52% 2.10%
0.02% 0.74% 1.61% 1.64% 1.24% 0.44% 0.93% 2.97% 2.09% 2.58% 2.67% 0.11% 1.08% 1.87% 1.02% 2.49%
Brix
6.27% 4.09% 3.68% 3.50% 3.79% 2.83% 3.58%
-5 .07%
1.03% 1.87% 2.29% 2.03% 2.86% 0.70% 0.83% 2.62% 2.70% 2.55% 3.00% 0.20% 1.00% 2.89% 2.59% 4.78%
Non-Sucrose
16.27% 11.25% 16.14% 17.04% 16.67% 17.08% 17.60%
-16.06%
7.49% 7.75% 6.45% 4.61%
12.61% 2.98% 0.35% 0.70% 5.98% 2.36% 4.95%
- 0 . 7 8 % 0.39% 8.24%
12.26% 17.49%
Ratio
53.37° 55.17° 35.16° 30.17° 35.98° 12.13° 37.14°
Negative
1.74° 33.43° 60.87° 69.92° 37.12° 53.60° 94.54° 95.85° 65.10° 86.56° 76.74° 47.13° 95.35° 54.39° 34.01° 44.07°
• indicates that brix of the boiling house products is determined v«th the aid of the refractometer.
The undetermined sucrose, brix and nonsucrose losses together with the ratio between the tons undetermined sucrose and brix losses are shown in table 18. We draw attention to the fact that as these balances are based on "clarified juice" the undetermined sucrose loss will differ from that shown in Table C as the latter is based on 100 sucrose in cane and the former on 100 sucrose in clarified juice.
Generally the undetermined sucrose loss should be approximately 1 % of the sucrose originally present in clarified juice and the ratio between tons undetermined lost sucrose and tons undetermined lost brix approximately 80%.
THE QUANTITY (VOLUME) OF C-MASSECUITES
The quantity of C-m.c. to be boiled is related to the following items:
(1) the quantity of nonsucrose entering the factory with the mixed juice.
(2) the nonsucrose ratio (3) the purity of the C-m.c. and (4) the circulation ratio With regard to the nonsucrose ratio this figure indicates
nothing else than the ratio between the tonnage of nonsucrose in mixed juice to the tonnage of nonsucrose in final molasses and sugars. We are not allowed to speak of "recovered" nonsucrose in total final molasses for two reasons:
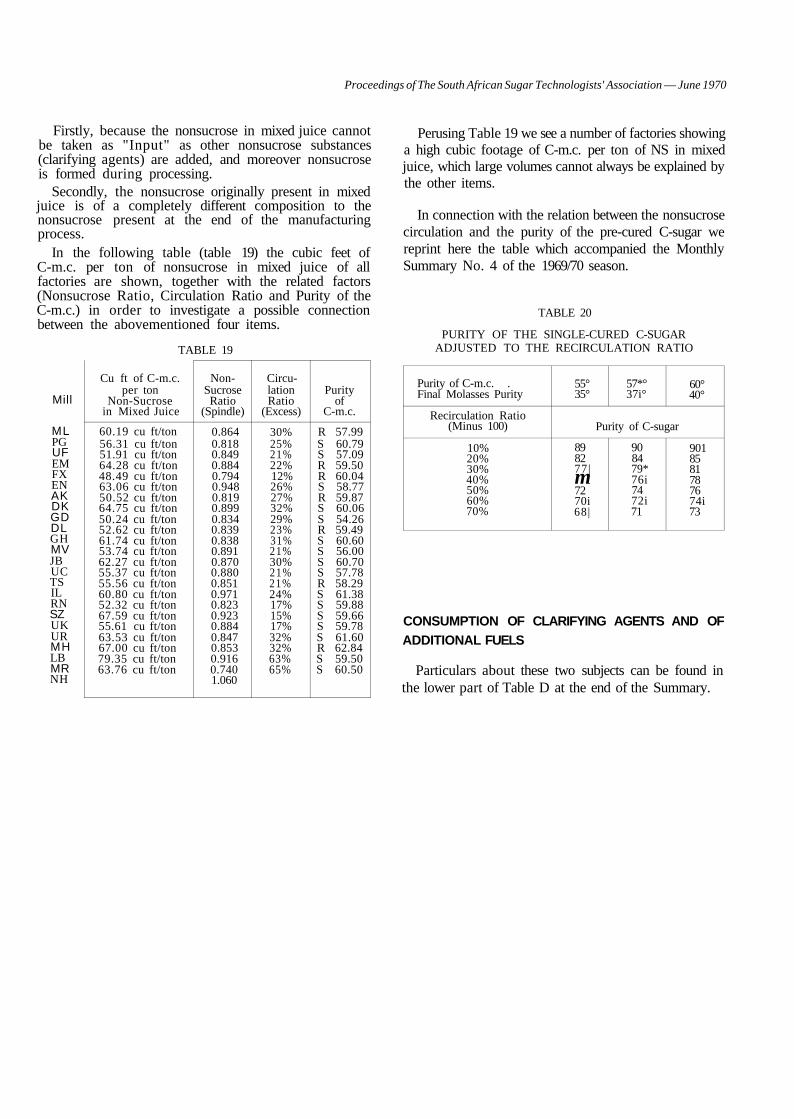
Proceedings of The South African Sugar Technologists' Association — June 1970
Firstly, because the nonsucrose in mixed juice cannot be taken as "Input" as other nonsucrose substances (clarifying agents) are added, and moreover nonsucrose is formed during processing.
Secondly, the nonsucrose originally present in mixed juice is of a completely different composition to the nonsucrose present at the end of the manufacturing process.
In the following table (table 19) the cubic feet of C-m.c. per ton of nonsucrose in mixed juice of all factories are shown, together with the related factors (Nonsucrose Ratio, Circulation Ratio and Purity of the C-m.c.) in order to investigate a possible connection between the abovementioned four items.
TABLE 19
Mill
ML PG UF EM FX EN AK DK GD DL GH MV JB UC TS IL RN SZ UK UR MH LB MR NH
Cu ft of C-m.c. per ton
Non-Sucrose in Mixed Juice
60.19 cu ft/ton 56.31 cu ft/ton 51.91 cu ft/ton 64.28 cu ft/ton 48.49 cu ft/ton 63.06 cu ft/ton 50.52 cu ft/ton 64.75 cu ft/ton 50.24 cu ft/ton 52.62 cu ft/ton 61.74 cu ft/ton 53.74 cu ft/ton 62.27 cu ft/ton 55.37 cu ft/ton 55.56 cu ft/ton 60.80 cu ft/ton 52.32 cu ft/ton 67.59 cu ft/ton 55.61 cu ft/ton 63.53 cu ft/ton 67.00 cu ft/ton 79.35 cu ft/ton 63.76 cu ft/ton
Non-Sucrose Ratio
(Spindle)
0.864 0.818 0.849 0.884 0.794 0.948 0.819 0.899 0.834 0.839 0.838 0.891 0.870 0.880 0.851 0.971 0.823 0.923 0.884 0.847 0.853 0.916 0.740 1.060
Circulation Ratio
(Excess)
30% 25% 21% 22% 12% 26% 27% 32% 29% 23% 31% 21% 30% 21% 21% 24% 17% 15% 17% 32% 32% 63% 65%
Purity of
C-m.c.
R 57.99 S 60.79 S 57.09 R 59.50 R 60.04 S 58.77 R 59.87 S 60.06 S 54.26 R 59.49 S 60.60 S 56.00 S 60.70 S 57.78 R 58.29 S 61.38 S 59.88 S 59.66 S 59.78 S 61.60 R 62.84 S 59.50 S 60.50
Perusing Table 19 we see a number of factories showing a high cubic footage of C-m.c. per ton of NS in mixed juice, which large volumes cannot always be explained by the other items.
In connection with the relation between the nonsucrose circulation and the purity of the pre-cured C-sugar we reprint here the table which accompanied the Monthly Summary No. 4 of the 1969/70 season.
TABLE 20
PURITY OF THE SINGLE-CURED C-SUGAR ADJUSTED TO THE RECIRCULATION RATIO
Purity of C-m.c. . Final Molasses Purity
Recirculation Ratio (Minus 100)
10% 20% 30% 40% 50% 60% 70%
55° 35°
57*° 37i°
60° 40°
Purity of C-sugar
89 82 77| m 72 70i 68|
90 84 79* 76i 74 72i 71
901 85 81 78 76 74i 73
CONSUMPTION OF CLARIFYING AGENTS AND OF ADDITIONAL FUELS
Particulars about these two subjects can be found in the lower part of Table D at the end of the Summary.
TABLE A
SOUTH AFRICAN SUGAR ASSOCIATION FINAL PRODUCTION 1969/70 SEASON
SHORT TONS
I &
MILL
LOCAL MARKET
White
Refinery
Raws Brown
EXPORT MARKET
High Pol
Very High Pol Adjusted to
Low Pol High Pol Low Pol
H.T.M.
(Sugar)
Equivalent)
TOTAL
I
Malelane.
Pongola .
Umfolozi . .
Empangeni .
Felixton .
Entumeni
Amatikulu .
Doornkop .
Glendale.
Darnall .
Gledhow.
Melville .
Jaagbaan
Union Co-op. .
Tongaat .
Mount Edgecombe
Illovo
Sezela
Renishaw
Umzimkulu .
TOTALS . .
107,827
44,255
11,318
116,018
81,037
68
42,209
109,324
69,427
17,174
105
23,305
21,056
248
18,634
8,519
254
100,038
20,701
83
42
10,159
8,626
38,953
8,290
240
1,198
3,659
17,832
95
76 312 83
2,740
— 71 548
2,498
7,410
50
33,926
80
— —
8,785
—
32,344
8,800
41,172
6,921
—
25,140
29,824
—
57,413
112
62,969
— 4,994
(Syrup) 177
38,197
— 78,083
47,303
91,568
35,412
75,619
17,141
21,123
35,397
4,483
267
271
4,433
2,755
1,588
324
658
7,790
933
698
9,962
593
601
9,852
6,121
3,528
721
1,461
17,310
2,073
1,551
63,544
116,453
83,208
121,032
109,564
103,829
24,649
182,031
42,533
23,381
131,003
151,289
39,560
65,932
23,679
188,655
86,743
48,061
122,332
33,994
90,571
360,523 441,278 126,687 394,931 323,563 24,200 53,773 63,544 1,788,499
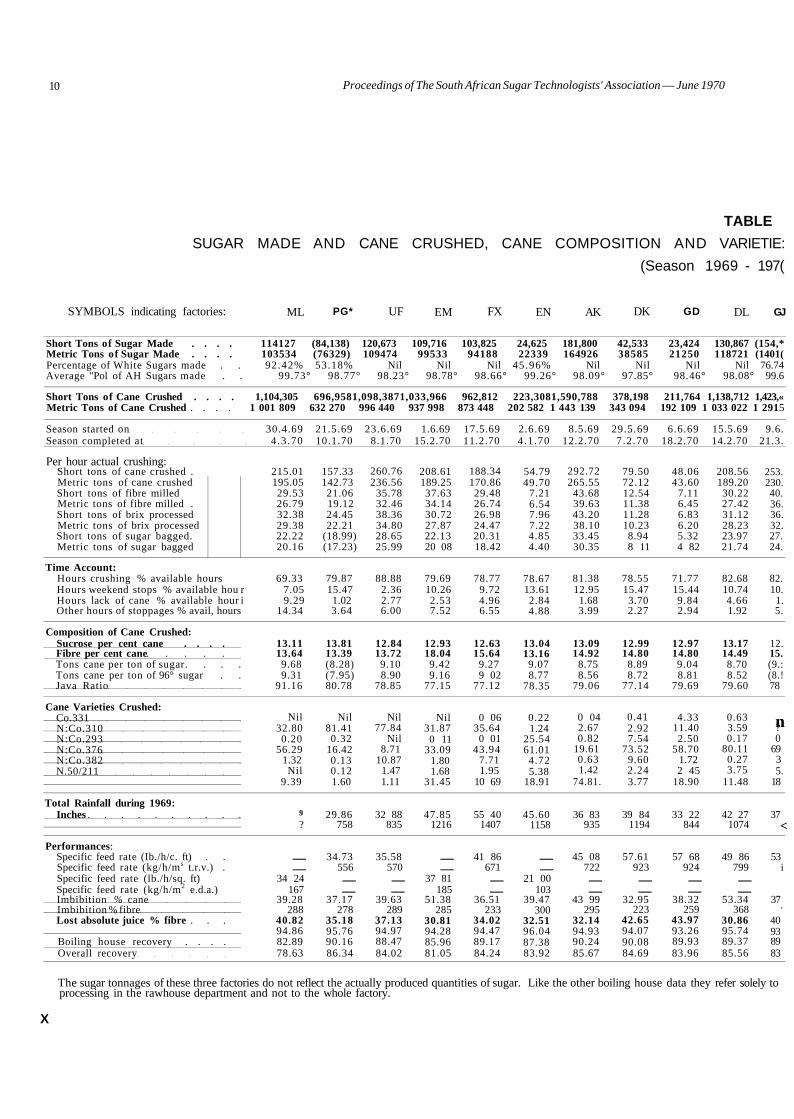
10 Proceedings of The South African Sugar Technologists' Association — June 1970
TABLE
SUGAR MADE AND CANE CRUSHED, CANE COMPOSITION AND VARIETIE:
(Season 1969 - 197(
SYMBOLS indicating factories: ML PG* UF EM FX EN AK DK GD DL GJ
Short Tons of Sugar Made . . . . 114127 (84,138) 120,673 109,716 103,825 24,625 181,800 42,533 23,424 130,867 (154,* Metric Tons of Sugar Made . . . . 103534 (76329) 109474 99533 94188 22339 164926 38585 21250 118721 (1401( Percentage of White Sugars made . . 92.42% 53.18% Nil Nil Nil 45.96% Nil Nil Nil Nil 76.74 Average "Pol of AH Sugars made . . 99.73° 98.77° 98.23° 98.78° 98.66° 99.26° 98.09° 97.85° 98.46° 98.08° 99.6
Short Tons of Cane Crushed . . . . 1,104,305 696,9581,098,3871,033,966 962,812 223,3081,590,788 378,198 211,764 1,138,712 1,423,« Metric Tons of Cane Crushed . . . . 1 001 809 632 270 996 440 937 998 873 448 202 582 1 443 139 343 094 192 109 1 033 022 1 2915
Season started on 30.4.69 21.5.69 23.6.69 1.6.69 17.5.69 2.6.69 8.5.69 29.5.69 6.6.69 15.5.69 9.6. Season completed at 4 .3 .70 10.1.70 8.1.70 15.2.70 11.2.70 4.1.70 12.2.70 7.2.70 18.2.70 14.2.70 21.3.
Per hour actual crushing: Short tons of cane crushed . Metric tons of cane crushed Short tons of fibre milled Metric tons of fibre milled . Short tons of brix processed Metric tons of brix processed Short tons of sugar bagged. Metric tons of sugar bagged
Time Account: Hours crushing % available hours Hours weekend stops % available hou Hours lack of cane % available hour Other hours of stoppages % avail, hours
Composition of Cane Crushed: Sucrose per cent cane . . . . Fibre per cent cane Tons cane per ton of sugar. . . . Tons cane per ton of 96° sugar . . Java Ratio
Cane Varieties Crushed: Co.331 N:Co.310 N:Co.293 N:Co.376 N:Co.382 N.50/211
Total Rainfall during 1969: Inches
Performances: Specific feed rate (Ib./h/c. ft) . . Specific feed rate (kg/h/ms t.r.v.) . Specific feed rate (lb./h/sq. ft) Specific feed rate (kg/h/m2 e.d.a.) Imbibition % cane Imbibition % fibre Lost absolute juice % fibre . . .
Boiling house recovery . . . . Overall recovery
215.01 195.05 29.53 26.79 32.38 29.38 22.22 20.16
69.33 r 7.05 i 9.29
14.34
13.11 13.64 9.68 9.31
91.16
Nil 32.80 0.20
56.29 1.32 Nil
9.39
9
?
— —
34 24 167
39.28 288
40.82 94.86 82.89 78.63
157.33 142.73 21.06 19.12 24.45 22.21
(18.99) (17.23)
79.87 15.47 1.02 3.64
13.81 13.39 (8.28) (7.95) 80.78
Nil 81.41 0.32
16.42 0.13 0.12 1.60
29.86 758
34.73 556 — —
37.17 278
35.18 95.76 90.16 86.34
260.76 236.56
35.78 32.46 38.36 34.80 28.65 25.99
88.88 2.36 2.77 6.00
12.84 13.72 9.10 8.90
78.85
Nil 77.84
Nil 8.71
10.87 1.47 1.11
32 88 835
35.58 570 — —
39.63 289
37.13 94.97 88.47 84.02
208.61 189.25 37.63 34.14 30.72 27.87 22.13 20 08
79.69 10.26 2.53 7.52
12.93 18.04 9.42 9.16
77.15
Nil 31.87 0 11
33.09 1.80 1.68
31.45
47.85 1216
— —
37 81 185
51.38 285
30.81 94.28 85.96 81.05
188.34 170.86 29.48 26.74 26.98 24.47 20.31 18.42
78.77 9.72 4.96 6.55
12.63 15.64
9.27 9 02
77.12
0 06 35.64 0 01
43.94 7.71 1.95
10 69
55 40 1407
41 86 671 — —
36.51 233
34.02 94.47 89.17 84.24
54.79 49.70
7.21 6.54 7.96 7.22 4.85 4.40
78.67 13.61 2.84 4.88
13.04 13.16 9.07 8.77
78.35
0.22 1.24
25.54 61.01 4.72 5.38
18.91
45.60 1158
— —
21 00 103
39.47 300
32.51 96.04 87.38 83.92
292.72 265.55
43.68 39.63 43.20 38.10 33.45 30.35
81.38 12.95
1.68 3.99
13.09 14.92
8.75 8.56
79.06
0 04 2.67 0.82
19.61 0.63 1.42
74.81.
36 83 935
45 08 722 — —
43 99 295
32.14 94.93 90.24 85.67
79.50 72.12 12.54 11.38 11.28 10.23 8.94 8 11
78.55 15.47 3.70 2.27
12.99 14.80
8.89 8.72
77.14
0.41 2.92 7.54
73.52 9.60 2.24 3.77
39 84 1194
57.61 923 — —
32.95 223
42.65 94.07 90.08 84.69
48.06 43.60
7.11 6.45 6.83 6.20 5.32 4 82
71.77 15.44 9.84 2.94
12.97 14.80 9.04 8.81
79.69
4.33 11.40 2.50
58.70 1.72 2 45
18.90
33 22 844
57 68 924 — —
38.32 259
43.97 93.26 89.93 83.96
208.56 189.20 30.22 27.42 31.12 28.23 23.97 21.74
82.68 10.74 4.66 1.92
13.17 14.49 8.70 8.52
79.60
0.63 3.59 0.17
80.11 0.27 3.75
11.48
42 27 1074
49 86 799 — —
53.34 368
30.86 95.74 89.37 85.56
253. 230. 40. 36. 36. 32. 27. 24.
82. 10.
1. 5.
12. 15. (9.: (8.! 78
n ? 0
69 3 5.
18
37 <
53 i
37 •
40 93 89 83
The sugar tonnages of these three factories do not reflect the actually produced quantities of sugar. Like the other boiling house data they refer solely to processing in the rawhouse department and not to the whole factory.
X

Proceedings of The South African Sugar Technologists' Association — June 1970 11
HROUGHPUTS AND TIME ACCOUNTS, PERFORMANCES
MV JB UC TS ME IL RN SZ* UK
39,546 65,895 23,734 188,806 (86,744) 48,059 33,994 (124,551) 90,577 35 875 59 779 21531 171282 (78 693) 43 598 30 839 (112 991) 82 170
Nil Nil Nil Nil Nil Nil Nil 66% Nil 98.06° 98.56° 97.88° 98.42° H.T.M. 97.85° 98.63° 99.64° 98.73°
155,048 631,073 220,852 1,748,628 807,958 443,048 327,818(1,116,090) 787,459 (22 094 572 500 200 354 1 586 329 732 967 401 926 297 392(1 012 500) 714 371
4.5.69 17.5.69 19.5.69 6.6.69 28.5.69 8.5.69 19.6.69 16.6.69 14.6.69 9.1.70 6.12.69 20.12.69 23.2.70 14.1.70 11.1.70 26.2.70 28.2.70 11.2.70
79.48 192.39 57.69 315.87 185.47 103.19 78.65 251.53 171.46 72.11 174.53 52.34 286.55 168.27 93.61 71.35 228.18 155.55 12.00 27.85 8.66 49.60 28.30 15.17 12.26 37.92 24.54 10.89 25.26 7.85 45.00 25.68 13.76 11.12 34.40 22.26 11.27 27.98 8.34 43.77 26.46 14.96 10.91 36.55 24.82 10.22 25.39 7.57 39.71 24.01 13.57 9.90 33.15 22.51 8.85 20.09 6.20 34.10 H.T.M. 11.19 8.16 28 07 19.72 8.03 18.22 5.62 30 94 H.T.M. 10.15 7.40 25.46 17.89
71.68 68.09 73.82 79.17 78.32 72.68 68.89 72.79 78.84 16.09 13.18 14.95 9.76 15.64 17.25 15.62 12.20 14.19 6.12 9.42 4.19 4.39 4.59 8.34 8.96 7.43 4.39 6.11 9.31 7.04 6.68 1.45 1.72 6.53 7.58 2.56
12.92 12.62 12.31 12.36 12.35 12.72 12.31 13.14 13.19 15.10 14.48 15.01 15.70 15 26 14.70 15.59 15 08 14.31
. 8.98 9.58 9.31 9.26 H.T.M. 9.22 9.64 (8.96) 8.69 8.79 9.33 9.13 9.03 H.T.M. 9.04 9.39 (8 69) 8.45
78.26 80.59 78.55 77.16 78.60 78.49 78.15 78.52 79.64
0.65 6.95 3.07 0.23 1.02 1.20 Nil 0.13 0.31 3.37 2.28 0.47 5.01 3.44 3.53 3.53 2.10 5.63 0.01 51.01 63.39 1.05 6.15 Nil Nil 0.07 2.14
47.78 15.97 7.09 53.13 44.07 78.26 78.26 81.15 90.25 1.37 22.07 24.56 5.56 1.95 10 68 10.80 3.14 0.28 3.45 0.40 1.08 12.21 7.90 2.13 6.78 0.95 0.51
43.37 1.32 0.34 22.81 35.47 4 20 0.63 12.46 0.88
48.29 30.21 37.15 44.88 51.02 46 40 46.85 47 85 45.75 1227 767 944 1140 1296 1179 1190 1215 1162
43.63 38.71 — 53.61 47.05 37.32 48.35 75.10 64.32 699 620 — 859 754 598 774 1203 1030 — — 33.40 _ _ _ _ _ _
45.68 38.28 35.31 34.32 50.54 39.10 35.59 44 85 36.48 302 264 235 219 331 266 228 297 255
41.15 34.31 15.83 30.76 25.40 33.25 34.56 35.52 35 08 93.74 95.42 97.91 95.02 96.53 95.66 94.86 94.79 95 42 90.19 84.45 87.25 90.50 — 87.21 87.57 88.88 90.21 84.54 81.54 85.43 85.99 — 83.43 83.07 84.25 86.08
Totals and
Means
(1,792,077) (1,625,745)
20% 98.68°
16,300,826 14 787 865
30.4.69 21.3.70
176.05 159.70 26.46 24.00 25.57 23.20 19.35 17.56
76.77 12.55 5.16 5.52
12.88 15.03 (9.10) (8.86) 78.78
0.60 13.47 4.40
52.60 3.95 3.64
21.34
41.54 1055
41.22 274
34.15 94.98 88.58 84.13
MH UR LB MR NH
87,829 84,808 78,181 74,587 29,640 79 677 76937 70 925 67 664 26 889 2.17% 21.40% 55.40% 64 48% 37.14% 98.56° 98.72° 98.93° 99.17° 97.58°
761,694 803,176 725,693 691,600 266,106 690 997 728 629 658 344 627 410 241407
19.5.69 2.5.69 5.5.69 5.5.69 24.4.69 19.1.70 1.1.70 4.11.69 21.12.69 24.11.69
164.16 161.31 204.93 151.12 70.40 148.92 146.24 185.91 137.09 63.87 23.44 21.33 28.16 22.33 9.85 21.26 19.35 25.55 20.26 8.94 24.28 23.19 28.11 22.42 10.65 22.03 21.04 25.50 20.34 9.66 18.93 17.02 22.08 16.30 7.84 17.17 15.44 20.03 14.78 7.11
78.89 85.01 80.67 82.94 74.26 6.67 7.55 9.11 9.25 12.53
10.53 4.90 5.55 3.11 0.95 3.91 2.54 4.68 4.64 12.26
13.37 12.55 13 03 13.78 13.46 14.28 13.22 13.74 14.78 14.00 8.67 9.48 9.28 9.17 8.98 8.45 9.16 9.01 8.87 8.83
81.17 80.65 Cane Laundries 80.50
Nil Nil Nil Nil Nil 34.12 19.67 28.50 28.57 69.20
Nil Nil Nil 0.21 Nil 63.24 67.62 58.50 61.30 29.88 0.14 Nil 9.70 8.99 Nil
Nil 3.54 Nil Nil Nil 2.50 9.17 3.30 0.93 0.92
33.36 23.73 47.46 41.13 ? 847 603 1205 1044 ?
66.96 65.97 73.81 70.22 — 1073 972 1182 1125 —
_ _ _ _ 30.98 — — — — 151
27.92 28.04 27.52 28 48 42.03 196 212 200 193 300
36 44 37.18 61.76 63.39 32.46 94 62 94.98 91.21 89.79 95.14 89.81 87.38 89.71 86.64 84.85 84.98 82.99 81.83 77.98 80.73

12 Proceedings of The South African Sugar Technologists'1 Association — June 1970
TABLE I
SUCROSE BALANCE, ANALYSIS OF BAGASSE, JUICE*
(Season 1969 - 197C
FACTORY SYMBOL: ML
Sucrose Balance: Lost in Bagasse (a) Lost in Filter Cake (b). . . . Lost in Final Molasses (c). . . Undetermined Sucrose Losses (d) . Boiling House Losses (b)-\-(c)+(d) Sum of All Losses (a )+(6)+(c)+(a
Final Bagasse:
Moisture % Bagasse . . . .
Bagasse % Cane L.C.V. in btu per lb. Bagasse . L.C.V. in kJ per kg Bagasse . . Brixfree Water % Fibre . . .
First Expressed Juice:
Degrees (Apparent) Purity. .
Last Expressed Juice: Degrees Brix Degrees (Apparent) Purity. . . Purity Drop
Mixed Juice:
Degrees (Apparent) Purity. .
Degrees Gravity Purity Reducing Sugars/Sucrose Ratio .
Clarified Juice: Degrees Brix Degrees (Apparent) Purity. . Reducing Sugars/Sucrose Ratio . Average pH
Filter Cake: Sucrose % Filter Cake. . . Filter Cake % Cane . . . .
Syrup: Degrees Brix Degrees (Apparent) Purity. . . Reducing Sugars/Sucrose Ratio . Average pH
Final Molasses: Spindle Brix (undiluted) Refracto Brix (undiluted) . . . Pol/Spindle Brix Purity. . . . Sucrose/Spindle Brix Purity . Pol/Refracto Brix Purity . Sucrose Refracto Brix Purity . Percentage Reducing Sugars . Percentage Sulphated Ash. Reducing Sugars/Ash Quotient . Molasses of 85° Spindle Brix % Ca
5.14 0.44
11.93 3.86
16.23 ). 21.37
2.09 54.56 42.23 32.29 2898 6741
18
19.20 84.12
3.08 65.10 19.02
14.08 —
1.56 82.56 6.10
13.09 82.03
6.39 7.25
1.76 3.30
60.97 82.40
6.43 6.26
— 84.91
— —
37.47 41.02 18.45 11-38
1.62 ne 4.72
P C
4.26 1.06 8.33 0.03 9.41
13.67
2.01 51.28 45.80 29.23 3183 7404
26
19.74 86.63
2.55 69.41 17.22
14.42 85.02
1.61 84.95 3.18
14.09 86.37
3.18 7.18
2.47 5.92
64.19 85.73 2.39 6.59
93.22 —
38.98 — — — —
— 3.47
UF
5.03 0.76 9.49 0.70
10.95 15.98
1.99 54.84 42.31 32.43 2876 6690
33
19.12 85.16
1.95 70.25 14.91
13.72 82.92 2.24
— 3.59
13.22 83.97
3.73 7.07
1.96 5.00
62.59 83.95
3.83 6.39
94.06 —
38.95 38.04
— —
10.25 15.25 0.67 3.77
EM
5.72 0.19
10.69 2.35
13.23 18.95
1.77 54.32 43.12 41.85
2925 6803
11
19.77 84.77
3.58 69.09 15.68
13.45 —
1.97 82.80 4.11
13.20 83.69
3.80 7.30
0.79 3.17
61.80 84.65
3.32 6.50
— 89.32
— —
40.81 40.65 13.59 13.21
1.03 4.00
FX
5.53 0.76 8.04 1.43
10.23 15.76
1 99 52.70 44.55 35.10 3061 7120
30
19.21 85.22
2.42 72.41 12.81
14.13 —
1.93 83.29 4.49
12.71 85.22
4.06 7.30
1.60 6 00
61.56 85.90
3.87 6.30
— 89.17
— — —
38.68 15.80 16.14 0.98 3.29
EN
3.96 0.80 9.78 1.54
12.12 16.08
1.60 56.75 40.91 32.16 2718 6322
45
18 87 88.23
1.28 69.55 18.68
13.53 —
1.97 86.26 2.51
13 02 86.14 2 20 7.47
2 09 5.00
61.83 85.96
2.00 7.01
91.08 —
42.11 40.36
— — —
13.01 —
3.63
AK
5.06 0.57 7.53 1.17 9.27
14.33
1.94 53.69 43.73 34.13 2926 6807
20
19.05 86.87
1 81 75.38 11.49
12.77 —
2.70 84 17 3.59
12.52 85.66
3.38 7.46
1 50 5 03
59.76 86.52
3.16 6.66
— 89.04
— —
36.71 38.81 16.27 13.79
1.18 3.22
DK
5.99 0.62 6.97 1.73 9.32
15.31
2.27 53.51 43.18 34.27 2986 6945
36
19.20 87.73
3.39 69.92 18.81
14.38 86.03
1.70 86.10 2.99
13.87 86.72 2.26 7.40
1.61 5.00
58.81 86.60
3.20 6.50
92.40 —
36.81 39.04
— —
13.15 — —
2.98
GD
6.64 0.27 8.24 1.06 9.30
16.04
2.58 52.03 44.44 33.30 3108 7230
26
18.91 86.69
3.04 73.02 13.67
13.54 85.18
1.51 —
4.61
13.48 85.72 4.87 7.08
1.16 3.00
61.33 86.11 4.07 6.62
94.18 —
36.91 38.91
— —
15.18 15.70 0.97 3.24
DL
4.26 0.49 8.16-1.53
10.18 14.44
1.75 52.33 45.11 32.12 3097 7204
23
19.15 86.44
1.82 68.40 18.04
12.31 —
1.92 84.52 3.63
11.63 85.45
3.49 7.40
1.31 4.95
62.51 85.70
3.37 6.60
— 85.72
— — —
40.14 13.67 14.98 0.92 3.34
&
6. 0.! 9.:
o.< 15.' 21.!
2.: 53.i 43.: 36.' 291 69;
19.: 85.1
2.1 67.. 18..
14.1
1.: 84 J 5.:
13.. 86-
3.: 7..
1. 4.
60. 86.
3.
87.
39.
10.
3.
L.C.V. (Bagasse: British Units) = 7650 - 18S - 86.4M btu per lb. Bagasse. Lower Calorific Value (metric units) 17 795 — 42S — 201M kJ per kg. S stands for Pol % Bagasse; M indicates moisture % Bagasse.
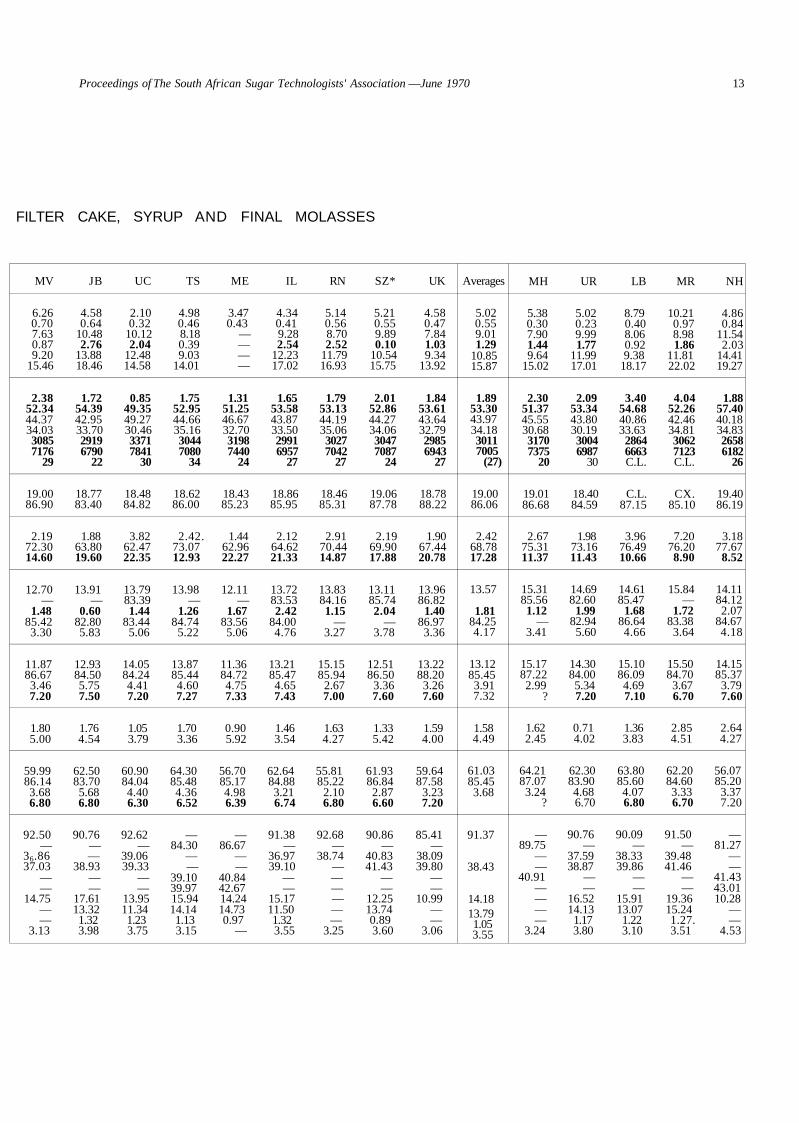
Proceedings of The South African Sugar Technologists' Association —June 1970 13
FILTER CAKE, SYRUP AND FINAL MOLASSES
MV JB UC TS ME IL RN SZ* UK
6.26 4.58 2.10 4.98 3.47 4.34 5.14 5.21 4.58 0.70 0.64 0.32 0.46 0.43 0.41 0.56 0.55 0.47 7.63 10.48 10.12 8.18 — 9.28 8.70 9.89 7.84 0.87 2.76 2.04 0.39 — 2.54 2.52 0.10 1.03 9.20 13.88 12.48 9.03 — 12.23 11.79 10.54 9.34
15.46 18.46 14.58 14.01 — 17.02 16.93 15.75 13.92
2.38 1.72 0.85 1.75 1.31 1.65 1.79 2.01 1.84 52.34 54.39 49.35 52.95 51.25 53.58 53.13 52.86 53.61 44.37 42.95 49.27 44.66 46.67 43.87 44.19 44.27 43.64 34.03 33.70 30.46 35.16 32.70 33.50 35.06 34.06 32.79 3085 2919 3371 3044 3198 2991 3027 3047 2985 7176 6790 7841 7080 7440 6957 7042 7087 6943
29 22 30 34 24 27 27 24 27
19.00 18.77 18.48 18.62 18.43 18.86 18.46 19.06 18.78 86.90 83.40 84.82 86.00 85.23 85.95 85.31 87.78 88.22
2.19 1.88 3.82 2.42. 1.44 2.12 2.91 2.19 1.90 72.30 63.80 62.47 73.07 62.96 64.62 70.44 69.90 67.44 14.60 19.60 22.35 12.93 22.27 21.33 14.87 17.88 20.78
12.70 13.91 13.79 13.98 12.11 13.72 13.83 13.11 13.96 — — 83.39 — — 83.53 84.16 85.74 86.82
1.48 0.60 1.44 1.26 1.67 2.42 1.15 2.04 1.40 85.42 82.80 83.44 84.74 83.56 84.00 — — 86.97 3.30 5.83 5.06 5.22 5.06 4.76 3.27 3.78 3.36
11.87 12.93 14.05 13.87 11.36 13.21 15.15 12.51 13.22 86.67 84.50 84.24 85.44 84.72 85.47 85.94 86.50 88.20 3.46 5.75 4.41 4.60 4.75 4.65 2.67 3.36 3.26 7.20 7.50 7.20 7.27 7.33 7.43 7.00 7.60 7.60
1.80 1.76 1.05 1.70 0.90 1.46 1.63 1.33 1.59 5.00 4.54 3.79 3.36 5.92 3.54 4.27 5.42 4.00
59.99 62.50 60.90 64.30 56.70 62.64 55.81 61.93 59.64 86.14 83.70 84.04 85.48 85.17 84.88 85.22 86.84 87.58 3.68 5.68 4.40 4.36 4.98 3.21 2.10 2.87 3.23 6.80 6.80 6.30 6.52 6.39 6.74 6.80 6.60 7.20
92.50 90.76 92.62 — — 91.38 92.68 90.86 85.41 — — — 84.30 86.67 — — — —
36.86 — 39.06 — — 36.97 38.74 40.83 38.09 37.03 38.93 39.33 — — 39.10 — 41.43 39.80
— — — 39.10 40.84 — — — — — — — 39.97 42.67 — — — —
14.75 17.61 13.95 15.94 14.24 15.17 — 12.25 10.99 — 13.32 11.34 14.14 14.73 11.50 — 13.74 — — 1.32 1.23 1.13 0.97 1.32 — 0.89 —
3.13 3.98 3.75 3.15 — 3.55 3.25 3.60 3.06
Averages
5.02 0.55 9.01 1.29
10.85 15.87
1.89 53.30 43.97 34.18 3011 7005
(27)
19.00 86.06
2.42 68.78 17.28
13.57
1.81 84.25 4.17
13.12 85.45 3.91 7.32
1.58 4.49
61.03 85.45 3.68
91.37
38.43
14.18 13.79 1.05 3.55
MH UR LB MR NH
5.38 5.02 8.79 10.21 4.86 0.30 0.23 0.40 0.97 0.84 7.90 9.99 8.06 8.98 11.54 1.44 1.77 0.92 1.86 2.03 9.64 11.99 9.38 11.81 14.41
15.02 17.01 18.17 22.02 19.27
2.30 2.09 3.40 4.04 1.88 51.37 53.34 54.68 52.26 57.40 45.55 43.80 40.86 42.46 40.18 30.68 30.19 33.63 34.81 34.83 3170 3004 2864 3062 2658 7375 6987 6663 7123 6182
20 30 C.L. C.L. 26
19.01 18.40 C.L. CX. 19.40 86.68 84.59 87.15 85.10 86.19
2.67 1.98 3.96 7.20 3.18 75.31 73.16 76.49 76.20 77.67 11.37 11.43 10.66 8.90 8.52
15.31 14.69 14.61 15.84 14.11 85.56 82.60 85.47 — 84.12 1.12 1.99 1.68 1.72 2.07
— 82.94 86.64 83.38 84.67 3.41 5.60 4.66 3.64 4.18
15.17 14.30 15.10 15.50 14.15 87.22 84.00 86.09 84.70 85.37 2.99 5.34 4.69 3.67 3.79
? 7.20 7.10 6.70 7.60
1.62 0.71 1.36 2.85 2.64 2.45 4.02 3.83 4.51 4.27
64.21 62.30 63.80 62.20 56.07 87.07 83.90 85.60 84.60 85.20 3.24 4.68 4.07 3.33 3.37
? 6.70 6.80 6.70 7.20
— 90.76 90.09 91.50 — 89.75 — — — 81.27
— 37.59 38.33 39.48 — — 38.87 39.86 41.46 —
40.91 — — — 41.43 — — — — 43.01 — 16.52 15.91 19.36 10.28 — 14.13 13.07 15.24 — — 1.17 1.22 1.27. —
3.24 3.80 3.10 3.51 4.53
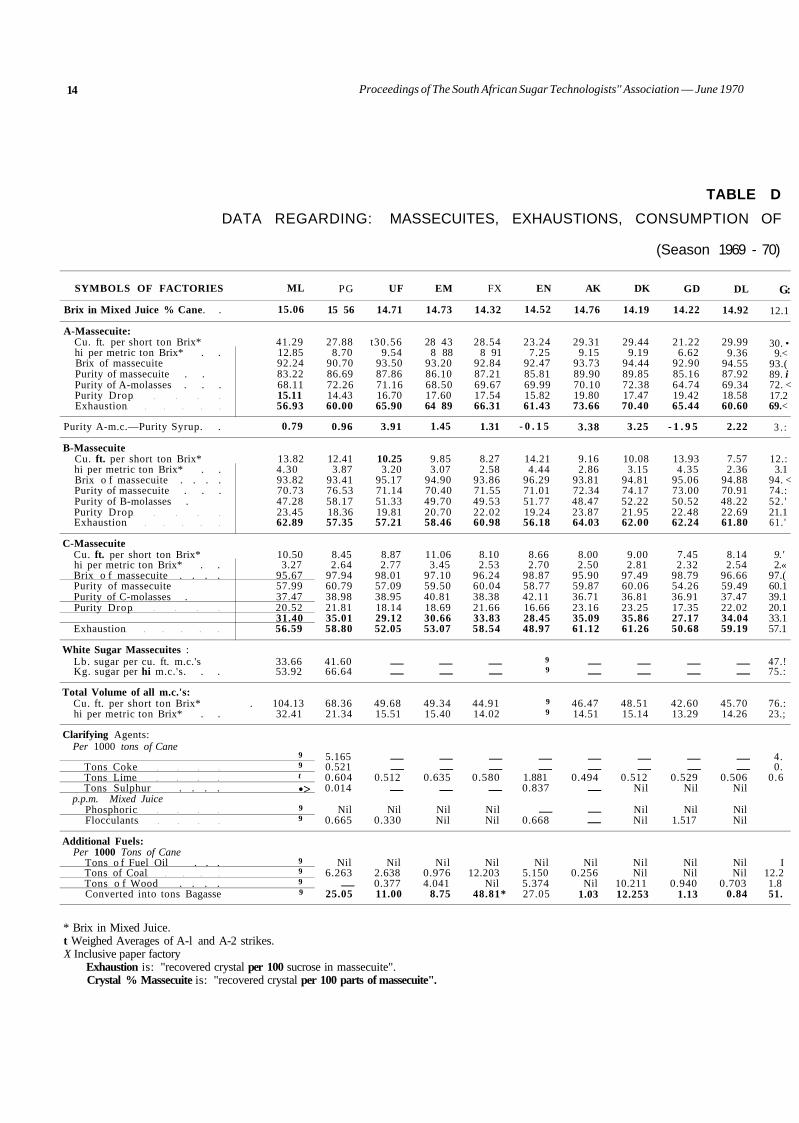
14 Proceedings of The South African Sugar Technologists'' Association — June 1970
TABLE D
DATA REGARDING: MASSECUITES, EXHAUSTIONS, CONSUMPTION OF
(Season 1969 - 70)
SYMBOLS OF FACTORIES
Brix in Mixed Juice % Cane. .
A-Massecuite: Cu. ft. per short ton Brix* hi per metric ton Brix* . . Brix of massecuite Purity of massecuite . . Purity of A-molasses . . . Purity Drop Exhaustion
Purity A-m.c.—Purity Syrup. .
B-Massecuite Cu. ft. per short ton Brix* hi per metric ton Brix* . . Brix o f massecuite . . . . Purity of massecuite . . . Purity of B-molasses . Purity Drop Exhaustion
C-Massecuite Cu. ft. per short ton Brix* hi per metric ton Brix* . . Brix o f massecuite . . . . Purity of massecuite Purity of C-molasses . Purity Drop
Exhaustion
White Sugar Massecuites : Lb. sugar per cu. ft. m.c.'s Kg. sugar per hi m.c.'s. . .
Total Volume of all m.c.'s: Cu. ft. per short ton Brix* hi per metric ton Brix* . .
Clarifying Agents: Per 1000 tons of Cane
Tons Coke Tons Lime Tons Sulphur . . . .
p.p.m. Mixed Juice Phosphoric Flocculants
Additional Fuels: Per 1000 Tons of Cane
Tons o f Fuel Oil . . . Tons of Coal Tons o f Wood . . . . Converted into tons Bagasse
ML
15.06
41.29 12.85 92.24 83.22 68.11 15.11 56.93
0.79
13.82 4.30 93.82 70.73 47.28 23.45 62.89
10.50 3.27
95.67 57.99 37.47 20.52 31.40 56.59
33.66 53.92
. 104.13 32.41
9 9 t
•> 9 9
9 9 9 9
PG
15 56
27.88 8.70
90.70 86.69 72.26 14.43 60.00
0.96
12.41 3.87
93.41 76.53 58.17 18.36 57.35
8.45 2.64
97.94 60.79 38.98 21.81 35.01 58.80
41.60 66.64
68.36 21.34
5.165 0.521 0.604 0.014
Nil 0.665
Nil 6.263
— 25.05
UF
14.71
t30.56 9.54
93.50 87.86 71.16 16.70 65.90
3.91
10.25 3.20
95.17 71.14 51.33 19.81 57.21
8.87 2.77
98.01 57.09 38.95 18.14 29.12 52.05
— —
49.68 15.51
— —
0.512 —
Nil 0.330
Nil 2.638 0.377 11.00
EM
14.73
28 43 8 88
93.20 86.10 68.50 17.60 64 89
1.45
9.85 3.07
94.90 70.40 49.70 20.70 58.46
11.06 3.45
97.10 59.50 40.81 18.69 30.66 53.07
— —
49.34 15.40
— —
0.635 —
Nil Nil
Nil 0.976 4.041
8.75
FX
14.32
28.54 8 91
92.84 87.21 69.67 17.54 66.31
1.31
8.27 2.58
93.86 71.55 49.53 22.02 60.98
8.10 2.53
96.24 60.04 38.38 21.66 33.83 58.54
— —
44.91 14.02
— —
0.580 —
Nil Nil
Nil 12.203
Nil 48.81*
EN
14.52
23.24 7.25
92.47 85.81 69.99 15.82 61.43
- 0 . 1 5
14.21 4.44
96.29 71.01 51.77 19.24 56.18
8.66 2.70
98.87 58.77 42.11 16.66 28.45 48.97
9 9
9 9
— —
1.881 0.837
— 0.668
Nil 5.150 5.374 27.05
AK
14.76
29.31 9.15
93.73 89.90 70.10 19.80 73.66
3.38
9.16 2.86
93.81 72.34 48.47 23.87 64.03
8.00 2.50
95.90 59.87 36.71 23.16 35.09 61.12
— —
46.47 14.51
— —
0.494 —
— —
Nil 0.256
Nil 1.03
DK
14.19
29.44 9.19
94.44 89.85 72.38 17.47 70.40
3.25
10.08 3.15
94.81 74.17 52.22 21.95 62.00
9.00 2.81
97.49 60.06 36.81 23.25 35.86 61.26
— —
48.51 15.14
— —
0.512 Nil
Nil Nil
Nil Nil
10.211 12.253
GD
14.22
21.22 6.62
92.90 85.16 64.74 19.42 65.44
- 1 . 9 5
13.93 4.35
95.06 73.00 50.52 22.48 62.24
7.45 2.32
98.79 54.26 36.91 17.35 27.17 50.68
— —
42.60 13.29
— —
0.529 Nil
Nil 1.517
Nil Nil
0.940 1.13
DL
14.92
29.99 9.36
94.55 87.92 69.34 18.58 60.60
2.22
7.57 2.36
94.88 70.91 48.22 22.69 61.80
8.14 2.54
96.66 59.49 37.47 22.02 34.04 59.19
— —
45.70 14.26
— —
0.506 Nil
Nil Nil
Nil Nil
0.703 0.84
G:
12.1
30. • 9.<
93.( 89. i 72. < 17.2 69.<
3 . :
12.: 3.1
94. < 74.: 52. ' 21.1 61 . '
9.' 2.«
97.( 60.1 39.1 20.1 33.1 57.1
47.! 75.:
76.: 23.;
4. 0.
0.6
I 12.2 1.8 51.
* Brix in Mixed Juice. t Weighed Averages of A-l and A-2 strikes. X Inclusive paper factory
Exhaustion is: "recovered crystal per 100 sucrose in massecuite". Crystal % Massecuite is: "recovered crystal per 100 parts of massecuite".
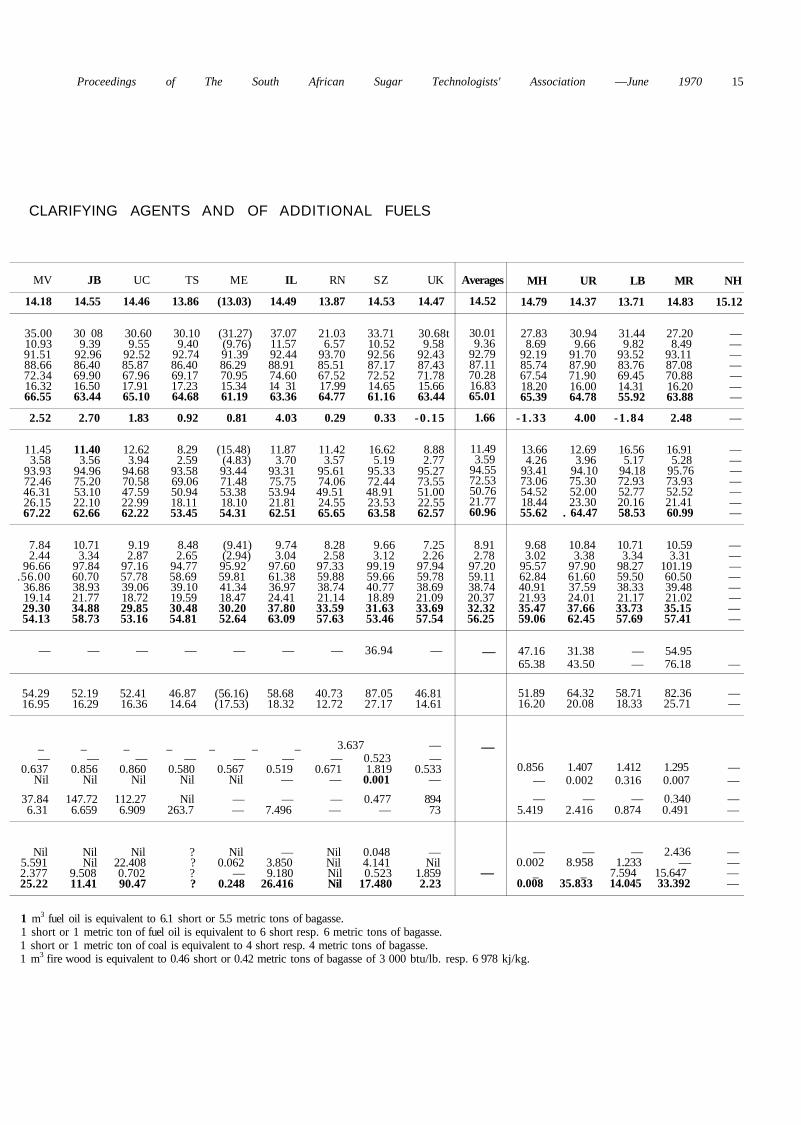
Proceedings of The South African Sugar Technologists' Association —June 1970 15
CLARIFYING AGENTS AND OF ADDITIONAL FUELS
MV JB UC TS ME IL RN SZ UK
14.18 14.55 14.46 13.86 (13.03) 14.49 13.87 14.53 14.47
35.00 30 08 30.60 30.10 (31.27) 37.07 21.03 33.71 30.68t 10.93 9.39 9.55 9.40 (9.76) 11.57 6.57 10.52 9.58 91.51 92.96 92.52 92.74 91.39 92.44 93.70 92.56 92.43 88.66 86.40 85.87 86.40 86.29 88.91 85.51 87.17 87.43 72.34 69.90 67.96 69.17 70.95 74.60 67.52 72.52 71.78 16.32 16.50 17.91 17.23 15.34 14 31 17.99 14.65 15.66 66.55 63.44 65.10 64.68 61.19 63.36 64.77 61.16 63.44
2.52 2.70 1.83 0.92 0.81 4.03 0.29 0.33 -0 .15
11.45 11.40 12.62 8.29 (15.48) 11.87 11.42 16.62 8.88 3.58 3.56 3.94 2.59 (4.83) 3.70 3.57 5.19 2.77
93.93 94.96 94.68 93.58 93.44 93.31 95.61 95.33 95.27 72.46 75.20 70.58 69.06 71.48 75.75 74.06 72.44 73.55 46.31 53.10 47.59 50.94 53.38 53.94 49.51 48.91 51.00 26.15 22.10 22.99 18.11 18.10 21.81 24.55 23.53 22.55 67.22 62.66 62.22 53.45 54.31 62.51 65.65 63.58 62.57
7.84 10.71 9.19 8.48 (9.41) 9.74 8.28 9.66 7.25 2.44 3.34 2.87 2.65 (2.94) 3.04 2.58 3.12 2.26
96.66 97.84 97.16 94.77 95.92 97.60 97.33 99.19 97.94 .56.00 60.70 57.78 58.69 59.81 61.38 59.88 59.66 59.78
36.86 38.93 39.06 39.10 41.34 36.97 38.74 40.77 38.69 19.14 21.77 18.72 19.59 18.47 24.41 21.14 18.89 21.09 29.30 34.88 29.85 30.48 30.20 37.80 33.59 31.63 33.69 54.13 58.73 53.16 54.81 52.64 63.09 57.63 53.46 57.54
— — — — — — — 36.94 —
54.29 52.19 52.41 46.87 (56.16) 58.68 40.73 87.05 46.81 16.95 16.29 16.36 14.64 (17.53) 18.32 12.72 27.17 14.61
_ _ _ _ _ _ _ 3.637 — — — — — — — — 0.523 —
0.637 0.856 0.860 0.580 0.567 0.519 0.671 1.819 0.533 Nil Nil Nil Nil Nil — — 0.001 —
37.84 147.72 112.27 Nil — — — 0.477 894 6.31 6.659 6.909 263.7 — 7.496 — — 73
Nil Nil Nil ? Nil — Nil 0.048 — 5.591 Nil 22.408 ? 0.062 3.850 Nil 4.141 Nil 2.377 9.508 0.702 ? — 9.180 Nil 0.523 1.859 25.22 11.41 90.47 ? 0.248 26.416 Nil 17.480 2.23
Averages
14.52
30.01 9.36
92.79 87.11 70.28 16.83 65.01
1.66
11.49 3.59
94.55 72.53 50.76 21.77 60.96
8.91 2.78
97.20 59.11 38.74 20.37 32.32 56.25
—
—
—
MH UR LB MR NH
14.79 14.37 13.71 14.83 15.12
27.83 30.94 31.44 27.20 — 8.69 9.66 9.82 8.49 —
92.19 91.70 93.52 93.11 — 85.74 87.90 83.76 87.08 — 67.54 71.90 69.45 70.88 — 18.20 16.00 14.31 16.20 — 65.39 64.78 55.92 63.88 —
-1 .33 4.00 -1 .84 2.48 —
13.66 12.69 16.56 16.91 — 4.26 3.96 5.17 5.28 —
93.41 94.10 94.18 95.76 — 73.06 75.30 72.93 73.93 — 54.52 52.00 52.77 52.52 — 18.44 23.30 20.16 21.41 — 55.62 . 64.47 58.53 60.99 —
9.68 10.84 10.71 10.59 — 3.02 3.38 3.34 3.31 —
95.57 97.90 98.27 101.19 — 62.84 61.60 59.50 60.50 — 40.91 37.59 38.33 39.48 — 21.93 24.01 21.17 21.02 — 35.47 37.66 33.73 35.15 — 59.06 62.45 57.69 57.41 —
47.16 31.38 — 54.95 65.38 43.50 — 76.18 —
51.89 64.32 58.71 82.36 — 16.20 20.08 18.33 25.71 —
0.856 1.407 1.412 1.295 — — 0.002 0.316 0.007 —
— — — 0.340 — 5.419 2.416 0.874 0.491 —
— — — 2.436 — 0.002 8.958 1.233 — —
_ _ 7.594 15.647 — 0.008 35.833 14.045 33.392 —
1 m3 fuel oil is equivalent to 6.1 short or 5.5 metric tons of bagasse. 1 short or 1 metric ton of fuel oil is equivalent to 6 short resp. 6 metric tons of bagasse. 1 short or 1 metric ton of coal is equivalent to 4 short resp. 4 metric tons of bagasse. 1 m3 fire wood is equivalent to 0.46 short or 0.42 metric tons of bagasse of 3 000 btu/lb. resp. 6 978 kj/kg.
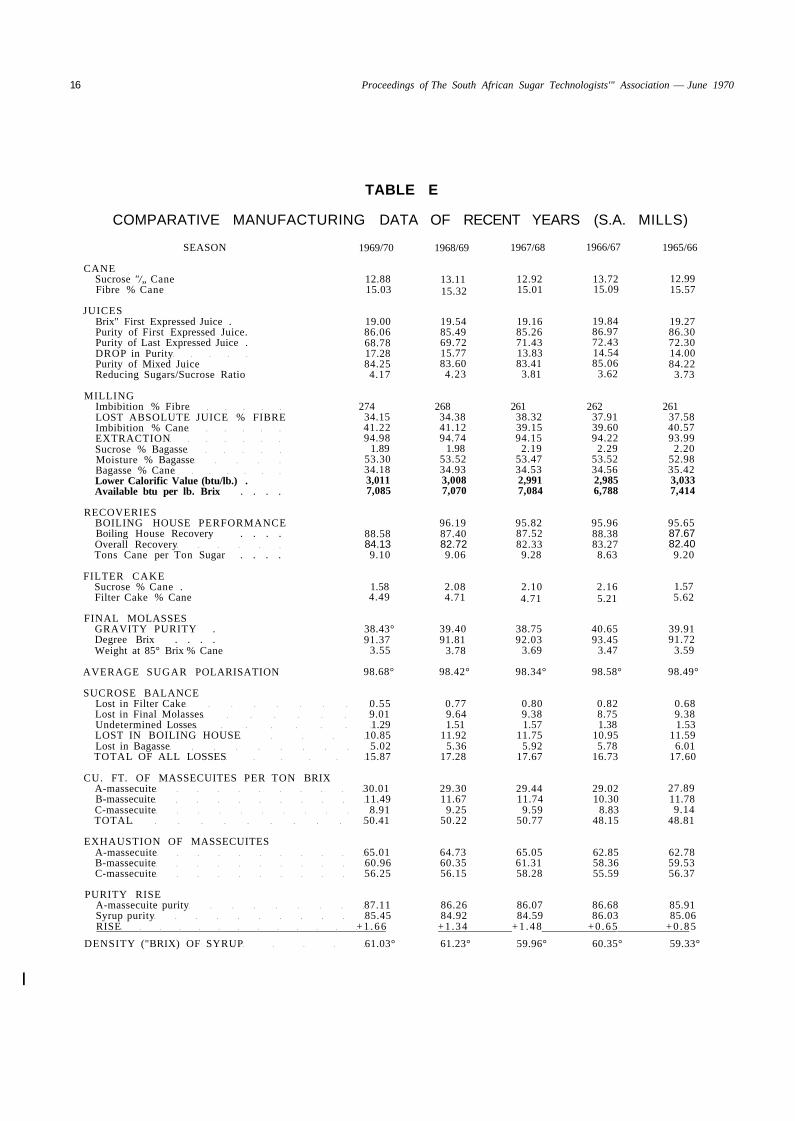
16 Proceedings of The South African Sugar Technologists'" Association — June 1970
TABLE E
COMPARATIVE MANUFACTURING DATA OF RECENT YEARS (S.A.
SEASON
CANE Sucrose "/„ Cane Fibre % Cane
JUICES Brix" First Expressed Juice . Purity of First Expressed Juice. Purity of Last Expressed Juice . DROP in Purity Purity of Mixed Juice Reducing Sugars/Sucrose Ratio
MILLING Imbibition % Fibre LOST ABSOLUTE JUICE % FIBRE Imbibition % Cane EXTRACTION Sucrose % Bagasse Moisture % Bagasse Bagasse % Cane Lower Calorific Value (btu/lb.) . Available btu per lb. Brix . . . .
1969/70
12.88 15.03
1968/69
13.11 15.32
1967/68
12.92 15.01
19.00 86.06 68.78 17.28 84.25 4.17
19.54 85.49 69.72 15.77 83.60 4.23
19.16 85.26 71.43 13.83 83.41
3.81
274 34.15 41.22 94.98
1.89 53.30 34.18 3,011 7,085
268 34.38 41.12 94.74
1.98 53.52 34.93 3,008 7,070
261 38.32 39.15 94.15
2.19 53.47 34.53 2,991 7,084
1966/67
13.72 15.09
19.84 86.97 72.43 14.54 85.06
3.62
262 37.91 39.60 94.22
2.29 53.52 34.56 2,985 6,788
MILLS)
1965/66
12.99 15.57
19.27 86.30 72.30 14.00 84.22
3.73
261 37.58 40.57 93.99
2.20 52.98 35.42 3,033 7,414
RECOVERIES BOILING HOUSE PERFORMANCE Boiling House Recovery . . . . Overall Recovery Tons Cane per Ton Sugar . . . .
FILTER CAKE Sucrose % Cane . Filter Cake % Cane
88.58 84.13 9.10
96.19 87.40 82.72 9.06
95.82 87.52 82.33 9.28
1.58 4.49
2.08 4.71
2.10 4.71
95.96 88.38 83.27 8.63
2.16 5.21
95.65 87.67 82.40 9.20
1.57 5.62
FINAL MOLASSES GRAVITY PURITY . Degree Brix . . . . Weight at 85° Brix % Cane
38.43° 91.37
3.55
39.40 91.81
3.78
38.75 92.03
3.69
40.65 93.45
3.47
39.91 91.72
3.59
AVERAGE SUGAR POLARISATION 98.68° 98.42° 98.34° 98.58° 98.49°
SUCROSE BALANCE Lost in Filter Cake 0.55 0.77 0.80 0.82 0.68 Lost in Final Molasses 9.01 9.64 9.38 8.75 9.38 Undetermined Losses 1.29 1.51 1.57 1.38 1.53 LOST IN BOILING HOUSE 10.85 11.92 11.75 10.95 11.59 Lost in Bagasse 5.02 5.36 5.92 5.78 6.01 TOTAL OF ALL LOSSES 15.87 17.28 17.67 16.73 17.60
CU. FT. OF MASSECUITES PER TON BRIX A-massecuite 30.01 29.30 29.44 29.02 B-massecuite 11.49 11.67 11.74 10.30 C-massecuite 8.91 9.25 9.59 8.83 TOTAL 50.41 50.22 50.77 48.15
EXHAUSTION OF MASSECUITES A-massecuite 65.01 64.73 65.05 62.85 B-massecuite 60.96 60.35 61.31 58.36 C-massecuite 56.25 56.15 58.28 55.59
PURITY RISE A-massecuite purity 87.11 86.26 86.07 86.68 85.91 Syrup purity 85.45 84.92 84.59 86.03 85.06 RISE + 1 . 6 6 +1 .34 +1 .48 +0 .65 + 0 . 8 5
DENSITY ("BRIX) OF SYRUP 61.03° 61.23° 59.96° 60.35° 59.33°
27.89 11.78 9.14
48.81
62.78 59.53 56.37
|
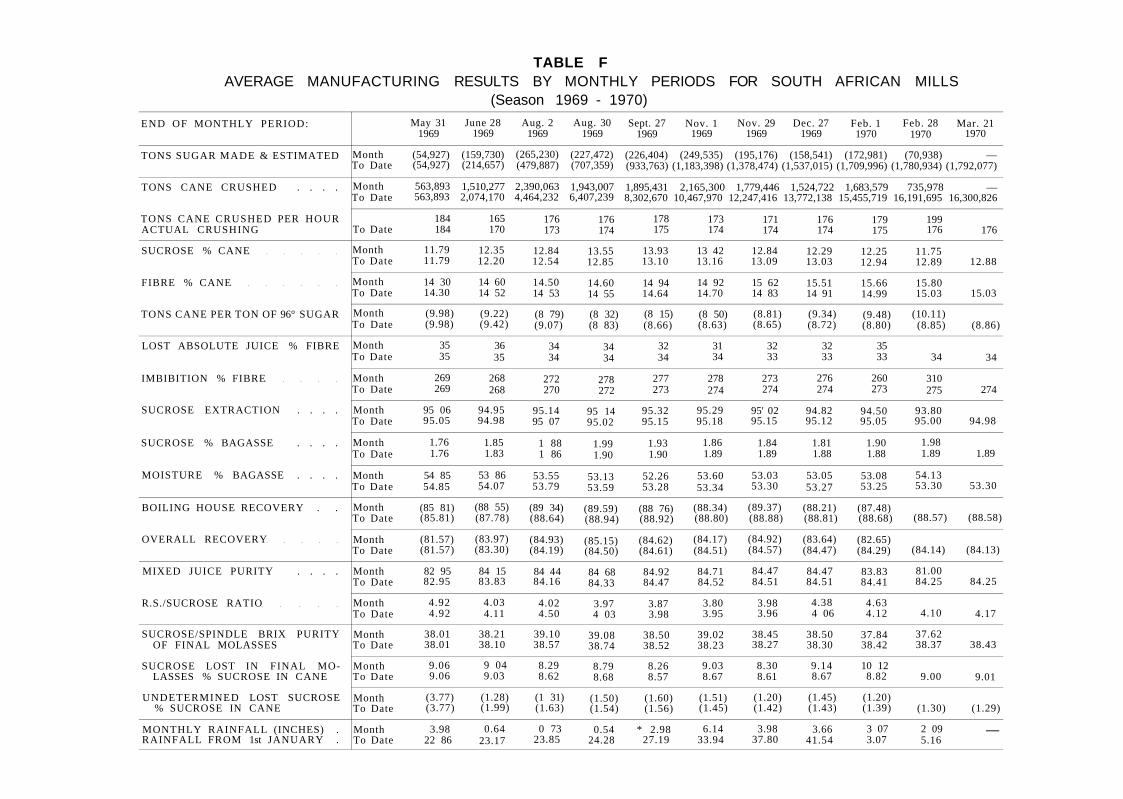
TABLE F AVERAGE MANUFACTURING RESULTS BY MONTHLY PERIODS FOR SOUTH AFRICAN MILLS
(Season 1969 - 1970)
END OF MONTHLY PERIOD:
TONS SUGAR MADE & ESTIMATED
TONS CANE CRUSHED . . . .
TONS CANE CRUSHED PER HOUR ACTUAL CRUSHING
SUCROSE % CANE
FIBRE % CANE
TONS CANE PER TON OF 96° SUGAR
LOST ABSOLUTE JUICE % FIBRE
IMBIBITION % FIBRE
SUCROSE EXTRACTION . . . .
SUCROSE % BAGASSE . . . .
MOISTURE % BAGASSE . . . .
BOILING HOUSE RECOVERY . .
OVERALL RECOVERY
MIXED JUICE PURITY . . . .
R.S./SUCROSE RATIO
SUCROSE/SPINDLE BRIX PURITY OF FINAL MOLASSES
SUCROSE LOST IN FINAL MOLASSES % SUCROSE IN CANE
UNDETERMINED LOST SUCROSE % SUCROSE IN CANE
MONTHLY RAINFALL (INCHES) . RAINFALL FROM 1st JANUARY .
Month To Date
Month To Date
To Date
Month To Date
Month To Date
Month To Date
Month To Date
Month To Date
Month To Date
Month To Date
Month To Date
Month To Date
Month To Date
Month To Date
Month To Date
Month To Date
Month To Date
Month To Date
Month To Date
May 31 1969
(54,927) (54,927)
563,893 563,893
184 184
11.79 11.79
14 30 14.30
(9.98) (9.98)
35 35
269 269
95 06 95.05
1.76 1.76
54 85 54.85
(85 81) (85.81)
(81.57) (81.57)
82 95 82.95
4.92 4.92
38.01 38.01
9.06 9.06
(3.77) (3.77)
3.98 22 86
June 28 1969
(159,730) (214,657)
1,510,277 2,074,170
165 170
12.35 12.20
14 60 14 52
(9.22) (9.42)
36 35
268 268
94.95 94.98
1.85 1.83
53 86 54.07
(88 55) (87.78)
(83.97) (83.30)
84 15 83.83
4.03 4.11
38.21 38.10
9 04 9.03
(1.28) (1.99)
0.64 23.17
Aug. 2 1969
(265,230) (479,887)
2,390,063 4,464,232
176 173
12.84 12.54
14.50 14 53
(8 79) (9.07)
34 34
272 270
95.14 95 07
1 88 1 86
53.55 53.79
(89 34) (88.64)
(84.93) (84.19)
84 44 84.16
4.02 4.50
39.10 38.57
8.29 8.62
(1 31) (1.63)
0 73 23.85
Aug. 30 1969
(227,472) (707,359)
1,943,007 6,407,239
176 174
13.55 12.85
14.60 14 55
(8 32) (8 83)
34 34
278 272
95 14 95.02
1.99 1.90
53.13 53.59
(89.59) (88.94)
(85.15) (84.50)
84 68 84.33
3.97 4 03
39.08 38.74
8.79 8.68
(1.50) (1.54)
0.54 24.28
Sept. 27 1969
Nov. 1 1969
Nov. 29 1969
Dec. 27 1969
Feb. 1 1970
Feb. 28 1970
Mar. 21 1970
(226,404) (249,535) (195,176) (158,541) (172,981) (70,938) — (933,763) (1,183,398) (1,378,474) (1,537,015) (1,709,996) (1,780,934) (1,792,077)
1,895,431 2,165,300 1,779,446 1,524,722 1,683,579 735,978 — 8,302,670 10,467,970 12,247,416 13,772,138 15,455,719 16,191,695 16,300,826
178 175
13.93 13.10
14 94 14.64
(8 15) (8.66)
32 34
277 273
95.32 95.15
1.93 1.90
52.26 53.28
(88 76) (88.92)
(84.62) (84.61)
84.92 84.47
3.87 3.98
38.50 38.52
8.26 8.57
(1.60) (1.56)
* 2.98 27.19
173 174
13 42 13.16
14 92 14.70
(8 50) (8.63)
31 34
278 274
95.29 95.18
1.86 1.89
53.60 53.34
(88.34) (88.80)
(84.17) (84.51)
84.71 84.52
3.80 3.95
39.02 38.23
9.03 8.67
(1.51) (1.45)
6.14 33.94
171 174
12.84 13.09
15 62 14 83
(8.81) (8.65)
32 33
273 274
95' 02 95.15
1.84 1.89
53.03 53.30
(89.37) (88.88)
(84.92) (84.57)
84.47 84.51
3.98 3.96
38.45 38.27
8.30 8.61
(1.20) (1.42)
3.98 37.80
176 174
12.29 13.03
15.51 14 91
(9.34) (8.72)
32 33
276 274
94.82 95.12
1.81 1.88
53.05 53.27
(88.21) (88.81)
(83.64) (84.47)
84.47 84.51
4.38 4 06
38.50 38.30
9.14 8.67
(1.45) (1.43)
3.66 41.54
179 175
12.25 12.94
15.66 14.99
(9.48) (8.80)
35 33
260 273
94.50 95.05
1.90 1.88
53.08 53.25
(87.48) (88.68)
(82.65) (84.29)
83.83 84.41
4.63 4.12
37.84 38.42
10 12 8.82
(1.20) (1.39)
3 07 3.07
199 176
11.75 12.89
15.80 15.03
(10.11) (8.85)
34
310 275
93.80 95.00
1.98 1.89
54.13 53.30
(88.57)
(84.14)
81.00 84.25
4.10
37.62 38.37
9.00
(1.30)
2 09 5.16
176
12.88
15.03
(8.86)
34
274
94.98
1.89
53.30
(88.58)
(84.13)
84.25
4.17
38.43
9.01
(1.29)
—
Proceedings of The South African Sugar Technologists' Association —June 1970
CO Q
rr <
in CM CD
O
CO
< CO
o H rr O Q. LU
rr
O
< a
< or < a. O o
Ove
rall
R
ecov
er
y
Boi
ling
H
ouse
R
ecov
er
y
i
Fin
al
i B
oili
ng
Mol
as-
} H
ouse
se
s P
erfo
r-P
uri
ty
man
ce
Mix
ed J
uice
Red
ucin
g
Sug
ar
Rat
io
Pur
ity
Imb
ibit
ion
per
cent
P
er c
ent
Bag
asse
Fib
re
Can
e M
ois
ture
S
ucro
se
Los
t A
bsol
. Ju
ice
/o
Fib
re
Extr
ac
tion
Can
e/S
ugar
R
atio
P
er c
ent
Can
e
96s
Sug
ar
Tel
Q
uel
Fib
re
Suc
rose
PE
RIO
D
(Sea
son)
75.1
2 8
3.6
7 4
5.3
j
90.6
3
.65
85
.09
I—
NO
©
3.88
•* 00
89
.83
9.64
9.
86
15.7
8 13
.19
Ave
rage
192
5-19
34
. .
81.3
4 8
8.3
6
43
.3
! 95
.4
3.2
2 86
.01
213
oo
<N co
O oo
• n
3.11
ON
00
92
.05
8.
73
8.9
6 15
.30
13.5
3 A
vera
ge 1
935-
44.
0 , t w c T » T i i n o ^ ' - i O m O M ^ i n f > r o n ^ 3 » M
OOOOOOOOOOOOOOOOOOOO
O M N - t TJ-oo n M ^ \ o T f O l r H ^ H v £ l > O ^ O N M O O N O N O N O N O N O N O O O N O N © 0O000OOO0O0O00OO0OON
r tT^OOV- lONONr - ^ fN lON^ f -
o o i o \ o ^ O ' 0 | N D ^ o t s " ' o r ^ O N O N O N O N O N O N O N O N O N O N
M H ^ I H - H Q Q O N O M T N
o o o > n t s - ' - i N ( N ( N ^ o o r o c o O N O O i — i t - H i n O N O O t N
m \ 0 fl1 N N Q t N >0 r n \D ( N o o f ^ a N O N i ^ - O N ( S \ o o o
OOOOOOOOOOOOOOOOOOOO
ON r - o o - < t oo oo >n r * - o - H H f H H H O O - i r t O W r N < N < N C N r N C N C N C N ( N - H
© ( N ^ T - H r - o o o o N r - r - -
i n i n T t - T f - c o f N i n T i - f N © c o c o c o c o c o c o c o c o c o c o
O \ ( N 0 O f O T t N - n n r * N H n T f A O O N t N i n r j - O N
O O O O O H H ^ N N v i i o " r n n m i n v i V T O \ o
r - O N T i - t - - o o f N r , ^ i n i n i n r » r ~ i n o o o o r - ~ i o o o r » r -
f N < N f N c N c N c N < N C N ( N < N
n i o o o o o o f o t N o o r ^ H
O N O O N O N ' — I ON © © •—< "^ c O T j - c o c o - i t f c o T j - T f - f t T - j -
oo r * - T t N T J - m oo o r - o ( N O - * f n a N « n o N O N O T t
n n n n i N M N m t N N O N O N O N O N O N O N O N O N O N O N
o e - ^ o ^ - i CN ON' co r - T | - i n O r t V o n " n o r > . M ( N ^ » 00 OO CO 00 00 CO 00 W OO
o> oo T I * i n oo N oo o ^ Is-r < o o o > n r ^ r o o M n < n o o
OOOOOOOOOOOOOOOOOOOO
O N ^ H O O O N O O S O ' — i r o 0 \ ( N » O \ r H 0 0 t N - H f n O
i o o o " n « n v o i n v o \ 0 ' 0 ^ o
o o - H ( N O N r ^ O N « n r ^ f n T i -N d n o o N O M f n c o o N r n
i n o o r - c o o N © ~ - i r N r O T j -x f ' * , i < t ' ^ - , | 5 j ' » n i n i n i n » n ONONONONONONONONONON
83
.23
89
.46
96.8
40
.7
3.2
9 8
5.9
5 21
0
OO
CO CO
CN en
«n
2.69
oo
o
93
.04
8.36
8.
60
16.0
6 13
.79
Ave
rage
194
5-19
54
. .
o o ^ f N i H t t i n f i r - O M
c o c o ^ c o c o r o ^ C N ' r l - T f OOOOOOOOOOOOOOOOOOOO
H O M ^ O M N O N M O ' O i n r ^ r j - T f T t T i - r - o o v c i o o O O N O O N O N O N O M ^ - O N O N O N O O O N O O O O O O O O O O O O O O
O N T f i r j o o — » o O ' - i o o f N ) — H
r » r - o o r - t - - o o r - - o o r - - r - -ONONONONONONONONONON
N O O N » 0 ' - H p o m « n ^ o ^ - a N
O N O N O O O N O O O N O N O N O N
O O O N O O O f S M l o o O t S o T l - H ^ t i n oo o f n f r n
<n ^ - i n • * «n i n oo n v i «n OOOOOOOOOOOOOOOOOOOO
• * fN -< t r * ' oo o o P I o o o o o o O M N O - r n i n o o i n i n r 4 t N ( N ( N C S c N < N ( N ( N < N
- H N «n ON OO N h - N 0O T f
c N i n ^ c N ^ - N O o O f H a N O N
o o c 4 o o o o o o ^ - i - ^ - r - o o ^
t n i n i n i n i n i n v r n i n i n
' H O i ^ - i n o o O M ^ ' O N ^ t O N O O T t - i n o o o O T t T N f N c o
C N r N c N C N C N C N C J r N r N C N
i n T - H O N m o O O - ^ f i n o
« n < N © r N c o r N o o r - r — r -T J - T J - ^ ^ ' ^ - ' ^ - C O C O C O C O
N r n oo p~ oo « n - H >n oo oo C O O N C O O O O O C O C N ' - H © ! - *
N N f n N f N m t - < f ^ j - r f O N O N O N O N O N O N O N O N O N O N
o o ( N r - O N i T ( - < - ^ o D - M ( N © CNoOoOOOTj-T j -cNONTfrcN OOOOOOOOOOOOOOOOOOOO
- H r - f O O N ^ O T j - r H O O M w - i o o O N © r - - t ^ - , n © o o T j -
O O O O O O O N O O O O O O O N C O O O
T l - ^ - ( 0 0 < N f S < N ( S © © 0 0
r ^ o o n o N O N N t f i i n i n f n
i n i n i n v - j i n m ^ i n i n i n
r - < n - ^ (N oo ON "n C M n o M f n H i H o o o o r ^ ( N « n o N c o c o c o c o c o c o c o c o c o c o
»n oo r - w ON o ^ H < N n - ^ t i n i n i n i n v i o o o o o o o o o o ONONONONONONONONONON
83
.69
89
.58
97
.4
39
.6
3.67
23
5
| 8
5.2
4
m
NO en
52
.78
2.5
1
r~
^
93
.43
8.
46
8.75
15
.49
13.5
3 A
vera
ge 1
955-
1964
.
.
© r - c O f N CI
00 00 00 00 00
r-» oo col © oo oo co i n - ^ i - w-j
r - oo t - - r - oo oo oo o o o o oo
o o © C O C N
i n oo i n oo 1 ON ON ON ON
ON OO OO Tf ^
ON©OOON 00 co -^- co co r o
co CN .— co r -r ^ o o o o N ' H
CO CO CO ^ * ^ -
cN OOI -H © v> f N © - * o o e N
T f i n co co T I * OO 00 00 00 CO
t H ( N - H C O T f oo o o o o oo r-» CN CN CN CN C*
NOOOcN rt fN
© O N ON —< r-i ^ CO CO T t Tt"
00 CN t*- (N © ON i n TJ- co CO
CM CO CO CO CO i n w-i i n i n i n
© O N ON 00 ON CNCN~-<ON 00
CNCNCN—i *H
OO ON CO Tf <S
r - r - oo TT T f CO CO CO CO CO
ON es * n ^ oo ON CN^-i r - ON CO • * Tj- r t - ^ ON ON ON ON ON
t-- © o o co oo ON ^ • © oo oo
OO 00 ON 00 00
© CO 00 OO © CNOOCN © ~-«
ON 00 ON ON ON
r - ON —I (N CO
• n © © c o ©
i n »n i n i n i n
ONCNfN »-H OO ON r - ON - H oo (N co CN co CN
i n o o r * - c o O N oo vo oo oo oo ON ON ON ON ON
Proceedings of The South African Sugar Technologists' Association—June 1970 19
DISCUSSION
Mr. Perk: I try and introduce at least one new item into my report each year.
For example, the nonsucrose ratio was introduced to have a check figure at hand to assess the accuracy of the recorded final molasses weights. Members should remember that in 1952 only ten factories published their final molasses weights and it took seventeen years before all mills had final molasses scales. There were factories which took the total 'tanker weights' as the weight of the produced molasses over the season; the molasses weight being therefore available only once a season. There was another mill which measured the volume of the produced molasses. It was this mill that showed the biggest deviations from the normal nonsucrose ratio. It is not only the nonsucrose ratio which I use as a check on the accuracy of the final molasses weight; the reducing sugars balance, the circulation ratio of final molasses inside the system "C-m.c. pans and centrifugals" also throw a light on the accuracy of the final molasses weights.
Quotations of the Monthly Weather Report were this year omitted as other papers deal with this subject more thoroughly. The results of the weather on the ripening of the cane is shown in a number of tables where "sucrose content of the cane by months" and "purity of the mixed juice by months" are compared with average values for these properties.
As far as the South African cane belt is concerned, the 1969/70 season started with a very low sucrose content of the cane and during the whole season the sucrose content stayed below the forty-one year averages. The mixed juice purity started at a normal value but did not improve during the course of the season.
Table 4 shows how much lower the average juice purity and the average sucrose content of the cane harvested during the last ten optimum periods were than the corresponding values of the previous decade. It is particularly the lower juice purities which affect the boiling house most, by reducing recovery, increasing sugar losses and steam consumption, and overloading the backend of the factory.
Marromeu's mixed juice showed a purity of 88.88° in September 1969. Luabo's maximum sucrose content of 15.57%, though high according to South African standards, is still below the mean value of 15.98% for the October month.
The mixed juice purities and the sucrose contents of the cane harvested by Mhlume and Big Bend do not differ much from the values obtained in other years.
With regard to the time account and length of seasons, the introduction of the seven-day week or the week of 168 hours available time brings to the fore how much
time could be won if the weekend stop could be reduced in length. In the last season the average time lost by weekend stops was twenty-one hours per week; the highest loss being twenty-nine hours, the smallest loss four hours per week, i.e. eight hours per milling tandem in alternative weeks.
In a chapter on refractometric and hydrometric brix determination it is pointed out that the refractometric brix, although it gives a closer approach to the actual dry matter content of the product, cannot replace the spindle brix in all cases as the refracto brix is not directly related to the specific gravity of the product.
A new factory performance indicator has been introduced. The part which is really new is the use of the "corrected milling loss according to Follet-Smith" as a yardstick for the performance of the extraction plant, the plant being either a diffuser or a milling train.
Subtracting the corrected milling loss from 100% gives us the whole reduced extraction according to Mittal i.e. the extraction which might have been expected had cane of 13J% fibre and 1 3 | % sucrose been milled.
Multiplying the whole reduced extraction with reduced boiling house recovery, E.S.G. leads to an overall recovery which would have been achieved had the purity of the mixed juice been 85°, in addition to 13|-% fibre and 13 |% sucrose in the cane; the result being indicated as "crystal".
N.B.: For the calculation of the crystal content of the sugar the Winter Formula with a factor of 0.4 is used. Java used for the calculation of the crystal content of a sugar the Winter Formula with a factor 0.5 after converting the pol of the sugar into sucrose content. (Addition of 0.3° for the difference in temperature during polarisation). South Africa is going to use a factor of 0.661 in the formula: S - y - times (B - S) = crystal percentage.
The nonsucrose ratio based on mixed juice appeared to indicate that diffusion factories produced more molasses from their nonsucrose introduced with the mixed juice than did the pure milling factories. However, as about 40% of the mixed juice of a diffusion factory has passed a purification process inside the diffuser, mixed juice of a pure milling factory cannot be compared with that of a diffusion factory. This is apparent when we compare the quantities of filter cake produced by the one and by the other.
For a better basis of comparision, we introduced in 1969 "the nonsucrose ratio based on clarified juice analysis". This change-over eliminated the indication that diffusion factories made more final molasses from their nonsucrose introduced with the juice than did pure milling factories.
However, it still leaves the question unresolved as to whether the diffuser (under similar conditions) extracts more impurities than the milling tandem.

20 Proceedings of The South African Sugar Technologists'' Association—June 1970
The abnormal figures encountered in the Reducing Sugars Balance are attributed more to mistakes made when analysing the products for reducing sugars content than to abnormal inversion or abnormal destruction of reducing sugars.
I refer now to the Sucrose, Brix and Nonsucrose balances and the Ratio or Purity of the Undetermined Losses.
As all these balances are based on the clarified juice analysis no discrimination has been made between diffusion and milling factories. However, as some factories apply the refractometer when analysing the boiling house products and others the hydrometer, the results had to be divided into two groups i.e. factories using the refractometer and those determining their brix with the spindle.
Attention is drawn to the three factories which publish the results only of their rawhouse departments and not of the complete combination of refinery and rawhouse departments. They all show very low undetermined sucrose and brix losses. In such cases small inaccuracies in both losses will lead to abnormal figures for the non-sucroses losses and for the ratio (or purity) of the undetermined losses. For example, Sezela shows a negative nonsucrose loss and Pongola a too low purity of the losses.
A note under Table 16 tells us that the average of the diffusion factories does not include Nchalo because there is doubt about the correctness of the final molasses weight. This remark was based on the results shown in Table 18 i.e. a negative brix loss, a negative nonsucrose loss and a negative figure for the purity of the undetermined losses. This is an example how other properties in addition to the nonsucrose ratio can pinpoint an incorrect final molasses weight. •
As regards the quantity (volume) of C-Massecuite, Table 19 deals with the cu ft of C-m.c. as recorded per ton of nonsucrose in mixed juice. As this table deals with diffusion and pure milling factories it would have been better if the volume of massecuite had been based on the quantity of nonsucrose in clarified juice.
Mr. Jennings: The cane/sugar ratios in South Africa over the years compare unfavourably with the figures
achieved in Australia. In Australia the figure has been below 7.0 whereas we are fortunate if we record a figure of 8.5.
Mr. Perk mentions one avenue of investigation we should pursue to reduce the cane/sugar ratio, namely, deterioration of cane after harvesting.
An aspect which has not been covered is planned harvesting of cane — programmed ripening trials.
Mr. Perk: The emphasis in South Africa has always been on tons cane per acre, and not on tons of available sugar per acre which is of course the really important figure.
As regards metrication, I note that rainfall is being reported in millimetres to two decimal places, an accuracy which I do not think can be achieved.
Mr. Jennings: Mr. Perk has refered to accuracy of reporting. Dr. Parker of Tate & Lyle recently mentioned that the most accurate buffer solution obtainable has a standard error of 0.045 pH and yet we find people who insist on reporting pH to two places of decimals.
Mr. Allan: The Time Account of factories makes interesting reading. The figures for UF are 88.88% for crushing hours per cent available hours. Another factory goes as low as 68.09 %.
Half the factories keep to the average of 76 % but those below this should look into the reasons for the time lost.
Mr. van Hengel: We have a factory with two tandems and when we stop a tandem for maintenance we record this as hours of stoppage.
Does U F do the same ?
Mr. Perk: UF shuts down each tandem on alternative week-ends but does not record this period in hours of stoppage.
I merely produce the figures declared by the factories — I cannot vouch for their accuracy.
Mr. van Hengel: In that case the figures can be highly misleading.
Mr. Alexander: (in the chair) 1 wish to thank Mr. Perk for this his last paper on the summary of laboratory reports.
We shall sorely miss his reports at future meetings.
HAYNEftSIBSON lOBNJ — 28617
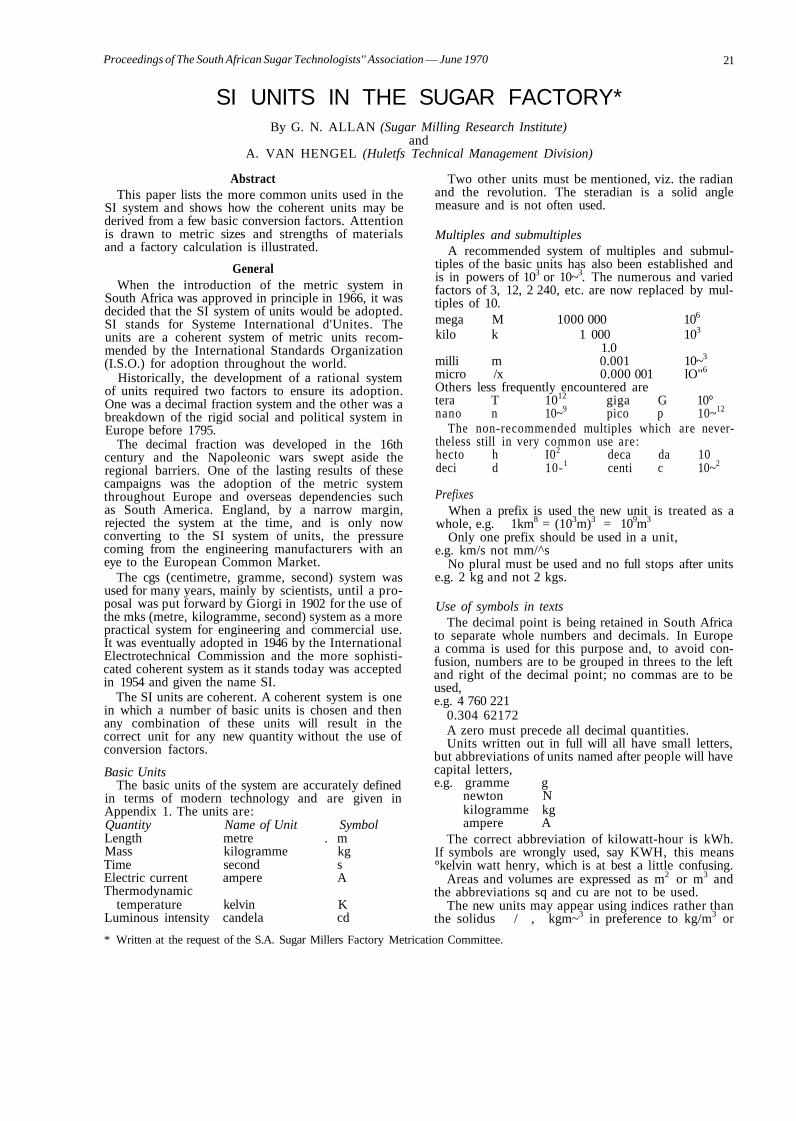
Proceedings of The South African Sugar Technologists'' Association — June 1970 21
SI UNITS IN THE SUGAR FACTORY* By G. N. ALLAN (Sugar Milling Research Institute)
and A. VAN HENGEL (Huletfs Technical Management Division)
Abstract This paper lists the more common units used in the
SI system and shows how the coherent units may be derived from a few basic conversion factors. Attention is drawn to metric sizes and strengths of materials and a factory calculation is illustrated.
General When the introduction of the metric system in
South Africa was approved in principle in 1966, it was decided that the SI system of units would be adopted. SI stands for Systeme International d'Unites. The units are a coherent system of metric units recommended by the International Standards Organization (I.S.O.) for adoption throughout the world.
Historically, the development of a rational system of units required two factors to ensure its adoption. One was a decimal fraction system and the other was a breakdown of the rigid social and political system in Europe before 1795.
The decimal fraction was developed in the 16th century and the Napoleonic wars swept aside the regional barriers. One of the lasting results of these campaigns was the adoption of the metric system throughout Europe and overseas dependencies such as South America. England, by a narrow margin, rejected the system at the time, and is only now converting to the SI system of units, the pressure coming from the engineering manufacturers with an eye to the European Common Market.
The cgs (centimetre, gramme, second) system was used for many years, mainly by scientists, until a proposal was put forward by Giorgi in 1902 for the use of the mks (metre, kilogramme, second) system as a more practical system for engineering and commercial use. It was eventually adopted in 1946 by the International Electrotechnical Commission and the more sophisticated coherent system as it stands today was accepted in 1954 and given the name SI.
The SI units are coherent. A coherent system is one in which a number of basic units is chosen and then any combination of these units will result in the correct unit for any new quantity without the use of conversion factors.
Basic Units The basic units of the system are accurately defined
in terms of modern technology and are given in Appendix 1. The units are: Quantity Name of Unit Symbol Length metre . m Mass kilogramme kg Time second s Electric current ampere A Thermodynamic
temperature kelvin K Luminous intensity candela cd
Two other units must be mentioned, viz. the radian and the revolution. The steradian is a solid angle measure and is not often used.
Multiples and submultiples A recommended system of multiples and submul
tiples of the basic units has also been established and is in powers of 103 or 10~3. The numerous and varied factors of 3, 12, 2 240, etc. are now replaced by multiples of 10. mega M 1000 000 106
kilo k 1 000 103
1.0 milli m 0.001 10~3
micro /x 0.000 001 lO"6
Others less frequently encountered are tera T 1012 giga G 10° nano n 10~9 pico p 10~12
The non-recommended multiples which are nevertheless still in very common use are: hecto h I02 deca da 10 deci d 10-1 centi c 10~2
Prefixes When a prefix is used the new unit is treated as a
whole, e.g. 1km8 = (103m)3 = 109m3
Only one prefix should be used in a unit, e.g. km/s not mm/^s
No plural must be used and no full stops after units e.g. 2 kg and not 2 kgs.
Use of symbols in texts The decimal point is being retained in South Africa
to separate whole numbers and decimals. In Europe a comma is used for this purpose and, to avoid confusion, numbers are to be grouped in threes to the left and right of the decimal point; no commas are to be used, e.g. 4 760 221
0.304 62172 A zero must precede all decimal quantities. Units written out in full will all have small letters,
but abbreviations of units named after people will have capital letters, e.g. gramme g
newton N kilogramme kg ampere A
The correct abbreviation of kilowatt-hour is kWh. If symbols are wrongly used, say KWH, this means °kelvin watt henry, which is at best a little confusing.
Areas and volumes are expressed as m2 or m3 and the abbreviations sq and cu are not to be used.
The new units may appear using indices rather than the solidus / , kgm~3 in preference to kg/m3 or
* Written at the request of the S.A. Sugar Millers Factory Metrication Committee.
22 Proceedings of The South African Sugar Technologists' Association — June 1970
kJ s^1 rrr2 K"1 rather than the older form of Btu/ (hr. sq. ft. °F). As Js~ l = W, by definition the SI unit of heat transfer rate is Wrrr2 K -1.
Basic SI units Length m
The metre was originally proposed as j X 10~7
of the meridian through Paris and a metal bar was made to this length and accepted as the standard metre in 1875. The metre is now redefined in terms of atomic radiationcorresponding to the length of thisbar.
In small work and in engineering drawing practice the millimetre is to be used and for surface texture the micrometre would be appropriate.
The centimetre is not a recommended unit and the kilometre will be used for lengths where the mile is now commonly used. lm = 39.37 in 1 in = 25.4 mm 0.001 in = 25.4/xm 1 mile = 1.609 3 km
Mass kg The kilogramme is the mass of a standard platinum
cylinder, and is the unit of mass which should be used generally. For very large masses the metric ton which is equal to 1 000 kg will be used and for very small masses the gramme and milligramme are the appropriate units. 1 metric ton = 1 000 kg = 2 204.6 lb 1 oz = 28.35 g 1 lb = 0.453 592 kg
Time s The second should be used wherever possible in
calculations and occurs in units involving velocity, power, heat flow rates, etc. The use of the hour and minute will of course continue to be used, but the use of the second in mechanics and thermodynamics as mentioned above immediately simplifies calculations. Road speeds will be given in km/h. The use of the symbol h in hour is in itself confusing as h also stands for hecto = 102.
Temperature K or °C The fundamental scale of temperature is the kelvin
scale in which O K is taken as absolute zero and the triple point of water at 273.16 K.
The temperature intervals of this scale are equal to the Celsius scale which sets 0°C for the freezing point of water (273.15K) and 100°C for the boiling point (373.15K) under normal atmospheric conditions. This Celsius scale is well known even in non-metric countries and will be used in all general references to temperature.
The term centigrade is used in infrequent angular measurement of a 400° circle and must not be used in connection with temperatures.
5 K = - ( °F + 459.67)
9 °R = (°F + 459.67) degrees Rankine K = (°C + 273.15)
5 °C = - (°F - 32)
9
Some sources distinguish between actual temperature and temperature difference by the terms °C and deg C, but this has not been recommended by ISO and therefore not be used.
Electric current A The ampere is defined as a current which would pro
duce in two infinitely long parallel conductors of neglible cross section placed 1 m apart in vacuo, a force of 2 x 10~7 newton.
Giorgi recognised the need of a fundamental electrical quantity with his system of mechanical units in 1902 and suggested the ohm as it was then the most accurate unit available, being measured in terms of a mercury column. The present unit (adopted in 1946) avoids dependence on physical properties.
Luminous Intensity cd Luminous intensity has the unit candela and is the
luminous flux per unit solid angle. Luminous flux is a measure of radiant energy which is capable of producing visual stimulus, and is in part a physiological quantity. The value of the candela is such that the brilliance of total radiation at the temperature of solidification of platinum is 60 candela per square centimetre.
Named units of the SI Refer to fig. 1
Force N Force = mass x acceleration and its unit, the newton
is that force which when applied to a mass of 1 kilogramme will produce an acceleration of 1 metre per second per second. I N = 1 kg x 1 ms-2
= 1 kgms-2
This is of course an absolute unit and no gravitational factor is involved. 1 dyne = lg x 1 cms -2
109 dyne = 1 J m = 1 Nm2
1 erg = 1 dyne x 1 cm 107 ergs = 107 dyne x 10-2m 1 joule = 107 dyne x 10_2m 1 Nm = 107 dyne x 10-2m IN = 105 dyne 1 N = 7.223 poundal. Now that the newton has been defined let us clearly differentiate between mass and weight. Weight is a force with which a mass is attracted to a centre of gravity. A one kilogramme mass (a quantity of matter) remains the same even if measured on the moon. The weight of this mass on a lunar expedition could vary from the gravitational attraction of earth, to weightlessness, to the gravitational attraction of the moon. The weight (or force of attraction) of 1 kilogramme mass on earth is 9.806 newton, on the moon its weight would be about 1.6 newton.
F = mass x acceleration = 1 kg x 9.806 ms-2
= 9.806 kgms-2
= 9.806 N
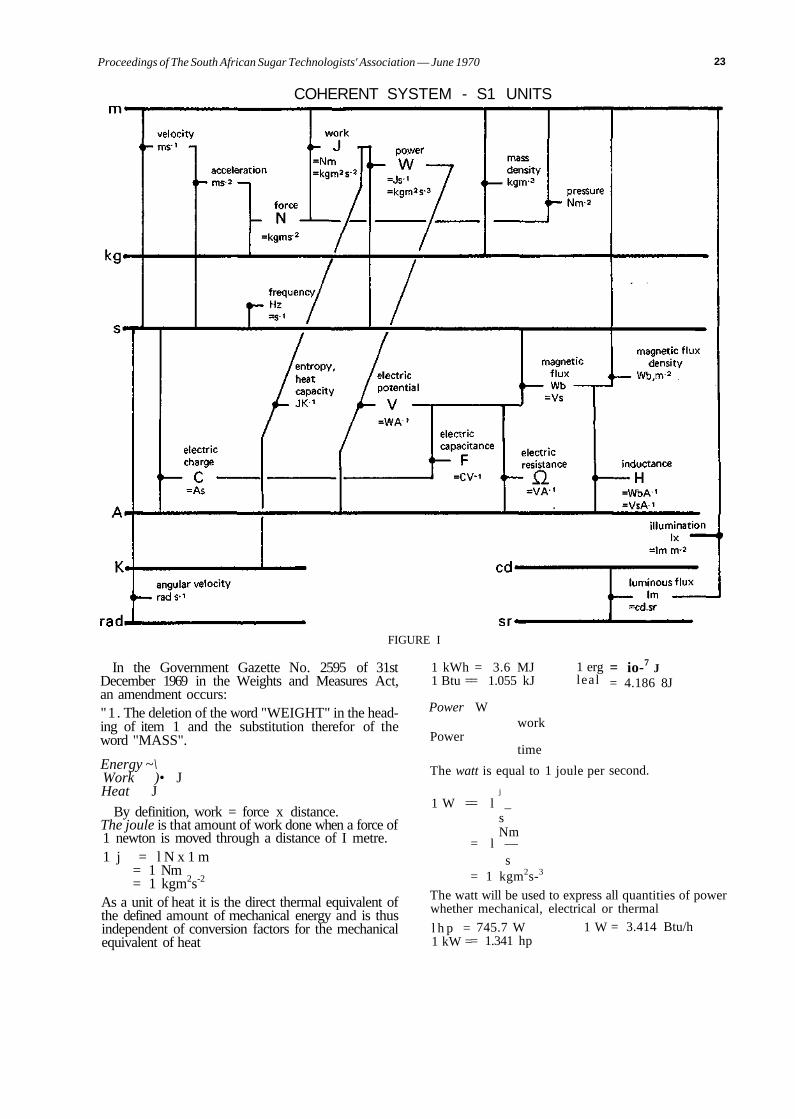
Proceedings of The South African Sugar Technologists' Association — June 1970
COHERENT SYSTEM - S1 UNITS
23
FIGURE I
In the Government Gazette No. 2595 of 31st December 1969 in the Weights and Measures Act, an amendment occurs: "1 . The deletion of the word "WEIGHT" in the heading of item 1 and the substitution therefor of the word "MASS".
Energy ~\ Work )• J Heat J
By definition, work = force x distance. The joule is that amount of work done when a force of 1 newton is moved through a distance of I metre. 1 j = l N x 1 m
= 1 Nm = 1 kgm2s-2
As a unit of heat it is the direct thermal equivalent of the defined amount of mechanical energy and is thus independent of conversion factors for the mechanical equivalent of heat
1 kWh 1 Btu =
Power
Power
= 3.6 MJ = 1.055 kJ
W work
time
1 erg leal
The watt is equal to 1 joule per
1 W = j
= l _ s Nm
= l — s
= 1 kgm2s-3
= io-7 J = 4.186 8J
second.
The watt will be used to express all quantities of power whether mechanical, electrical or thermal
l h p = 1 kW =
745.7 W = 1.341 hp
1 W = 3.414 Btu/h
24 Proceedings of The South African Sugar Technologists' Association — June 1970
Electric Potential V The volt is specified as WA~'
WA l = J A - ' s - 1
----- kg m2A 's :t
For practical use the volt remains identical to what it was, only the definition has changed.
Units not named Pressure Nm a (pascal)
Pressure, which is defined as force per unit area, is measured in newtons per square metre ( N m 2 ) . The value of 1 Nm 2 is too small for practical purposes ( I N m * (). 145038 X 10 ;' Ibf/sq in)and IhekN/m^ and MNm 2 are more acceptable (0.145 and 145 lbf/ sq in respectively). There is, however, merit in a unit which is at roughly atmospheric pressure and for this reason the unit bar has been selected (I bar — 10° Nm " 14.503 8 Ibf/sq in) even though this is not a recognised multiple in the SI system. The submultiple is the millibar.
An "atmosphere" in physics is defined as an air pressure which is in equilibrium with a mercury column of 760 mm. Mercury with a specilic gravity of 13.6 will then exert a pressure of 13.6 x 76 • 1033.6 gfcnr2
I.033 6kgfcm 2
In the past the technical atmosphere was taken as 1 kgfcm "* The bar is defined as 105 N m ' 2
105
= — N cm - 2
10* = lONcm-2
1 On earth one newton is—-— part of a kg weight and
9.806 hence 10 Ncmr2 = 1.0198 kgfcm-2, likewise it can now easily be shown that
1 bar = 1 000 millibar -= 1.019 8
1.033 6 = 0.986 6 "atmosphere'"
and 1 atmosphere = 1 000 = 1 013.6 mbarapprox..
0.986 6
Heat Units There seems to be more mystery than necessary
around the heat unit of the new SI metric system. Here follow a number of ways to convert the Btu
into kilojoules (k.I). lBtu 1 lb X 1"F
0.453 6 kg X 0.555 6nC = 0.252 kcal (not used any longer)
I kcal -•-•••• 426.9 kgf.in (Joule's heat equivalent). .-. 1 Btu -- Alb.9 X 0.252 = 107.58 kgf.m
To check: 1 kgf.m - I kgf x 1 m
- 2.205 lbf X 3.280 84 ft =••= 7.233 ft. lbf
.-. 1 Btu = 7.233 X 107.58 = 778.2 ft lbf (Joule's heat equivalent).
Obviously, whether we go from the kcal or the Btu, we find that:
1 Btu = 107.58 kf.m
The kg force is not used any more and the kg mass takes its place. Now as the average acceleration of the gravity force = 9.81 ms -2
I kgf = 9.81 Newton .-. 1 Btu = 9.81 X 107.58 = 1055.1 Nm
By definition we know that 1 Nm = 1 joule (J) or I Btu = 1 055 J
= 1.055 kJ
Identically:
1 kcal = 1
= 3.968 Btu 0.251
1 kcal = 3.968 X 1.055 = 4.187 kJ
The factor Btu/lb can now easily be converted in kJ/kg
1.055 kJ Btu/lb =
0.453 kg = 2.33 kJ kg-1
Another approach would be: lkWh
3 412 Btu 1 Btu
= 3 412 Btu = 3 600 kWs = 3 600kJ = 3 600 kJ = 1.055 kJ
Specific entropy in kJ kg - 1 K_1 can be calculated as follows:
Btu 1.055 kJ
lb X °R 0.453 kg X 0.555 K = 4 .187kJkg- 1 K- 1
Also the conversion for the heat transfer coefficient is easy:
1 Btu/(sq ft°Fhr) 1.055 kJ
0.304 82m2 X 0.555 °C X hr
= 20.44 kJm- '^C-^- 1
= 0.005 67kJm-2 OC-1s-1
= 5.678 Wm-2 0C~ l
= 5.678 Wm-^K-1
Summary of units commonly used in thermodynamics are given below:
Imperial Units SI Units Quantity of heat Btu X 1.055 = kJ Heat flow rate Btu/hr X0.293 = W Specific enthalpy Btu/lb X2.326 = kJkg-1
Specific heat Btu/(lb°F)x4.187 = kJ kg-^C" 1
Specific entropy Btu/(lb°R)x4.187 = kJ k g - 1 ^ 1
Coefficient of heat transfer Btu/(ft2°Fhr)
X 5.678 = Wm-^C- 1
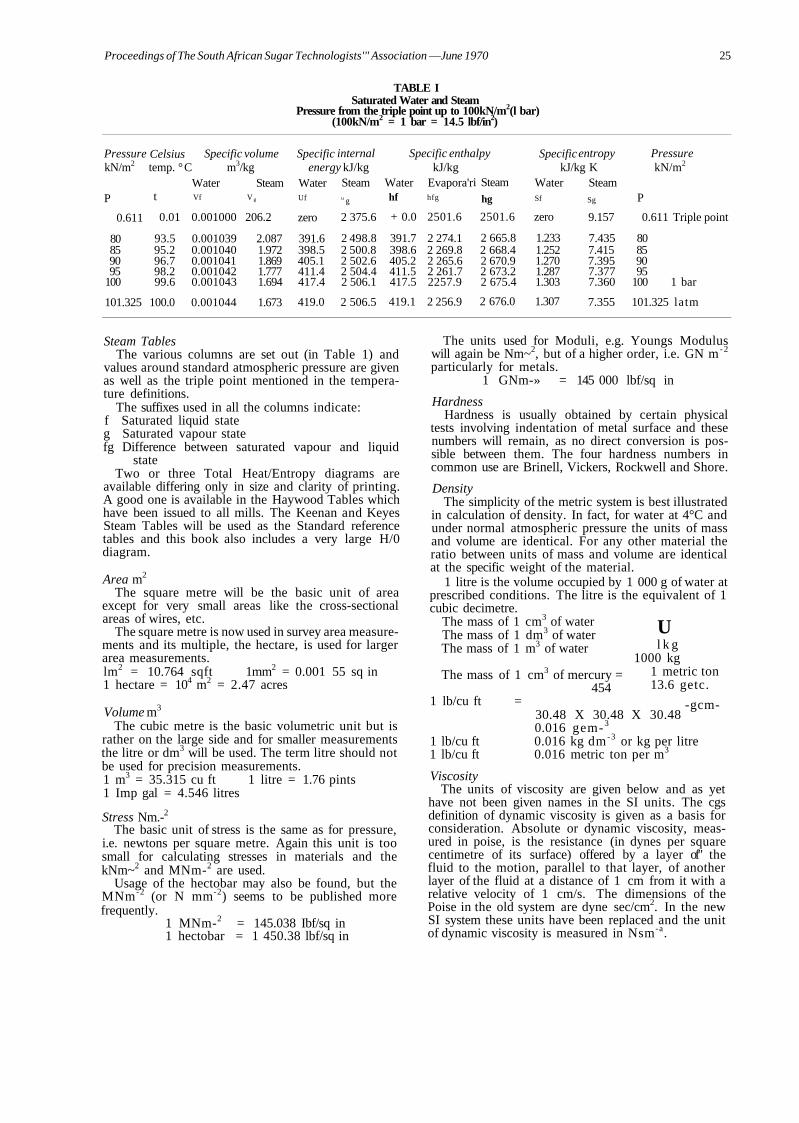
Proceedings of The South African Sugar Technologists'" Association —June 1970 25
TABLE I Saturated Water and Steam
Pressure from the triple point up to 100kN/m2(l bar) (100kN/m2 = 1 bar = 14.5 lbf/in2)
Pressure kN/m2
P
0.611
80 85 90 95
100
101.325
Celsius temp. °
t
0.01
93.5 95.2 96.7 98.2 99.6
100.0
Specific volume C m3/kg
Water Steam Vf V g
0.001000 206.2
0.001039 2.087 0.001040 1.972 0.001041 1.869 0.001042 1.777 0.001043 1.694
0.001044 1.673
Specific internal energy kJ/kg
Water Uf
zero
391.6 398.5 405.1 411.4 417.4
419.0
Steam u g
2 375.6
2 498.8 2 500.8 2 502.6 2 504.4 2 506.1
2 506.5
Specific enthalpy
Water hf
+ 0.0
391.7 398.6 405.2 411.5 417.5
419.1
kJ/kg Evapora'r hfg
2501.6
2 274.1 2 269.8 2 265.6 2 261.7 2257.9
2 256.9
i Steam hg
2501.6
2 665.8 2 668.4 2 670.9 2 673.2 2 675.4
2 676.0
Specific entropy kJ/kg K
Water Sf
zero
1.233 1.252 1.270 1.287 1.303
1.307
Steam Sg
9.157
7.435 7.415 7.395 7.377 7.360
7.355
Pressure kN/m2
P
0.611 Triple point
80 85 90 95
100 1 bar
101.325 latm
Steam Tables The various columns are set out (in Table 1) and
values around standard atmospheric pressure are given as well as the triple point mentioned in the temperature definitions.
The suffixes used in all the columns indicate: f Saturated liquid state g Saturated vapour state fg Difference between saturated vapour and liquid
state Two or three Total Heat/Entropy diagrams are
available differing only in size and clarity of printing. A good one is available in the Haywood Tables which have been issued to all mills. The Keenan and Keyes Steam Tables will be used as the Standard reference tables and this book also includes a very large H/0 diagram.
Area m2
The square metre will be the basic unit of area except for very small areas like the cross-sectional areas of wires, etc.
The square metre is now used in survey area measurements and its multiple, the hectare, is used for larger area measurements. lm2 = 10.764 sqft 1mm2 = 0.001 55 sq in 1 hectare = 104 m2 = 2.47 acres
Volume m3
The cubic metre is the basic volumetric unit but is rather on the large side and for smaller measurements the litre or dm3 will be used. The term litre should not be used for precision measurements. 1 m3 = 35.315 cu ft 1 litre = 1.76 pints 1 Imp gal = 4.546 litres
Stress Nm.-2
The basic unit of stress is the same as for pressure, i.e. newtons per square metre. Again this unit is too small for calculating stresses in materials and the kNm~2 and MNm-2 are used.
Usage of the hectobar may also be found, but the MNm -2 (or N mm-2) seems to be published more frequently.
1 MNm-2 = 145.038 Ibf/sq in 1 hectobar = 1 450.38 lbf/sq in
The units used for Moduli, e.g. Youngs Modulus will again be Nm~2, but of a higher order, i.e. GN m - 2
particularly for metals. 1 GNm-» = 145 000 lbf/sq in
Hardness Hardness is usually obtained by certain physical
tests involving indentation of metal surface and these numbers will remain, as no direct conversion is possible between them. The four hardness numbers in common use are Brinell, Vickers, Rockwell and Shore.
Density The simplicity of the metric system is best illustrated
in calculation of density. In fact, for water at 4°C and under normal atmospheric pressure the units of mass and volume are identical. For any other material the ratio between units of mass and volume are identical at the specific weight of the material.
1 litre is the volume occupied by 1 000 g of water at prescribed conditions. The litre is the equivalent of 1 cubic decimetre.
The mass of 1 cm3 of water The mass of 1 dm3 of water The mass of 1 m3 of water
The mass of 1 cm3 of mercury = 454
1 lb/cu ft =
U l k g
1000 kg 1 metric ton 13.6 getc.
-gcm-
1 lb/cu ft 1 lb/cu ft
30.48 X 30.48 X 30.48 0.016 gem-3
0.016 kg dm - 3 or kg per litre 0.016 metric ton per m3
Viscosity The units of viscosity are given below and as yet
have not been given names in the SI units. The cgs definition of dynamic viscosity is given as a basis for consideration. Absolute or dynamic viscosity, measured in poise, is the resistance (in dynes per square centimetre of its surface) offered by a layer of" the fluid to the motion, parallel to that layer, of another layer of the fluid at a distance of 1 cm from it with a relative velocity of 1 cm/s. The dimensions of the Poise in the old system are dyne sec/cm2. In the new SI system these units have been replaced and the unit of dynamic viscosity is measured in Nsm-a.
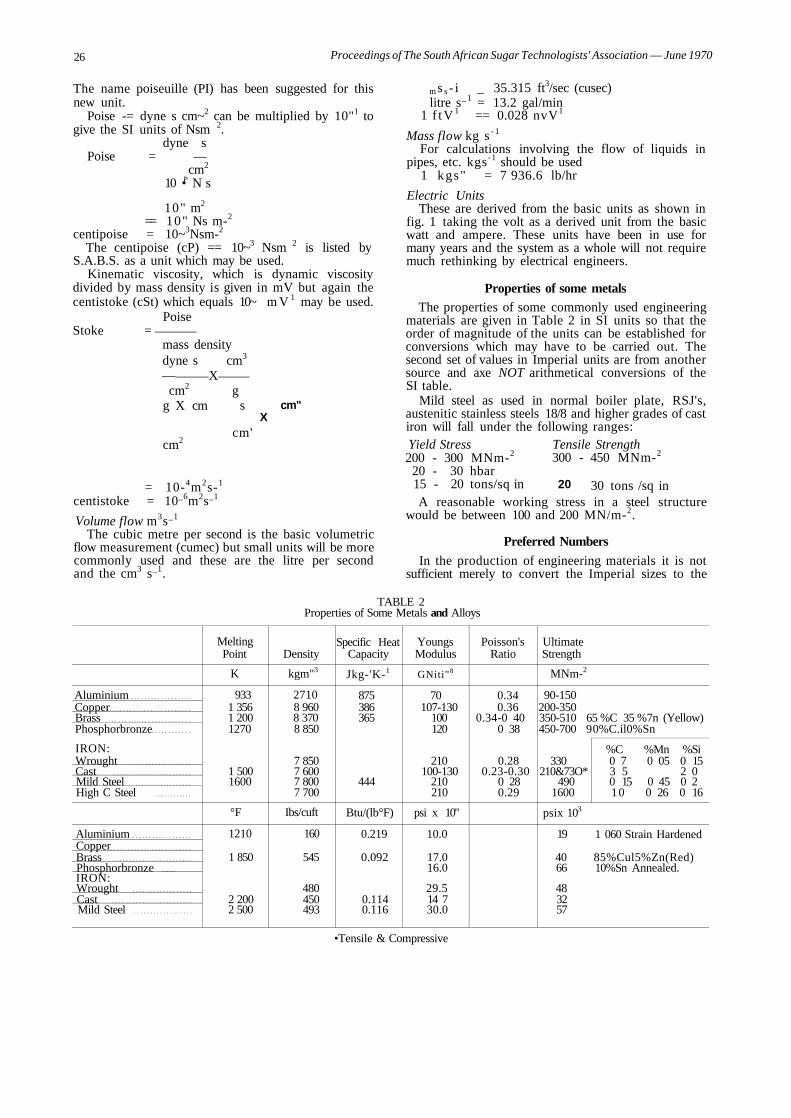
26 Proceedings of The South African Sugar Technologists' Association — June 1970
The name poiseuille (PI) has been suggested for this new unit.
Poise -= dyne s cm~2 can be multiplied by 10"1 to give the SI units of Nsm 2.
dyne s Poise = —
cm2
10 •r> N s
10" m2
== 10" Ns m-2
centipoise = 10~3Nsm-2
The centipoise (cP) == 10~3 Nsm 2 is listed by S.A.B.S. as a unit which may be used.
Kinematic viscosity, which is dynamic viscosity divided by mass density is given in mV but again the centistoke (cSt) which equals 10~
Poise Stoke =
m V 1 may be used.
mass density dyne s cm3
— X cm2 g
g X cm s cm" X
cm2 cm'
= 10-4m2s-1
centistoke = 10_6m2s_1
Volume flow m3s_1
The cubic metre per second is the basic volumetric flow measurement (cumec) but small units will be more commonly used and these are the litre per second and the cm3 s_1.
m s s - i _ 35.315 ft3/sec (cusec) litre s_1 = 13.2 gal/min
1 f tV 1 == 0.028 nvV1
Mass flow kg s - 1
For calculations involving the flow of liquids in pipes, etc. kgs -1 should be used
1 kgs" = 7 936.6 lb/hr
Electric Units These are derived from the basic units as shown in
fig. 1 taking the volt as a derived unit from the basic watt and ampere. These units have been in use for many years and the system as a whole will not require much rethinking by electrical engineers.
Properties of some metals The properties of some commonly used engineering
materials are given in Table 2 in SI units so that the order of magnitude of the units can be established for conversions which may have to be carried out. The second set of values in Imperial units are from another source and axe NOT arithmetical conversions of the SI table.
Mild steel as used in normal boiler plate, RSJ's, austenitic stainless steels 18/8 and higher grades of cast iron will fall under the following ranges: Yield Stress 200 - 300 MNm-2
20 - 30 hbar 15 - 20 tons/sq in
Tensile Strength 300 - 450 MNm-2
20 30 tons /sq in A reasonable working stress in a steel structure
would be between 100 and 200 MN/m-2.
Preferred Numbers In the production of engineering materials it is not
sufficient merely to convert the Imperial sizes to the
TABLE 2 Properties of Some Metals and Alloys
Aluminium Copper Brass Phosphorbronze
IRON: Wrought Cast Mild Steel High C Steel
Aluminium Copper Brass Phosphorbronze IRON: Wrought Cast Mild Steel
Melting Point
K
933 1 356 1 200 1270
1 500 1600
°F
1210
1 850
2 200 2 500
Density
kgm"3
2710 8 960 8 370 8 850
7 850 7 600 7 800 7 700
Ibs/cuft
160
545
480 450 493
Specific Heat Capacity
Jkg-'K-1
875 386 365
444
Btu/(lb°F)
0.219
0.092
0.114 0.116
Youngs Modulus
GNiti"8
70 107-130
100 120
210 100-130
210 210
psi x 10"
10.0
17.0 16.0
29.5 14 7 30.0
Poisson's Ratio
0.34 0.36
0.34-0 40 0 38
0.28 0.23-0.30
0 28 0.29
Ultimate Strength
MNm-2
90-150 200-350 350-510 65 %C 35 %7n (Yellow) 450-700 9
330 210&73O*
490 1600
psix 103
19
40 66
48 32 57
0%C.il0%Sn
%C %Mn %Si 0 7 0 05 0 15 3 5 2 0 0 15 0 45 0 2 10 0 26 0 16
1 060 Strain Hardened
85%Cul5%Zn(Red) 10%Sn Annealed.
•Tensile & Compressive
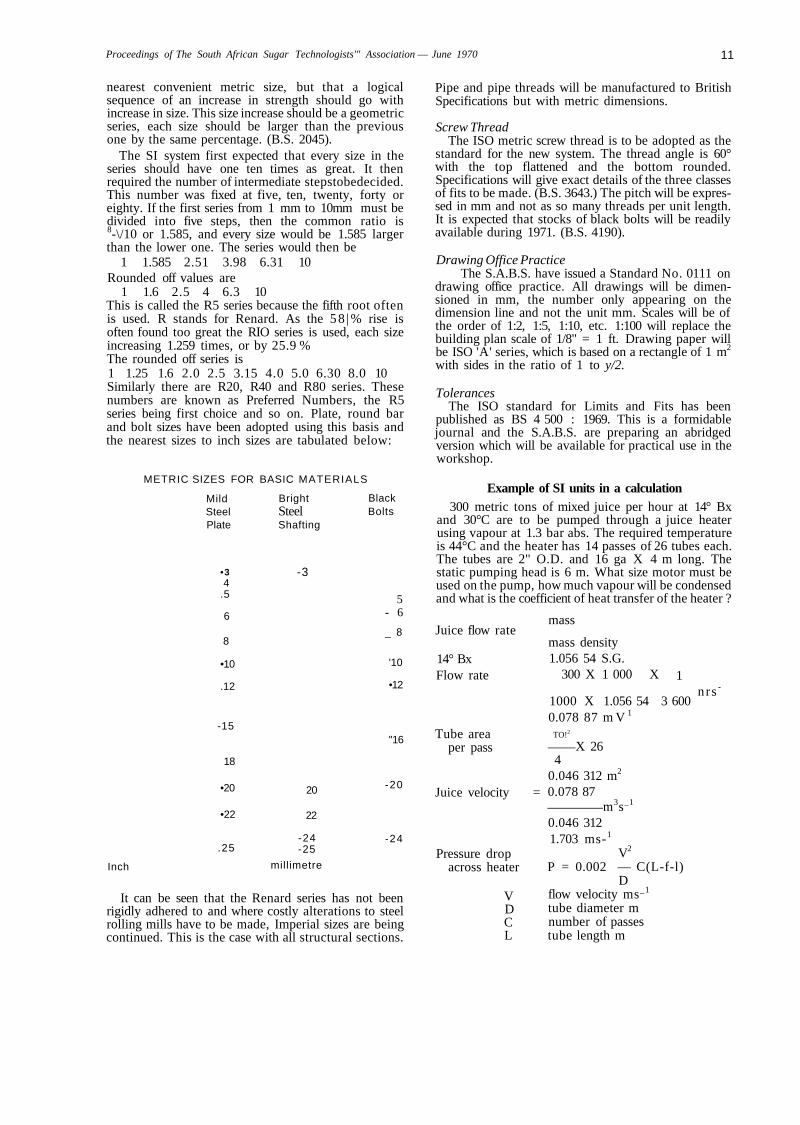
Proceedings of The South African Sugar Technologists'" Association — June 1970 11
nearest convenient metric size, but that a logical sequence of an increase in strength should go with increase in size. This size increase should be a geometric series, each size should be larger than the previous one by the same percentage. (B.S. 2045).
The SI system first expected that every size in the series should have one ten times as great. It then required the number of intermediate stepstobedecided. This number was fixed at five, ten, twenty, forty or eighty. If the first series from 1 mm to 10mm must be divided into five steps, then the common ratio is 8-\/10 or 1.585, and every size would be 1.585 larger than the lower one. The series would then be
1 1.585 2.51 3.98 6.31 10 Rounded off values are
1 1.6 2.5 4 6.3 10 This is called the R5 series because the fifth root often is used. R stands for Renard. As the 58 |% rise is often found too great the RIO series is used, each size increasing 1.259 times, or by 25.9 % The rounded off series is 1 1.25 1.6 2.0 2.5 3.15 4.0 5.0 6.30 8.0 10 Similarly there are R20, R40 and R80 series. These numbers are known as Preferred Numbers, the R5 series being first choice and so on. Plate, round bar and bolt sizes have been adopted using this basis and the nearest sizes to inch sizes are tabulated below:
METRIC SIZES FOR BASIC MATERIALS
Inch
Mild Steel Plate
•3 4
.5
6
8
•10
.12
-15
18
•20
•22
.25
Bright Steel Shafting
-3
Black Bolts
20
22
-24 -25
millimetre
5 - 6
_ 8
'10
•12
"16
-20
-24
It can be seen that the Renard series has not been rigidly adhered to and where costly alterations to steel rolling mills have to be made, Imperial sizes are being continued. This is the case with all structural sections.
Pipe and pipe threads will be manufactured to British Specifications but with metric dimensions.
Screw Thread The ISO metric screw thread is to be adopted as the
standard for the new system. The thread angle is 60° with the top flattened and the bottom rounded. Specifications will give exact details of the three classes of fits to be made. (B.S. 3643.) The pitch will be expressed in mm and not as so many threads per unit length. It is expected that stocks of black bolts will be readily available during 1971. (B.S. 4190).
Drawing Office Practice The S.A.B.S. have issued a Standard No. 0111 on
drawing office practice. All drawings will be dimensioned in mm, the number only appearing on the dimension line and not the unit mm. Scales will be of the order of 1:2, 1:5, 1:10, etc. 1:100 will replace the building plan scale of 1/8" = 1 ft. Drawing paper will be ISO 'A' series, which is based on a rectangle of 1 m2
with sides in the ratio of 1 to y/2.
Tolerances The ISO standard for Limits and Fits has been
published as BS 4 500 : 1969. This is a formidable journal and the S.A.B.S. are preparing an abridged version which will be available for practical use in the workshop.
Example of SI units in a calculation 300 metric tons of mixed juice per hour at 14° Bx
and 30°C are to be pumped through a juice heater using vapour at 1.3 bar abs. The required temperature is 44°C and the heater has 14 passes of 26 tubes each. The tubes are 2" O.D. and 16 ga X 4 m long. The static pumping head is 6 m. What size motor must be used on the pump, how much vapour will be condensed and what is the coefficient of heat transfer of the heater ?
mass Juice flow rate
14° Bx Flow rate
Tube area per pass
Juice velocity =
Pressure drop across heater
V D C L
mass density 1.056 54 S.G.
300 X 1 000 X 1 n r s -
1000 X 1.056 54 3 600 0.078 87 m V 1
TO!2
X 26 4
0.046 312 m2
0.078 87 m3s_1
0.046 312 1.703 ms-1
V2
P = 0.002 — C(L-f-l) D
flow velocity ms_1
tube diameter m number of passes tube length m
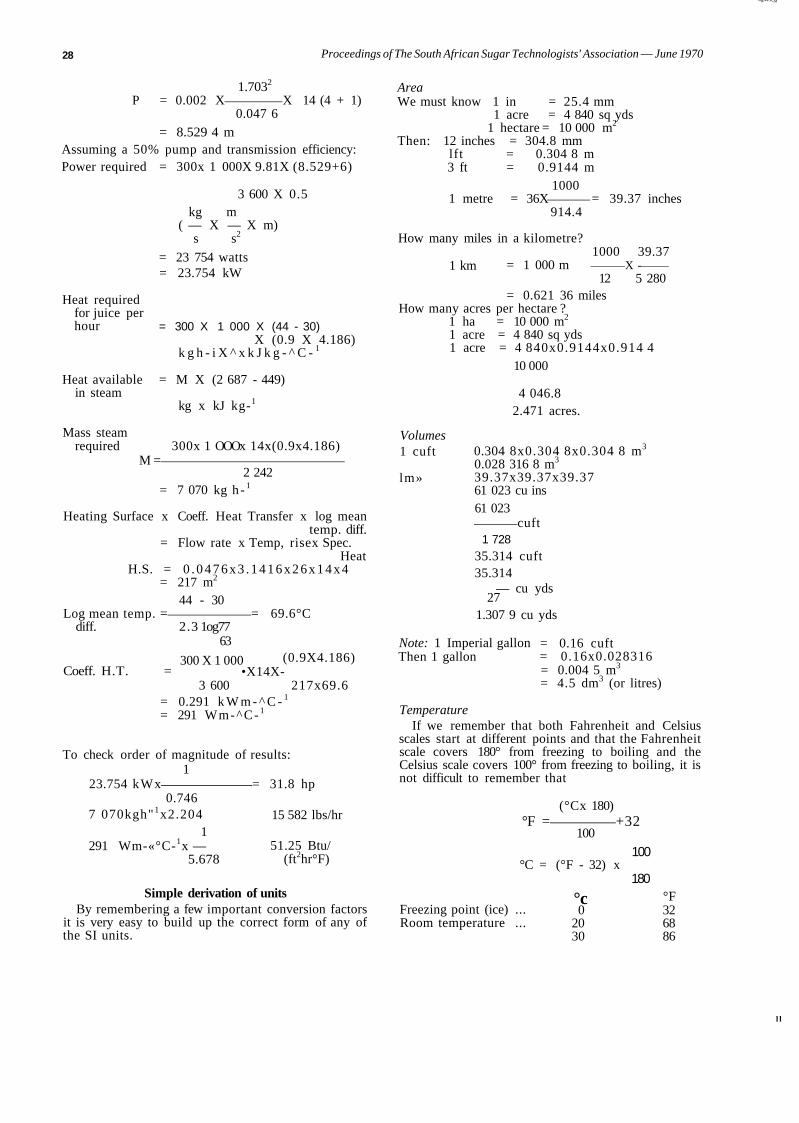
"*W**™«M
28 Proceedings of The South African Sugar Technologists' Association — June 1970
1.7032
P = 0.002 X X 14 (4 + 1) 0.047 6
= 8.529 4 m Assuming a 50% pump and transmission efficiency: Power required = 300x 1 000X 9.81X (8.529+6)
3 600 X 0.5
Heat required for juice per hour
kg m ( — X — X m)
s s2
= 23 754 watts = 23.754 kW
= 300 X 1 000 X (44 - 30) X (0.9 X 4.186)
k g h - i X ^ x k J k g - ^ C - 1
Heat available = M X (2 687 - 449) in steam
kg x kJ kg-1
Mass steam required 300x 1 OOOx 14x(0.9x4.186)
M = 2 242
= 7 070 kg h - 1
Heating Surface x Coeff. Heat Transfer x log mean temp. diff.
= Flow rate x Temp, risex Spec. Heat
H.S. = 0 . 0 4 7 6 x 3 . 1 4 1 6 x 2 6 x 1 4 x 4 = 217 m2
44 - 30 Log mean temp. = = 69.6°C
diff. 2.3 1og77
Coeff. H.T. =
63
300 X 1 000 •X14X-
(0.9X4.186)
3 600 217x69.6 = 0.291 k W m - ^ C - 1
= 291 Wm-^C- 1
To check order of magnitude of results: 1
23.754 kWx = 31.8 hp 0.746
7 070kgh"1x2.204 1
291 Wm-«°C-1x — 5.678
15 582 lbs/hr
51.25 Btu/ (ft2hr°F)
Simple derivation of units By remembering a few important conversion factors
it is very easy to build up the correct form of any of the SI units.
Area We must know 1 in = 25.4 mm
1 acre = 4 840 sq yds 1 hectare = 10 000 m2
Then: 12 inches = 304.8 mm lft = 0.304 8 m 3 ft = 0.9144 m
1000 1 metre = 36X = 39.37 inches
914.4
How many miles in a kilometre?
1 km = 1 000 m 1000 39.37
X -12 5 280
= 0.621 36 miles How many acres per hectare ?
1 ha = 10 000 m2
1 acre = 4 840 sq yds 1 acre = 4 840x0.9144x0.914 4
10 000
Volumes 1 cuft
lm»
4 046.8 2.471 acres.
0.304 8x0.304 8x0.304 8 m3
0.028 316 8 m3
39.37x39.37x39.37 61 023 cu ins 61 023
cuft 1 728
35.314 cuft 35.314
— cu yds 27
1.307 9 cu yds
Note: 1 Imperial gallon Then 1 gallon
= 0.16 cuft = 0.16x0.028316 = 0.004 5 m3
= 4.5 dm3 (or litres)
Temperature If we remember that both Fahrenheit and Celsius
scales start at different points and that the Fahrenheit scale covers 180° from freezing to boiling and the Celsius scale covers 100° from freezing to boiling, it is not difficult to remember that
(°Cx 180) °F = +32
100
°C = (°F - 32) x 100
180
Freezing point (ice) ... Room temperature ...
°c 0
20 30
°F 32 68 86
l l
Proceedings of The South African Sugar Technologists' Association — June 1970 29
Body temperature
Boiling point (water)
36.9 60 80
100
98.4 140 176 212
Heat Units Remember: = 0.555 5 °C
= 25.4 mm 453.6 g
Then: 1 lbf/sq in
1°F 1 in 1 lb 1 Btu = 1.055 kJ
1 lbf 453.6 gf
1 sqin 25.4x25.4 mm2
453.6X10⁻³ kgf
25 .4x25.4xl0- 2 cm 2
= 0.070 3 kgf cm-2
lbf or 1 lbf/(sq ft °F hr) =
sq f tx°Fxhr
453.6 gf
144x25.4x25.4x0.555 5 x 3 600
453.6X10"3
144x25.42x 10-6X0.555 5 x 3 600 kgfm-2°C - V
= 0.002 44 kgfm->°C-1s-
or 1 Btu/(sq ft hr) = Btu
sqf txhr
1.055 kJ
122x25.42xl0-6 m 2 x3 600 s
= S . l S x l O ^ k J m ^ s " 1 ' = 3.15 Wm~2
It will be sufficient to remember the four basic conversions given above.
Factory Conversion The main factors in factory conversion have been
(1) Conversion of scales and weighbridges to read kilogrammes
(2) Alterations to laboratory control sheets
(3) Recalibration of process vessels for stocktaking
(4) Education of factory personnel at different levels and of different interests
(5) Conversion of gauges, charts, etc.
Pressure Units It has been decided that for low pressure and
vacuum measurements the bar absolute will be used. For vacuum measurements the sub-multiple millibar absolute will replace inches of mercury.
Boiler pressure gauges and other process lines will be measured in bars (gauge).
1 bar = 105 Nm-2 = 100 kNm"2
1 bar = 14.503 8 lbf/sq in = 750.062 mm Hg = 29.530 in Hg
1 atm = 760 mm Hg = 1.013 25 bar
Millibars abs
300 280 260 240 220 200 180 160 140 120 100
Vac. gauge in Hg.
21.061 21.651 22.242 22.832 23.423 24.014 24.604 25.195 25.785 26.376 26.967
Sat Temp °C
69.1 67.5 65.9 64.1 62.2 60.1 57.8 55.3 52.6 49.4 45.8
APPENDIX I Basic SI units and Definitions
METRE: Length equal to 1 650 763.73 wavelengths in vacuo of the radiation corresponding to the transition between the energy levels 2p1(> and 5 d5 of the krypton 86 atom. KILOGRAMME: The mass of the international prototype kilogramme in the custody of the Bureau International des Poids et Mesures in Sevres, France. SECOND: The duration of 9 192 631770 oscillations of a radiation corresponding to a transition between the two hyper-fine levels F = 4, M = O and F = 3, M = O of the fundamental stage 2 S £ of an atom of caesium 133. AMPERE: The constant current which, if maintained in two parallel rectilinear conductors of infinite length, of negligible cross section and placed at a distance of one metre apart in vacuo, would produce between these conductors a force equal to 2 x 10 _7 newton per metre length. KELVIN: A unit of temperature equal to the fraction 1/273.16 of the temperature of the triple point of water. CANDELA: The luminous intensity in a direction perpendicular to the surface of 1/600 000 square metre of a black body at the temperature of the freezing point of platinum at a pressure of 101 325 newton per square metre.
References use extensively in the text Basic Guide to the Metric System in South Africa South African Bureau of Standards 2nd Ed. 1969 Metric Sizes for Basic Materials
S.A.B.S. SI Units in Engineering
Blackman, D. R. Macmillan 1969 Steam Tables
Keenan, H. J. et al John Wiley 1969 Thermodynamic Tables in SI (metric) Units
Haywood, R. W. Cambridge University Press Materials Selection for Process Plants
Gackenbach, R. E. Reinhold Publishing Corp. 1960 Engineers Diary
Collins 1965 Engineering Materials and Design
Metric Data Sheets Jan. 68 — March 69 Metrication: New Standards for Components
E.M.P.E. Certificated Engineer. March 1969 Metrication: Preferred Numbers
E.M.P.E. Certificated Engineer. Jan. 1969
30 Proceedings of The South African Sugar Technologists'' Association — June 1970
CONTAINERISATION By D. S. WILKES
Hulett's South African Refineries Limited
Abstract The definition and principles of a container are
outlined. The particular application at Hulett's Refineries, Rossburgh, is cited. Overseas developments are briefly outlined.
Introduction With the increasing use of containerisation as a
means of packing goods for transportation overseas, as well as in South Africa, it was thought that a worthwhile investigation would be to determine the effect of the introduction of this method of packing at the Refinery. The results obtained were sufficiently promising to warrant a more detailed study. It is hoped that this short paper will arouse sufficient interest to enable the Industry to be adequately prepared when containerisation arrives.
Definitions Before attempting to outline the effects of con
tainerisation, it would be as well to define the subject matter.
The definition of a freight container according to the International Organisation for Standardisation1, is as follows:
"Freight container shall mean an article of transport equipment: (a) Of a permanent character and accordingly
strong enough to be suitable for repeated use. (b) Especially designed to facilitate the carriage
of goods, by one or more modes of transport, without intermediate reloading.
(c) Fitted with devices permitting its ready handling, particularly its transfer from one mode of transport to another.
(d) Or designed as to be easy to fill and empty."
The term "freight container" includes neither vehicles nor conventional packing.
Definition of general purpose of freight container "Freight container of rectangular configuration,
weatherproof, for transporting and storing a number of unit loads, packages or bulk materials, that confines and protects the contents from loss and damage, then can be separated from the means of transport, handled as a unit load, and trans-shipped without rehandling the contents."
There are at present two series of containers which have been standardised upon by the international committee, and these are shown in Table I and II.
Applications These can be summarized by three major func
tions: 1. To provide weatherproof storage. 2. To confine and protect packs. 3. To be transported by various means as a unit
load. The advantages of weatherproof storage are more
than obvious, especially when one is dealing with a perishable product like sugar. Far too often we have heard of cases in which a sudden storm caught a crew unloading a railway truck unawares or a vehicle driver forgot to take along a tarpaulin or the ship's hold could not be closed in time to prevent damage to sugar.
To confine and protect 20 metric tons of refined sugar from Durban to Walvis Bay or Durban to the Reef is no small undertaking. However, the following uncontrollable hazards no longer exist with containers: (a) Theft, at present very prevalent. (b) Multiple handling, an ever-present hazard. (c) Rain and weather hazard.
The only hazard which is still present is, of course, bad hyster driving when loading and unloading, and this is surely controllable.
Hysters capable of handling 20 metric ton loads have been developed and the advantages of transporting 20 pallet loads with one lift are self-evident.
Specific Advantages to the Refinery Apart from the cost of raw sugar, one of the
biggest expenditures at the Refinery is packing materials and this at present exceeds Rl million rand per annum.
A considerable amount of this is necessary in order to ensure that the package is strong enough to withstand the rigours of the South African distribution system.
With the introduction of containerisation, the need for this strength requirement is greatly reduced. The saving in packing materials that would be realised by the reduced strength requirements is of the order of R200,000 per annum. This is the maximum and is based on the assumption that a 2-ply valve sack and baler bag would be sufficiently strong to contain refined sugar on a container journey.
Claims involving damage to pockets and packed sugar at present cost the Refinery in excess of R20.000 per annum. When one considers that 45 per cent of the Refinery's inland despatches are trans-
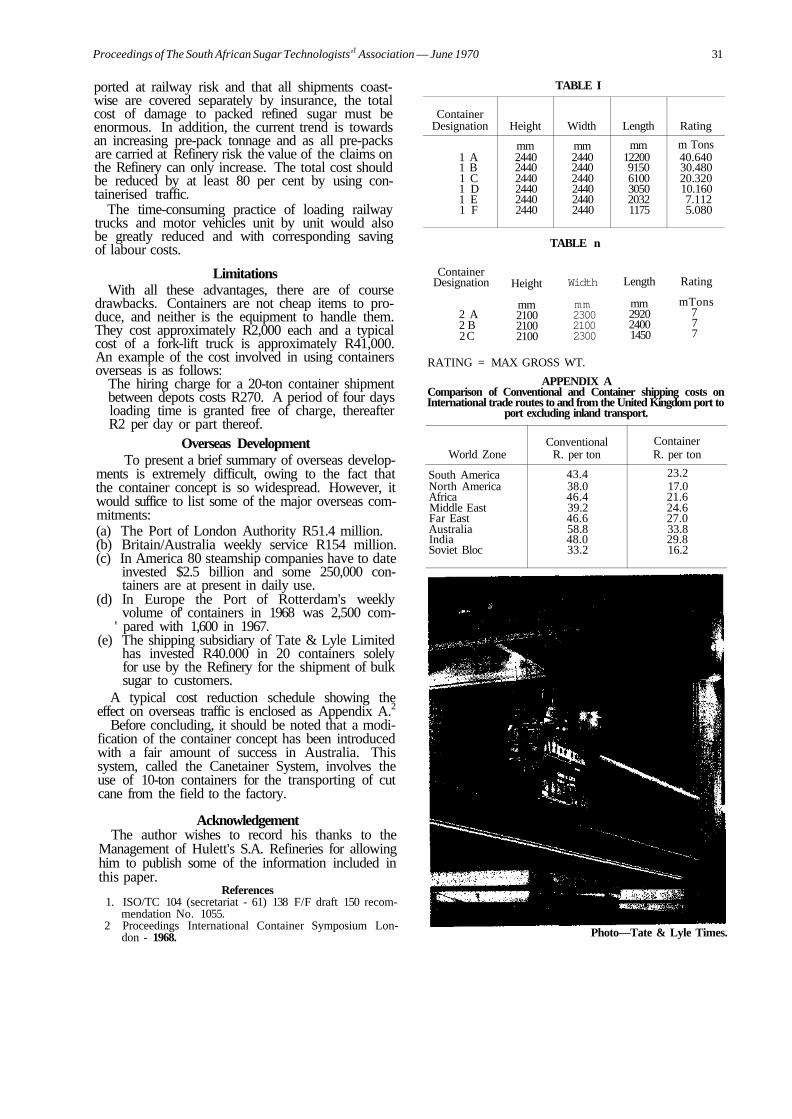
Proceedings of The South African Sugar Technologists'1 Association — June 1970 31
ported at railway risk and that all shipments coastwise are covered separately by insurance, the total cost of damage to packed refined sugar must be enormous. In addition, the current trend is towards an increasing pre-pack tonnage and as all pre-packs are carried at Refinery risk the value of the claims on the Refinery can only increase. The total cost should be reduced by at least 80 per cent by using containerised traffic.
The time-consuming practice of loading railway trucks and motor vehicles unit by unit would also be greatly reduced and with corresponding saving of labour costs.
Limitations With all these advantages, there are of course
drawbacks. Containers are not cheap items to produce, and neither is the equipment to handle them. They cost approximately R2,000 each and a typical cost of a fork-lift truck is approximately R41,000. An example of the cost involved in using containers overseas is as follows:
The hiring charge for a 20-ton container shipment between depots costs R270. A period of four days loading time is granted free of charge, thereafter R2 per day or part thereof.
Overseas Development To present a brief summary of overseas develop
ments is extremely difficult, owing to the fact that the container concept is so widespread. However, it would suffice to list some of the major overseas commitments: (a) The Port of London Authority R51.4 million. (b) Britain/Australia weekly service R154 million. (c) In America 80 steamship companies have to date
invested $2.5 billion and some 250,000 containers are at present in daily use.
(d) In Europe the Port of Rotterdam's weekly volume of' containers in 1968 was 2,500 com-
' pared with 1,600 in 1967. (e) The shipping subsidiary of Tate & Lyle Limited
has invested R40.000 in 20 containers solely for use by the Refinery for the shipment of bulk sugar to customers.
A typical cost reduction schedule showing the effect on overseas traffic is enclosed as Appendix A.2
Before concluding, it should be noted that a modification of the container concept has been introduced with a fair amount of success in Australia. This system, called the Canetainer System, involves the use of 10-ton containers for the transporting of cut cane from the field to the factory.
Acknowledgement The author wishes to record his thanks to the
Management of Hulett's S.A. Refineries for allowing him to publish some of the information included in this paper.
References 1. ISO/TC 104 (secretariat - 61) 138 F/F draft 150 recom
mendation No. 1055. 2 Proceedings International Container Symposium Lon
don - 1968.
TABLE I
Container Designation
1 A 1 B 1 C 1 D 1 E 1 F
Height
mm 2440 2440 2440 2440 2440 2440
Width
mm 2440 2440 2440 2440 2440 2440
Length
mm 12200 9150 6100 3050 2032 1175
Rating
m Tons 40.640 30.480 20.320 10.160 7.112 5.080
TABLE n
Container Designation
2 A 2 B 2C
Height
mm 2100 2100 2100
Width
mm 2300 2100 2300
Length
mm 2920 2400 1450
Rating
mTons 7 7 7
RATING = MAX GROSS WT.
APPENDIX A Comparison of Conventional and Container shipping costs on International trade routes to and from the United Kingdom port to
port excluding inland transport.
World Zone
South America North America Africa Middle East Far East Australia India Soviet Bloc
Conventional R. per ton
43.4 38.0 46.4 39.2 46.6 58.8 48.0 33.2
Container R. per ton
23.2 17.0 21.6 24.6 27.0 33.8 29.8 16.2
Photo—Tate & Lyle Times.
32 Proceedings of The South African Sugar Technologists'' Association — June 1970
Discussion Mr. Collingwood: Would a container in this
country belong to the railways or to the manufacturer?
If a twenty tone container requires twenty pallets to load it, do the pallets remain in the container?
Mr. Wilkes: The general manager of the South African Railways says that the S.A.R. will provide the containers, including the pallets.
The actual packing must be done by the consignor.
Mr. Hoekstra: Does the type of container used for sugar limit its suitability for use for other products, i.e. for return freight?
Mr. Wilkes: Tate and Lyle used containers for bulk sugar but at this stage I think we should restrict ourselves to containers for bagged sugar, packed on pallets.
We are not responsible for filling a container for return freight.
Mr. Renton: Was containerisation in Britain developed by British Railways or by private enterprise and when are the railways in this country likely to introduce such a system?
Mr. Wilkes: British Railways do not operate in the same manner as South African Railways.
The Port of London Authority started containerisation between U.K. and U.S.A. and savings were such that British Railways quickly followed suit.
The South African Railways are interested in containers but no date has yet been set for their introduction.
I understand "Bosal" exhausts are using containers for exports, but only from the dockside,
Mr. Francis: How does containerisation affect storage problems?
Mr. Wilkes: Containers do assist with storage. Using straddle trucks, they can be stacked three high.
The trucks can handle up to 42 tons and the time spent in handling freight is reduced considerably.
Mr. Alexander (in the chair}: The cost of containers is so high that a container would be a rather expensive method of storage.
Dr. Matic: A small manufacturer may not have the equipment to unload these containers.
Mr. Wilkes: The standard container is 8 feet by 8 feet and has large doors at one end through which can be driven a hyster complete with pallet.
Mr. Allan: If the container arrived on a trailer would the trailer be left at the factory? It would be quite a problem to lift the container off the trailer.
Mr. Wilkes: There is a system in America where the container, using the truck's pneumatic system, is lifted a few inches off the truck and is supported on legs while the truck drives off.
Mr. Poree: If the consignor wants the container back he is presumably responsible for the return journey, so must he try and develop a return trade?
Mr. Wilkes: As both containers and transport will belong to the railways, there will be simply a demurrage problem, as at present.
An outside private organisation might be used for loading containers and bringing them to a railway depot.
Proceedings of The South African Sugar Technologists' Association — June 1970 33
FACTORY BALANCE SYMPOSIUM
THE FACTORY BALANCE S.A.S.T.A. Chemical Control Committee
Abstract The interests of the Committee in aspects of the
Factory Balance are outlined and figures given to show the financial implications of undetermined loss and non-sucrose ratio. The work of the Committee on the influence of suspended solids on mixed juice analysis, the determination of refractometer brix, and industry-wide standardisation of sampling, analysis, and reporting, is reviewed.
Introduction The importance which should be attached to the
control of loss in industry cannot be overstressed. The ability to assess when and where losses occur is a necessary forerunner to effective loss control.
When it is remembered that our industry enjoys a world-wide reputation for efficiency it is startling to note the considerable financial implications of sugar factory losses in South Africa.
What has this to do with the Chemical Control Committee?
All calculations of sugar factory losses are based on factory data for weights and analyses. It has long been realised that many of the so-called losses grouped as "undetermined" are by no means genuine. Apparent losses of sucrose are caused by errors in weighing, sampling and analysis of factory products. These fictitious sucrose losses are very much the province of chemical control.
Non-sucrose ratio* has been used as an indicator of the fate of impurities in the factory. Non-sucrose ratios vary considerably from factory to factory. This variation is important in that the ratio is an expression of molasses production. A high non-sucrose ratio reflects an excessive molasses production. Yet, despite the proven parallel between N.S.R. and molasses weighed out of the factory, doubt exists as to the validity of non-sucrose ratio for indicating performance, for the figure depends upon the accuracy of the brix determination in mixed juice and molasses, analyses which do not inspire general confidence! And so non-sucrose ratio, and its larger cousin the factory brix balance, become important aspects for the consideration of the Committee.
Calculations, summarised in the Appendix, indicate that the cost to the industry through factories losing more sucrose in molasses than the industrial average amounted to over R600,000 last season. At the same time the total cost to the industry through undetermined sucrose losses in excess of the industrial mean amounted to over R400,000. The latter figure can be considered a minimum, for the industrial average undetermined loss, 1.54%, is a figure
Non-sucrose in Sugar and Molasses * N.S.R. = — •
Non-sucrose in Mixed Juice
which an industry with a reputation for efficiency should not tolerate without an explanation. If an uncontrollable undetermined loss of 1% is taken as a basis for calculation, this cost soars to over R700,000 for the season.
Matters Considered by the Committee 1. Suspended Matter in Mixed Juice
Suspended matter can affect the official sucrose determination in at least two different ways, namely through sampling in the factory and through the analytical techniques used. When appreciable amounts of suspended matter are present in the juice, although they are weighed in their entirety, the perforated sampling tube canted at an angle can act in a way similar to a DSM screen, selectively passing a sample richer in juice and hence in sucrose. Once having reached the laboratory, a portion of the juice is clarified and filtered, in this way removing all suspended and most colloidal matter before the two portions of juice are measured out for the Jackson and Gillis sucrose determination.
An investigation of the selectivity of the present mixed juice sampling device was undertaken by the Sugar Milling Research Institute at the request of the Committee. The findings, that the device was indeed selective against suspended matter, were accompanied by suggestions for improved sampling of mixed juice.
At the same time the Committee initiated the accumulation of data on the quantity of suspended matter in mixed juice from different factories. A method for the determination of suspended matter was devised, and this was the subject of a paper presented to the 1969 Congress of this Association2. The accumulated data were used as the basis for a letter sent to the South African Sugar Association containing the following recommendations:—
(1) Hourly catch samples should be taken from the mixed juice pipe leading to the weigher.
(2) Samples should be composited with mercuric chloride and analysed on a shift basis.
(3) The method of analysis using filtration2 should be used for the determination of suspended solids in mixed juice.
(4) The sucrose per cent in mixed juice should be determined in the normal manner by J. and G. methods on the usual four-hourly sample, but the weekly sucrose percentage should be corrected for the suspended matter determined as described above.
The recommendations of the Committee were referred by the Sugar Association to the millers and growers. The discussions are still proceeding.
2. The Use of Refractometers for Factory Control Following the success of the decision by Hulett's
to adopt the refractometer in place of the spindle for the determination of brix in factory products from
34 Proceedings of The South African Sugar Technologists' Association — June 1970
clear juice onwards, the Committee has considered recommending the use of the refractometer throughout the industry.
A problem lies in the details of the method of analysis, particularly sample preparation. Graham and MacGillivray' have indicated the extent to which suspended and colloidal matter may influence refractometer readings in juices and extracts, and their work is being extended by the S.M.R.I. to include other factory products.
There is no doubt that refractometer brix gives a truer indication of the soluble solids content of a juice than spindle brix. A logical follow-up of the adoption of the refractometer from clear juice onwards would be an extension to the complete factory through changing the method of determination in mixed juice, at present defined by the Sugar Act. The Committee has suggested that parallel determinations of brix in mixed juice should be carried out by the two methods. This suggestion will be adopted by some factories in the 1970/71 season. The details of the exact method of sample preparation and analysis have recently been finalised by a subcommittee.
3. Standardisation of Factory Methods and Reporting The true significance of differences between fac
tory balances can only be appreciated if the data supplied are based on standard procedures. Standardisation of the method used for determining brix has already been mentioned. There are other measures which have been considered by the Committee.
A recommendation has been put forward that all factories should weigh final molasses. This is an essential prerequisite for industry-wide comparisons of undetected losses and non-sucrose ratios.
The weighing of syrup is a step which may well gain favour when an investigation of losses is intensified. The Committee has undertaken to "encourage" factories to weigh syrup. The current paper on weighing syrup at Empangeni may, or may not, lend weight to the encouragement!
The Committee has recently initiated, through the S.M.R.I., a survey of the methods of sampling and analysis used in all factories. From the results of this survey it will be possible to make suggestions to certain factories with the object of improving standardisation throughout the industry.
Two matters relating to reporting have been dealt with by the Committee. A recommendation has been put forward that all factories should submit data on non-sucrose ratio to the S.M.R.I. for inclusion in the weekly summary of factory returns. This step has been taken because considerable differences have been found between the seasonal average non-sucrose ratios for different factories. Taking clarified juice as starting point, the N.S.R. for factories using spindle brix varied from 0.901 to 0.996, and for factories using refractometer brix from 0.829 to 0.887. Non-sucrose ratio is in itself a statement of factory balance, but, while a ratio of nearly 100% may please the academic, in the case of non-sucrose ratio the lower the better! Calculation shows that the difference in N.S.R. between 0.996 and 0.901 is worth 68 cents per ton of sugar to the "less well balanced"
factory. For refractometer factories the difference between 0.887 and 0.829 is worth 42 cents per ton of sugar. While it is not suggested that the mere reporting of these data will solve the overall problem, it will be appreciated that collection of reliable data must form the first step in any methodical scientific approach to the problem.
The second item dealing with reporting may seem less directly connected with the factory balance. This was the decision, taken after long consideration, to abandon the use of Boiling House Performance.-One of the grounds on which B.H.P. was attacked was its dependence on mixed juice purity, itself influenced by the accuracy of determination of both brix and sucrose. In fact B.H.P. was intimately tied up with the accuracy of determination of factory balance.
4. Other Matters Considered by the Committee The Committee decided to send a questionnaire to
other sugar-producing countries, giving details of the "non-sucrose ratio" and "undetermined loss" problems, and asking for their experience. Any pertinent information from other industries could be most useful.
Projects undertaken within the industry have been fully supported by the Committee. These have included three items to be discussed during this symposium, the chloride balance, solids balance, and isotope dilution method investigations, as well as research into non-sucrose constituents of juices and molasses which influence the sucrose determination.
Discussion Academic considerations apart, the factory
balance has considerable economic significance. The economic aspect can be divided into two problems which may be conveniently labelled undetermined loss and non-sucrose ratio.
It is the intention of the Committee to act as a clearing house for data received and to suggest and initiate new lines of investigation.
Not all the collection of data can be undertaken directly by the Chemical Control Committee. Some investigations may be conducted by individual members, in particular those representing the S.M.R.I. and Hulett's Research and Development, but the basic data collection will consume far more time than can be contributed by the members of the Committee. It has therefore been proposed that a technologist be appointed on a full-time basis to collect and collate statistical data and to undertake specific investigations at the Committee's request.
It may seem that few of the measures mentioned in this report are likely to solve either of the major problems. Improvement to sucrose analysis of mixed juice or, more drastic, the adoption of the isotope dilution method, may reduce fictitious undetected losses, but real undetermined losses will continue to plague the industry, while above-average non-sucrose ratios will continue to reduce the profits of unfortunate factories.
By the application of scientific methods it should be possible, after a fair amount of reliable data
Proceedings of The South African Sugar Technologists' Association — June 1970 35
has been accumulated through the present programme, to suggest lines of attack able to yield more positive results.
The purpose of this symposium will be well served if the discussion includes ideas on lines of investigation not covered by the papers.
References 1. MacGillivray, A. W., and Graham, W. S. (1969). "Brix
Determination", Proc. S. Afr. Sug. Technol. Assoc. 43, 215-218.
2. Prince, P. A. (1969). "The Determination of Suspended Solids in Mixed Juice", Proc. S. Afr. Sug. Technol. Assoc. 43, 141-142.
APPENDIX A Calculated Loss of Revenue to the Industry
TABLE I Calculated loss of revenue for factories not attaining industrial average (8.90 %) for loss of sucrose in molasses per cent sucrose
in cane, 1969/70 season.
APPENDIX B
Economic Effect of Non-sucrose Ratio
The calculations have been based on 1,000,000 tons of cane, and the following assumptions:—
Sucrose % cane Extraction % Mixed Pol of
Juice Purity % Sugar,
Non-sucrose in Boiling House Final Molasses
°S sugar %
Recovery % Purity %
13.5 95 85 98.7 0.9
90 38
Tons sucrose in mixed juice = 1,000,000 x 0.135 x 0.95
Factory
L O P H I M J N
'Extra' Loss (over 8.90%)
0.38 0.39 0.59 0.88 1.22 1.58 1.79 2.88
To
Tons 'extra' Sucrose Lost
214 661 832 267 327
1259 2393 4054
tal 10007
Loss in Rand at R60 per ton 98.7 pol sugar
13,020 40,200 50,580 16,200 19,860 76,500
145,440 246,420
608,220
Tons brix in mixed juice 100
= 128,250 x — 85
(a) Tons non-sucrose in mixs = 150,882 - 128,250 Tons sucrose in sugar = 128,250 x 0.90
Tons sugar 100
TABLE U Calculated loss of revenue for factories not attaining industrial average (1.54%) for undetermined loss of sucrose per cent sucrose
in cane, 1969/70 season. Factory 'Extra' Loss
(Over 1.54%) Tons 'Extra' Sucrose Lost
Loss in Rand at R60 per ton 98.7 pol sugar
I J K L M N
0.50 0.81 0.98 1.00 1.22 2.50
134 1083 395 563 972
3519
Total 6666
8,160 65,840 24,020 34,250 59,060
213,900
405,230
115,425 x 98.7
(b) Tons non-sucrose in sugar = 116,945 x 0.009
(c) Non-sucrose ratio A
0.901
Note: Factories H, I, J, N, operate diffusers. TABLE JJI
Calculated loss of revenue for factories losing more than 1% of sucrose in cane 'undetermined'. 1969/70 season.
Factory 'Extra' loss (over 1.00%)
Tons 'Extra' Sucrose Lost
Loss in Rand at R60 per Ton 98.7 pol sugar
A B C D E F G H I J K L M N
0.03 0.16 0.16 0.26 0.43 0.52 0.53 0.54 1.04 1.35 1.52 1.54 1.76 3.04
31 44
333 381 523 780 260 164 279
1805 613 868
1402 4279
Total 11762
1,860 2,700
20,220 23,160 31,800 47,400 15,780 9,960
16,980 109,740 37,260 52,740 85,200
260,100
714,900
128,250
150,882
22,632
115,425
116,945
1,053
(d)
(e)
Tons non-sucrose recovered = (a x c)
Tons non-sucrose in molasses = (d - b) Tons sucrose in molasses
38 = x e
20,391
19,338
11,852
22,541
21,488
13,170 100 - 38
The difference in sucrose lost in molasses, 1,318 tons, is equivalent to 1,335 tons of 98.7 pol sugar. At R60 per ton this amounts to R80,100, or in other words:—
R0.08 per ton cane R0.68 per ton sugar.
By means of a similar calculation it can be shown that a non-sucrose ratio difference between 0.887 and 0.829 is worth:—
R0.05 per ton cane R0.42 per ton sugar.
For discussion on this Paper, see page 50.
36 Proceedings of The South African Sugar Technologists" Association —June 1970
FACTORY BALANCE SYMPOSIUM
A FACTORY CHLORIDE BALANCE By A. W. MACG1LLIVRAY
Sugar Milling Research Institute
and
B. M. STUART Hulett's Research and Development
Abstract A chloride balance in a raw sugar factory has been
established. This balance compares favourably with the sucrose balance and could be used to detect chemical losses of sucrose. The use of chloride ions as tracers to detect losses in particular areas of the factory has been partially successful. The techniques of sampling and analysis are briefly described, and suggestions are made towards improving the accuracy of this work.
1. Introduction The discussion following the paper "Potentiometric
Determination of Chlorides in Molasses",1 at the 1969 congress, included lively comment on the use of chloride as the basis for factory balance calculations. The concept had been used with success by Davies and his co-workers" in 1941 for investigating the magnitude of sugar losses in the evaporators and pan station, and by Virginio Zanni3 in 1951, but little work has been reported since that time.
With the introduction of a quick and accurate potentiometric method for determining chloride, a routine factory chloride balance becomes a practical possibility. Chlorides are not subject to chemical destruction and, in common with other highly soluble inorganic ions can only be lost in the factory by physical removal, either through entrainment or absorption. A mass balance for chlorides over the factory should theoretically yield results approaching 100% recovery, and should definitely prove more reliable than a balance based on sucrose or total non sucrose, both of which may be altered chemically during the process.
Work has been carried out during the past season in an attempt to establish chloride balances in a raw sugar factory. This work has been partially successful in that a number of occasions a recovery of almost 100% was recorded over periods of two to three weeks.
At the same time at other factories, chloride was used as a tracer to pinpoint sugar losses. This programme has highlighted a number of unusual features.
The results so far are sufficiently promising to warrant continued and intensified investigation of the overall factory balance. If the techniques can be improved sufficiently to produce 100% confidence in the chloride balance, the adoption of the balance as a
routine feature of factory control may help to explain some of the anomalies of present comparative factory data.
2. Experimental 2.1 Chloride Analysis
The Metrohm Potentiograph (E.436) as described by Comrie1 was used throughout this work. AgNOa of either 0.05 or 0.IN strengths was titrated automatically against the various factory products, the end point being determined from the resultant millivolt curve.
The factory products which were analysed were as follows:
(i) Mixed Juice: 15 to 20 g of juice was accurately weighed and diluted to 50 ml for titration. The samples were not filtered before analysis and were therefore representative of the mixed juice as weighed.
(ii) Clear Juice: as for mixed juice. (iii) Filter Cake: A number of techniques were
used for this determination, none of them completely satisfactorily. At some mills it was possible to make a slurry of cake with distilled water, and titrate directly into this. At other factories this method did not give satisfactory results, and it was necessary to digest the cake with water or dilute HNOa and titrate the extract. Another technique used which gave a slightly improved titration curve was to add a known amount of chloride to the slurry before titrating.
(iv) Syrup: 4 g of syrup were weighed and diluted to about 50 ml.
(v) Sugar: 40 g of sugar were weighed and diluted to constant volume.
(vi) Molasses: 1 g of molasses was weighed and diluted to constant volume.
(vii) Stock: All products in stock were analysed for chloride at the beginning and end of each balance period,
(viii) Milk of Lime: 150 g of supernatant liquor was weighed, neutralized with HNOs and titrated directly.
2.2 Sampling Frequency 2.2.1. When a complete factory balance was being
established the various points sampled were as follows:
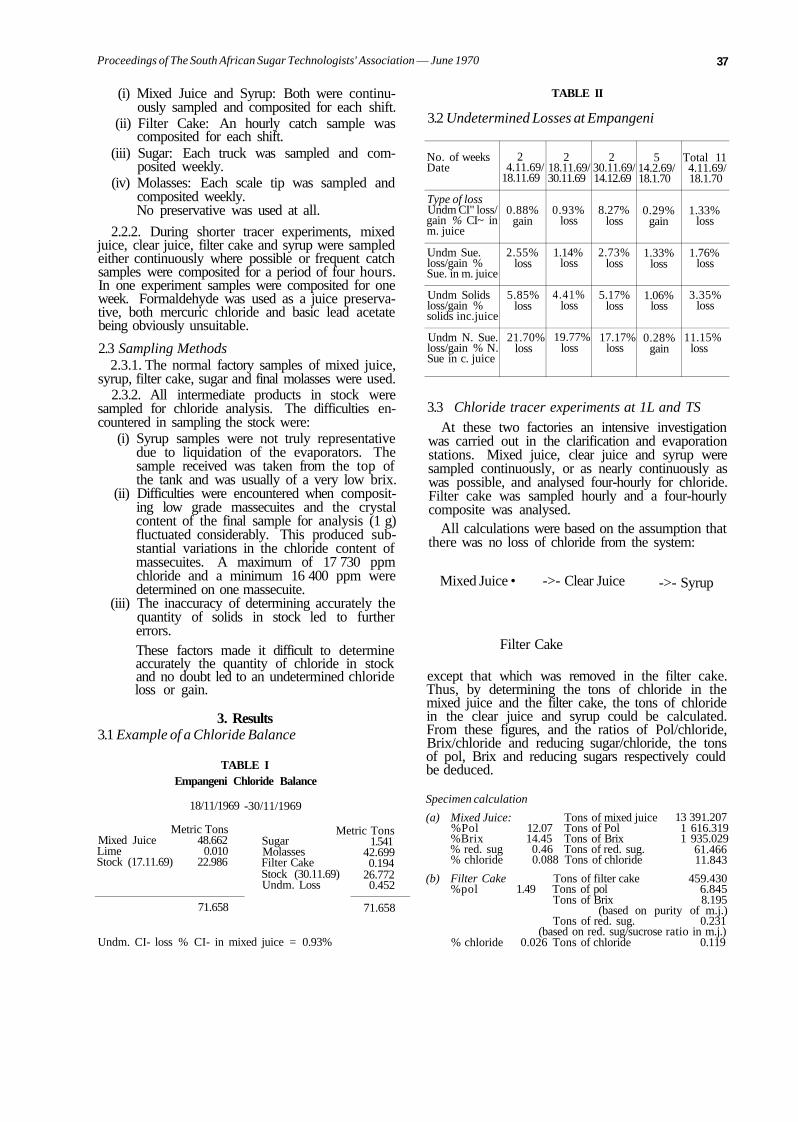
Proceedings of The South African Sugar Technologists' Association — June 1970 37
(i) Mixed Juice and Syrup: Both were continuously sampled and composited for each shift.
(ii) Filter Cake: An hourly catch sample was composited for each shift.
(iii) Sugar: Each truck was sampled and composited weekly.
(iv) Molasses: Each scale tip was sampled and composited weekly. No preservative was used at all.
2.2.2. During shorter tracer experiments, mixed juice, clear juice, filter cake and syrup were sampled either continuously where possible or frequent catch samples were composited for a period of four hours. In one experiment samples were composited for one week. Formaldehyde was used as a juice preservative, both mercuric chloride and basic lead acetate being obviously unsuitable.
2.3 Sampling Methods 2.3.1. The normal factory samples of mixed juice,
syrup, filter cake, sugar and final molasses were used. 2.3.2. All intermediate products in stock were
sampled for chloride analysis. The difficulties encountered in sampling the stock were:
(i) Syrup samples were not truly representative due to liquidation of the evaporators. The sample received was taken from the top of the tank and was usually of a very low brix.
(ii) Difficulties were encountered when compositing low grade massecuites and the crystal content of the final sample for analysis (1 g) fluctuated considerably. This produced substantial variations in the chloride content of massecuites. A maximum of 17 730 ppm chloride and a minimum 16 400 ppm were determined on one massecuite.
(iii) The inaccuracy of determining accurately the quantity of solids in stock led to further errors. These factors made it difficult to determine accurately the quantity of chloride in stock and no doubt led to an undetermined chloride loss or gain.
3. Results 3.1 Example of a Chloride Balance
TABLE I Empangeni Chloride Balance
TABLE II
3.2 Undetermined Losses at Empangeni
No. of weeks Date
Type of loss Undm CI" loss/ gain % CI~ in m. juice
Undm Sue. loss/gain % Sue. in m. juice
Undm Solids loss/gain % solids inc.juice
Undm N. Sue. loss/gain % N. Sue in c. juice
2 4.11.69/
18.11.69
0.88% gain
2.55% loss
5.85% loss
21.70% loss
2 18.11.69/ 30.11.69
0.93% loss
1.14% loss
4.41% loss
19.77% loss
2 30.11.69/ 14.12.69
8.27% loss
2.73% loss
5.17% loss
17.17% loss
5 14.2.69/ 18.1.70
0.29% gain
1.33% loss
1.06% loss
0.28% gain
Total 11 4.11.69/ 18.1.70
1.33% loss
1.76% loss
3.35% loss
11.15% loss
3.3 Chloride tracer experiments at 1L and TS At these two factories an intensive investigation
was carried out in the clarification and evaporation stations. Mixed juice, clear juice and syrup were sampled continuously, or as nearly continuously as was possible, and analysed four-hourly for chloride. Filter cake was sampled hourly and a four-hourly composite was analysed.
All calculations were based on the assumption that there was no loss of chloride from the system:
Mixed Juice • ->- Clear Juice ->- Syrup
Filter Cake
except that which was removed in the filter cake. Thus, by determining the tons of chloride in the mixed juice and the filter cake, the tons of chloride in the clear juice and syrup could be calculated. From these figures, and the ratios of Pol/chloride, Brix/chloride and reducing sugar/chloride, the tons of pol, Brix and reducing sugars respectively could be deduced.
18/11/1969
Metric Tons Mixed Juice 48.662 Lime 0.010 Stock (17.11.69) 22.986
-30/11/1969
Sugar Molasses Filter Cake
Metric Tons 1.541
42.699 0.194
Stock (30.11.69) Undm. Loss
26.772 0.452
Specimen calculation
(a) Mixed Juice: Tons of mixed juice %Pol 12.07 Tons of Pol %Brix 14.45 Tons of Brix % red. sug 0.46 Tons of red. sug. % chloride 0.088 Tons of chloride
(b) Filter Cake Tons of filter cake %pol 1.49 Tons of pol
13 391.207 1 616.319 1 935.029
61.466 11.843
459.430 6.845
71.658 71.658
Undm. CI- loss % CI- in mixed juice = 0.93% % chloride
Tons of Brix 8.195 (based on purity of m.j.)
Tons of red. sug. 0.231 (based on red. sug/sucrose ratio in m.j.)
0.026 Tons of chloride 0.119
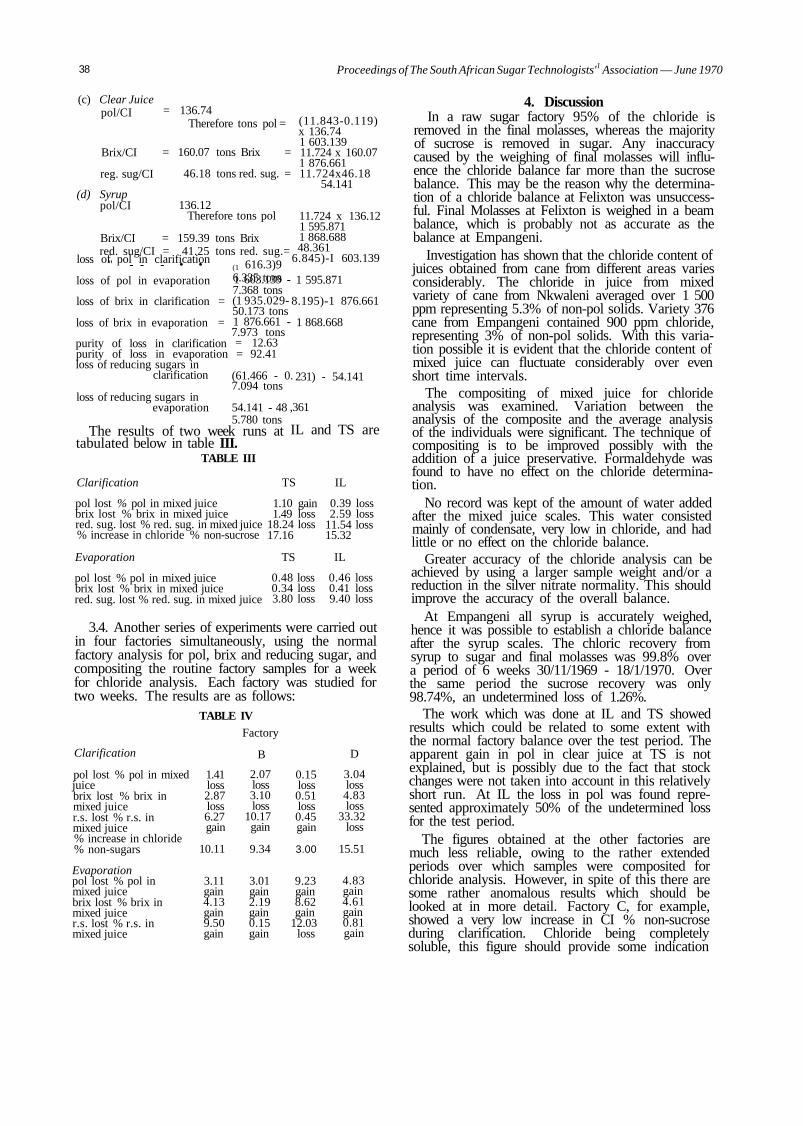
38 Proceedings of The South African Sugar Technologists'1 Association — June 1970
(c) Clear Juice pol/CI
Brix/CI
reg. sug/CI
= 136.74 Therefore tons pol =
= 160.07 tons Brix =
46.18 tons red. sug. =
(d) Syrup pol/CI
(11.843-0.119) x 136.74 1 603.139 11.724 x 160.07 1 876.661 11.724x46.18
54.141
136.12 Therefore tons pol
Brix/CI = 159.39 tons Brix red. sug/CI = 41.25 tons red. sug.=
" - - - • • (1 616.3)9 6.335 tons
loss of pol in clarification
loss of pol in evaporation
loss of brix in clarification =
loss of brix in evaporation =
1 603.139 -7.368 tons (1 935.029-50.173 tons 1 876.661 -7.973 tons = 12.63
11.724 x 136.12 1 595.871 1 868.688 48.361
6.845)-I 603.139
1 595.871
8.195)-1 876.661
1 868.668
purity of loss in clarification purity of loss in evaporation = 92.41 loss of reducing sugars in
clarification
loss of reducing sugars in evaporation
(61.466 - 0. 7.094 tons
54.141 - 48 5.780 tons
The results of two week runs at tabulated below in table III.
TABLE III
231) - 54.141
,361
IL and TS are
Clarification
pol lost % pol in mixed juice brix lost % brix in mixed juice red. sug. lost % red. sug. in mixed juice % increase in chloride % non-sucrose
Evaporation
pol lost % pol in mixed juice brix lost % brix in mixed juice red. sug. lost % red. sug. in mixed juice
TS
1.10 gain 1.49 loss
18.24 loss 17.16
TS
0.48 loss 0.34 loss 3.80 loss
IL
0.39 loss 2.59 loss
11.54 loss 15.32
IL
0.46 loss 0.41 loss 9.40 loss
3.4. Another series of experiments were carried out in four factories simultaneously, using the normal factory analysis for pol, brix and reducing sugar, and compositing the routine factory samples for a week for chloride analysis. Each factory was studied for two weeks. The results are as follows:
TABLE IV
Clarification
pol lost % pol in mixed juice brix lost % brix in mixed juice r.s. lost % r.s. in mixed juice % increase in chloride % non-sugars
Evaporation pol lost % pol in mixed juice brix lost % brix in mixed juice r.s. lost % r.s. in mixed juice
Factory
1.41 loss 2.87 loss 6.27 gain
10.11
3.11 gain 4.13 gain 9.50 gain
B
2.07 loss 3.10 loss
10.17 gain
9.34
3.01 gain 2.19 gain 0.15 gain
0.15 loss 0.51 loss 0.45 gain
3.00
9.23 gain 8.62 gain
12.03 loss
D
3.04 loss 4.83 loss
33.32 loss
15.51
4.83 gain 4.61 gain 0.81 gain
4. Discussion In a raw sugar factory 95% of the chloride is
removed in the final molasses, whereas the majority of sucrose is removed in sugar. Any inaccuracy caused by the weighing of final molasses will influence the chloride balance far more than the sucrose balance. This may be the reason why the determination of a chloride balance at Felixton was unsuccessful. Final Molasses at Felixton is weighed in a beam balance, which is probably not as accurate as the balance at Empangeni.
Investigation has shown that the chloride content of juices obtained from cane from different areas varies considerably. The chloride in juice from mixed variety of cane from Nkwaleni averaged over 1 500 ppm representing 5.3% of non-pol solids. Variety 376 cane from Empangeni contained 900 ppm chloride, representing 3% of non-pol solids. With this variation possible it is evident that the chloride content of mixed juice can fluctuate considerably over even short time intervals.
The compositing of mixed juice for chloride analysis was examined. Variation between the analysis of the composite and the average analysis of the individuals were significant. The technique of compositing is to be improved possibly with the addition of a juice preservative. Formaldehyde was found to have no effect on the chloride determination.
No record was kept of the amount of water added after the mixed juice scales. This water consisted mainly of condensate, very low in chloride, and had little or no effect on the chloride balance.
Greater accuracy of the chloride analysis can be achieved by using a larger sample weight and/or a reduction in the silver nitrate normality. This should improve the accuracy of the overall balance.
At Empangeni all syrup is accurately weighed, hence it was possible to establish a chloride balance after the syrup scales. The chloric recovery from syrup to sugar and final molasses was 99.8% over a period of 6 weeks 30/11/1969 - 18/1/1970. Over the same period the sucrose recovery was only 98.74%, an undetermined loss of 1.26%.
The work which was done at IL and TS showed results which could be related to some extent with the normal factory balance over the test period. The apparent gain in pol in clear juice at TS is not explained, but is possibly due to the fact that stock changes were not taken into account in this relatively short run. At IL the loss in pol was found represented approximately 50% of the undetermined loss for the test period.
The figures obtained at the other factories are much less reliable, owing to the rather extended periods over which samples were composited for chloride analysis. However, in spite of this there are some rather anomalous results which should be looked at in more detail. Factory C, for example, showed a very low increase in CI % non-sucrose during clarification. Chloride being completely soluble, this figure should provide some indication

Proceedings of The South African Sugar Technologists' Association — June 1970 39
of the insoluble non-sucrose removal in the filter-cake. The average for the six factories investigated was 11.74% increase in chloride % N-S, whereas at factory C it was only 3%. There is some indication here that the clarification station at this factory should be investigated.
Another example is the apparent reducing sugar loss at factory D. A loss of 33.32% in reducing sugars at this particular factory represented more than 200 tons. This loss was highly unlikely to have occurred in fact, and the indication is that' the analysis is suspect. Here again further investigation is warranted.
5. Conclusion If the technique of mixed juice compositing can be
improved, representative stock stamples taken and molasses weighing perfected, a highly accurate chloride balance should be achieved.
This method of investigating a factory balance shows promise, particularly with regard to pinpointing chemical losses of sucrose in particular areas of the factory. The techniques which have been used
in the investigations reported here were not sufficiently reliable to provide a 100% balance, but with suitable improvements in the current season it is hoped that the method can be perfected into a really useful tool in factory control.
6. Acknowledgements
The authors wish to thank the management and the personnel at the various factories involved for their assistance with sampling and analysis.
7. REFERENCES
1. Comrie, G. W., 1969. "Potentiometric Determination of Chlorides in Molasses", Proc. S. Afr. Sug. Technol. Ass. 43 (1969), 151-154 and discussion p. 155.
2. Davies, J. G., Yearwood, R. D. E., Foster, H. T., and Dunlop, J. W. T., 1942. "Undetected Losses during Evaporation and Pan Boiling", Sugar (1942), 37, 12, 29-33.
3. Zanni, V. 1951. "Determination of Sugar Losses in Juice Concentration, using the Chloride Method" (1951), Azucar, 3, 43-45.
For discussion on this Paper, see page 50.
•
40 Proceedings of The South African Sugar Technologists' Association — June 1970
FACTORY BALANCE SYMPOSIUM
A SOLIDS BALANCE INVESTIGATION By E. L. MULLER
Hulett's S.A. Sugar Mills and Estates Limited
Abstract This paper is an abridged version of a thesis which
was submitted to the Sugar Milling Research Institute in accordance with the requirements for the Sugar Technology Course.
The objectives of the thesis were to assess the magnitude and significance of errors inherent in the various methods of brix determination, and to investigate a method for calculating a true solids balance in a raw cane sugar factory. The methods of analysis and the facts revealed by the literature survey have been omitted from this paper.
Introduction Brix is a parameter of major importance to fac
tory control. This investigation was undertaken to assess the magnitude and significance of errors inherent in the various methods of brix determination.
A literature survey which was carried out revealed that a number of investigators throughout the world have looked into the problems associated with brix determinations. The effects of suspended solids, dilution, different techniques of oven drying, etc., have been related to the densimetric and refractometric methods of determining the dissolved solids in factory materials.
It might be justifiable to say that a comparison of methods for determining dissolved solids is unnecessary, since a vast amount of research has already been done in this field. Also, most investigators have been led to the same conclusions, that is, most methods for determining brix are influenced by factors such as suspended solids, non-sugars, etc., and that these factors introduce an error into factory control.
However, the erroneous influence that these factors have on factory calculations and performances has never been examined in any great detail. Examination in detail is therefore the aim and scope of the investigation.
The determination of total solids in factory materials thus enables a solids balance to be made. The procedure which has been adopted for this balance is based on:—
Solids Entering Factory Solids Leaving Factory
Total solids in Mixed Juice Solids in Filter Cake solids in Lime added Solids in Molasses solids in Phosphate
added Solids in Sugar solids in Flocculant
added solids in Bagacillo
added
Due to the relatively small quantity of moisture in the chemicals added, the weights of these materials, as recorded by the factory, have been used.
The investigation was carried out at Darnall where the vacuum flotation clarification process was in use.
The Brix Balance In other countries, e.g. Java, an attempt was made
to introduce a brix balance by assuming no loss of sucrose during clarification, other than in filter cake. Despite the shortcomings of this method as used in Java, it is applied in the Hulett mills and recently there was an occurence at Empangeni which proved its value beyond any doubt.
For a number of years, the "non-Sucrose Ratio" as defined by Perk',J has found a rather strong following.
Non-Sucrose Ratio=
Tons non-sucrose in final molasses + tons non-sucrose in sugar
Tons non-sucrose in mixed juice
Tons sucrose in mixed juice Tons sucrose in sugar Tons sucrose in molasses Tons sucrose in combined losses Tons brix in mixed juice Tons brix in sugar Tons brix in molasses Tons brix in combined losses
= J = S = M = L = ] = s = m = c
Then: (s+m—S—M)
Non-Sucrose Ratio= s+m+c—S—M—L
(s+m—S—M)
(s+m—S—M)+c—L
Substituting W=(s+m—S—M)
W Non-Sucrose Ratio =
W+c—L The value of W and L are determined fairly
accurately and, moreover, are more or less constant quantities. Obviously, variations in the non-sucrose ratio are caused by variations in "c" (tons brix in combined losses).
Proceedings of The South African Sugar Technologists' Association — June 1970 41
Assume: S =75 Normal factory with 2.35% s =76 loss in cake+undetermined, M = 8 89% B.H.R. L =2 40 purity final molasses m = 2 0
For a Non-Sucrose Ratio = 0.9.
W 13
W + c — L 13—2 + c c=3.44%
For a Non-Sucrose Ratio=0.8 W 13
W + c — L 13—2+c c=5.25%
It is therefore submitted that an evaluation of the brix loss will give a better understanding of factory performance than does the present non-sucrose ratio, although it is not suggested that the N-S ratio be discarded.
In the following report, one must differentiate between a brix balance and a solids balance as the latter includes all suspended (insoluble) solids.
Solids in Mixed Juice Solids in mixed juice is the starting point of the
solids balance and the accuracy of the balance therefore depends to a great extent on the determination of this factor.
Sampling of Mixed Juice The determination of total solids in mixed juice
entails two separate analyses. Firstly, dissolved solids on filtered juice, which can be found by a number of methods and, secondly, suspended solids. The accuracy of the latter determination is more dependent upon the sampling procedure than the actual method of analysis.
The mixed juice sampling device recommended for use in South African factories1 does not give a representative distribution of sand and other insoluble material in the final sample. Two reasons can be given for this:
(a) If there is not sufficient turbulence in the scale tank before it tips, most of the heavy suspended particles will settle to the bottom of the tank. When the tank empties the juice which reaches the sampling tube first, will contain the greater proportion of sand, yet will represent only an insignificant portion of the total sample.
(b) The tube itself can be compared to a D.S.M. screen, especially if the holes are canted to one side to regulate the quantity of juice obtained per tip. It must be remembered that the recommended tube' consists of 15 holes, each 3/32" diameter x 1" pitch. Thus, a large proportion of the sand is deflected away from the tube.
To obtain a representative hourly sample, an entirely new sampling device would have to be employed. However, at the time of the investigation no such device was available. The necessity for an hourly representative sample becomes apparent in the solids balance when one calculates the tons of total solids in mixed juice, i.e. Tons suspended solids+Tons dissolved solids.
The same problem exists when weighing out the juice for the analysis of suspended solids, i.e. the difficulty to ensure an even distribution of insoluble material in the 200 g taken.
At the time of the investigation, there remained no choice but to analyse the sample as received by the available system. More attention will be drawn to this at a later stage in this paper.
Solids in Other Material Added a. Lime
It is difficult to assess, from one week to the next, the quantity of lime consumed by the process. However a fairly accurate estimation can be made of the weight of lime used over a period of one month.
Also, the quantity of solids in lime added is relatively small compared to the total solids in mixed juice. (Solids in Lime % Solids in Mixed Juice= 0.4%).
Thus one can use the monthly estimated weight of lime without introducing any significant error in the solids balance.
b. Mono-Calcium Phosphate This material is delivered in bags of known weight,
and an accurate account of the number of bags used per shift is kept.
Solids in M.C.P. % Solids in Mixed Juice amounts to 0.17%. With an accurate monthly weight of M.C.P. available, the quantity of solids added in this material is easily arrived at.
c. Flocculant The addition of this material is likewise care
fully controlled, and amounts only to 0.004% of the solids in mixed juice.
Again the consumption of flocculant is known to the pound and this facilitates its use in the solids balance.
d. Bagacillo This material is added to the muds leaving the
clarifiers and although it was possible to measure the flow rate of the bagacillo in pounds per minute, a more reliable method of determining the quantity added had to be found.
The method finally decided upon is as follows: The dry bagacillo content of the mixed juice varies
only slightly from hour to hour. By analysing the mixed juice for dry bagacillo per cent a fairly accurate average can be found.
The same applies to the bagacillo content of the filter cake. Assuming that the bagacillo content of clear juice is negligible, the difference between bagacillo in filter cake and bagacillo in mixed juice will
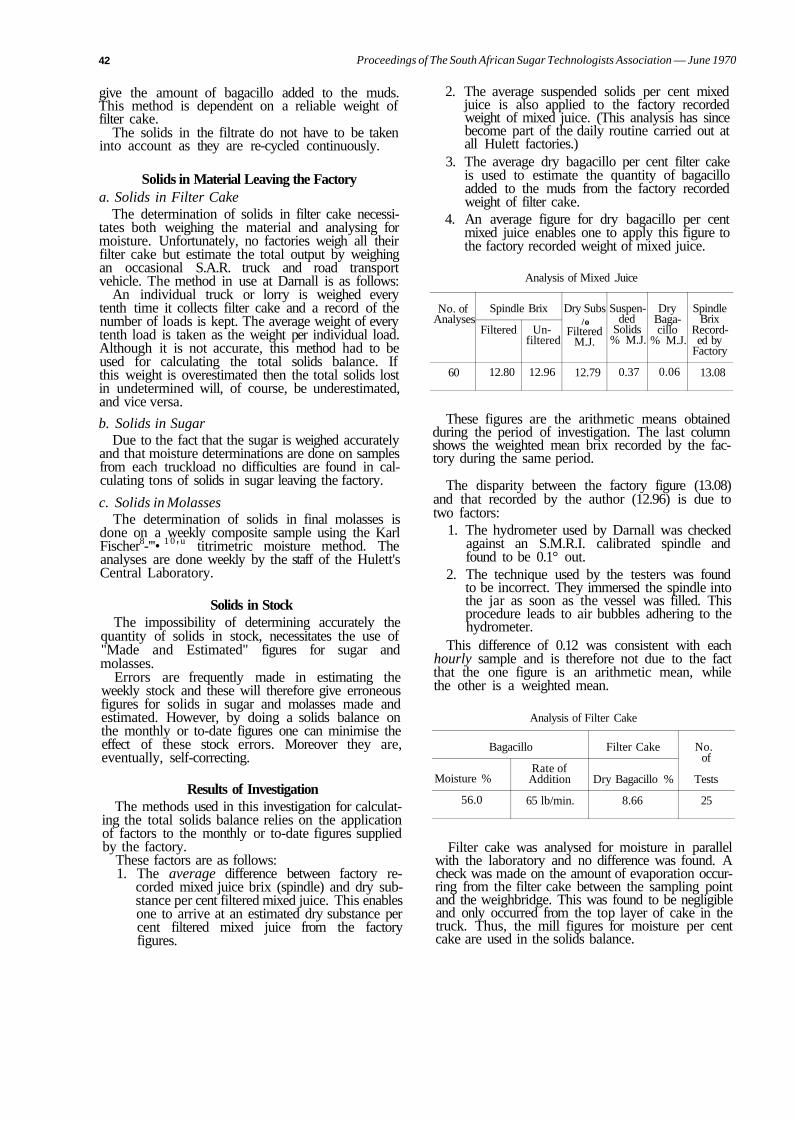
42 Proceedings of The South African Sugar Technologists Association — June 1970
2. The average suspended solids per cent mixed juice is also applied to the factory recorded weight of mixed juice. (This analysis has since become part of the daily routine carried out at all Hulett factories.)
3. The average dry bagacillo per cent filter cake is used to estimate the quantity of bagacillo added to the muds from the factory recorded weight of filter cake.
4. An average figure for dry bagacillo per cent mixed juice enables one to apply this figure to the factory recorded weight of mixed juice.
Analysis of Mixed .Juice
give the amount of bagacillo added to the muds. This method is dependent on a reliable weight of filter cake.
The solids in the filtrate do not have to be taken into account as they are re-cycled continuously.
Solids in Material Leaving the Factory a. Solids in Filter Cake
The determination of solids in filter cake necessitates both weighing the material and analysing for moisture. Unfortunately, no factories weigh all their filter cake but estimate the total output by weighing an occasional S.A.R. truck and road transport vehicle. The method in use at Darnall is as follows:
An individual truck or lorry is weighed every tenth time it collects filter cake and a record of the number of loads is kept. The average weight of every tenth load is taken as the weight per individual load. Although it is not accurate, this method had to be used for calculating the total solids balance. If this weight is overestimated then the total solids lost in undetermined will, of course, be underestimated, and vice versa.
b. Solids in Sugar Due to the fact that the sugar is weighed accurately
and that moisture determinations are done on samples from each truckload no difficulties are found in calculating tons of solids in sugar leaving the factory.
c. Solids in Molasses The determination of solids in final molasses is
done on a weekly composite sample using the Karl Fischer8-'''• 1 0 ' u titrimetric moisture method. The analyses are done weekly by the staff of the Hulett's Central Laboratory.
Solids in Stock The impossibility of determining accurately the
quantity of solids in stock, necessitates the use of "Made and Estimated" figures for sugar and molasses.
Errors are frequently made in estimating the weekly stock and these will therefore give erroneous figures for solids in sugar and molasses made and estimated. However, by doing a solids balance on the monthly or to-date figures one can minimise the effect of these stock errors. Moreover they are, eventually, self-correcting.
Results of Investigation The methods used in this investigation for calculat
ing the total solids balance relies on the application of factors to the monthly or to-date figures supplied by the factory.
These factors are as follows: 1. The average difference between factory re
corded mixed juice brix (spindle) and dry substance per cent filtered mixed juice. This enables one to arrive at an estimated dry substance per cent filtered mixed juice from the factory figures.
No. of Analyses
60
Spindle Brix
Filtered
12.80
Un-filtered
12.96
Dry Subs /o
Filtered M.J.
12.79
Suspended
Solids % M.J.
0.37
Dry Bagacillo
% M.J.
0.06
Spindle Brix
Recorded by
Factory
13.08
These figures are the arithmetic means obtained during the period of investigation. The last column shows the weighted mean brix recorded by the factory during the same period.
The disparity between the factory figure (13.08) and that recorded by the author (12.96) is due to two factors:
1. The hydrometer used by Darnall was checked against an S.M.R.I. calibrated spindle and found to be 0.1° out.
2. The technique used by the testers was found to be incorrect. They immersed the spindle into the jar as soon as the vessel was filled. This procedure leads to air bubbles adhering to the hydrometer.
This difference of 0.12 was consistent with each hourly sample and is therefore not due to the fact that the one figure is an arithmetic mean, while the other is a weighted mean.
Analysis of Filter Cake
Bagacillo
Moisture %
56.0
Rate of Addition
65 lb/min.
Filter Cake
Dry Bagacillo %
8.66
No. of
Tests
25
Filter cake was analysed for moisture in parallel with the laboratory and no difference was found. A check was made on the amount of evaporation occurring from the filter cake between the sampling point and the weighbridge. This was found to be negligible and only occurred from the top layer of cake in the truck. Thus, the mill figures for moisture per cent cake are used in the solids balance.
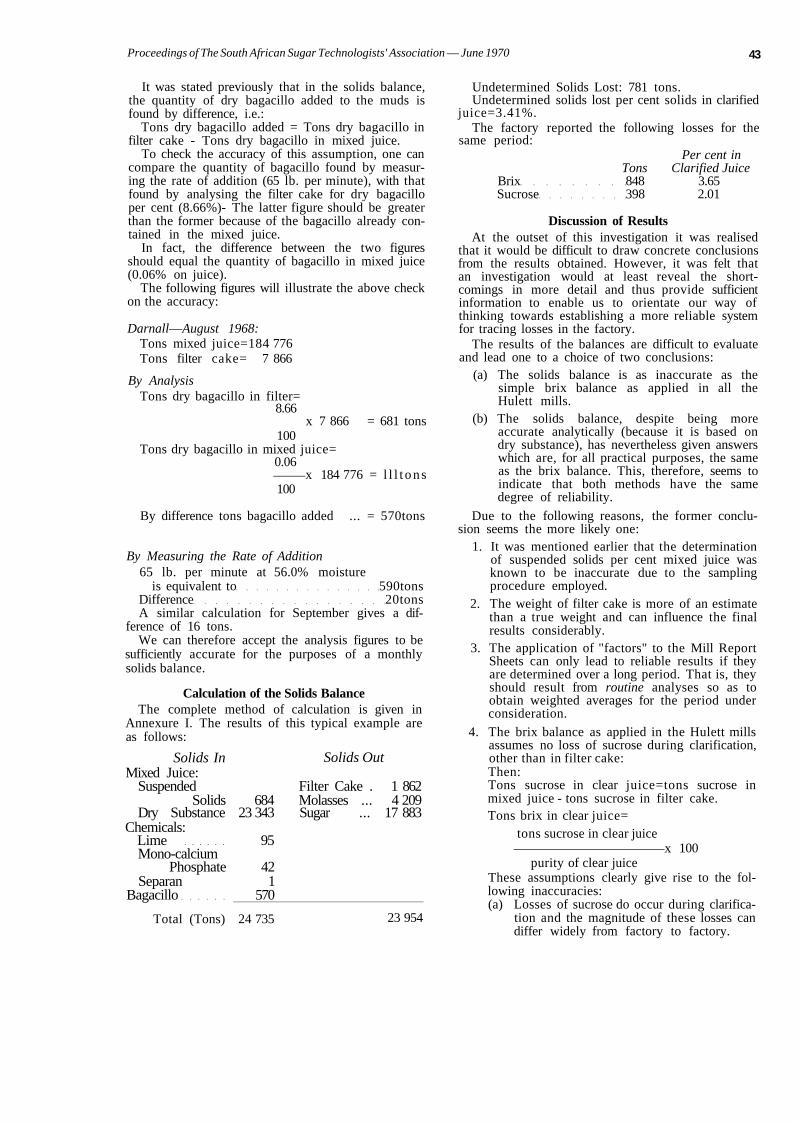
Proceedings of The South African Sugar Technologists' Association — June 1970 43
It was stated previously that in the solids balance, the quantity of dry bagacillo added to the muds is found by difference, i.e.:
Tons dry bagacillo added = Tons dry bagacillo in filter cake - Tons dry bagacillo in mixed juice.
To check the accuracy of this assumption, one can compare the quantity of bagacillo found by measuring the rate of addition (65 lb. per minute), with that found by analysing the filter cake for dry bagacillo per cent (8.66%)- The latter figure should be greater than the former because of the bagacillo already contained in the mixed juice.
In fact, the difference between the two figures should equal the quantity of bagacillo in mixed juice (0.06% on juice).
The following figures will illustrate the above check on the accuracy:
Darnall—August 1968: Tons mixed juice=184 776 Tons filter cake= 7 866
By Analysis Tons dry bagacillo in filter=
8.66
100 x 7 866 = 681 tons
Tons dry bagacillo in mixed juice= 0.06
x 184 776 = l l l t o n s 100
By difference tons bagacillo added ... = 570tons
By Measuring the Rate of Addition 65 lb. per minute at 56.0% moisture
is equivalent to 590tons Difference 20tons A similar calculation for September gives a dif
ference of 16 tons. We can therefore accept the analysis figures to be
sufficiently accurate for the purposes of a monthly solids balance.
Calculation of the Solids Balance The complete method of calculation is given in
Annexure I. The results of this typical example are as follows:
Solids In Mixed Juice:
Suspended Solids
Dry Substance Chemicals:
Lime Mono-calcium
Phosphate Separan
Bagacillo
684 23 343
95
42 1
570
Solids Out
Filter Cake . 1 862 Molasses ... 4 209 Sugar ... 17 883
Total (Tons) 24 735 23 954
Undetermined Solids Lost: 781 tons. Undetermined solids lost per cent solids in clarified
juice=3.41%. The factory reported the following losses for the
same period: Per cent in
Tons Clarified Juice Brix 848 3.65 Sucrose 398 2.01
Discussion of Results At the outset of this investigation it was realised
that it would be difficult to draw concrete conclusions from the results obtained. However, it was felt that an investigation would at least reveal the shortcomings in more detail and thus provide sufficient information to enable us to orientate our way of thinking towards establishing a more reliable system for tracing losses in the factory.
The results of the balances are difficult to evaluate and lead one to a choice of two conclusions:
(a) The solids balance is as inaccurate as the simple brix balance as applied in all the Hulett mills.
(b) The solids balance, despite being more accurate analytically (because it is based on dry substance), has nevertheless given answers which are, for all practical purposes, the same as the brix balance. This, therefore, seems to indicate that both methods have the same degree of reliability.
Due to the following reasons, the former conclusion seems the more likely one:
1. It was mentioned earlier that the determination of suspended solids per cent mixed juice was known to be inaccurate due to the sampling procedure employed.
2. The weight of filter cake is more of an estimate than a true weight and can influence the final results considerably.
3. The application of "factors" to the Mill Report Sheets can only lead to reliable results if they are determined over a long period. That is, they should result from routine analyses so as to obtain weighted averages for the period under consideration.
4. The brix balance as applied in the Hulett mills assumes no loss of sucrose during clarification, other than in filter cake: Then: Tons sucrose in clear juice=tons sucrose in mixed juice - tons sucrose in filter cake. Tons brix in clear juice=
tons sucrose in clear juice x 100
purity of clear juice These assumptions clearly give rise to the following inaccuracies: (a) Losses of sucrose do occur during clarifica
tion and the magnitude of these losses can differ widely from factory to factory.
44 Proceedings of The South African Sugar Technologists' Association—June 1970
(b) ft is known that the presence of large quantities of insoluble solids cause an error in the determination of sucrose in mixed juice, and this error is carried forward into the brix balance.
(c) An apparent purity of clear juice (i.e. pol/ brix ratio) is used to calculate the tons of brix in clear juice.
It would appear that our measuring tools have become too crude for this investigation and that the increase in factory efficiency has gone beyond the point of reliable information.
Conclusions Although a step in the right direction has been
taken by using dry substance instead of specific gravities and refractive indices, the solids balance, as presented in this report, requires refinement.
Empangeni Mill now lends itself to a more reliable investigation due to the following:
1. A sampling device has been designed and installed at Empangeni to give a representative sample of mixed juice for the determination of suspended solids.
2. A rilTler apparatus has been designed and tested to enable sub-sampling of the mixed juice sample.
3. Empangeni has installed a Servo-Balans to weigh syrup.
A point to bear in mind is the possible introduction of the new cane payment system in South Africa. This system would make the water scales available for syrup weighing and once the syrup sampling problems have been solved, one would know what quantity of material is entering the boiling house.
If any further work is envisaged on this project, the following recommendations are tentatively put forward:
1. All analyses must be done on a routine basis so as to obtain weighted averages.
2. Filter cake must be weighed. 3. Correct sampling procedures must be adopted. 4. Syrup scales must be installed. 5. At present, it is doubtful whether any existing
laboratory staff could handle the extra work load entailed and one would therefore require extra staff.
In view of these last-mentioned factors, an analogy to Lost Absolute Juice % Fibre is being sought for application in the boiling house. That is, one must attempt to express the sucrose losses in terms of a substance which remains a constant quantity (other than that which is actually lost) such as fibre in the milling tandem. At present, an investigation is being conducted by Hulett's Research and Development Department into the feasibility of a chloride ion balance.
If this proves successful, it will be possible to express sucrose as a ratio to chloride in all factory materials thus enabling one to pinpoint any losses.
Acknowledgements I wish to place on record my thanks to the Direc
tors of Hulett's S.A. Sugar Mills and Estates Limited for permission to publish process records and other data used in this paper.
I am particularly indebted to Mr. J. B. Alexander, Research and Development Consultant, and to Mr. R P. Jennings, Chief Research Chemist, for their valued counsel on many occasions.
References Although all these references are not used in this abridged
report, they are given for the convenience of those wishing to make use of them.
1. Laboratory Manual for South African Sugar Factories, S.A.S.T.A., 1962.
2. Clayton, J. L. "Brix and Purity of Raw Juices." Proc. 26th Conference, Q.S.S.C.T., 1959, p. 131.
3. Deicke, R. "Preliminary Investigations into the Influence of Suspended Solids on the Brix of First Expressed Juice." Proc. 25th Conference, Q.S.S.C.T., 1958, p. 159.
4. Laboratory Manual for Queensland Sugar Mills, 4th Edition, Bur Sug. Expt. Stns., 1961, p. 57.
5. Clayton, J. L. "Refractometer Brix for Factory Control." Proc. 29th Conference, Q.S.S.C.T., 1962, p. 235.
6. Jensen, E. D. "A Comparison of Methods for the Determination of Dissolved Solids." Proc. 29th Conference, Q.S.S.C.T., 1962, p. 227.
7. Graham, W. S., and MacGillivray, A. W. "The Determination of Brix." Proc. 43rd Congress, S.A.S.T.A., 1969.
8. Honig, P., and Sattler, L. "Determination of Water in Molasses." I.S.J., Vol. LVIII, 1956, p. 92.
9. Douwes Dekker, K. "The Composition of South African Final Molasses." Proc. 31st Congress, S.A.S.T.A., 1957, p. 92.
10. Zerban, F. W. "Determination of Moisture in Sugar Solutions with the Karl Fischer Reagent." Ind. Eng. Chem., Anal. Ed., Feb. 1946, p. 138.
11. Oosthuizen, D. M. "The Determination of Water in Raw Sugar Using the Karl Fischer Method." Proc. 43rd Congress, S.A.S.T.A. 1969.
12. Relf, E. T. "Determination of Dry Substance in Molasses and Massecuites." Proc. 25th Conference, Q.S.S.C.T., 1958, p. 189.
13. Smart, S. G., and Mitchell, J. J. I.C.U.M.S.A. Report, I.S.J. 52, p. 244.
14. Vandenberg, H. "The Application of a 'Dirt-Correction' Factor when using Juice Scales." Proc. 20th Conference, Q.S.S.C.T., 1953, p. 95.
15. Douwes Dekker, K., and Laubscher, P. J. "The Effect of Removing Bagacillo from Mixed Juice on Sugar Manufacture." Proc. 25th Congress, S.A.S.T.A., 1951, p. 57.
16. Anon. "Comparison of the Results obtained on 'Muddy' juice samples by the Official Jackson and Gillis method No. 4 for the determination of sucrose in Mixed Juice with the Normal Weight Method." Annual Report, Sugar Milling Research Institute (S.A.), 1955, p. 15.
17. Smith, N. "1936 Seasonal Investigation on Hot and Cold Liming." Bur. Sug. Expt. Stns. Tech. Comm., No. 3, 1937.
18. Wright P. G. "Removal of Suspended Solids from Mixed Juice." Proc. 26th Conference, Q.S.S.C.T., 1959, p. 177.
19. Perk, Charles G. M. "Forty-first Annual Summary of Laboratory Results." Proc. 40th Congress, S.A.S.T.A., 1966.
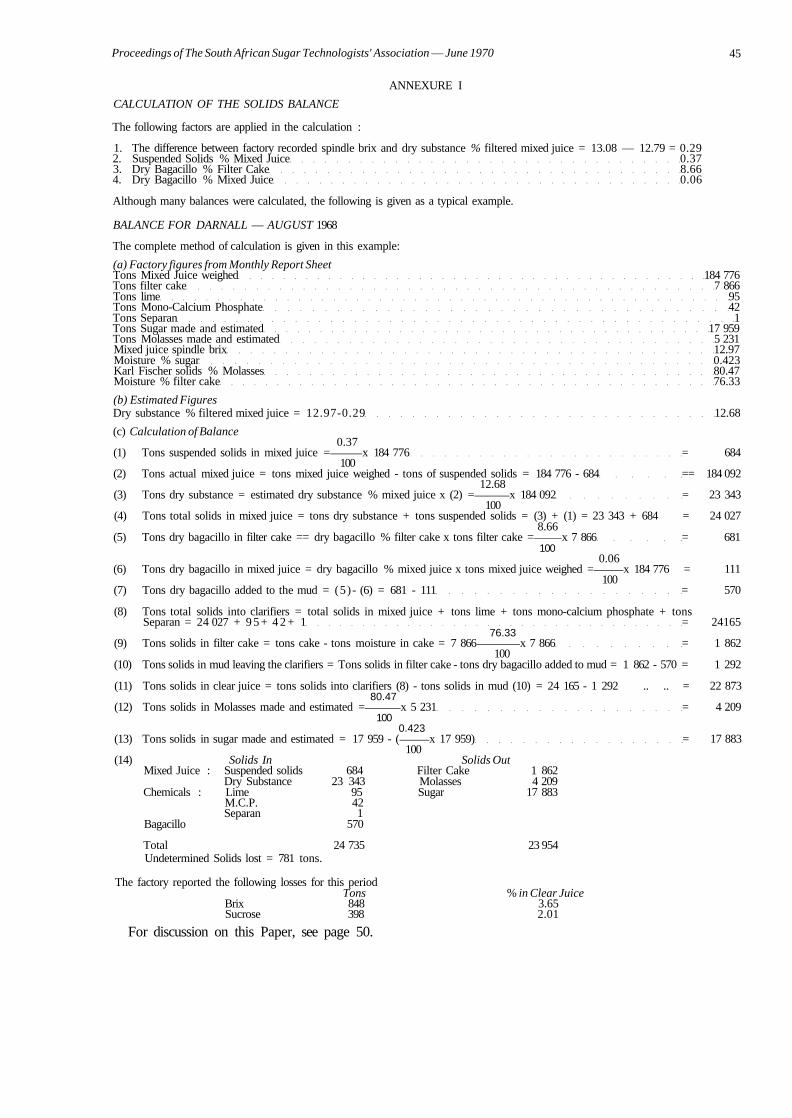
Proceedings of The South African Sugar Technologists' Association — June 1970 45
ANNEXURE I
CALCULATION OF THE SOLIDS BALANCE
The following factors are applied in the calculation :
1. The difference between factory recorded spindle brix and dry substance % filtered mixed juice = 13.08 — 12.79 = 0.29 2. Suspended Solids % Mixed Juice 0.37 3. Dry Bagacillo % Filter Cake 8.66 4. Dry Bagacillo % Mixed Juice 0.06
Although many balances were calculated, the following is given as a typical example.
BALANCE FOR DARNALL — AUGUST 1968
The complete method of calculation is given in this example:
(a) Factory figures from Monthly Report Sheet Tons Mixed Juice weighed 184 776 Tons filter cake 7 866 Tons lime 95 Tons Mono-Calcium Phosphate 42 Tons Separan 1 Tons Sugar made and estimated 17 959 Tons Molasses made and estimated 5 231 Mixed juice spindle brix 12.97 Moisture % sugar 0.423 Karl Fischer solids % Molasses 80.47 Moisture % filter cake 76.33
(b) Estimated Figures Dry substance % filtered mixed juice = 12.97-0.29 12.68
(c) Calculation of Balance 0.37
(1) Tons suspended solids in mixed juice = x 184 776 = 684 100
(2) Tons actual mixed juice = tons mixed juice weighed - tons of suspended solids = 184 776 - 684 == 184 092 12.68
(3) Tons dry substance = estimated dry substance % mixed juice x (2) = x 184 092 = 23 343 100
(4) Tons total solids in mixed juice = tons dry substance + tons suspended solids = (3) + (1) = 23 343 + 684 = 24 027 8.66
(5) Tons dry bagacillo in filter cake == dry bagacillo % filter cake x tons filter cake = x 7 866 = 681 100
0.06 (6) Tons dry bagacillo in mixed juice = dry bagacillo % mixed juice x tons mixed juice weighed = x 184 776 = 111
100 (7) Tons dry bagacillo added to the mud = (5)- (6) = 681 - 111 = 570
(8) Tons total solids into clarifiers = total solids in mixed juice + tons lime + tons mono-calcium phosphate + tons Separan = 24 027 + 9 5 + 4 2 + 1 = 24165
76.33 (9) Tons solids in filter cake = tons cake - tons moisture in cake = 7 866 x 7 866 = 1 862
100 (10) Tons solids in mud leaving the clarifiers = Tons solids in filter cake - tons dry bagacillo added to mud = 1 862 - 570 = 1 292
(11) Tons solids in clear juice = tons solids into clarifiers (8) - tons solids in mud (10) = 24 165 - 1 292 .. .. = 22 873 80.47
(12) Tons solids in Molasses made and estimated = x 5 231 = 4 209 100
0.423 (13) Tons solids in sugar made and estimated = 17 959 - ( x 17 959) = 17 883
100 (14) Solids In Solids Out
Mixed Juice : Suspended solids 684 Filter Cake 1 862 Dry Substance 23 343 Molasses 4 209
Chemicals : Lime 95 Sugar 17 883 M.C.P. 42 Separan 1
Bagacillo 570
Total 24 735 23 954 Undetermined Solids lost = 781 tons.
The factory reported the following losses for this period Tons % in Clear Juice
Brix 848 3.65 Sucrose 398 2.01
For discussion on this Paper, see page 50.
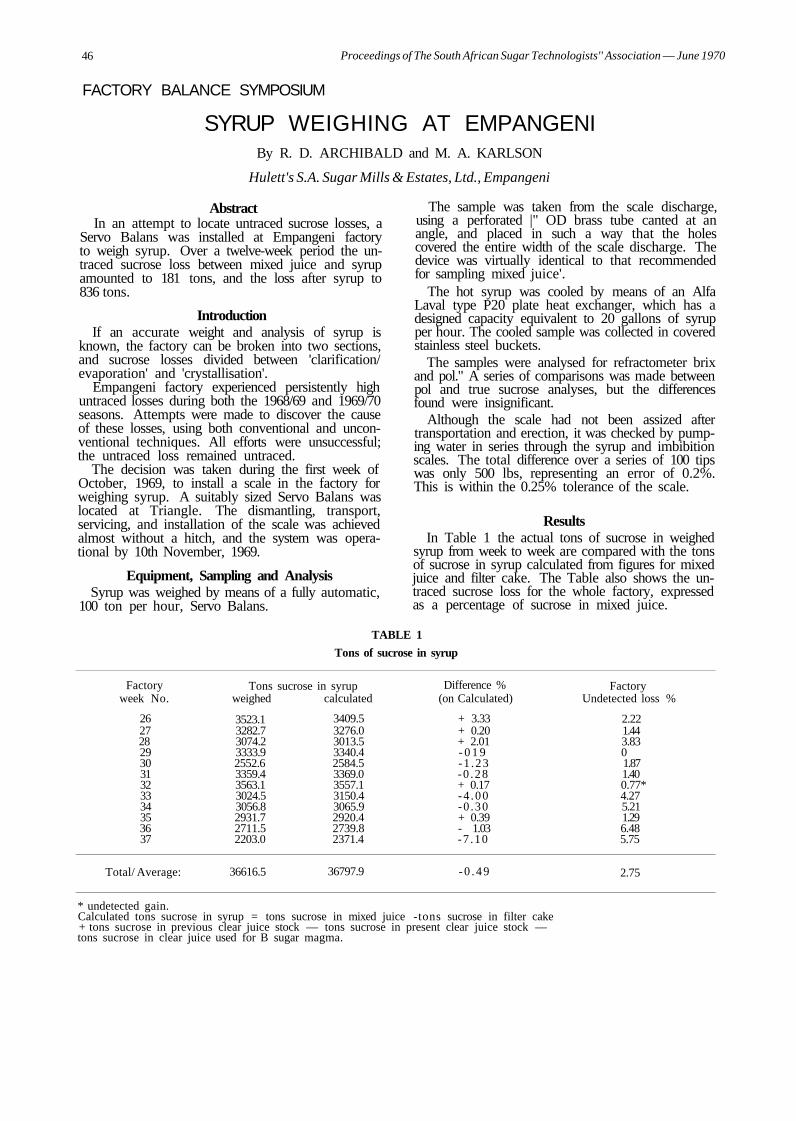
46 Proceedings of The South African Sugar Technologists'' Association — June 1970
FACTORY BALANCE SYMPOSIUM
SYRUP WEIGHING AT EMPANGENI By R. D. ARCHIBALD and M. A. KARLSON
Hulett's S.A. Sugar Mills & Estates, Ltd., Empangeni
Abstract In an attempt to locate untraced sucrose losses, a
Servo Balans was installed at Empangeni factory to weigh syrup. Over a twelve-week period the untraced sucrose loss between mixed juice and syrup amounted to 181 tons, and the loss after syrup to 836 tons.
Introduction If an accurate weight and analysis of syrup is
known, the factory can be broken into two sections, and sucrose losses divided between 'clarification/ evaporation' and 'crystallisation'.
Empangeni factory experienced persistently high untraced losses during both the 1968/69 and 1969/70 seasons. Attempts were made to discover the cause of these losses, using both conventional and unconventional techniques. All efforts were unsuccessful; the untraced loss remained untraced.
The decision was taken during the first week of October, 1969, to install a scale in the factory for weighing syrup. A suitably sized Servo Balans was located at Triangle. The dismantling, transport, servicing, and installation of the scale was achieved almost without a hitch, and the system was operational by 10th November, 1969.
Equipment, Sampling and Analysis Syrup was weighed by means of a fully automatic,
100 ton per hour, Servo Balans.
The sample was taken from the scale discharge, using a perforated |" OD brass tube canted at an angle, and placed in such a way that the holes covered the entire width of the scale discharge. The device was virtually identical to that recommended for sampling mixed juice'.
The hot syrup was cooled by means of an Alfa Laval type P20 plate heat exchanger, which has a designed capacity equivalent to 20 gallons of syrup per hour. The cooled sample was collected in covered stainless steel buckets.
The samples were analysed for refractometer brix and pol." A series of comparisons was made between pol and true sucrose analyses, but the differences found were insignificant.
Although the scale had not been assized after transportation and erection, it was checked by pumping water in series through the syrup and imbibition scales. The total difference over a series of 100 tips was only 500 lbs, representing an error of 0.2%. This is within the 0.25% tolerance of the scale.
Results In Table 1 the actual tons of sucrose in weighed
syrup from week to week are compared with the tons of sucrose in syrup calculated from figures for mixed juice and filter cake. The Table also shows the untraced sucrose loss for the whole factory, expressed as a percentage of sucrose in mixed juice.
TABLE 1
Tons of sucrose in syrup
Factory week No.
26 27 28 29 30 31 32 33 34 35 36 37
Total/ Average:
Tons weighed
3523.1 3282.7 3074.2 3333.9 2552.6 3359.4 3563.1 3024.5 3056.8 2931.7 2711.5 2203.0
36616.5
sucrose in syrup calculated
3409.5 3276.0 3013.5 3340.4 2584.5 3369.0 3557.1 3150.4 3065.9 2920.4 2739.8 2371.4
36797.9
Difference % (on Calculated)
+ 3.33 + 0.20 + 2.01 - 0 1 9 -1 .23 -0 .28 + 0.17 -4 .00 -0 .30 + 0.39 - 1.03 -7 .10
- 0 . 4 9
Factory Undetected loss %
2.22 1.44 3.83 0 1.87 1.40 0.77* 4.27 5.21 1.29 6.48 5.75
2.75
* undetected gain. Calculated tons sucrose in syrup = tons sucrose in mixed juice -tons sucrose in filter cake + tons sucrose in previous clear juice stock — tons sucrose in present clear juice stock — tons sucrose in clear juice used for B sugar magma.

Proceedings of The South African Sugar Technologists' Association — June 1970 47
Discussion Over a twelve-week period, the tonnage of sucrose
in mixed juice was 36,970 tons. Of this amount 1,017 tons was lost 'untraced'. ? * -*- .;"
Over the same period the difference between the weighed and calculated tonnage of sucrose in syrup was 181 tons. £>- ^ *V
It would appear that, although there is some loss of sucrose prior to the syrup scale, a more substantial loss occurs during the crystallisation process. Over the period in question the untraced loss of sucrose after the syrup scale amounted to 836 tons, an average of 70 tons per week.
Routine laboratory measurements showed that mixed juice entering the factory during the period from week 26 to week 37 contained 1,431 tons of suspended matter. This inflated the tons of sucrose in mixed juice by 160 tons. Because of an inefficient sampling method this figure is certainly an underestimate, but even so, suspended matter accounts for
over 88% of the 'untraced sucrose loss' before the syrup scale. Chemical losses of sucrose in the clari-fiers must also be considered.
Losses during crystallisation are less easy to explain. The answer may well lie in the destruction of sucrose in the crystallisers themselves, and to a lesser extent in the pans. The danger of losses of this type was stressed by Mr. Frank Chapman at a recent meeting of this Association.
The week-to-week fluctuations in the differences between weighed and calculated sucrose in syrup are a cause for concern. This matter will be investigated during the 1970/71 season, both at Empangeni and at Amatikulu, where it is hoped to install Hulett's second syrup scale.
Reference 1. Laboratory Manual for South African Sugar Factories,
published (1962) by S. Afr. Sug. Technol. Ass. pp. 33-34.
For discussion on this Paper, see page 50.
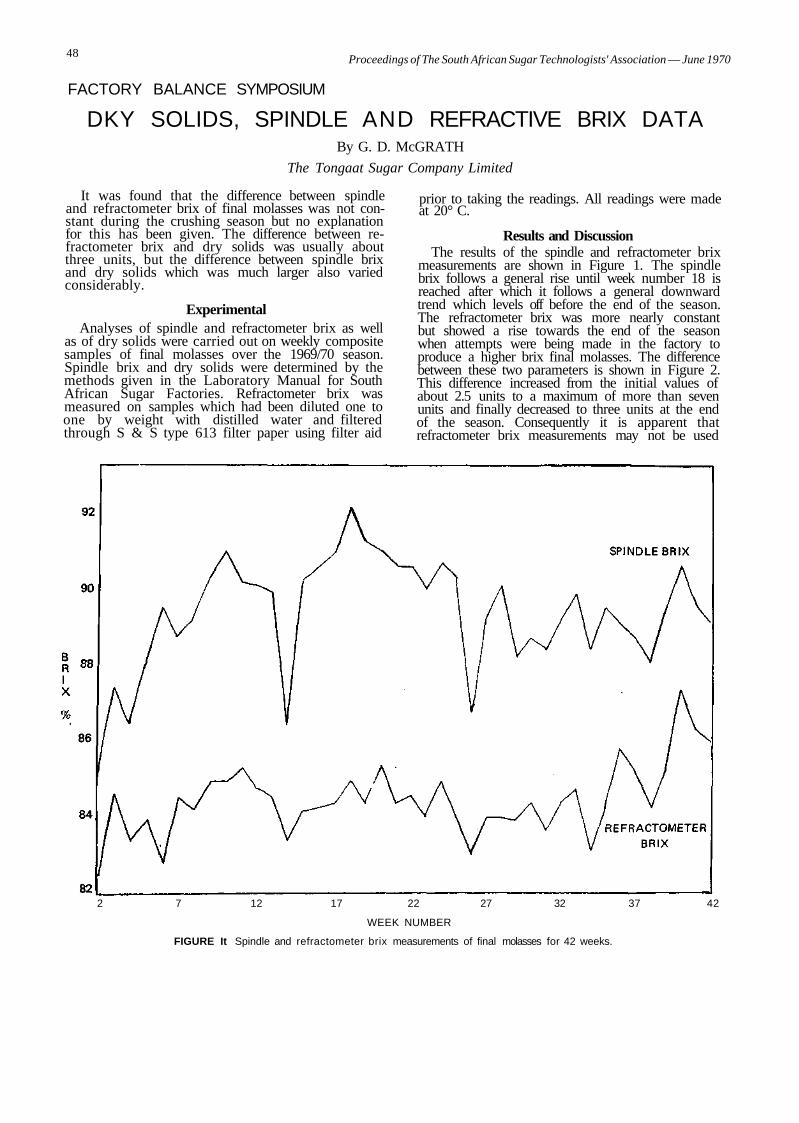
48 Proceedings of The South African Sugar Technologists' Association — June 1970
FACTORY BALANCE SYMPOSIUM
DKY SOLIDS, SPINDLE AND REFRACTIVE BRIX DATA By G. D. McGRATH
The Tongaat Sugar Company Limited
prior to taking the readings. All readings were made at 20° C.
Results and Discussion The results of the spindle and refractometer brix
measurements are shown in Figure 1. The spindle brix follows a general rise until week number 18 is reached after which it follows a general downward trend which levels off before the end of the season. The refractometer brix was more nearly constant but showed a rise towards the end of the season when attempts were being made in the factory to produce a higher brix final molasses. The difference between these two parameters is shown in Figure 2. This difference increased from the initial values of about 2.5 units to a maximum of more than seven units and finally decreased to three units at the end of the season. Consequently it is apparent that refractometer brix measurements may not be used
2 7 12 17 22 27 32 37 42
WEEK NUMBER
FIGURE It Spindle and refractometer brix measurements of final molasses for 42 weeks.
It was found that the difference between spindle and refractometer brix of final molasses was not constant during the crushing season but no explanation for this has been given. The difference between refractometer brix and dry solids was usually about three units, but the difference between spindle brix and dry solids which was much larger also varied considerably.
Experimental Analyses of spindle and refractometer brix as well
as of dry solids were carried out on weekly composite samples of final molasses over the 1969/70 season. Spindle brix and dry solids were determined by the methods given in the Laboratory Manual for South African Sugar Factories. Refractometer brix was measured on samples which had been diluted one to one by weight with distilled water and filtered through S & S type 613 filter paper using filter aid
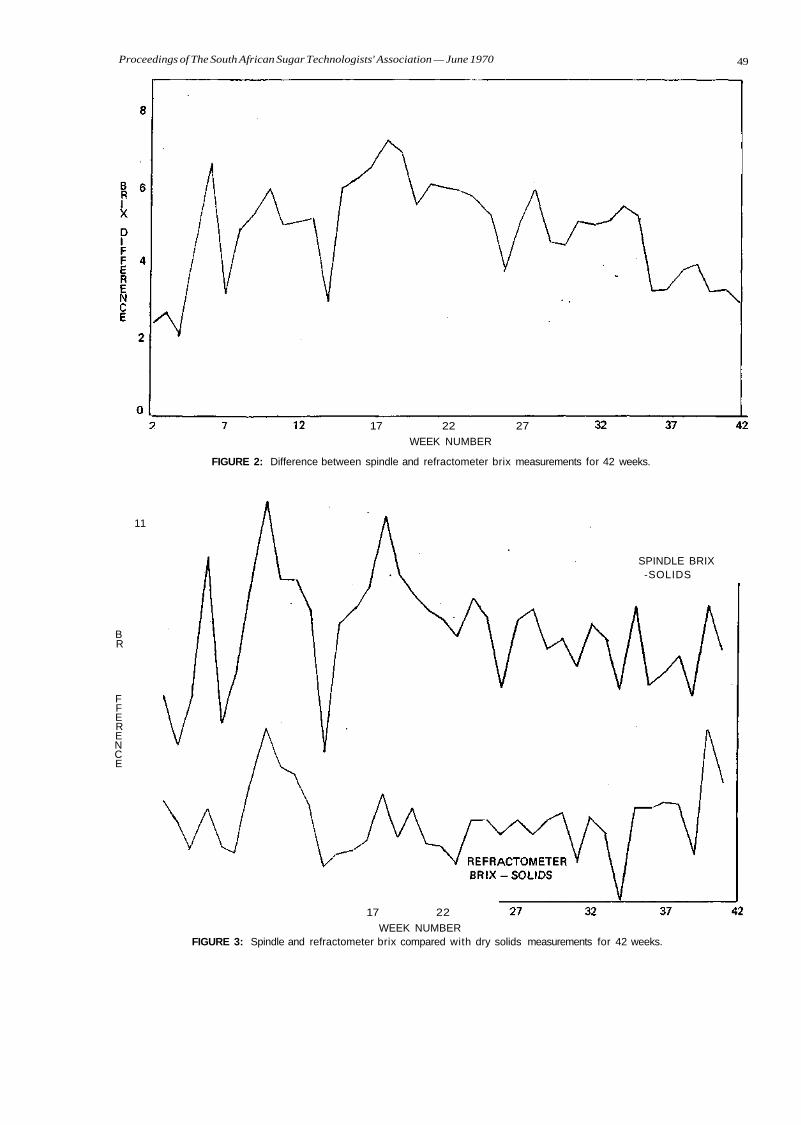
Proceedings of The South African Sugar Technologists' Association — June 1970 49
17 22 27
WEEK NUMBER
FIGURE 2: Difference between spindle and refractometer brix measurements for 42 weeks.
11
B R
F F E R E N C E
SPINDLE BRIX -SOLIDS
17 22
WEEK NUMBER FIGURE 3: Spindle and refractometer brix compared with dry solids measurements for 42 weeks.

50 Proceedings of The South African Sugar Technologists' Association —June 1970
to control the brix of final molasses within specifications which are defined in terms of spindle brix.
Attempts have been made to relate the magnitude of the difference between spindle and refractometer brix with properties of the molasses such as purity, reducing sugars content, non-sugars content, etc., but no clear pattern has emerged.
Finally the brix data are compared with dry solids in Figure 3. Over a large part of the season the difference between refractometer brix and dry solids remained close to three units but the difference between spindle brix and dry solids was very much greater and also showed bigger variations in this difference.
Discussion In the non-sucrose balance the non-sugar re
moval during clarification is normally not take'n into account. However, it is considered that defecation is mainly a removal of suspended solids and that any removal of soluble non-sugars is negligible. For this reason a gap in the non-sucrose balance is most likely due to analytical errors, which are at present still unknown.
The reliability of our present data could be checked by applying the Monte Carlo technique, in which the actual data are compared with a randomly generated uniform distribution. If the practical results are of the same order as those obtained from the randomly generated distribution the results can be regarded as valueless.
Consideration should be given to whether the sucrose balance or the brix balance shows the greater inaccuracy. At present the latter is the most suspect, but research will be carried out into the isotope dilution method and the pol determinations will be compared with the sucrose value obtained by this new technique.
Recently the factory balances for brix and sucrose have been compared with the chloride balance. The chloride determination itself was considered sufficiently accurate by most investigators, but the largest errors are likely to be in the weighing and sampling of molasses. This has to be very reliable as 95% of the chloride ion leaves the factory in the molasses.
If the brix determinations are carried out by spindle measurement, the non-sucrose ratio is approximately 80%. Using the refractometer, which is considered to be more accurate, the value obtained drops to 70% and even lower when using dry solids
determinations. This is a clear indication that the analytical methods are not fully reliable.
At the moment non-sucrose balances are related to mixed juice, but the values obtained will vary with the suspended matter. For this reason it might be decided in future to use only filtered mixed juice for analyses.
In reporting data, too many dedcimal places should not be given, particularly if the accuracy of the analysis is considered doubtful.
In connection with the syrup weighing at Empan-geni there appear to be deviations of more than 1 % between juice and syrup. These differences obviously cannot be explained by wrong stock taking and sampling errors are most likely.
If the non-sucrose ratio is expressed in terms of monetary value it can be stated that 1 % absolute is equal to R0.08 per ton of sugar, which is high compared to bonuses or penalties for sugar quality, which are of the order of R0.02 per ton of sugar. For this reason more knowledge on the determination or meaning of the non-sucrose ratio is important. In Hulett's factories the figure varies between 67-89%.
According to Tate and Lyle, sucrose in molasses is on the average 3% absolute too high if compared with the C14 technique.
If this is correct the non-sucrose balance will improve, but the undetermined losses will increase.
Kestoses are dextra rotrary and show identical behaviours in acid and enzymic hydrolysis.
Inversion cannot be proved from reducing sugar ratio as this normally decreases during the process in the factory but other sucrose degradation might take place. It is, however, possible to determine the effect of retention time of juice on sucrose concentration or pol in laboratory experiments. This can be done under variable conditions of time, temperature and pH.
At Empangeni it was indicated that losses occurred after the syrup stage. For this reason more investigations have to be carried out into sucrose losses during boiling and crystallizing. In the refinery of Hulsar, A-massecuites showed a significant relation between the temperature at which the strike was dropped and the drop in purity of massecuite during crystallization. The same result was found at Jaag-baan for C-massecuite.
It is the opinion of Tate and Lyle Technical Services that a large part of the sucrose losses in South African factories takes place during the long retention of crystallized products.
Proceedings of The South African Sugar Technologists' Association — June 1970 51
SOME IMPRESSIONS OF THE SUGAR INDUSTRIES OF MAURITIUS AND REUNION
By J. R. GUNN
The Tongaat Sugar Company Limited
During September 1969 the author visited both Mauritius with peaks not much higher than 1 000 latest technical developments on those two islands. The first comment that must be made is that at both places the hospitality of the officials of the sugar companies is overwhelming and there is real evidence of great progress in their industries. There is also a tremendous contrast between the two islands both in geophysical nature and in economic background. Reunion, with its tallest peak of 3 069 metres, has a very high labour wage whereas Mauritius and Reunion for a short survey of the metres still benefits from relatively lower labour costs. Sugar from Reunion is sold in the European Common Market at a high price because that island is considered to be part of metropolitan France and, of course, at the moment, Mauritius has the advantage of British Commonwealth preference price.
Milling
On both islands the cane is delivered to the mills in a spotless trash-free condition and it has not been found necessary to install high vertical feeding hoppers to assist feeding the mills. A number of the mills which were visited successfully employed highspeed rubber belts as inter-carriers. The mill managers claim a substantial reduction in maintenance and down time.
Extra heavy-duty shredders are now becoming more popular in Mauritius.
At Savanna factory in Reunion, Messrs. Fives Lille have an experimental turbine-driven gear train coupled to one mill. This is virtually a king-size torque arm gear box with the output gear shaft rigidly coupled to the square of the top roller. The reduction gears are carried in a housing which floats up and down with the top roller and which applies the torque reaction to a robust link which is attached to the housing and anchored to the ground. The tur
bine is mounted on a fixed foundation and is coupled to the conveyor belt to the de-watering mills. Stella coupled drive shaft. This gearing was completing its second season and had caused no trouble at all.
Diffusion
A D.D.S. diffusion system is operating at Stella in Reunion using crusher bagasse followed by three de-watering mills. This is a fairly old diffuser with a bucket-wheel for transferring the diffuser bagasse to the conveyor belt to the de-watering mills. Stella has experienced trouble with the system and had
to remove the shredder before any reasonable results were obtained. No settling or liming of press water is practised.
All the factories visited in Reunion used bacterial disinfectants on the milling trains.
Clarification
All the factories visited in Mauritius employed hot liming, some before and some after the flash tank. Most of them were using a saccharate principle which they claimed gave a higher filterability sugar than by injecting milk of lime. Syrup from the fourth vessel of the evaporator is used to prepare the saccharate.
No factories in Mauritius use enzymes for starch degradation as they claim that the natural enzymes process is adequate and that there is no detectable sucrose destruction. In Reunion there is no starch problem.
Of the eight factories visited in Mauritius, two were employing the Rapifloc filtering system and were sending the filtrate through to the evaporators. Some of the factories were using a clarification flocculant aid continuously and some intermittently. All the factories passed the clarified juice through stationary wire mesh screens before it was pumped to the clarifier. They claim that the screens gather a significant amount of foreign matter immediately after a week-end shut down.
In order to change clarification techniques and in particular to reduce residence time in the clarifier, Mr. Emile Hugo of Reunion has installed a system which could deal with clarification and filtration of mixed juice in 20 minutes. Briefly it consists of a large tank for progressively liming heated juice with a residence time of 10 minutes followed by 10 minutes' treatment in a pressure filter which produces clear juice and filter cake. It appears that there has been some difficulty in achieving successful operation of this plant.
Pan Boiling and Crystallisation
The use of a two-boiling system is common practice in Mauritius. The A massecuites are cooled for a period of about four hours in rapid water-cooled crystallisers and a drop in purity of between 25 and 27 degrees is expected between A massecuite and A mollasses. A molasses is then boiled into C massecuite which is water cooled and then mainly single cured on continuous centrifugals. Electric resistance reheating is now gaining favour in Mauritius and Reunion.

52 Proceedings of The South African Sugar Technologists' Association — June 1970
All the factories visited in Reunion were using the three massecuite system except for one which was boiling four massecuites. In all cases the B or penultimate molasses was being centrifuged to remove scum and solids which were then mixed with the final molasses. The amount of reject material was very small. In Reunion, both A and B massecuites are cooled in the crystallisers.
Power Generation and Air Pollution In Mauritius all the factories visited supply power
to the Central Electricity Board and therefore they are in a position to somewhat control the amount of surplus bagasse and also to turn the surplus bagasse to a financial advantage. At La Mare in Reunion, the surplus bagasse is being very successfully converted into "Bagaplan" bagasse particle board for which there is a ready market in the French territories.
At one factory in Mauritius the exhaust steam of the back pressure turbo-alternator feeding the grid system has been connected to the vapour one system of the factory to give a larger pressure drop across the turbine so that more power can be expected for the same quantity of steam.
Very little is done regarding air pollution and in all cases where some action is being taken the problem has been tackled by using expansion chambers equipped with water sprays through which the flue gasses pass. The smutty water is either used as surface irrigation or is passed over vibrating screens to separate the smuts from the water. It was interesting to note the difference in smoke emission at one factory which had two boilers of equal capacity but of different design and each with its own stack. The stack connected to the boiler using "spreader" firing was positively worse than the other boiler which employed a stepped-grate type of furnace.
Research in Mauritius
The Mauritius Sugar Industry Research Institute is a very active organisation which is investigating many of the industry's problems on an industrial basis and also those particular to an individual factory. They have evolved a satisfactory regression formula for the exhaustion of final molasses. However, as this was developed from data obtained from existing plant and it is expected that techniques and equipment will improve, three degrees of purity are deducted from the derived result so that the difference between achieved and expected purities will not be negative.
Extensive work has been done on particle size and distribution of crystals in massecuites. This has led to an investigation of particle size and distribution of slurries used for pan seeding. The M.S.I.R.I. is of the opinion that false grain is being developed by using insufficient slurry in the pan and because of this there is a shortage of nuclei on which sucrose can be deposited. The thought is put forward that it is infinitely better to have too much than too little slurry for pan seeding.
Discussion Mr. Buchanan (in the chair): A wage comparison
between Mauritian and South African workers in the sugar industry would be most interesting.
I think the relationship between clean cane, low fibre and surplus bagasse is interesting. Has the effective fuel value of trash something to do with this?
Mr. Moor: As Mr. Gunn is unfortunately away ill, I will try to answer the questions on his behalf. (a) Mr. Gunn has commented that although wages
in Reunion are much higher than in Mauritius, the cost of living was correspondingly higher, resulting in a comparable standard of living.
(b) In Mauritius bagasse moistures down to forty-five are achieved, compared to our fifty % or more. Yet Mr. Gunn observed that even when this very dry bagasse falls ten feet after leaving the final mill, little or no dust is generated, whereas the relatively damp South African bagasse dusts badly in similar circumstances. It appears possible that lack of trash is responsible for this absence of dust.
Mr. Buchanan: Yes, but is the calorific value of trash different from that of fibre, and is this why there is a surplus of bagasse in Mauritius despite the low fibre content of the cane?
Mr. Magasiner: I think the main reason for the bagasse surplus is the moisture content of the fuel.
Mr. Lenfema: Cane is trashed while it is growing in Mauritius due to the heavy rainfall and the strong winds.
It is also cut much younger than in South Africa. Mr. Renton: I am interested in the torque arm gear
box attached to the top roller at Savannah mill. Is it a single or a multiple drive unit?
Mr. Moor: I believe it is a triple reduction gear train with the output shaft rigidly connected to the square of the top roller with a flexible input shaft from the turbine.
Dr. Matic: Regarding clarification, how much sac-charate is used for liming and is there colour formation during the preparation of saccharate?
Also, in connection with use of natural enzymes, how is the juice obtained and what are the pH's like?
Dr. Graham: I presume the application of natural enzymes would be under similar conditions to those used previously in South Africa.
Mr. Pershouse: In Australia syrup is mixed with the lime to a deep chocolate colour. Although there is a problem of high pH, the retention times are short in Australia.
Some factories put the saccharate into the eye of the final juice pump before the juice goes through the heater.
Mr. Carter: I believe in Australia they make a 24° Brix syrup solution, using 8° Be lime.
Dr. Marie: Our experience has been that there is not much difference in sugar quality whether hot or cold liming is used.
Mr. Young: Mr. Gunn mentions an expected purity of final molasses with a formula derived from a regression analysis.

Proceedings of The South African Sugar Technologists'lAssociation —
It is implied that the expected purity is used for practical purposes instead of the normal molasses formula.
I am interested to know what parameters were used in determining the regression formula.
Mr. Lamusse: They were Brix converted to dry matter, reducing sugar and ash.
Thirty percent of the factories were getting better than the expected purities.
Mr. Williams: I noticed the absence generally of shredders in Mauritius, but the preparation was excellent through the use of knives. A 72" mill might have as many as 100 knives, and would often give as good a preparation as a shredder.
Mr. Buchanan: 1 also noted this in Mauritius, but we hold generally that a shredder is necessary for good milling performance.
Mr. Hulett: In Mauritius, is it customary to have the knives running backwards or forwards?
Mr. Williams: I did not observe the direction of rotation, but I did notice that the speed employed for
— June 1970 53
the secondary set was 600 rpm compared to 500 rpm for our factories.
Dr. Matic: I understand that the preparation by knives is good enough to be considered suitable preparation for a diffuser. Some of the knives were shaped differently to ours.
Dr. •Graham: A two boiling system is used in Mauritius, starting with a massecuite purity of 88, but A-massecuites are water cooled.
This should contribute to reduced losses from decomposition in the boiling house, as well as making possible the phenomenal purity drops in the A massecuites of up to 27°.
The boiling house recovery shows figures ranging up to 93, and they have high overall recoveries because of high mill extractions.
Mr. Buchanan: This paper indicates the value to our industry of trips overseas undertaken by experienced technologists.
Our S.M.R.I. should be interested in the work being done by the Mauritius Research Institute on particle size and distribution of slurries used for pan seeding.
54 Proceedings of The South African Sugar Technologists' Association —June 1970
NOTES ON AIR POLLUTION IN THE SUGAR INDUSTRY By B. ST. C. MOOR
The Tongaat Sugar Company Limited
Summary A topic currently commanding urgent attention
with the proposed scheduling of the sugar industry in terms of the Atmospheric Pollution Prevention Act is discussed in general terms. A variety of causes and remedies are commented upon and fields for further research suggested in the hope of stimulating fruitful discussion.
Introduction On the morning of 10th December, 1969, a number
of persons interested in the reduction of air pollution caused by boilers in the sugar industry chanced to arrive at the Engineers' Offices, Tongaat, simultaneously and the opportunity was taken to convene an informal forum for discussion of this vexed topic. This paper is a direct result of those discussions and much of what follows forms a synthesis of ideas expressed by those present, who were:—
Mr. N. Allan of the S.M.R.I. Dr. E. C. Halliday of the C.S.I.R. Mr. N. Boegman of the C.S.I.R. Mr. N. Magasiner of John Thompson Africa
(Pty.) Limited. Mr. J. Michley of John Thompson Africa (Pty.)
Limited. Mr. J. van Dokkum of the Tongaat Sugar
Company. Mr. B. St. C. Moor of the Tongaat Sugar
Company. Dr. Halliday is the Chief Air Pollution Control
Officer with the C.S.I.R. and he and Mr. Boegman have been charged with the task of investigating and combating this problem in the sugar industry. Their visit to Tongaat on this occasion was for purposes of preliminary fact-finding and problem assessment.
Mr. Magasiner and Mr. Michley had been involved in association with Tongaat Sugar Company with investigations into means of preventing smuts from bagasse-fired boilers and had been conducting experimental work on a pilot plant at Tongaat.
Perspective Air pollution in general is undesirable when one
or both of two circumstances prevail. These are, first, when it forms a health hazard (e.g. poisonous gases); and, secondly, when it forms a social amenity hazard (e.g. unsightly, light obstruction or dirt fallout).
In the sugar industry the problem is almost entirely of the second type, and is primarily associated with the fall-out of incompletely combusted particles ("smuts") rather than with the true "smoke". The remedy lies either in prevention, by avoiding the generation of smuts (Generation) or in cure, by removing generated smuts from gases before their release (Removal).
Generation 1. Bagasse as a fuel presents problems. With the
miller pushing mills to high capacities, high moisture contents can be expected (South African moistures tend to be higher than most). Further, bagasse is generally a non-homogeneous fuel, with heavy and light fractions, large and small particles intermixed. These properties are not conducive to complete and even combustion, but to overcome these limitations of bagasse as a fuel is probably too costly and too complex to be a feasible solution to the problem.
2. In similar vein, the presence in South African bagasse of a relatively high volume of trash residue, which is light and flakey, could be aggravating. A change in the basis of cane payment may help here.
3. In any bagasse-fired boiler or incinerator, adequate furnace area is essential in order to ensure a low gas velocity and thus minimise carryover. Unfortunately it is seldom easy to redesign existing furnaces.
4. Adequate height of the furnace is also important, in order to allow a sufficient period of time before contact with the tubes and extinction of the flame front. Any incompletely burnt particles at this stage will carry over as smuts.
5. Another contributory factor to smuts generation can be the lack of draught control on a boiler. Fitting of such control may often be simple and inexpensive.
6. Spreader stokers are far greater offenders than the hearth-type furnace as the principle of combustion in suspension is bound to induce carryover. However, it is accepted that spreader stokers are essential for dual fuel (coal/bagasse) boiler firing.
7. Boiler selection based exclusively on cost must cause boiler designers to rate their designs immoderately. It is recommended that sugar engineers include the requirement that the plant be "smut-free" in tender specifications for new boilers. Standards of freedom from smuts for bagasse-fired boilers have not yet been defined, but it is hoped that Dr. Halliday and his colleagues at the C.S.I.R. will be able to assist in this regard.
8. Boiler users are also to blame for accepting situations of under-capacity, in which boilers are forced beyond their design loads. Perhaps this is the greatest single cause of the smut nuisance in the industry.
9. Another major cause of smuts carry-over from certain boilers is the lack of air heaters. The relatively moist bagasse found in the S.A. sugar industry will not burn to complete combustion in most boilers unless combustion is initiated with preheated air.
10. Correct training and supervision of boiler operators in such matters as fuel bed levels,
Proceedings of The South African Sugar Technologists'' Association —
steady fuel supplies, fuel distribution across the furnace and draught control is also essential.
11. It has been suggested that the common practice of mixed firing of bagasse and coal causes more smuts than either fuel used on its own, and should be avoided. To avoid this practice may require larger bagasse storage facilities with improved recovery plant.
It is worth noting that many of the remedies proposed in this section are inexpensive, and often have side benefits which would enable the measures to pay for themselves.
Removal If measures to prevent the generation of smuts
are either not feasible or unsuccessful, then the less satisfactory solution can only lie in their capture and removal from the flue gases. Comments to be made on some methods tried are:—
1. Spinners and cyclones are of dubious effectiveness in dealing with the relatively large particles of low density which constitute the bulk of bagasse smuts.
2. The cost of electrostatic precipitators, which would probably be effective, is prohibitive (one price quoted was nearly three times that for an equivalent cyclone system).
3. Partial success has been achieved at Tongaat using water sprays in a "smuts chamber". Essentials are adequate volume and dispersion of sprays, low gas velocities through the chamber (Dr. R. Morris has quoted a maximum of 3 m/s) and a brick-, concrete- or stainless steel-lined stack to resist internal corrosion. In order to provide sufficient water a recycling system with small make-up and leak-off was instituted. Smuts screened from the spray water is disposed of with the factory filter cake. Problem areas in the system are choking of the sprays, pump maintenance and screening the smut-bearing water. These have now been largely overcome.
4. A system of removal being tried in Australia involves bubbling the flue gases through about 25 mm of water. In addition to the disposal and stack corrosion difficulties, this method also imposes an additional head on the induced draught fan and would normally require an increase in power here of about 15%.
5. Engineers of John Thompson Africa have recently carried out extremely promising experiments at Tongaat involving filtering the flue gases through various screening media. On the pilot plant most success was achieved using a 40-40 per inch mesh stainless steel vibrator screen as filter medium. This system virtually guarantees the dry removal of 99% by volume of all particles over 0.25 mm in size, and a large proportion of all finer smut particles. The disadvantages of the system would appear to be cost (R20,000 to R30,000 for a fully automatic unit for a 40t/h boiler) and increased I.D. fan power requirements owing to the pressure drop of approximately 25 mm w.g. across the filters.
6. In a very few instances, an acceptable alternative to removing the smuts could be to spread it a bit more thinly over the downwind terrain. One way to do this is to increase stack heights.
— June 1970 55
Conclusion Dr. Halliday has persuaded the South African
Sugar Millers' Association to agree to the industry's being declared a "Scheduled Industry" in terms of the Atmospheric Pollution Prevention Act. All mills will thus be required to take stock of their position in the very near future. To assist in this, Dr. Halliday proposed the formation of a study group comprising mill engineers together with S.M.R.I. and C.S.I.R. representatives. This group has been formed and with the assistance of Dr. Halliday and his staff should be able to play a constructive part in "cleaning up" the skies over the industry.
The foregoing discussion demonstrates that solutions need not be very costly and could well be self-financing. Study avenues in this field could include quantitative studies of satisfactory furnace design principles; methods of measuring stack emissions; criteria for satisfactory stack conditions; the development and evaluation of smuts removal systems; and alternative uses for bagasse to obviate the need for incineration.
Discussion Mr. Magasiner (commenting on his slide projec
tions): I agree that the most intelligent way to solve the problem is to eliminate the cause. Correct furnace design goes a long way to achieving this. At our company's second International Conference on Boiler Plant for the Cane Sugar Industry in Australia last year the factors affecting carry over were discussed at length and parameters were quantified using an acceptable visual stack emission as the guiding criterion.
Apart from furnace configuration, bagasse moisture content and grading were high-lighted as the most important single factors affecting performance. The lower the moisture content, the lower the smut emission from a given unit. The University of Natal is at present attempting, on our behalf, to formalise the empirical data which we have gathered together.
By the way, there was strong evidence presented at our conference to indicate that a correctly designed hearth type furnace set in a Dutch Oven was the most effective available from a grit and smut suppression and combustion point of view. Initial cost, size limitations and maintenance unfortunately ruled it out as a commercial proposition under present-day conditions.
While mechanical collectors of the cyclone or multi cyclone type are capable of collecting a substantial proportion of the denser grits, they are unable to collect the smut particles which have a very much lower density.
The performance of a collector drops as the density of the particles to be collected is reduced. If the aerodynamic drag on the particles is high, as is the case with bagasse smut, the reduction in performance is very much greater and the collector efficiencies are reduced even more radically. To aggravate the problem still further, any air leakage into the collector through the dust discharge system causes a substantial reduction in performance.
The problem has been analysed in detail by. the Sugar Research Institute in Mackay, Australia, who

56 Proceedings of The South African Sugar Technologists' Association —June 1970
have concluded that wet collectors of the scrubber type are the only suitable machines available at present.
The wet type collector, however, suffers from a number of very serious disadvantages. These are:— (a) The gases leaving the collector are saturated. The
ductwork, induced draught fan and chimney must therefore be protected against corrosion. The ducting and chimney can be Gunnite lined but this is expensive and would probably have to be renewed every four odd years. The induced draught fan would have to be made of stainless steel.
(b) The water absorbed by the gases would amount to approximately 10%—15% of the M.C.R. evaporation of the boiler plant.
(c) In order to avoid creating a water pollution problem, the water used in the collector would have to be filtered and re-circulated. A simple vibrating screen appears to be quite adequate for this duty. The solids contents of the re-circulated water apparently stabilises at about 0.3% by weight.
Because the wet collector in solving the smut emission problem creates a number of expensive subsidiary problems, it seems worthwhile to spend a bit more time in trying to make the dry collector work before admitting defeat.
Towards the end of last year, we tested, in conjunction with Tongaat, a filter device. Unfortunately, for reasons beyond our control, our experiments were curtailed before we were able to finally establish ultimate performance limits.
The preliminary results appeared to be reasonably promising and indicate that further work is warranted. Provision has been made in the ductwork of the new boiler being installed at Tongaat to carry out these tests.
Having collected the grit and smuts the problem of disposing of them remains. They must be damped down to eliminate a fire hazard and to prevent them blowing about in the wind. The mechanical design of equipment to successfully handle these wastes is an interesting problem in its own right and one which I feel should be divorced from the broader problem of collection.
Mr. Buchanan (in the chair): For avoidance of air pollution, should trash be burnt in the field or in the factory furnace?
Mr. Moor: Burning in the fields does not overcome the problem of pollution, it merely spreads it over a wider area, although the fields may at least derive some benefit from the burnt carbon particles.
Mr. Kramer: How high does Mr. Moor think the bagasse furnace should be in relation to the furnace grate area?
Mr. Moor: There are no criteria that I am aware of giving ratio of furnace area to height or furnace volume to calorific output of the boiler at M.C.R.
I think that air pollution study group should investigate this.
Mr. Allan: Before we do anything, we must establish scientifically a satisfactory level of emission.
We can improve existing stack conditions by taking note of all the points Mr. Moor has raised.
An elementary way to begin is to pay more attention to the boiler house.
Some sugar factories have already installed dust collecting equipment.
Fortunately we have a reasonable amount of time to set our houses in order.
I take issue with Mr. Moor on one point. I am not convinced that, if a spreader stoker boiler is fired correctly and its fuel to air ratio is correct, that it is a worse type of unit than any other.
Mr. Moor: I would agree with Mr. Allen if he also mentioned design of the spreader stoker furnace.
If two identical furnaces are fired, one with a spreader stoker and the other with a quiescent bed, then the spreader stoker will emit more from the stack than the other, because in the quiescent bed there is a period for bagasse to be heated before going to the gas passes. Therefore, it requires less time to complete its combustion and is likely to undergo more thorough combustion. Often with spreader stokers, furnace areas and furnace heights have been kept to the barest minimum with an eye to cost and no account has been taken of pollution.
Mr. McLunan: With coal, are not toxic effects more important than visible emission, and does this not apply to bagasse as well?
Mr. Moor: Apart from the central refinery in Durban, most sugar factories only use coal intermittently as an auxiliary fuel. The factories are generally situated out of town and I have not heard of any complaints about toxicity of flue gases. The toxic effects of coal gases are mainly associated with concentrations of sulphur dioxide. Bagasse, unlike coal, contains only negligible quantities of sulphur.
Mr. vau Hengel: To limit increased use of coal in the sugar industry as bagasse utilisation projects develop, we should investigate bagasse saving methods and endeavour to make changes in process operations rather than boiler operations.
Mr. Dick: Have any attempts been made to pulverise bagasse to make it more uniform before firing?
Mr. Magasiner: An enormous amount of horse power would be required for this purpose.
Mr. Strong: Pollution is a matter of economics. When a new boiler is required the first consideration is price. It is difficult to convince management to spend more in order to prevent pollution.
Mr. Allan: One of the objects of the study group is to set up reasonable criteria which we know will give us an acceptable smut emission.
Boiler manufacturers in future will only be able to sell boilers to the sugar industry that comply with our reasonable standards.
Dr. Mansfield: Surely the important point is the concentration of material coming down — and what goes up must come down!
Mr. Allan: That sounds correct but it is possible to do as Rand Carbide did, namely, build an enormously high stack so that emissions simply disappear into the atmosphere. The cost of the stack was, however, very high.
Proceedings of The South African Sugar Technologists' Association — June 1970 57
WATER CONSERVATION IN SUGAR MILLS By D. J. L. HULETT
Deon Hulett and Partners
The year 1970 has been declared water year. What is "water year"? It is an attempt by the Government to make both industry and the public more conscious of the part they must play in the conservation of water.
The country's economic growth and prosperity depends on an adequate supply of water—but this supply is dwindling at an alarming rate.
At present, the Government is attempting to conserve our natural water resources by building dams and by passing legislation through parliament making it a criminal offence to misuse water.
This means that in the very near future industry will be forced to take measures to halt unnecessary waste and pollution.
Contrary to Press reports—I refer in particular to an article in the Natal Mercury dated 13th March which was headlined "Rubbish . . . by Industry". We all know that industry does cause pollution and we in the sugar industry should make every effort to eliminate this problem and prevent unnecessary waste.
With this in mind I would now like to discuss:
Sugar Mill Effluent Elimination If one considers the overall water balance of a
sugar mill (see Fig. 1) one can see that the amount of water coming in with the cane is almost enough to maintain the operation of the factory and it is this criterion which led engineers to have the courage to build mills such as Empangeni and Jaagbaan, remote from rivers, which have to rely only on water obtained from boreholes for the operation of the mills.
Mills where an abundant supply of water has existed have not, however, bothered to conserve water and so the usage has become greater as the mill gradually expanded. What is happening now to these mills is the materialisation of a twofold problem. One is that the supply of water is running low due to the demand on the river and the other is that restrictions are being placed on the disposal of effluent.
What can be done about this situation? There are two solutions— (a) to build dams and store large quantities of
water and install effluent treatment plants and effluent disposal schemes to cope with the water; and/or
(b) to close up the system and make maximum use of the water by careful selection and recirculation.
It is this latter choice that I wish to discuss in this paper.
Imbibition Water
Consider the water balance sketch (Fig. 1) of a typical sugar mill. The first large water requirement is the imbibition water required for washing the sugar out of the crushed cane.
Most mills require that this water be applied cold for various reasons. The two main reasons are to prevent roller slip when large quantities of imbibition water are used on mills operating at high fibre throughputs and to obviate the mill house becoming wet and clouded with steam on cold evenings.
The hot condensate collected from the evaporator tail ends, pans and heaters is generally sufficient to supply this water and it is simply a matter of cooling this water to a suitable temperature for application to the mills. This is best achieved by first flashing the condensate down the evaporator to 71° C corresponding to the 335 mbar vacuum prevailing in the calandria of the last effect and then cooling with cold mixed juice down to about 32° C in a counter current liquid-liquid heat exchanger. Should really cool imbibition water be required it may be necessary to by-pass the hot return juice from the Oliver filters around this liquid-liquid heater in factories where this filtrate is returned to the mixed juice tank.
Boiler Feed Water
From a steam economy point of view and from the safety angle with regard to sugar contamination, all the low pressure steam should be fed to a pre-evaporator in which the clear juice is boiled to produce vapour at about 1.4 bar for the supply of pans and heaters and other general use. In this way it is possible to collect most of the steam generated in the boilers as condensate and return it to the boilers as feed. This condensate is withdrawn from the pre-evaporator calandria at about 2.03 bar and is flashed to below atmospheric pressure, the flash heat being utilised for juice heating or boiling the tail vessels of the evarporator.
A certain amount of make up, however, is inevitable due to the loss of the flash and the inevitable leaks. This make up for the boilers should be obtained from the second effect of the evaporator calandria condensate. Multiple layer wiremesh en-trainment preventers can achieve a very high efficiency in the scrubbing of sugar entrainment from the vapour produced in the pre-evaporator provided, of course, that it has been correctly designed and properly maintained.
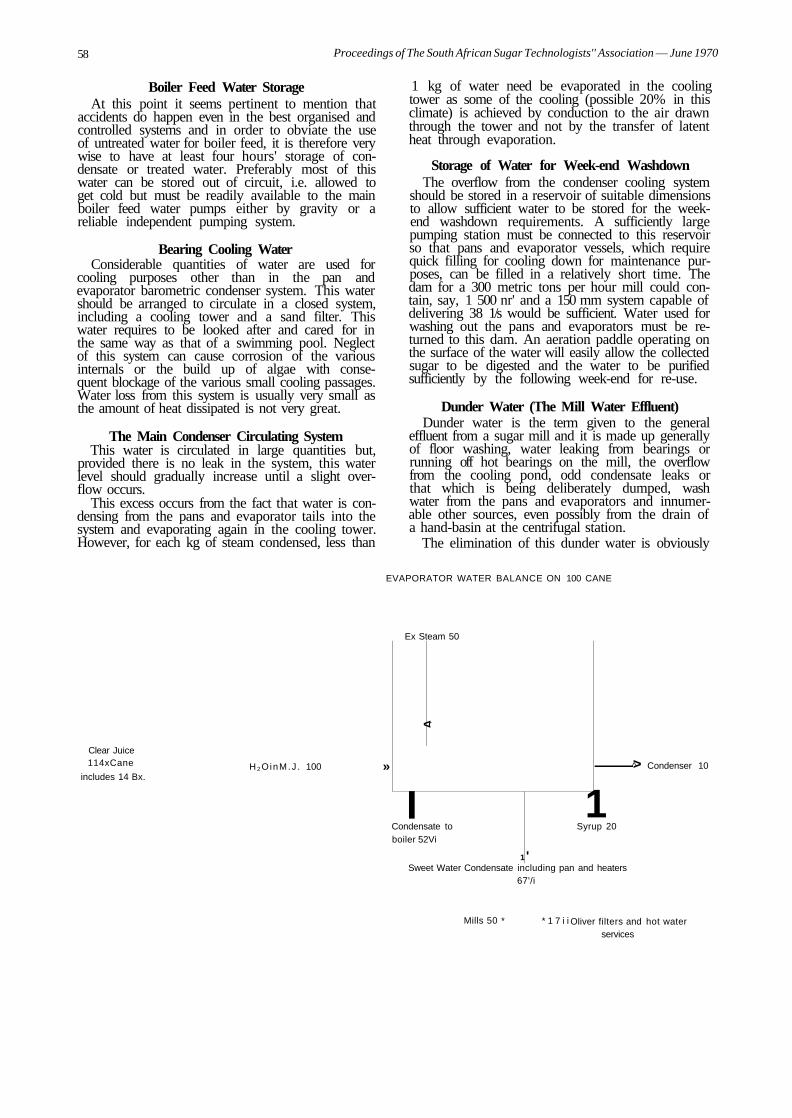
58 Proceedings of The South African Sugar Technologists'' Association — June 1970
Boiler Feed Water Storage At this point it seems pertinent to mention that
accidents do happen even in the best organised and controlled systems and in order to obviate the use of untreated water for boiler feed, it is therefore very wise to have at least four hours' storage of condensate or treated water. Preferably most of this water can be stored out of circuit, i.e. allowed to get cold but must be readily available to the main boiler feed water pumps either by gravity or a reliable independent pumping system.
Bearing Cooling Water Considerable quantities of water are used for
cooling purposes other than in the pan and evaporator barometric condenser system. This water should be arranged to circulate in a closed system, including a cooling tower and a sand filter. This water requires to be looked after and cared for in the same way as that of a swimming pool. Neglect of this system can cause corrosion of the various internals or the build up of algae with consequent blockage of the various small cooling passages. Water loss from this system is usually very small as the amount of heat dissipated is not very great.
The Main Condenser Circulating System This water is circulated in large quantities but,
provided there is no leak in the system, this water level should gradually increase until a slight overflow occurs.
This excess occurs from the fact that water is condensing from the pans and evaporator tails into the system and evaporating again in the cooling tower. However, for each kg of steam condensed, less than
1 kg of water need be evaporated in the cooling tower as some of the cooling (possible 20% in this climate) is achieved by conduction to the air drawn through the tower and not by the transfer of latent heat through evaporation.
Storage of Water for Week-end Washdown The overflow from the condenser cooling system
should be stored in a reservoir of suitable dimensions to allow sufficient water to be stored for the weekend washdown requirements. A sufficiently large pumping station must be connected to this reservoir so that pans and evaporator vessels, which require quick filling for cooling down for maintenance purposes, can be filled in a relatively short time. The dam for a 300 metric tons per hour mill could contain, say, 1 500 nr' and a 150 mm system capable of delivering 38 1/s would be sufficient. Water used for washing out the pans and evaporators must be returned to this dam. An aeration paddle operating on the surface of the water will easily allow the collected sugar to be digested and the water to be purified sufficiently by the following week-end for re-use.
Dunder Water (The Mill Water Effluent) Dunder water is the term given to the general
effluent from a sugar mill and it is made up generally of floor washing, water leaking from bearings or running off hot bearings on the mill, the overflow from the cooling pond, odd condensate leaks or that which is being deliberately dumped, wash water from the pans and evaporators and innumerable other sources, even possibly from the drain of a hand-basin at the centrifugal station.
The elimination of this dunder water is obviously
EVAPORATOR WATER BALANCE ON 100 CANE
Ex Steam 50
Clear Juice 114xCane
includes 14 Bx. H 2 OinM.J . 100 »
< r
I Condensate to boiler 52Vi
1
1 >
Syrup 20
'
^ Condenser 10
Sweet Water Condensate including pan and heaters 67'/i
Mills 50 * * 1 7 i i Oliver filters and hot water services
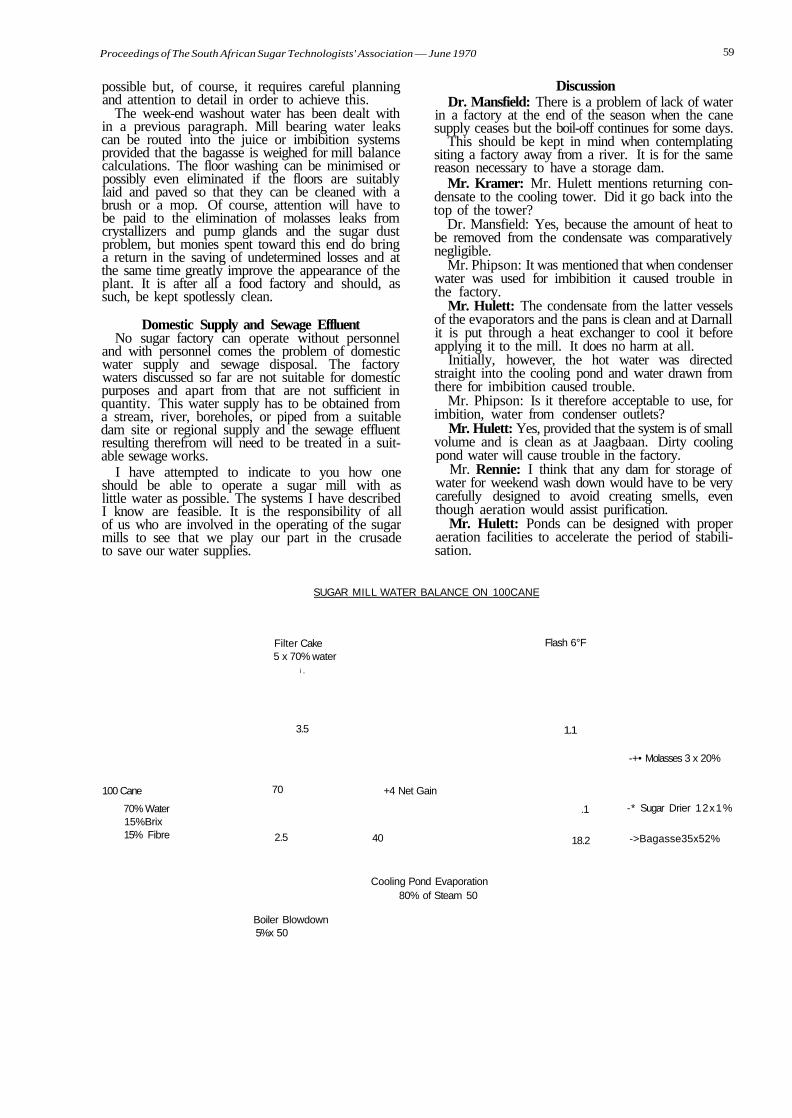
Proceedings of The South African Sugar Technologists' Association — June 1970 59
possible but, of course, it requires careful planning and attention to detail in order to achieve this.
The week-end washout water has been dealt with in a previous paragraph. Mill bearing water leaks can be routed into the juice or imbibition systems provided that the bagasse is weighed for mill balance calculations. The floor washing can be minimised or possibly even eliminated if the floors are suitably laid and paved so that they can be cleaned with a brush or a mop. Of course, attention will have to be paid to the elimination of molasses leaks from crystallizers and pump glands and the sugar dust problem, but monies spent toward this end do bring a return in the saving of undetermined losses and at the same time greatly improve the appearance of the plant. It is after all a food factory and should, as such, be kept spotlessly clean.
Domestic Supply and Sewage Effluent No sugar factory can operate without personnel
and with personnel comes the problem of domestic water supply and sewage disposal. The factory waters discussed so far are not suitable for domestic purposes and apart from that are not sufficient in quantity. This water supply has to be obtained from a stream, river, boreholes, or piped from a suitable dam site or regional supply and the sewage effluent resulting therefrom will need to be treated in a suitable sewage works.
I have attempted to indicate to you how one should be able to operate a sugar mill with as little water as possible. The systems I have described I know are feasible. It is the responsibility of all of us who are involved in the operating of the sugar mills to see that we play our part in the crusade to save our water supplies.
Discussion Dr. Mansfield: There is a problem of lack of water
in a factory at the end of the season when the cane supply ceases but the boil-off continues for some days.
This should be kept in mind when contemplating siting a factory away from a river. It is for the same reason necessary to have a storage dam.
Mr. Kramer: Mr. Hulett mentions returning condensate to the cooling tower. Did it go back into the top of the tower?
Dr. Mansfield: Yes, because the amount of heat to be removed from the condensate was comparatively negligible.
Mr. Phipson: It was mentioned that when condenser water was used for imbibition it caused trouble in the factory.
Mr. Hulett: The condensate from the latter vessels of the evaporators and the pans is clean and at Darnall it is put through a heat exchanger to cool it before applying it to the mill. It does no harm at all.
Initially, however, the hot water was directed straight into the cooling pond and water drawn from there for imbibition caused trouble.
Mr. Phipson: Is it therefore acceptable to use, for imbition, water from condenser outlets?
Mr. Hulett: Yes, provided that the system is of small volume and is clean as at Jaagbaan. Dirty cooling pond water will cause trouble in the factory.
Mr. Rennie: I think that any dam for storage of water for weekend wash down would have to be very carefully designed to avoid creating smells, even though aeration would assist purification.
Mr. Hulett: Ponds can be designed with proper aeration facilities to accelerate the period of stabilisation.
SUGAR MILL WATER BALANCE ON 100CANE
Filter Cake 5 x 70% water
i ,
Flash 6°F
100 Cane
70% Water 15%Brix 15% Fibre
3.5 1.1
70
2.5
+4 Net Gain
40
.1
18.2
-+• Molasses 3 x 20%
-* Sugar Drier 12x1%
->Bagasse35x52%
Cooling Pond Evaporation 80% of Steam 50
Boiler Blowdown 5%x 50

60 Proceedings of The South African Sugar Technologists' Association —June 1970
STAINLESS STEEL IN THE SOUTH AFRICAN SUGAR INDUSTRY
By C. G. W. ROFFEY* and I. A. ELSDON-DEW**
Until five years ago South African sugar engineers and technologists were reluctant to consider stainless steel for these reasons:
(i) cost,
(ii) different fabrication techniques compared to traditional mild steel,
(iii) lack of knowledge about stainless steel.
This paper attempts to clarify the above points, highlight some of the progress made to date and outline future applications.
TABLE 1
A.I.S.I. Metallurgical Series Structure
y Ferritic
4 0 0 ^
^ Martensitic
300 Austenitic
Major Alloying Elements
Fe. Cr.
Fe. Cr. C.
Fe. Cr. Ni.
Basic Properties
Magnetic Non
Hardenable
Magnetic Hardenable
Non Magnetic Hardenable
The metallurgical types of Stainless Steel and their basic properties
(a) Stainless steel as a material "Stainless Steel" is not a single metal—it is the name
given to a group of iron based alloys containing a minimum of 11 % chromium. Although the basic stainless steels are divided into three metallurgical categories, it will be noted from Table 1, that the A.I.S.I. numbering system only differentiates between the nickel containing Stainless Steel (300 series) and the non-nickel containing Stainless Steel (400 series) The A.I.S.I. specifications cover a large range of stainless steels many of which are tailor made to operate at temperatures of —273° C to -+• 1 000° C, to combat a wide range of acids, alkalis, gases etc., and with mechanical properties ranging from the hardness of razor blade steel to the ductility of deep drawing steel.
Fortunately the sugar technologist has only 3 stainless steels to consider, and Table 2 gives the respective A.I.S.I. specifications.
TABLE 2
A.I.S.I. No.
304
316
430
Chromium %
18
18
17
Nickel %
8
10
—
Molybdenum %
—
3
—
* Metallurgical and corrosion consultant. ** R. Jackson and Co. (Natal) (Pty.) Ltd.
The basic composition of A.I.S.I. 430, 304, 316.
(i) A.I.S.I.—304. This is the basic stainless steel in the 300
series, containing 18% chromium and 8% nickel. It is one of the most versatile stainless steels having excellent corrosion resistence, extremely good ductility, and excellent weld-ability. Most sugar engineers will be familiar with this grade due to its extensive use as tubing for juice extraction.
(ii) A.I.S.I.—316. This is another nickel containing stainless
steel similar in mechanical properties to A.I.S.I. 304. The addition of 2—3% molybdenum greatly increases the pitting resistance and so this stainless steel is only used in applications calling for ultra high corrosion resistance, e.g. highly by acidic or alkaline environments.
(iii) STELEX 430. This is a straight 17% chrome stainless steel
made by Southern Cross Steel Co. (Pty) Ltd. at Middleburg to the basic A.I.S.I. 430 specification.
Stelex 430 does not have quite the same level 6f corrosion resistance as A.I.S.I. 304, but being a nickel free stainless steel, it is significantly cheaper whilst offering vastly better resistance to corrosion than mild steel.
-June 1970 61 Proceedings of The South African Sugar Technologists' Association
The U.T.S. values and relative hardness of these stainless steels are compared to mild steel and 70/30 brass in Table 3.
TABLE 3
U.T.S. p.s.i.
MN/ms
h bar
Hardness B.H.N.
Mild Steel
60 000 413.685 41.369
120
Stelex 430
75 000 517.107 51.711
190
A.I.S.I. 304/316
85 000 586.054 58.605
180
Brass 70/30
45 000 310.264 31.026
120
Note: 10 000psi= 68.948 meganewtons per square metre = 6.895 hectobars
14 500 psi = 10 hectobars
The strength and hardness characteristics of Stainless Steel compared to mild steel and 70/30 brass
(b) Stainless Steel Costs. The kg for kg costs of the stainless steels as com
pared to mild steel and 70/30 brass are given in Table 4.
TABLE 4
Mild Steel 70/30 Brass
Stelex A.I.S.I. A.I.S.I.
430 304 316
1 10
44 84
13
The basic cost comparison of mild steel 70/30 brass and Stainless Steel.
Although the initial material costs of stainless steel appears prohibitive, practical experience in the sugar industry over the past 2 years has shown that the thickness of stainless steel can be reduced by at least 25 % compared to mild steel with the resultant savings in material, handling, and fabrication. In several instances more complex fabrications such as pan condensers have been made in STELEX 430 at only double the price of mild steel and with far superior corrosion and abrasion characteristics.
Experience to date has shown that a life of 10—12 times is possible with Stelex 430 against convential mild steel, and thus the saving on maintenance and replacement cost is more than offset by the initial capital cost of stainless steel.
(c) Stainless Steel Fabrication. Most mill engineers have now developed welding,
and fabrication techniques for Stelex 430 and A.I.S.I. 304 to suit their own staff and workshop lay out. Excellent weldability for Stelex 430 has been achieved by using the standard austenitic electrodes, such as A.I.S.I. 310. In many cases STELEX 430 has been successfully welded in as a replacement part of a mild steel construction using these same electrodes.
The higher hardness and strength of the stainless steels has posed certain cutting problems in view of the limited shearing capacities in most units. However the introduction of powder and disc cutting now appears to have overcome these difficulties.
Stainless Steel in Crushing/Juice extraction Stelex 430 has made a significant contribution to
machinery life and reduction of maintenance costs in this part of the mill. It has been proved to be ideal for abrasive areas such as intercarrier bottoms and boots, and current results indicate an average wear of 0.25mm—0.38mm per season as compared to an average loss of 3.81 mm—4.46mm for mild steel plates subjected to similar duty. At two mills the last two intercarriers in the tandem show that the Stelex 430 plates installed have even less wear ± 0.05mm (± .002in) during one seasons operation. Thus in comparison with mild steel, a life factor of over 10—12 times has been obtained from Stelex 430 for an initial installation cost including raw material of 3 times that of mild steel.
Some Mills, to save on initial capital, are now using 6mm Stelex 430 as liners instead of the conventional 10mm or 12mm mild steel.
Continuing on the tandem, Donnelly chutes situated over the rollers have been fabricated from 3mm Stelex 430 and after one season operation, no wear has taken place, (± 0.05mm). Juice gutters, maceration tanks, under pans have all been fabricated from Stelex 430 usually in 5mm thickness, and on testing a maceration tank after 3 full seasons operation, other than the removal of the original mill scale, there was no sign of wear and even more important, no pitting attack. (See Fig. la & 6) In this case it is worth noting that 5mm Stelex 430 was used for the fabrication in place of 10mm mild steel, again saving on material cost.
In diffusers some experimental plates of perforated Stelex 430 have been installed and after one season are standing up far better than the mild steel counterparts. In addition, Stelex 430 is being used as side plates to combat the corrosion that normally occurs in this area.
Primary juice lines are also an excellent application for Stelex 430 and piping of 100mm x 3mm wall and 150mm X 3mm wall are being installed this year at three sugar mills, also supplied are collars and pressed bends, fabricated from Stelex 430.
Screw conveyors especially the bottoms have shown good results with Stelex 430 although trouble has been experienced with the flights. This is a welding problem and with the correct technique is being overcome. Juice scale tanks have now been manufactured and installed in three mills, and once again Stelex 430 lends itself to this type of application.
At several mills this year Stelex 430 is being used as a repair material for badly corroded or eroded plates, as it can easily be welded to mild steel.
Prior to the introduction of Stelex 430 many vessels e.g. maceration tanks and storage tanks were fabricated from A.I.S.I. 304, which now appears to be a
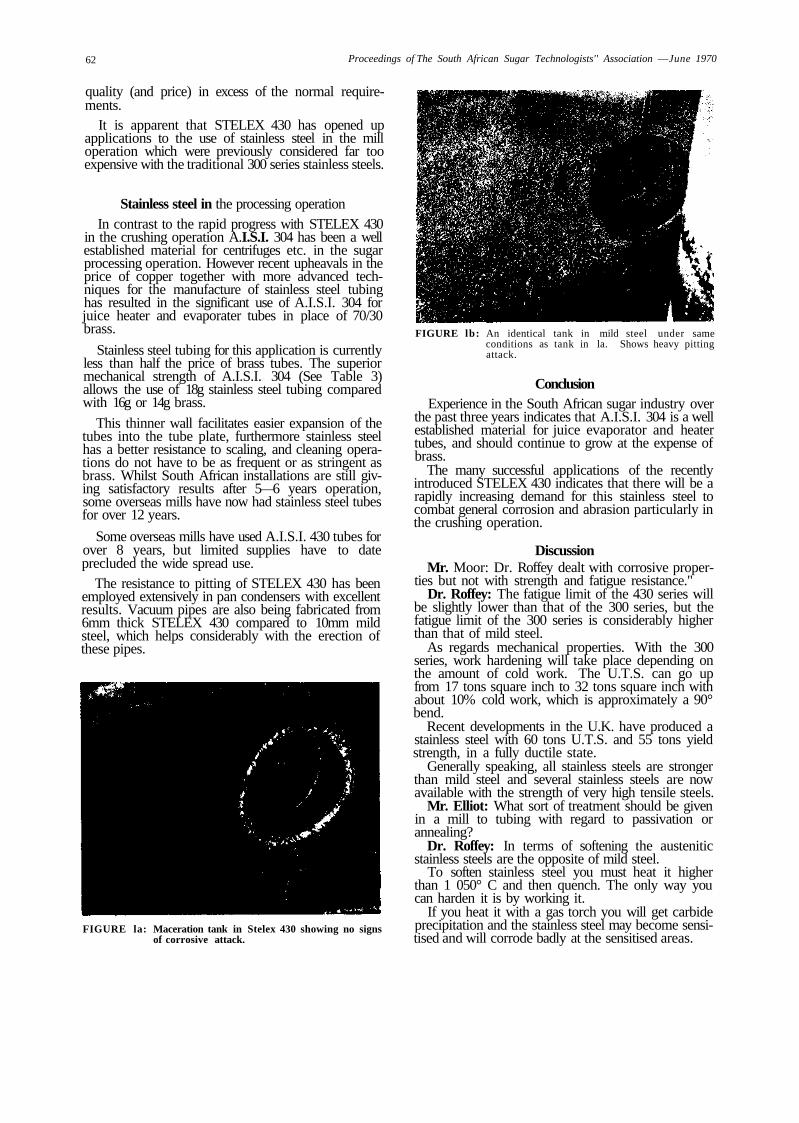
62 Proceedings of The South African Sugar Technologists'' Association —June 1970
quality (and price) in excess of the normal requirements.
It is apparent that STELEX 430 has opened up applications to the use of stainless steel in the mill operation which were previously considered far too expensive with the traditional 300 series stainless steels.
Stainless steel in the processing operation In contrast to the rapid progress with STELEX 430
in the crushing operation A.I.S.I. 304 has been a well established material for centrifuges etc. in the sugar processing operation. However recent upheavals in the price of copper together with more advanced techniques for the manufacture of stainless steel tubing has resulted in the significant use of A.I.S.I. 304 for juice heater and evaporater tubes in place of 70/30 brass.
Stainless steel tubing for this application is currently less than half the price of brass tubes. The superior mechanical strength of A.I.S.I. 304 (See Table 3) allows the use of 18g stainless steel tubing compared with 16g or 14g brass.
This thinner wall facilitates easier expansion of the tubes into the tube plate, furthermore stainless steel has a better resistance to scaling, and cleaning operations do not have to be as frequent or as stringent as brass. Whilst South African installations are still giving satisfactory results after 5—6 years operation, some overseas mills have now had stainless steel tubes for over 12 years.
Some overseas mills have used A.I.S.I. 430 tubes for over 8 years, but limited supplies have to date precluded the wide spread use.
The resistance to pitting of STELEX 430 has been employed extensively in pan condensers with excellent results. Vacuum pipes are also being fabricated from 6mm thick STELEX 430 compared to 10mm mild steel, which helps considerably with the erection of these pipes.
FIGURE la: Maceration tank in Stelex 430 showing no signs of corrosive attack.
FIGURE lb: An identical tank in mild steel under same conditions as tank in la. Shows heavy pitting attack.
Conclusion Experience in the South African sugar industry over
the past three years indicates that A.I.S.I. 304 is a well established material for juice evaporator and heater tubes, and should continue to grow at the expense of brass.
The many successful applications of the recently introduced STELEX 430 indicates that there will be a rapidly increasing demand for this stainless steel to combat general corrosion and abrasion particularly in the crushing operation.
Discussion Mr. Moor: Dr. Roffey dealt with corrosive proper
ties but not with strength and fatigue resistance." Dr. Roffey: The fatigue limit of the 430 series will
be slightly lower than that of the 300 series, but the fatigue limit of the 300 series is considerably higher than that of mild steel.
As regards mechanical properties. With the 300 series, work hardening will take place depending on the amount of cold work. The U.T.S. can go up from 17 tons square inch to 32 tons square inch with about 10% cold work, which is approximately a 90° bend.
Recent developments in the U.K. have produced a stainless steel with 60 tons U.T.S. and 55 tons yield strength, in a fully ductile state.
Generally speaking, all stainless steels are stronger than mild steel and several stainless steels are now available with the strength of very high tensile steels.
Mr. Elliot: What sort of treatment should be given in a mill to tubing with regard to passivation or annealing?
Dr. Roffey: In terms of softening the austenitic stainless steels are the opposite of mild steel.
To soften stainless steel you must heat it higher than 1 050° C and then quench. The only way you can harden it is by working it.
If you heat it with a gas torch you will get carbide precipitation and the stainless steel may become sensitised and will corrode badly at the sensitised areas.

Proceedings of The South African Sugar Technologists' Association — June 1970 63
Passivation and removal of oxide films is carried out using a ten percent nitric acid solution with one percent hydrofluoric acid and, if desired, a small amount of potassium dichromate.
Mr. Stender: Chromium stainless steel is sensitive to chrome carbide precipitation in the welding process. Can you make any recommendations?
Dr. Roffey: A low carbon stainless steel or titanium or niobium stabilised stainless steels should be used.
A welding rod with high nickel and high chromium content should also be used with the same low carbon analysis or titanium additions as the parent metal.
Mr. Williams: Will this also apply to building up stainless steel shafting?
I once built up a pump shaft by metallising and after a short time it left the parent metal.
Dr. Roffey: This was probably because the wrong rod was used. It is usually safe, with the 300 and 400 series, to use the type 310 rod.
Mr. Renton: The 410 series has been recommended for mills for abrasion resistance but this has not been mentioned in the paper.
Also, there has been more use of stainless steel in
centrifugal baskets in the sugar industry but there have been some unfortunate results because of stress corrosion.
Dr. Roffey: I omitted 410 because it is difficult to fabricate. It has 12% chromium and very high carbon so that it is hard and brittle.
It is difficult to combat stress corrosion cracking in stainless steel. The trouble in centrifugals has been due to a combination of stress and corrosion. Their combination gives a force many times stronger than either of them individually and therefore failure, when it comes, is rapid. The main corrosion is due to chlorides and in all cases the stress has to be tensile. Therefore, the ways to eliminate stress corrosion cracking are either to apply a compressive stress, to eliminate chlorides, or to use a material that is not susceptible, such as Incanel, which can be expensive.
Mr. Fokkens: We like to insert stainless steel liners into tanks. Is a 310 electrode the one to use to weld stainless steel to mild steel?
Dr. Roffey: Yes, the 310 is the correct electrode to use.
64 Proceedings of The South African Sugar Technologists Association —June 1970
THE INTERDEPENDENCE OF CANE PREPARATION, PARTICLE SIZE, DISPLACEABILITY, AND LIQUID
HOLDUP IN FIXED BED DIFFUSERS By P. W. REIN
Huletfs Research and Development, Mount Edgecombe
Abstract Observations on the use of Displaceability Index
and sieve analysis as a means of characterizing cane preparation are given. Data on liquid holdup in fixed beds of bagasse are presented; both dynamic and static holdup are shown to be dependent on flow rate and the degree of cane preparation.
Introduction It is now a well-established fact that the degree
of cane preparation has a considerable effect on diffuser extraction. Moreover, cane preparation affects the maximum obtainable percolation rate, and juice holdup and retention time. There is, therefore, a need for some quantitative means of characterizing cane preparation. This is no easy task, due to the nature of bagasse particles, which constitute a wide range of complex shapes and sizes.
Markham4 recently investigated Displaceability Index as a measure of cane preparation, and demonstrated a relationship between bagasse particle size as obtained by sieve analysis and Displaceability Index. Further observations on these two methods of particle characterization are presented, as well as liquid holdup data in a fixed bed diffuser.
The subject of this paper forms part of a much wider investigation into sugar diffusion; thus only preliminary results are presented.
Sieve Analysis Sieve analysis is a well-established and widely
applied procedure, and it was a logical step to apply it to the analysis of bagasse samples.
Bagasse samples were sieved in two stages; firstly in a sieving box containing three coarse screens for two minutes, after which the residue was transferred to smaller sieves and sieved for ten minutes. The methods of preparation of bagasse samples are given in Appendix I.
A typical cumulative size distribution is shown as curve A in figure 1, on log normal probability coordinates. The inflection in the curve corresponds to the change from large to small screens. In order to assess whether the inflection was due to sieving technique or to some sudden change in shape factor at that point, the following procedure was carried out: any particle retained on one of the coarse screens which could have passed through that screen was pushed through by hand; sieving of the smaller particles was then continued for a further 30 minutes.
The resulting size distribution is marked B in figure 1; this plots as a straight line and thus follows the log normal distribution law. In such cases, the mean size is obtained from the 50% point. In order to obtain a characteristic particle size from the sieve test, the straight portion of the curve A was projected as shown by the dotted line in figure 1. The point where this crosses the 50% horizontal was taken as the characteristic particle size. This procedure was applied to all the sieve tests, and characteristic sizes closer to the mean of the true distribution are obtained.
It is unlikely that anything other than relative values of bagasse particle size can be obtained by sieve analysis. As with all sieving operations, results depend on the time of screening, method of shaking, and screen loading. In sieving bagasse, further difficulties are encountered due to the fibrous nature of the bagasse; tangling between particles, sticking of particles to the screens, and high values of particle length to breadth ratios all lead to low sieving efficiencies.
It is only possible therefore to compare particle size in this way when identical sieving procedures are adhered to.
Displaceability Index The use of the Displaceability Index (DI) was first
reported by Payne6 as a direct measure of the availability of sugar in bagasse. Since then, Markham4
has reported some results which show that DI depends on bagasse particle size.
The method of determining DI as proposed by Markham has been used here, except that brix values measured by means of a precision refractometer have been used instead of pol measurements.
Figure 2 confirms that a direct relationship exists between characteristic particle size and DI, which may be written in the form:
DI = kdc" (1)
where n has the value -0.275 and k is 88.0. It should be noted that these values of k and n hold only when dc is determined as described in the previous section.
The determination of DI is more accurate and reliable and less dependent on experimental technique than the determination of dc, and thus it is felt that DI is a better method of characterization of cane preparation. Once again, the value of DI depends to some extent on the procedure employed; it is suggested that the procedure described by Markham4 be standardized.
Proceedings of The South African Sugar Technologists' Association — June 1970 65
Liquid Holdup Liquid holdup in a packed bed may be considered
as consisting of two parts, static holdup and dynamic holdup. Thus we may write:
HT = Hs + HD (2) Dynamic holdup may be thought of as a measure
of the amount of liquid flowing through the bed. Static holdup has been identified with stagnant pockets of liquid in the bed11, but perhaps a better idea is obtained by referring to observations by Shul-man et al.7 on the flow of dye injected into a packed bed. He observed semi-stagnant pockets of liquid, and splashing and the random motion of liquid over the packing surfaces deposited or removed dye from pockets by means of a slow random dilution process. Thus a certain amount of exchange of liquid between the flowing liquid and stagnant regions occurs.
A brief description of some of the published work on holdup follows, in the light of which the present holdup data may be discussed. Static Holdup
The static holdup is normally taken as being equivalent to the adherent holdup, i.e., the residual liquid which remains in the bed on draining. This implies that Hs is independent of flow rate; however, one can envisage the volume of stagnant regions decreasing as the flow rate increases.
Gelbe3 states that the adherent holdup is equal to the highest value of Hs at zero throughput. If the influence of the flowing film on the static holdup is taken into account, the value of Hs decreases with increasing flow rate, approaching zero at a high enough flow rate. This is a more plausible point of view.
Published data on static holdup are characterized by a considerable amount of scatter. This data shows that Hs is strongly dependent on packing material, shape and size7'9, and also when adherent holdup is considered, on conditions in the packed bed before draining10.
It has been shown that static holdup should depend on We/Fr, i.e., the ratio of Weber to Froude numbers3'10. This ratio represents the ratio of gravity to surface tension forces. Dynamic Holdup
Dimensional analysis leads to the following relation for HD
5: HD = f(Fr/Re, Re) (3)
where Fr and Re are the Froude and Reynolds numbers respectively. The most general correlations which have been proposed for HD are of this form2, but scatter is still up to approximately 20 %.
Shulman et al.7'8 found dynamic holdup to be independent of packing shape and material. This supports a theory proposed by Davidson2 that all random packings of a given size are equivalent to a series of sloping surfaces which are indistinguishable from one another. According to Davidson's model, for liquid in laminar flow.
HD = f r(Re)i "I (4)
where Gr is a modified Grashof number.
Gelbe3 reduced the scatter in correlation of dynamic holdup data by assuming that Hs varies with flow rate. He proposed the following correlation:
*>-'(£)"" [£]-«* (5)
where S is a shape factor. For Re< 1, where the influence of inertia is negligible, n = l / 3 (cf Davidson2), and for R e > l , where inertia increases and viscous drag decreases, n—5/11.
A number of other correlations have been proposed. These will not be discussed here, save to point out that the dependence of HD on flow rate has not been established satisfactorily.
Experimental Liquid Holdup Results A brief description of the pilot plant diffuser is
given in Appendix II.
Dynamic Holdup This was calculated as the product of mean resi
dence time and flow rate once steady state flow conditions were achieved. Mean residence time was taken as the time interval between injection of a dye into the top of the bagasse bed to the peak in outlet dye concentration. Experimental results are shown in figure 3. These data were obtained with bagasse bed heights varying from 30" to 35". The temperature of the percolating juice was 75°C; a few points obtained at 60°C and 90°C are included in figure 3 as they showed no significant variation. Flooding occurred at values of HD = ca. 300 lb.
A marked effect of cane preparation can be seen, and four curves can be drawn through the data for the four types of preparation used (see Appendix I). A certain amount of scatter can be observed, which is to be expected as significant variations between bagasse samples occur even with the same method of preparation.
It is clear from the preceding discussion that if constant liquid properties are assumed, HD is a function of flow rate and particle size only. Asssuming DI to be a measuring of* particle size, a correlation of the following form is indicated:
HD = AL» DIm (6)
where A, n and m are constants. Multilinear regression analysis showed L and DI to be significant at the 0.5% level. "Values of A, n and m, and their standard deviations are given in Table I.
A more general form of correlation was obtained as:
HD 1 = A1 L"1 DIml (7)
where HD 1 is defined as holdup per lb. fibre. The corresponding value of the constants are given in Table I. In both cases dynamic holdup can be predicted with a standard deviation of 15%. Thus a usable correlation for dynamic holdup has been obtained, but indicates perhaps that DI alone is not sufficient to specify the dependence of HD on particle size.
The values of n and n1 as given in the Table lie in between the values of exponents on flow rate
66 Proceedings of The South African Sugar Technologists'' Association — June 1970
(or Re) of 5/11 proposed by Gelbe3 and 0.75 proposed by Mohunta and Laddha5.
Static Holdup
Consideration of the nature of bagasse leads one to expect significantly higher values of the static holdup in a bed of bagasse than in a bed of conventional packing materials used in absorption or distillation, to which most data on holdup refer. This is due to the complex shapes of the bagasse particles and the affinity of bagasse for water, and the error involved in assuming Hs equal to the adherent holdup is greater in this case than with conventional packing materials.
Values of Hs were calculated by subtracting the dynamic holdup from the total holdup, which could be readily obtained from the weight of the contents of the diffuser. Experimental data are shown in figure 4. Again a dependence on flow rate and cane preparation can be observed. The scatter is more pronounced in this case, which on the basis of the preceding discussion is not unexpected; static holdup is a function of particle shape and size.
Values of the ratio of adherent holdup to fibre varied from 5 to just over 6. No significant trends could be discerned, other than a slight dependence on cane preparation. It can be seen from figure 4 that extrapolation to zero flow rate leads to a value between 5 and 6, thus supporting the contention that adherent holdup is equal to H3 at zero throughout3.
A correlation of static holdup/fibre ratio in terms of flow rate and DI was obtained by multilinear regression:
Hsx = B LP DI< (8)
Values of the constants B, p and q are given in Table I. It was found that DI is significant at the 0.5 % level, and L at the 5 % level. The standard deviation in predicted values of Hs1 is 19%.
Discussion The relations given above for holdup will be in
fluenced by the density of packing and bed height. Nevertheless, it is probable that the relationship between holdup, L and DI will still have the same form. Further, in the case of different liquid properties, different holdup values will be obtained. The effect of varying properties on liquid holdup has been thoroughly investigated by Shulman et. al.7'8.
Residence time of juice in diffusers has assumed a new importance recently; high residence time systems are associated with the production of more molasses and a consequently higher loss of sugar. The implications of a high static holdup are that some of the juice may remain in the bed for a long period of time, and have a far greater than average residence time in the bed. Higher static holdups are associated with coarser preparations; however, the total holdup of juice is less than that obtained with finer preparations. Higher flow rates significantly reduce the static holdup.
Conclusions 1. The fact that a relationship exists between DI and
particle size has been confirmed. Values of the constants in this relationship will depend on the method used to characterize particle size.
2. DI is a more reliable measure of cane preparation than particle size. Since it is still a relative measure of cane preparation, values of DI depend on the method of determination.
3. Static and dynamic holdup exhibit a strong dependence on cane preparation.
4. Both static and dynamic holdup depend on flow rate. The ratio HD/HS increases markedly with flow rate.
5. DI has been used as a measure of cane preparation to provide working correlations to predict holdup in fixed bed diffusers.
Acknowledgements The author wishes to express his thanks to Mr. M. R.
Joyce for his help in obtaining the experimental data, to Mrs. R. Wilkes who was responsible for the fine sieving tests, and to Mr. C. M. Young of Hulsmith for carrying out the multilinear regression analyses.
Further, the author is indebted to the Manager and Staff of Hulett's Mount Edgecombe Mill for their help and co-operation.
Finally, the advice and encouragement of Professor E. T. Woodburn and Dr. B. V. Preen are gratefully acknowledged.
Nomenclature DI = displaceability index dc = characteristic particle size (mm or ft) dD = particle size (mm or ft)
Vs
Fr = Froude Number = gdp
g = acceleration due to gravity (ft/sec2) Gr = modified Grashof Number = gdp
3 p2
HT = total holdup (lb) HQ = dynamic holdup (lb) Hs = static holdup (lb) HD 1 = HD/lb fibre Hs1 = Hg/lb fibre L = liquid mass velocity (lb/min ft2) Re = Reynolds Number dp L
V-V = Velocity of liquid based on empty column (ft/sec) We = Weber number = V2 pdp
tx = liquid viscosity (lb/min ft) p = liquid density (lb/ft3) cr = surface tension (lb/ft)
References 1. Buchanan, J. E., Ind. Eng. Chem. Fundam., 1967, 6,
400. 2. Davidson, J. F., Trans. Instn. Chem. Engrs., 1959, 37,
131. 3. Gelbe. H., Chem. Eng. ScL, 1968, 23. 1401 4. Markham, R. G., Proc. S. Afr Sug. Technol. Assoc,
1969, 43, 230. 5. Mohunta, D. M., and Laddha, G. S., Chem. Eng. ScL,
1965, 20, 1069. 6. Payne, J. H., Repts. Hawaiian Sug. Technol., 19 Ann.
Meeting, 1960, 107.
Proceedings of The South African Sugar Technologists' Association —
7. Shulman, H. L., Ullrich, C. F., and Wells, N. A., A.I. Chem. E. Jl., 1955, 1, 247.
8. Shulman, H. L., Ullrich, C. F., Wells, N., and Proulx, A. Z., A.I.Chem. E. Jl., 1955, 1, 259.
9. Standish, N., Chem. Eng. ScL, 1968, 23, 945. 10. Turner, G. A., uad Hewitt, G. F., Trans. Instn. Chem.
Engrs., 1959, 37, 329. 11. Van Swaaij, W. P. M., Charpentier, J. C, and Viller-
maux, J., Chem. Eng. Sci., 1969, 24, 1083.
TABLE I Values of regression coefficients and standard deviations for
equations (6), (7), and (8).
A n m
A1
n1
m1
B P q
Regression Coefficient
0.010 0.472 1.887
0.00052 0.494 1.728
1780 -0.154 -1.306
Standard Deviation
0.048 0.153
0.048 0.155
0.059 0.189
APPENDIX I
Preparation of bagasse samples Bagasse samples were taken from the milling tan
dem at Mount Edgecombe after the first mill. The bagasse could then be further prepared by the use of a small Hippo Mill, a fixed hammer shredder, with provision for the introduction of screens on the outlet in order to attain finer preparation.
The various degrees of preparation referred to in the text are:
PI First mill bagasse. P2 First mill bagasse, after passing through
the Hippo mill without a screen. P3 As above, but with a coarse screen in the
. Hippo mill. P4 As above, but with a fine screen.
APPENDIX II
Description of the pilot plant diffuser The diffuser consisted of a 2 ' D. mild steel column
6' high. The bagasse bed rested on a screen located towards the bottom of the column. The diffuser itself rested on three knife edges; two of them rested on a rigid supporting framework on one side of the column, and acted effectively as a pivot. The third
— June 1970 67
knife edge was attached to a Phillips PR 6101P/02HK load beam; any increase in weight in the diffuser increased the force on the load beam. This produced a signal proportional to the force, which was led to a recorder. Thus the weight of the contents of the diffuser could be continuously monitored.
The weight of the vessel itself was counter balanced by means of a weight-and-pulley system. A fine tare adjustment on the power supply to the load beam enabled accurate elimination of the weight of the vessel for recording purposes.
In operation, water or juice was pumped from a stirred thermostatistically controlled tank through a flow controller and into a flow distributor, suspended independently of the diffuser just above the bagasse bed.
At the commencement of a run, the weight was observed to increase; after a few minutes, the weight tended to a constant value, indicating steady state flow conditions. All holdup data reported here referred to steady state operation only.
Discussion Mr. Bruijn (in the chair): Do you favour a coarse
or fine preparation for diffusion? Mr. Rein: I suggest somewhere in between. If it is
too fine, the maximum flow rate is limited. On the other hand, if it is too coarse the extraction will be low.
Mr. Bruijn: Is not the flow rate connected with the type of diffuser, or does this apply to all diffusers, i.e. does it only apply to a percolation diffuser.
Mr. Rein: This applies mainly to percolation diffusers.
Mr. Jullienne: No mention is made in the paper of the effect of air locks. Was this investigated.
Mr. Rein: This was not investigated. It is more important when flooding occurs but as these data were taken when the bed was not flooded, air locks should have little effect.
Mr. Renton: Mr. Rein says that in the case of static hold up some of the juice may remain in the bed for a long time, i.e. longer than the usual residence time.
Percolation bed diffusers have a higher juice retention than fibre retention. Therefore, if there is static hold up, does this juice have less residence time than juice that is percolated.
Mr. Rein: The boundary between static and dynamic hold up is not absolutely defined, and there is interchange between the two.
Some parts of static hold up will be more firmly held in bagasse beds than others and it is those parts which are most firmly held that might be caught in the bed near the beginning of the diffuser, be taken to the end, and recirculated to the beginning.
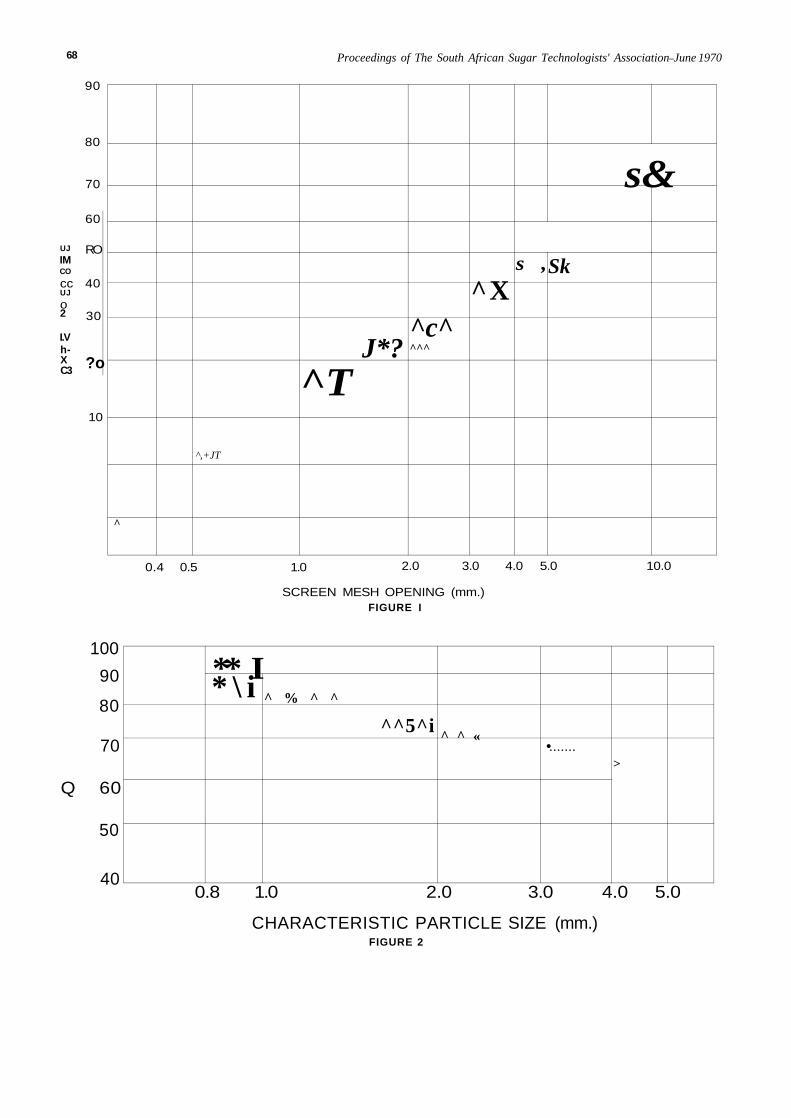
68 Proceedings of The South African Sugar Technologists' Association June 1970
90
80
70
UJ
IM CO
cc UJ
o 2
I.V h-X C3
60
RO
40
30
?o
10
^
^,+JT
J*? ^T
^c^ ^^^
^X
s&
s , Sk
0.4 0.5 1.0 2.0 3.0 4.0 5.0
SCREEN MESH OPENING (mm.) FIGURE I
100
90
80
70
Q 60
50
40
10.0
** I * \ i ^ % ^ ^
^^5^i ^ ^ «
• >
0.8 1.0 2.0 3.0 4.0 5.0
CHARACTERISTIC PARTICLE SIZE (mm.) FIGURE 2
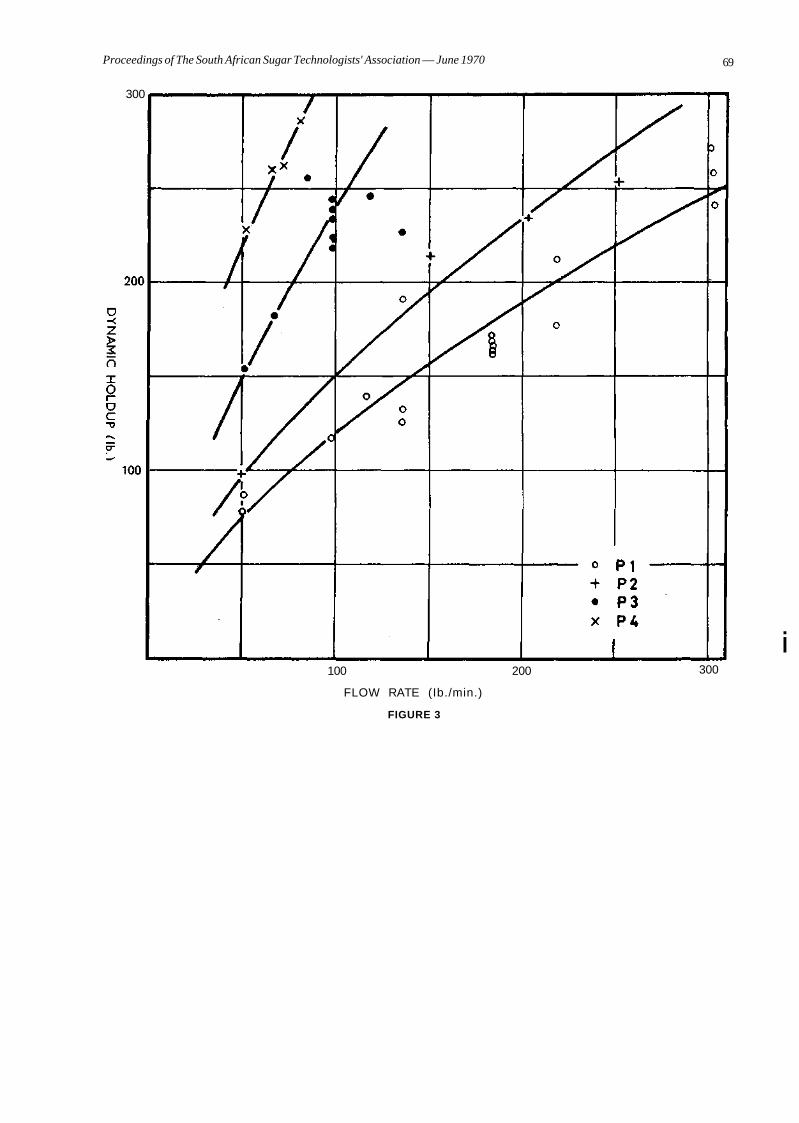
Proceedings of The South African Sugar Technologists' Association — June 1970 69
300
100 200
FLOW RATE (Ib./min.)
FIGURE 3
i 300
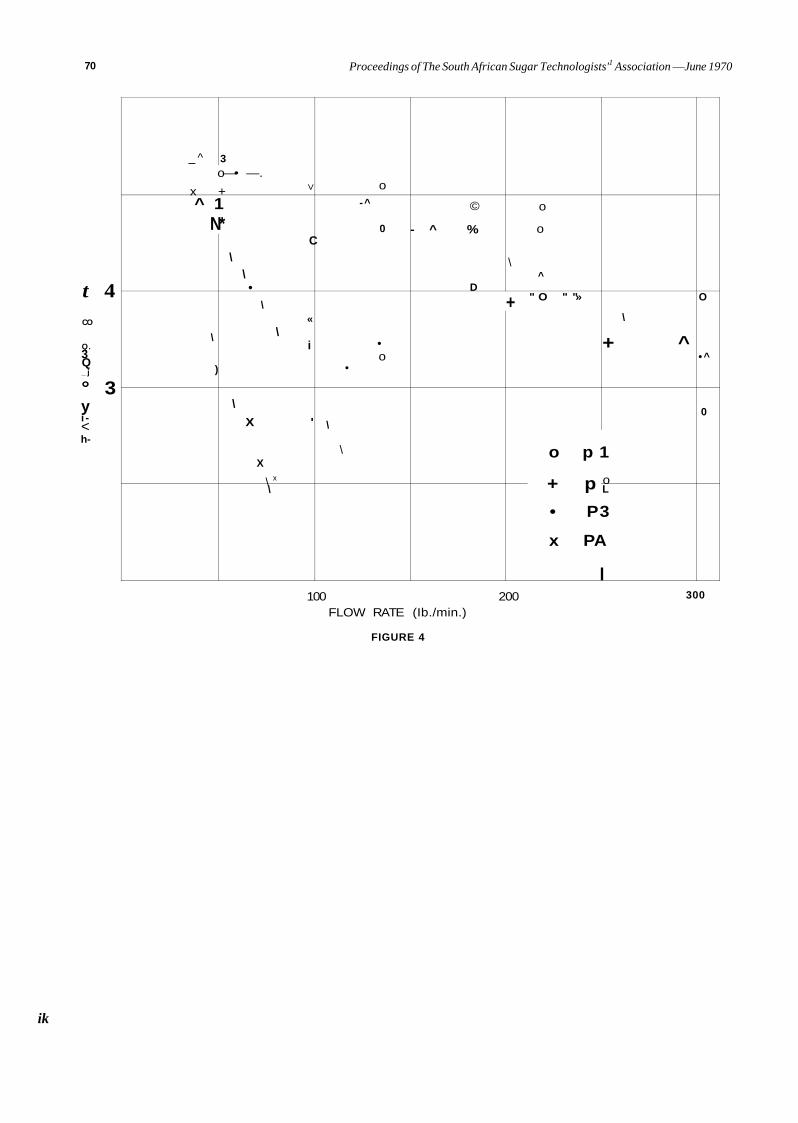
70 Proceedings of The South African Sugar Technologists'1 Association —June 1970
t 4 CO
Q. 3 Q _ j
° 3 y i -< h-
_ ^ 3 o—• —.
x + V
^ 1 N*
\
)
C \
\ •
\ «
\ i
\
X '
X
\ x
\
•
\
\
o -^
0
• o
©
- ^ %
D
\
+
o
o
^
" O " "»
\
+ ^
o p 1
+ p o L
• P3
x PA
I
O
• ^
0
100 200 FLOW RATE (Ib./min.)
FIGURE 4
300
ik
Proceedings of The South African Sugar Technologists' Association — June 1970 71
THE MUTUAL CLARIFICATION PROJECT-PROGRESS REPORT No. 2
By L. M. S. A. JULLIENNE*, M. MATIC and M. TEOKAROVIC
Sugar Milling Research Institute
Abstract Data collected in connection with the Mutual
Clarification Project during the 1969-70 season are presented and discussed in relation to juice and sugar quality. An explanation is offered for partial removal of starch which happens in the factories not using a specific removal process. The results of a factory test comparing liming at the boiling point of juice with the normal liming method are reported.
Introduction Ten factories submitted data required for the
Mutual Clarification Project during last season and weekly summaries were regularly issued by the Sugar Milling Research Institute from August onwards. Details of participating factories (and lengths of their contribution) are summarised in Table 1. Although several mills continued crushing during January 1970, the week ending 4th January, 1970, was used as a closing week for the purpose of calculating average performance figures.
The procedure followed and the analytical methods used in this project have been described in the previous report (1).
TABLE 1 Factories Participating in M.C.P.
Factory EM
No. of weeks 18
Period 2.8.69 7.12.70
Factory
Mixed Juice P 2 0 6 ppm/juice
Starch ppm/Bx
Purity
Clear Juice P 2 0 5 ppm/juice
Ca (Mg) ppm/juice
Starch ppm/Bx
Suspended matter % clear juice
Turbidity
FX
25
23.8.69 8.2.70
Max. Av. Min.
Max. Av. Min.
Av.
Max. Av. Min.
Max. Av. Min.
Max. Av. Min.
Max. Av. Min.
Max. Av. Min.
AK
28
2.8.69 8.2.70
DL
28
GH
24
2.8.69 16.8.69 8.2.70 1.2.70 30
JB
17
2.8.69 .11.70
TABLE 2 Analysis of Mixed and Clear Juices
EM
250 229 200
2075 1704 1150
83.16
40 31.7 20
—
1590 1238 700
.023
.010
.006
85f 77.3 74
FX
324 308 288
2182 1852 1490
83.54
64 57.3 52
700 558 507
1570 1255 1000
.473
.050
.008
.710
.516
.330
AK
237 193 124
2865 2137 1560
84.48
76 58. 32
590 565 549
1847 1325 853
.020
.011
.007
.270
.219
.190
DL
230 192 139
2092 1725 1494
84.71
51 3 40.5
3!
552 527 488
1668 1409 1158
.042
.032
.018
.200
.141
.110
GH
280 267 230
2032 1514 762
85.00
51 48.5 40
—
1550 1019 529
.037
.025
.018
.330
.247
.180
TS
18
2.8.69 18.1.70
JB
143 129 115
2095 1668 1362
82.00
36 30.6 29
841 613 560
879 678 592
.043
.030
.014
.290
.274
.260
ME
24
2 .8 . 11 .1 .
TS
303 264 228
2360 1620 1189
84.87
55 44.1 38
680 641 580
1523 1271 922
.029 ...013
.005
.320
.202
.140
IL
20
69 2.8.69 70 4.1.70
ME
272 209 170
2470 1716 1060
83.63
85 39.5 15
710 642 539
2130 1553 1200
.240
.095
.017
.380
.250
.180
IL
188 156 125
2470 1237 869
84.10
UK
28
2.8.69 8.2.70
UK
335 318 290
2175 1859 1316
87.18
45 44 34.3 33.8 28 30
864 689 525
894 690 497
.066
.034
.012
624 583 546
892 628 305
.090
.034
.010
.440
.285
.200
•Present address—The Tongaat Sugar Co. Ltd. fKopke
72 Proceedings of The South African Sugar Technologists' Association — June 1970
Results and Discussion
General A survey of participating factories was carried out
during the season and the information relevant to M.C.P. is summarised below:
All factories extract juice by conventional milling, the only exception being EM, which uses diffusion. In the latter case, the press water is limed to pH 7.0 and returned to the diffuser. At JB and 1L starch removal, using enzymes present in the juice, is practised. Lime is added to the mixed juice to bring the pH to 6.0, after which the juice is kept in retention tanks for eight minutes at 70°C. At UK starch is removed from the mixed juice by the Rabe process. All other factories, except ME, use the starch removal processes in the syrup stage.
The juice is heated to boiling point and flashed be- • fore liming at EM, FX, AK, DL, TS and ME. At JB lime is added to boiling juice before the flash tank and IL practises the conventional liming method. The juice leaving the vacuum clarifier at UK is heated to boiling point and flashed before being sent to subsidisers.
The pH of muds is brought up to 7.0 at JB and the pH of filtrate to 7.5 at IL by the addition of lime. Flocculant is also used. No chemicals are added to the muds at other factories.
Mixed Juice and Clear Juice The average analytical values of various para-"
meters determined in mixed and clear juices are presented in Table 2. In order to give an indication of the fluctuations which occurred, the maximum and minimum values obtained are also recorded. The average analytical figures for sugars (affinated) produced by the participating mills in the period under review are reproduced in Table 3.
TABLE 3 Analysis of Affinated Sugar (Average Values 31.12.69)
EM FX AK DL GH JB TS IL UK
ppm
950 1012 660 710 894 987 860
1016 910
ppm
245 165 76 95
187 135 133 135 149
ppm
32 31 22 35 16 20 30 25 18
°/o
0.076 0.084 0.047 0.068 0.057 0.074 0.071 0.050 0.049
% 39 44 55 48 48 41 52 41 38
The amount of phosphate present in mixed juice fluctuated considerably at all factories but on the whole was reasonably high. Two exceptions were JB and IL, where the phosphate was consistently low. Mono-calcium phosphate as well as flocculant were therefore regularly added to the mixed juice at JB. At IL only flocculant was used. Although UK had the highest P2Os content of mixed juice, both phosphate and flocculant were continuously added in
order to fulfil the requirements of the Rabe process. TS used flocculant only intermittently. The average consumption of these chemicals and of lime by various factories is given in Table 4.
TABLE 4 Consumption of Chemicals (Average)
Factory
EM FX AK DL GH JB TS ME IL UK
kg lime/ metric ton cane
0.58 0.53 0.51 0.53 0.55 —
0.60 0.54 0.52 0.51
* Seven weeks only ** One week only
kg phosphate/ metric ton cane
0.089 —
0.053** —
0.079
Flocculant, ppm mixed juice
3.61 0.47* 5.00** 5.02 6.75
There is no correlation between the soluble phosphate content of clear juice and the amount of inorganic P2Os found in the affinated sugar. This is illustrated in Fig. 1, where the factories are arranged in a descending order of phosphate crystal content. If the level of phosphate in clarified juice is taken as an index of the efficiency of juice clarification, as is sometimes done (4), one will have to conclude that clarification at, for example, AK and GH was not very good. Yet the phosphate contents of their crystals were low. In contrast, at DL phosphate in the clear juice was considerably lower than in the above two factories but phosphate in crystal was the highest recorded. It appears therefore that, within limits, boiling house work plays a more important role in determining the amount of P3Os included in the crystal, than does clarification.
The level of phosphate attained in clarified juice seems to be dependent on the amount of soluble phosphate present in mixed juice. Why this should be so is not clear, as better phosphate removal would be expected in the case of mixed juices rich in phosphate. In this connection the good performance achieved by IL is particularly surprising.
As expected, a reasonably good correlation (correlation coefficient 0.63) was found between the suspended matter present in clear juice and the filter-ability of affinated sugar (Fig. 2a). This was also true, although to a smaller extent, in the case of ash in sugar (Fig. 3a). The importance of efficient clarification if good quality sugar is to be produced is therefore obvious. In this connection it would appear (Table 2) that clarifier capacities at EM and FX are not adequate.
If FX is excluded, there was also a correlation between turbidity of clear juice and filterability of sugar (Fig. 2b). However, the influence of turbidity on the ash content of affinated sugar seems to be negligible (Fig. 3b).
The average Ca (Mg) content of the clarified juices was about 600 ppm (Table 2) but varied considerably not only between factories but also within one fac-
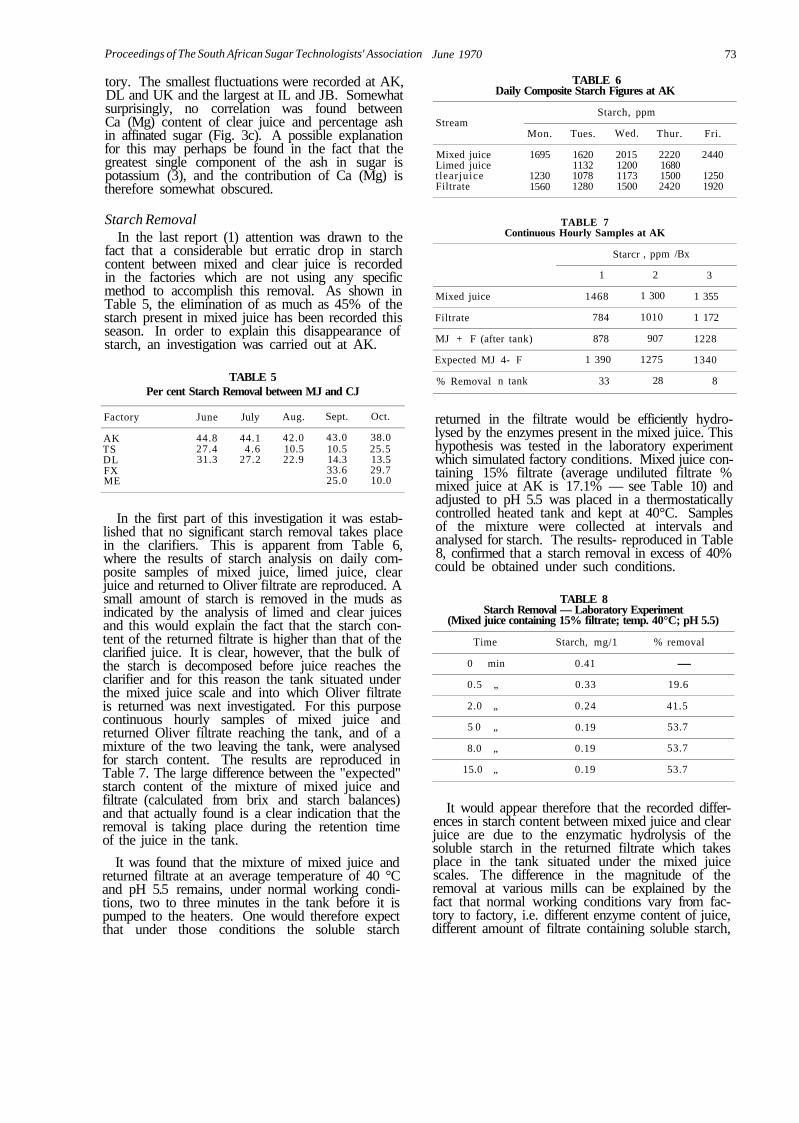
Proceedings of The South African Sugar Technologists' Association
tory. The smallest fluctuations were recorded at AK, DL and UK and the largest at IL and JB. Somewhat surprisingly, no correlation was found between Ca (Mg) content of clear juice and percentage ash in affinated sugar (Fig. 3c). A possible explanation for this may perhaps be found in the fact that the greatest single component of the ash in sugar is potassium (3), and the contribution of Ca (Mg) is therefore somewhat obscured.
Starch Removal In the last report (1) attention was drawn to the
fact that a considerable but erratic drop in starch content between mixed and clear juice is recorded in the factories which are not using any specific method to accomplish this removal. As shown in Table 5, the elimination of as much as 45% of the starch present in mixed juice has been recorded this season. In order to explain this disappearance of starch, an investigation was carried out at AK.
TABLE 5 Per cent Starch Removal between MJ and CJ
Factory
AK TS DL FX ME
June
44.8 27.4 31.3
July
44.1 4.6
27.2
Aug.
42.0 10.5 22.9
Sept.
43.0 10.5 14.3 33.6 25.0
Oct.
38.0 25.5 13.5 29.7 10.0
In the first part of this investigation it was established that no significant starch removal takes place in the clarifiers. This is apparent from Table 6, where the results of starch analysis on daily composite samples of mixed juice, limed juice, clear juice and returned to Oliver filtrate are reproduced. A small amount of starch is removed in the muds as indicated by the analysis of limed and clear juices and this would explain the fact that the starch content of the returned filtrate is higher than that of the clarified juice. It is clear, however, that the bulk of the starch is decomposed before juice reaches the clarifier and for this reason the tank situated under the mixed juice scale and into which Oliver filtrate is returned was next investigated. For this purpose continuous hourly samples of mixed juice and returned Oliver filtrate reaching the tank, and of a mixture of the two leaving the tank, were analysed for starch content. The results are reproduced in Table 7. The large difference between the "expected" starch content of the mixture of mixed juice and filtrate (calculated from brix and starch balances) and that actually found is a clear indication that the removal is taking place during the retention time of the juice in the tank.
It was found that the mixture of mixed juice and returned filtrate at an average temperature of 40 °C and pH 5.5 remains, under normal working conditions, two to three minutes in the tank before it is pumped to the heaters. One would therefore expect that under those conditions the soluble starch
June 1970 73
TABLE 6 Daily Composite Starch Figures at AK
Stream
Mixed juice Limed juice t learjuice Filtrate
Mixed juice
Filtrate
Mon.
1695
1230 1560
Starch, ppm
Tues.
1620 1132 1078 1280
Wed.
2015 1200 1173 1500
Thur.
2220 1680 1500 2420
TABLE 7 Continuous Hourly Samples at AK
MJ + F (after tank)
Expected MJ 4- F
% Removal n tank
1
1468
784
878
1 390
33
Starcr , ppm /Bx
2
1 300
1010
907
1275
28
Fri.
2440
1250 1920
3
1 355
1 172
1228
1340
8
returned in the filtrate would be efficiently hydro-lysed by the enzymes present in the mixed juice. This hypothesis was tested in the laboratory experiment which simulated factory conditions. Mixed juice containing 15% filtrate (average undiluted filtrate % mixed juice at AK is 17.1% — see Table 10) and adjusted to pH 5.5 was placed in a thermostatically controlled heated tank and kept at 40°C. Samples of the mixture were collected at intervals and analysed for starch. The results- reproduced in Table 8, confirmed that a starch removal in excess of 40% could be obtained under such conditions.
TABLE 8 Starch Removal — Laboratory Experiment
(Mixed juice containing 15% filtrate; temp. 40°C; pH 5.5)
Time
0 min
0.5 „
2.0 „
5 0 „
8.0 „
15.0 „
Starch, mg/1
0.41
0.33
0.24
0.19
0.19
0.19
% removal
—
19.6
41.5
53.7
53.7
53.7
It would appear therefore that the recorded differences in starch content between mixed juice and clear juice are due to the enzymatic hydrolysis of the soluble starch in the returned filtrate which takes place in the tank situated under the mixed juice scales. The difference in the magnitude of the removal at various mills can be explained by the fact that normal working conditions vary from factory to factory, i.e. different enzyme content of juice, different amount of filtrate containing soluble starch,
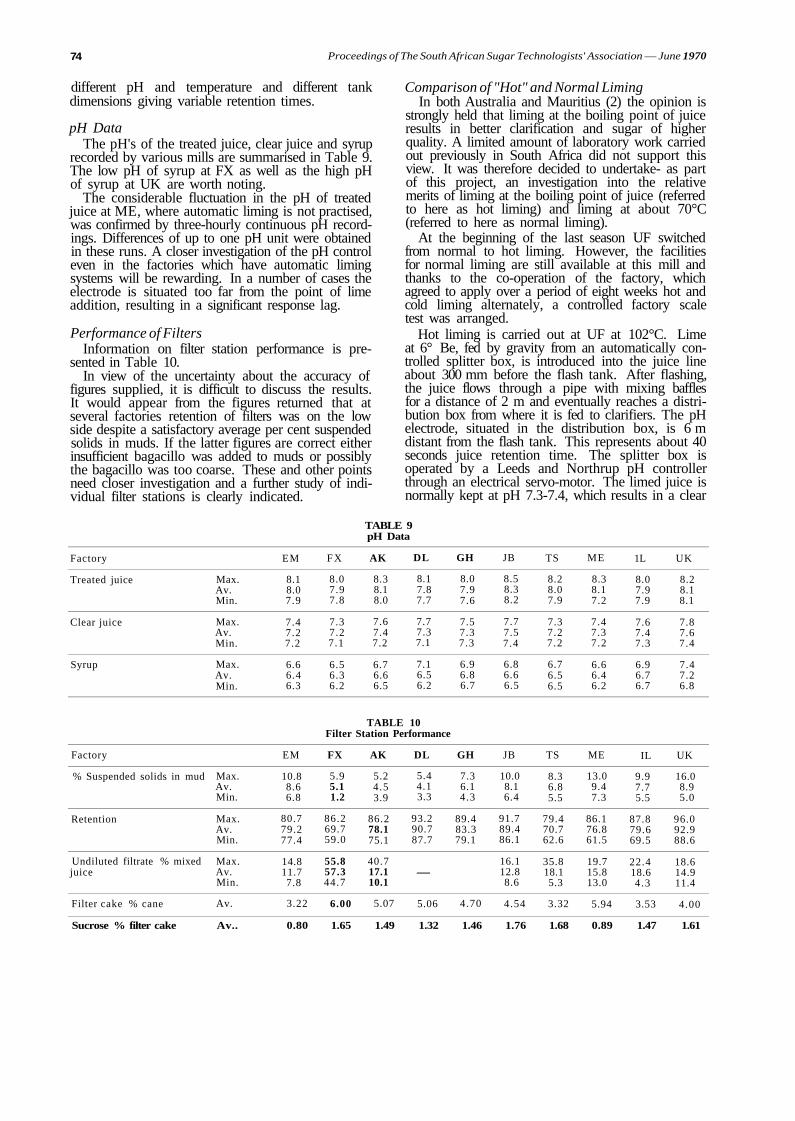
74 Proceedings of The South African Sugar Technologists' Association — June 1970
different pH and temperature and different tank dimensions giving variable retention times.
pH Data The pH's of the treated juice, clear juice and syrup
recorded by various mills are summarised in Table 9. The low pH of syrup at FX as well as the high pH of syrup at UK are worth noting.
The considerable fluctuation in the pH of treated juice at ME, where automatic liming is not practised, was confirmed by three-hourly continuous pH recordings. Differences of up to one pH unit were obtained in these runs. A closer investigation of the pH control even in the factories which have automatic liming systems will be rewarding. In a number of cases the electrode is situated too far from the point of lime addition, resulting in a significant response lag.
Performance of Filters Information on filter station performance is pre
sented in Table 10. In view of the uncertainty about the accuracy of
figures supplied, it is difficult to discuss the results. It would appear from the figures returned that at several factories retention of filters was on the low side despite a satisfactory average per cent suspended solids in muds. If the latter figures are correct either insufficient bagacillo was added to muds or possibly the bagacillo was too coarse. These and other points need closer investigation and a further study of individual filter stations is clearly indicated.
Comparison of "Hot" and Normal Liming In both Australia and Mauritius (2) the opinion is
strongly held that liming at the boiling point of juice results in better clarification and sugar of higher quality. A limited amount of laboratory work carried out previously in South Africa did not support this view. It was therefore decided to undertake- as part of this project, an investigation into the relative merits of liming at the boiling point of juice (referred to here as hot liming) and liming at about 70°C (referred to here as normal liming).
At the beginning of the last season UF switched from normal to hot liming. However, the facilities for normal liming are still available at this mill and thanks to the co-operation of the factory, which agreed to apply over a period of eight weeks hot and cold liming alternately, a controlled factory scale test was arranged.
Hot liming is carried out at UF at 102°C. Lime at 6° Be, fed by gravity from an automatically controlled splitter box, is introduced into the juice line about 300 mm before the flash tank. After flashing, the juice flows through a pipe with mixing baffles for a distance of 2 m and eventually reaches a distribution box from where it is fed to clarifiers. The pH electrode, situated in the distribution box, is 6 m distant from the flash tank. This represents about 40 seconds juice retention time. The splitter box is operated by a Leeds and Northrup pH controller through an electrical servo-motor. The limed juice is normally kept at pH 7.3-7.4, which results in a clear
TABLE 9 pH Data
Factory
Treated juice
Clear juice
Syrup
Factory
% Suspended solids in mud
Retention
Undiluted filtrate % mixed juice
Filter cake % cane
Max. Av. Min.
Max. Av. Min.
Max. Av. Min.
Max. Av. Min.
Max. Av. Min.
Max. Av. Min.
Av.
EM
8.1 8.0 7.9
7.4 7.2 7.2
6.6 6.4 6.3
EM
10.8 8.6 6.8
80.7 79.2 77.4
14.8 11.7 7.8
3.22
F X
8.0 7.9 7.8
7.3 7.2 7.1
6.5 6.3 6.2
AK
8.3 8.1 8.0
7.6 7.4 7.2
6.7 6.6 6.5
DL
8.1 7.8 7.7
7.7 7.3 7.1
7.1 6.5 6.2
TABLE 10 Filter Station Performance
FX
5.9 5.1 1.2
86.2 69.7 59.0
55.8 57.3 44.7
6.00
AK
5.2 4.5 3.9
86.2 78.1 75.1
40.7 17.1 10.1
5.07
DL
5.4 4.1 3.3
93.2 90.7 87.7
—
5.06
GH
8.0 7.9 7.6
7.5 7.3 7.3
6.9 6.8 6.7
GH
7.3 6.1 4.3
89.4 83.3 79.1
4.70
JB
8.5 8.3 8.2
7.7 7.5 7.4
6.8 6.6 6.5
JB
10.0 8.1 6.4
91.7 89.4 86.1
16.1 12.8 8.6
4.54
TS
8.2 8.0 7.9
7.3 7.2 7.2
6.7 6.5 6.5
TS
8.3 6.8 5.5
79.4 70.7 62.6
35.8 18.1 5.3
3.32
ME
8.3 8.1 7.2
7.4 7.3 7.2
6.6 6.4 6.2
ME
13.0 9.4 7.3
86.1 76.8 61.5
19.7 15.8 13.0
5.94
1L
8.0 7.9 7.9
7.6 7.4 7.3
6.9 6.7 6.7
IL
9.9 7.7 5.5
87.8 79.6 69.5
22.4 18.6 4 .3
3.53
UK
8.2 8.1 8.1
7.8 7.6 7.4
7.4 7.2 6.8
UK
16.0 8.9 5.0
96.0 92.9 88.6
18.6 14.9 11.4
4.00
Sucrose % filter cake Av.. 0.80 1.65 1.49 1.32 1.46 1.76 1.68 0.89 1.47 1.61
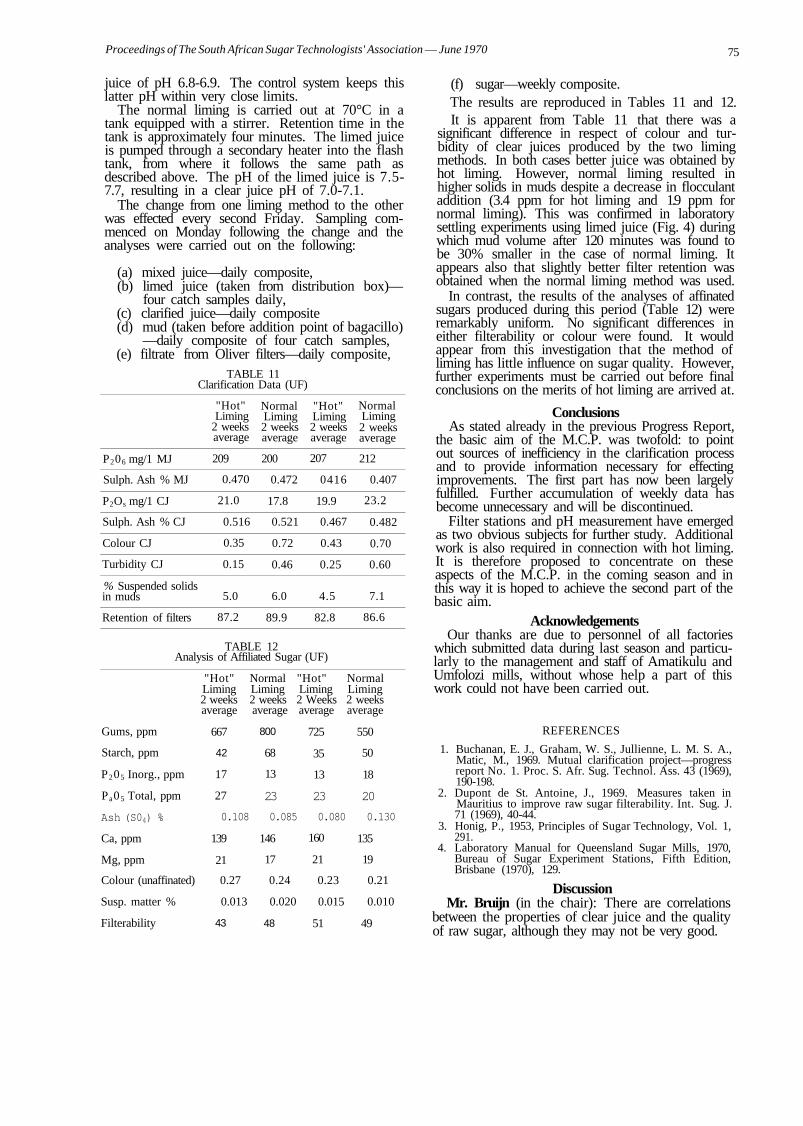
Proceedings of The South African Sugar Technologists' Association — June 1970 75
juice of pH 6.8-6.9. The control system keeps this latter pH within very close limits.
The normal liming is carried out at 70°C in a tank equipped with a stirrer. Retention time in the tank is approximately four minutes. The limed juice is pumped through a secondary heater into the flash tank, from where it follows the same path as described above. The pH of the limed juice is 7.5-7.7, resulting in a clear juice pH of 7.0-7.1.
The change from one liming method to the other was effected every second Friday. Sampling commenced on Monday following the change and the analyses were carried out on the following:
(a) mixed juice—daily composite, (b) limed juice (taken from distribution box)—
four catch samples daily, (c) clarified juice—daily composite (d) mud (taken before addition point of bagacillo)
—daily composite of four catch samples, (e) filtrate from Oliver filters—daily composite,
TABLE 11 Clarification Data (UF)
P206 mg/1 MJ
Sulph. Ash % MJ
P2Os mg/1 CJ
Sulph. Ash % CJ
Colour CJ
Turbidity CJ
% Suspended solids in muds
Retention of filters
"Hot" Liming
2 weeks average
209
0.470
21.0
0.516
0.35
0.15
5.0
87.2
Normal Liming 2 weeks average
200
0.472
17.8
0.521
0.72
0.46
6.0
89.9
"Hot" Liming 2 weeks average
207
0416
19.9
0.467
0.43
0.25
4.5
82.8
TABLE 12 Analysis of Affiliated Sugar (UF)
Normal Liming 2 weeks average
212
0.407
23.2
0.482
0.70
0.60
7.1
86.6
"Hot" Normal "Hot" Normal Liming Liming Liming Liming 2 weeks 2 weeks 2 Weeks 2 weeks average average average average
Gums, ppm 667 800 725 550
Starch, ppm 42 68 35 50
P205 Inorg., ppm 17 13 13 18
P a05 Total, ppm 27 23 23 20
Ash (S04) % 0.108 0.085 0.080 0.130
Ca, ppm 139 146 160 135
Mg, ppm 21 17 21 19
Colour (unaffinated) 0.27 0.24 0.23 0.21
Susp. matter % 0.013 0.020 0.015 0.010
Filterability 43 48 51 49
(f) sugar—weekly composite. The results are reproduced in Tables 11 and 12. It is apparent from Table 11 that there was a
significant difference in respect of colour and turbidity of clear juices produced by the two liming methods. In both cases better juice was obtained by hot liming. However, normal liming resulted in higher solids in muds despite a decrease in flocculant addition (3.4 ppm for hot liming and 1.9 ppm for normal liming). This was confirmed in laboratory settling experiments using limed juice (Fig. 4) during which mud volume after 120 minutes was found to be 30% smaller in the case of normal liming. It appears also that slightly better filter retention was obtained when the normal liming method was used.
In contrast, the results of the analyses of affinated sugars produced during this period (Table 12) were remarkably uniform. No significant differences in either filterability or colour were found. It would appear from this investigation that the method of liming has little influence on sugar quality. However, further experiments must be carried out before final conclusions on the merits of hot liming are arrived at.
Conclusions As stated already in the previous Progress Report,
the basic aim of the M.C.P. was twofold: to point out sources of inefficiency in the clarification process and to provide information necessary for effecting improvements. The first part has now been largely fulfilled. Further accumulation of weekly data has become unnecessary and will be discontinued.
Filter stations and pH measurement have emerged as two obvious subjects for further study. Additional work is also required in connection with hot liming. It is therefore proposed to concentrate on these aspects of the M.C.P. in the coming season and in this way it is hoped to achieve the second part of the basic aim.
Acknowledgements Our thanks are due to personnel of all factories
which submitted data during last season and particularly to the management and staff of Amatikulu and Umfolozi mills, without whose help a part of this work could not have been carried out.
REFERENCES
1. Buchanan, E. J., Graham, W. S., Jullienne, L. M. S. A., Matic, M., 1969. Mutual clarification project—progress report No. 1. Proc. S. Afr. Sug. Technol. Ass. 43 (1969), 190-198.
2. Dupont de St. Antoine, J., 1969. Measures taken in Mauritius to improve raw sugar filterability. Int. Sug. J. 71 (1969), 40-44.
3. Honig, P., 1953, Principles of Sugar Technology, Vol. 1, 291.
4. Laboratory Manual for Queensland Sugar Mills, 1970, Bureau of Sugar Experiment Stations, Fifth Edition, Brisbane (1970), 129.
Discussion Mr. Bruijn (in the chair): There are correlations
between the properties of clear juice and the quality of raw sugar, although they may not be very good.

76 Proceedings of The South African Sugar Technologists' Association —June 1970
Has not the importance of clarification been overrated and should we rather not be studying the boiling and crystallisation stages?
Dr. Matic: It is mentioned in the paper that once a certain level of clarification has been achieved, whatever that level may be, then the boiling house operations are very important.
If the juice is badly clarified and full of suspended matter, then of course there will be an effect on the final product.
Dr. Graham: It is stated that at Umfolozi lime is fed by gravity into the juice line before the flash tank. Is this correct?
In table 11 the colour figure given for hot liming is very low. The pH also has a marked effect on colour measurement and has this been taken into account?
When turbidity was measured, was compensation made for colour?
In this paper when hot liming is mentioned, it does not refer to saccharate liming.
What is the pH of mud at Jaagbaan that it has to be brought up to 7.0?
Why is the pH of the clear juice at Illovo brought up to 7.5?
Dr. Matic: I will answer the questions in reverse order.
The figures reported in the paper are as reported by the factories and they have been averaged.
Colour and turbidity were determined by standard methods and the pH has been adjusted as is normally done in colour measurement.
Mr. Conijn would perhaps explain the arrangements of Umfolozi.
Mr. Bruijn: The turbidity was measured by filtering off some of the juice and using the filtered juice as a blank, so colour was compensated for by the filtered solution.
Mr. Conijn: At Umfolozi, we do not inject into the flash tank but into the feed pipe about one foot from the flash tank, by gravity feed.
Mr. van Hengel: The pH's at Umfolozi of 6.8 and 6.9 when using hot liming and 7.0 and 7.1 when using normal liming, are considerably lower than other factories, i.e. Umzimkulu 7.6.
I think we should look critically at clarified juice pH and the resulting syrup pH. To take Umzimkulu as an example, I do not think it necessary to keep the pH of the syrup as close to 7.0 as possible at this temperature.
I think that, provided there is reasonable clarification, the pH of the syrup or clarified juice has an influence on whether or not free flowing C massecuites will be obtained.
Mr. Thumann, formerly of Umfolozi, and his successor, Mr. Conijn, I am sure agree with me on this.
Mr. Conijn: I think the pH should be kept as low as possible because of the effect on the colour of the sugar.
Mr. Jennings: The low syrup pH at Felixton corresponds with the best non-sucrose ratio for Natal factories and the high pH at Umzimkulu corresponds with the highest non-sucrose ratio for factories contributing to the M.C.P.
When the M.C.P. was first discussed, some technologists were critical of the decision to base all the conclusions on quality of sugar and I think the results have proved them right.
The crystallisation stage appears to be of overriding importance. Is it not possibly time to start a Mutual Crystallisation Project?
Some data on molasses should also have been submitted to the M.C.P.
Dr. Matic: It is possibly premature at this stage to start a Mutual Crystallisation Project, but I agree that crystallisation should be studied.
Data on molasses have not been included because they are presented in the next paper.
Consideration was given to including in the M.C.P. data on syrup analysis, but it was decided that the response from factories would be poor if too much was requested of them.
We did compare results from syrup as opposed to clear juice, using data from Hulett factories. Plotting of calcium and magnesium in clear juice against sul-phated ash in syrup gave poor correlation, when ash in syrup was compared with conductivity ash in crystal, a resonably good correlation was obtained.
I therefore do not think we have lost much by not including figures for syrup.
Mr. Alexander: Were the analyses performed on juices at the factories comparaible, as otherwise the conclusions drawn may not be justified?
At least syrup samples could be analysed at one point and would therefore be comparable.
In figure 3, turbidity of clarified juice and suspended matter in clarified juice is plotted against conductivity ash in afrinated sugar — what is the connection between the two? Turbidity and suspended matter are insoluble materials in the juices, whereas conductivity in afnnated sugar must result from ionised material. Is it expected that suspended matter at some stage goes back into solution to contribute towards the conductivity ash?
Dr. Matic: I think your suspicion regarding the analyses might be correct. We looked into the ways certain parameters were analysed and there are differences between factories, so correlations could be affected. Unfortunately, in these co-operative efforts it is difficult to force factories to do everything as you would like it done. However, our conclusions are only tentative and really indicate trends only.
Regarding turbidity, suspended matter and conductivity ash, one would expect the conductivity ash to result from soluble inorganic material. These graphs were plotted to indicate trends and were presented without trying to explain why turbidity and suspended matter appeared to show some correlation with conductivity ash.
Mr. Jullienne: Could not the inslu'ble P2Or> in the clear juice be connected with the soluble P2Os in sugar.
Dr. Matic: This point was not discussed in our paper because we did not have separate figures for organic and inorganic phosphate.
A certain amount of Phosphate, in addition to inorganic phosphate, is present in crystal and this might influence the line of phosphate shown here, but not •to a great extent.
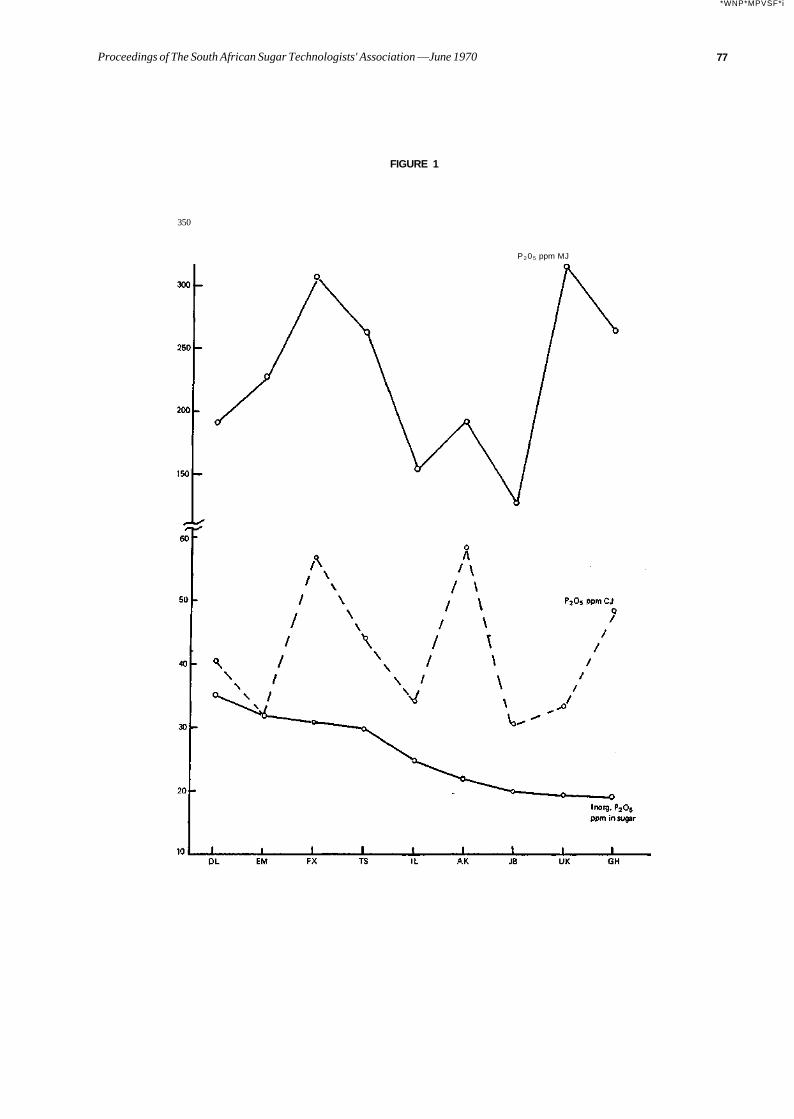
*WNP*MPVSF*i
Proceedings of The South African Sugar Technologists' Association —June 1970 77
FIGURE 1
350
P205 ppm MJ
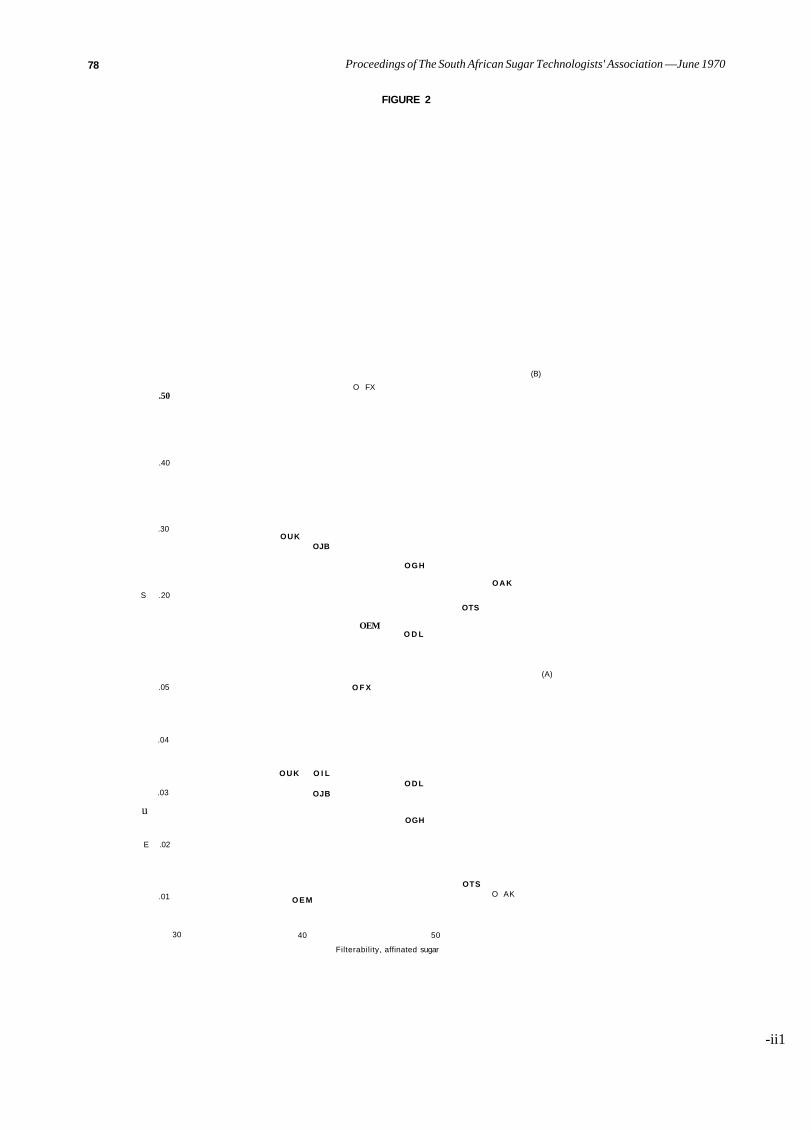
78 Proceedings of The South African Sugar Technologists' Association —June 1970
.04
E .02
FIGURE 2
.50 O FX
(B)
.40
.30
S .20
OUK OJB
OEM
OGH
O D L
O A K
OTS
.05 O F X
(A)
.03
u
O U K O I L
OJB O D L
OGH
.01 O E M
OTS O AK
30 40 50
Filterability, affinated sugar
-ii1
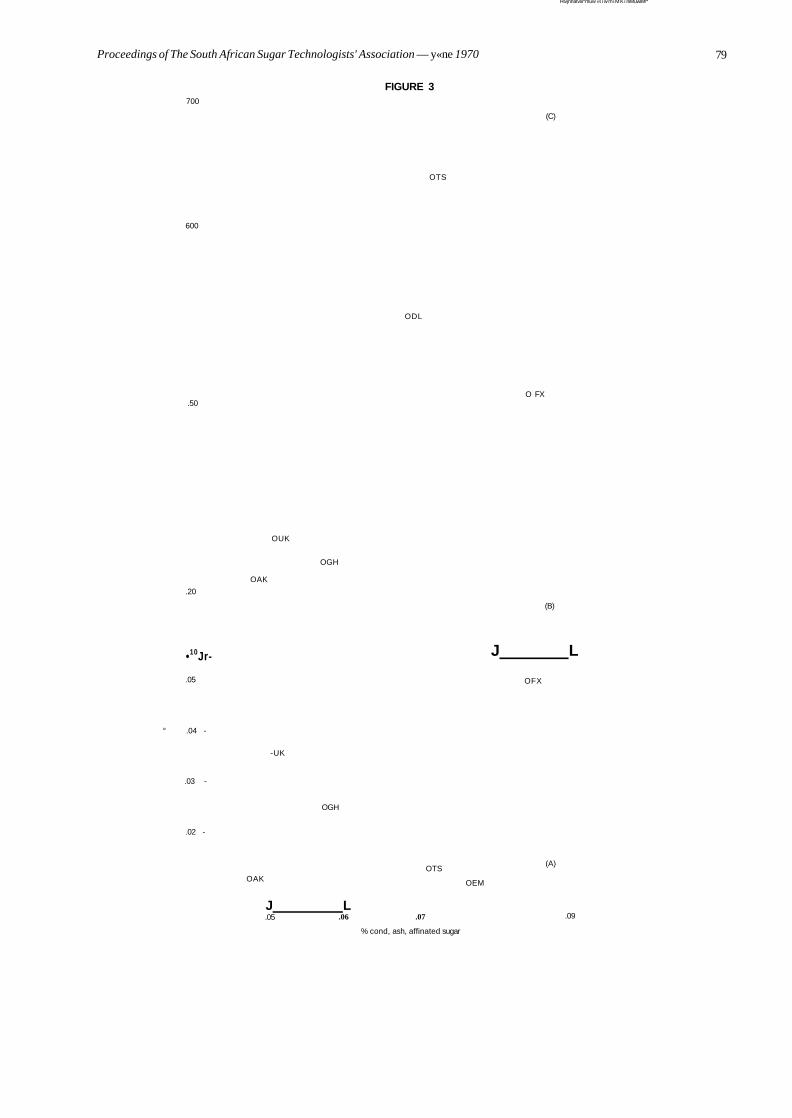
Hivjnnatviii muw »t i wmiMKi niMuwiM!*
Proceedings of The South African Sugar Technologists' Association — y«ne 1970
FIGURE 3 700
600
.50
.20
•10Jr-
.05
° .04 -
.03 -
.02 -
OUK
OAK
-UK
OAK
.05
OGH
OGH
J L
OTS
ODL
OTS
OEM
(C)
O FX
(B)
J L
OFX
(A)
.06 .07
% cond, ash, affinated sugar
.09
79
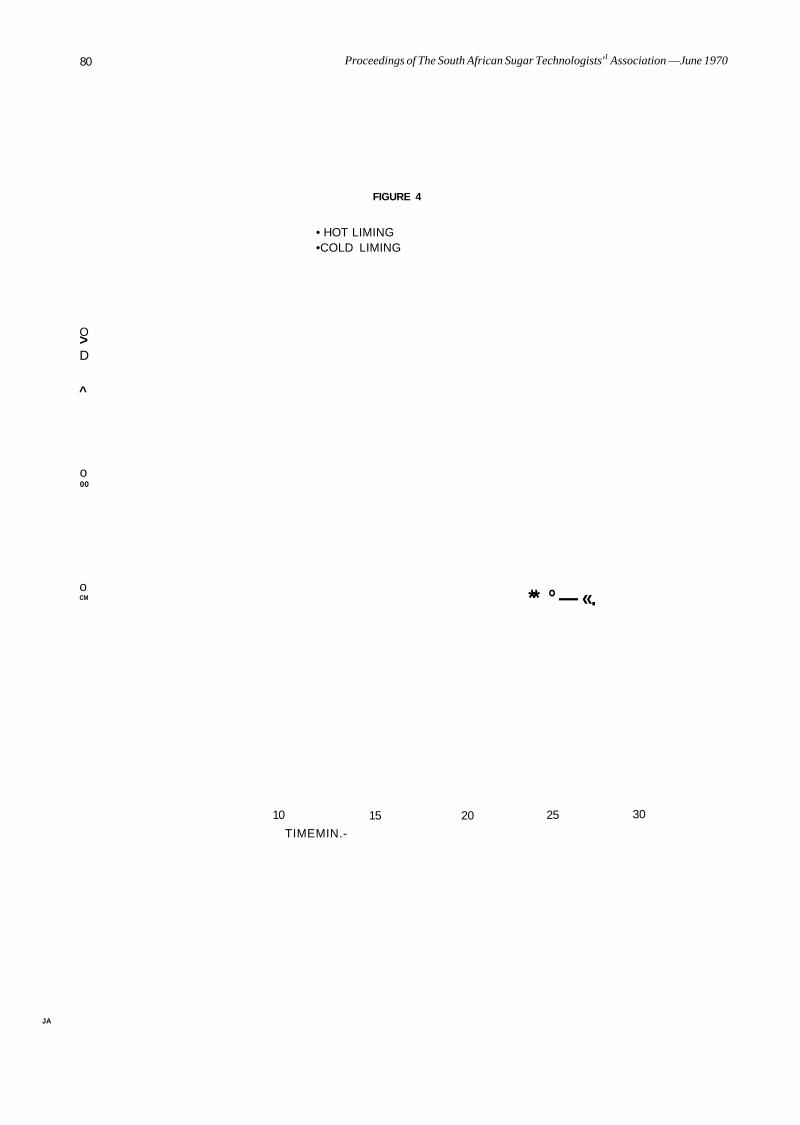
80 Proceedings of The South African Sugar Technologists'1 Association —June 1970
FIGURE 4
• HOT LIMING •COLD LIMING
O > D
^
o 00
o CM ** ° — «.
10 15 20 25 30
TIMEMIN.-
JA
Proceedings of The South African Sugar Technologists' Association — June 1970 81
COMPOSITION OF SOUTH AFRICAN FINAL MOLASSES
By A. W. MACGILLIVRAY and M. MATIC
Sugar Milling Research Institute
Abstract A survey has been carried out on the com
position of final molasses from South African sugar factories. Regional and seasonal trends in various parameters have been noted, and the degree of exhaustion of the molasses has been commented upon. Included in the survey are data on the non-sucrose constituents of molasses, and the inorganic ash components. Comparisons are made with a similar survey conducted in 1955/1956.
Introduction A detailed survey of the composition of South
African final molasses was carried out 15 years ago3. Since then three new factories have been opened in order to serve newly developed areas, the combined crushing rate of the mills has more than doubled and the average crushing rate has increased by 70%. Purity of mixed juice has dropped by about two points and the varietal scene has altered significantly (Co.331 and N.Co.310 varieties represented 80% of the cane crushed during 1955/56 season compared to 20% during the 1969/70 season). The methods of clarification have also changed. In 1955, defecation was practised by eight out of 17 factories. There was one carbonatation factory and the remaining mills used sulphitation. Profound changes, which could have influenced the composition of final molasses, have therefore taken place in the industry in the intervening years and it was felt that a new survey of the final molasses was highly desirable.
In order to assess the seasonal influences on the molasses composition, it was intended to collect four samples of final molasses from each factory, i.e. at the beginning of July, September, November and January. Ten mills supplied all four samples. Three samples were received from seven factories, either because they stopped crushing before January or for some other reason. RN sent two and PG one sample. ME, which produced high test molasses, was omitted from this survey.
Except for EN, where sulphitation is used, all other factories clarified their juice by either normal defecation or vacuum flotation (SZ, UK). However, ML, GH, SZ and PG are factories-cum-refineries. The first three use carbonatation with polishing sulphitation in their refining process and PG uses melt carbonatation only.
The analytical results obtained in the survey are presented in this paper and seasonal and regional influences on molasses and ash composition are discussed. Target purities are calculated by using the Douwes Dekker, Queensland and Mauritian formulae and are compared with the final molasses purities actually achieved.
Experimental The molasses samples which were analysed were
composite samples from each factory for the first week of July, September, November and January respectively. The analyses for sucrose, reducing sugars, ash, dry solids, colour and viscosity were done as soon as possible after receipt of the samples to avoid any effects of deterioration. Analyses of the ash constituents and the organic non-sugars were completed at the end of the season when all the samples were available.
The methods of analysis were as follows:
(a) Dry Solids The method is detailed in the Laboratory Manual
for South African Sugar Factories (1962) pages 67-8.
(b) Refractometer Solids The solids were determined on undiluted molasses
at 20 °C using an Atago Refractometer.
(c) Sucrose This determination was by Lane and Eynon titra
tion after acid hydrolysis7.
(d) Reducing Sugars By Lane and Eynon titration7.
(e) Sulphated Ash As described in the Laboratory Manual for South
African Sugar Factories (1962), page 56.
(f) Colour An approximately 50 Brix refined sugar solution
was decolourised with 1% (on solids) of active carbon. The solution was filtered over kieselguhr (0.7% on solids) on a Buchner funnel, and the pH was adjusted to 7.0 ± 0.1 with dilute HC1 or NaOH. The Brix was then adjusted to 50.0° ± 0 . 1 . One gramme of molasses and 99.0 g of the sugar solution were mixed to obtain a homogeneous solution. The colour was then determined by ICUMSA Method IP as is used for raw sugars. The colour attenuation was corrected for dry solids by multiplying the result by -j y-r, in order to eliminate the
effects of the varying water contents of the molasses.
(g) Viscosity The samples were adjusted to 80.0% dry solids by
adding the calculated weight of water to a known weight of molasses and viscosity was determined with a Hoppler Falling Ball Viscometer, at 25° and 50°C
82 Proceedings of The South African Sugar Technologists Association — June 1970
(h) Filierability Two per cent by weight of molasses was added to
a 60° Brix refined sugar solution, and the filter-abilities were determined by the Nicholson and Horsley method8. The filterabilities obtained were then expressed as a percentage of the figure obtained for the refined sugar solution, which was determined as a blank.
(i) Starch, Wax and Gums These were determined as described by Douwes
Dekker'.
(j) Aconitic Acid Thirty-five grammes of molasses were dissolved in
250 ml water, and 50 ml of neutral lead acetate were added. The precipitate was washed free of wax and fats, and dried. Decarboxylation was carried out by boiling the precipitate with glacial acetic acid in the presence of potassium acetate. The C0 2 given off was collected and the amount determined, from Which the aconitic acid was calculated.
(k) CaO, MgO and K20 These were determined as described by Douwes
spectroscopy10.
(1) Chloride This was determined by automatic potentio-
metric titration as described by Comrie2.
(m) Sulphate This was determined gravimetrically by precipita
tion with BaCl2.
(n) Protein Nitrogen was determined by the micro-Kjeldahl
method.
(o) Silica As described by Vogel11.
Results and Discussion The analytical data are presented in Tables I, II
and IV.
Dry Solids and Refractometer Solids Refractometer solids in Table I have been deter
mined on undiluted molasses samples. It was felt that the error which is obtained by this method is of a similar order to that when samples are diluted and filtered prior to reading. The average difference between refractometer solids and dry solids found for these samples was 2.78%, with a standard deviation between results of 0.82. A limited number of determinations carried out at the S.M.R.I. on various dilutions of molasses give differences ranging from 3 to 6.
The dry solids of the samples analysed varied between 76.89 and 84.79 with an average figure of 81.53. This is 2.18% higher than the average found in the previous survey3 of Natal final molasses. This may be due either to the improvement which has been made in centrifugal performance in the last 15 years or to lower viscosities of final molasses. Unfortunately no comparative figures are available.
Pol and Sucrose A number of the samples analysed were found to
have a pol value lower than the chemically determined sucrose. In all but one of these cases the samples were taken during November, when the reducing sugars were generally low. Conversely the greatest differences between sucrose and pol were found in samples having a high reducing sugars content. The effect of this phenomenon on the apparent and gravity purities is obvious and some of the anomalous results which have been found in the past by the factories may have been due to this discrepancy.
Colour It has been noted in the past that low pol sugars
produced at certain factories were very much higher in colour than at others. As this was largely due to the colour of the final molasses coating, it was thought to be of some interest to present comparative data for molasses colours. It is apparent from Figure 1 that the molasses colours were at a minimum during September, when mixed juice purities were highest. During November and January colours were substantially higher. One exception to this was JB, where no seasonal influence was observed. Disregarding EM and DL, both of whom produced very highly-coloured molasses, there appeared to be a regional influence, as molasses produced on the South Coast and in the Midlands were higher in colour than those from Zululand and the North Coast.
Surprisingly, there appears to be no correlation between the nitrogen content of molasses and the colour.
Viscosity It has been observed by a number of workers1 •5-9
that the limiting factor in molasses exhaustion is viscosity. In order to determine any seasonal or regional influences on the viscosities of Natal final molasses, the viscosities were determined at a fixed dry solids content of 80%. In most cases the viscosity of molasses from any one mill tended to reach a maximum during November. A very wide spread in viscosities between factories was observed, with figures ranging from 14 to 128 poises at 50°C and 93 to 855 poises at 25 °C.
Filterability It was felt that an indication of the suspended
matter in molasses could be obtained from a filter-ability measurement. A method was devised which approximated to the conditions of the Nicholson and Horsley filterability test8, and comparative figures were obtained for the September and January samples. A marked seasonal influence was observed, with a drop in filterability occurring towards the end of the season. This is in agreement with the trend found in the results of filterability tests of unaffinated low pol raw sugars in South Africa.
Exhaustion of Final Molasses As was mentioned earlier, the main limiting fac
tor in molasses exhaustion is the viscosity. This has been borne out by this survey, in which it was found
— June 1970 83 Proceedings of The South African Sugar Technologists' Association
0.65 f
0.55
that in most cases the highest molasses purities occurred in November, when the highest viscosities were recorded.
A number of formulae for the exhaustibility of final molasses are based on the ratio of reducing sugars to ash. Of the molasses samples analysed in this survey, almost all had the lowest reducing sugars/ash ratio in November, and a definite correlation is apparent with the degree of exhaustion. The data produced in this survey were applied to three different molasses exhaustion formulae, viz. the Douwes Dekker formula4: P = 35.886 - 0.08088 R + 0.26047A; the Queensland formula1 : P = 40.67 -17.80 log X; and the Mauritian formula9: P = 44.6O - 4X, where P = target purity, R = RS% non-sucrose, A = ash % non-sucrose, and X = RS/ ash.
In general the best agreement between the actual true purity and the target purity was obtained with the Douwes Dekker formula. However, in cases where particularly low reducing sugar/ash ratios were found, such as at EN and the South Coast mills, the Queensland formula provided better agreement. The formula originally derived from experimental data in Mauritius was as indicated above. However, it was found that a number of factories were consistently improving on the target, and hence it was decided to arbitrarily reduce the constant factor by three. Despite the fact that the equation was used in its original form when applying it to the results of this survey, the differences between true and target purities were greater in most cases than with the
July Sept. Nov. Jan.
other two formulae. This would seem to indicate that by Mauritian standards Natal final molasses is poorly exhausted, but as yet no direct comparison between viscosities have been made.
Composition of Dry Solids The composition of the molasses samples, on a dry
solids basis, are shown in Table II. There was a definite seasonal influence upon the
reducing sugars content as a percentage of the solids (Figure 2). November samples were the lowest in every case, whilst in general the January samples were the highest. The opposite seemed to be the case with the sulphated ash percentage dry solids (Figure 3), where January was the lowest and November the highest.
On a regional basis the lower South Coast mills of RN, SZ and UK were low in reducing sugars, as was noted in the previous section. EN was also very low in reducing sugars. An explanation for this may possibly be found in the relatively high pH's which are used in the Rabe process at SZ and UK, and which are also found in the sulphitation process used at EN.
Three factories which were conspicuous for their low ash per cent dry solids figures were ML, JB and UC. All three of these mills service newly developed cane-growing areas, some distance inland. The low ash content is probably not due to the type of cane grown in these areas as there is a considerable difference between the varieties found in the Eastern Transvaal and in the Midlands.
i i
-±- ' ' • 1 1 • 1 1 1 1 - J 1 I I i i I 1 _ PG ML UF EM FX EN AK DL DK GH GD MV TS JB UC IL RN SZ UK
FIGURE 1: Seasonal variation of molasses colour.
84 Proceedings of The South African Sugar Technologists' Association — June 1970
20.0
16.0
10.0 PG ML UF EM FX EN AK DL DK GH GD MV TS JB UC
FIGURE 2: Seasonal variation of reducing sugar content of molasses.
IL RN SZ UK
22.5
20.0
July
. Sept.
Nov. Jan.
12.5 PG ML UF EM FX EN AK DL DK GH GD MV TS JB UC
FIGURE 3: Seasonal distribution of ash content of molasses. RN SZ UK
>k • %
Proceedings of The South African Sugar Technologists' Association — June 1970 85
Seasonal influences in the gum content (Figure 4) are also apparent, with November again having the highest figures, and January the lowest. There seemed to be a slight increase in wax content from September to January while the protein content declined slightly over the same period. No seasonal differences could be detected in the aconitic acid contents.
Table III shows the comparison between the average non-sucrose constituents of the molasses produced in July/September 1955 and September/ January 1969/70. The carbonated ash shown for 1969 has been calculated from the relationship:—
Carbonated ash=sulphated ash x 0.752. This is an aoproximation based on the figures presented by Douwes Dekker'1.
TABLE m Average composition of the "Non-Sucrose" of Final Molasses
Total non-sucrose % molasses Reducing sugars % N-S Carbonated ash % N-S Starch % N-S Gums % N-S Wax % N-S Crude protein % N-S U.O.M. % N-S
1969/70 45.95 33.80 24.27 ' 0.34 5.86 1.10
11.88 22.75
1955/6 42.75 30.50 26.75
1.04 7.43 0.94 7.13
27.30
It would seem from Table III that the reducing sugars are higher and the ash lower now than was the
case 15 years ago. This is reflected in the true purities of final molasses which were on the average 46.2 in 1955 and 44.7 in 1969/70 seasons.
As was to be expected, owing to the introduction of starch-removal processes, the starch and total gums are lower than in 1955. The sum of the protein and undetermined organic matter is very similar in both surveys and the difference in protein figures is not thought to be significant. Wax content is of very much the same order in both cases.
Composition of the Inorganic Ash of Molasses The composition of the ash of the final molasses
samples analysed is shown in Table IV. Potassium represents roughly one-third of the ash
in most cases. Magnesium is a major constituent, but in contrast to the figures reported in 1955, in no case was the magnesium content higher than that of the calcium. JB, and to a lesser extent UC, are low in magnesium while EN, JB and UK are rather higher than average in calcium.
An interesting feature of Figure 5, where average results for various constituents are plotted, is the relationship between potassium and chloride on the one hand and calcium and sulphate on the other. Very little regional or seasonal trend in inorganic constituents is apparent.
The molasses samples from EN were somewhat different from the rest of the factories in their ash composition, particularly with respect to potassium, chloride, calcium and sulphate. This was no doubt due to the sulphitation process still practised in this factory.
FX EN AK DL DK GH GD MV TS JB UC
FIGURE 4: Seasonal distribution of gums content of molasses.
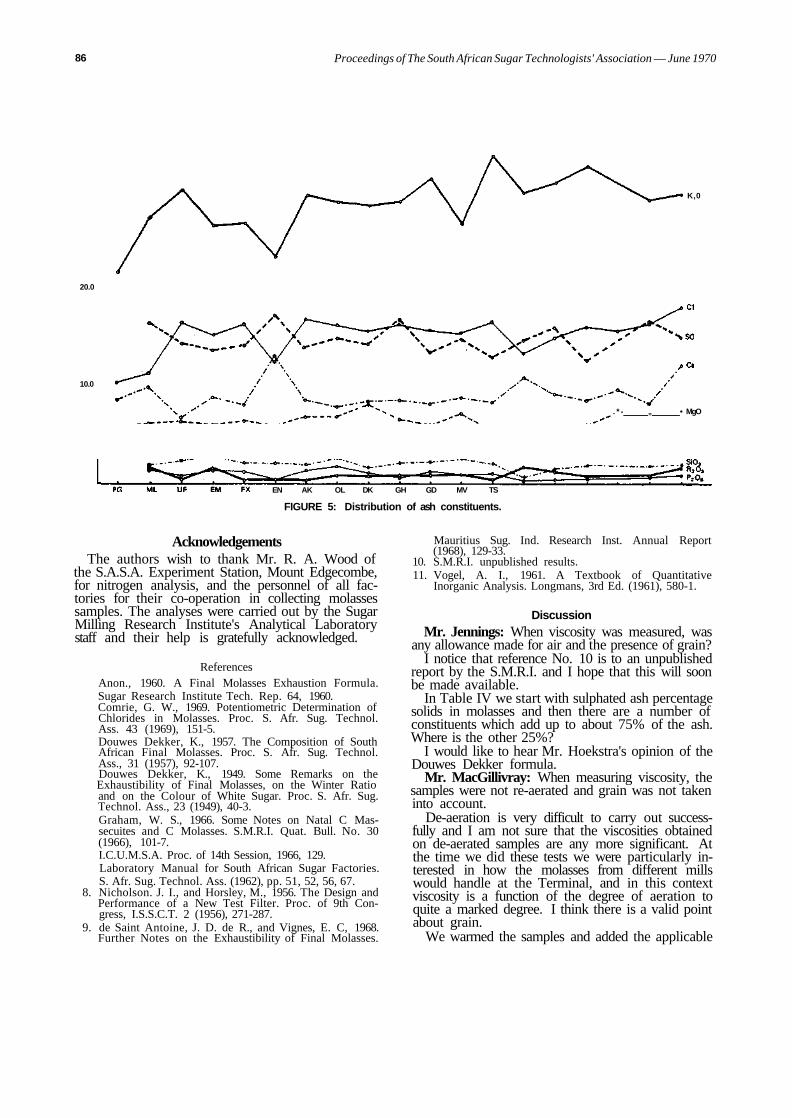
86 Proceedings of The South African Sugar Technologists' Association — June 1970
20.0
10.0
K,0
. * - „ • MgO
EN AK OL DK GH GD MV TS
FIGURE 5: Distribution of ash constituents.
Acknowledgements The authors wish to thank Mr. R. A. Wood of
the S.A.S.A. Experiment Station, Mount Edgecombe, for nitrogen analysis, and the personnel of all factories for their co-operation in collecting molasses samples. The analyses were carried out by the Sugar Milling Research Institute's Analytical Laboratory staff and their help is gratefully acknowledged.
References Anon., 1960. A Final Molasses Exhaustion Formula. Sugar Research Institute Tech. Rep. 64, 1960. Comrie, G. W., 1969. Potentiometric Determination of Chlorides in Molasses. Proc. S. Afr. Sug. Technol. Ass. 43 (1969), 151-5. Douwes Dekker, K., 1957. The Composition of South African Final Molasses. Proc. S. Afr. Sug. Technol. Ass., 31 (1957), 92-107. Douwes Dekker, K., 1949. Some Remarks on the Exhaustibility of Final Molasses, on the Winter Ratio and on the Colour of White Sugar. Proc. S. Afr. Sug. Technol. Ass., 23 (1949), 40-3. Graham, W. S., 1966. Some Notes on Natal C Mas-secuites and C Molasses. S.M.R.I. Quat. Bull. No. 30 (1966), 101-7. I.C.U.M.S.A. Proc. of 14th Session, 1966, 129. Laboratory Manual for South African Sugar Factories. S. Afr. Sug. Technol. Ass. (1962), pp. 51, 52, 56, 67.
8. Nicholson. J. I., and Horsley, M., 1956. The Design and Performance of a New Test Filter. Proc. of 9th Congress, I.S.S.C.T. 2 (1956), 271-287.
9. de Saint Antoine, J. D. de R., and Vignes, E. C, 1968. Further Notes on the Exhaustibility of Final Molasses.
Mauritius Sug. Ind. Research Inst. Annual Report (1968), 129-33.
10. S.M.R.I. unpublished results. 11. Vogel, A. I., 1961. A Textbook of Quantitative
Inorganic Analysis. Longmans, 3rd Ed. (1961), 580-1.
Discussion Mr. Jennings: When viscosity was measured, was
any allowance made for air and the presence of grain? I notice that reference No. 10 is to an unpublished
report by the S.M.R.I. and I hope that this will soon be made available.
In Table IV we start with sulphated ash percentage solids in molasses and then there are a number of constituents which add up to about 75% of the ash. Where is the other 25%?
I would like to hear Mr. Hoekstra's opinion of the Douwes Dekker formula.
Mr. MacGillivray: When measuring viscosity, the samples were not re-aerated and grain was not taken into account.
De-aeration is very difficult to carry out successfully and I am not sure that the viscosities obtained on de-aerated samples are any more significant. At the time we did these tests we were particularly interested in how the molasses from different mills would handle at the Terminal, and in this context viscosity is a function of the degree of aeration to quite a marked degree. I think there is a valid point about grain.
We warmed the samples and added the applicable
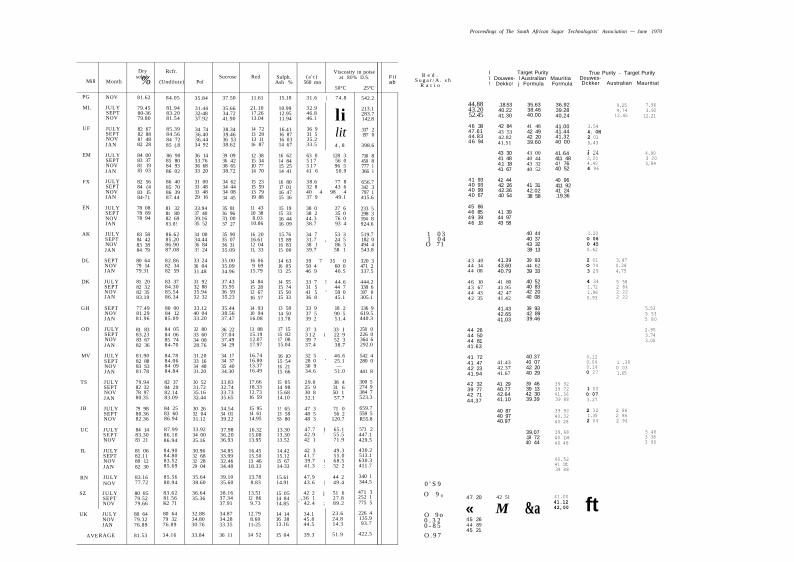
Mill
PG
ML
UF
EM
FX
EN
AK
DL
DK
G H
O D
MV
TS
JB
UC
IL
RN
SZ
UK
AVE
Month
NOV
JULY SEPT NOV
JULY SEPT NOV JAN
JULY SEPT NOV JAN
JULY SEPT NOV JAN
JULY SEPT NOV JAN
JULY SEPT NOV JAN
SEPT NOV JAN
JULY SEPT NOV JAN
SEPT NOV JAN
JULY SEPT NOV JAN
JULY SEPT NOV JAN
JULY SEPT NOV JAN
JULY SEPT NOV
JULY SEPT NOV
JULY SEPT NOV JAN
JULY NOV
JULY SEPT NOV
JULY NOV JAN
RAGE
Dry solids % 81.62
79.45 80-36 79.80
82 67 82 88 8! 48 82 28
84 00 83 37 81 19 83 03
82 56 84 (4 83 15 84-71
78 08 78 89 78 94
83 58 84 42 83 38 84 79
80 64 79 14 79.31
81 20 82 32 82 35 83.19
77.49 81.29 81.96
81 83 83.23 83 67 82 36
81.90 82 88 83 S3 81.78
79.94 82 32 78 97 80.35
79 98 80.36 82.36
84 14 83.30 83 21
81 06 82.11 80 12 82 30
83.16 77.72
80 85 79.52 79.66
80 64 79.32 76.89
81.53
Rcfr.
(Undilute)
84.05
81.94 83.20 81.54
85.39 84.56 84 72 85 (.8
. 86 90 85 80 84 93 86 02
86 40 85 70 86 39 87.44
81 32 8t 80 82 69 83.8!
86.62 85.20 86.90 87.08
82.86 82 34 82 59
83 37 84.30 85.54 86.34
80 00 84 12 85.09
84 05 84 06 85 74 84-70
84.78 84.06 84 09 84.84
82 37 84 20 82.14 83.09
84 25 83 60 86.94
87.99 86.10 86.94
84.90 84.80 83.52 85.69
85.56 80.94
83.62 81.56 K2 71
80 64 79 32 76.89
34.16
Pol
35.84
31.44 32-48 37.92
34 74 36.40 36.44 34 92
36 14 33.76 36 68 33 20
31 00 33 48 33 48 29 16
33.94 37 40 39.16 35 52
34 00 34.44 36 84 3! 24
33 24 36 04 31.48
33 92 32 88 35.94 32 32
33.12 40 04 33.20
32 80 33 60 34 08 28.76
31.20 33 16 34 48 31.20
30 52 31.72 35.16 32.44
30 26 32 04 31.12
33.92 34 00 35.16
30.96 32 68 32 28 29 04
35.64 38.60
36.64 35.36
32.88 34.80 30.76
33.84
Sucrose
37.50
35.66 34.72 41.90
38.34 39.46 36 53 38.62
39 09 36 42 38 65 38.72
34 62 34 44 34 08 34 45
35 81 36 96 3') 00 37 27
35 90 35 07 36 31 35.09
35.00 35.09 34.96
37.43 35.95 36 59 35.23
35.44 38.56 37.47
36 22 37.04 37.49 34 29
34 17 34 37 35 40 34.30
33.83 32.74 33.73 35.65
34.54 34 01 39.22
37.98 36.20 36.93
34.85 33.99 32.46 34.48
39.10 35.60
38.16 37.34 37.91
34.87 34.28 33.35
36 11
Red
11.61
21.10 17.26 13.04
14 72 13 28 13 11 16 87
12 38 15 34 10 77 14 70
15 23 15 59 13 79 19 88
11 43 10 38 8.03
10.86
16 20 16.61 12 04 11, 33
16 06 9 69
15.79
14 84 15 28 12 67 16 57
14 93 10 94 16.08
13 88 15.19 12.07 17.97
16.74 16.80 13.37 16.49
17.66 18.33 12.73 16 59
15 95 14 61 14.95
16.32 15.08 13.95
16.45 15.50 13 46 18.33
13.78 8.83
13.51 12 86 9.73
12.79 8.60
11-25
14 52
Sulph. Ash %
15.18
10.99 12.95 11.94
16.41 16 87 16 03 14 67
16 62 14 84 15 25 14 41
16 80 17 01 16 47 15 16
15 19 15 33 16 44 16 09
15.76 15 89 16 83 15 00
14 63 16 05 13 25
14 55 15 ?4 15 50 15 33
13 58 14 50 13.78
17 15 15 82 17 08 15.04
16 iO 15 54 16 21 15 66
15 05 14 98 15.68 14.10
1! 65 13 58 S3 80
13.30 13.30 13.52
14.42 15.12 15 67 14-33
15.61 14.91
15 05 14 84 14.85
14 14 16 38 13.16
15 04
(a 'c) 560 mn
Viscosity in poise at 8 0 % D.S.
50°C 25°C
31.6 | 74.8
32.9 46.8 46.1
36 9 31 5 35.2 33.5
li lit 4 , 8
63 0 128 3 5 1 7 56 0 5 1 7 96 5 41 6 50.9
38.6 77 8 32 8 43 6 40 4 98 4 37 9 49.1
38 0 27 6 38 2 35 0 44.3 76 0 38.7 93 4
34 7 53 3 31.7 , 24 5 38 1 86 5 39.7 58 1
39 7 35 0 50 4 60 0 46 9 40.5
33 7 ! 44.6 31 5 44 7 41 5 ' 59 0 36 8 45.1
33 9 18 2 37 5 90 5 39 2 51.4
37 3 33 I 3 1 2 i 22 9 39 7 52 3 37.4 38.7
32 5 46.6 28 0 ' 25.1 30 9 — 34.6 51.0
29.0 38 4 25 9 31 6 30 8 50 1 32.1 57.7
47 3 71 0 48 5 56 2 48 3 120.7
47.7 1 65.1 42.9 ; 55.5 42 1 71.9
42 3 49.3 41.7 55.0 39.7 i 68.5 41.3 : 52 2
47,9 44 2 43.6 | 49.4
42 2 j 51 6 . ,36 1 27.8 ' 42.4 ; 89.2
34.1 45.8 44.5
39.3
23.6 24.8 14.3
51.9
542.2
213.1 283.7 142.8
337 2 197 0
398.6
730 8 450 8 777 1 366 1
656.7 342 3 797 1 415.6
233 5 298 3 594 8 924.6
519.7 182 0 494 4 543.8
320 3 471 2 337.5
444.2 338 6 397 0 305.1
136 9 619.5 440.3
258 0 226 0 364 6 292.0
542 4 280 0
441 8
300 5 274 9 384 7 523.3
659.7 558 5 R55.8
573 2 447.1 429.5
430.2 513.1 630.3 411.7
340 1 344.5
471 3 252 1 775 5
226 4 135.9 93.7
422.5
Proceedings of The South African Sugar Technologists' Association ~- June 1970
Fi l ab
R e d . S u g a r / A . s h
R a t i o
I Target Purity \ Douwes- l Australian Mauritia ! Dekkcr j Formula Formula
True Purity - Target Purity Douwes-Dckker Australian Mauritiat
1 0 3 1 0 4 O 71
0 ' S 9
O 9 0
O 9 o 0 . 3 2 0 - 8 5
O . 9 7
44,88 43.20 52.45
46 38 47.61 44.83 46 94
41 93 40 93 40 99 40 67
45 86 46 85 49 39 46 .18
4 3 40 4 4 34 4 4 08
4 6 10 4 3 67 4 4 43 42 35
44 26 44 50 44 81 41.63
41 72 41 47 42 23 41.94
42 32 39 77 42 71 44,37
47 20
« 45 26 4 4 89 45 21
.18.53 40.22 41.30
42 84 43 53 42.82 41.51
43 30 41 48 4.1 18 41 67
42 44 42 26 42.36 40 54
4.1 39 44 97 43 58
41.39 43.60 40.79
41 80 41.95 42 47 41.42
41.43 42.65 41,03
41.43 42.37 41.67
41 29 40.77 42.64 41.10
40 87 40 97 40.97
42 51
M
35.63 38.46 40.00
41 48 42 49 42 20 39.60
43 00 40 44 43 32 40 52
41 31 42.02 38 58
40 44 40 37 43 32 39 13
39 93 44 62 39 33
40 52 40 83 42 20 40 08
39 93 42 89 39.46
40.37 40 07 42 20 40 29
39 46 39 13 42 30 39.39
39,07 .19 72 40 44
&a
36.92 39.28 40,24
41.00 41.44 41,32 40 00
41.64 411 48 4! 76 40 52
40 96 411 92 41 24 .19.36
39 92 39 72 41,36 39 88
39 92 40.32 40 28
39,68 40 1)8 40 48
40.52 41 1ft 39 48
41.00 41.12 42,00
3.54 4. OH 2 01 5,43
i 24 2,20 4.42 4 96
1.20 O 06 0 45 0.62
2 01 O 74 3 29
4 34 1.72 1.96 0.93
0.12 0,04 0.14 O 27
1 00 O 07 3.27
2 32 1.35 2 04
ft
9.25 4,74 12.45
3,47 0.28 4.75
5 58 2 84 2 22 2 22
i .39 0 03 1.65
2 86 2 86 2 94
7.96 3.92 12.21
4.90 3 20 5,84
5.53 5 53 5 80
2.90 3.74 3.05
5 46 3 38 3 90

i %
I
f
!
&
i 1
X,
Hi
3
0 On
5"
NO
V
SEPT
JU
LY
JA
N
NO
V
SEPT
JU
LY
JA
N
NO
V
SEPT
JU
LY
JA
N
NO
V
SEPT
JU
LY
JA
N
NO
V
SEPT
JU
LY
oo-Scs —
ON OS OO _ , , , . m O \ m o o c s s o
V O Q ^ O S O W ! 1 1 O O ^ - » - H - H .
© m m *t r-C\mCMCM</"><nOOO
OOTC—. t s
82.5
6 41
.93
18.4
5 20
.4
0.2
©sor~."*j-cnfnr-mos m s o r - r - o m o —<•>* 0 0 T * . M «
n * N « \ t O r H l ^ M X O ' n 1 I 1 00 ^ - ^ ~H
r ~ o o o r-
m m o o f ~ © m © » - * s o o o n - — i —i
-* so" •<a- os d n- 1 1 1 00 T f - ^ H
o o n - o Q CNOsu- ioown^r-so M > o o f - o n o - s - * O O T f C M "
81.4
8 44
.83
16.0
9 19
.7
0.03
2.
9
oor—c-l os
C l t - ^ O O O C S O r - l O O o o - « » « < S
r~-oo»-i
cs"sdl--osdcN 1 1 1 0 0 - ^ * - ! - *
1 1 I 1 1 II 1 1
o v N i e m o V i 1 1 1
s o ~ « o o s o t«CS'<a- ' -«c-10mooco © e n - H v o o c i © * - i s o 00-*<N»-<
79.4
5 44
.88
26.5
6 13
.8
0.2
1 1 1 1 1 1 1 1 1
( S - * c s _^ so Os r s so Tj- ro ^-i WlTf 00 O •* 1 1 1
II 111 1 II 1
1 1 11 1 111 1
)RY
SO
LID
S %
U
CR
OSE
% D
RY
SO
LID
S
DE
DU
CIN
G S
UG
AR
% D
RY
SO
LID
S
03H
% D
RY
SO
LID
S
TA
RC
H %
DR
Y S
OL
IDS
JU
MS
% D
RY
SO
LID
S
VA
X %
DR
Y S
OL
IDS
V
C. A
CID
% D
RY
SO
LID
S
"RO
TE
IN %
DR
Y S
OL
IDS
X. o
0
z. w
JAN
N
OV
SE
PT
JUL
Y
JAN
N
OV
SE
PT
JUL
Y
JAN
N
OV
SE
PT
JUL
Y
JAN
N
OV
SE
PT
JUL
Y
JAN
N
OV
SE
PT
JUL
Y
crNr-^oooi-HOsos^vo *•* «n ON\O © cs © ^ *n
<S-^ rf oo m ts —11- en ^ o •* 1 1 1 00 Tt — i « ^
1 1 1 1 1 1 1 II
O s m C M i-H — i n a s * ( H r S r t O » e s M o s o o o n ^ N v c
82.3
5 44
.43
15.3
9 18
.8
0.1
3.9
tNt~.sc © e i s o u - i O s c s © 0 0 0 0
oo • < * « - * 81
.20
46.1
0 18
.28
17.9
0.
4
- N ^ - i - H O0 m O O S I — CM "<]• Os CM "<t O s ' ^ - O s s o O m O ' - i " ^
79.1
4 44
.34
12.2
4 20
.3
0.2
4.0
© f i o \ o o © < n o t N t * -O O T ^ i — t
11 11 1 I I I I
OSOOCN CN r - m s o r ~ - « © r - o o v o ^ C ^ r t t — O f i O - * s o oo-i-eN-*
oom^-m m •* cs « s o m m -*d- d d en 1 1 1 O O ^ i - i C S
cs^-oo oo s f i f i*ocortmmro*o s f ^ o \ x o n O « t ~
0 0 i n 0 0 •n os moscM m e n O s o o d I OO^t-^l —I
X - S O O I N o o w p s t ^ O H t ~ ( S O w O s O m © O c s O ( S I - -OO-tfT-iCM
s t o r -O s • < * . - . o o ~ « i t o o g s d p d r o 1 1 1
Os<n so r-i
o o s o c i o s O n O c N t —
00 SO-St
Ooosom<soo o d « T * o s d t N 1 1 1 t-~ TT —I —H
DR
Y S
OLI
DS
%
SUC
RO
SE %
DR
Y S
OL
IDS
D
ED
UC
ING
SU
GA
R %
DR
Y S
OL
IDS
kS
H %
DR
Y S
OL
IDS
ST
AR
CH
% D
RY
SO
LID
S
3UM
S %
DR
Y S
OL
IDS
W
AX
% D
RY
SO
LID
S
\C.
AC
ID %
DR
Y S
OL
IDS
PR
OT
EIN
% D
RY
SO
LID
S
a 3
e
e
1
§
JAN
N
OV
SE
PT
JUL
Y
JAN
N
OV
SE
PT
JUL
Y
JAN
N
OV
SE
PT
JUL
Y
JAN
N
OV
SE
PT
JUL
Y
JAN
N
OV
SE
PT
JUL
Y
II 1 1 1 1 1 1 1
83.2
1 44
.38
16.7
6 16
.3
0.1
O s o o w>
OOlt —<" T-i
84.1
4 45
.14
19.4
0 15
.8
0.3
1 1 1 1 1 1 II 1
cn'o *-H oo T-i oo c* r^ oo %o o rj 1 1 I
VJDCS 00 ©
O N « v O O ( S O l S O O 0OTT H H
ooas^t-ON *-H a\ *-' m ONfno\t^o 1 1 1 1 r - - fr T-4 *~i
80.3
5 44
.37
20.6
5 17
.6
0.1
3.1
1.03
1.
6
OS t— ~H OS »-H 00
oo es so" o \ d n 1 1 1 C-M-— i— i
< N t ~ t - SO m t ~ - f N | t S - ^ r J ' S O O s - *
< S O S < M O O O O O * - « S O o o r r . e s - ~
79.9
4 42
,32
22.0
9 18
.8
0.2
O O ^ V O O t - O s « C N C S t S O \ 0 0 S O * - n - H © O s © c n © ~ H > o O O S j - N r - i
m m » n o o t s Os m m >n m ri >r> Os d ro" 1 I I o o > ^ T-* *-*
82.8
8 41
.47
20.2
7 18
.8
0.1
3.3
81.9
0 41
.72
20.4
4 19
.7
0.3
f ^ i s o o o < n f * s c n o o - ^ ^ t
r - « t s SO 0 0 Tj- Tf CO 00
rja;-*d©co 1 1 I
« * l © " " l ( S « S k - l C S O - v t T ~ - ( ~ - 0 0 » H
fn-d-ooOsQcn©^^!^-O0 ^ - ^-) ^H
81.8
3 44
.26
16.9
6 21
.0
0.5
DR
Y S
OL
IDS
%
SUC
RO
SE %
DR
Y S
OL
IDS
R
ED
UC
ING
SU
GA
R %
DR
Y S
OL
IDS
A
SH
% D
RY
SO
LID
S
STA
RC
H %
DR
Y S
OL
IDS
G
UM
S %
DR
Y S
OL
IDS
W
AX
% D
RY
SO
LID
S
AC
. AC
ID %
DR
Y S
OL
IDS
P
RO
TE
IN %
DR
Y S
OL
IDS
AG
ES
AV
ER
g
s
§
d
JAN
N
OV
SE
PT
JUL
Y
JAN
N
OV
SE
PT
JUL
Y
JAN
N
OV
SE
PT
JUL
Y
JAN
N
OV
SE
PT
JUL
Y
JAN
N
OV
SE
PT
JUL
Y
\L> OO CS NW
oo-s f"-« —i
m moo ~ en "*© <S oo ~H v r t j - ON © rn 1 1 1 QO ^ ,— H
m ^ - O oo oov^'Of<i<N»n,^,oor>l f « m o o x O f o O ' - r ^ 00 " t ——^
T T © 0 O
f- •*£ oo oo © m 1 I 1 oo "<r •— *->
\o — >^ ON h-w N oo « < s y? \o \c f*-i»ri«^r-©T(-© — oc
76 3
6 44
89
11 2
6 21
5
0.1
4 5
1 II 1 1 II II
s J O O O t N S O - * ( N
r-msooo o 1 1 1 t - • < ! - „ , - ,
1 1 1 II 1 1 1.1
O \ r - f s o o o -<t 1 | 1 t - Tf <—"—"
m a « r - N o o mfj-r* O N V O \ O 0 O © m © — ' W - l
*n©-— cr-'voooo 1 1 1 1
1 I I 1 1 1 II 1
rs. — so f - 00 c o c N n - i s O
C~- in«os©-* 1 1 1 r - T f — —
1 1 1 1 1 1 1 1 1
sots r-
m r~ sooo© m 1 [ I OOTJ- ^* —
O © 1 - t -
m o \ N T f — a n o o o o s N — ( N t — d r s d — so
rs — o -* in oo so CM r-O Q s o o s o m 1 1 1 0 0 " * ^-i —H
»—^•oo's3Tn©^so — CN^-.OOOO©TJ-©.—r-
SOOSOS
OOscsoom - i e s o r ~ d 1 1 1 OOTT C S «
DR
Y S
OL
IDS
%
SUC
RO
SE %
DR
Y S
OL
IDS
R
ED
UC
ING
SU
GA
R %
DR
Y S
OL
IDS
A
SH
% D
RY
SO
LID
S
STA
RC
H %
DR
Y S
OL
IDS
G
UM
S %
DR
Y S
OL
IDS
W
AX
% D
RY
SO
LID
S
AC
. AC
ID %
DR
Y S
OL
IDS
P
RO
TE
IN X
DR
Y S
OL
IDS
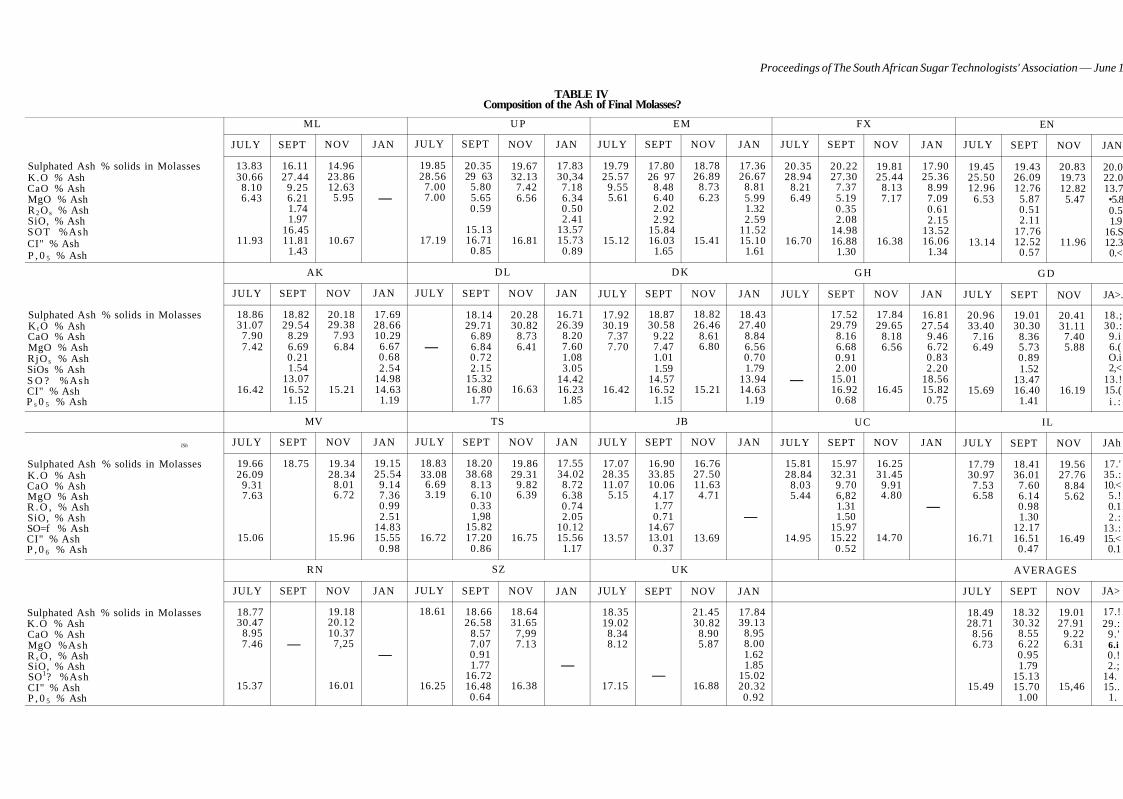
Proceedings of The South African Sugar Technologists' Association — June 19J
TABLE IV Composition of the Ash of Final Molasses?
Sulphated Ash % solids in Molasses K.O % Ash CaO % Ash MgO % Ash R 2 O s % Ash SiO, % Ash SOT %Ash CI" % Ash P , 0 5 % Ash
Sulphated Ash % solids in Molasses K t O % Ash CaO % Ash MgO % Ash RjO s % Ash SiOs % Ash S O ? %Ash CI" % Ash P s 0 5 % Ash
lSh
Sulphated Ash % solids in Molasses K.O % Ash CaO % Ash MgO % Ash R . O , % Ash SiO, % Ash SO=f % Ash CI" % Ash P , 0 6 % Ash
Sulphated Ash % solids in Molasses K.O % Ash CaO % Ash MgO %Ash R s O , % Ash SiO, % Ash SO1? %Ash CI" % Ash P , 0 5 % Ash
ML
JULY
13.83 30.66 8.10 6.43
11.93
SEPT
16.11 27.44
9.25 6.21 1.74 1.97
16.45 11.81
1.43
NOV
14.96 23.86 12.63 5.95
10.67
JAN
—
AK
JULY
18.86 31.07 7.90 7.42
16.42
SEPT
18.82 29.54
8.29 6.69 0.21 1.54
13.07 16.52
1.15
NOV
20.18 29.38
7.93 6.84
15.21
JAN
17.69 28.66 10.29 6.67 0.68 2.54
14.98 14.63 1.19
MV
JULY
19.66 26.09
9.31 7.63
15.06
SEPT
18.75
NOV
19.34 28.34
8.01 6.72
15.96
JAN
19.15 25.54 9.14 7.36 0.99 2.51
14.83 15.55 0.98
R N
JULY
18.77 30.47
8.95 7.46
15.37
SEPT
—
NOV
19.18 20.12 10.37
7,25
16.01
JAN
—
U P
JULY
19.85 28.56
7.00 7.00
17.19
SEPT
20.35 29 63
5.80 5.65 0.59
15.13 16.71 0.85
NOV
19.67 32.13 7.42 6.56
16.81
JAN
17.83 30,34 7.18 6.34 0.50 2.41
13.57 15.73 0.89
DL
JULY
—
SEPT
18.14 29.71
6.89 6.84 0.72 2.15
15.32 16.80 1.77
NOV
20.28 30.82
8.73 6.41
16.63
JAN
16.71 26.39
8.20 7.60 1.08 3.05
14.42 16.23 1.85
TS
JULY
18.83 33.08 6.69 3.19
16.72
SEPT
18.20 38.68 8.13 6.10 0.33 1,98
15.82 17.20 0.86
NOV
19.86 29.31
9.82 6.39
16.75
JAN
17.55 34.02 8.72 6.38 0.74 2.05
10.12 15.56
1.17
SZ
JULY
18.61
16.25
SEPT
18.66 26.58
8.57 7.07 0.91 1.77
16.72 16.48 0.64
NOV
18.64 31.65 7,99 7.13
16.38
JAN
—
EM
JULY
19.79 25.57
9.55 5.61
15.12
SEPT
17.80 26 97
8.48 6.40 2.02 2.92
15.84 16.03
1.65
NOV
18.78 26.89
8.73 6.23
15.41
JAN
17.36 26.67
8.81 5.99 1.32 2.59
11.52 15.10
1.61
D K
JULY
17.92 30.19 7.37 7.70
16.42
SEPT
18.87 30.58
9.22 7.47 1.01 1.59
14.57 16.52
1.15
NOV
18.82 26.46
8.61 6.80
15.21
JAN
18.43 27.40
8.84 6.56 0.70 1.79
13.94 14.63
1.19
JB
JULY
17.07 28.35 11.07
5.15
13.57
SEPT
16.90 33.85 10.06 4.17 1.77 0.71
14.67 13.01 0.37
NOV
16.76 27.50 11.63 4.71
13.69
JAN
—
UK
JULY
18.35 19.02 8.34 8.12
17.15
SEPT
—
NOV
21.45 30.82 8.90 5.87
16.88
JAN
17.84 39.13
8.95 8.00 1.62 1.85
15.02 20.32 0.92
FX
JULY
20.35 28.94
8.21 6.49
16.70
SEPT
20.22 27.30
7.37 5.19 0.35 2.08
14.98 16.88
1.30
NOV
19.81 25.44
8.13 7.17
16.38
JAN
17.90 25.36
8.99 7.09 0.61 2.15
13.52 16.06
1.34
G H
JULY
—
SEPT
17.52 29.79
8.16 6.68 0.91 2.00
15.01 16.92 0.68
NOV
17.84 29.65
8.18 6.56
16.45
JAN
16.81 27.54
9.46 6.72 0.83 2.20
18.56 15.82 0.75
UC
JULY
15.81 28.84
8.03 5.44
14.95
SEPT
15.97 32.31 9.70 6,82 1.31 1.50
15.97 15.22 0.52
NOV
16.25 31.45 9.91 4.80
14.70
JAN
—
EN
JULY
19.45 25.50 12.96
6.53
13.14
SEPT
19.43 26.09 12.76 5.87 0.51 2.11
17.76 12.52 0.57
NOV
20.83 19.73 12.82 5.47
11.96
JAN
20.0 22.0 13.7 •5.8 0.5 1.9
16.S 12.3 0.<
G D
JULY
20.96 33.40 7.16 6.49
15.69
SEPT
19.01 30.30
8.36 5.73 0.89 1.52
13.47 16.40 1.41
NOV
20.41 31.11 7.40 5.88
16.19
JA>.
18.; 30.: 9.i 6.( O.i 2,<
13.! 15.( i . :
IL
JULY
17.79 30.97 7.53 6.58
16.71
SEPT
18.41 36.01 7.60 6.14 0.98 1.30
12.17 16.51 0.47
NOV
19.56 27.76
8.84 5.62
16.49
JAh
17.' 35.: 10.< 5.! 0.1 2.:
13.: 15.< 0.1
AVERAGES
JULY
18.49 28.71
8.56 6.73
15.49
SEPT
18.32 30.32
8.55 6.22 0.95 1.79
15.13 15.70 1.00
NOV
19.01 27.91
9.22 6.31
15,46
JA>
17.! 29.:
9. ' 6.i 0.! 2.;
14. 15.. 1.
Proceedings of The South African Sugar Technologists' Association —
amount of water to bring them to 80% solids and we hoped this would take care of grain.
Our atomic absorption data has not yet been published as we are not sure that our methods tie up with conventional methods of determination of calcium and magnesium.
Regarding the balance of the ash, the fact that the constituents were determined independently of the sulphated ash will have caused the difference in the total. If the various constituents were shown as a percentage of carbonated ash they would total approximately 100%.
We were trying to show the difference in various ash levels between the samples and we also wished to show how the constituents fell in the samples from different mills.
The intention was not to do a total ash balance. Mr. Hoekstra: We are endeavouring to make a
mathematical model of a sugar factory, including the boiling house, and we thought the Douwes Dekker formula might assist in putting molasses exhaustion on a more scientific basis. Purity = A„ + A, x Reducing Sugar + A2 x Sulphated Ash
Total Non-Sucrose Total Non-Sucrose
where A„ A, and A2 are constants But Purity = Sucrose x 100
Total Solids and Total Non-Sucrose = Total Solids-Sucrose
As sucrose is by implication on the left-hand side and the right-hand side of the equation we suspected
— June 1970 87
there might be a mathematical bias in the formula. When a Douwes Dekker correlation was done by
multiple linear regression analysis on the actual results of four Hulett factories, approximately 300 sets of data, we found a fair mathematical correlation — about .6.
We wondered what the correlation would be if, instead of actual factory data, random values of purities, reducing sugar/total non-sucrose, and sulphated ash/ total-non-sucrose were used. Yesterday, Mr. Young mentioned the Monte Carlo technique and we used this technique for generating these random values.
We determined from factory data what the means and the standard deviations were for these three variables. We got the computer to generate sets of random numbers corresponding to those particular means and standard deviations.
Doing a multiple linear regression analysis on these sets of data, we got a correlation co-efficient of approximately .5, as compared with the .6 for actual data.
Therefore, although there is an improvement of .1 when using actual data, most of the correlation is due to mathematical bias inherent in the formula.
We tried reducing sugar/ash, ash/reducing sugar, and also reducing sugar/reducing sugar plus ash.
We again got a correlation of approximately .5 with random numbers but we did not get as good a correlation when using actual factory data.
So, although we have not yet found a formula that does not have an inherent mathematical bias, our conclusion is that the Douwes Dekker formula is still slightly better than the others.
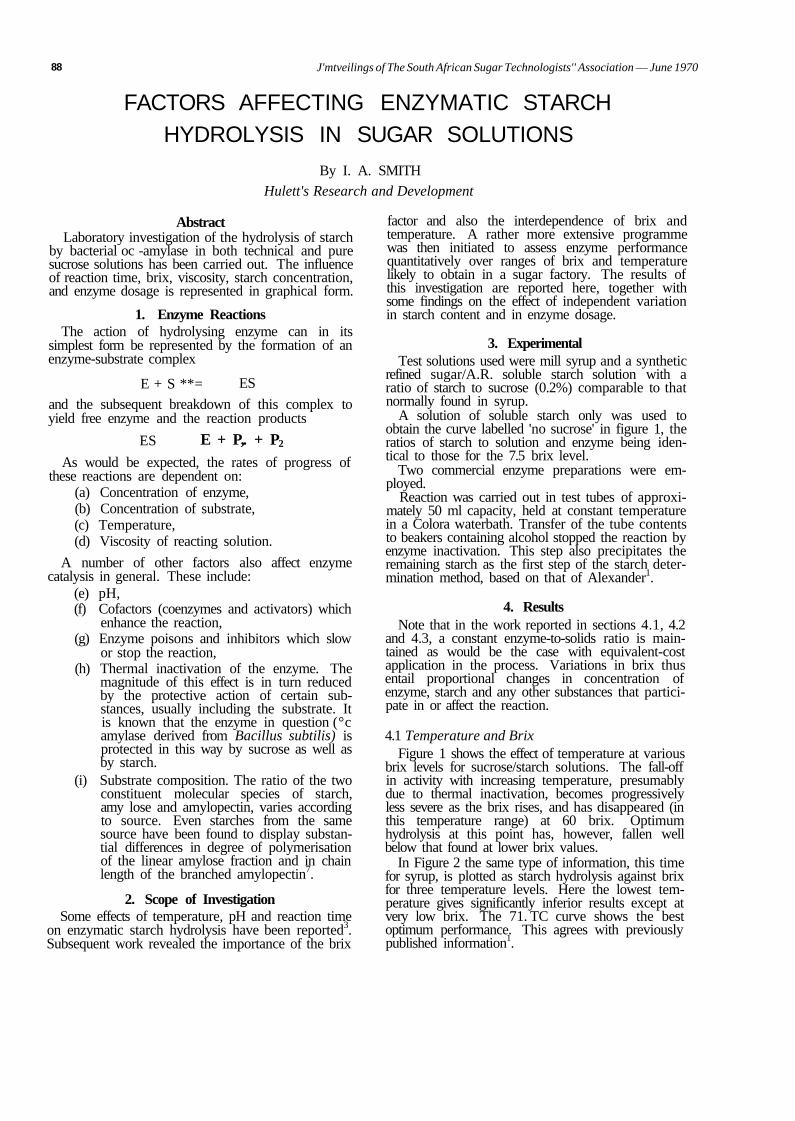
88 J'mtveilings of The South African Sugar Technologists'' Association — June 1970
FACTORS AFFECTING ENZYMATIC STARCH HYDROLYSIS IN SUGAR SOLUTIONS
By I. A. SMITH
Hulett's Research and Development
Abstract Laboratory investigation of the hydrolysis of starch
by bacterial oc -amylase in both technical and pure sucrose solutions has been carried out. The influence of reaction time, brix, viscosity, starch concentration, and enzyme dosage is represented in graphical form.
1. Enzyme Reactions The action of hydrolysing enzyme can in its
simplest form be represented by the formation of an enzyme-substrate complex
E + S **= ES
and the subsequent breakdown of this complex to yield free enzyme and the reaction products
ES E + P,. + P2
As would be expected, the rates of progress of these reactions are dependent on:
(a) Concentration of enzyme, (b) Concentration of substrate, (c) Temperature, (d) Viscosity of reacting solution.
A number of other factors also affect enzyme catalysis in general. These include:
(e) pH, (f) Cofactors (coenzymes and activators) which
enhance the reaction, (g) Enzyme poisons and inhibitors which slow
or stop the reaction, (h) Thermal inactivation of the enzyme. The
magnitude of this effect is in turn reduced by the protective action of certain substances, usually including the substrate. It is known that the enzyme in question (°c amylase derived from Bacillus subtilis) is protected in this way by sucrose as well as by starch.
(i) Substrate composition. The ratio of the two constituent molecular species of starch, amy lose and amylopectin, varies according to source. Even starches from the same source have been found to display substantial differences in degree of polymerisation of the linear amylose fraction and in chain length of the branched amylopectin7.
2. Scope of Investigation Some effects of temperature, pH and reaction time
on enzymatic starch hydrolysis have been reported3. Subsequent work revealed the importance of the brix
factor and also the interdependence of brix and temperature. A rather more extensive programme was then initiated to assess enzyme performance quantitatively over ranges of brix and temperature likely to obtain in a sugar factory. The results of this investigation are reported here, together with some findings on the effect of independent variation in starch content and in enzyme dosage.
3. Experimental Test solutions used were mill syrup and a synthetic
refined sugar/A.R. soluble starch solution with a ratio of starch to sucrose (0.2%) comparable to that normally found in syrup.
A solution of soluble starch only was used to obtain the curve labelled 'no sucrose' in figure 1, the ratios of starch to solution and enzyme being identical to those for the 7.5 brix level.
Two commercial enzyme preparations were employed.
Reaction was carried out in test tubes of approximately 50 ml capacity, held at constant temperature in a Colora waterbath. Transfer of the tube contents to beakers containing alcohol stopped the reaction by enzyme inactivation. This step also precipitates the remaining starch as the first step of the starch determination method, based on that of Alexander1.
4. Results Note that in the work reported in sections 4.1, 4.2
and 4.3, a constant enzyme-to-solids ratio is maintained as would be the case with equivalent-cost application in the process. Variations in brix thus entail proportional changes in concentration of enzyme, starch and any other substances that participate in or affect the reaction.
4.1 Temperature and Brix Figure 1 shows the effect of temperature at various
brix levels for sucrose/starch solutions. The fall-off in activity with increasing temperature, presumably due to thermal inactivation, becomes progressively less severe as the brix rises, and has disappeared (in this temperature range) at 60 brix. Optimum hydrolysis at this point has, however, fallen well below that found at lower brix values.
In Figure 2 the same type of information, this time for syrup, is plotted as starch hydrolysis against brix for three temperature levels. Here the lowest temperature gives significantly inferior results except at very low brix. The 71. TC curve shows the best optimum performance. This agrees with previously published information1.
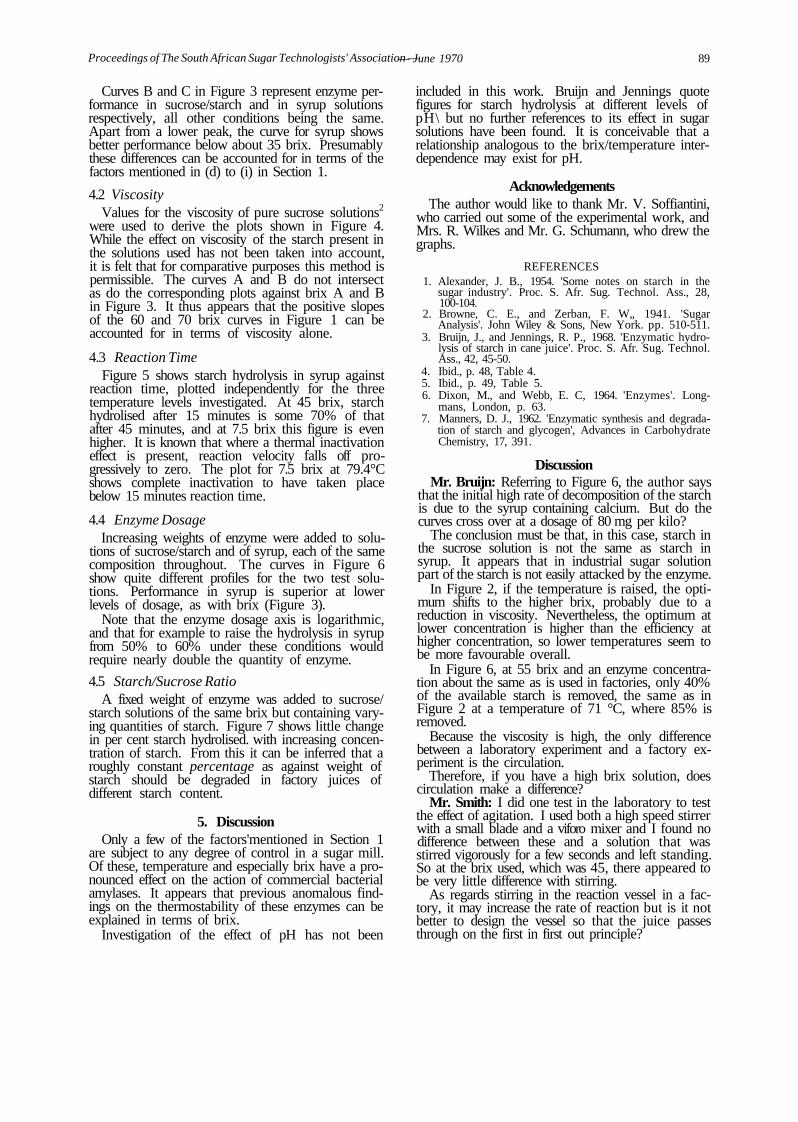
Proceedings of The South African Sugar Technologists' Association —
Curves B and C in Figure 3 represent enzyme performance in sucrose/starch and in syrup solutions respectively, all other conditions being the same. Apart from a lower peak, the curve for syrup shows better performance below about 35 brix. Presumably these differences can be accounted for in terms of the factors mentioned in (d) to (i) in Section 1.
4.2 Viscosity Values for the viscosity of pure sucrose solutions2
were used to derive the plots shown in Figure 4. While the effect on viscosity of the starch present in the solutions used has not been taken into account, it is felt that for comparative purposes this method is permissible. The curves A and B do not intersect as do the corresponding plots against brix A and B in Figure 3. It thus appears that the positive slopes of the 60 and 70 brix curves in Figure 1 can be accounted for in terms of viscosity alone.
4.3 Reaction Time Figure 5 shows starch hydrolysis in syrup against
reaction time, plotted independently for the three temperature levels investigated. At 45 brix, starch hydrolised after 15 minutes is some 70% of that after 45 minutes, and at 7.5 brix this figure is even higher. It is known that where a thermal inactivation effect is present, reaction velocity falls off progressively to zero. The plot for 7.5 brix at 79.4°C shows complete inactivation to have taken place below 15 minutes reaction time.
4.4 Enzyme Dosage Increasing weights of enzyme were added to solu
tions of sucrose/starch and of syrup, each of the same composition throughout. The curves in Figure 6 show quite different profiles for the two test solutions. Performance in syrup is superior at lower levels of dosage, as with brix (Figure 3).
Note that the enzyme dosage axis is logarithmic, and that for example to raise the hydrolysis in syrup from 50% to 60% under these conditions would require nearly double the quantity of enzyme.
4.5 Starch/Sucrose Ratio A fixed weight of enzyme was added to sucrose/
starch solutions of the same brix but containing varying quantities of starch. Figure 7 shows little change in per cent starch hydrolised. with increasing concentration of starch. From this it can be inferred that a roughly constant percentage as against weight of starch should be degraded in factory juices of different starch content.
5. Discussion Only a few of the factors'mentioned in Section 1
are subject to any degree of control in a sugar mill. Of these, temperature and especially brix have a pronounced effect on the action of commercial bacterial amylases. It appears that previous anomalous findings on the thermostability of these enzymes can be explained in terms of brix.
Investigation of the effect of pH has not been
— June 1970 89
included in this work. Bruijn and Jennings quote figures for starch hydrolysis at different levels of pH\ but no further references to its effect in sugar solutions have been found. It is conceivable that a relationship analogous to the brix/temperature interdependence may exist for pH.
Acknowledgements The author would like to thank Mr. V. Soffiantini,
who carried out some of the experimental work, and Mrs. R. Wilkes and Mr. G. Schumann, who drew the graphs.
REFERENCES 1. Alexander, J. B., 1954. 'Some notes on starch in the
sugar industry'. Proc. S. Afr. Sug. Technol. Ass., 28, 100-104.
2. Browne, C. E., and Zerban, F. W„ 1941. 'Sugar Analysis'. John Wiley & Sons, New York. pp. 510-511.
3. Bruijn, J., and Jennings, R. P., 1968. 'Enzymatic hydrolysis of starch in cane juice'. Proc. S. Afr. Sug. Technol. Ass., 42, 45-50.
4. Ibid., p. 48, Table 4. 5. Ibid., p. 49, Table 5. 6. Dixon, M., and Webb, E. C, 1964. 'Enzymes'. Long
mans, London, p. 63. 7. Manners, D. J., 1962. 'Enzymatic synthesis and degrada
tion of starch and glycogen', Advances in Carbohydrate Chemistry, 17, 391.
Discussion Mr. Bruijn: Referring to Figure 6, the author says
that the initial high rate of decomposition of the starch is due to the syrup containing calcium. But do the curves cross over at a dosage of 80 mg per kilo?
The conclusion must be that, in this case, starch in the sucrose solution is not the same as starch in syrup. It appears that in industrial sugar solution part of the starch is not easily attacked by the enzyme.
In Figure 2, if the temperature is raised, the optimum shifts to the higher brix, probably due to a reduction in viscosity. Nevertheless, the optimum at lower concentration is higher than the efficiency at higher concentration, so lower temperatures seem to be more favourable overall.
In Figure 6, at 55 brix and an enzyme concentration about the same as is used in factories, only 40% of the available starch is removed, the same as in Figure 2 at a temperature of 71 °C, where 85% is removed.
Because the viscosity is high, the only difference between a laboratory experiment and a factory experiment is the circulation.
Therefore, if you have a high brix solution, does circulation make a difference?
Mr. Smith: I did one test in the laboratory to test the effect of agitation. I used both a high speed stirrer with a small blade and a viforo mixer and I found no difference between these and a solution that was stirred vigorously for a few seconds and left standing. So at the brix used, which was 45, there appeared to be very little difference with stirring.
As regards stirring in the reaction vessel in a factory, it may increase the rate of reaction but is it not better to design the vessel so that the juice passes through on the first in first out principle?

90 Proceedings of The South African Sugar Technologists' Association —June 1970
As regards the theory that some portion of the starch may not be susceptible to attack, I do not feel that this is shown here. In Figure 6, the curve tails off to a level approaching about 70%, but this does not mean that 30% is not susceptible to reaction. In Figure 2, under different circumstances, we get to 80% at one point and under more favourable conditions we might get up to 100%, as we have done in laboratory work.
Dr. Matic: Figure 5 shows the percentage rather than the amount of starch that is reduced under various conditions.
Why is it that the percentage, as against the weight of starch produced, appears to stay the same?
Mr. Smith: I cannot give an explanation, although of course the concentration of the starch increases and this will tend to speed up the reaction.
Mr. Cox: Regarding Dr. Matic's query, the reaction exhibits first order kinetics; this means that the reaction has a discrete and definite half-life.
Therefore, any given quantity of reactant will be degruded by a constant percentage in unit time. When
the active sites of the enzyme have become saturated, as would occur with an excess of reactant, the reaction takes on the characteristics of a zero order reaction. In this case the quantity of material degraded in unit time will be constant at any given temperature. The reaction velocity remains constant regardless of the amount of reactant added.
Under the conditions described, however, the reaction clearly exhibits first order characteristics, and on this basis the degradation of a constant percentage of material in unit time under isothermal conditions is in accordance with theory.
Mr. Jennings:: The enzyme usage is expressed as mg/kg brix. As we seem doubtful about the brix, I suggest we might express it as mg/kg final production of sugar.
Mr. Smith: Yes, because it could then be related to sugar lost.
For short periods, such as a day or less, it is difficult to relate juice or syrup throughput to sugar tonnage: however, for normal weekly reporting of enzyme consumption, a sugar basis is certainly preferable.
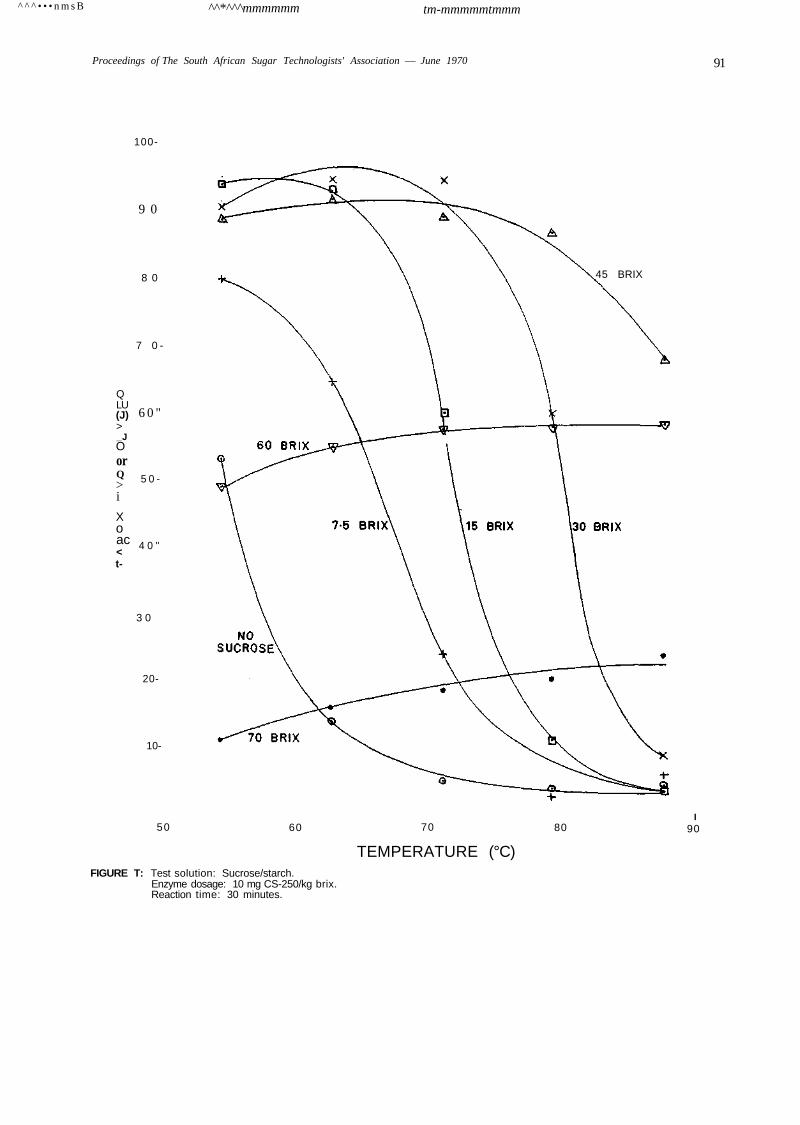
^ ^ ^ • • • n m s B ^^*^^^mmmmmm tm-mmmmmtmmm
Proceedings of The South African Sugar Technologists' Association — June 1970 91
100-
9 0
8 0
7 0 -
Q LU (J) > _J O or Q > i
X o ac < t-
6 0 "
5 0 -
4 0 "
3 0
20-
10-
45 BRIX
50 60 70 80 I
90
TEMPERATURE (°C) FIGURE T: Test solution: Sucrose/starch.
Enzyme dosage: 10 mg CS-250/kg brix. Reaction time: 30 minutes.
92' Proceedings of The South African Sugar Technologists' Association — June 1970
1C0-
90-
80-
Q LU </> 70 >
O or so-Q >-X
50-X o or < 40-
30-
2 0 -
10-
A- 79-40C
71-1 °C
62-8 °C
- 1 — 10 20 30
i * 0
FIGURE 2: Test solution: Syrup. Enzyme dosage: 10 mg Enzyme A/kg brix. Reaction time: 30 minutes.
100
50
BRIX
100-i
60 —r~ 70 lo 90 100
BRIX FIGURE 3: Test solution — curves A and B: Sucrose/starch.
Test solution — curve C: Syrup. Enzyme dosage: 10 mg Enzyme A/kg brix. Reaction time: 30 minutes. Temperature — curve A: 54.4°C. Temperature — curves B and C: 79.4°C.
i 1
1 10 VISCOSITY (CENT IP0 ISE)
FIGURE 4: Test solution:- Sucrose/starch. Enzyme dosage: 10 mg Enzyme A/kg brix. Reaction time: 30 minutes. Temperature — curve A: 54.4°C. Temperature — curve B: 79.4°C.
100
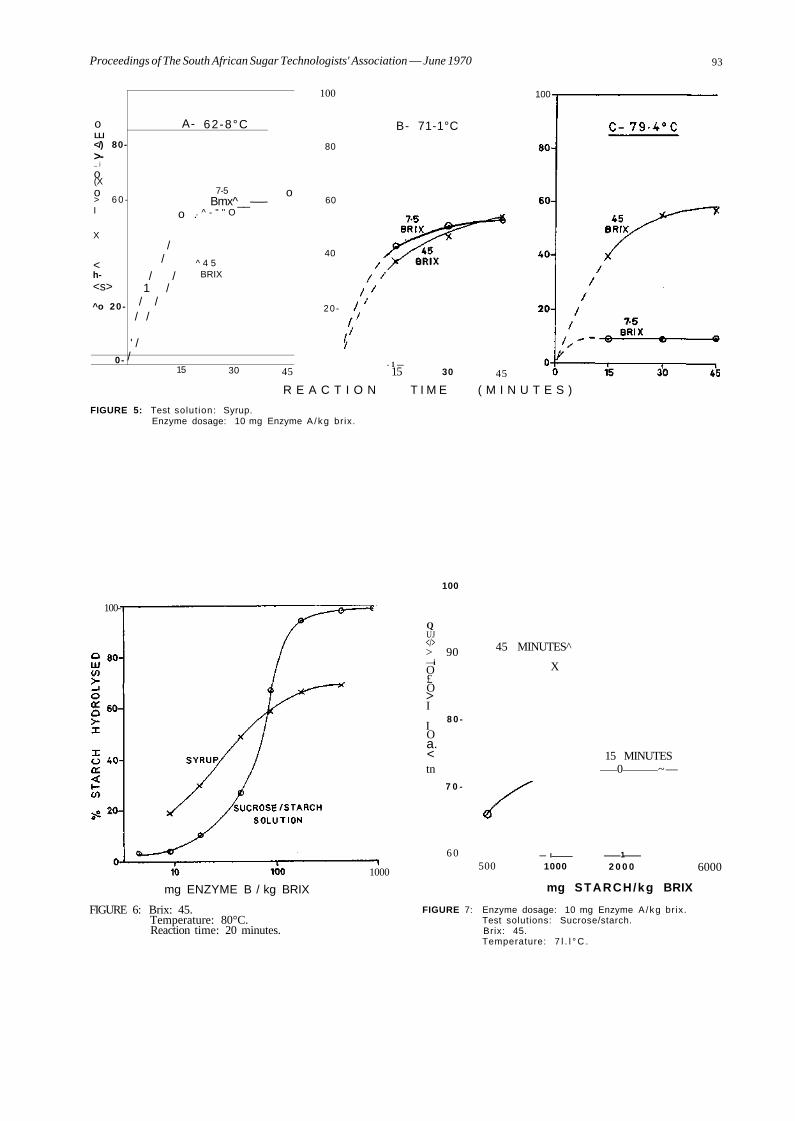
Proceedings of The South African Sugar Technologists' Association — June 1970 93
o LLI </) 80->-_ j
o (X o > 6 0 -I
X
< h-<s>
^o 20 -
0-
A-
o .
/ /
/ / 1 /
/ / / /
' / /
62-8°C
7-5 Bmx^__-—-
. ^ - " " O
^ 4 5 BRIX
o
15 30 45
100
80
60
40
20 -
100
B- 71-1°C
- 1 — 15 30 45
R E A C T I O N T I M E ( M I N U T E S )
FIGURE 5: Test solut ion: Syrup. Enzyme dosage: 10 mg Enzyme A /kg br ix.
100
100-
1000
mg ENZYME B / kg BRIX
FIGURE 6: Brix: 45. Temperature: 80°C. Reaction time: 20 minutes.
Q UJ </> > 90 —i O £ O > I
I O a. < tn
8 0 -
7 0 -
6 0
45 MINUTES^
X
500 — I
1000
15 MINUTES 0 ~—
1
2 0 0 0 6000
mg STARCH/kg BRIX
FIGURE 7: Enzyme dosage: 10 mg Enzyme A /kg br ix. Test solutions: Sucrose/starch. Brix: 45. Temperature: 7 l . l ° C .
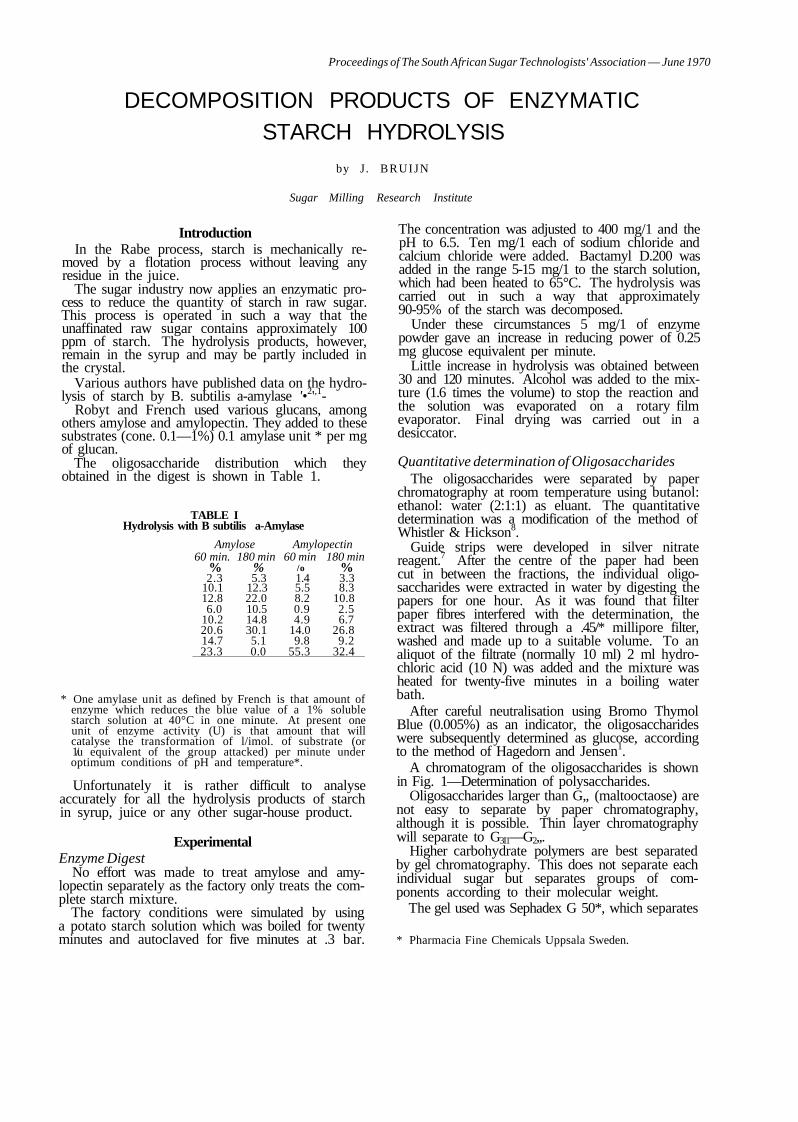
Proceedings of The South African Sugar Technologists' Association — June 1970
DECOMPOSITION PRODUCTS OF ENZYMATIC STARCH HYDROLYSIS
by J. BRUIJN
Sugar Milling Research Institute
Introduction In the Rabe process, starch is mechanically re
moved by a flotation process without leaving any residue in the juice.
The sugar industry now applies an enzymatic process to reduce the quantity of starch in raw sugar. This process is operated in such a way that the unaffinated raw sugar contains approximately 100 ppm of starch. The hydrolysis products, however, remain in the syrup and may be partly included in the crystal.
Various authors have published data on the hydrolysis of starch by B. subtilis a-amylase '•2',1-
Robyt and French used various glucans, among others amylose and amylopectin. They added to these substrates (cone. 0.1—1%) 0.1 amylase unit * per mg of glucan.
The oligosaccharide distribution which they obtained in the digest is shown in Table 1.
TABLE I Hydrolysis with B subtilis a-Amylase
Amylose 60 min.
% 2.3
10.1 12.8 6.0
10.2 20.6 14.7 23.3
180 min % 5.3
12.3 22.0 10.5 14.8 30.1 5.1 0.0
Amylopectin 60 min
/o 1.4 5.5 8.2 0.9 4.9
14.0 9.8
55.3
180 min % 3.3 8.3
10.8 2.5 6.7
26.8 9.2
32.4
* One amylase unit as defined by French is that amount of enzyme which reduces the blue value of a 1% soluble starch solution at 40°C in one minute. At present one unit of enzyme activity (U) is that amount that will catalyse the transformation of l/imol. of substrate (or 1/u equivalent of the group attacked) per minute under optimum conditions of pH and temperature*.
Unfortunately it is rather difficult to analyse accurately for all the hydrolysis products of starch in syrup, juice or any other sugar-house product.
Experimental Enzyme Digest
No effort was made to treat amylose and amylopectin separately as the factory only treats the complete starch mixture.
The factory conditions were simulated by using a potato starch solution which was boiled for twenty minutes and autoclaved for five minutes at .3 bar.
The concentration was adjusted to 400 mg/1 and the pH to 6.5. Ten mg/1 each of sodium chloride and calcium chloride were added. Bactamyl D.200 was added in the range 5-15 mg/1 to the starch solution, which had been heated to 65°C. The hydrolysis was carried out in such a way that approximately 90-95% of the starch was decomposed.
Under these circumstances 5 mg/1 of enzyme powder gave an increase in reducing power of 0.25 mg glucose equivalent per minute.
Little increase in hydrolysis was obtained between 30 and 120 minutes. Alcohol was added to the mixture (1.6 times the volume) to stop the reaction and the solution was evaporated on a rotary film evaporator. Final drying was carried out in a desiccator.
Quantitative determination of Oligosaccharides The oligosaccharides were separated by paper
chromatography at room temperature using butanol: ethanol: water (2:1:1) as eluant. The quantitative determination was a modification of the method of Whistler & Hickson8.
Guide strips were developed in silver nitrate reagent.7 After the centre of the paper had been cut in between the fractions, the individual oligosaccharides were extracted in water by digesting the papers for one hour. As it was found that filter paper fibres interfered with the determination, the extract was filtered through a .45/* millipore filter, washed and made up to a suitable volume. To an aliquot of the filtrate (normally 10 ml) 2 ml hydrochloric acid (10 N) was added and the mixture was heated for twenty-five minutes in a boiling water bath.
After careful neutralisation using Bromo Thymol Blue (0.005%) as an indicator, the oligosaccharides were subsequently determined as glucose, according to the method of Hagedorn and Jensen1.
A chromatogram of the oligosaccharides is shown in Fig. 1—Determination of polysaccharides.
Oligosaccharides larger than G„ (maltooctaose) are not easy to separate by paper chromatography, although it is possible. Thin layer chromatography will separate to G3I1—G2,,.
Higher carbohydrate polymers are best separated by gel chromatography. This does not separate each individual sugar but separates groups of components according to their molecular weight.
The gel used was Sephadex G 50*, which separates
* Pharmacia Fine Chemicals Uppsala Sweden.
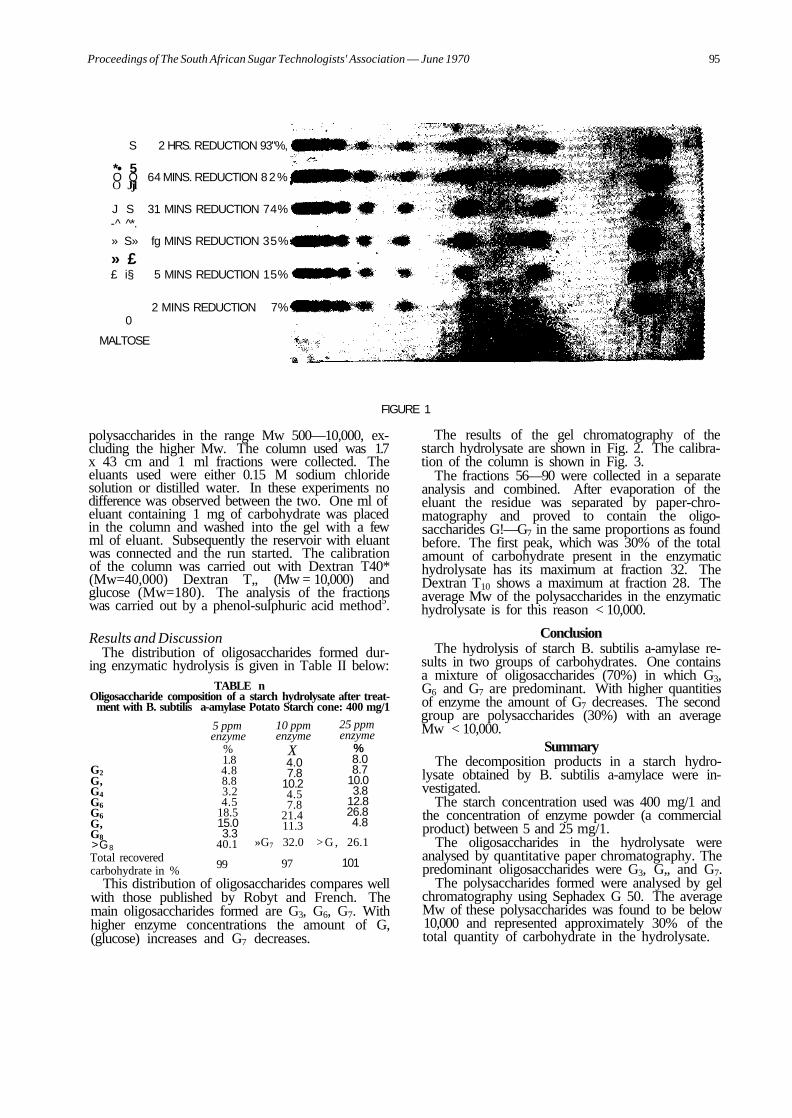
Proceedings of The South African Sugar Technologists' Association — June 1970 95
S 2 HRS. REDUCTION 93"%,
*• 5 O O 64 MINS. REDUCTION 82% O Jjl
J S 31 MINS REDUCTION 74% -^ *.
» S» fg MINS REDUCTION 35%
» £ £ i§ 5 MINS REDUCTION 15%
0
MALTOSE
2 MINS REDUCTION 7%
FIGURE 1
polysaccharides in the range Mw 500—10,000, excluding the higher Mw. The column used was 1.7 x 43 cm and 1 ml fractions were collected. The eluants used were either 0.15 M sodium chloride solution or distilled water. In these experiments no difference was observed between the two. One ml of eluant containing 1 mg of carbohydrate was placed in the column and washed into the gel with a few ml of eluant. Subsequently the reservoir with eluant was connected and the run started. The calibration of the column was carried out with Dextran T40* (Mw=40,000) Dextran T„ (Mw = 10,000) and glucose (Mw=180). The analysis of the fractions was carried out by a phenol-sulphuric acid method5.
Results and Discussion The distribution of oligosaccharides formed dur
ing enzymatic hydrolysis is given in Table II below: TABLE n
Oligosaccharide composition of a starch hydrolysate after treatment with B. subtilis a-amylase Potato Starch cone: 400 mg/1
G2 G, G4 G6 G6 G, G8 >G8 Total recovered carbohydrate in %
5 ppm enzyme
% 1.8 4.8 8.8 3.2 4.5
18.5 15.0 3.3
40.1
99
10 ppm enzyme
X 4.0 7.8
10.2 4.5 7.8
21.4 11.3
25 ppm enzyme
% 8.0 8.7
10.0 3.8
12.8 26.8 4.8
»G7 32.0 > G , 26.1
97 101
This distribution of oligosaccharides compares well with those published by Robyt and French. The main oligosaccharides formed are G3, G6, G7. With higher enzyme concentrations the amount of G, (glucose) increases and G7 decreases.
The results of the gel chromatography of the starch hydrolysate are shown in Fig. 2. The calibration of the column is shown in Fig. 3.
The fractions 56—90 were collected in a separate analysis and combined. After evaporation of the eluant the residue was separated by paper-chro-matography and proved to contain the oligosaccharides G!—G7 in the same proportions as found before. The first peak, which was 30% of the total amount of carbohydrate present in the enzymatic hydrolysate has its maximum at fraction 32. The Dextran T10 shows a maximum at fraction 28. The average Mw of the polysaccharides in the enzymatic hydrolysate is for this reason < 10,000.
Conclusion The hydrolysis of starch B. subtilis a-amylase re
sults in two groups of carbohydrates. One contains a mixture of oligosaccharides (70%) in which G3, G6 and G7 are predominant. With higher quantities of enzyme the amount of G7 decreases. The second group are polysaccharides (30%) with an average Mw < 10,000.
Summary The decomposition products in a starch hydro
lysate obtained by B. subtilis a-amylace were investigated.
The starch concentration used was 400 mg/1 and the concentration of enzyme powder (a commercial product) between 5 and 25 mg/1.
The oligosaccharides in the hydrolysate were analysed by quantitative paper chromatography. The predominant oligosaccharides were G3, G„ and G7.
The polysaccharides formed were analysed by gel chromatography using Sephadex G 50. The average Mw of these polysaccharides was found to be below 10,000 and represented approximately 30% of the total quantity of carbohydrate in the hydrolysate.
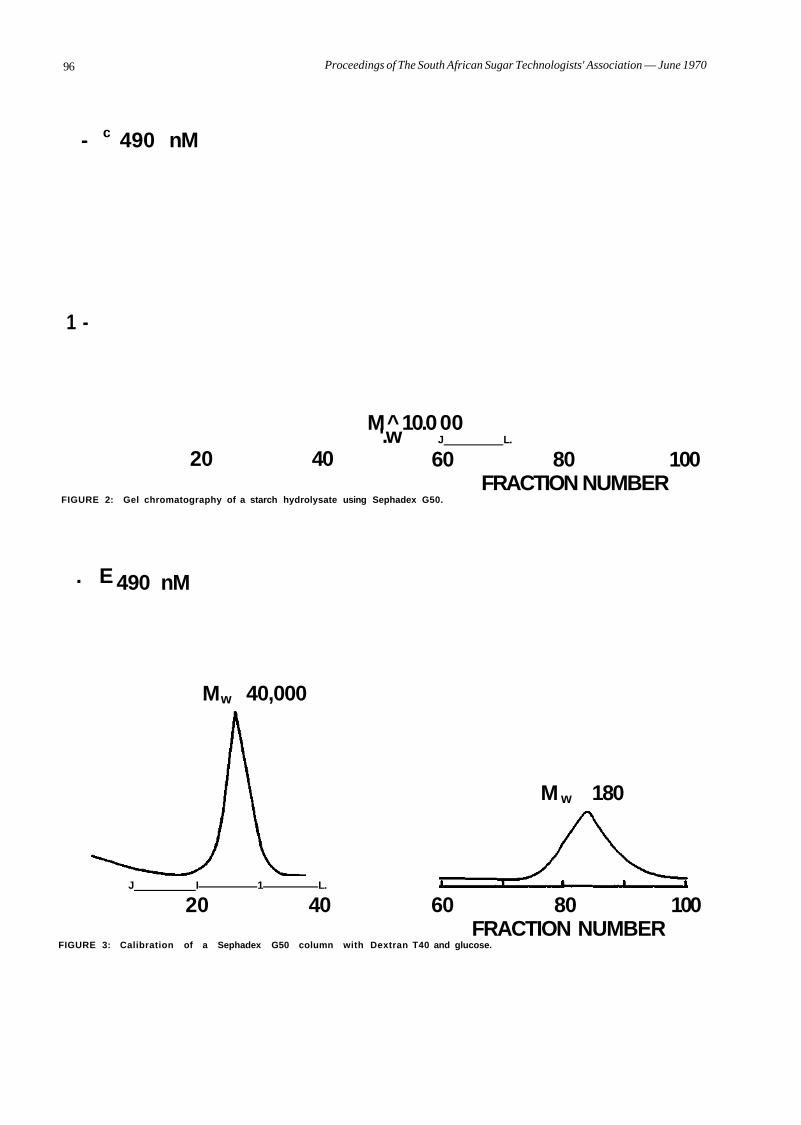
96 Proceedings of The South African Sugar Technologists' Association — June 1970
- c 490 nM
1 -
M^ 10.0 00 '.w J L.
20 40 60 80 100 FRACTION NUMBER
FIGURE 2: Gel chromatography of a starch hydrolysate using Sephadex G50.
. E 490 nM
Mw 40,000
J I 1 L.
M w 180
20 40 60 80 100 FRACTION NUMBER
FIGURE 3: Calibration of a Sephadex G50 column with Dextran T40 and glucose.
Proceedings of The South African Sugar Technologists' Association —
Acknowledgement Thanks are due to Mrs. M. Roberts for the ex
perimental work.
References 1. F. J. Bates Polarimetry, Saccharimetry and the Sugars
p. 198 U.S.A. Gov. Print. Office Washington (1942). 2. J. Robyt and D. French
Arch Biochem & Biophys 100 451 (1963). 3. W. Banks e.a. Carbohydrate Research 12 79 (1970). 4. Commission on Enzymes, International Union of Bio
chemistry 1961. Enzyme units p. 7 Pergamon Press, Oxford (1961).
5. M. Dubois e.a. Analyt. Chem. 28 350 (1956).
6. J. Osugi Rev. Phys. Chem. Jpan 5/ 957 (1958). 7. W. E. Trevelyan e.a. Nature 166 52 (1950). 8. R. L. Whistler & J. C. Hickson.
Analy. Chem. 27 1514 (1955).
Discussion Mr. Alexander (in the chair): Do any of the
oligosaccharides in the hydrolysate co-crystallise with sucrose?
Mr. Bruijn: I have not done any work on this. But a subject under investigation at the moment is to try and find out why some factories produce elongated crystals, which, according to an Australian publication, are due to dextran.
We have analysed massecuites, which gave elongated crystals, for their total polysaccharide content but found no difference in the total quantity compared with other massecuites.
At present I am isolating the total quantity of polysaccharides and putting them through columns to try and find any difference in molecular weight.
Mr. Comrie: Mr. Bruijn mentions that the oligosaccharides G20 to G2S were separated by thin layer chromatography, using silica gel. We have had no success with this method.
Also, did he use streaking techniques for his paper chromatography, or only the spots as shown on the slides?
I must congratulate him on Table II, where his total carbohydrate recovery was near 100%.
Mr. Bruijn: I did carry out thin layer chromatography, but not very successfully, hence I used paper chromatography.
Dr. Murray: I would like to know more about the kinetics of starch hydrolysis. The kinetics shown by Mr. Smith appear to be zero order under his experimental conditions.
— June 1970 97
However, the kinetics shown by Mr. Bruijn's experiments under factory conditions are not of zero order. Now in a normal chemical reaction, if the order changes then the products of the reaction may change and, of course, if the products change this means that the subsequent chemical and physical behaviour of the system will change. If then one produces different products by changing hydrolysis conditions then might this not have an effect on the crystallisation of sucrose and impurities intercalated at a later stage?
Does the mechanism of starch hydrolysis vary with reaction conditions?
Mr. Bruijn: A lot has been published about the mechanism of the amylase attack on starch but I would have to study this to answer your question.
Mr. Cox: Starch hydrolysis has the characteristics of a first order reaction. One of the characteristics of this type of reaction is that it has a fixed and definite half life; therefore the percentage of starch hydrolysed in mixtures will remain constant, since until the point is reached at which all the actual sites on the enzyme are saturated, the speed of reaction will increase in proportion to the concentration of starch present. When all the active sites are saturated the kinetics change to zero order. This does not entail however that the molecularity of the reaction has changed, only that the availability of active sites. which under constant enzyme concentration will remain constant, has become the limiting factor. Under these conditions the mechanism of the reaction should remain exactly the same as when there still remained some active sites available, that is, as when the kinetics were still of the first order.
Dr. Matic: Over ninety percent of the original material was hydrolysed as determined by the starch-iodine colour determination. However, thirty percent of the hydrolysate according to gel-chromatography had an average molecular weight of 10.000 and therefore it would be expected to give blue colour. These two results seem to be contradictory.
Mr. Bruijn: It has been published that malto oligosaccharides with a molecular weight greater than 10 give a coloured iodine complex.
There seems to be a discrepancy in the results. It is however likely that the malto oligosaccharide has to be unbranched to give this colour. In the hydrolysate obtained most of the larger oligosaccharides obtained will be branched.
98 Proceedings of The South African Sugar Technologists' Association — June 1970
THE ISOLATION AND PARTIAL CHARACTERISATION OF OLIGOSACCHARIDES IN REFINERY MOLASSES
By P. G. MOREL DU BOIL, K. J. SCHAFFLER, G. W. COMRIE and D. M. OOSTHUIZEN
Huletfs Research and Development
Abstract Two trisaccharides have been isolated by carbon
chromatography from cane refinery molasses. Raf-finose was detected and characterised by hydrolysis. The other carbohydrate yielded, on hydrolysis, fructose and glucose in the ratio of 2:1, indicating a fructosylsucrose. Concentrations of each trisaccha-ride were approx. 0.5% by weight.
Introduction The determination of sucrose in molasses is of
prime importance to the efficient running of a sugarcane factory. When the conventional methods for sucrose determination were drawn up, the influence of impurities such as raffinose, kestoses and polysaccharides was not fully realised.
The application of the invertase method in beet molasses was questionable because of the presence of raffinose, kestose and levan39. These compounds are all hydrolysed to monosaccharides and thus a falsely high sucrose value is obtained. The polarisation methods for the determination of sucrose are also suspect because of oligosaccharide interference39- 10. De Whalley13 has noted that a raw sugar shows an elevation of pol of 0.4 for every 1 % kestose present. Clerget molasses, however, shows an increase in sucrose content of 0.8 for the same concentration of kestose present.
Sutherland", along with Leonard and Richards30, identified polysaccharides as being the major cause of crystal elongation. On the other hand, however, Japanese workers 28, concerned about the refining quality of raw sugars, have considered the effects of starch, silica, phosphate, gum and oligosaccharide impurities on the formation of needle-shaped crystals in raw sugars. They concluded that oligosaccharides are a dominant factor and gums a secondary factor in the formation of elongated crystals. Extensive studies into the kinetics of sucrose crystal growth have been carried out by Smythe36-37-38. Oligosaccharides have been found to poison the growing sucrose crystal by adsorption. The most effective inhibitors of sucrose crystal growth appear to be those oligosaccharides derived from sucrose by substitution on the primary hydroxyl group attached to C8 of glucose. Therefore raffinose and neo-kestose (II) are reported to be much more powerful inhibitors than 1-kestose (III) and 6-kestose (IV).
These oligosaccharides have the same sucrose moiety and their occurrence is due to transglyco-
sylation. Kestoses are fructosylsucroses which have been formed by the enzymatic transfer of a fructose radical to one of three primary hydroxyl groups of sucrose by the action of invertase17. The formation of these fructosylsucroses has been observed with invertase from a wide variety of sources—fungal, bacterial and plant extracts1'3'*-5-7'22-25. Methods of preparation of these kestoses have been outlined by Gross21. One of these methods was modified slighdy and used to prepare 6-kestose in our laboratories.
Raffinose, although occurring mainly in beet sugar factories, has been reported in cane sugar products. Gross23 detected raffinose in raw sugar produced from cane. Binkley9 later verified this by isolating raffinose and crystalline 1- and 6-kestoses from cane final molasses.
It was decided therefore to study the occurrence of oligosaccharides in South African sugar factories. Refinery molasses was chosen as the initial starting material.
Several chromatographic media have been used for the separation of sugars. Ion exchange32 and more recently, dextran18 and polyacrylamide gels27-34 have been used in the separation of carbohydrates.
Carbon was first proposed as a chromatographic medium for the separation of carbohydrates in 194141. Six years later the separation of a mixture of glucose, sucrose and raffinose was reported using carbon as the stationary phase and a 4% aqueous phenol solution as eluant11. Whistler and Durso43
extended the technique of Tiselius and in 1950 reported the use of aqueous ethanol as an eluting agent for sugars from a carbon-celite column. Small variations of eluant composition, degree of dilution of sugars and the presence of inorganic salts did not affect the separation.
The method of Whistler and Durso43 was adopted and proved successful in the isolation of two trisaccharides from refinery molasses.
Experimental All concentrations were carried out at 40 °C under
reduced pressure.
Paper Chromatography Paper chromatography was carried out using the
continuous descending technique on Whatman No. 1 paper, or (for preparative work) Whatman No. 3MM. The following solvent systems were used.
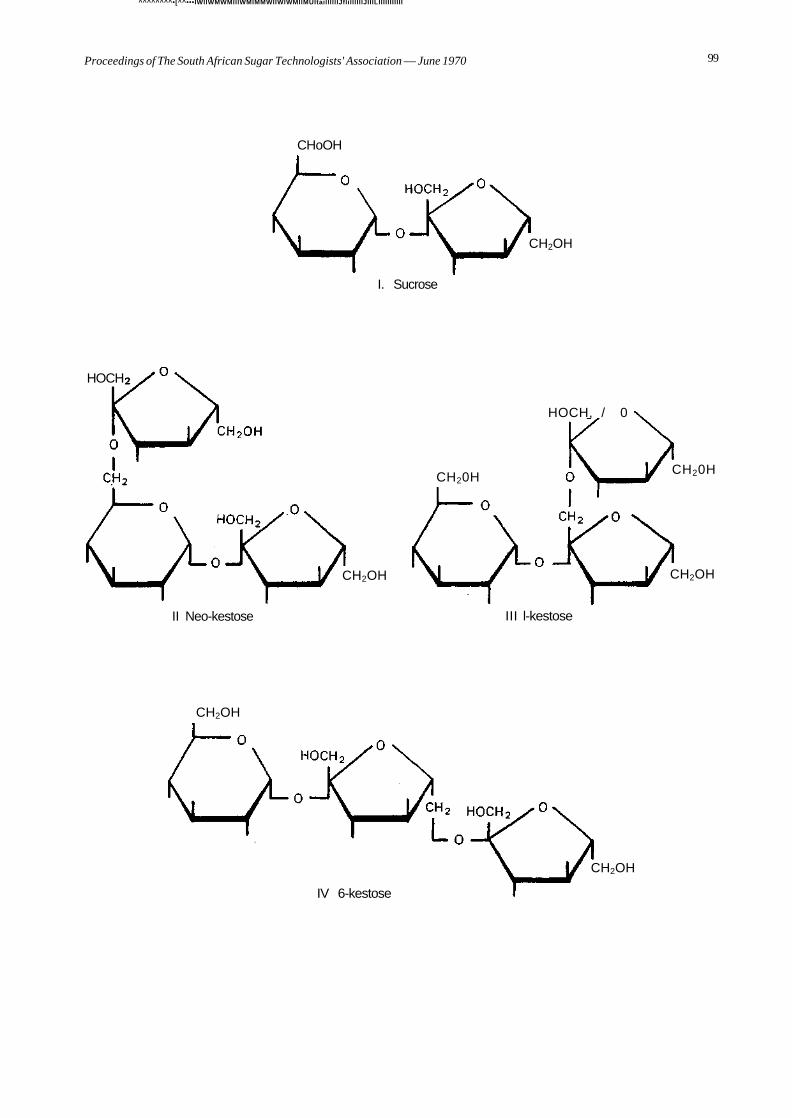
^^^^^^^^•[^^•••IWllWMWMIllWMlMMWIIWlWMllMUItaillllllJflillllllJIIlLIIIIIIIIIII
Proceedings of The South African Sugar Technologists' Association — June 1970 99
CHoOH
I. Sucrose
CH2OH
HOCH
CH2OH
CH20H
HOCH, / 0
CH20H
CH2OH
II Neo-kestose III l-kestose
CH2OH
CH2OH
IV 6-kestose
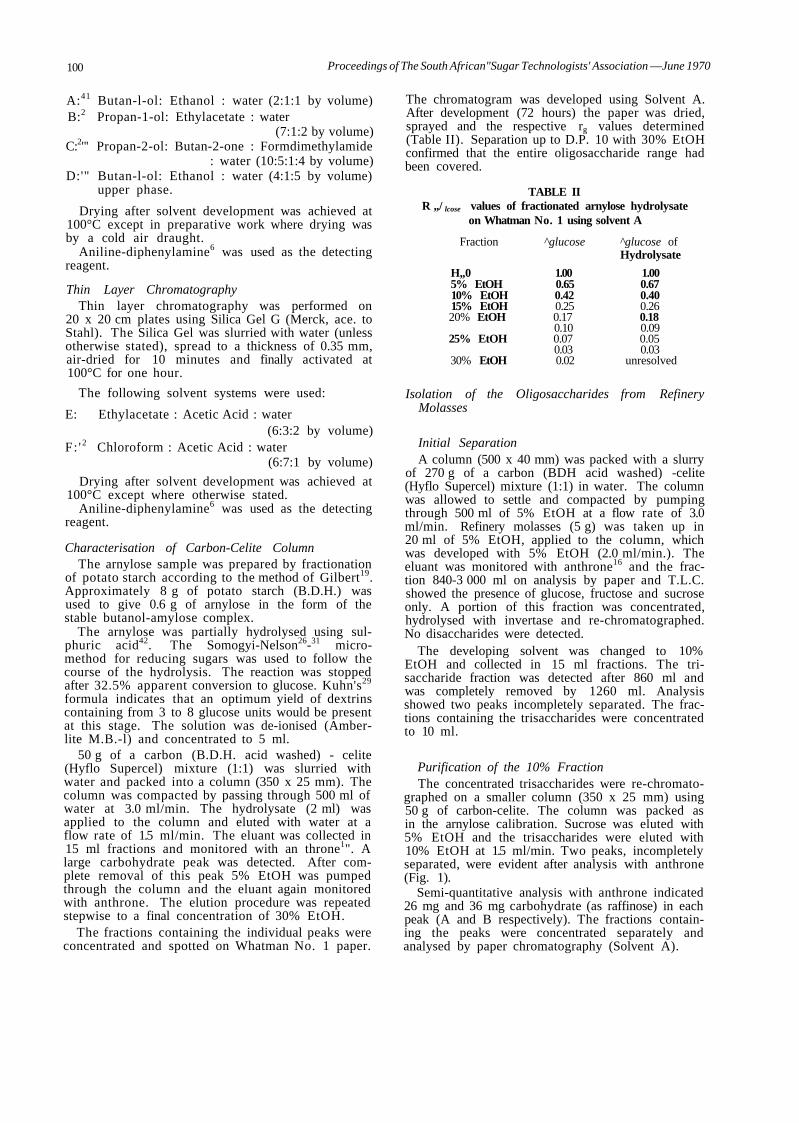
100 Proceedings of The South African"Sugar Technologists' Association —June 1970
A:41 Butan-l-ol: Ethanol : water (2:1:1 by volume) B:2 Propan-1-ol: Ethylacetate : water
(7:1:2 by volume) C:2"' Propan-2-ol: Butan-2-one : Formdimethylamide
: water (10:5:1:4 by volume) D:'" Butan-l-ol: Ethanol : water (4:1:5 by volume)
upper phase.
Drying after solvent development was achieved at 100°C except in preparative work where drying was by a cold air draught.
Aniline-diphenylamine6 was used as the detecting reagent.
Thin Layer Chromatography Thin layer chromatography was performed on
20 x 20 cm plates using Silica Gel G (Merck, ace. to Stahl). The Silica Gel was slurried with water (unless otherwise stated), spread to a thickness of 0.35 mm, air-dried for 10 minutes and finally activated at 100°C for one hour.
The following solvent systems were used:
E: Ethylacetate : Acetic Acid : water (6:3:2 by volume)
F: '2 Chloroform : Acetic Acid : water (6:7:1 by volume)
Drying after solvent development was achieved at 100°C except where otherwise stated.
Aniline-diphenylamine6 was used as the detecting reagent.
Characterisation of Carbon-Celite Column The arnylose sample was prepared by fractionation
of potato starch according to the method of Gilbert19. Approximately 8 g of potato starch (B.D.H.) was used to give 0.6 g of arnylose in the form of the stable butanol-amylose complex.
The arnylose was partially hydrolysed using sulphuric acid42. The Somogyi-Nelson26-31 micro-method for reducing sugars was used to follow the course of the hydrolysis. The reaction was stopped after 32.5% apparent conversion to glucose. Kuhn's29
formula indicates that an optimum yield of dextrins containing from 3 to 8 glucose units would be present at this stage. The solution was de-ionised (Amber-lite M.B.-l) and concentrated to 5 ml.
50 g of a carbon (B.D.H. acid washed) - celite (Hyflo Supercel) mixture (1:1) was slurried with water and packed into a column (350 x 25 mm). The column was compacted by passing through 500 ml of water at 3.0 ml/min. The hydrolysate (2 ml) was applied to the column and eluted with water at a flow rate of 1.5 ml/min. The eluant was collected in 15 ml fractions and monitored with an throne1". A large carbohydrate peak was detected. After complete removal of this peak 5% EtOH was pumped through the column and the eluant again monitored with anthrone. The elution procedure was repeated stepwise to a final concentration of 30% EtOH.
The fractions containing the individual peaks were concentrated and spotted on Whatman No. 1 paper.
The chromatogram was developed using Solvent A. After development (72 hours) the paper was dried, sprayed and the respective rg values determined (Table II). Separation up to D.P. 10 with 30% EtOH confirmed that the entire oligosaccharide range had been covered.
TABLE II R „/ lcose values of fractionated arnylose hydrolysate
on Whatman No. 1 using solvent A
Fraction ^glucose ^glucose of Hydrolysate
H„0 1.00 1.00 5% EtOH 0.65 0.67 10% EtOH 0.42 0.40 15% EtOH 0.25 0.26 20% EtOH 0.17 0.18
0.10 0.09 25% EtOH 0.07 0.05
0.03 0.03 30% EtOH 0.02 unresolved
Isolation of the Oligosaccharides from Refinery Molasses
Initial Separation A column (500 x 40 mm) was packed with a slurry
of 270 g of a carbon (BDH acid washed) -celite (Hyflo Supercel) mixture (1:1) in water. The column was allowed to settle and compacted by pumping through 500 ml of 5% EtOH at a flow rate of 3.0 ml/min. Refinery molasses (5 g) was taken up in 20 ml of 5% EtOH, applied to the column, which was developed with 5% EtOH (2.0 ml/min.). The eluant was monitored with anthrone16 and the fraction 840-3 000 ml on analysis by paper and T.L.C. showed the presence of glucose, fructose and sucrose only. A portion of this fraction was concentrated, hydrolysed with invertase and re-chromatographed. No disaccharides were detected.
The developing solvent was changed to 10% EtOH and collected in 15 ml fractions. The tri-saccharide fraction was detected after 860 ml and was completely removed by 1260 ml. Analysis showed two peaks incompletely separated. The fractions containing the trisaccharides were concentrated to 10 ml.
Purification of the 10% Fraction The concentrated trisaccharides were re-chromato
graphed on a smaller column (350 x 25 mm) using 50 g of carbon-celite. The column was packed as in the arnylose calibration. Sucrose was eluted with 5% EtOH and the trisaccharides were eluted with 10% EtOH at 1.5 ml/min. Two peaks, incompletely separated, were evident after analysis with anthrone (Fig. 1).
Semi-quantitative analysis with anthrone indicated 26 mg and 36 mg carbohydrate (as raffinose) in each peak (A and B respectively). The fractions containing the peaks were concentrated separately and analysed by paper chromatography (Solvent A).
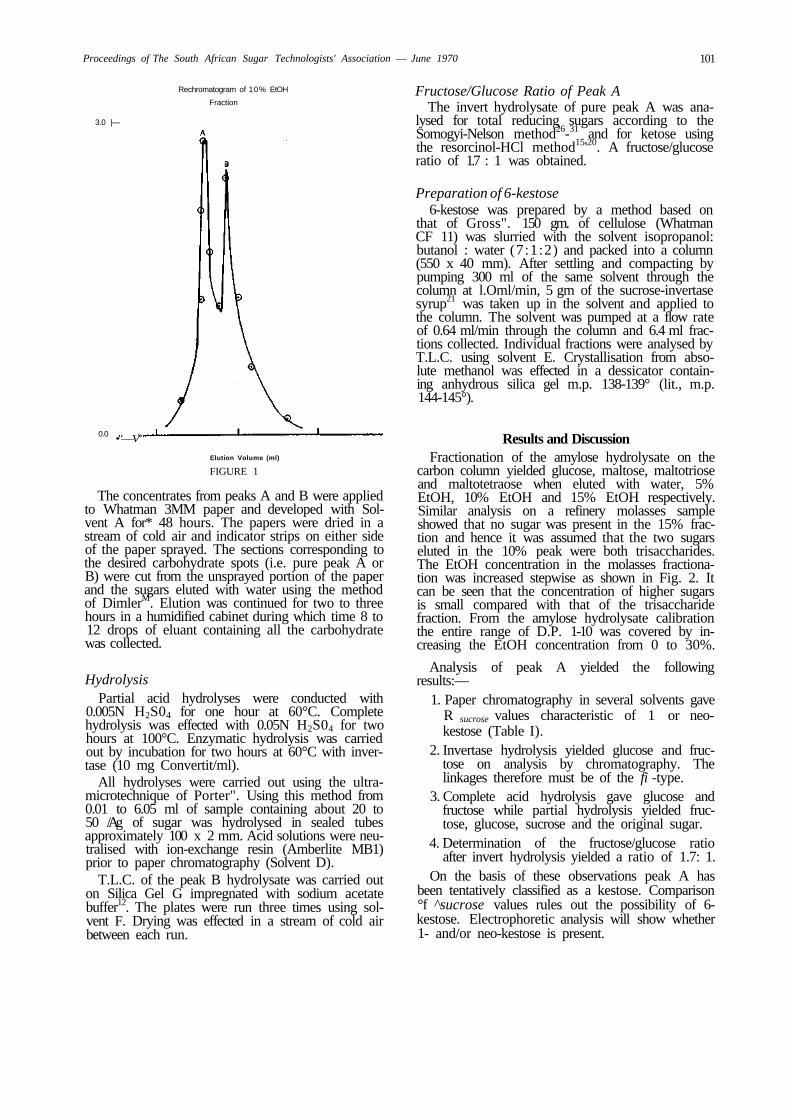
Proceedings of The South African Sugar Technologists' Association — June 1970 101
Rechromatogram of 10% EtOH
Fraction
3.0 |—
0.0 •"—Vs"
Elution Volume (ml)
FIGURE 1
The concentrates from peaks A and B were applied to Whatman 3MM paper and developed with Solvent A for* 48 hours. The papers were dried in a stream of cold air and indicator strips on either side of the paper sprayed. The sections corresponding to the desired carbohydrate spots (i.e. pure peak A or B) were cut from the unsprayed portion of the paper and the sugars eluted with water using the method of DimlerM. Elution was continued for two to three hours in a humidified cabinet during which time 8 to 12 drops of eluant containing all the carbohydrate was collected.
Hydrolysis Partial acid hydrolyses were conducted with
0.005N H2S04 for one hour at 60°C. Complete hydrolysis was effected with 0.05N H2S04 for two hours at 100°C. Enzymatic hydrolysis was carried out by incubation for two hours at 60°C with inver-tase (10 mg Convertit/ml).
All hydrolyses were carried out using the ultra-microtechnique of Porter". Using this method from 0.01 to 6.05 ml of sample containing about 20 to 50 /Ag of sugar was hydrolysed in sealed tubes approximately 100 x 2 mm. Acid solutions were neutralised with ion-exchange resin (Amberlite MB1) prior to paper chromatography (Solvent D).
T.L.C. of the peak B hydrolysate was carried out on Silica Gel G impregnated with sodium acetate buffer12. The plates were run three times using solvent F. Drying was effected in a stream of cold air between each run.
Fructose/Glucose Ratio of Peak A The invert hydrolysate of pure peak A was ana
lysed for total reducing sugars according to the Somogyi-Nelson method26-31 and for ketose using the resorcinol-HCl method15'20. A fructose/glucose ratio of 1.7 : 1 was obtained.
Preparation of 6-kestose 6-kestose was prepared by a method based on
that of Gross". 150 gm. of cellulose (Whatman CF 11) was slurried with the solvent isopropanol: butanol : water (7:1:2) and packed into a column (550 x 40 mm). After settling and compacting by pumping 300 ml of the same solvent through the column at l.Oml/min, 5 gm of the sucrose-invertase syrup21 was taken up in the solvent and applied to the column. The solvent was pumped at a flow rate of 0.64 ml/min through the column and 6.4 ml fractions collected. Individual fractions were analysed by T.L.C. using solvent E. Crystallisation from absolute methanol was effected in a dessicator containing anhydrous silica gel m.p. 138-139° (lit., m.p. 144-145°).
Results and Discussion Fractionation of the amylose hydrolysate on the
carbon column yielded glucose, maltose, maltotriose and maltotetraose when eluted with water, 5% EtOH, 10% EtOH and 15% EtOH respectively. Similar analysis on a refinery molasses sample showed that no sugar was present in the 15% fraction and hence it was assumed that the two sugars eluted in the 10% peak were both trisaccharides. The EtOH concentration in the molasses fractionation was increased stepwise as shown in Fig. 2. It can be seen that the concentration of higher sugars is small compared with that of the trisaccharide fraction. From the amylose hydrolysate calibration the entire range of D.P. 1-10 was covered by increasing the EtOH concentration from 0 to 30%.
Analysis of peak A yielded the following results:—
1. Paper chromatography in several solvents gave R sucrose values characteristic of 1 or neo-kestose (Table I).
2. Invertase hydrolysis yielded glucose and fructose on analysis by chromatography. The linkages therefore must be of the fi -type.
3. Complete acid hydrolysis gave glucose and fructose while partial hydrolysis yielded fructose, glucose, sucrose and the original sugar.
4. Determination of the fructose/glucose ratio after invert hydrolysis yielded a ratio of 1.7: 1.
On the basis of these observations peak A has been tentatively classified as a kestose. Comparison °f ^sucrose values rules out the possibility of 6-kestose. Electrophoretic analysis will show whether 1- and/or neo-kestose is present.
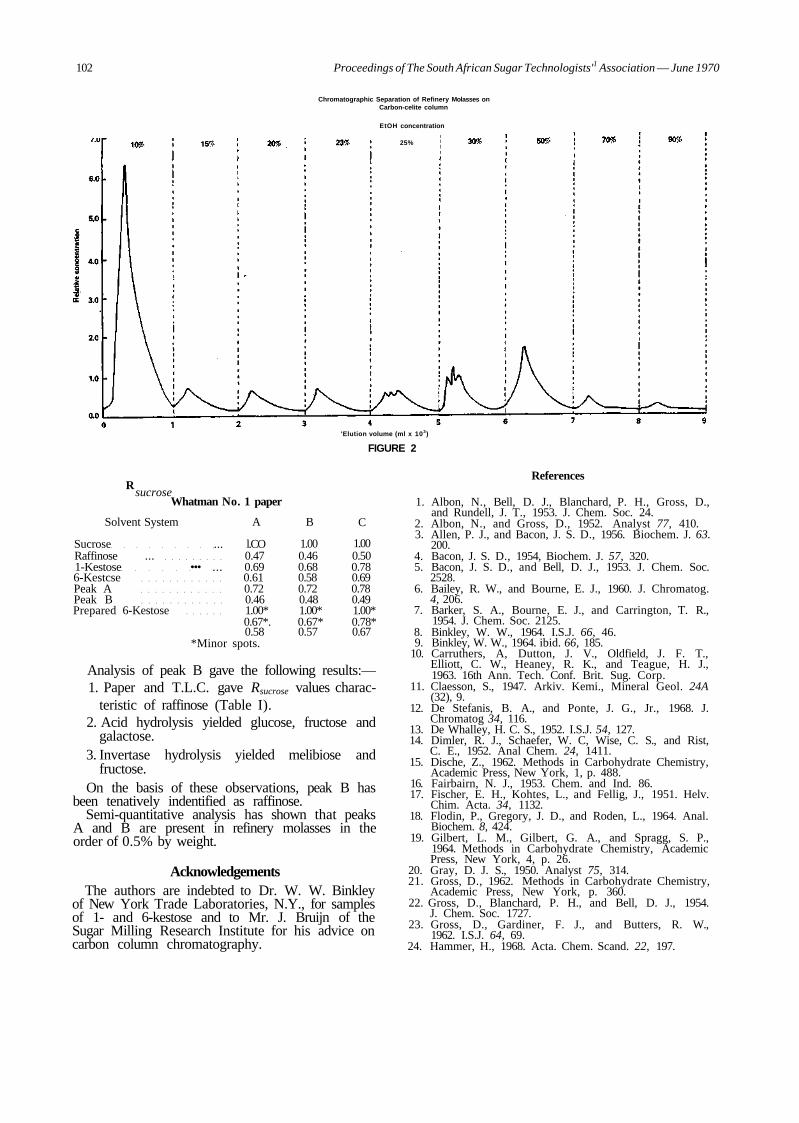
102 Proceedings of The South African Sugar Technologists'1 Association — June 1970
Chromatographic Separation of Refinery Molasses on Carbon-celite column
EtOH concentration
25%
'Elution volume (ml x 103)
FIGURE 2
R sucrose
Whatman No. 1 paper
Solvent System
Sucrose ... Raffinose ... 1-Kestose ••• ... 6-Kestcse Peak A Peak B Prepared 6-Kestose
*Minor
A
l.CO 0.47 0.69 0.61 0.72 0.46 1.00* 0.67*. 0.58
spots.
B
1.00 0.46 0.68 0.58 0.72 0.48 1.00* 0.67* 0.57
C
1.00 0.50 0.78 0.69 0.78 0.49 1.00* 0.78* 0.67
Analysis of peak B gave the following results:— 1. Paper and T.L.C. gave Rsucrose values charac
teristic of raffinose (Table I). 2. Acid hydrolysis yielded glucose, fructose and
galactose. 3. Invertase hydrolysis yielded melibiose and
fructose. On the basis of these observations, peak B has
been tenatively indentified as raffinose. Semi-quantitative analysis has shown that peaks
A and B are present in refinery molasses in the order of 0.5% by weight.
Acknowledgements The authors are indebted to Dr. W. W. Binkley
of New York Trade Laboratories, N.Y., for samples of 1- and 6-kestose and to Mr. J. Bruijn of the Sugar Milling Research Institute for his advice on carbon column chromatography.
References
1. Albon, N., Bell, D. J., Blanchard, P. H., Gross, D., and Rundell, J. T., 1953. J. Chem. Soc. 24.
2. Albon, N., and Gross, D., 1952. Analyst 77, 410. 3. Allen, P. J., and Bacon, J. S. D., 1956. Biochem. J. 63.
200. 4. Bacon, J. S. D., 1954, Biochem. J. 57, 320. 5. Bacon, J. S. D., and Bell, D. J., 1953. J. Chem. Soc.
2528. 6. Bailey, R. W., and Bourne, E. J., 1960. J. Chromatog.
4, 206. 7. Barker, S. A., Bourne, E. J., and Carrington, T. R.,
1954. J. Chem. Soc. 2125. 8. Binkley, W. W., 1964. I.S.J. 66, 46. 9. Binkley, W. W., 1964. ibid. 66, 185.
10. Carruthers, A, Dutton, J. V., Oldfield, J. F. T., Elliott, C. W., Heaney, R. K., and Teague, H. J., 1963. 16th Ann. Tech. Conf. Brit. Sug. Corp.
11. Claesson, S., 1947. Arkiv. Kemi., Mineral Geol. 24A (32), 9.
12. De Stefanis, B. A., and Ponte, J. G., Jr., 1968. J. Chromatog 34, 116.
13. De Whalley, H. C. S., 1952. I.S.J. 54, 127. 14. Dimler, R. J., Schaefer, W. C, Wise, C. S., and Rist,
C. E., 1952. Anal Chem. 24, 1411. 15. Dische, Z., 1962. Methods in Carbohydrate Chemistry,
Academic Press, New York, 1, p. 488. 16. Fairbairn, N. J., 1953. Chem. and Ind. 86. 17. Fischer, E. H., Kohtes, L., and Fellig, J., 1951. Helv.
Chim. Acta. 34, 1132. 18. Flodin, P., Gregory, J. D., and Roden, L., 1964. Anal.
Biochem. 8, 424. 19. Gilbert, L. M., Gilbert, G. A., and Spragg, S. P.,
1964. Methods in Carbohydrate Chemistry, Academic Press, New York, 4, p. 26.
20. Gray, D. J. S., 1950. Analyst 75, 314. 21. Gross, D., 1962. Methods in Carbohydrate Chemistry,
Academic Press, New York, p. 360. 22. Gross, D., Blanchard, P. H., and Bell, D. J., 1954.
J. Chem. Soc. 1727. 23. Gross, D., Gardiner, F. J., and Butters, R. W.,
1962. I.S.J. 64, 69. 24. Hammer, H., 1968. Acta. Chem. Scand. 22, 197.

Proceedings of The South African Sugar Technologists' Association —
25. Henderson, R. W., Morton, R. K., and Rawlinson, W. A., 1959. Biochem. J. 72, 34.
26. Hodge, J. E., and Hofreiter, B. T., 1962. Methods in Carbohydrate Chemistry, Academic Press, New York, 1, p. 380.
27. John, M., Trenel, G., and Dellweg, H., 1969. J. Chromatog. 42, Aid.
28. Kamoda, M., Onda, F., Ito, H., Shirasaki, T., Miki, T., and Ando, T., 1968. Proc. of the 13th Congress of I.S.S.C.T. 362.
29. Kuhn, R., 1930. Ber. 63, 1503. 30. Leonard, G. J., and Richards, G. K, 1969. I.S.J.
71, 263. 31. Marais, J. P., De Wit, J. L., and Quicke, G. V., 1966.
Anal. Biochem. 15, 373. 32. McCready, R. M., and Goodwin, J. C. 1966. J.
Chromatog. 22, 195. 33. Partridge, S. M., 1946. Nature 158, 270. 34. Pontis, H. G., 1968. Anal. Biochem. 23, 331. 35. Porter, W. L., and Hoban, N., 1954. Anal. Chem. 26,
1847. 36. Smythe, B. M., 1967. Aust. J. Chem. 20, 1087. 37. Smythe, B. M., 1967. ibid. 20, 1097. 38. Smythe, B. M, 1967. ibid. 20, 1115. 39. Stachenko, S. (referee), 1962. I.C.U.M.S.A. Proc. 14th
Session, Copenhagen, Subject 8. 40. Sutherland, D. N., 1968. I.S.J. 70, 355. 41. Tiselius, A., 1941. Arkiv. Kemi., Mineral Geol. 14B
(32), 8. 42. Whelan, W. J., Bailey, J. M., and Roberts, P. J. P.,
1953. J. Chem. Soc. 1293. 43. Whistler, R. L., and Durso, D. F., 1950. J. Amer.
Chem. Soc. 72, 677. 44. Whistler, R. L., and Hickson, J. L., 1955. Anal. Chem.
27, 1514.
Discussion Mr. Alexander (in the chair): We do not know
where this investigation will lead us, but it may explain some of the anomalies we have in the sugar industry, such as undetermined losses.
— June 1970 103
Dr. Matic: A prepared 6-kestose appears to be impure, as shown by the melting point and chromatographic behaviour. This should be borne in mind when further work is carried out.
Mr. Schaft'ler: The melting point is not as it should be because we only re-crystallised 6-kestose once, owing to lack of time before writing this paper.
Mr. Comrie: In Table I it is shown that 6-kestose contained minor spots and was not as pure as we would have liked. The main spot had an R sucrose value of .58.
Mr. Carter: Can this now be regarded as a routine analysis to be carried out by ordinary laboratory personnel?
Mr. Schaffler: The results reported in this paper are part of a research project which is being carried out to identify oligosaccharides in sugar products.
Once the oligosaccharides have been identified, a routine quantitative thin layer chromatographic method will be adopted.
Initial experiments in this aspect of the work are now in progress.
Mr. Jennings: At the recent ICUMSA meeting, kestoses and disaccharides were discussed and methods mentioned at the previous Copenhagen meeting were tentatively approved.
One difficulty in setting up routine methods for kestoses is to obtain standard samples. We have ob-"tained samples of 1-kestose and 6-kestose from the New York trade laboratory.
Mr. Dutton, of British Sugar Corporation, has done determinations of kestoses and raffinoses in cane molasses from all over the world. The largest amount of kestose and raffinose found in combination was .5% in cane refinery molasses.
104 Proceedings of The South African Sugar Technologists" Association — June 1970
SOME ASPECTS OF FACTORY OPERATION AT THE TONGAAT SUGAR COMPANY FACTORY
By G. G. CARTER, W. S. GRAHAM and
B. ST. C. MOOR
The Tongaat Sugar Company Limited
A review of several of the operations carried out in a raw sugar factory has been presented. Proven solutions to some of the practical problems which were being experienced at the Tongaat Sugar Company factory are described, while mention is also made of some still unresolved practical difficulties which, it is hoped, will provoke fruitful discussion.
Trials with an Ultrasonic Electrode Cleaner A commercially available ultrasonic electrode
cleaner was tried on the electrodes which measured the pH of limed juice at its boiling point. The local representatives of the supplier had stated that the ultrasonic electrode cleaner could be used satisfactorily on boiling juices but it was only subsequent to its installation that the contrary opinion of a representative from the parent company in Europe was learned. It was explained that the electrode cleaner would prove unsatisfactory in liquids at boiling point because the energy imparted by the electrode cleaner would cause a vapour layer on the electrode surface, i.e. the liquid on the surface of the electrode was made to boil. This was borne out in practice.
The unit did show the anticipated benefit of keeping the electrodes clean but it also caused unexpected damage. In particular it caused the porous plug on the reference electrode to be dislodged and was the probable cause of some broken glass electrodes. Further, the sealing of the ultrasonic probe itself was unsuitable for the conditions of use.
The Distribution of Limed Juice to the Clarifiers More than one type of commercial arrangement
for the distribution of limed juice to the clarifiers had been tried at Tongaat without success when it was decided to design a plant to perform this important function. Incidentally, unsuccessful plant included vee-notch weirs and submerged adjustable gates.
The requirements of the plant were:— (a) The proportion of the total factory flow of
juice lo each clarifier should be easily adjustable over a wide range (including zero, i.e. clarifier shut off).
(b) Once set, the ratios of the flows to each clarifier should be unaffected by variations in the total factory flow. i.e. the proportions to be independent of the total.
(c) The flow to each clarifier should be easily and accurately measurable at all flow rates.
Attaining these objectives was complicated at Tongaat by:—
(i) The wide variations in flow stemming from two different-sized milling trains which gave nominal crushing rates of 0, 120, 180 and 300 tons/hour, depending on what plant was running.
(ii) Wide variations of clarifier capacities, with two 24 ft. Dorr and four 22 ft. Bach clarifiers.
The above objectives have been successfully achieved under all conditions of operation in a relatively simple and inexpensive manner by distributing the juice from a quiescent tank through a series of adjustable Cippoletti weirs. Cippoletti weirs were chosen in preference to vee-notch weirs for two major reasons. First, the vee-notch form does not permit simple adjustment whilst retaining the proportionality condition (b) above. Secondly, the vee-notch discharge being proportional to H2-5 suffers from a markedly bunched scale for large values of H, which means that precision of measurement is sacrificed at large flows.
An excellent weir form for the required purpose would be a suppressed rectangular weir for which the discharge Q is given by—
Q = 3.33 LH1-5 in f.p.s. units where L is the length of weir and H the height of the free upstream liquid surface above the base of the weir. A series of such weirs with a common base level positioned round a tank would discharge in the ratio of their lengths. However, if a simple gate were introduced to adjust the length L of such a weir, its form would be changed immediately to that of an unsuppressed weir. With two end contractions the flow from a rectangular weir becomes Q = 3.33 (L - O.l H) H'-5.
Apart from the more complicated calculation this implies, the property of Q being proportional to L for a given H has now been lost. This means that the ratio of the flows through different weirs would no longer be independent of the total flow. This was the problem which led to the selection of a Cippoletti weir form.
A Cippoletti weir is a trapezoidal weir whose side angle 6 (Fig. 1) is selected such that the increase of length with height just compensates for the effect of the end contractions and the formula for such a weir reverts to the desired form of—
Q = 3.33 LH1-4
The angle 9 for this property was determined by Cippoletti to be such that tan 6=0.25.

Proceedings of The South African Sugar Technologists' Association — June 1970 105
FIGURE 1: Illustration of a Cippoletti weir.
If Q is expressed in metric tons per hour while H and L are given in centimetres the equation for the flow of juice (S.G. 1.06) over a Cippoletti weir is-
O = 0.06795 x L x H1-1
The product 0.06795 x H1-5 was calculated for different values of H and these values used to con-
SCALE A
SCALE B
^OUTLETS
w?a
SCALE A
SCALE B
O
WEIRS
QUIESCENT
ZONE
I-o o
NLET
FIGURE 2: T.S.C. juice distribution tank.
FIGURE 2A: Details of scales in Figure 2.
struct the (scale A) which indicated the height of juice above the weirs. Hence the product of this reading and the weir opening in centimetres read from another scale (scale B), gave the quantity of juice passing through the weir.
Details of appropriate H/L ratios, free ventilation and chamfered edges, etc., required in the design of such a box can be found in any standard hydraulics or engineering handbook. The arrangement of the Tongaat installation is depicted diagrammatically in Fig. 2.
A check on the accuracy of these weirs was made on a number of occasions by comparing the calculated flow through the weirs with the recorded flow from an orifice plate. The agreement was within 1-2%.
A problem which was found with the weir box was a build up of sand which was such in the latter part of the year that it was necessary to flush it out once per week. To facilitate this operation it is desirable to have the bottom sloping towards the drain outlet.
Clarifiers Although all the heated juice at Tongaat passed
through a suitable flash tank the Bach clarifiers had flash tanks which were attached to each unit. One of
106 Proceedings of The South African Sugar Technologists' Association—June 1970
these had been removed a few years ago when some test work was being carried out on this clarifier and it had functioned satisfactorily since then without the flash tank. The other Bach flash tanks were removed during the past season and no problems have been experienced as a result. It should be mentioned that the emergency overflow of the Bach clarifier was located in its flash tank, but in view of the relatively large diameter of these clarifiers such an overflow was considered to be unnecessary under present circumstances. The main advantages of their removal were the reduction in maintenance and provision of extra space on the clarifier floor. It was noticed thai the juice entered the clarifier at a slightly higher temperature after they had been removed.
T.S.C. operated two 24 ft. Rapidorr clarifiers and in the past it had been found that one of them had a marked tendency to retain caked mud in the mud compartments. A close study of the units was made in order to find the cause of the difference in performance. Two features that were noted were—
(a) different rates of rotation of the scraping gear; and
(b) juice take-off pipes in the one clarifier were set about 20 cm too low.
Although these two features were modified to bring the characteristics of the unsatisfactory clarifier into line with the better one it was not successful in achieving the desired improvement.
After seven weeks of operation in July/August the mud in the lower mud compartment had built up to the level of the inspection port. On the other hand, no significant mud build up occurred during the last 16 weeks of operation. Analysis of juice samples from this clarifier after a week-end shut-down showed a greater increase in R.S.R. than did any of the other clarifiers. Some comparative data of the R.S. ratios after a week-end shut-down were:—
5.26 and 7.12 6.36 and 10.16.
Juice Retention in Clarifiers
Trials run in Bach clarifiers at 55 and at 80 tons juice per hour seemed to indicate that there was less loss of sucrose with the lower retention time of 1.7 hours compared with 2.4 hours. This conclusion was based mainly on the change in R.S.R. from clarifier feed to clarified juice. As a guide to what happens in the clarifier it is suggested that this comparison is more meaningful than the change in R.S.R. from mixed juice to clarifier juice which is sometimes used as a rough indicator.
Filter Station
The retention of the filter station was known for some time to be low and attempts were made to improve it. These filters had been altered some years ago in such a way that the feed entered through two pipes in the bottom of the tray and the overflow was taken off from the one end instead of along the length of the filter.
Observations showed that the sprays were impinging too strongly on the cake and also delivering too much water. This resulted in erosion of the cake and dilution of the bagacillo/mud mixture in the filter tray. Consequently retention was being reduced in two ways, viz., by—
(a) washing off cake which had been picked up by the filter; and
(b) diluting the feed to the filter which has often been shown to result in lower retention.
New finer sprays were fitted and this did lead to improved results. Using water at a pressure of 3.8 bar absolute, these sprays delivered 200 ml/minute over a circle of diameter 20 cm when the spray was set 20 cm from the filter drum. However, it is still possible for the operator to add too much water on the top of the filter with the above-mentioned effects, but the answer to this is considered to lie in proper training of the operators.
A further aspect of filter operation which was examined was the setting of the cut off and application of vacuum to the panels of the filter drum. It was found that for a particular filter different panels appeared to cut off at different heights above the mud discharge point while some panels did not appear to break vacuum completely. It was only towards the end of the season that the cause of this unsatisfactory behaviour, viz. eroded or incomplete brass strips separating the panels, was found. The leaks occurred between the drum and the strip as well as on the screen side of the strip. Some leakage of vacuum also occurred on the strips sealing the ends of the panels. It is expected that the necessary attention to this will result in a further improvement in filter operation.
One other modification which seemed to have been well worth while was the fitting of steaming pipes along the length of the filter drums. These were set approximately 25 mm from the drum and consisted of 1.5 in. n.b. pipes with 1/16 in. diameter holes drilled at | in. centres. These were used to steam-clean the filters using 7 bar gauge steam once every two days and examination has indicated that after a full season's operation the screen and compartment behind it were still in a satisfactory state of cleanliness" for filter operation. Consequently it was not necessary to use the caustic soda cleaning treatment which had proved so successful on a previous occasion.
Pan Boiling Attention is drawn here to one aspect of the
operation of continuous centrifugals curing C masse-cuite, viz. the effect of irregular size grain. While a continuous machine can cope much more readily than a batch machine with a boiling containing all sizes of grain there can be appreciable loss of small crystals through the screen. Because of this, particular attention must always be paid to the grain regularity of the C boilings. At T.S.C. it was found that the regularity of boilings was not satisfactory and investigation showed that a major cause of this was the introduction of fine crystal in the B molasses and more especially in the wash from the double curing

June 1970 Proceedings of The South African Sugar Technologists' Association 107
of C sugar. The presence of the exceptionally large quantity of crystal in the wash was a direct result of crystal breakage in the continuous C fore-curers. A very noticeable improvement was achieved by dissolving this grain through the use of thermostatically controlled silent steam blowers on the pan suction tanks.
Stirrers were also employed so that localized overheating, which would cause caramelization, was minimized and also the feed to the pans was maintained at a uniform temperature. By heating the liquor in the suction tanks only, the amount of decomposition attendant on this practice was further minimized.
Discussion Mr. van Hengel (in the chair): Tongaat uses steam
blowers to improve the position regarding crystal in wash.
I think the present system of storage tanks for B-molasses should be reconsidered. These have been replaced at Mount Bdgcombe by one large vertical tank, which pumps continuously to a blow-up tank and continuously overflows so that solution of fine particles is taking place.
It may be that the difference in reducing sugar ratio between limed and clarified juice should be investigated before the difference between mixed juice and clarified juice but what do these differences really convey to us?
Dr. Graham: A major reason why Tongaat operates as at present is the belief that decomposition can be minimised by holding molasses in storage at as low a temperature as is practicable.
Hence, only the molasses in the pan feed tanks is heated to dissolve fine grain.
The reducing sugar differences referred to are used as an indicator of chemical changes in the clarifier.
Dr. Matic: Is it the intention to measure pH at the boiling point of the juice?
Dr. Graham: No, because we do not know how to clean electrodes at boiling point with the ultrasonic cleaner.
The other problem is that the electrodes simply do not last, whether they are being cleaned or not.
Dr. Matic: Dr. Parker mentioned a German make of electrode which would stand up to these conditions.
Mr. Cargill: Did Tongaat solve the problem of differences in clarifier capacities?
Mount Edgecombe last year installed an automatic flushing system for their electrodes.
Dr. Graham: Although we have modified the clari-fiers and are now using a reliable measuring device which controls the flow of juice, we are still having trouble and are getting an uneven build-up of mud.
Mr. Renton: Empangeni did at one stage introduce mechanical wiping of electrodes but this is no longer carried out.
Mr. Chiazzari: I am very interested in Tongaat's clarification system.
Regarding filter stations and the scaling up of the backing screens we have found that we cannot leave our screens for a week before cleaning them and we try and purge them every eight hours.
In connection with fine grain in wash, our centrifugals are fitted with a device operated by a timer, to feed water into the monitor casing.
By diluting the molasses in the casing, a smaller pump is required and much of the dissolving of fine crystal is affected.
We put low pressure vapour into our tanks and we seldom have trouble with microscopic grain coming back.
Dr. Graham: Our after-curers were continuous machines but we did not add water and often the wash looked more like massecuite than molasses.
Regarding our filters, an operator on each shift is responsible for two and he normally cleans one machine every second day.
In connection with clarification, the pH of the clarified juice is governed by two factors: (1) it should be minimum otherwise the quantity of final molasses is excessive; (2) we do not want an increase in reducing sugars from clarified juice to syrup, which is indicative of sucrose hydrolysis.
Mr. Bruijn: This morning we heard that the pH must not be too high because of decomposition of reducing sugars and because more molasses would be made.
Now we are told not to keep the pH too low because we will increase reducing sugars in the syrup.
There is no exact point where the one reaction stops and the other starts.
Dr. Graham: A compromise is necessary when deciding the pH at which the juice must be controlled. This value should be such that the destruction of both sucrose and reducing sugars is minimised.
Mr. van Hengel: The construction of our evaporators must be able to cope with the conditions which are optimum both ways and there is need for an intensive investigation.
Mr. Jullienne: Regarding bleeding of filters, it is important that they be properly cleaned at shut-down.
108 Proceedings of The South African Sugar Technologists' Association — June 1970
TRIALS ON B.M.A. CONTINUOUS CENTRIFUGALS By G. G. CARTER
The Tongaat Sugar Company Limited
The Tongaat Sugar Company installed 10 new B M.A. K850 continuous centrifugals at the start of the 1969/70 season as a replacement for 19 obsolete batch type C machine used as forecurers.
The appreciable savings in maintenance and operational labour which were anticipated were realized, as well as lower final molasses purities.
This paper deals with the experience gained while operating these machines during the 1969/70 season and it must be stressed that these results are based on the difficult C massecuite conditions in S.A.
Description of the Machine The B.M.A. K850 (Fig. 1) is a continuous machine
comprising a vertically mounted conical basket spinning at 2,200 r.p.m. The angle of the cone is W and the top and bottom diameters are 850 mm and 360 mm respectively. The gravity factor is 2,265 measured at the top of the basket diameter, at full speed.
The drive is by means of a 30 kW electric motor mounted behind the centrifuge and connected to the basket spindle by means of five vee belts. The basket has no flywheel but requires a 10-minute wait to come to rest should the machine be switched off.
Lubrication of the two main bearings is done by a separate oil pump, which in case of failure switches off the main drive and a pilot lamp (see Fig. 1).
The distribution cone is elaborate and consists of an acceleration cup plus feed cone whereby the massecuite is both fed on to the screen and also lubricated with steam and water prior to the massecuite being purged on the screen.
The type of screen used for the curing of low-grade massecuite has slots 0.06 mm wide and 2.2 mm long and was composed of nickel with a hard chrome surface.
Massecuite was fed from a static finned reheater only capable of reheating 0.86 m3h—l per machine from 40°C to 55°C with water of 60°C. The unit was
KBS0
1199(A)
BMA TO 201 - 2 0 - 0 2
FIGURE 1
RfffflWPHPHPiWffl' WH*WJPWWSPfPPmP«
Proceedings of The South African Sugar Technologists' Association — June 1970 109
unsuitable for the quantity of massecuite to be reheated since the heating surface was well below requirements.
Massecuite flow from the reheater could be controlled by an automatic diaphragm valve. The controlling impulse comes from the power taken by the drive which is proportional to the feed rate. Because of fluctuations in the electrical supply to the machines these valves opened and closed ad lib. and were also electrically unreliable. The net result was that manual operation was adopted.
Wash water could be added through sprays at the apex of the basket as well as mid-basket whilst water could also be added inside the distribution cone to provide lubrication of the feeding massecuite (see Fig. 2).
Steam injection is provided inside the distribution cone to warm the massecuite (see Fig. 2).
Inspection of the sugar is possible on the top of the monitor casing and of the molasses by means of an inspection plate on the molasses drain.
Investigational Aspects A programme of work was drawn up and the
following points were studied:— (a) The effects of the temperature and quantity
of water and steam added in relation to the sugar quality and consequently machine throughput.
(b) The effects of the temperature and quantity of water and steam added in relation to the molasses purity.
(c) The effects of crystal size on the sugar and molasses purities.
(d) The effects of massecuite purity and its viscosity effects on machine throughput and molasses purity.
(e) The effects of massecuite temperature and its viscosity effects on machine throughput.
(f) The reliability of the machines with respect to screen life, electrical problems and component life, etc.
Thermometer thermometer thermometry termtmetro
Durchflu/bnengenme sser flow meter dibit metre medidor de paso misuratore di quantta
FIGURE 2
110 Proceedings of The South African Sugar Technologists'' Association — June 1970
Results and Discussion In compiling the results the average conditions
from a series of experiments have been quoted and the various points dealt with in the order mentioned under investigational aspects.
(a) Tests to see the effects of the quantity of water on sugar quality and molasses purity.
1. From visual tests it was clearly seen that water added to the feed cone was essential to serve as a lubrication medium to the molasses film adhering to the sugar crystal and the sugar would not cure without it. The water which could be added by nozzles to wash the purging sugar on the screen was shown to wash the sugar through the screen if used in any quantity, or raised the final molasses purity, and consequently was never used.
2. An interesting feature of the tests was that the ratio of lubrication water to massecuite increased in a non-linear fashion as the throughput of massecuite was increased from 0.71 m3 to the maximum which was of the order of 1.23 m3h—\ This is shown in Table I and Graph 1.
TABLE I The effects of massecuite throughput on the amount of water
needed to effect a sugar purity of + t~---
m3 of Mass. per hour
0.72 0.87 0.99 1.15 1.23
Amt. of water Ratio of water in litre/hour
26.0 37.0 60.0 81.0 94.5
Mass. *
1.0 1.2 1.7 2.0 2.2
Purity of C sugar
86.7 85.8 84.7 84.8 84.3
* The ratio of water/mass, is calculated in this column using 0.72 cubic metres as a base.
The high ratio of water needed at the upper range of throughput resulted in a dilute molasses which was below the target refractometer brix of 86.0 set to prevent the operators adding too much water and thus washing excess sucrose into the final molasses.
1 '" re IIO s< *
D M
0-7O * - ' ' • •— • ' l-O IZ /••* / • « / • » 2-0 3-2
RATIO litres/ hour m3/hour
GRAPH 1: Showing effects of massecuite throughput on the amount of water needed to produce a sugar of 85.0 purity.
3. The effects of the quantity of water on sugar purity and molasses purity were found to be such that:—
(a) A point can be reached where the sugar purity will not increase much above a certain level however much water is added.
(b) The excess water merely serves to dilute the molasses brix to below an acceptable level and increased the difference between nutsch and final molasses purity.
(c) The increase in difference between final molasses and its nutsch purity became most marked with rising use of wash water when the sugar purity exceeded a level of 85.0.
TABLE ri The effects at 0.92 mah-1 (constant throughput) of increasing the
rate of water addition on sugar purity molasses brix and purity rise.
Rate of water Rise in Nutsch addition in 1/h Sugar Purity Molasses Brix difference
40.0 83.7 87.5 1.4 80.0 85.8 84.3 1.7
120.0 86.3 80.6 2.3 160.0 86.8 76.8 3.1
(b) Tests to see the effects of water temperature on sugar quality and molasses purity.
A series of experiments were conducted to see the effects of water temperature on sugar purity and the tests clearly showed that water at 80° C was better than at 60° C or 40° C in that less water at the higher temperature was needed to produce a superior quality C sugar.
TABLE III The effects of wash water temperature on the throughput and purity
of C sugar
m* of Mass Average Temp, of Purity Amount per Purity the wash of the of wash Molasses
hour of C Mass water °C C sugar water 1 /h Purity
0.99 58.5 80 84.7 46 38.6 0.97 58.6 60 84.1 55 37.9 0.99 58.8 40 82.7 66 38.3
(c) Tests to see the effects of steam on sugar quality.
Steam, at Tongaat, was found to be necessary to improve the quality of sugar produced at throughputs above 0.72 m3h—l. Attempts were made to see what steam pressure was most beneficial. Whereas J. Chen and workers in Peru showed an improvement in sugar quality between 1 and 2 atmosphere steam, at Tongaat no difference could be detected and the lower pressure steam was used. The quantity of steam added was increased by using a 6 mm copper pipe instead of a 3 mm copper pipe and the generally hotter atmosphere gave visually improved sugar quality. It was further seen that the lower the purity of the massecuite the more beneficial was the steam in producing higher purity C sugar by most probably providing better viscosity reduction. This latter observation has not yet been confirmed by quantitative measurements. With increas-
Proceedings of The South African Sugar Technologists' Association —
ing steam pressure a higher molasses purity can be expected. (d) Tests to see the effect of increased massecuite
temperature on machine capacity and the quality of sugar produced.
Results are seen in Table IV where the effects of purging massecuite at 50° C and 60° C are shown. It is seen that the machines are able to use less water/m3 of feed at the same throughput and also can purge more massecuite at 60° C than 50° C. The rise in nutsch purity was, however, the same in both instances. This seems strange in the light of expected rise in molasses purity due to resolution, but could have been disguised by the need for less wash water.
TABLE IV Illustrating the effects of massecuite temperature on maximum
throughput and water /feed ratio.
Massecuite
Temp. "C
60 50 60 50 60 50
Massecuite
Purity
59.5 59.7 58.7 58.3 58.0 59.1
Sugar Purity
86.3 85.2 85.7 85.9 85.8 84.3
Throughput in
m3
0.98 0.99 1.05 0.99 1.06 0.96
Molasses Amount Nutsch of water
Difference litre/hour
1.5 50.0 1.4 56.0 1.5 50.0 1.7 60.0 1.6 55.0 1.6 63.0
(e) Tests to see the effect of massecuite purity on machine throughput and the quality of molasses produced.
Massecuite purity was set at different levels during the season and it was seen that the general tendency was for the lower purity massecuite to take longer to purge, though at the start and finish of the season 56.0 purity (5:1 refractometer brix) massecuite was boiled and handled very well.
It is a known fact that the lower the third massecuite purity (at least to 55.0 (5:1 refractometer) the greater will be the probability of low molasses purity.
This was illustrated at T.S.C. where the purity of third massecuite was raised from 57.7 average for the period (8th June, 1969, to 14th June, 1969) to 58.8 for the period (15th June, 1969, to 21st June, 1969) and the molasses purity rose from 37.5 to 38.1. The following table shows the average molasses purity and its equivalent massecuite purity for the period of 42 weeks during the 1969/70 season.
Group
36.6—37.5 37 38 39
6—38.5 6—39.0 1—39.5
Number in Group
15 12 6 6
Average Nutsch Purity
37.1 37.9 38.9 39.4
Average Mas-secuite Purity
58 58 59
21 66 10
59.75
Similar results were found in tests conducted at Darnall as shown in the extract quoted below:—
"Massecuite Purity: This varied between 54.0 and 60.6. An attempt has been made to correlate massecuite purity with the nutsch purity to give an indi-
— June 1970 111
cation of whether a low massecuite purity leads to a potentially lower molasses purity.
In the first case, the nutsch purities were placed in the following groups:—
30.0—30.9 31.0—31.9 32.0—32.9 33.0—34.9
Each group was averaged with the corresponding massecuite purities and the following results were obtained:—
Group
30.0—30.9 31.0—31.9 32.0—32.9 33.0—34.9
Number in Group
9 19 12 9
Average Nutsch Purity
30.65 31.62 32.31 33.63
In the second case, the massecuite placed into groups, i.e.:—
Group
54.0—55.9 56.0—57.0 57.1—58.0 58.1—59.0 59.1—60.0
Number in Group
7 12 11 11 8
Average Nutsch Purity
31.66 31.98 31.82 32.55 32.60
Average Massecuite Purity
56.65 57.05 57.60 59.17
purities were
Average Massecuite Purity
55.34 56.65 57.61 58.72 59.40
From these results, one can say that the lower the massecuite purity, the lower will be the nutsch purity. That is, the lower the massecuite purity the greater is the potential of the massecuite to yield a lower purity of final molasses."
(f) Tests to see the effect of grain size on sugar and molasses purity from the continuous machines.
During the course of the season tests were conducted on the C massecuite grain size in order to assess its effect on sugar ipurity and molasses purity.
At the beginning of the season the grain size was of the order of 0.29 mm in length and massecuites were full of false grain. This slowed purging and produced sugar with a low pol and molasses of higher than necessary purity. The effects of false grain are very pronounced on continuous machine molasses purity, more so than in a batch machine where the crystal bed filters out the false gra in-giving, admittedly, a poor quality sugar.
Attempts were made to boil a larger grain but these merely served to reduce third-stage exhaustion since insufficient crystal was present so that a great amount of false grain still occurred.
Consequently, boiling techniques were changed to give a massecuite with many nuclei so that the false grain was greatly reduced and the grain size, because of uniformity, still kept to 0.29 mm average. This grain gave improved curing and better quality sugar.
An interesting point which emerged was that the sugar produced by the continuous machines contained a lot of fine grain which, when made into a magma with B molasses, raised the purity of the
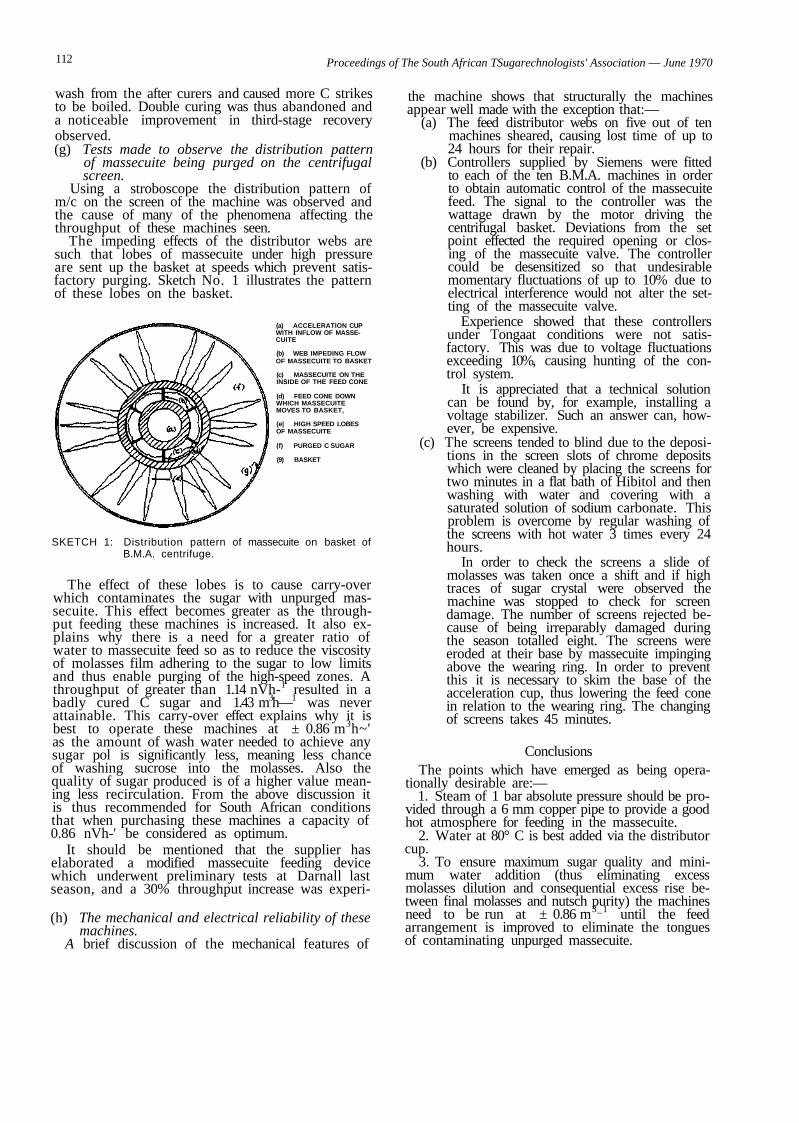
112 Proceedings of The South African TSugarechnologists' Association — June 1970
wash from the after curers and caused more C strikes to be boiled. Double curing was thus abandoned and a noticeable improvement in third-stage recovery observed. (g) Tests made to observe the distribution pattern
of massecuite being purged on the centrifugal screen.
Using a stroboscope the distribution pattern of m/c on the screen of the machine was observed and the cause of many of the phenomena affecting the throughput of these machines seen.
The impeding effects of the distributor webs are such that lobes of massecuite under high pressure are sent up the basket at speeds which prevent satisfactory purging. Sketch No. 1 illustrates the pattern of these lobes on the basket.
(a) ACCELERATION CUP WITH INFLOW OF MASSECUITE
(b) WEB IMPEDING FLOW OF MASSECUITE TO BASKET
(c) MASSECUITE ON THE INSIDE OF THE FEED CONE
(d) FEED CONE DOWN WHICH MASSECUITE MOVES TO BASKET,
(e| HIGH SPEED LOBES OF MASSECUITE
(f) PURGED C SUGAR
(9) BASKET
SKETCH 1: Distribution pattern of massecuite on basket of B.M.A. centrifuge.
The effect of these lobes is to cause carry-over which contaminates the sugar with unpurged massecuite. This effect becomes greater as the throughput feeding these machines is increased. It also explains why there is a need for a greater ratio of water to massecuite feed so as to reduce the viscosity of molasses film adhering to the sugar to low limits and thus enable purging of the high-speed zones. A throughput of greater than 1.14 nVh-1 resulted in a badly cured C sugar and 1.43 m3h—1 was never attainable. This carry-over effect explains why it is best to operate these machines at ± 0.86 m3h~' as the amount of wash water needed to achieve any sugar pol is significantly less, meaning less chance of washing sucrose into the molasses. Also the quality of sugar produced is of a higher value meaning less recirculation. From the above discussion it is thus recommended for South African conditions that when purchasing these machines a capacity of 0.86 nVh-' be considered as optimum.
It should be mentioned that the supplier has elaborated a modified massecuite feeding device which underwent preliminary tests at Darnall last season, and a 30% throughput increase was experi-
(h) The mechanical and electrical reliability of these machines.
A brief discussion of the mechanical features of
the machine shows that structurally the machines appear well made with the exception that:—
(a) The feed distributor webs on five out of ten machines sheared, causing lost time of up to 24 hours for their repair.
(b) Controllers supplied by Siemens were fitted to each of the ten B.M.A. machines in order to obtain automatic control of the massecuite feed. The signal to the controller was the wattage drawn by the motor driving the centrifugal basket. Deviations from the set point effected the required opening or closing of the massecuite valve. The controller could be desensitized so that undesirable momentary fluctuations of up to 10% due to electrical interference would not alter the setting of the massecuite valve.
Experience showed that these controllers under Tongaat conditions were not satisfactory. This was due to voltage fluctuations exceeding 10%, causing hunting of the control system.
It is appreciated that a technical solution can be found by, for example, installing a voltage stabilizer. Such an answer can, however, be expensive.
(c) The screens tended to blind due to the depositions in the screen slots of chrome deposits which were cleaned by placing the screens for two minutes in a flat bath of Hibitol and then washing with water and covering with a saturated solution of sodium carbonate. This problem is overcome by regular washing of the screens with hot water 3 times every 24 hours.
In order to check the screens a slide of molasses was taken once a shift and if high traces of sugar crystal were observed the machine was stopped to check for screen damage. The number of screens rejected because of being irreparably damaged during the season totalled eight. The screens were eroded at their base by massecuite impinging above the wearing ring. In order to prevent this it is necessary to skim the base of the acceleration cup, thus lowering the feed cone in relation to the wearing ring. The changing of screens takes 45 minutes.
Conclusions The points which have emerged as being opera
tionally desirable are:— 1. Steam of 1 bar absolute pressure should be pro
vided through a 6 mm copper pipe to provide a good hot atmosphere for feeding in the massecuite.
2. Water at 80° C is best added via the distributor cup.
3. To ensure maximum sugar quality and minimum water addition (thus eliminating excess molasses dilution and consequential excess rise between final molasses and nutsch purity) the machines need to be run at ± 0.86 m3_1 until the feed arrangement is improved to eliminate the tongues of contaminating unpurged massecuite.
Proceedings of The South African Sugar Technologists' Association —
4. An operator is essential and needs to be supplied with information every hour on special notice boards. This information gives sugar quality (not below 85.0 purity) and molasses brix (of not less than 86.0 brix) thus ensuring minimum water usage and rise in molasses purity. The great advantage of continuous machines is that they afford the process manager the ability to control recycling since the C sugar quality can be varied within limits. The machines need constant operator attention to obtain the best results at all times.
5. If the massecuite could be fed hot (at 60° C), using very rapid reheaters to ensure minimum resolution, then increased throughput and lower water usage can be expected.
These machines earned revenue by achieving savings as follows:—
1. Only one operator per eight-hour shift is required to work 10 continuous machines with savings in labour previously needed to operate 19 old batch-type machines, amounting to R21,000 per annum.
2. Savings in maintenance over the comparable number of batch-type machine are estimated at R3.000 p.a.
3. The earnings in revenue to Tongaat of these machines in one year has meant a gain in BHR of 0.8% which means additional revenue of some R80,000. This figure is high because of previous serious deficiencies in equipment. The earnings ability for a factory well equipped with fully automatic batch machines would be less.
The following table shows the massecuite purity and molasses purity which was obtained by the T.S.C. from 1962 to 1969 and shows dramatically the ability of the continuous machines in 1969 to cure a low purity third massecuite and its subsequent production of low-purity molasses.
Massecuite Massecuite Final Mol. Type of Brix
*97.2 97.2 97.0 97.4 97.8 97.1 97.3 96.6
Purity
*57.3 59.3 58.6 59.6 59.5 59.8 59.9 60.3
Gravity Pur.
37.8 40.5 39.8 41.2 41.1 40.5 40.0 40.9
Year
1969 1968 1967 1966 1965 1964 1963 1962
C Centrifug
Continuous Batch
„ „ „ ,,
»!
* These two figures calculated from refractometer data using measured differences between refractometer and spindle brix. The difference in molasses purity between the 1969 year and the lowest year from 1962 to 1968 is 2.0%, which represents some 1.0% in BHR.
Acknowledgements The author wishes to thank all those members of
staff who assisted during the course of this investigational work and to also thank the Tongaat Sugar Company for permission to publish this paper.
Discussion Mr. van Hengel (in the chair): I concur with the
five points mentioned in the conclusion of your paper, except where it is stated that we must aim for the
— June 1970 113
highest possible sugar purity. Darnall has decided, unlike Tongaat, to maintain
double curing even with continuous machines. If we settle for a purity of C — sugar of 80, then
it is possible from a normal massecuite purity to have a circulation of 130. This is not pure enough to go to the remelter — it must be double cured.
As plenty of water is necessary and some capacity is lost by trying to get higher purity sugar, I think that it is better to settle for a slightly lower sugar purity and to double cure it.
Mr. Carter: Our view is this. Why buy fifteen machines and use ten to produce sugar of 80 purity when you can use fifteen to produce sugar of 85 purity with a lower recirculation load?
When you purge to a high purity you will have more molasses to dispose of.
Mr. Chiazzari: If you double cure, the molasses is being circulated to the C-massecuite.
If you single cure, are you not returning the recirculation back to the raw sugar?
Mr. Carter: Yes, but we prefer to use as many machines as possible in order to get the minimum recirculation. We want to use all our machines to get the highest possible quality sugar.
Mr. van Hengel: The industry has spent a lot of money on the remelt system, which is designed basically to crystallise our first product out of the most pure surroundings — to get the best sugar. This object is defeated if we do not double cure, particularly as this system has presented no difficulties.
Mr. Archibald: Has Tongaat experienced building up of sugar in the machines? It has been so bad at Empangeni that the machines have tripped. We now stop and wash down one machine daily.
We have also had trouble with the massecuite impinging onto the screen.
I agree with Mr. Carter that constant operator attention is necessary to ensure smooth running of the machines.
Mr. Hulett: I wish to refer to the correlation between low massecuite purity and low molasses purity.
Before monthly averages are taken for massecuite and molasses purities, it can be seen that a very low purity molasses has been obtained from a high purity massecuite.
I feel we should put on a machine to drive a pan so that the same condition could be produced all the time and we might then be able to take a step forward in boiling C-massecuites.
Mr. Carter: On the basis of probability, when you boil a lower purity massecuite you will obtain a lower purity molasses.
It would be interesting to have mobility meters to indicate viscosities in our pans when boiling because of the different purities during the season.
Mr. Moor: Regarding the automatic controls for the massecuite feed. We were under the impression that they were operated from the amperage of the motor driving the centrifugal. But it is not purely an amperage control as it does take account of voltage fluctuations, but it becomes inaccurate under the conditions of voltage fluctuations such as sugar mills tend to have. However, the manufacturers are taking steps to correct this.
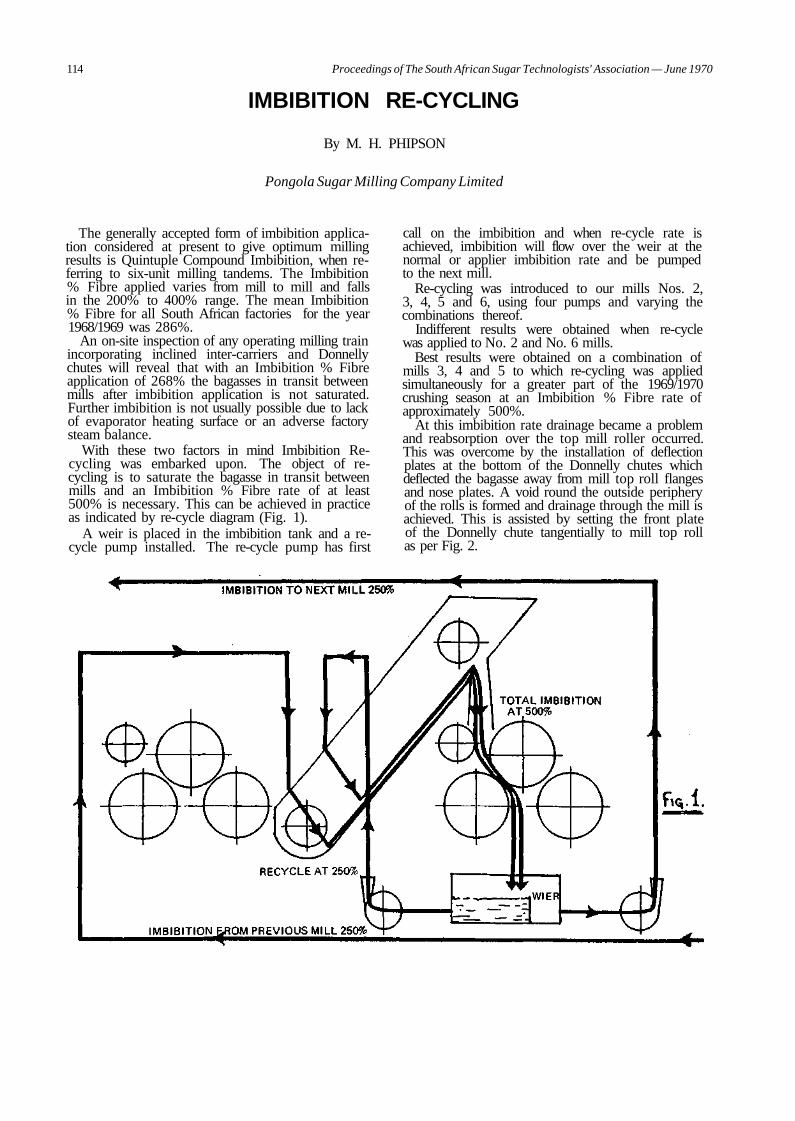
114 Proceedings of The South African Sugar Technologists' Association — June 1970
IMBIBITION RE-CYCLING
By M. H. PHIPSON
Pongola Sugar Milling Company Limited
The generally accepted form of imbibition application considered at present to give optimum milling results is Quintuple Compound Imbibition, when referring to six-unit milling tandems. The Imbibition % Fibre applied varies from mill to mill and falls in the 200% to 400% range. The mean Imbibition % Fibre for all South African factories for the year 1968/1969 was 286%.
An on-site inspection of any operating milling train incorporating inclined inter-carriers and Donnelly chutes will reveal that with an Imbibition % Fibre application of 268% the bagasses in transit between mills after imbibition application is not saturated. Further imbibition is not usually possible due to lack of evaporator heating surface or an adverse factory steam balance.
With these two factors in mind Imbibition Recycling was embarked upon. The object of recycling is to saturate the bagasse in transit between mills and an Imbibition % Fibre rate of at least 500% is necessary. This can be achieved in practice as indicated by re-cycle diagram (Fig. 1).
A weir is placed in the imbibition tank and a recycle pump installed. The re-cycle pump has first
call on the imbibition and when re-cycle rate is achieved, imbibition will flow over the weir at the normal or applier imbibition rate and be pumped to the next mill.
Re-cycling was introduced to our mills Nos. 2, 3, 4, 5 and 6, using four pumps and varying the combinations thereof.
Indifferent results were obtained when re-cycle was applied to No. 2 and No. 6 mills.
Best results were obtained on a combination of mills 3, 4 and 5 to which re-cycling was applied simultaneously for a greater part of the 1969/1970 crushing season at an Imbibition % Fibre rate of approximately 500%.
At this imbibition rate drainage became a problem and reabsorption over the top mill roller occurred. This was overcome by the installation of deflection plates at the bottom of the Donnelly chutes which deflected the bagasse away from mill top roll flanges and nose plates. A void round the outside periphery of the rolls is formed and drainage through the mill is achieved. This is assisted by setting the front plate of the Donnelly chute tangentially to mill top roll as per Fig. 2.
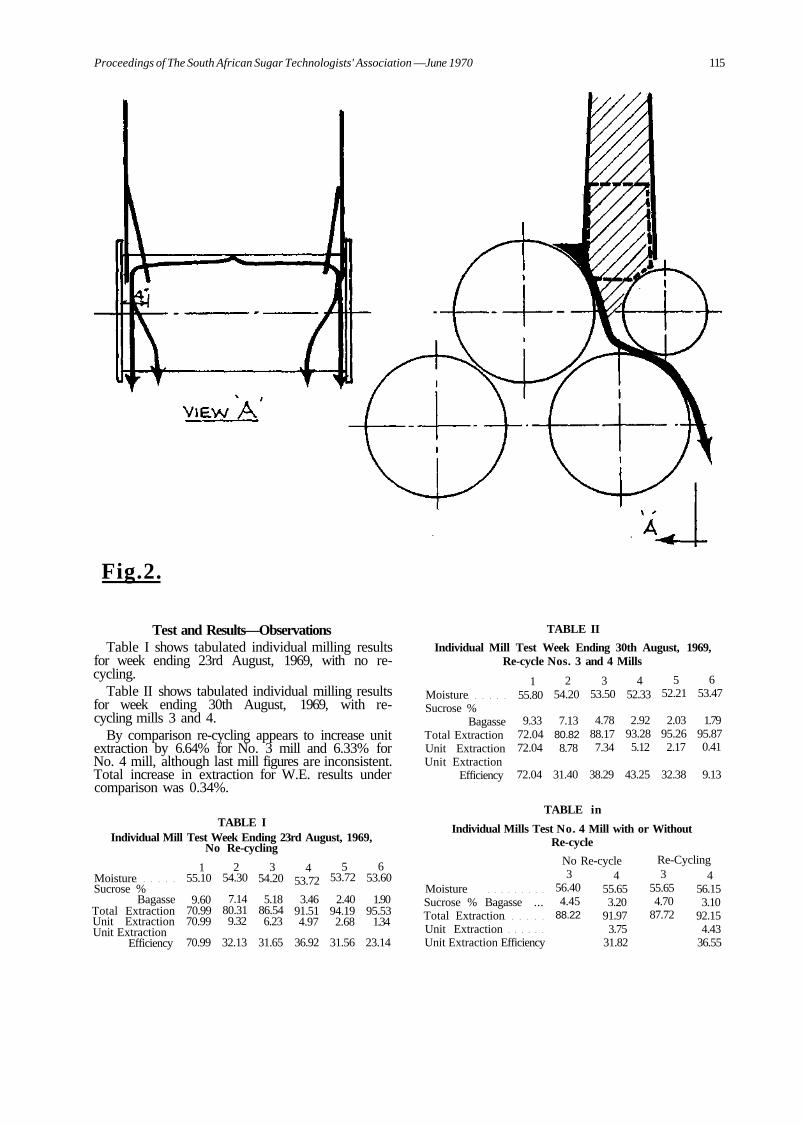
Proceedings of The South African Sugar Technologists' Association —June 1970 115
Fig.2.
Test and Results—Observations Table I shows tabulated individual milling results
for week ending 23rd August, 1969, with no recycling.
Table II shows tabulated individual milling results for week ending 30th August, 1969, with recycling mills 3 and 4.
By comparison re-cycling appears to increase unit extraction by 6.64% for No. 3 mill and 6.33% for No. 4 mill, although last mill figures are inconsistent. Total increase in extraction for W.E. results under comparison was 0.34%.
TABLE I Individual Mill Test Week Ending 23rd August, 1969,
No Re-cycling
Moisture Sucrose %
Bagasse Total Extraction Unit Extraction Unit Extraction
Efficiency
1 55.10
9.60 70.99 70.99
2 54.30
7.14 80.31 9.32
3 54.20
5.18 86.54 6.23
4 53.72
5 53.72
6 53.60
3.46 91.51 4.97
2.40 94.19 2.68
1.90 95.53
1.34
TABLE II
Individual Mill Test Week Ending 30th August, Re-cycle Nos. 3 and 4 Mills
Moisture Sucrose %
Bagasse Total Extraction Unit Extraction Unit Extraction
Efficiency
1 55.80
9.33 72.04 72.04
2 54.20
7.13 80.82 8.78
3 53.50
4.78 88.17 7.34
4 52.33
2.92 93.28 5.12
5 52.21
2.03 95.26 2.17
1969,
6 53.47
1.79 95.87 0.41
72.04 31.40 38.29 43.25 32.38 9.13
TABLE in
Individual Mills Test No. 4 Mill with or Without Re-cycle
70.99 32.13 31.65 36.92 31.56 23.14
Moisture Sucrose % Bagasse ... Total Extraction Unit Extraction Unit Extraction Efficiency
No Re-cycle 3
56.40 4.45
88.22
4 55.65 3.20
91.97 3.75
31.82
Re-Cycling 3
55.65 4.70
87.72
4 56.15 3.10
92.15 4.43
36.55
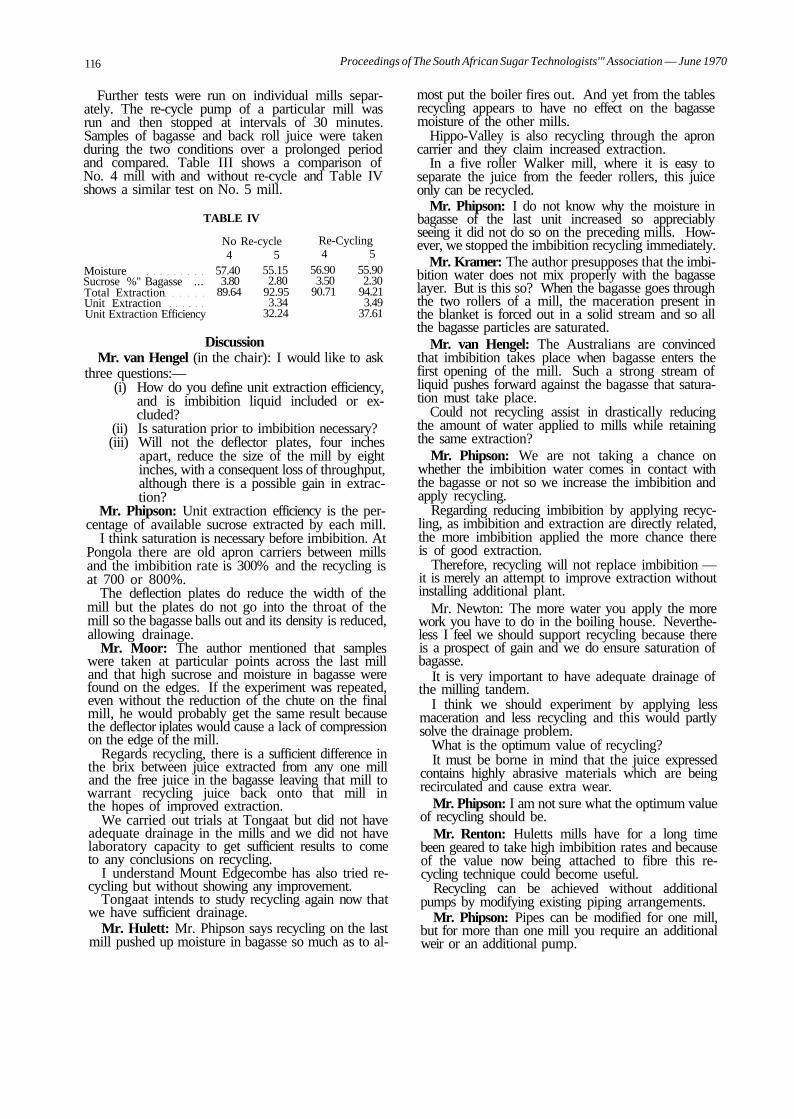
116 Proceedings of The South African Sugar Technologists'" Association — June 1970
Further tests were run on individual mills separately. The re-cycle pump of a particular mill was run and then stopped at intervals of 30 minutes. Samples of bagasse and back roll juice were taken during the two conditions over a prolonged period and compared. Table III shows a comparison of No. 4 mill with and without re-cycle and Table IV shows a similar test on No. 5 mill.
TABLE IV
No Re-cycle 4 5
Re-Cycling 4 5
Moisture Sucrose %" Bagasse ... Total Extraction Unit Extraction Unit Extraction Efficiency
57.40 3.80
89.64
55.15 2.80
92.95 3.34
32.24
56.90 3.50
90.71
55.90 2.30
94.21 3.49
37.61
Discussion Mr. van Hengel (in the chair): I would like to ask
three questions:— (i) How do you define unit extraction efficiency,
and is imbibition liquid included or excluded?
(ii) Is saturation prior to imbibition necessary? (iii) Will not the deflector plates, four inches
apart, reduce the size of the mill by eight inches, with a consequent loss of throughput, although there is a possible gain in extraction?
Mr. Phipson: Unit extraction efficiency is the percentage of available sucrose extracted by each mill.
I think saturation is necessary before imbibition. At Pongola there are old apron carriers between mills and the imbibition rate is 300% and the recycling is at 700 or 800%.
The deflection plates do reduce the width of the mill but the plates do not go into the throat of the mill so the bagasse balls out and its density is reduced, allowing drainage.
Mr. Moor: The author mentioned that samples were taken at particular points across the last mill and that high sucrose and moisture in bagasse were found on the edges. If the experiment was repeated, even without the reduction of the chute on the final mill, he would probably get the same result because the deflector iplates would cause a lack of compression on the edge of the mill.
Regards recycling, there is a sufficient difference in the brix between juice extracted from any one mill and the free juice in the bagasse leaving that mill to warrant recycling juice back onto that mill in the hopes of improved extraction.
We carried out trials at Tongaat but did not have adequate drainage in the mills and we did not have laboratory capacity to get sufficient results to come to any conclusions on recycling.
I understand Mount Edgecombe has also tried recycling but without showing any improvement.
Tongaat intends to study recycling again now that we have sufficient drainage.
Mr. Hulett: Mr. Phipson says recycling on the last mill pushed up moisture in bagasse so much as to al
most put the boiler fires out. And yet from the tables recycling appears to have no effect on the bagasse moisture of the other mills.
Hippo-Valley is also recycling through the apron carrier and they claim increased extraction.
In a five roller Walker mill, where it is easy to separate the juice from the feeder rollers, this juice only can be recycled.
Mr. Phipson: I do not know why the moisture in bagasse of the last unit increased so appreciably seeing it did not do so on the preceding mills. However, we stopped the imbibition recycling immediately.
Mr. Kramer: The author presupposes that the imbibition water does not mix properly with the bagasse layer. But is this so? When the bagasse goes through the two rollers of a mill, the maceration present in the blanket is forced out in a solid stream and so all the bagasse particles are saturated.
Mr. van Hengel: The Australians are convinced that imbibition takes place when bagasse enters the first opening of the mill. Such a strong stream of liquid pushes forward against the bagasse that saturation must take place.
Could not recycling assist in drastically reducing the amount of water applied to mills while retaining the same extraction?
Mr. Phipson: We are not taking a chance on whether the imbibition water comes in contact with the bagasse or not so we increase the imbibition and apply recycling.
Regarding reducing imbibition by applying recycling, as imbibition and extraction are directly related, the more imbibition applied the more chance there is of good extraction.
Therefore, recycling will not replace imbibition — it is merely an attempt to improve extraction without installing additional plant.
Mr. Newton: The more water you apply the more work you have to do in the boiling house. Nevertheless I feel we should support recycling because there is a prospect of gain and we do ensure saturation of bagasse.
It is very important to have adequate drainage of the milling tandem.
I think we should experiment by applying less maceration and less recycling and this would partly solve the drainage problem.
What is the optimum value of recycling? It must be borne in mind that the juice expressed
contains highly abrasive materials which are being recirculated and cause extra wear.
Mr. Phipson: I am not sure what the optimum value of recycling should be.
Mr. Renton: Huletts mills have for a long time been geared to take high imbibition rates and because of the value now being attached to fibre this recycling technique could become useful.
Recycling can be achieved without additional pumps by modifying existing piping arrangements.
Mr. Phipson: Pipes can be modified for one mill, but for more than one mill you require an additional weir or an additional pump.
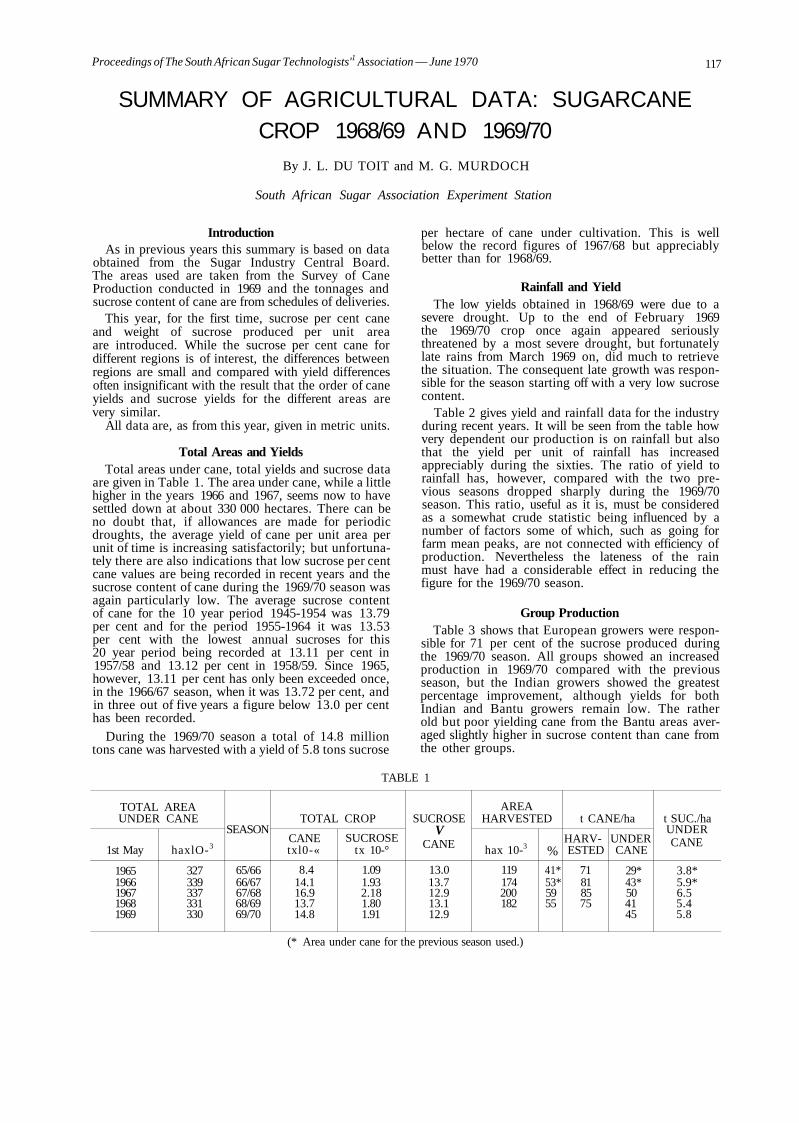
Proceedings of The South African Sugar Technologists'1 Association — June 1970 117
SUMMARY OF AGRICULTURAL DATA: SUGARCANE CROP 1968/69 AND 1969/70
By J. L. DU TOIT and M. G. MURDOCH
South African Sugar Association Experiment Station
Introduction As in previous years this summary is based on data
obtained from the Sugar Industry Central Board. The areas used are taken from the Survey of Cane Production conducted in 1969 and the tonnages and sucrose content of cane are from schedules of deliveries.
This year, for the first time, sucrose per cent cane and weight of sucrose produced per unit area are introduced. While the sucrose per cent cane for different regions is of interest, the differences between regions are small and compared with yield differences often insignificant with the result that the order of cane yields and sucrose yields for the different areas are very similar.
All data are, as from this year, given in metric units.
Total Areas and Yields Total areas under cane, total yields and sucrose data
are given in Table 1. The area under cane, while a little higher in the years 1966 and 1967, seems now to have settled down at about 330 000 hectares. There can be no doubt that, if allowances are made for periodic droughts, the average yield of cane per unit area per unit of time is increasing satisfactorily; but unfortunately there are also indications that low sucrose per cent cane values are being recorded in recent years and the sucrose content of cane during the 1969/70 season was again particularly low. The average sucrose content of cane for the 10 year period 1945-1954 was 13.79 per cent and for the period 1955-1964 it was 13.53 per cent with the lowest annual sucroses for this 20 year period being recorded at 13.11 per cent in 1957/58 and 13.12 per cent in 1958/59. Since 1965, however, 13.11 per cent has only been exceeded once, in the 1966/67 season, when it was 13.72 per cent, and in three out of five years a figure below 13.0 per cent has been recorded.
During the 1969/70 season a total of 14.8 million tons cane was harvested with a yield of 5.8 tons sucrose
per hectare of cane under cultivation. This is well below the record figures of 1967/68 but appreciably better than for 1968/69.
Rainfall and Yield The low yields obtained in 1968/69 were due to a
severe drought. Up to the end of February 1969 the 1969/70 crop once again appeared seriously threatened by a most severe drought, but fortunately late rains from March 1969 on, did much to retrieve the situation. The consequent late growth was responsible for the season starting off with a very low sucrose content.
Table 2 gives yield and rainfall data for the industry during recent years. It will be seen from the table how very dependent our production is on rainfall but also that the yield per unit of rainfall has increased appreciably during the sixties. The ratio of yield to rainfall has, however, compared with the two previous seasons dropped sharply during the 1969/70 season. This ratio, useful as it is, must be considered as a somewhat crude statistic being influenced by a number of factors some of which, such as going for farm mean peaks, are not connected with efficiency of production. Nevertheless the lateness of the rain must have had a considerable effect in reducing the figure for the 1969/70 season.
Group Production Table 3 shows that European growers were respon
sible for 71 per cent of the sucrose produced during the 1969/70 season. All groups showed an increased production in 1969/70 compared with the previous season, but the Indian growers showed the greatest percentage improvement, although yields for both Indian and Bantu growers remain low. The rather old but poor yielding cane from the Bantu areas averaged slightly higher in sucrose content than cane from the other groups.
TABLE 1
TOTAL AREA UNDER CANE
1st May
1965 1966 1967 1968 1969
haxlO-3
327 339 337 331 330
SEASON
65/66 66/67 67/68 68/69 69/70
TOTAL CROP
CANE txl0-«
8.4 14.1 16.9 13.7 14.8
SUCROSE tx 10-°
1.09 1.93 2.18 1.80 1.91
SUCROSE V
CANE
13.0 13.7 12.9 13.1 12.9
AREA HARVESTED
hax 10-3
119 174 200 182
%
41* 53* 59 55
t CANE/ha
HARVESTED
71 81 85 75
UNDER CANE
29* 43* 50 41 45
t SUC./ha UNDER CANE
3.8* 5.9* 6.5 5.4 5.8
(* Area under cane for the previous season used.)
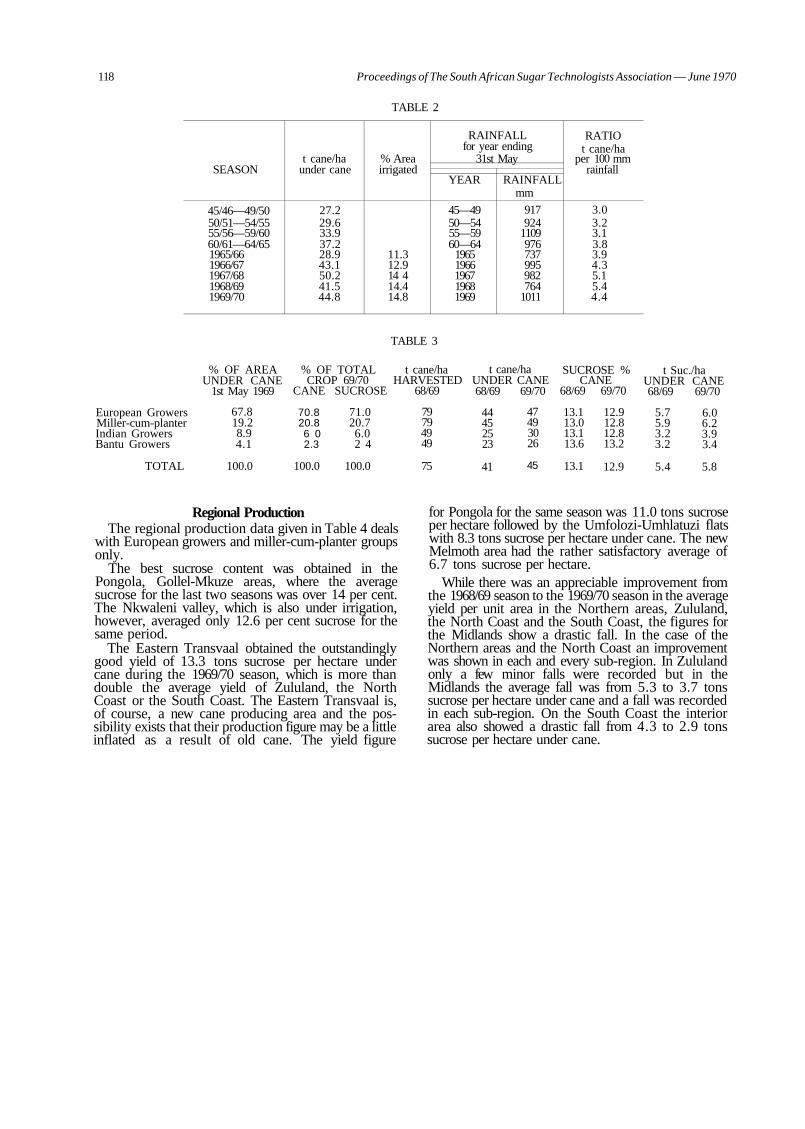
118 Proceedings of The South African Sugar Technologists Association — June 1970
SEASON
45/46—49/50 50/51—54/55 55/56—59/60 60/61—64/65 1965/66 1966/67 1967/68 1968/69 1969/70
t cane/ha under cane
27.2 29.6 33.9 37.2 28.9 43.1 50.2 41.5 44.8
TABLE 2
% Area irrigated
11.3 12.9 14 4 14.4 14.8
RAINFALL for year ending
31st May
YEAR
45—49 50—54 55—59 60—64
1965 1966 1967 1968 1969
RAINFALL mm
917 924
1109 976 737 995 982 764
1011
RATIO t cane/ha
per 100 mm rainfall
3.0 3.2 3.1 3.8 3.9 4.3 5.1 5.4 4.4
% OF AREA UNDER CANE
1st May 1969
TABLE 3
% OF TOTAL CROP 69/70
CANE SUCROSE
t cane/ha HARVESTED
68/69
t cane/ha UNDER CANE 68/69 69/70
SUCROSE % CANE
68/69 69/70
t Suc./ha UNDER CANE 68/69 69/70
European Growers Miller-cum-planter Indian Growers Bantu Growers
67.8 19.2 8.9 4.1
70.8 20.8 6 0 2.3
71.0 20.7 6.0 2 4
79 79 49 49
44 45 25 23
47 49 30 26
13.1 13.0 13.1 13.6
12.9 12.8 12.8 13.2
5.7 5.9 3.2 3.2
6.0 6.2 3.9 3.4
TOTAL 100.0 100.0 100.0 75 41 45 13.1 12.9 5.4 5.8
Regional Production The regional production data given in Table 4 deals
with European growers and miller-cum-planter groups only.
The best sucrose content was obtained in the Pongola, Gollel-Mkuze areas, where the average sucrose for the last two seasons was over 14 per cent. The Nkwaleni valley, which is also under irrigation, however, averaged only 12.6 per cent sucrose for the same period.
The Eastern Transvaal obtained the outstandingly good yield of 13.3 tons sucrose per hectare under cane during the 1969/70 season, which is more than double the average yield of Zululand, the North Coast or the South Coast. The Eastern Transvaal is, of course, a new cane producing area and the possibility exists that their production figure may be a little inflated as a result of old cane. The yield figure
for Pongola for the same season was 11.0 tons sucrose per hectare followed by the Umfolozi-Umhlatuzi flats with 8.3 tons sucrose per hectare under cane. The new Melmoth area had the rather satisfactory average of 6.7 tons sucrose per hectare.
While there was an appreciable improvement from the 1968/69 season to the 1969/70 season in the average yield per unit area in the Northern areas, Zululand, the North Coast and the South Coast, the figures for the Midlands show a drastic fall. In the case of the Northern areas and the North Coast an improvement was shown in each and every sub-region. In Zululand only a few minor falls were recorded but in the Midlands the average fall was from 5.3 to 3.7 tons sucrose per hectare under cane and a fall was recorded in each sub-region. On the South Coast the interior area also showed a drastic fall from 4.3 to 2.9 tons sucrose per hectare under cane.
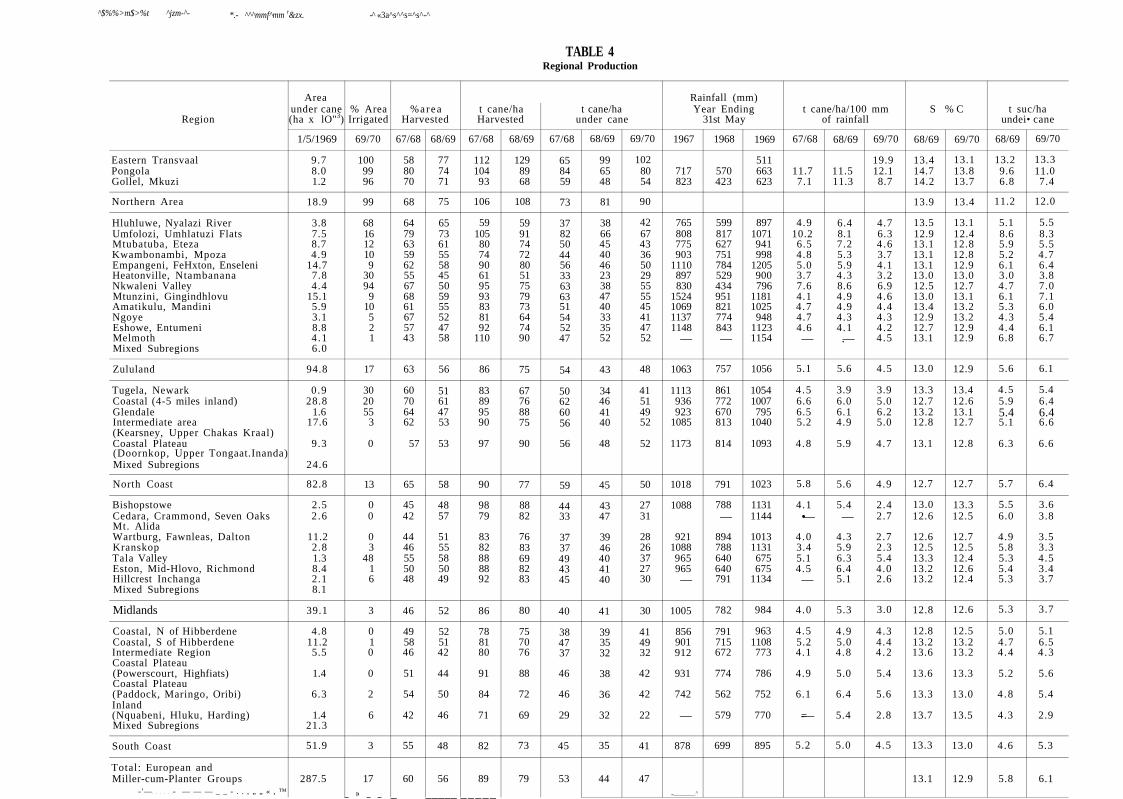
^$%%>m$>%t ^jzm-^- *.- ^^^mmf^mm r&zx. - «3a^s^^s=^s^-^
TABLE 4 Regional Production
Region
Eastern Transvaal Pongola Gollel, Mkuzi
Northern Area
Hluhluwe, Nyalazi River Umfolozi, Umhlatuzi Flats Mtubatuba, Eteza Kwambonambi, Mpoza Empangeni, FeHxton, Enseleni Heatonville, Ntambanana Nkwaleni Valley Mtunzini, Gingindhlovu Amatikulu, Mandini Ngoye Eshowe, Entumeni Melmoth Mixed Subregions
Zululand
Tugela, Newark Coastal (4-5 miles inland) Glendale Intermediate area (Kearsney, Upper Chakas Kraal) Coastal Plateau (Doornkop, Upper Tongaat.Inanda) Mixed Subregions
North Coast
Bishopstowe Cedara, Crammond, Seven Oaks Mt. Alida Wartburg, Fawnleas, Dalton Kranskop Tala Valley Eston, Mid-Hlovo, Richmond Hillcrest Inchanga Mixed Subregions
Midlands
Coastal, N of Hibberdene Coastal, S of Hibberdene Intermediate Region Coastal Plateau (Powerscourt, Highfiats) Coastal Plateau (Paddock, Maringo, Oribi) Inland (Nquabeni, Hluku, Harding) Mixed Subregions
South Coast
Total: European and Miller-cum-Planter Groups
- '— - — — — _ _ - . . , „ „ « , ™
Area under cane (ha x lO"3)
1/5/1969
9.7 8.0 1.2
18.9
3.8 7.5 8.7 4.9
14.7 7.8 4.4
15.1 5.9 3.1 8.8 4 .1 6.0
94.8
0.9 28.8
1.6 17.6
9.3
24.6
82.8
2.5 2 .6
11.2 2.8 1.3 8.4 2.1 8.1
39.1
4.8 11.2 5.5
1.4
6.3
1.4 21.3
51.9
287.5
% Area Irrigated
69/70
100 99 96
99
68 16 12 10 9
30 94
9 10 5 2 1
17
30 20 55
3
0
13
0 0
0 3
48 1 6
3
0 1 0
0
2
6
3
17 _ » _ _
%area Harvested
67/68
58 80 70
68
64 79 63 59 62 55 67 68 61 67 57 43
63
60 70 64 62
57
65
45 42
44 46 55 50 48
46
49 58 46
51
54
42
55
60
_
68/69
77 74 71
75
65 73 61 55 58 45 50 59 55 52 47 58
56
51 61 47 53
53
58
48 57
51 55 58 50 49
52
52 51 42
44
50
46
48
56
_____
t cane/ha Harvested
67/68
112 104 93
106
59 105 80 74 90 61 95 93 83 81 92
110
86
83 89 95 90
97
90
98 79
83 82 88 88 92
86
78 81 80
91
84
71
82
89
_____
68/69
129 89 68
108
59 91 74 72 80 51 75 79 73 64 74 90
75
67 76 88 75
90
77
88 82
76 83 69 82 83
80
75 70 76
88
72
69
73
79
t cane/ha under cane
67/68
65 84 59
73
37 82 50 44 56 33 63 63 51 54 52 47
54
50 62 60 56
56
59
44 33
37 37 49 43 45
40
38 47 37
46
46
29
45
53
68/69
99 65 48
81
38 66 45 40 46 23 38 47 40 33 35 52
43
34 46 41 40
48
45
43 47
39 46 40 41 40
41
39 35 32
38
36
32
35
44
69/70
102 80 54
90
42 67 43 36 50 29 55 55 45 41 47 52
48
41 51 49 52
52
50
27 31
28 26 37 27 30
30
41 49 32
42
42
22
41
47
Rainfall (mm) Year Ending
1967
717 823
765 808 775 903
1110 897 830
1524 1069 1137 1148
—
1063
1113 936 923
1085
1173
1018
1088
921 1088 965 965 —
1005
856 901 912
931
742
—
878
„ ^
31st May
1968
570 423
599 817 627 751 784 529 434 951 821 774 843 —
757
861 772 670 813
814
791
788 —
894 788 640 640 791
782
791 715 672
774
562
579
699
1969
511 663 623
897 1071 941 998
1205 900 796
1181 1025 948
1123 1154
1056
1054 1007 795
1040
1093
1023
1131 1144
1013 1131 675 675
1134
984
963 1108 773
786
752
770
895
t cane/ha/100 mm of rainfall
67/68
11.7 7.1
4.9 10.2 6.5 4.8 5.0 3.7 7.6 4.1 4.7 4.7 4.6 —
5.1
4 .5 6.6 6.5 5.2
4 .8
5.8
4.1 •—
4.0 3.4 5.1 4.5 —
4.0
4.5 5.2 4.1
4.9
6.1
-=—
5.2
68/69
11.5 11.3
6.4 8.1 7.2 5.3 5.9 4 .3 8.6 4.9 4.9 4.3 4.1 .—
5.6
3.9 6.0 6.1 4.9
5.9
5.6
5.4 —
4.3 5.9 6.3 6.4 5.1
5.3
4.9 5.0 4 .8
5.0
6.4
5.4
5.0
69/70
19.9 12.1 8.7
4.7 6.3 4 .6 3.7 4.1 3.2 6.9 4.6 4.4 4.3 4.2 4 .5
4.5
3.9 5.0 6.2 5.0
4.7
4.9
2.4 2.7
2.7 2.3 5.4 4.0 2.6
3.0
4 .3 4.4 4 .2
5.4
5.6
2.8
4 .5
S % C
68/69
13.4 14.7 14.2
13.9
13.5 12.9 13.1 13.1 13.1 13.0 12.5 13.0 13.4 12.9 12.7 13.1
13.0
13.3 12.7 13.2 12.8
13.1
12.7
13.0 12.6
12.6 12.5 13.3 13.2 13.2
12.8
12.8 13.2 13.6
13.6
13.3
13.7
13.3
13.1
69/70
13.1 13.8 13.7
13.4
13.1 12.4 12.8 12.8 12.9 13.0 12.7 13.1 13.2 13.2 12.9 12.9
12.9
13.4 12.6 13.1 12.7
12.8
12.7
13.3 12.5
12.7 12.5 12.4 12.6 12.4
12.6
12.5 13.2 13.2
13.3
13.0
13.5
13.0
12.9
t suc/ha undei
68/69
13.2 9.6 6.8
11.2
5.1 8.6 5.9 5.2 6.1 3.0 4.7 6.1 5.3 4 .3 4 .4 6.8
5.6
4.5 5.9 5.4 5.1
6.3
5.7
5.5 6.0
4.9 5.8 5.3 5.4 5.3
5.3
5.0 4.7 4 .4
5.2
4 .8
4.3
4 .6
5.8
• cane
69/70
13.3 11.0 7.4
12.0
5.5 8.3 5.5 4.7 6.4 3.8 7.0 7.1 6.0 5.4 6.1 6.7
6.1
5.4 6.4 6.4 6.6
6.6
6.4
3.6 3.8
3.5 3.3 4.5 3.4 3.7
3.7
5.1 6.5 4 .3
5.6
5.4
2.9
5.3
6.1

120 Proceedings of The South African Sugar Technologists' Association — June 1970
Discussion Dr. Thompson (in the chair): Mr. du Toit has
pointed out the decline in sucrose throughout the industry over the past twenty years, so that the average is now below 13%.
The average sucrose for Pongola mill in 1956 was 15.6% and it dropped in 1970 to 13.8%. in line with the industry as a whole. Can he perhaps outline the possible reasons for this decline?
Mr. du Toit: There are certain factors depressing sucrose, for instance, extraneous matter and the cutting of young cane.
The only area showing a larger sucrose figure is the Umfolosi area, but that could be accounted for by the decreased water table there.
The longer seasons in recent years would also have had an unfavourable effect on sucrose.
Mr. Renaud: The two farms owned by U.V.S. had extremely high sucrose figures this season.
Mr. du Toit: This is a feature so far this year. Last year there was a drought period followed by good rains in March and April, giving excellent late growth with consequent low sucrose.
This year has been very dry from February until May, when heavy rains fell that saved the industry, and it is not surprising that sucrose is high.
Dr. Thompson: Is there any comment on the fact that in the midlands area the sucrose yield fell from 5.3 tons to 3.7 tons per hectare? Was the area harvested particularly low in 1969/70?
Mr. du Toit: If you consult the table showing percentages of area cut you will see that the figure is not available for last year. But compared to the previous year the area cut has increased and apparently the farmers in these newly-planted areas have gone for farm mean peaks later than the rest of the industry.
Mr. Sherrard: Has not the replacement of NC„ 310 by NC0 334 resulted in a decrease in sucrose? In our area, Umfolosi, we have retained NC„ 310 and the sucrose is still high.
Mr. du Toit: This could certainly have been one factor.
Figures recently extracted for Malelane show that NC0 310 and NC„ 334 are appreciably higher in sucrose than NC0 376.
Dr. Thompson: However, in Pongola, the sucrose figure has also dropped considerably, although NC0 310 is still predominant.
Mr. Moberly: Surely the amount of N being used will have an effect on sucrose?
Mr. du Toit: This would be a contributory factor, but does not fully explain the drop in sucrose.
Mr. Browne: The change in recent years from rail to road transport of cane has undobutedly caused delays in getting cane to the mill and this would have some effect on sucrose.
Dr. Thompson: It is a sad commentary that delays should have increased rather than decreased.
Referring to table 2, which gives tons cane per hectare per 100 mm of rainfall, and bearing in mind the limitations pointed out by the authors, it is fairly certain that we can get nine tons of cane per hectare per 100 mm of rainfall. However, the industry as a whole is getting less than half this figure, but at least one grower, who harvests 1.000 ha per crop, is actually getting the figure of 9.
Mr. du Toit: To make the matter worse, the figure of 4.4 includes the areas under irrigation — about 15% of the industry.
Mr. Browne: The length of the season (age of cane) appears to have some connection with the effeotive use of water.
Would not tons of cane per inch of rainfall per months not be a better figure to use?
Mr. Murdoch: It is not possible to get such a figure on an industry-wide basis.
Dr. Dodds: Possibly the new varieties are more susceptible to drought than the old varieties. Varietal data have not been included in the tables.
Mr. du Toit: Inclusion of varietal data delays the reporting of figures and in any case the figures are very unreliable.
When the industry is fully computerised, this information will be given for the different areas.
Regarding drought conditions, I have heard it said that NC„ 376 does not stand up well to drought.
Dr. Gosnell: In Rhodesia CP 29/116 is extremely drought resistant and is supposed to be immune to R.S.D.
Where we have experienced drought, CP 29/116 has recovered quicker than other varieties.
There seem to be no relationship between recovery from drought and susceptibility to scorching as CP 29/116 does scorch very easily.
Many growers' comments on drought will be related to scorching.
Mr. du Toit: We believe that R.S.D. will be more severe in drought conditions and yet it appears that even under good irrigation conditions R.S.D. can have a severe effect on cane yield.
Dr. Gosnell: A recently established experiment at Chiredzi compares heat-treated cane with non heat-treated cane and cane that it is believed has been infected with R.S.D.
Early indications are that there is no difference up to six months provided there is plenty of irrigation.
Mr. Perk A useful figure would be tons of "made" sugar per hectare.
Mr. Murdoch: This figure is easily obtained for the whole industry but not for individual areas, unless the same tons cane/tons sugar ratio is used for all areas.
Figures could be obtained per mill, but mills are not synonymous with the regions we show.
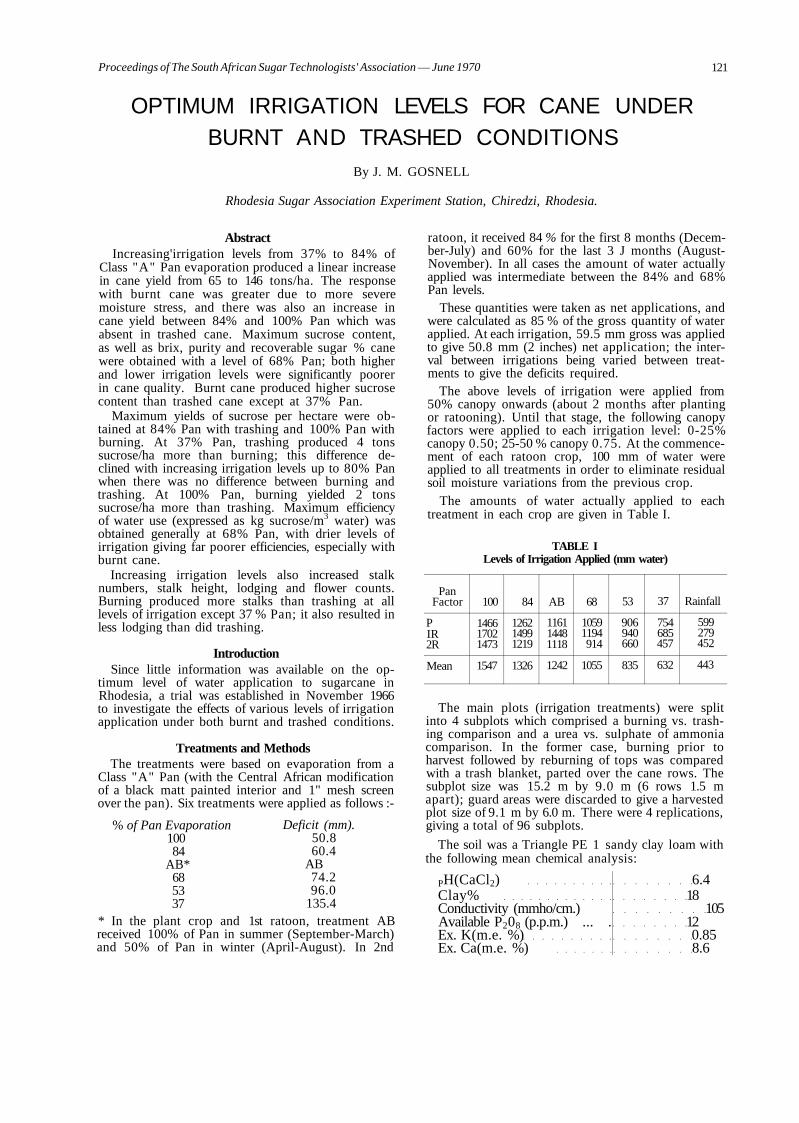
Proceedings of The South African Sugar Technologists' Association — June 1970 121
OPTIMUM IRRIGATION LEVELS FOR CANE UNDER BURNT AND TRASHED CONDITIONS
By J. M. GOSNELL
Rhodesia Sugar Association Experiment Station, Chiredzi, Rhodesia.
Abstract Increasing'irrigation levels from 37% to 84% of
Class "A" Pan evaporation produced a linear increase in cane yield from 65 to 146 tons/ha. The response with burnt cane was greater due to more severe moisture stress, and there was also an increase in cane yield between 84% and 100% Pan which was absent in trashed cane. Maximum sucrose content, as well as brix, purity and recoverable sugar % cane were obtained with a level of 68% Pan; both higher and lower irrigation levels were significantly poorer in cane quality. Burnt cane produced higher sucrose content than trashed cane except at 37% Pan.
Maximum yields of sucrose per hectare were obtained at 84% Pan with trashing and 100% Pan with burning. At 37% Pan, trashing produced 4 tons sucrose/ha more than burning; this difference declined with increasing irrigation levels up to 80% Pan when there was no difference between burning and trashing. At 100% Pan, burning yielded 2 tons sucrose/ha more than trashing. Maximum efficiency of water use (expressed as kg sucrose/m3 water) was obtained generally at 68% Pan, with drier levels of irrigation giving far poorer efficiencies, especially with burnt cane.
Increasing irrigation levels also increased stalk numbers, stalk height, lodging and flower counts. Burning produced more stalks than trashing at all levels of irrigation except 37 % Pan; it also resulted in less lodging than did trashing.
Introduction Since little information was available on the op
timum level of water application to sugarcane in Rhodesia, a trial was established in November 1966 to investigate the effects of various levels of irrigation application under both burnt and trashed conditions.
Treatments and Methods The treatments were based on evaporation from a
Class "A" Pan (with the Central African modification of a black matt painted interior and 1" mesh screen over the pan). Six treatments were applied as follows :-
% of Pan Evaporation 100 84
AB* 68 53 37
Deficit (mm). 50.8 60.4
AB 74.2 96.0
135.4
ratoon, it received 84 % for the first 8 months (December-July) and 60% for the last 3 J months (August-November). In all cases the amount of water actually applied was intermediate between the 84% and 68% Pan levels.
These quantities were taken as net applications, and were calculated as 85 % of the gross quantity of water applied. At each irrigation, 59.5 mm gross was applied to give 50.8 mm (2 inches) net application; the interval between irrigations being varied between treatments to give the deficits required.
The above levels of irrigation were applied from 50% canopy onwards (about 2 months after planting or ratooning). Until that stage, the following canopy factors were applied to each irrigation level: 0-25% canopy 0.50; 25-50 % canopy 0.75. At the commencement of each ratoon crop, 100 mm of water were applied to all treatments in order to eliminate residual soil moisture variations from the previous crop.
The amounts of water actually applied to each treatment in each crop are given in Table I.
TABLE I Levels of Irrigation Applied (mm water)
Pan Factor
P IR 2R
Mean
100
1466 1702 1473
1547
84
1262 1499 1219
1326
AB
1161 1448 1118
1242
68
1059 1194 914
1055
53
906 940 660
835
37
754 685 457
632
Rainfall
599 279 452
443
The main plots (irrigation treatments) were split into 4 subplots which comprised a burning vs. trashing comparison and a urea vs. sulphate of ammonia comparison. In the former case, burning prior to harvest followed by reburning of tops was compared with a trash blanket, parted over the cane rows. The subplot size was 15.2 m by 9.0 m (6 rows 1.5 m apart); guard areas were discarded to give a harvested plot size of 9.1 m by 6.0 m. There were 4 replications, giving a total of 96 subplots.
The soil was a Triangle PE 1 sandy clay loam with the following mean chemical analysis:
* In the plant crop and 1st ratoon, treatment AB received 100% of Pan in summer (September-March) and 50% of Pan in winter (April-August). In 2nd
PH(CaCl2) Clay% Conductivity (mmho/cm.) Available P208 (p.p.m.) ... . Ex. K(m.e. %) Ex. Ca(m.e. %)
6.4 18
105 12 0.85 8.6
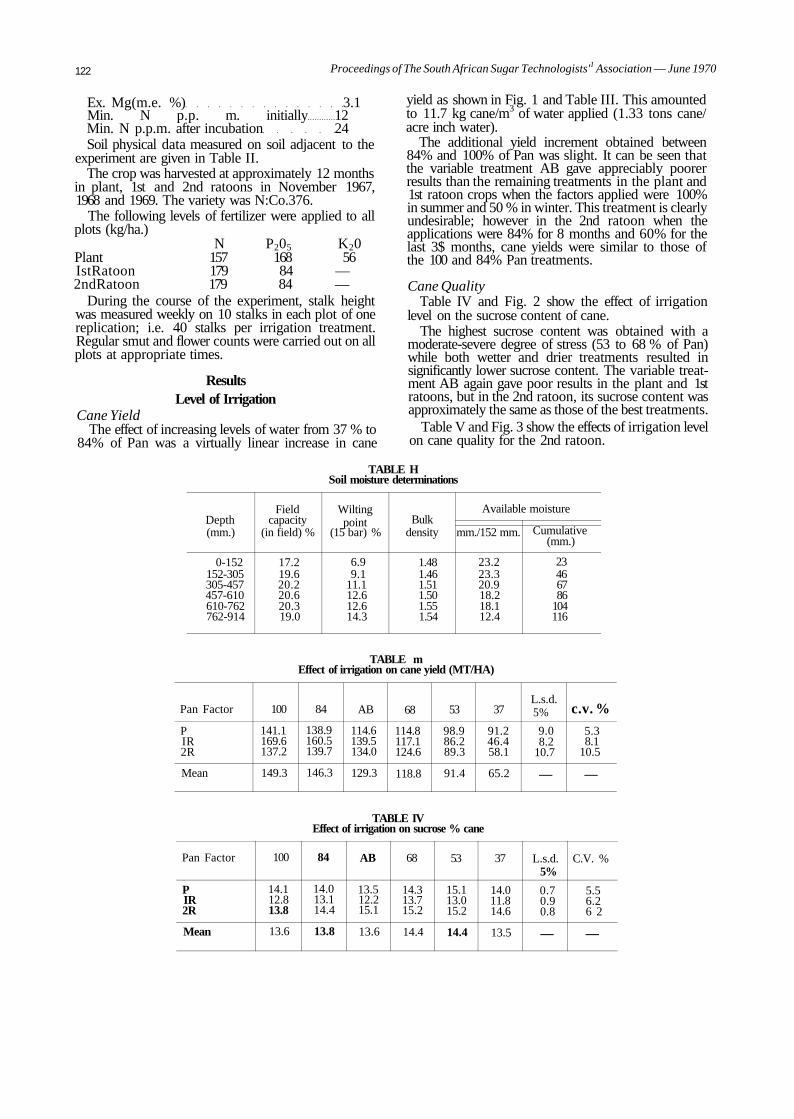
122 Proceedings of The South African Sugar Technologists'1 Association — June 1970
Ex. Mg(m.e. %) 3.1 Min. N p.p. m. initially 12 Min. N p.p.m. after incubation 24 Soil physical data measured on soil adjacent to the
experiment are given in Table II. The crop was harvested at approximately 12 months
in plant, 1st and 2nd ratoons in November 1967, 1968 and 1969. The variety was N:Co.376.
The following levels of fertilizer were applied to all plots (kg/ha.)
N P205 K20 Plant 157 168 56 IstRatoon 179 84 — 2ndRatoon 179 84 —
During the course of the experiment, stalk height was measured weekly on 10 stalks in each plot of one replication; i.e. 40 stalks per irrigation treatment. Regular smut and flower counts were carried out on all plots at appropriate times.
Results Level of Irrigation
Cane Yield The effect of increasing levels of water from 37 % to
84% of Pan was a virtually linear increase in cane
yield as shown in Fig. 1 and Table III. This amounted to 11.7 kg cane/m3 of water applied (1.33 tons cane/ acre inch water).
The additional yield increment obtained between 84% and 100% of Pan was slight. It can be seen that the variable treatment AB gave appreciably poorer results than the remaining treatments in the plant and 1st ratoon crops when the factors applied were 100% in summer and 50 % in winter. This treatment is clearly undesirable; however in the 2nd ratoon when the applications were 84% for 8 months and 60% for the last 3$ months, cane yields were similar to those of the 100 and 84% Pan treatments.
Cane Quality Table IV and Fig. 2 show the effect of irrigation
level on the sucrose content of cane. The highest sucrose content was obtained with a
moderate-severe degree of stress (53 to 68 % of Pan) while both wetter and drier treatments resulted in significantly lower sucrose content. The variable treatment AB again gave poor results in the plant and 1st ratoons, but in the 2nd ratoon, its sucrose content was approximately the same as those of the best treatments.
Table V and Fig. 3 show the effects of irrigation level on cane quality for the 2nd ratoon.
TABLE H Soil moisture determinations
Depth (mm.)
0-152 152-305 305-457 457-610 610-762 762-914
Field capacity
(in field) %
17.2 19.6 20.2 20.6 20.3 19.0
Wilting point
(15 bar) %
6.9 9.1
11.1 12.6 12.6 14.3
Bulk density
1.48 1.46 1.51 1.50 1.55 1.54
Available moisture
mm./152 mm.
23.2 23.3 20.9 18.2 18.1 12.4
Cumulative (mm.)
23 46 67 86
104 116
TABLE m Effect of irrigation on cane yield (MT/HA)
Pan Factor
P IR 2R
Mean
100
141.1 169.6 137.2
149.3
84
138.9 160.5 139.7
146.3
AB
114.6 139.5 134.0
129.3
68
114.8 117.1 124.6
118.8
53
98.9 86.2 89.3
91.4
37
91.2 46.4 58.1
65.2
L.s.d. 5%
9.0 8.2
10.7
—
c.v. %
5.3 8.1
10.5
—
TABLE IV Effect of irrigation on sucrose % cane
Pan Factor
P IR 2R
Mean
100
14.1 12.8 13.8
13.6
84
14.0 13.1 14.4
13.8
AB
13.5 12.2 15.1
13.6
68
14.3 13.7 15.2
14.4
53
15.1 13.0 15.2
14.4
37
14.0 11.8 14.6
13.5
L.s.d. 5%
0.7 0.9 0.8
—
C.V. %
5.5 6.2 6 2
—
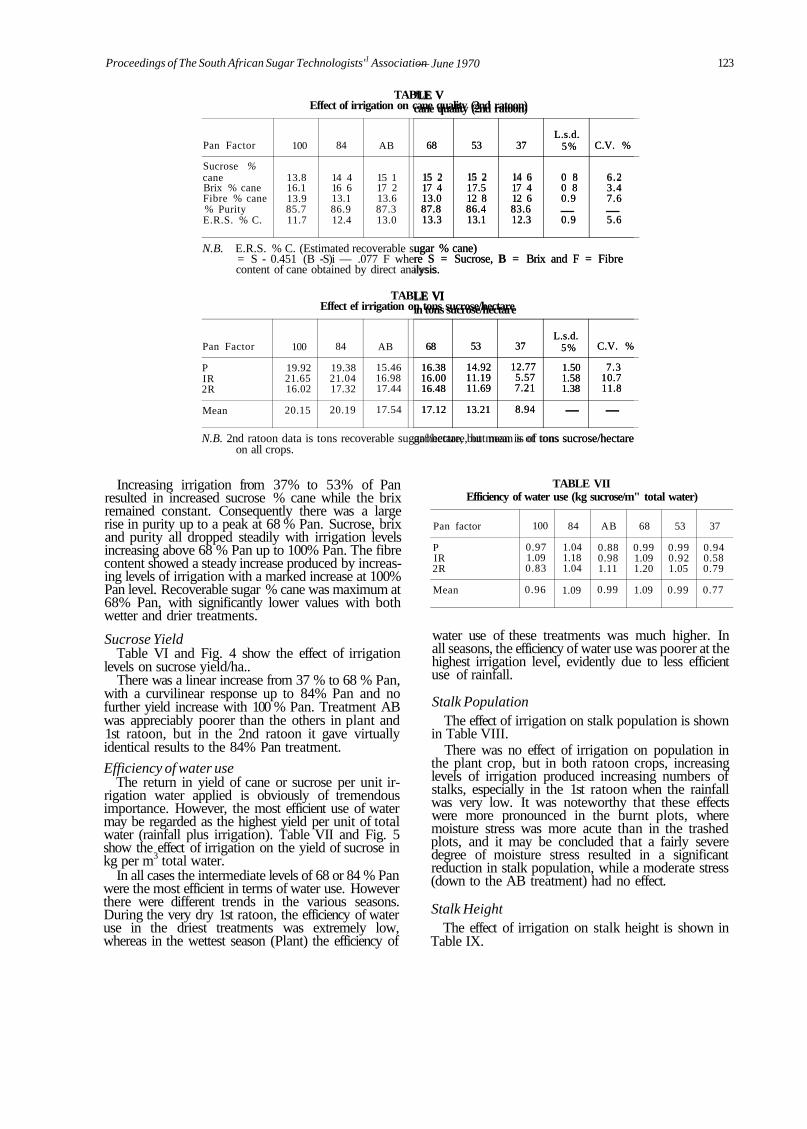
TABLE V Effect of irrigation on cane quality (2nd ratoon)
Pan Factor
Sucrose % cane Brix % cane Fibre % cane % Purity E.R.S. % C.
100
13.8 16.1 13.9 85.7 11.7
84
14 4 16 6 13.1 86.9 12.4
AB
15 1 17 2 13.6 87.3 13.0
68
15 2 17 4 13.0 87.8 13.3
53
15 2 17.5 12 8 86.4 13.1
37
14 6 17 4 12 6 83.6 12.3
L.s.d. 5%
0 8 0 8 0.9 — 0.9
C.V. %
6.2 3.4 7.6 — 5.6
N.B. E.R.S. % C. (Estimated recoverable sugar % cane) = S - 0.451 (B -S)i — .077 F where S = Sucrose, B = Brix and F = Fibre content of cane obtained by direct analysis.
TABLE VI Effect ef irrigation on tons sucrose/hectare
Pan Factor
P IR 2R
Mean
100
19.92 21.65 16.02
20.15
84
19.38 21.04 17.32
20.19
AB
15.46 16.98 17.44
17.54
68
16.38 16.00 16.48
17.12
53
14.92 11.19 11.69
13.21
37
12.77 5.57 7.21
8.94
L.s.d. 5%
1.50 1.58 1.38
—
C.V. %
7.3 10.7 11.8
—
N.B. 2nd ratoon data is tons recoverable sugar/hectare, but mean is of tons sucrose/hectare on all crops.
— June 1970 123
*LE V cane quality (2nd ratoon)
68
15 2 17 4 13.0 87.8 13.3
53
15 2 17.5 12 8 86.4 13.1
37
14 6 17 4 12 6 83.6 12.3
L.s.d. 5%
0 8 0 8 0.9 — 0.9
C.V. %
6.2 3.4 7.6 — 5.6
ugar % cane) re S = Sucrose, B = Brix and F = Fibre ilysis.
LE VI in tons sucrose/hectare
68
16.38 16.00 16.48
17.12
53
14.92 11.19 11.69
13.21
37
12.77 5.57 7.21
8.94
L.s.d. 5%
1.50 1.58 1.38
—
C.V. %
7.3 10.7 11.8
—
gar/hectare, but mean is of tons sucrose/hectare
Proceedings of The South African Sugar Technologists'1 Association
Increasing irrigation from 37% to 53% of Pan resulted in increased sucrose % cane while the brix remained constant. Consequently there was a large rise in purity up to a peak at 68 % Pan. Sucrose, brix and purity all dropped steadily with irrigation levels increasing above 68 % Pan up to 100% Pan. The fibre content showed a steady increase produced by increasing levels of irrigation with a marked increase at 100% Pan level. Recoverable sugar % cane was maximum at 68% Pan, with significantly lower values with both wetter and drier treatments.
Sucrose Yield Table VI and Fig. 4 show the effect of irrigation
levels on sucrose yield/ha.. There was a linear increase from 37 % to 68 % Pan,
with a curvilinear response up to 84% Pan and no further yield increase with 100 % Pan. Treatment AB was appreciably poorer than the others in plant and 1st ratoon, but in the 2nd ratoon it gave virtually identical results to the 84% Pan treatment.
Efficiency of water use The return in yield of cane or sucrose per unit ir
rigation water applied is obviously of tremendous importance. However, the most efficient use of water may be regarded as the highest yield per unit of total water (rainfall plus irrigation). Table VII and Fig. 5 show the effect of irrigation on the yield of sucrose in kg per m3 total water.
In all cases the intermediate levels of 68 or 84 % Pan were the most efficient in terms of water use. However there were different trends in the various seasons. During the very dry 1st ratoon, the efficiency of water use in the driest treatments was extremely low, whereas in the wettest season (Plant) the efficiency of
TABLE VII Efficiency of water use (kg sucrose/m" total water)
Pan factor
P IR 2R
Mean
100
0.97 1.09 0.83
0.96
84
1.04 1.18 1.04
1.09
AB
0.88 0.98 1.11
0.99
68
0.99 1.09 1.20
1.09
53
0.99 0.92 1.05
0.99
37
0.94 0.58 0.79
0.77
water use of these treatments was much higher. In all seasons, the efficiency of water use was poorer at the highest irrigation level, evidently due to less efficient use of rainfall.
Stalk Population The effect of irrigation on stalk population is shown
in Table VIII. There was no effect of irrigation on population in
the plant crop, but in both ratoon crops, increasing levels of irrigation produced increasing numbers of stalks, especially in the 1st ratoon when the rainfall was very low. It was noteworthy that these effects were more pronounced in the burnt plots, where moisture stress was more acute than in the trashed plots, and it may be concluded that a fairly severe degree of moisture stress resulted in a significant reduction in stalk population, while a moderate stress (down to the AB treatment) had no effect.
Stalk Height The effect of irrigation on stalk height is shown in
Table IX.
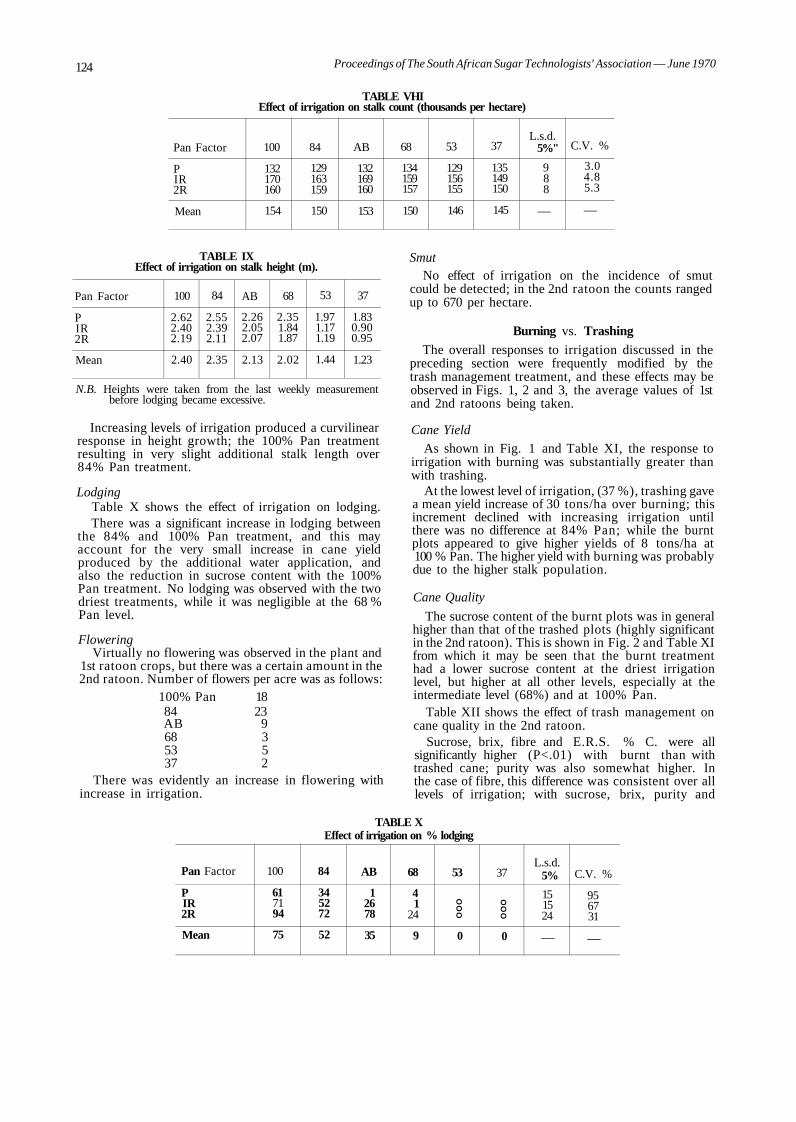
124 Proceedings of The South African Sugar Technologists' Association — June 1970
TABLE VHI Effect of irrigation on stalk count (thousands per hectare)
Pan Factor
P IR 2R
Mean
100
132 170 160
154
84
129 163 159
150
AB
132 169 160
153
68
134 159 157
150
53
129 156 155
146
37
135 149 150
145
L.s.d. 5%"
9 8 8
—
C.V. %
3.0 4.8 5.3
—
TABLE IX Effect of irrigation on stalk height (m).
Pan Factor
P IR 2R
Mean
100
2.62 2.40 2.19
2.40
84
2.55 2.39 2.11
2.35
AB
2.26 2.05 2.07
2.13
68
2.35 1.84 1.87
2.02
53
1.97 1.17 1.19
1.44
37
1.83 0.90 0.95
1.23
N.B. Heights were taken from the last weekly measurement before lodging became excessive.
Increasing levels of irrigation produced a curvilinear response in height growth; the 100% Pan treatment resulting in very slight additional stalk length over 84% Pan treatment.
Lodging Table X shows the effect of irrigation on lodging. There was a significant increase in lodging between
the 84% and 100% Pan treatment, and this may account for the very small increase in cane yield produced by the additional water application, and also the reduction in sucrose content with the 100% Pan treatment. No lodging was observed with the two driest treatments, while it was negligible at the 68 % Pan level.
Flowering Virtually no flowering was observed in the plant and
1st ratoon crops, but there was a certain amount in the 2nd ratoon. Number of flowers per acre was as follows:
100% Pan 84 AB 68 53 37
18 23
9 3 5 2
There was evidently an increase in flowering with increase in irrigation.
Smut No effect of irrigation on the incidence of smut
could be detected; in the 2nd ratoon the counts ranged up to 670 per hectare.
Burning vs. Trashing The overall responses to irrigation discussed in the
preceding section were frequently modified by the trash management treatment, and these effects may be observed in Figs. 1, 2 and 3, the average values of 1st and 2nd ratoons being taken.
Cane Yield
As shown in Fig. 1 and Table XI, the response to irrigation with burning was substantially greater than with trashing.
At the lowest level of irrigation, (37 %), trashing gave a mean yield increase of 30 tons/ha over burning; this increment declined with increasing irrigation until there was no difference at 84% Pan; while the burnt plots appeared to give higher yields of 8 tons/ha at 100 % Pan. The higher yield with burning was probably due to the higher stalk population.
Cane Quality
The sucrose content of the burnt plots was in general higher than that of the trashed plots (highly significant in the 2nd ratoon). This is shown in Fig. 2 and Table XI from which it may be seen that the burnt treatment had a lower sucrose content at the driest irrigation level, but higher at all other levels, especially at the intermediate level (68%) and at 100% Pan.
Table XII shows the effect of trash management on cane quality in the 2nd ratoon.
Sucrose, brix, fibre and E.R.S. % C. were all significantly higher (P<.01) with burnt than with trashed cane; purity was also somewhat higher. In the case of fibre, this difference was consistent over all levels of irrigation; with sucrose, brix, purity and
TABLE X Effect of irrigation on % lodging
Pan Factor
P IR 2R
Mean
100
61 71 94
75
84
34 52 72
52
AB
1 26 78
35
68
4 1
24
9
53
OO
O
0
37
OO
O
0
L.s.d. 5%
15 15 24
—
C.V. %
95 67 31
—
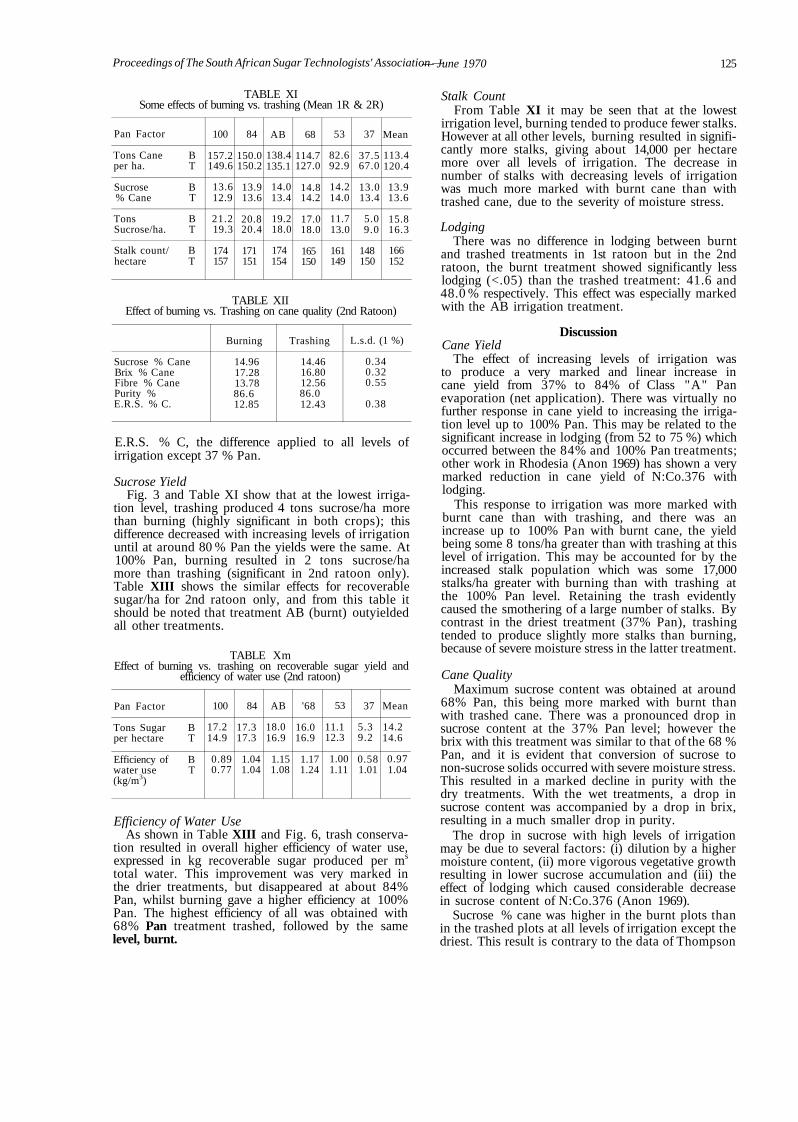
Proceedings of The South African Sugar Technologists' Association —
TABLE XI Some effects of burning vs. trashing (Mean 1R & 2R)
Pan Factor
Tons Cane B per ha. T
Sucrose B % Cane T
Tons B Sucrose/ha. T
Stalk count/ B hectare T
100
157.2 149.6
13.6 12.9
21.2 19.3
174 157
84
150.0 150.2
13.9 13.6
20.8 20.4
171 151
AB
138.4 135.1
14.0 13.4
19.2 18.0
174 154
68
114.7 127.0
14.8 14.2
17.0 18.0
165 150
53
82.6 92.9
14.2 14.0
11.7 13.0
161 149
37
37.5 67.0
13.0 13.4
5.0 9.0
148 150
Mean
113.4 120.4
13.9 13.6
15.8 16.3
166 152
TABLE XII Effect of burning vs. Trashing on cane quality (2nd Ratoon)
Sucrose % Cane Brix % Cane Fibre % Cane Purity % E.R.S. % C.
Burning
14.96 17.28 13.78 86.6 12.85
Trashing
14.46 16.80 12.56 86.0 12.43
L.s.d. (1 %)
0.34 0.32 0.55
0.38
E.R.S. % C, the difference applied to all levels of irrigation except 37 % Pan.
Sucrose Yield Fig. 3 and Table XI show that at the lowest irriga
tion level, trashing produced 4 tons sucrose/ha more than burning (highly significant in both crops); this difference decreased with increasing levels of irrigation until at around 80 % Pan the yields were the same. At 100% Pan, burning resulted in 2 tons sucrose/ha more than trashing (significant in 2nd ratoon only). Table XIII shows the similar effects for recoverable sugar/ha for 2nd ratoon only, and from this table it should be noted that treatment AB (burnt) outyielded all other treatments.
TABLE Xm Effect of burning vs. trashing on recoverable sugar yield and
efficiency of water use (2nd ratoon)
Pan Factor
Tons Sugar B per hectare T
Efficiency of B water use T (kg/m3)
100
17.2 14.9
0.89 0.77
84
17.3 17.3
1.04 1.04
AB
18.0 16.9
1.15 1.08
'68
16.0 16.9
1.17 1.24
53
11.1 12.3
1.00 1.11
37
5.3 9.2
0.58 1.01
Mean
14.2 14.6
0.97 1.04
Efficiency of Water Use As shown in Table XIII and Fig. 6, trash conserva
tion resulted in overall higher efficiency of water use, expressed in kg recoverable sugar produced per ms
total water. This improvement was very marked in the drier treatments, but disappeared at about 84% Pan, whilst burning gave a higher efficiency at 100% Pan. The highest efficiency of all was obtained with 68% Pan treatment trashed, followed by the same level, burnt.
— June 1970 125
Stalk Count From Table XI it may be seen that at the lowest
irrigation level, burning tended to produce fewer stalks. However at all other levels, burning resulted in significantly more stalks, giving about 14,000 per hectare more over all levels of irrigation. The decrease in number of stalks with decreasing levels of irrigation was much more marked with burnt cane than with trashed cane, due to the severity of moisture stress.
Lodging There was no difference in lodging between burnt
and trashed treatments in 1st ratoon but in the 2nd ratoon, the burnt treatment showed significantly less lodging (<.05) than the trashed treatment: 41.6 and 48.0 % respectively. This effect was especially marked with the AB irrigation treatment.
Discussion Cane Yield
The effect of increasing levels of irrigation was to produce a very marked and linear increase in cane yield from 37% to 84% of Class "A" Pan evaporation (net application). There was virtually no further response in cane yield to increasing the irrigation level up to 100% Pan. This may be related to the significant increase in lodging (from 52 to 75 %) which occurred between the 84% and 100% Pan treatments; other work in Rhodesia (Anon 1969) has shown a very marked reduction in cane yield of N:Co.376 with lodging.
This response to irrigation was more marked with burnt cane than with trashing, and there was an increase up to 100% Pan with burnt cane, the yield being some 8 tons/ha greater than with trashing at this level of irrigation. This may be accounted for by the increased stalk population which was some 17,000 stalks/ha greater with burning than with trashing at the 100% Pan level. Retaining the trash evidently caused the smothering of a large number of stalks. By contrast in the driest treatment (37% Pan), trashing tended to produce slightly more stalks than burning, because of severe moisture stress in the latter treatment.
Cane Quality Maximum sucrose content was obtained at around
68% Pan, this being more marked with burnt than with trashed cane. There was a pronounced drop in sucrose content at the 37% Pan level; however the brix with this treatment was similar to that of the 68 % Pan, and it is evident that conversion of sucrose to non-sucrose solids occurred with severe moisture stress. This resulted in a marked decline in purity with the dry treatments. With the wet treatments, a drop in sucrose content was accompanied by a drop in brix, resulting in a much smaller drop in purity.
The drop in sucrose with high levels of irrigation may be due to several factors: (i) dilution by a higher moisture content, (ii) more vigorous vegetative growth resulting in lower sucrose accumulation and (iii) the effect of lodging which caused considerable decrease in sucrose content of N:Co.376 (Anon 1969).
Sucrose % cane was higher in the burnt plots than in the trashed plots at all levels of irrigation except the driest. This result is contrary to the data of Thompson
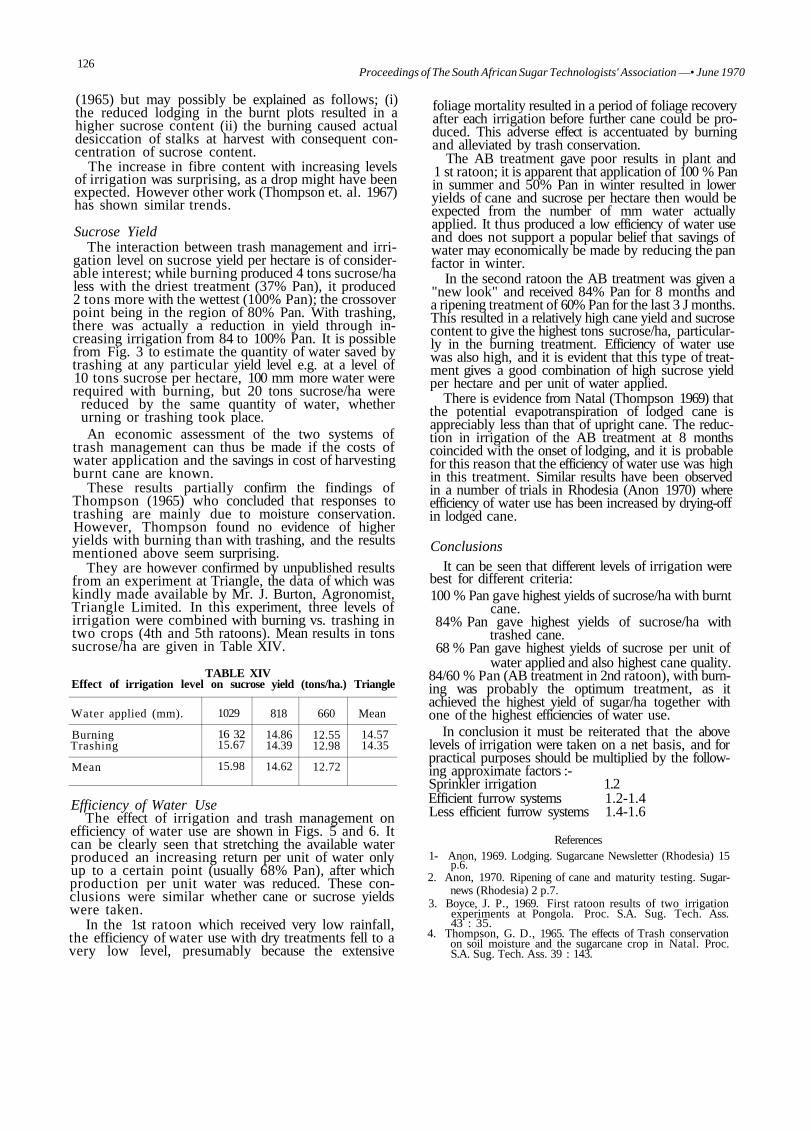
126 Proceedings of The South African Sugar Technologists' Association —• June 1970
(1965) but may possibly be explained as follows; (i) the reduced lodging in the burnt plots resulted in a higher sucrose content (ii) the burning caused actual desiccation of stalks at harvest with consequent concentration of sucrose content.
The increase in fibre content with increasing levels of irrigation was surprising, as a drop might have been expected. However other work (Thompson et. al. 1967) has shown similar trends.
Sucrose Yield The interaction between trash management and irri
gation level on sucrose yield per hectare is of considerable interest; while burning produced 4 tons sucrose/ha less with the driest treatment (37% Pan), it produced 2 tons more with the wettest (100% Pan); the crossover point being in the region of 80% Pan. With trashing, there was actually a reduction in yield through increasing irrigation from 84 to 100% Pan. It is possible from Fig. 3 to estimate the quantity of water saved by trashing at any particular yield level e.g. at a level of 10 tons sucrose per hectare, 100 mm more water were required with burning, but 20 tons sucrose/ha were
reduced by the same quantity of water, whether urning or trashing took place. An economic assessment of the two systems of
trash management can thus be made if the costs of water application and the savings in cost of harvesting burnt cane are known.
These results partially confirm the findings of Thompson (1965) who concluded that responses to trashing are mainly due to moisture conservation. However, Thompson found no evidence of higher yields with burning than with trashing, and the results mentioned above seem surprising.
They are however confirmed by unpublished results from an experiment at Triangle, the data of which was kindly made available by Mr. J. Burton, Agronomist, Triangle Limited. In this experiment, three levels of irrigation were combined with burning vs. trashing in two crops (4th and 5th ratoons). Mean results in tons sucrose/ha are given in Table XIV.
TABLE XIV Effect of irrigation level on sucrose yield (tons/ha.) Triangle
Water applied (mm).
Burning Trashing
Mean
1029
16 32 15.67
15.98
818
14.86 14.39
14.62
660
12.55 12.98
12.72
Mean
14.57 14.35
Efficiency of Water Use The effect of irrigation and trash management on
efficiency of water use are shown in Figs. 5 and 6. It can be clearly seen that stretching the available water produced an increasing return per unit of water only up to a certain point (usually 68% Pan), after which production per unit water was reduced. These conclusions were similar whether cane or sucrose yields were taken.
In the 1st ratoon which received very low rainfall, the efficiency of water use with dry treatments fell to a very low level, presumably because the extensive
foliage mortality resulted in a period of foliage recovery after each irrigation before further cane could be produced. This adverse effect is accentuated by burning and alleviated by trash conservation.
The AB treatment gave poor results in plant and 1 st ratoon; it is apparent that application of 100 % Pan in summer and 50% Pan in winter resulted in lower yields of cane and sucrose per hectare then would be expected from the number of mm water actually applied. It thus produced a low efficiency of water use and does not support a popular belief that savings of water may economically be made by reducing the pan factor in winter.
In the second ratoon the AB treatment was given a "new look" and received 84% Pan for 8 months and a ripening treatment of 60% Pan for the last 3 J months. This resulted in a relatively high cane yield and sucrose content to give the highest tons sucrose/ha, particularly in the burning treatment. Efficiency of water use was also high, and it is evident that this type of treatment gives a good combination of high sucrose yield per hectare and per unit of water applied.
There is evidence from Natal (Thompson 1969) that the potential evapotranspiration of lodged cane is appreciably less than that of upright cane. The reduction in irrigation of the AB treatment at 8 months coincided with the onset of lodging, and it is probable for this reason that the efficiency of water use was high in this treatment. Similar results have been observed in a number of trials in Rhodesia (Anon 1970) where efficiency of water use has been increased by drying-off in lodged cane.
Conclusions It can be seen that different levels of irrigation were
best for different criteria: 100 % Pan gave highest yields of sucrose/ha with burnt
cane. 84% Pan gave highest yields of sucrose/ha with
trashed cane. 68 % Pan gave highest yields of sucrose per unit of
water applied and also highest cane quality. 84/60 % Pan (AB treatment in 2nd ratoon), with burning was probably the optimum treatment, as it achieved the highest yield of sugar/ha together with one of the highest efficiencies of water use.
In conclusion it must be reiterated that the above levels of irrigation were taken on a net basis, and for practical purposes should be multiplied by the following approximate factors :-Sprinkler irrigation 1.2 Efficient furrow systems 1.2-1.4 Less efficient furrow systems 1.4-1.6
References 1- Anon, 1969. Lodging. Sugarcane Newsletter (Rhodesia) 15
p.6. 2. Anon, 1970. Ripening of cane and maturity testing. Sugar-
news (Rhodesia) 2 p.7. 3. Boyce, J. P., 1969. First ratoon results of two irrigation
experiments at Pongola. Proc. S.A. Sug. Tech. Ass. 43 : 35.
4. Thompson, G. D., 1965. The effects of Trash conservation on soil moisture and the sugarcane crop in Natal. Proc. S.A. Sug. Tech. Ass. 39 : 143.
Proceedings of The South African Sugar Technologists Association —
5. Thompson, G. D., Gosnell, J. M.,and de Robillard, P. J.M., 1967. Responses of Sugarcane to Supplementary Irrigation on two soils in Natal. Expl. Agric. 3, 3 : 223.
6. Thompson, G. D., 1969. Personal communication.
Discussion Dr. Thompson (in the chair): In table VII you
have given the efficiency of water use for pan factor treatments 100, 84, A B, 68 and 53. The data show that these efficiencies vary from crop to orop, but I wonder if the differences are really significant? But at pan factor 37 the efficiency really does decline, and we have found a similar effect in our own work. The relationship between yield and water use appears to be linear until a certain point of moisture stress is reached. We think that mortality of otherwise har-vestable stalks then occurs and the efficiency consequently declines.
You have given an alternative explanation in that the foliage dies, irrigation water is applied, and a lot of it is then lost by evaporation.
In Table XI, giving some effects of burning and trashing, you have combined data for first and second ratoons. Did the first ratoon data, when rainfall was low, give a bigger effect due to trash than the second ratoon when rainfall was high?
Dr. Gosnell: The rainfall was also low for the second ratoon — it was only high in the plant crop, and the burning versus trashing effect was similar for both.
Mr. Boyce: In our drying off experiments we have also found that fibre percent increased with the wetter treatments.
How does Dr. Gosnell relate his pan factor method of irrigation to our method of minimum cycle during peak demand?
At Pongola we achieve maximum yield of sucrose per acre with a 21 day cycle, which indicates that rainfall cannot be ignored.
Dr. Gosnell: We cannot relate at all the two different methods of applying waiter.
Our method suits our particular conditions and requirements.
For design of new schemes, I think Mr. Boyce's method would be more suitable.
Dr. Thompson: Regarding your tons cane and tons sucrose per hectare, your 100 and 84% factors gave similar yields. If a direct relationship exists between yield and water requirement, did you get the same yield at 84 and 100 because the 84 made better use of rainfall?
Dr. Gosnell: That is partly the reason but it is also connected with the burning versus trashing interaction. The burnt plots increased in yield from 84 to 100 but the trashed plots decreased in yield, possibly due to excessive lodging.
Mr. Browne: In Figure 5, efficiency of water use, the peaks of the graphs appear to move to the left
— June 1970 ' 127
and upwards from the plant crop to the first ratoon and second ratoon crop. Could compaction have had an effect here?
Dr. Gosnell: I do not know. As regards the plant crop there was a much higher rainfall, and the differences between driest and wettest treatments and of water use were much closer.
Mr. Moberly: Were drying off procedures followed with these treatments? The sucrose per cent cane is lower than one would expect with high water treatments.
Dr. Gosnell: No, the treatments were continued right up to harvest.
If you compare the 84% pan treatment throughout of the second ratoon with the 84 pan up to eight months, followed by drying off, substantially improved results are seen.
In this trial we did not want the confusion between drying off and irrigation effects, except in the one treatment AB.
Mr. du Toit: Regarding increase of fibre with irrigation, the figures published for the industry every year by Mr. Perk puzzle me because they show a low sucrose at the beginning and end of the season and high sucrose at the peak in September, yet the fibre tends to fall at that time.
A period of drought does not apparently give high fibre but instead gives low fibre. With increased water, the photosynthesis appears to work more towards fibre than sucrose.
Dr. Gosnell's optimum use of water is at 68. Would he recommend this figure for a commercial irrigation scheme?
Dr. Gosnell: This would have to be considered for each case, and would depend on which was the more valuable — the land or the water.
Generally, a figure of about 84 would be recommended.
Mr. Boyce: Because of the soil type at Pongola we have tended to discount the applicability of our results — we have found a crop feeding from as deep as eight feet.
However, Dr. Gosnell's results tend to confirm our results.
Dr. Gosnell: The soil depth for this experiment is about 30 inches and there is no effective root proliferation below this depth.
Dr. Thompson: We have been hesitant about extrapolating our Pongola results too far because we are working on such a deep soil that the crop may be getting water from depth that it would not get on your soil. On a shallow soil you appear to be getting similar trends for the different treatments.
Dr. Gosnell: They seem similar but our intermediate treatment is not similar to your 21 day treatment.
If we did not irrigate for 21 days in summer, our crop would be severely affected.
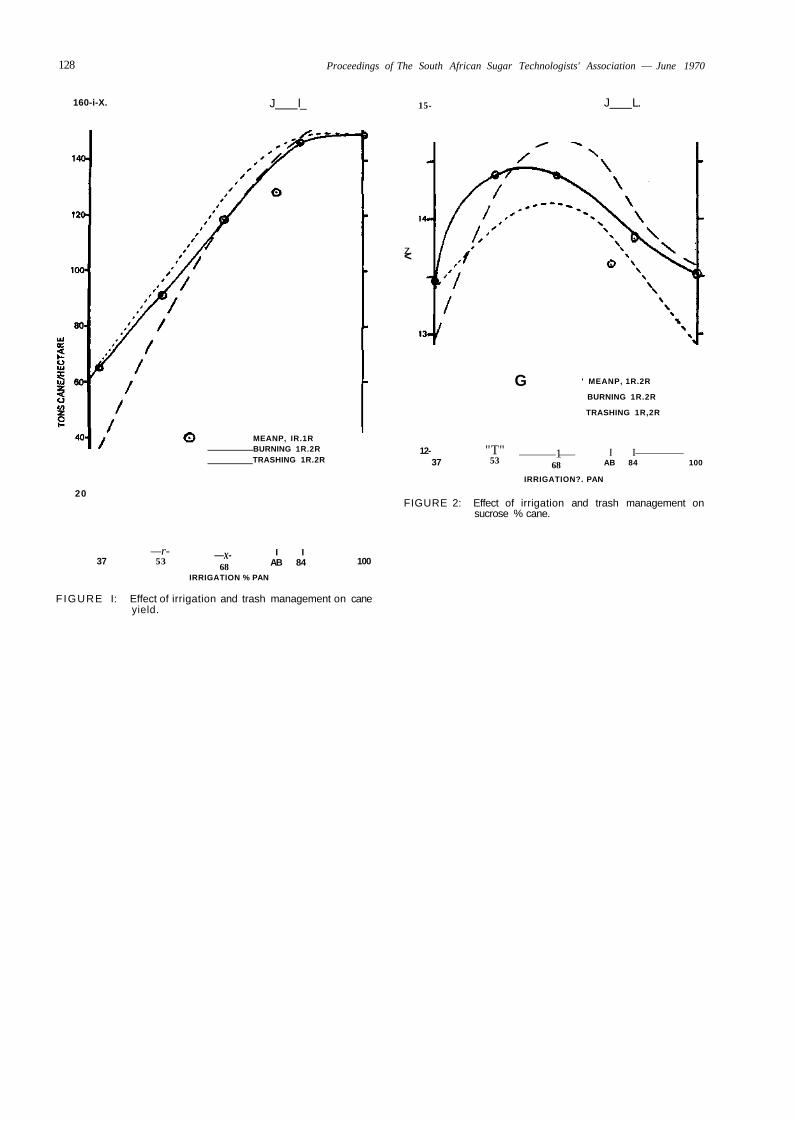
128 Proceedings of The South African Sugar Technologists' Association — June 1970
160-i-X. J l_
MEANP, IR.1R BURNING 1R.2R TRASHING 1R.2R
20
37 —r-
53 —x-
68
I I AB 84
15-
z <
12-
J L.
G ' MEANP, 1R.2R
BURNING 1R.2R
TRASHING 1R,2R
37 "T"
53 1
68
IRRIGATION?. PAN
I I AB 84 100
FIGURE 2: Effect of irrigation and trash management on sucrose % cane.
100
IRRIGATION % PAN
FIGURE I: Effect of irrigation and trash management on cane yield.
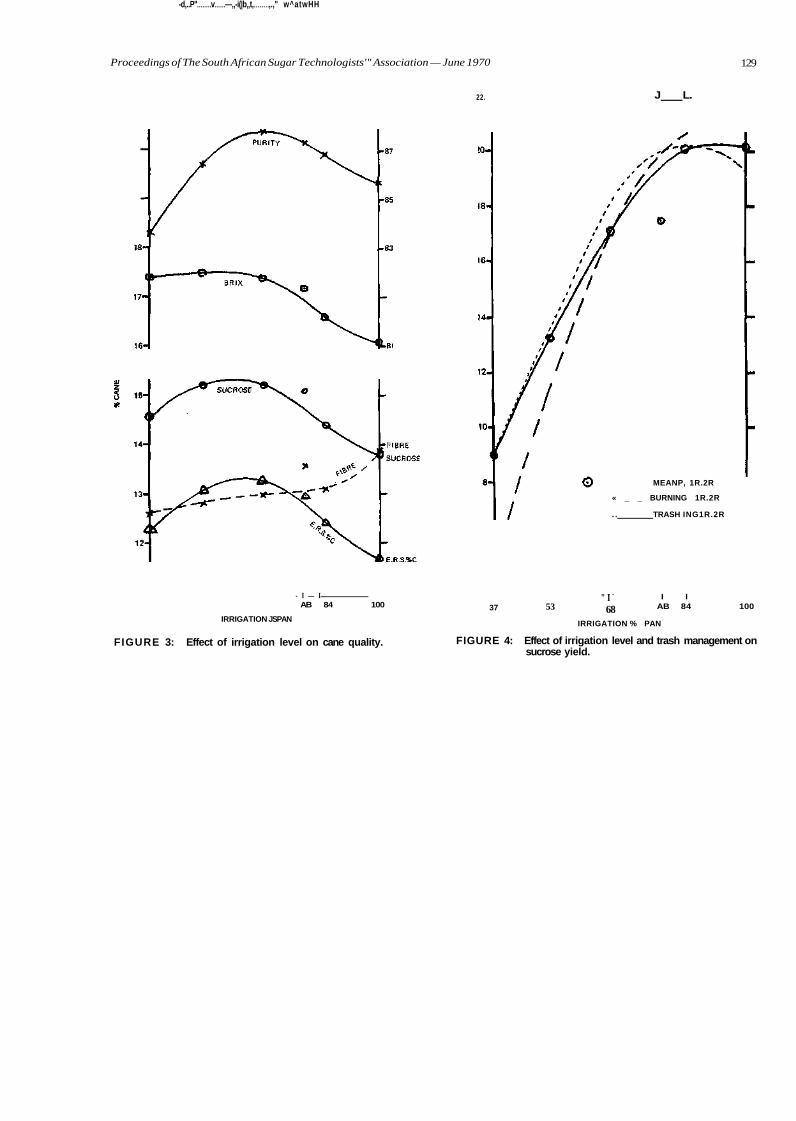
-d,..P'' v —,,-i(|b„t, ,.," w^atwHH
Proceedings of The South African Sugar Technologists'" Association — June 1970 129
22.
- I — I AB 84 100
IRRIGATION JSPAN
FIGURE 3: Effect of irrigation level on cane quality.
J L.
MEANP, 1R.2R
« _ _ BURNING 1R.2R
. . TRASH ING1R.2R
37 53 " I -
68 I I
AB 84 100
IRRIGATION % PAN
FIGURE 4: Effect of irrigation level and trash management on sucrose yield.
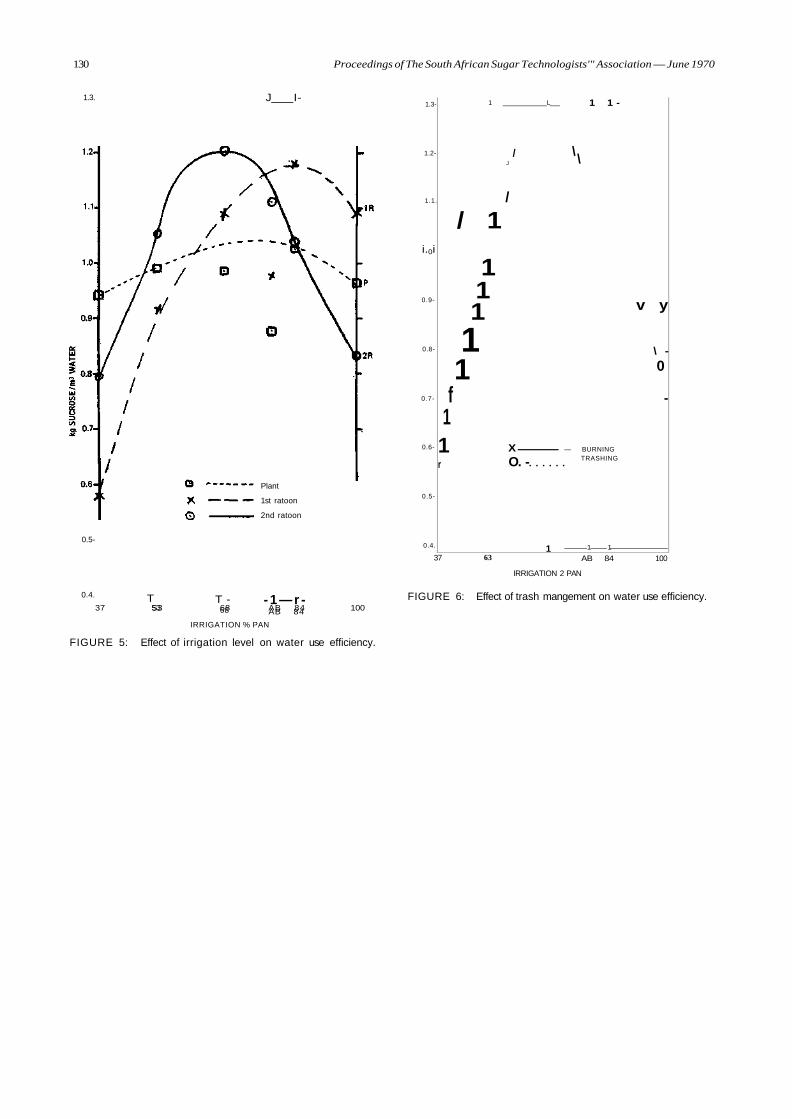
130 Proceedings of The South African Sugar Technologists'" Association — June 1970
1.3.
0.5-
0.4.
J I-
Plant
1st ratoon
2nd ratoon
T 53
T -68
- 1 — r -AB 84 37 S3 68 AB 84 100
IRRIGATION % PAN
FIGURE 5: Effect of irrigation level on water use efficiency.
1.3-
1.2-
1.1.
i.0i
0.9-
0.8-
0.7-
0.6-
0.5-
0.4.
1
/ 1
1 1 1
1 1
f 1 1 r
L
/ J
/
X O. -
1
1 1 -
\ \
v y
\ -
0
-
— BURNING TRASHING
1 1
37 63 AB 84 100
IRRIGATION 2 PAN
FIGURE 6: Effect of trash mangement on water use efficiency.

Proceedings of The South African Sugar Technologists' Association — June 1970 131
SOME ASPECTS OF THE USE OF PLASTIC PIPING IN LAND DRAINAGE
By B. PITHEY
Stewarts and Lloyds of South Africa Limited
Introduction There appears to be little doubt that this country
has accepted the advantages that can be enjoyed by employing irrigation schemes to assist in crop production. Not only are advantages expected, but automatically the assumption is made that irrigation implies continued high levels of production.
Irrigation engineers, expounding the benefits of packaged deal pipes, pumps and sprays fail to devote the same attention to the problems that can result when irrigation is practised in areas of low rainfall. For as much as irrigation can result in high levels of crop production, a gradual decline in production can result from waterlogging and the build-up of alkalinity and salinity in the soil.
It is estimated that from 15% to 20% of the total cane production area in South Africa is faced with these two problems. In particular, the arid areas in the Eastern parts of the country have shown evidence of just this type of problem, leading to the loss of crops or reduction in yields.
Installing suitable drainage is a means of overcoming these difficulties. Its function would be:
(a) to remove excess ground water in the root zone of the crop plants during the growing season.
(b) to maintain the water table below ground level throughout the year, particularly in reclamation areas.
(c) to reduce the levels of salinity by leaching out of salts carried by or absorbed by irrigation water.
(d) to allow free circulation of air in the rhizosphere To safeguard our soils we have to recognise where
drainage is needed, and what steps must be taken to provide adequate drainage. If we establish and irrigate a crop, but only consider drainage when saline or alkali conditions occur, it will cost a great deal more to install, if at all possible. Irrigation and drainage are complementary and should not be considered separately; they form part of a system, in which drainage might or might not be necessary.
Drainage and Plastics Predictably, in view of the tremendous inroads that
plastics have made as substitution materials on the conventionally accepted ones, drainage pipe made from polymeric materials was a natural development. In Holland for example, 20% of the total drainage was done by means of plastic pipe by 1963. Apart from the European countries, our most interesting comparison is that Australia uses plastic drainage systems for a wide number of applications.
Some of the advantages of plastic pipe over the
more conventional materials now used for drainage might help to explain the substitution.
1 Lightness—a 20 ft (6.1 m) length of 75 mm pipe weighs 6.7 lb (3 kg).
2 Ease of handling. 3 Toughness. 4 Availability in any length; quick and easy to lay. 5 Ease of stacking; taking up little space. 6 Once laid, resists misalignment by earth move
ment. 7 Controlled slots prevent blockage by large soil
particles. 8 Ease of flushing out or rodding. 9 Grids are easily attached to exposed ends of
pipes to prevent entry of rodents during dry weather.
Types of Plastic Materials used for Drainage Pipe Three pipe compounds, based on polyethylene,
acrylonitrile/butadiene/styrene and polyvinylchloride have been used for this type of application. Of these, PVC has been the most successful and economical compound and the discussion is accordingly limited to this material.
Early History The first existence of the monomer vinyl chloride
was reported as early as-1838, but was only born as a polymeric compound around 1912 when the Germans patented the first polymerisation process. By 1933 two further companies, one being B. F. Goodrich, patented other allied processes.
By the start of the Second World War, the significance of plasticising PVC was fully realised. Due to the shortage of rubber, plasticised PVC was used as a substitute material, and has been permanently used ever since. The point to be made is that PVC as a material already has a 30 year history, and is not as unconventional as is commonly accepted.
Properties of PVC Compounds In general, most thermoplastics are delivered in a
form suitable for processing. This is not so for PVC which is in a form which usually requires compounding. This is necessary because of the relatively low thermal stability and high meltviscosity of the material. By correct choice of compounding additives it is found that processing is made easier. By changing the combination of additives the physical properties of an end product made from the compound can be varied and controlled.
Polyvinyl compounds normally contain the base polymer together with stabilizer, lubricant, filler and
132 Proceedings of The South African Sugar Technologists' Association — June 1970
pigments, and are then classified as 'rigids'. By adding a plasticiser, the hard horny rigid compound converts into a flexible grade, and is accordingly termed a semirigid or flexible compound. Table 1 outlines the properties of these two types of PVC compounds.
For drainage purposes, pipes made from the rigid compounds are the most suitable. The term rigid is a little misleading, and is sometimes thought to convey brittleness. This is not true. Pipe extruded from rigid compound is tough and durable, and is sufficiently flexible for a 50 mm diameter pipe to be coiled. What's more, by altering the geometry of the pipe surface, for example by corrugating it, an even more flexible effect is achieved. Coiling is made easier.
Pipe and Slot Dimensions The slot patterns on drainage pipe vary between
countries, some of which are listed.
Pipe sizes
Area of perforation
Slits/m
Slot size length
width
Australia
2" 3" 4"
60 in 4 rows
ir 1/16"
Denmark
50mm/ 90mm
10 sq.cm/m
7.8mm width
2mm width
Netherland
40mm/ 63mm
9 sq.cm/m 60 in
4 rows 2.5 cm
0.6 mm
Gt. Britain
2"
0.6%
1J" traverse
A generally accepted pattern in South Africa is 9 sq cm per metre area of perforation 60 slots per metre 2.5 cm slot length 0.6 mm slot width It is anticipated that a 0.6 mm wide saw slit will
prevent silting up of the drainage pipe in most soils. An exception could be found in sandy soils in which case two preventative measures can be taken. The first is to backfill the areas in contact with the drainage pipe with a coarser grain material, or alternatively to cover the saw slits with a strip of fibre glass. Experimental work in Holland has shown that fibreglass pre-wrapped drainage pipe has given results as good as those found from tile drainage in sandy subsoils.
In clay soils the silting up of the drains does not appear to coincide as much with the fineness of the soil particles as with the cohesion and the structure of the soil. The use of filtering material is in general not necessary here.
Laying a plastic drainage system The two most important advantages of laying
drainage with plastic pipes are :-1 Transport— A 75 mm pipe weighs approximately
6.6lbs (3 kg) per 20 ft (6.1 m) length. Packed in bundles of 10 they make loading and unloading a relatively easy task. This all means a saving of time and labour, particularly in the field. Breakages very rarely occur.
2 Labour employed—Compared to other drainage materials, laying plastic pipes requires a smaller number of workers. Labour organisation is simpler, in that the same workers are employed on the project all the time.
In South Africa trenching will often be done manually. Savings can be expected to accrue from the use of plastic pipes in manual installations because of the speed of laying the pipe. Several lengths of pipe can be joined and snaked into the trench as fast as the trench is dug. This means that narrower trenches can be used.
But plastic pipes particularly lend themselves to mechanical means of installation. Drain laying machines can easily be modified to handle plastic pipes.
For best results, plastic drainage pipe must be laid firmly on the base of the trench and not on loose soil which has fallen back after the trencher has passed. To ensure this, a "box" consisting of two parallel plates running along either side of the trench wall is attached at the back of the machine. The pipes are then laid within and between these plates before soil can fall onto the bottom of the trench. A chute of about 15 ft (4.75 m) radius is recommended down which the pipe can be fed to rest on the freshly cut V base of the trench. The pipe is fed continuously either from a coiled length of pipe or from straight lengths joined by a spigot and socket method. This means that the one end of each straight length is belled. It is not necessary to improve the joint strength with cementing compound.
Under bad laying conditions where fall-in of the trench occurs soon after the trenching machine has passed, it is desirable to cover the pipe as soon as possible with a permeable layer. The necessity for manual removal of fallen earth from the top of the pipe will be avoided by following the trenching machine with a gravelling unit.
Although plastic pipe has more than adequate strength for its intended purpose, it will not withstand a man jumping into the trench on top of it. If it is necessary to remove any earth from on top of the pipe, this should be done from the side of the trench, using a suitable tool.
Conclusion Drainage is a very important but somewhat neglected
feature of crop production. Most drainage problems are associated with irrigation. Continued application of irrigation water will add salts to soil, and rainfall or further application of water will be necessary to leach out the salts and to remove these through drains.
Drainage costs are reasonable in relation to other aspects of capital expenditure for crop production. Plastic pipe drainage should in the near future offer the most attractive savings on drainage schemes in South Africa, as has been found in other parts of the world.
Drainage on anything other than a very small scale, requires expert advice and design. Advice should be called for on matters pertaining to drainage whether it be design, installation, operation or maintenance.
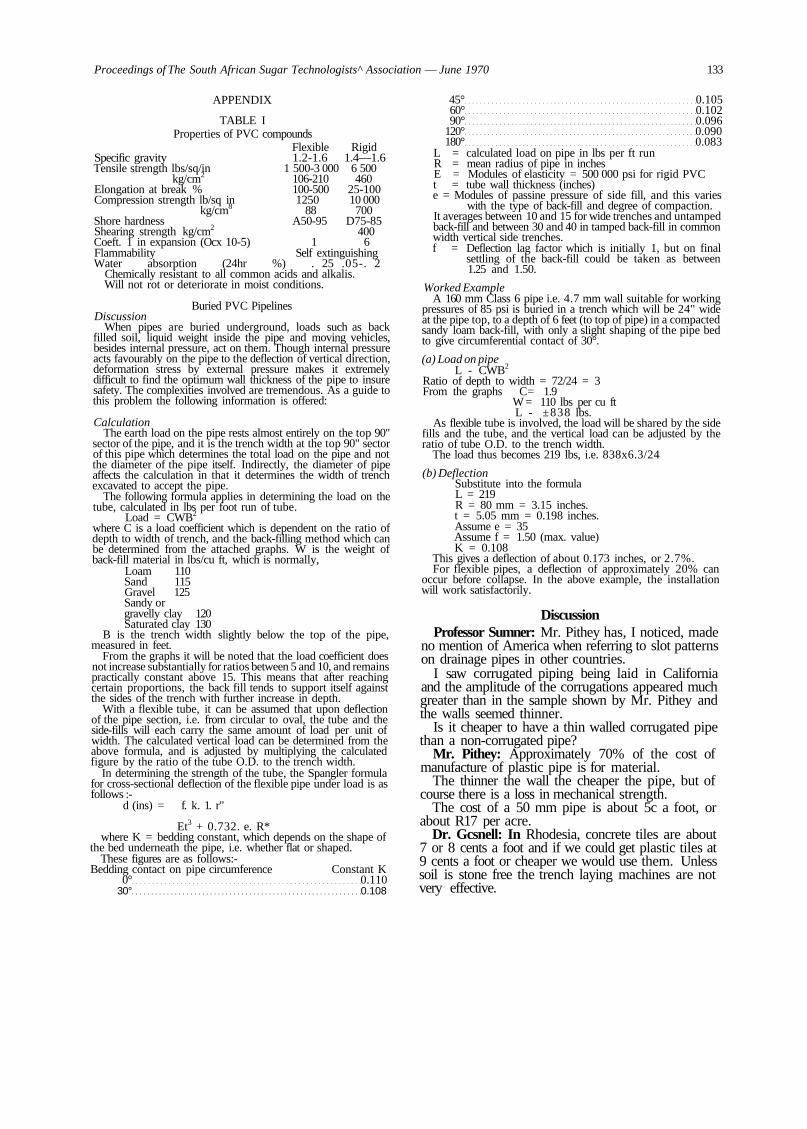
Proceedings of The South African Sugar Technologists^ Association — June 1970 133
APPENDIX
TABLE I Properties of PVC compounds
Flexible Rigid Specific gravity 1.2-1.6 1.4—1.6 Tensile strength lbs/sq/in 1 500-3 000 6 500
kg/cm2 106-210 460 Elongation at break % 100-500 25-100 Compression strength lb/sq in 1250 10 000
kg/cm8 88 700 Shore hardness A50-95 D75-85 Shearing strength kg/cm2 400 Coeft. 1 in expansion (Ocx 10-5) 1 6 Flammability Self extinguishing Water absorption (24hr %) . 25 .05-. 2
Chemically resistant to all common acids and alkalis. Will not rot or deteriorate in moist conditions.
Buried PVC Pipelines Discussion
When pipes are buried underground, loads such as back filled soil, liquid weight inside the pipe and moving vehicles, besides internal pressure, act on them. Though internal pressure acts favourably on the pipe to the deflection of vertical direction, deformation stress by external pressure makes it extremely difficult to find the optimum wall thickness of the pipe to insure safety. The complexities involved are tremendous. As a guide to this problem the following information is offered:
Calculation The earth load on the pipe rests almost entirely on the top 90"
sector of the pipe, and it is the trench width at the top 90" sector of this pipe which determines the total load on the pipe and not the diameter of the pipe itself. Indirectly, the diameter of pipe affects the calculation in that it determines the width of trench excavated to accept the pipe.
The following formula applies in determining the load on the tube, calculated in lbs per foot run of tube.
Load = CWB2
where C is a load coefficient which is dependent on the ratio of depth to width of trench, and the back-filling method which can be determined from the attached graphs. W is the weight of back-fill material in lbs/cu ft, which is normally,
Loam 110 Sand 115 Gravel 125 Sandy or gravelly clay 120 Saturated clay 130
B is the trench width slightly below the top of the pipe, measured in feet.
From the graphs it will be noted that the load coefficient does not increase substantially for ratios between 5 and 10, and remains practically constant above 15. This means that after reaching certain proportions, the back fill tends to support itself against the sides of the trench with further increase in depth.
With a flexible tube, it can be assumed that upon deflection of the pipe section, i.e. from circular to oval, the tube and the side-fills will each carry the same amount of load per unit of width. The calculated vertical load can be determined from the above formula, and is adjusted by multiplying the calculated figure by the ratio of the tube O.D. to the trench width.
In determining the strength of the tube, the Spangler formula for cross-sectional deflection of the flexible pipe under load is as follows :-
d (ins) = f. k. 1. r"
Et3 + 0.732. e. R* where K = bedding constant, which depends on the shape of
the bed underneath the pipe, i.e. whether flat or shaped. These figures are as follows:-
Bedding contact on pipe circumference Constant K 0° 0.110
30° 0.108
45° 0.105 60° 0.102 90° 0.096
120° 0.090 180° 0.083
L = calculated load on pipe in lbs per ft run R = mean radius of pipe in inches E = Modules of elasticity = 500 000 psi for rigid PVC t = tube wall thickness (inches) e = Modules of passine pressure of side fill, and this varies
with the type of back-fill and degree of compaction. It averages between 10 and 15 for wide trenches and untamped back-fill and between 30 and 40 in tamped back-fill in common width vertical side trenches. f = Deflection lag factor which is initially 1, but on final
settling of the back-fill could be taken as between 1.25 and 1.50.
Worked Example A 160 mm Class 6 pipe i.e. 4.7 mm wall suitable for working
pressures of 85 psi is buried in a trench which will be 24" wide at the pipe top, to a depth of 6 feet (to top of pipe) in a compacted sandy loam back-fill, with only a slight shaping of the pipe bed to give circumferential contact of 30°.
(a) Load on pipe L - CWB2
Ratio of depth to width = 72/24 = 3 From the graphs C= 1.9
W = 110 lbs per cu ft L - ±838 lbs.
As flexible tube is involved, the load will be shared by the side fills and the tube, and the vertical load can be adjusted by the ratio of tube O.D. to the trench width.
The load thus becomes 219 lbs, i.e. 838x6.3/24
(b) Deflection Substitute into the formula L = 219 R = 80 mm = 3.15 inches. t = 5.05 mm = 0.198 inches. Assume e = 35 Assume f = 1.50 (max. value) K = 0.108
This gives a deflection of about 0.173 inches, or 2.7%. For flexible pipes, a deflection of approximately 20% can
occur before collapse. In the above example, the installation will work satisfactorily.
Discussion Professor Sumner: Mr. Pithey has, I noticed, made
no mention of America when referring to slot patterns on drainage pipes in other countries.
I saw corrugated piping being laid in California and the amplitude of the corrugations appeared much greater than in the sample shown by Mr. Pithey and the walls seemed thinner.
Is it cheaper to have a thin walled corrugated pipe than a non-corrugated pipe?
Mr. Pithey: Approximately 70% of the cost of manufacture of plastic pipe is for material.
The thinner the wall the cheaper the pipe, but of course there is a loss in mechanical strength.
The cost of a 50 mm pipe is about 5c a foot, or about R17 per acre.
Dr. Gcsnell: In Rhodesia, concrete tiles are about 7 or 8 cents a foot and if we could get plastic tiles at 9 cents a foot or cheaper we would use them. Unless soil is stone free the trench laying machines are not very effective.
134 Proceedings of The South African Sugar Technologists' Association — June 1970
H Y D R A U L I C G R A D I E N T
o> *J tt tp o o o o o
3S5SHKWBKS
Proceedings of The South African Sugar Technologists'" Association — June 1970 135
70 >
O -n
-o m
50 m z o X o m
o
6
. 171
to in
~ j
U l
o o
U l
ns
SAFE WORKING VALUE OF COEFFICIENT *C*
^ * ^ * j r ^
^y v s \ s.
\
: 5
5 E
« -c i—
\ \
\> \"X-lo
w>
_ ^
V -\
\
I
V i^
K
V
1
i
\
\ >
* •4
5 lo
Ig
Is
V
\ \
ft
tt
\
\ >
r-U o
£ ax—
? V
<•
1 K 3 30
5 m
-n-
c >
i
r—
> CO
ON
00
2 r»T -
PIP
m
m
1
136 Proceedings of The South African Sugar Technologists'" Association — June 1970
STOOL POPULATIONS AND YIELD OF SUGARCANE UNDER IRRIGATED CONDITIONS AT PONGOLA
By J. P. BOYCE
South African Sugar Association Experiment Station
Abstract Yield per unit area increased rapidly to a maxi
mum as the number of stools increased, and either remained relatively constant or declined slightly with higher stool densities, depending upon the particular component of yield. The results imply that under favourable growing conditions, maximum yield per unit area can be achieved with relatively low stool populations. There is considerable potential for reducing seedcane requirements and the number of harvestable stalks in irrigated fields. It may also be economically feasible to transplant nursery-grown seedlings into irrigated commercial fields. Comparisons of the yields of isolated stools of different varieties could be misleading because the relative performance of the same varieties can be different at high stool densities.
Introduction The results of row and sett spacing experiments
have been described by Thompson and du Toit10 and Boyce'\ Whilst the relationship between row or sett spacing and crop yield was studied, no attempt was made to specify the number of stools initially established. The number of buds which germinate and form primary shoots may be as few as 50 per cent of the number planted. It was decided therefore to determine the number of stools required to achieve the maximum yield per unit area. An experiment was designed to define the relationship between complete stands of stool populations planted "on the square" and crop yield over a very wide range of treatments. Similar studies for vegetative yields of other crops (Holliday5, Bleasdale2, Jarvis7) have indicated that above a relatively low density, the yield response is likely to be negligible.
The experiment was located at Pongola on the South African Sugar Association Field Station. The soil is a deep sandy clay of the Makatini series, the characteristics of which were described by Thompson and Boyce9. The plant and first ratoon crops were grown over 9- and 12-month periods respectively between 26 October, 1967, and 4 August, 1969.
Treatments The treatments consisted of seven stool densities
established "on the square" and two varieties. These treatments were established with pre-germinated single-bud setts. An extraneous row spacing treatment (S8; N:Co.376) was allotted to two vacant plots on the site. The rows were 144.5 cm apart and were planted with pre-germinated three-bud setts of variety
N:Co.376. The purpose of this S8 treatment was to provide some indication of the relationship between the square spacing treatments and current commercial practice. The treatments were as follows:
(i) Stool populations per hectare
Treatment Code
SI S2 S3 S4 S5 S6 S7 S8;
N : Co.376
Stools per hectare
746 1,912 4,787
12,034 30,480 75,770
192,131
75,770
Square spacing cm
366 229 144 91 57 36 23
144 cm rows
(ii) Varieties
VI : N:Co.376 V2 : C.B.36/14
The population treatments were spaced on a log scale. Successive populations were increased by a factor of 2.5. The upper limit of 192,131 stools per hectare was intended to give a final stalk population consisting mainly of the original primary stalks. The lower limit of 746 stools per hectare was chosen to give minimal inter-stool competition. The two varieties were included to identify population x variety interactions. These particular varieties were chosen because of their different morphological characteristics.
Design and Analysis The experiment consisted of three replications of a
split-plot design with the varieties as whole-plot factors and the seven stool population treatments as sub-plot factors. No particular attention was given to the differences between individual treatment means; what was of interest was the form of the trend of each characteristic with increasing stool density, and not the significance of treatment differences. Since competition was minimal with the SI treatment, no particular population could be safely associated with the yield data for this treatment. For the purpose of describing the form of the trends with increasing density, the data for treatment SI were excluded. Since the variance of the data for treatment SI was similar to that of the other treatments, these data were included in the analyses of variance.
Proceedings of The South African Sugar Technologists'1 Association — June 1970 137
Field Operations Adequate supplies of water and nutrients were
available to the crop. Basal fertilizer applications and top-dressings were broadcast over the entire site. Healthy seedcane was cut into uniform single-bud setts which were treated with insecticide and fungicide before being pre-germinated under wet sacks.
Uniformly pre-germinated setts were planted "on the square" and covered evenly with soil which was then compacted. Irrigation was controlled by means of a profit and loss account system. Weeds were eliminated by means of a herbicide and by hand cultivation when necessary. Complete stands of stools were established by filling gaps with transplants from a separate nursery supply, before competition began.
At harvesting, the dead leaf, green foliage and millable stalk components of the above-ground yield were weighed for the plant crop, but for the first ratoon crop, only the fresh weight of millable stalk was obtained. The moisture contents of sub-samples of the dead leaves, green foliage and millable stalk of the plant crop were determined, so that the results could be expressed on a dry-weight basis. Sub-samples of the millable cane were taken for quality analyses. The stalks were counted and a sub-sample
of the stalks in each plot was measured for lengths and diameters at the bottom, middle and top of each stalk. After harvesting the plant crop, the crop residues were spread over the site and burnt.
Results Dry Matter Production
The results for production of dry matter in the plant crop are plotted graphically in Fig. 1, whilst Table I shows the levels of significance and signs of the trends with increasing stool density.
TABLE I Dry matter (D.M.) production in the plant crop
Levels of significance and signs for trends of characteristics with increasing stool populations per hectare.
Sub-division of S.S. for
treatments S2 toS7
Population S.S.
Population x Variety S.S.
Effects
Linear Quadratic
Linear Quadratic
Total D.M. per hectare
* * * i
***
NS + NS
Stalk D.M. per hectare
***
* + NS
Trash D.M. per
hectare
* * * -L.
NS NS
*** : P < 0.001 ** : P < 0.01 * : P < 0.05
As shown in Fig. 1, the dry matter in stalks and trash, and the total above-ground dry matter increased linearly at first and then at a decreasing rate with increasing density, both linear and quadratic effects being very high significant (P<0.001). For stalk dry matter, the population x variety interaction was significant (P<0.05).
Yield and Quality of Cane The results and summarised statistical analyses for
yield and quality of cane for both plant and first ratoon crops are given in Tables II and III.
In the plant crop, metric (m) tons cane per hectare increased at a decreasing rate with increasing stool density and declined at very high stool densities (P< 0.001), but in the ratoon crop the effect of stool density on the yield of cane was non-significant. In spite of the obvious limitations of the data for the row spacing treatment S8; N:Co.376, the results for this treatment were not very different from the best results achieved with square planting treatments. The population x variety interaction was highly significant for m tons cane per hectare in the plant crop for both linear (P<0.01) and quadratic (P<0.05) effects. This interaction was due to the higher yield of C.B.36/14 than N:Co.376 at low stool densities and the reversal of this situation at higher stool densities. There was no significant interaction in the ratoon crop.
Sucrose per cent cane increased linearly (P<0.001) with increasing density in the plant crop but in the first ratoon crop this effect was less
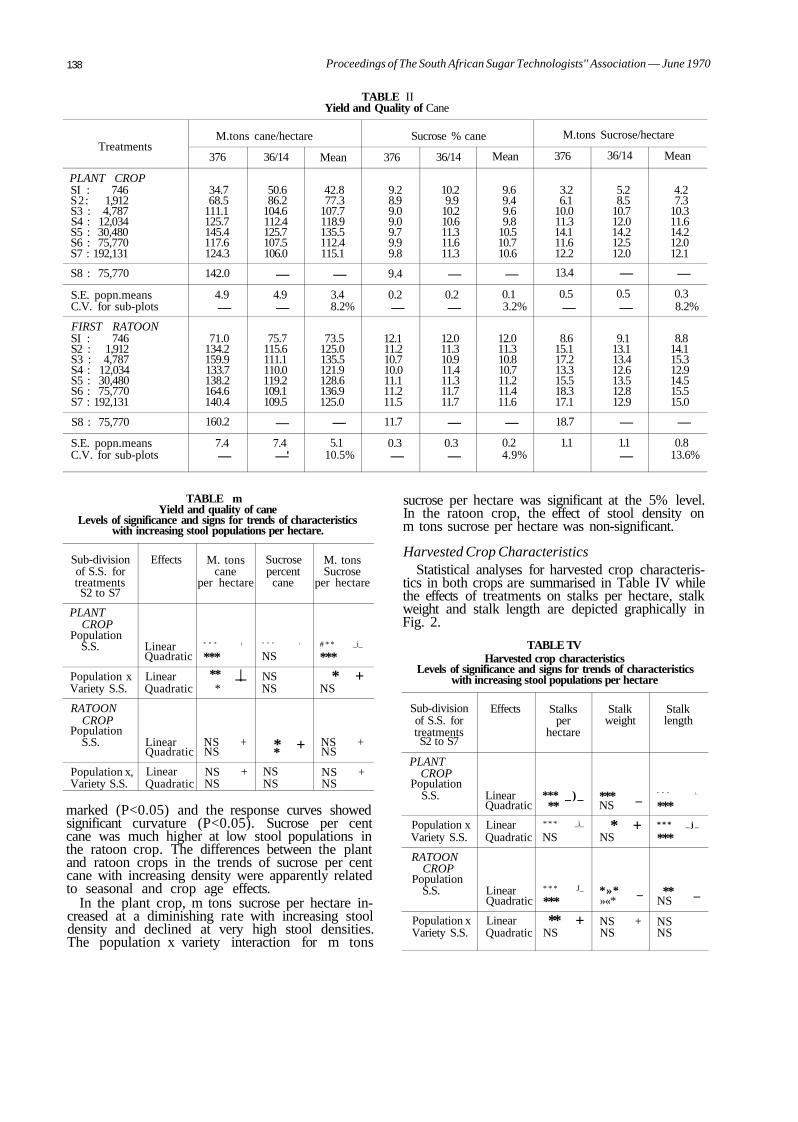
138 Proceedings of The South African Sugar Technologists'' Association — June 1970
Treatments
PLANT CROP SI : 746 S2: 1,912 S3 : 4,787 S4 : 12,034 S5 : 30,480 S6 : 75,770 S7 : 192,131
S8 : 75,770
S.E. popn.means C.V. for sub-plots
FIRST RATOON SI : 746 S2 : 1,912 S3 : 4,787 S4 : 12,034 S5 : 30,480 S6 : 75,770 S7 : 192,131
S8 : 75,770
S.E. popn.means C.V. for sub-plots
TABLE II Yield and Quality of Cane
M.tons cane/hectare
376
34.7 68.5
111.1 125.7 145.4 117.6 124.3
142.0
4.9 —
71.0 134.2 159.9 133.7 138.2 164.6 140.4
160.2
7.4 —
36/14
50.6 86.2
104.6 112.4 125.7 107.5 106.0
—
4.9 —
75.7 115.6 111.1 110.0 119.2 109.1 109.5
—
7.4 —'
Mean
42.8 77.3
107.7 118.9 135.5 112.4 115.1
—
3.4 8.2%
73.5 125.0 135.5 121.9 128.6 136.9 125.0
—
5.1 10.5%
Sucrose % cane
376
9.2 8.9 9.0 9.0 9.7 9.9 9.8
9.4
0.2 —
12.1 11.2 10.7 10.0 11.1 11.2 11.5
11.7
0.3 —
36/14
10.2 9.9
10.2 10.6 11.3 11.6 11.3
—
0.2 —
12.0 11.3 10.9 11.4 11.3 11.7 11.7
—
0.3 —
Mean
9.6 9.4 9.6 9.8
10.5 10.7 10.6
—
0.1 3.2%
12.0 11.3 10.8 10.7 11.2 11.4 11.6
—
0.2 4.9%
M.tons Sucrose/hectare
376
3.2 6.1
10.0 11.3 14.1 11.6 12.2
13.4
0.5 —
8.6 15.1 17.2 13.3 15.5 18.3 17.1
18.7
1.1
36/14
5.2 8.5
10.7 12.0 14.2 12.5 12.0
—
0.5 —
9.1 13.1 13.4 12.6 13.5 12.8 12.9
—
1.1 —
Mean
4.2 7.3
10.3 11.6 14.2 12.0 12.1
—
0.3 8.2%
8.8 14.1 15.3 12.9 14.5 15.5 15.0
—
0.8 13.6%
TABLE m Yield and quality of cane
Levels of significance and signs for trends of characteristics with increasing stool populations per hectare.
Sub-division of S.S. for treatments S2 to S7
PLANT CROP
Population S.S.
Population x Variety S.S.
RATOON CROP
Population S.S.
Population x, Variety S.S.
Effects
Linear Quadratic
Linear Quadratic
Linear Quadratic
Linear Quadratic
M. tons cane
per hectare
* * * i
*** ** _|_ *
NS + NS
NS + NS
Sucrose percent
cane
* * * i
NS
NS NS
* + * NS NS
M. tons Sucrose
per hectare
# * * _i_
***
* + NS
NS + NS
NS + NS
marked (P<0.05) and the response curves showed significant curvature (P<0.05). Sucrose per cent cane was much higher at low stool populations in the ratoon crop. The differences between the plant and ratoon crops in the trends of sucrose per cent cane with increasing density were apparently related to seasonal and crop age effects.
In the plant crop, m tons sucrose per hectare increased at a diminishing rate with increasing stool density and declined at very high stool densities. The population x variety interaction for m tons
sucrose per hectare was significant at the 5% level. In the ratoon crop, the effect of stool density on m tons sucrose per hectare was non-significant.
Harvested Crop Characteristics Statistical analyses for harvested crop characteris
tics in both crops are summarised in Table IV while the effects of treatments on stalks per hectare, stalk weight and stalk length are depicted graphically in Fig. 2.
TABLE TV Harvested crop characteristics
Levels of significance and signs for trends of characteristics with increasing stool populations per hectare
Sub-division of S.S. for treatments S2 to S7
PLANT CROP
Population S.S.
Population x Variety S.S.
RATOON CROP
Population S.S.
Population x Variety S.S.
Effects
Linear Quadratic
Linear Quadratic
Linear Quadratic
Linear Quadratic
Stalks per
hectare
*** _)_ **
* * * _i_
NS
* * * J_
***
** + NS
Stalk weight
*** _ NS
* + NS
*»* _ »«*
NS + NS
Stalk length
* * * i _
*** * * * _ j _
***
** _ NS
NS NS
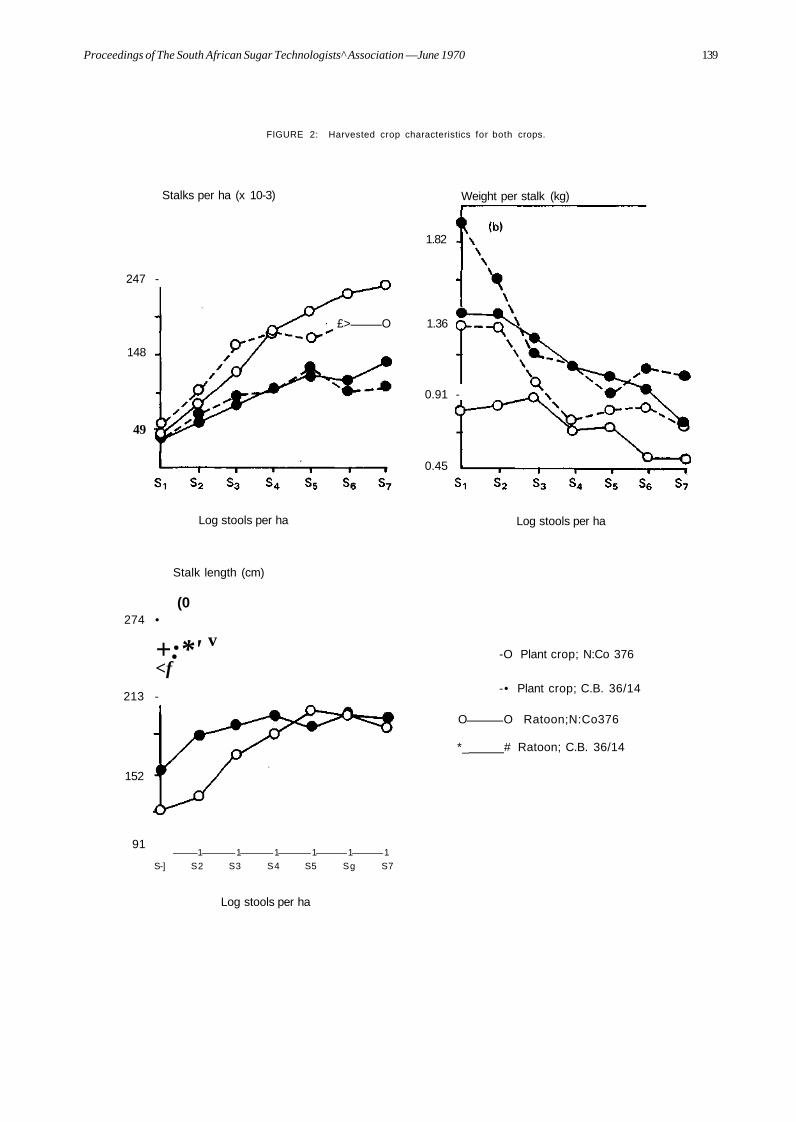
Proceedings of The South African Sugar Technologists^ Association —June 1970 139
FIGURE 2: Harvested crop characteristics for both crops.
Stalks per ha (x 10-3) Weight per stalk (kg)
247 -
148
49
1.82
£> O 1.36
0.91 -
0.45
Log stools per ha Log stools per ha
Stalk length (cm)
274 • (0
<f 213 -
+:*' v
152
91 1 1 1 1 1 1
S-] S2 S3 S4 S5 Sg S7
-O Plant crop; N:Co 376
-• Plant crop; C.B. 36/14
O O Ratoon;N:Co376
*_ # Ratoon; C.B. 36/14
Log stools per ha
140 Proceedings of The South African Sugar Technologists' Association — June 1970
In the plant crop, the number of harvestable stalks per hectare increased at a diminishing rate with increasing stool density. Both the linear (P<0.001) and quadratic (P<0.01) effects were significant. The population x variety interaction for this characteristic was very highly significant (P<0.001). Stalk populations of the varieties were similar at very low densities but the difference increased linearly with increasing densities.
In the first ratoon crop, harvestable stalk populations again increased at a decreasing rate as stool density increased (P<0.001) and the interaction was highly significant (P<0.01). Stalk populations in the ratoon crop were higher at lower densities and lower at higher densities than in the plant crop. Increased stalk populations at lower densities were associated with higher yields in the ratoon compared with the plant crop.
Stalk weights declined linearly (P< 0.001) with increasing density in the plant crop and the population x variety interaction was significant (P<0.05). In the ratoon crop, both linear and quadratic effects were very highly significant (P<0.001), indicating that weight per stalk declined at a diminishing rate as density increased.
Marked effects of density on stalk length were evident. In the plant crop, stalk length increased at a diminishing rate with increasing density (P<0.001). The population x variety interaction was very highly significant (P<0.001), the difference between the two varieties decreasing as density increased.
In the ratoon crop stalk length declined significantly (P<0.01) as density increased, but there was no significant population x variety interaction. The much greater stalk lengths at low densities in the first ratoon crop compared with the plant crop were associated with higher yields at low densities. The stalk lengths for the two varieties were surprisingly similar.
Discussion The results showed that the yield per unit area of
land from stools planted "on the square" increased rapidly to a maximum as density increased and then the yield either remained relatively constant or declined slightly. Thus the indications were that there was little to be gained in terms of cane and sucrose production, from increasing stool populations above a relatively low number per hectare when conditions were favourable for rapid growth. Statistically fitted curves describing the relationship between stool populations and yield are shown in Fig. 3 (Bleas-dale1-a; Farazdaghi and Harris4). The yield/density relationships were very similar for total dry matter, stalk dry matter, and millable cane in the plant and first ratoon crops. The yield response to stool populations exceeding 30,480 per hectare in the plant crop and 1,912 per hectare in the ratoon crop, was either very small or slightly negative. The number of buds planted per hectare in current commercial practice probably ranges from 50,000 to 75,000.
The large discrepancy between the number of stools required to exploit an environment and the number of buds planted in commercial fields, can be attributed mainly to the need to compensate for poor germination and poor distribution of those primary shoots which do survive. The factors causing poor germination and mortality of young shoots are many and diverse, including moisture, temperature and various other soil conditions, quality and treatment of seedcane, disease and insect damage, weed competition, and several cultural practices (Humbert"). With current field practices, the planting of excessive seedcane to ensure that maximum yields are achieved is probably justified under most conditions in the sugar industry. The current recommendation is that there should be a gradual change towards narrower row spacings to a minimum of 0.90 metre wherever soil moisture is not a severe limiting factor, and that setts should be laid continuously in the furrow, and evenly overlapped where conditions for establishment of a crop are adverse.
Whilst the results of the experiment described here refer to square-planted stool populations grown at very high fertility levels, which tend to accentuate lodging, it can be predicted that similar results would be achieved if stools were grown in rows approximately one metre apart. It follows that it may be necessary, in the case of fully irrigated crops, to adhere to the current recommendation that setts should almost invariably be laid continuously in rows. However, the results may not be applicable with widely spaced rows where rectangularity of plant arrangement is extreme ("rectangularity" refers to the ratio of the between - row to the within - row distance).
Furthermore, if as few as 10,000 to 25,000 stools per hectare can produce the maximum yield, then the feasibility of growing seedlings in a nursery and transplanting to the field can be contemplated. Humbert6 referred to "spaced planting" experiments in Hawaii which showed that within 3| months of planting, the leaf canopy of stools spaced five feet apart was as complete as that obtained with continuous-sett planting in rows five feet apart. Humbert6 questioned the necessity for growing large numbers of small stools, but stressed that complete stands are essential for "spaced planting". Nickell8
stated that "properly grown transplants, properly spaced, can out-produce areas planted and raised by current practices—and can drastically reduce 'seed' requirements". Wilson11 considered that effective chemical weed control could eliminate the arguments in favour of the traditional method of planting sugarcane as a row crop, and that engineers would probably experience no major problems designing machines for planting and harvesting the new type of crop. An experiment designed specifically to provide appropriate data is already in progress at Pongola.
The significant population x variety interactions for m tons cane and sucrose per hectare in the plant crop were due to the higher yield of C.B.36/14 at low stool densities than N:Co.376 and the reversal of this
Proceedings of The South African Sugar Technologists' Association June 1970 141
position at higher stool densities. The mean weights of millable cane per stool at three stool densities were as follows:—
Stools/hectare N:Co.376 C.B.36/14 746 46.5 kg 68.0 kg
1,912 35.9 kg 45.1kg 30,480 10.5 kg 9.3 kg
The greater yield of the C.B.36/14 stools at low stool densities was attributed to the more recumbent growth habit and broader leaves of this variety compared with N:Co.376. These morphological features promoted greater light interception at low densities, but were of no apparent advantage at higher densities.
The implication of this population x variety interaction is that comparisons of the yields of isolated stools or low stool densities of different varieties could be misleading. It follows that selection procedures in plant breeding programmes should not be based on the assumption that stools which produce the highest yields when grown in the absence of competition will also produce the highest yields in commercial crop production. It is equally important, however, to guard against the assumption in selection programmes that ability to compete against other varieties is associated with ability to produce maximum yields in commercial fields of a single variety.
Inspection of Fig. 3a shows that competition did not reduce the number of stalks at high densities to the stalk populations which were capable of producing the maximum yields of cane per unit area. This illustrates the capacity of plants to exploit an environment on the one hand, and their ability to survive under conditions of acute competitive stress on the other. However, the increase in harvested stalk numbers with increasing density, did become more gradual at high populations, particularly with variety C.B.36/14 and with the ratoon crop of N:Co.376. In practical terms, the survival of excessive stalk populations with little or no increase in yield, simply increases handling costs.
The increase in stalk length with increasing density was associated with increasing yield but was also due to the fact that the stools were planted "on the square" rather than in rows. With cane planted in rows, inter-stool competition commences within rows at the same time regardless of the row spacing, whereas with square-planted crops, competition begins later at lower stool densities. During the growth of the plant crop, there were marked differences in stalk height due to population treatments. The onset of rapid stalk elongation corresponded with the commencement of inter-stool competition.
The highly significant population x variety interaction for stalk length in the plant crop arose because the varieties had similar stalk lengths at high stool densities. Even in the ratoon crop, the stalk lengths for the varieties were surprisingly similar over a wide range of stool densities. When grown in rows at high densities, C.B.36/14 is normally much taller than N:Co.376, possibly because competition is more intense within rows than between stools arranged "on the square".
Future research in this field should be aimed towards decreasing the amount of seedcane planted and the number of stalks harvested. This conclusion is consistent with the finding that, under irrigated conditions, the potential for reducing seedcane requirements and the number of harvestable stalks is considerable. Knowledge of the number of stools required to exploit an environment is the first step towards the ideal; that is, to establish a complete stand of the optimum number of stools, whilst maintaining maximum economic returns.
Acknowledgements The co-operation and advice of Mr. M. G. Mur
doch concerning the statistics is gratefully acknowledged.
The results discussed in this paper are being used for post-graduate work in the Department of Crop Science at the University of Natal.
References 1. Bleasdale, J. K. A., 1966. Plant growth and crop yield.
Ann. Appl. Biol. 57, 173-182. 2. Bleasdale, J. K. A., 1967. The relationship between the
weight of a plant and total weight as affected by plant density. J. Hort Sci. 42, 51-58.
3. Boyce, J. P., 1968. Plant crop results of a row spacing experiment at Pongola. Proc. S. Afr. Sug. Technol. Assoc, 42, 136-142.
4. Farazdaghi, R, and Harris, P. M., 1968. Plant competition and crop yield. Nature 217, 289-290.
5. Holliday, R., 1960. Plant population and crop yield. Field Crop Abstr. 13, 159-167 and 247-254.
6. Humbert, R. P., 1968. The growing of sugarcane. Spaced planting. Elsevier Publishing Co., Amsterdam, London, New York. 118.
7. Jarvis, R. H., 1962. Studies on lucerne and lucerne-grass leys. V. Plant population studies with lucerne. J. Agri. Sci. 59,281-286.
8. Nickell, L. G., 1967. Results of transplanting-spacing tests. Ann. Rep. Haw. Sug. Plant Assoc. 15.
9. Thompson, G. D., and Boyce, J. P., 1968. The plant crop results of two irrigation experiments at Pongola. Proc. S. Afr. Sug. Technol. Assoc. 42, 143-153.
10. Thompson, G. D., and du Toit, J. L., 1965. The effects of row spacing on sugarcane crops in Natal. Proc. Int. Soc. Sugar Cane Technol. 12, 103-111.
11. Wilson, 1., 1968. Increasing sugarcane yields. Cultural practices. Proc. Int. Soc. Sug. Cane Technol. 13, 31-37.
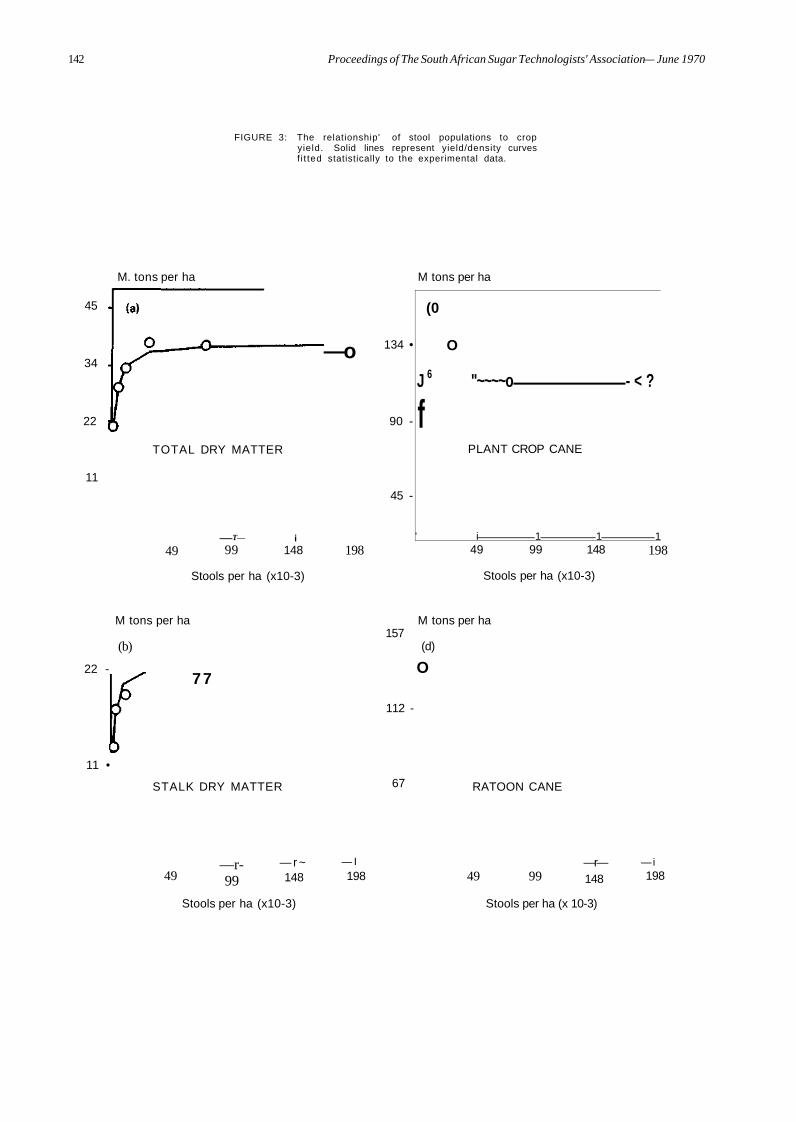
142 Proceedings of The South African Sugar Technologists' Association — June 1970
FIGURE 3: The relationship' of stool populations to crop yield. Solid lines represent yield/density curves f i t ted statistically to the experimental data.
M. tons per ha
45
34
22
11
—o
TOTAL DRY MATTER
49 T—
99 i
148
134 •
90 -
45 -
M tons per ha
(0
O
J 6 "~~~~o - < ?
f PLANT CROP CANE
' i 1 1 1 198
Stools per ha (x10-3)
49 99 148
Stools per ha (x10-3)
198
M tons per ha
22 -
11 •
157 (b)
77
M tons per ha
(d)
O
STALK DRY MATTER
112 -
67
49 —r-99
— r ~ 148
— I 198
RATOON CANE
—r— 148
Stools per ha (x10-3)
49 99
Stools per ha (x 10-3)
—i 198

Proceedings of The South African Sugar Technologists'1 Association —
Discussion Dr. Shuker (in the chair): With the increased width
of spacing between your stools there was presumably some variation in frequency of weeding. Did you have a record of this?
Mr. Boyce: We used a herbicide to eliminate weeds completely at the beginning and all plots were maintained weed-free throughout in this experiment.
Mr. Odendaal: What is the difference between pre-germinated setts and seedlings?
Mr. Boyce: The seedling were grown in a nursery and then transplanted in the field. The single-bud setts were planted directly into the field as shown in the slide.
Mr. Wise: Would these same conclusions apply to dry land conditions, where competition for moisture would be greater than for irrigated conditions?
Mr. Boyce: It would depend on how dry conditions were. I have limited my remarks to irrigated conditions because the relationship between stool population and yield is based on the ability of individual stools at low population to "catch up" and they must have a sufficiently long period of growth to do so.
Mr. Pearson: In our experiments under dry land conditions water was the important factor. With wide spacing we grew the same tonnage as we did with continuous rows.
— June 1970 143
Mr. Bartlett: I think the results of these experiments will have an effect on mechanising, or rather on minimising mechanising.
Regarding mechanisation, some hold that there should be as many stools as possible per acre and that a machine would first flatten the cane and then cut it and lift it onto a chopper type harvester. But today most consideration is being given to a harvesting on a row crop, with the object of reducing the work load.
On certain of our steep lands we will never use machines. At present we plant in 3' 9" to 4' row spacing in continuous rows. One object is to obtain canopy as soon as possible. Could not the spacing be 2' but not with a continuous row, so as to get a quicker canopy?
Mr. Boyce: In an experiment at Pongola, we have closer rows and different sett spacings within the row. Stool distribution is improved by reducing the row spacing and increasing the distance between setts within the row.
However, it is essential to achieve an adequate population of stools by taking into account the risk of poor germination when planting with normal setts.
Dr. Thompson: By increasing sett spacing, you will increase the weed problem within the rows, so I think it is important to achieve an adequate row population.

144 Proceedings of The South African Sugar Technologists'1 Association — June 1970
THE TONGAAT FIELD DIARY - A USEFUL MANAGEMENT TOOL
By J. N. S. HILL
The Tongaat Sugar Company, Limited
Abstract This paper describes a system for recording labour,
material and machine usage on all operations concerned with sugar cane husbandry at Tongaat. It involves the use of a daily diary from which the information from one copy of each day's recorded activities is forwarded to a computer bureau, the other copy remaining in the field office. After processing, monthly cost reports are received from the computer which aid in budget control and in centralised field management. Some of the results of this system are briefly reported.
Introduction Prior to April 1966, the company's system for record
ing and distributing labour and machine costs was based on the labour unit ticket and tractor return form. A ticket for each unit of labour employed was sent in daily to the compound office and had written on it the cost centre (job number), indicating the work done by the unit the previous day. Similarly, fuel usage returns equating to tractor hours worked were delivered to the clerical staff and the work done by each machine was costed. These labour-unit tickets were used for pay purposes and for costing records, both exercises being calculated and written up manually. The so-called monthly cost report was presented some six to eight weeks after the end of the month and therefore lost a lot of its impact. Furthermore, with growing size of the agricultural division at Tongaat and the desire to have more accurate and meaningful records, it became necessary to investigate the whole system and to improve both the details supplied and the time lag in the presentation of the reports.
The writer and his colleagues at Tongaat therefore designed a system, based on a daily diary, which achieved both objectives. This system is described below :-
The Daily Diary A copy of the daily diary is presented in Figure 1.
It is simply a preprinted form showing operations and cost centres (in rows) and materials, men and machines (in columns).
Thus, if a section, area or estate is involved on a particular day with harvesting, infield transport, land preparation, planting, cultivation, road maintenance and general work around headquarters, the numbers of labour units, fertiliser bags, tractors or mules used are entered in the appropriate spaces. One copy remains on the section as a diary, and the other is sent to a central office handling cost records, wages and paybook matters. The month's total copies from all departments are firstly summarised into a form
suitable for punch card entry and, secondly, paybook details (book number, rate of pay, etc.) are entered on to them before they are forwarded to the computer bureau. The computer then sorts these returns into (a) cost centre (operation number) order for cost control purposes, and (b) into paybook order for wage purposes. On return from the bureau, the accounts department summarises (a) into a monthly cost report which includes the corresponding budget values for each operation and department.
In assigning job numbers (cost centres) to particular operations it is necessary to define operations quite clearly in terms of movements involved, time of operation and relationship to the methods used. The definitions used are presented below :-
Preparation This includes all operations concerned with the pre
paration of the soil to a state suitable for replanting sugar cane, including labour used to singe trash from the previous crop and until the final tilth has been achieved. These include at Tongaat :-
(i) Singeing trash, (ii) Subsoiling or ripping,
(iii) Ploughing, (iv) Harrowing or rotavating, (v) Drainage or conservation, (vi) Bush clearing (breaking in new ground), (vii)Filtercake handling and spreading.
Planting All operations concerned with replanting a field to
sugar cane. These include :-(i) Drawing and preparing furrows, including any
•marking involved and fertilising, (ii) Cutting, transporting, trashing, chopping and
dipping the cane setts, (iii) Actual planting, i.e. placement of setts in the
furrows and covering with soil.
Cultivation All operations concerned with the husbandry of the
crop between the time of planting (or harvesting in the case of a ratoon crop) and the time of harvesting the following crop. These include :-
(i) Hand weeding, (ii) Herbicides, (iii) Cultivating, either by tractor or mule scarifiers, (iv) Trash management, including the cleaning of
drains and installation of additional drains in ratoon fields,
(v) Fertiliser application.
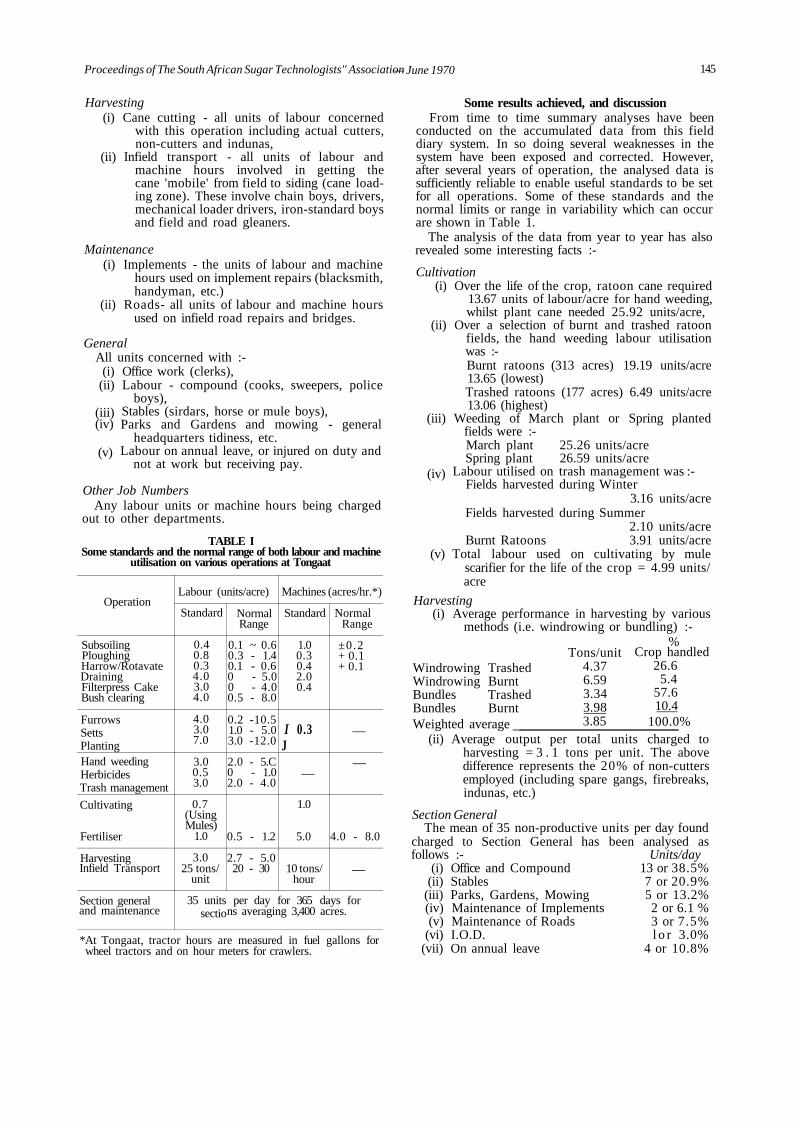
Proceedings of The South African Sugar Technologists'' Association — June 1970 145
Harvesting (i) Cane cutting - all units of labour concerned
with this operation including actual cutters, non-cutters and indunas,
(ii) Infield transport - all units of labour and machine hours involved in getting the cane 'mobile' from field to siding (cane loading zone). These involve chain boys, drivers, mechanical loader drivers, iron-standard boys and field and road gleaners.
Maintenance (i) Implements - the units of labour and machine
hours used on implement repairs (blacksmith, handyman, etc.)
(ii) Roads- all units of labour and machine hours used on infield road repairs and bridges.
General All units concerned with :-
(i) Office work (clerks), (ii) Labour - compound (cooks, sweepers, police
boys), Stables (sirdars, horse or mule boys), Parks and Gardens and mowing - general
headquarters tidiness, etc. Labour on annual leave, or injured on duty and
not at work but receiving pay.
(iii) (iv)
(v)
Other Job Numbers Any labour units or machine hours being charged
out to other departments.
TABLE I Some standards and the normal range of both labour and machine
utilisation on various operations at Tongaat
Operation
Subsoiling Ploughing Harrow/Rotavate Draining Filterpress Cake Bush clearing
Furrows Setts Planting Hand weeding Herbicides Trash management
Cultivating
Fertiliser
Harvesting Infield Transport
Section general and maintenance
Labour (units/acre)
Standard
0.4 0.8 0.3 4.0 3.0 4.0
4.0 3.0 7.0
3.0 0.5 3.0
0.7 (Using Mules)
1.0
3.0 25 tons/
unit
35 units sectio
Normal Range
0.1 ~ 0.6 0.3 - 1.4 0.1 - 0.6 0 - 5.0 0 - 4.0 0.5 - 8.0
0.2 -10.5 1.0 - 5.0 3.0 -12.0
2.0 - 5.C 0 - 1.0 2.0 - 4.0
0.5 - 1.2
2.7 - 5.0 20 - 30
Machines (acres/hr.*)
Standard
1.0 0.3 0.4 2.0 0.4
I 0.3 J
—
1.0
5.0
10 tons/ hour
Normal Range
±0.2 + 0.1 + 0.1
—
—
4.0 - 8.0
—
per day for 365 days for ns averaging 3,400 acres.
Some results achieved, and discussion From time to time summary analyses have been
conducted on the accumulated data from this field diary system. In so doing several weaknesses in the system have been exposed and corrected. However, after several years of operation, the analysed data is sufficiently reliable to enable useful standards to be set for all operations. Some of these standards and the normal limits or range in variability which can occur are shown in Table 1.
The analysis of the data from year to year has also revealed some interesting facts :-
Cultivation (i) Over the life of the crop, ratoon cane required
13.67 units of labour/acre for hand weeding, whilst plant cane needed 25.92 units/acre,
(ii) Over a selection of burnt and trashed ratoon fields, the hand weeding labour utilisation was :-Burnt ratoons (313 acres) 19.19 units/acre 13.65 (lowest) Trashed ratoons (177 acres) 6.49 units/acre 13.06 (highest)
(iii) Weeding of March plant or Spring planted fields were :-March plant 25.26 units/acre Spring plant 26.59 units/acre
Labour utilised on trash management was :-Fields harvested during Winter
3.16 units/acre Fields harvested during Summer
2.10 units/acre Burnt Ratoons 3.91 units/acre
(v) Total labour used on cultivating by mule scarifier for the life of the crop = 4.99 units/ acre
Harvesting (i) Average performance in harvesting by various
methods (i.e. windrowing or bundling) :-%
(iv)
Tons/unit 4.37 6.59 3.34 3.98 3.85
Crop handled 26.6
5.4 57.6 10.4
100.0%
*At Tongaat, tractor hours are measured in fuel gallons for wheel tractors and on hour meters for crawlers.
Windrowing Trashed Windrowing Burnt Bundles Trashed Bundles Burnt Weighted average
(ii) Average output per total units charged to harvesting = 3 . 1 tons per unit. The above difference represents the 20% of non-cutters employed (including spare gangs, firebreaks, indunas, etc.)
Section General The mean of 35 non-productive units per day found
charged to Section General has been analysed as follows :- Units/day
(i) Office and Compound 13 or 38.5% (ii) Stables 7 or 20.9%
(iii) Parks, Gardens, Mowing 5 or 13.2% (iv) Maintenance of Implements 2 or 6.1 % (v) Maintenance of Roads 3 or 7.5%
(vi) I.O.D. l o r 3.0% (vii) On annual leave 4 or 10.8%

146 Proceedings of The South African Sugar Technologists' Association fune 1970
THE TONGAAT SUGAR COMPANY, LIMITED.
FIELDS DIARY & DAILY LABOUR DISTRIBUTION
OPERATION
PREPARATION •
Sub*oiling
Ploughing
Hwrow, Rotovata-
O'ainino
F l l t . r Cok«
Bt»h CLor ina <*><:.
PLANTING
Planting
CULTIVATION Monal W««dlnp
M*rble|d*i
Cult ivating
Trash Monegamvnt
HARVESTING Cutting
MAINTENANCE Implantants
Road*
GENERAL 0 ' f le« . Compound
S'obUt
Pks. Gdn». Mowing
l-O.D.
L»ov«
Op.
On.
01
02
03
04
05
06
11
13
13
...?!.
22
23
24
31
41
51
52
o l
62
63
64
65
FIELD
No. Nam-
f
OTHER JOB NUMBERS
RAINFALL
A e r . i / T o n .
(Bagi )
LABOUR UNITS
P-rm.
i
SUB T O T A L - U N I T S PAID Si eli
Absent
TOTAL LABOUR S TRE 4GTH (As • * with C W k L i * 0
Mifl. Togt
Hor.e*
& Mul«s
TRACTOR
No.
' '
Hours
|
REMARKS
|
1 I
1
| i 1 1
J
1 ' I
] i 1 1
SECTION MANAGER
FIGURE

Proceedings of The South African Sugar Technologists' Association — June 1970 147
The figures presented above do not necessarily apply to other farms or estates where management or conditions are different. They are presented merely to illustrate the usefulness of the diary in supplying information about both labour performance on certain operations and labour and/or machine utilisation over the season.
Records which supply the above information can play a vital role in farm management. Not only are yield records and, say, fertiliser, rainfall, irrigation and other crop data important, but facts about labour and machine effort put into various fields to result in the measured yield, help enormously in planning future budgets and making management decisions. It is also, in fact, believed that only when such records as these are available, can sound decisions and judgement be made on when and where to mechanise.
This system has operated for almost five years and is at present being reviewed. More detailed information and reports are being considered. A field history on file in the computer is being developed and a system of exception reporting to field management (using the data presented in Table 1) on labour, machine and material utilisation, and costs, is currently being devised.
The ultimate objective is to have available on request analyses of crop yield factors, field profitability, operation method analysis and also computerised routine reports on harvesting, crop estimates, etc. It is believed that with this information readily available, decisions such as "when to replant", "how to prepare the soil", "what to do in restriction", will be more easily made, whilst accurate budgeting, crop and expenditure forecasts and action needed to improve performances will be soundly guided. In short, a field diary can be developed into an extremely useful management tool.
Discussion Mr. de Robillard: The cost of irrigation is not
mentioned in the paper. Will the field diary give allocation of labour per
hectare for budget purposes? Dr. Hill: Irrigation is taken into account, but not
in the field diary as it would make it too complicated. We have a similar sheet for other departments, in
cluding irrigation. Irrigation is controlled from a centralised depart
ment at Tongaat and they keep their own diaries. Information kept about irrigation of various blocks will be incorporated in the new diary I have mentioned previously. The information will be stored in the computer so that we can analyse yield factors pertaining to a particular field when required.
We are now able to set a budget for labour because we have established standards to work on. The standards will, of course, be modified for difficult areas.
Mr. Andries: Costing machines in hours is always difficult.
How does Tongaat relate the hours recorded against each machine?
Dr. Hill: We use a fuel hour system on all wheel tractors.
If. for example, a Massey Ferguson 35 Ls used on cultivation, at the end of the day it is filled with fuel
and the amount is recorded against the tractor number and the field number in which it was used.
The hour meters fitted to wheel-type tractors were found to be most unreliable.
We have found that most wheel tractors use about one gallon of dieseline per hour.
We do use hour meters on our fewer crawler tractors.
Mr. Bartlett: The figures are most valuable and it would be interesting to have comparisons from other estates.
On one of our estates, for windrowing burnt cane the average to date is 10.90 compared to Tongaat's 6.59, but we may, of course, be using a different basis of comparison.
These figures should help us to determine accurately the cost of various tasks.
We tend to regard weeding labour as cheap. At 19 units per acre, each at 50c, the cost of weeding is R9.50 per acre. At a yield 40 tons per acre the cost is approximately 25c per ton.
It is possible we may be underestimating the value of certain tasks.
As cane cutters can earn a bonus, why should not weeders?
I would like to record that Illovo has had a cutter who has cut 33 metric tons of cane in a day, following up the next day with 30 tons and that a team of six cutters in a section averaged 20 metric tons a day each.
Mr. Browne: You are using a computer for recording information, but are you also using it for management decisions?
Dr. Hill: At the moment we are only using it for that purpose in the engineering field, but we will be using it for management decisions when the new sophisticated input form is ready. We will then get full value from the computer.
Mr. Stewart: We feel a tractor should be booked out with the hours it is away from its base, even though during the period it might have been standing idle for a time. This gives an idea of total utilisation of the tractors on the estate.
On our daily report only prime data is entered so that minimum calculations are made by the estate. The diary goes to the computer and the information is accumulated in memory until the field is harvested.
Information on the exact labour used in particular operations in a field is then available and is useful to the estate manager.
Dr. Hill: I do not completely agree with you on these two points.
If you have one tractor on mowing and one on ploughing, both may be out for twelve hours and with your system would give the impression of having done the same amount of work, whereas the one ploughing would have done much harder work and used more fuel. The best method of ensuring maximum utilisation is by personal control, and inspection, which is why we have managers.
We use our diary also for cost control purposes and it is kept as a permanent record in the field office and is often referred to.
If information is withheld by having it stored in the computer the diary cannot be used for budget allocation of particular operations.
Proceedings of The South African Sugar Technologists' Association — June 1970
THE RESULTS OF PRE-EMERGENCE HERBICIDE SCREENING TRIALS FOR SUGARCANE IN NATAL
By F. E. RICHARDSON
South African Sugar Association Experiment Station
Abstract The results of seven pre-emergence herbicide
screening trials involving 27 chemicals are presented. The experiments, which were conducted over a four-year period, differed with respect to soil moisture conditions, soil type and prevailing weed flora. Special attention was directed to the control of Cyperus esculentus, C. rotundus and grasses. Mean visual assessments of control of species or species-group are presented for each experiment. Two chemicals, C.P.50144 (Alachlor) and C.P.44939 gave consistently good results. C.P.50144 had a wide spectrum of broad-leaf weed and grass control, the latter being excellent even under relatively dry conditions. The product was also active on C. esculentus. No phytotoxicity to sugarcane from C.P.50144 was recorded. C.P.44939 gave outstanding control of C. esculentus, C. rotundus and the grasses, including Panicum maximum. Phytotoxicity to cane has not been fully evaluated.
Introduction The use of herbicides for pre-emergent weed con
trol in the South African sugar industry has steadily increased since 1961. The phenoxyacetic acids, primarily in the form of 2, 4-D amine, are the most important group of chemical weedkillers currently recommended for controlling a wide range of germinating annual grass and broad-leaf weeds. The present usage of this group exceeds 100 000 kg acid equivalent per annum, a figure that continues to rise each year and which indicates that satisfactory results continue to be obtained.
Unfortunately, the phenoxyacetic acids do not usually give any pre-emergent control of the important watergrass species Cyperus esculentus and C. rotundus. Satisfactory grass control is often dependent upon an optimum soil moisture status during and immediately after application. Screening trials are regularly conducted on selected new formulations in the search for a herbicide having a wider spectrum of activity, a longer period of control and being less dependent on soil moisture conditions.
It is unlikely that a recently developed herbicide would compete immediately with 2,4-D on a price basis, but there are large areas within the industry where an effective, more expensive product might be valuable. The results of previous pre-emergence screening trials have been reported up to 19651 ' a-3 ' *•a. This paper presents the results of seven pre-emergence herbicide screening trials carried out between 1966 and 1970.
Materials and Methods The experiments are described and discussed indi
vidually but the techniques of herbicide application and assessment were common to all experiments. Full cover herbicide treatments were applied using a "Platz Frankonia" knapsack fitted with a "Spraying Systems" T.K.2.5 floodjet and a constant pressure valve. The pace of the operator was maintained so that approximately 280 litres per hectare were delivered at a pressure of 2.1 kg/cm2, with the floodjet held 50 cm above the ground.
Visual scorings of weed control were carried out in the experiments using a scale of 0(=No weed control) to 9(=complete weed control). A score of 7 on this scale reflects adequate weed control such that further operations are not immediately necessary. Absolute values may vary according to the assessor but over a period of time a reliable assessment of the efficacy of a product relative to that of other products is obtained. Where the individual species were not uniformly distributed assessments of total weed cover were made. The preferred method, however, was by species or species-group (e.g. broad-leaf, grasses), because the selective herbicides used frequently altered the pattern and rapidity of succession, a species or species-group becoming dominant in the absence of any competitors.
Technical details of the herbicides used are given in Appendix I.
Experiments I and II Description
The experiments were similar in design and contained the same treatments, but different in soil type, weed flora and water regime. Both were of a randomised block design with a plot size of 0.004 hectares, but treatments were replicated four times in Experiment I and six times in Experiment II.
Experiment I This was conducted at Chaka's Kraal Experimental
Farm on a Dwyka sandy loam. Setts of variety N:Co.376 were planted in October 1966, the crop being harvested 12 months later. Immediately after planting, the herbicides of low solubility were applied, after which the site received 25 mm of water by means of overhead irrigation. The more soluble herbicides were then applied. For the duration of the experiment supplementary irrigation was used to ensure that the soil moisture deficit did not exceed 25 mm.
The weed flora that developed in control plots con-
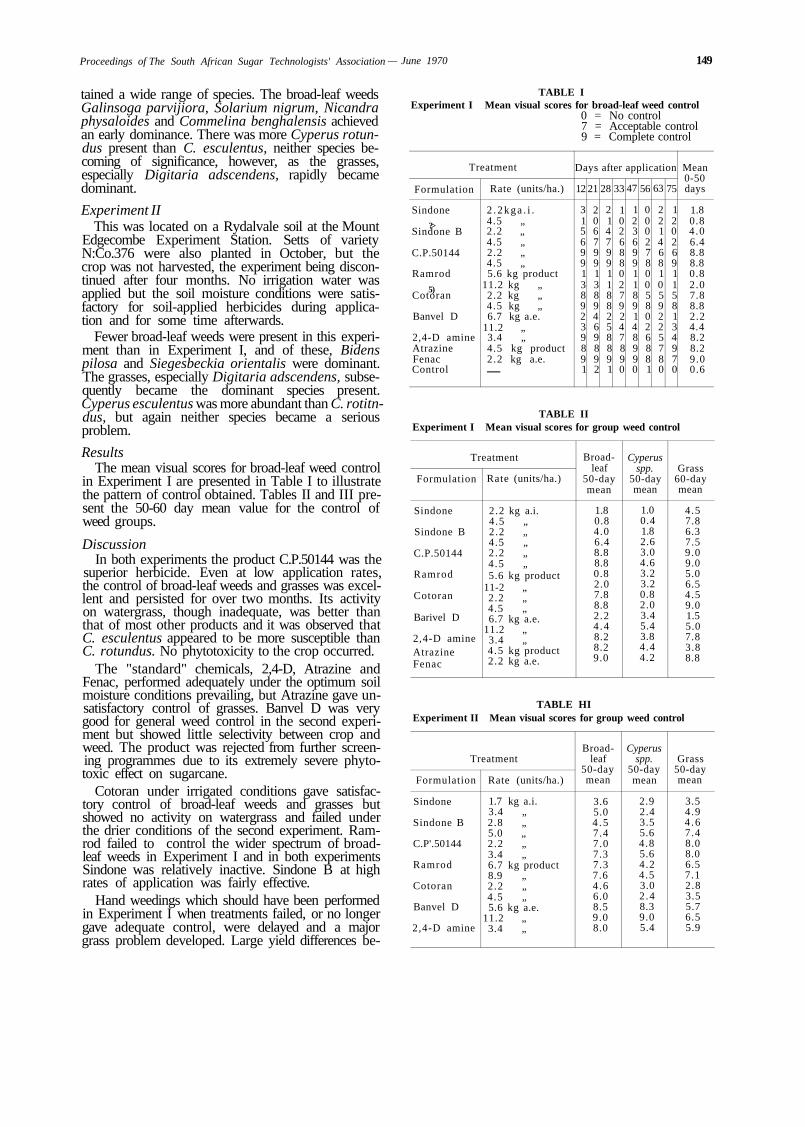
Proceedings of The South African Sugar Technologists' Association — June 1970 149
tained a wide range of species. The broad-leaf weeds Galinsoga parvijiora, Solarium nigrum, Nicandra physaloides and Commelina benghalensis achieved an early dominance. There was more Cyperus rotun-dus present than C. esculentus, neither species becoming of significance, however, as the grasses, especially Digitaria adscendens, rapidly became dominant.
Experiment II This was located on a Rydalvale soil at the Mount
Edgecombe Experiment Station. Setts of variety N:Co.376 were also planted in October, but the crop was not harvested, the experiment being discontinued after four months. No irrigation water was applied but the soil moisture conditions were satisfactory for soil-applied herbicides during application and for some time afterwards.
Fewer broad-leaf weeds were present in this experiment than in Experiment I, and of these, Bidens pilosa and Siegesbeckia orientalis were dominant. The grasses, especially Digitaria adscendens, subsequently became the dominant species present. Cyperus esculentus was more abundant than C. rotitn-dus, but again neither species became a serious problem.
Results The mean visual scores for broad-leaf weed control
in Experiment I are presented in Table I to illustrate the pattern of control obtained. Tables II and III present the 50-60 day mean value for the control of weed groups.
Discussion In both experiments the product C.P.50144 was the
superior herbicide. Even at low application rates, the control of broad-leaf weeds and grasses was excellent and persisted for over two months. Its activity on watergrass, though inadequate, was better than that of most other products and it was observed that C. esculentus appeared to be more susceptible than C. rotundus. No phytotoxicity to the crop occurred.
The "standard" chemicals, 2,4-D, Atrazine and Fenac, performed adequately under the optimum soil moisture conditions prevailing, but Atrazine gave unsatisfactory control of grasses. Banvel D was very good for general weed control in the second experiment but showed little selectivity between crop and weed. The product was rejected from further screening programmes due to its extremely severe phyto-toxic effect on sugarcane.
Cotoran under irrigated conditions gave satisfactory control of broad-leaf weeds and grasses but showed no activity on watergrass and failed under the drier conditions of the second experiment. Ramrod failed to control the wider spectrum of broad-leaf weeds in Experiment I and in both experiments Sindone was relatively inactive. Sindone B at high rates of application was fairly effective.
Hand weedings which should have been performed in Experiment I when treatments failed, or no longer gave adequate control, were delayed and a major grass problem developed. Large yield differences be-
TABLE I Experiment I Mean visual scores for broad-leaf weed control
0 = No control 7 = Acceptable control 9 = Complete control
Treatment
Formulation
Sindone
?> Sindone B
C.P.50144
Ramrod
5) Cotoran
Banvel D
2,4-D amine Atrazine Fenac Control
Rate (units/ha.)
2 . 2 k g a . i . 4.5 „ 2.2 „ 4.5 „ 2.2 „ 4.5 „ 5.6 kg product
11.2 kg „ 2.2 kg „ 4.5 kg „ 6.7 kg a.e.
11.2 „ 3.4 „ 4.5 kg product 2.2 kg a.e. —
Days after application
12
3 1 5 6 9 9 1 3 8 9 2 3 9 8 9 1
21
2 0 6 7 9 9 1 3 8 9 4 6 9 8 9 2
28
2 1 4 7 9 9 1 1 8 8 2 5 8 8 9 1
33
1 0 2 6 8 8 0 2 7 9 2 4 7 8 9 0
47
1 2 3 6 9 9 1 1 8 9 1 4 8 9 9 0
56
0 0 0 2 7 8 0 0 5 8 0 2 6 8 8 1
63
2 2 1 4 6 8 1 0 5 9 2 2 5 7 8 0
75
1 2 0 2 6 9 1 1 5 8 1 3 4 9 7 0
Mean 0-50 days
1.8 0.8 4 .0 6.4 8.8 8.8 0.8 2.0 7.8 8.8 2.2 4.4 8.2 8.2 9.0 0.6
TABLE II Experiment I Mean visual scores for group weed control
Treatment
Formulation
Sindone
Sindone B
C.P.50144
Ramrod
Cotoran
Barivel D
2,4-D amine Atrazine Fenac
Rate (units/ha.)
2.2 kg a.i. 4 .5 „ 2.2 „ 4.5 „ 2 .2 „ 4 .5 „ 5.6 kg product
11-2 „ 2.2 „ 4.5 „ 6.7 kg a.e.
11.2 „ 3.4 „ 4 .5 kg product 2.2 kg a.e.
Broad-leaf
50-day mean
1.8 0.8 4.0 6.4 8.8 8.8 0.8 2.0 7.8 8.8 2.2 4 .4 8.2 8.2 9.0
Cyperus spp.
50-day mean
1.0 0.4 1.8 2.6 3.0 4.6 3.2 3.2 0.8 2.0 3.4 5.4 3.8 4.4 4.2
Grass 60-day mean
4.5 7.8 6.3 7.5 9.0 9.0 5.0 6.5 4.5 9.0 1.5 5.0 7.8 3.8 8.8
TABLE HI Experiment II Mean visual scores for group weed control
Treatment
Formulation
Sindone
Sindone B
C.P'.50144
Ramrod
Cotoran
Banvel D
2,4-D amine
Rate (units/ha.)
1.7 kg a.i. 3.4 „ 2.8 „ 5.0 „ 2.2 „ 3.4 „ 6.7 kg product 8.9 „ 2.2 „ 4.5 „ 5.6 kg a.e.
11.2 „ 3.4 „
Broad-leaf
50-day mean
3.6 5.0 4 . 5 7.4 7.0 7.3 7.3 7.6 4 .6 6.0 8.5 9.0 8.0
Cyperus spp.
50-day mean
2.9 2.4 3.5 5.6 4.8 5.6 4.2 4.5 3.0 2 .4 8.3 9.0 5.4
Grass 50-day mean
3.5 4.9 4 .6 7.4 8.0 8.0 6.5 7.1 2.8 3.5 5.7 6.5 5.9
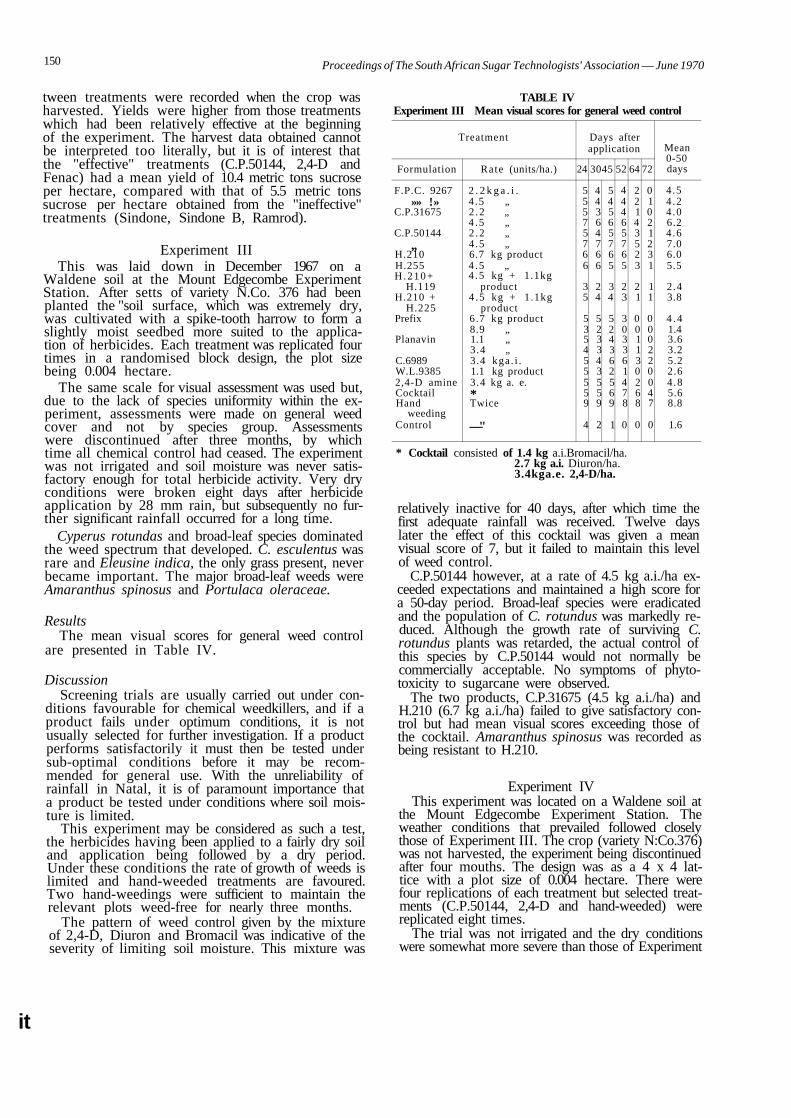
150 Proceedings of The South African Sugar Technologists' Association — June 1970
tween treatments were recorded when the crop was harvested. Yields were higher from those treatments which had been relatively effective at the beginning of the experiment. The harvest data obtained cannot be interpreted too literally, but it is of interest that the "effective" treatments (C.P.50144, 2,4-D and Fenac) had a mean yield of 10.4 metric tons sucrose per hectare, compared with that of 5.5 metric tons sucrose per hectare obtained from the "ineffective" treatments (Sindone, Sindone B, Ramrod).
Experiment III This was laid down in December 1967 on a
Waldene soil at the Mount Edgecombe Experiment Station. After setts of variety N.Co. 376 had been planted the "soil surface, which was extremely dry, was cultivated with a spike-tooth harrow to form a slightly moist seedbed more suited to the application of herbicides. Each treatment was replicated four times in a randomised block design, the plot size being 0.004 hectare.
The same scale for visual assessment was used but, due to the lack of species uniformity within the experiment, assessments were made on general weed cover and not by species group. Assessments were discontinued after three months, by which time all chemical control had ceased. The experiment was not irrigated and soil moisture was never satisfactory enough for total herbicide activity. Very dry conditions were broken eight days after herbicide application by 28 mm rain, but subsequently no further significant rainfall occurred for a long time.
Cyperus rotundas and broad-leaf species dominated the weed spectrum that developed. C. esculentus was rare and Eleusine indica, the only grass present, never became important. The major broad-leaf weeds were Amaranthus spinosus and Portulaca oleraceae.
Results The mean visual scores for general weed control
are presented in Table IV.
Discussion Screening trials are usually carried out under con
ditions favourable for chemical weedkillers, and if a product fails under optimum conditions, it is not usually selected for further investigation. If a product performs satisfactorily it must then be tested under sub-optimal conditions before it may be recommended for general use. With the unreliability of rainfall in Natal, it is of paramount importance that a product be tested under conditions where soil moisture is limited.
This experiment may be considered as such a test, the herbicides having been applied to a fairly dry soil and application being followed by a dry period. Under these conditions the rate of growth of weeds is limited and hand-weeded treatments are favoured. Two hand-weedings were sufficient to maintain the relevant plots weed-free for nearly three months.
The pattern of weed control given by the mixture of 2,4-D, Diuron and Bromacil was indicative of the severity of limiting soil moisture. This mixture was
TABLE IV Experiment III Mean visual scores for general weed control
Treatment
Formulation
F.P.C. 9267 »» !»
C.P.31675
C.P.50144 ,,
H.210 H.255 H .210+
H.119 H.210 +
H.225 Prefix
Planavin
C.6989 W.L.9385 2,4-D amine Cocktail Hand
weeding Control
Rate (units/ha.)
2 . 2 k g a . i . 4 .5 „ 2 .2 „ 4 .5 „ 2 .2 „ 4 .5 „ 6.7 kg product 4 .5 „ 4 .5 kg + 1.1kg
product 4 .5 kg + 1.1kg
product 6.7 kg product 8.9 „ 1.1 „ 3.4 „ 3.4 kga . i . 1.1 kg product 3.4 kg a. e. * Twice
—"
Days after application
24
5 5 5 7 5 7 6 6
3 5
5 3 5 4 5 5 5 5 9
4
3045
4 4 3 6 4 7 6 6
2 4
5 2 3 3 4 3 5 5 9
2
5 4 5 6 5 7 6 5
3 4
5 2 4 3 6 2 5 6 9
1
52
4 4 4 6 5 7 6 5
2 3
3 0 3 3 6 1 4 7 8
0
64
2 2 1 4 3 5 2 3
2 1
0 0 1 1 3 0 2 6 8
0
72
0 1 0 2 1 2 3 1
1 1
0 0 0 2 2 0 0 4 7
0
Mean 0-50 days
4.5 4 .2 4 .0 6.2 4 .6 7.0 6.0 5.5
2.4 3.8
4 . 4 1.4 3.6 3.2 5.2 2.6 4 .8 5.6 8.8
1.6
* Cocktail consisted of 1.4 kg a.i.Bromacil/ha. 2.7 kg a.i. Diuron/ha. 3.4kga.e. 2,4-D/ha.
relatively inactive for 40 days, after which time the first adequate rainfall was received. Twelve days later the effect of this cocktail was given a mean visual score of 7, but it failed to maintain this level of weed control.
C.P.50144 however, at a rate of 4.5 kg a.i./ha exceeded expectations and maintained a high score for a 50-day period. Broad-leaf species were eradicated and the population of C. rotundus was markedly reduced. Although the growth rate of surviving C. rotundus plants was retarded, the actual control of this species by C.P.50144 would not normally be commercially acceptable. No symptoms of phyto-toxicity to sugarcane were observed.
The two products, C.P.31675 (4.5 kg a.i./ha) and H.210 (6.7 kg a.i./ha) failed to give satisfactory control but had mean visual scores exceeding those of the cocktail. Amaranthus spinosus was recorded as being resistant to H.210.
Experiment IV This experiment was located on a Waldene soil at
the Mount Edgecombe Experiment Station. The weather conditions that prevailed followed closely those of Experiment III. The crop (variety N:Co.376) was not harvested, the experiment being discontinued after four mouths. The design was as a 4 x 4 lattice with a plot size of 0.004 hectare. There were four replications of each treatment but selected treatments (C.P.50144, 2,4-D and hand-weeded) were replicated eight times.
The trial was not irrigated and the dry conditions were somewhat more severe than those of Experiment
it
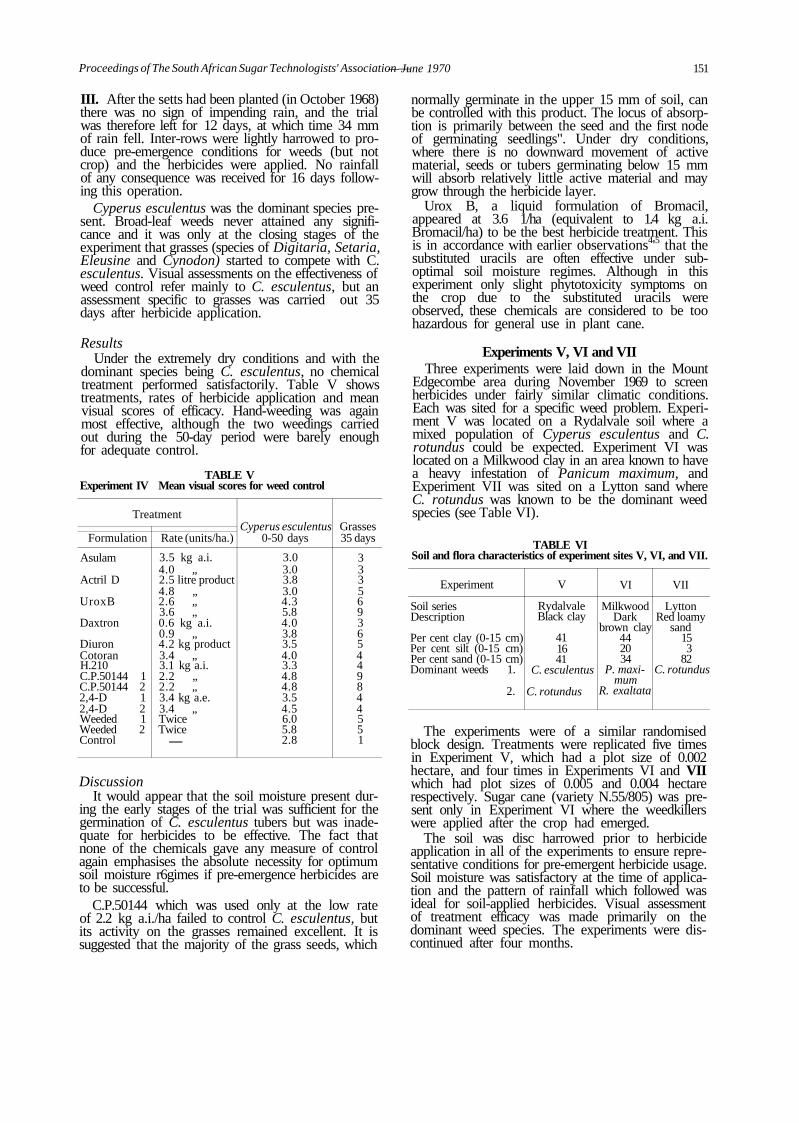
Proceedings of The South African Sugar Technologists' Association —
III. After the setts had been planted (in October 1968) there was no sign of impending rain, and the trial was therefore left for 12 days, at which time 34 mm of rain fell. Inter-rows were lightly harrowed to produce pre-emergence conditions for weeds (but not crop) and the herbicides were applied. No rainfall of any consequence was received for 16 days following this operation.
Cyperus esculentus was the dominant species present. Broad-leaf weeds never attained any significance and it was only at the closing stages of the experiment that grasses (species of Digitaria, Setaria, Eleusine and Cynodon) started to compete with C. esculentus. Visual assessments on the effectiveness of weed control refer mainly to C. esculentus, but an assessment specific to grasses was carried out 35 days after herbicide application.
Results Under the extremely dry conditions and with the
dominant species being C. esculentus, no chemical treatment performed satisfactorily. Table V shows treatments, rates of herbicide application and mean visual scores of efficacy. Hand-weeding was again most effective, although the two weedings carried out during the 50-day period were barely enough for adequate control.
TABLE V Experiment IV Mean visual scores for weed control
Treatment
Formulation
Asulam
Actril D
UroxB
Daxtron
Diuron Cotoran H.210 C.P.50144 C.P.50144 2,4-D 2,4-D Weeded Weeded Control
1 2 1 2 1 2
Rate (units/ha.)
3.5 kg a.i. 4.0 „ 2.5 litre product 4.8 „ 2.6 „ 3.6 „ 0.6 kg a.i. 0.9 „ 4.2 kg product 3.4 „ 3.1 kg a.i. 2.2 „ 2.2 „ 3.4 kg a.e. 3.4 „ Twice Twice
—
Cyperus esculentus 0-50 days
3.0 3.0 3.8 3.0 4.3 5.8 4.0 3.8 3.5 4.0 3.3 4.8 4.8 3.5 4.5 6.0 5.8 2.8
Grasses 35 days
3 3 3 5 6 9 3 6 5 4 4 9 8 4 4 5 5 1
Discussion It would appear that the soil moisture present dur
ing the early stages of the trial was sufficient for the germination of C. esculentus tubers but was inadequate for herbicides to be effective. The fact that none of the chemicals gave any measure of control again emphasises the absolute necessity for optimum soil moisture r6gimes if pre-emergence herbicides are to be successful.
C.P.50144 which was used only at the low rate of 2.2 kg a.i./ha failed to control C. esculentus, but its activity on the grasses remained excellent. It is suggested that the majority of the grass seeds, which
— June 1970 151
normally germinate in the upper 15 mm of soil, can be controlled with this product. The locus of absorption is primarily between the seed and the first node of germinating seedlings". Under dry conditions, where there is no downward movement of active material, seeds or tubers germinating below 15 mm will absorb relatively little active material and may grow through the herbicide layer.
Urox B, a liquid formulation of Bromacil, appeared at 3.6 1/ha (equivalent to 1.4 kg a.i. Bromacil/ha) to be the best herbicide treatment. This is in accordance with earlier observations4'5 that the substituted uracils are often effective under sub-optimal soil moisture regimes. Although in this experiment only slight phytotoxicity symptoms on the crop due to the substituted uracils were observed, these chemicals are considered to be too hazardous for general use in plant cane.
Experiments V, VI and VII Three experiments were laid down in the Mount
Edgecombe area during November 1969 to screen herbicides under fairly similar climatic conditions. Each was sited for a specific weed problem. Experiment V was located on a Rydalvale soil where a mixed population of Cyperus esculentus and C. rotundus could be expected. Experiment VI was located on a Milkwood clay in an area known to have a heavy infestation of Panicum maximum, and Experiment VII was sited on a Lytton sand where C. rotundus was known to be the dominant weed species (see Table VI).
TABLE VI Soil and flora characteristics of experiment sites V, VI, and VII.
Experiment
Soil series Description
Per cent clay (0-15 cm) Per cent silt (0-15 cm) Per cent sand (0-15 cm) Dominant weeds 1.
2.
V
Rydalvale Black clay
41 16 41
C. esculentus
C. rotundus
VI
Milkwood Dark
brown clay 44 20 34
P. maximum
R. exaltata
VII
Lytton Red loamy
sand 15 3
82 C. rotundus
The experiments were of a similar randomised block design. Treatments were replicated five times in Experiment V, which had a plot size of 0.002 hectare, and four times in Experiments VI and VII which had plot sizes of 0.005 and 0.004 hectare respectively. Sugar cane (variety N.55/805) was present only in Experiment VI where the weedkillers were applied after the crop had emerged.
The soil was disc harrowed prior to herbicide application in all of the experiments to ensure representative conditions for pre-emergent herbicide usage. Soil moisture was satisfactory at the time of application and the pattern of rainfall which followed was ideal for soil-applied herbicides. Visual assessment of treatment efficacy was made primarily on the dominant weed species. The experiments were discontinued after four months.
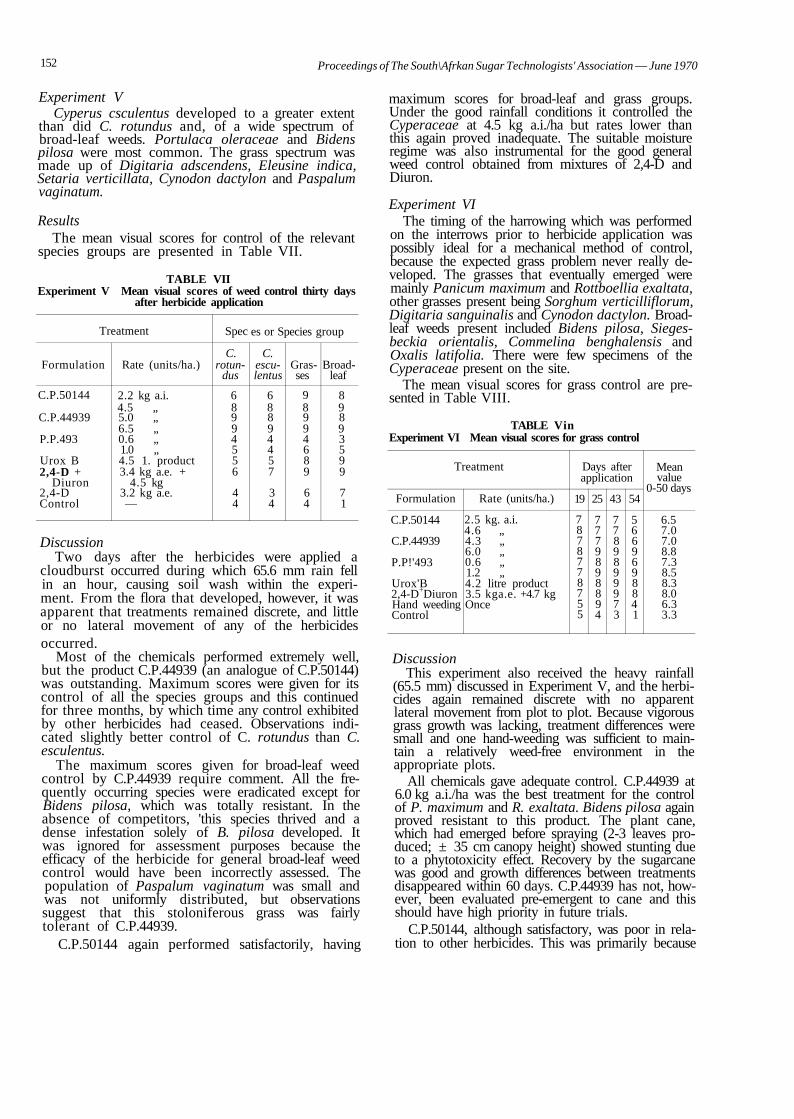
152 Proceedings of The South\Afrkan Sugar Technologists' Association — June 1970
Experiment V Cyperus csculentus developed to a greater extent
than did C. rotundus and, of a wide spectrum of broad-leaf weeds. Portulaca oleraceae and Bidens pilosa were most common. The grass spectrum was made up of Digitaria adscendens, Eleusine indica, Setaria verticillata, Cynodon dactylon and Paspalum vaginatum.
Results The mean visual scores for control of the relevant
species groups are presented in Table VII.
TABLE VII Experiment V Mean visual scores of weed control thirty days
after herbicide application
Treatment
Formulation
C.P.50144
C.P.44939
P.P.493
Urox B 2,4-D +
Diuron 2,4-D Control
Rate (units/ha.)
2.2 kg a.i. 4.5 „ 5.0 „ 6.5 „ 0.6 „ 1.0 „ 4.5 1. product 3.4 kg a.e. +
4.5 kg 3.2 kg a.e. —
Spec
C. rotun
dus
6 8 9 9 4 5 5 6
4 4
es or Species group
C. escu-lentus
6 8 8 9 4 4 5 7
3 4
Grasses
9 8 9 9 4 6 8 9
6 4
Broad-leaf
8 9 8 9 3 5 9 9
7 1
Discussion Two days after the herbicides were applied a
cloudburst occurred during which 65.6 mm rain fell in an hour, causing soil wash within the experiment. From the flora that developed, however, it was apparent that treatments remained discrete, and little or no lateral movement of any of the herbicides occurred.
Most of the chemicals performed extremely well, but the product C.P.44939 (an analogue of C.P.50144) was outstanding. Maximum scores were given for its control of all the species groups and this continued for three months, by which time any control exhibited by other herbicides had ceased. Observations indicated slightly better control of C. rotundus than C. esculentus.
The maximum scores given for broad-leaf weed control by C.P.44939 require comment. All the frequently occurring species were eradicated except for Bidens pilosa, which was totally resistant. In the absence of competitors, 'this species thrived and a dense infestation solely of B. pilosa developed. It was ignored for assessment purposes because the efficacy of the herbicide for general broad-leaf weed control would have been incorrectly assessed. The population of Paspalum vaginatum was small and was not uniformly distributed, but observations suggest that this stoloniferous grass was fairly tolerant of C.P.44939.
C.P.50144 again performed satisfactorily, having
maximum scores for broad-leaf and grass groups. Under the good rainfall conditions it controlled the Cyperaceae at 4.5 kg a.i./ha but rates lower than this again proved inadequate. The suitable moisture regime was also instrumental for the good general weed control obtained from mixtures of 2,4-D and Diuron.
Experiment VI The timing of the harrowing which was performed
on the interrows prior to herbicide application was possibly ideal for a mechanical method of control, because the expected grass problem never really developed. The grasses that eventually emerged were mainly Panicum maximum and Rottboellia exaltata, other grasses present being Sorghum verticilliflorum, Digitaria sanguinalis and Cynodon dactylon. Broad-leaf weeds present included Bidens pilosa, Sieges-beckia orientalis, Commelina benghalensis and Oxalis latifolia. There were few specimens of the Cyperaceae present on the site.
The mean visual scores for grass control are presented in Table VIII.
TABLE Vin Experiment VI Mean visual scores for grass control
Treatment
Formulation
C.P.50144
C.P.44939
P.P!'493
Urox'B 2,4-D+Diuron Hand weeding Control
Rate (units/ha.)
2.5 kg. a.i. 4.6 „ 4.3 „ 6.0 „ 0.6 „ 1.2 „ 4.2 litre product 3.5 kga.e. +4.7 kg Once
Days after application
19
7 8 7 8 7 7 8 7 5 5
25
7 7 7 9 8 9 8 8 9 4
43
7 7 8 9 8 9 9 9 7 3
54
5 6 6 9 6 9 8 8 4 1
Mean value
0-50 days
6.5 7.0 7.0 8.8 7.3 8.5 8.3 8.0 6.3 3.3
Discussion This experiment also received the heavy rainfall
(65.5 mm) discussed in Experiment V, and the herbicides again remained discrete with no apparent lateral movement from plot to plot. Because vigorous grass growth was lacking, treatment differences were small and one hand-weeding was sufficient to maintain a relatively weed-free environment in the appropriate plots.
All chemicals gave adequate control. C.P.44939 at 6.0 kg a.i./ha was the best treatment for the control of P. maximum and R. exaltata. Bidens pilosa again proved resistant to this product. The plant cane, which had emerged before spraying (2-3 leaves produced; ± 35 cm canopy height) showed stunting due to a phytotoxicity effect. Recovery by the sugarcane was good and growth differences between treatments disappeared within 60 days. C.P.44939 has not, however, been evaluated pre-emergent to cane and this should have high priority in future trials.
C.P.50144, although satisfactory, was poor in relation to other herbicides. This was primarily because
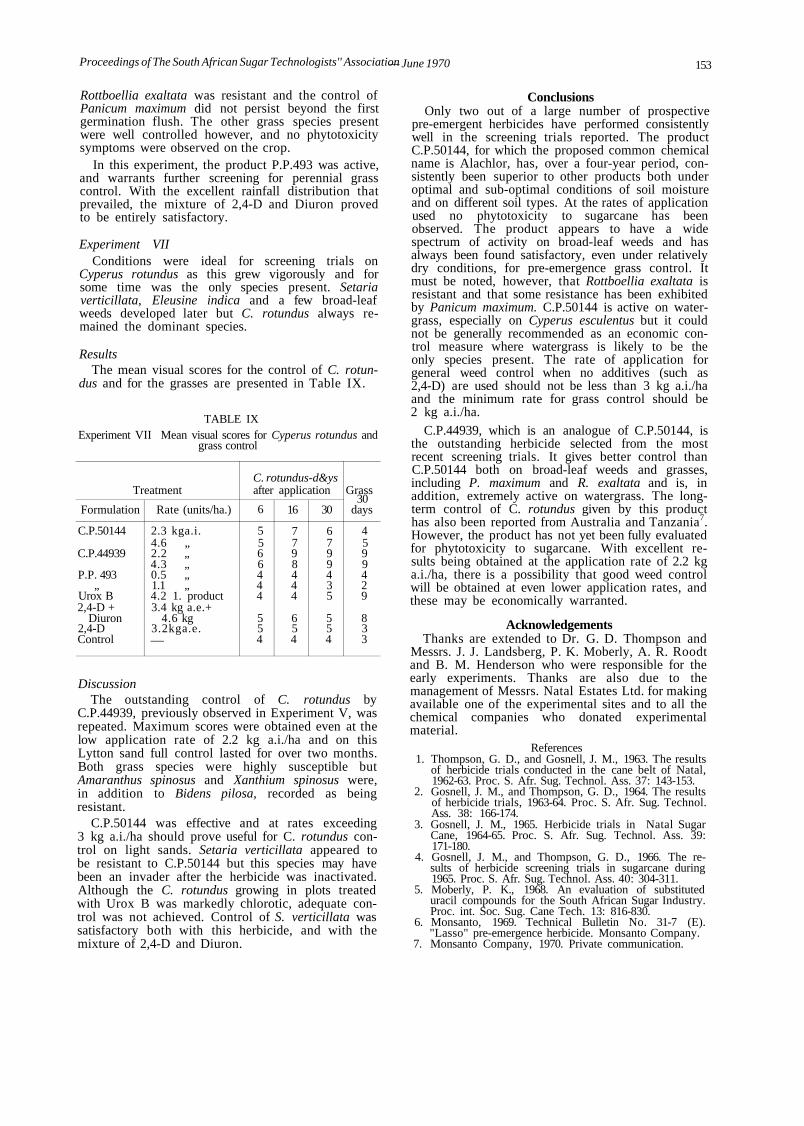
Proceedings of The South African Sugar Technologists'' Association — June 1970 153
Rottboellia exaltata was resistant and the control of Panicum maximum did not persist beyond the first germination flush. The other grass species present were well controlled however, and no phytotoxicity symptoms were observed on the crop.
In this experiment, the product P.P.493 was active, and warrants further screening for perennial grass control. With the excellent rainfall distribution that prevailed, the mixture of 2,4-D and Diuron proved to be entirely satisfactory.
Experiment VII Conditions were ideal for screening trials on
Cyperus rotundus as this grew vigorously and for some time was the only species present. Setaria verticillata, Eleusine indica and a few broad-leaf weeds developed later but C. rotundus always remained the dominant species.
Results The mean visual scores for the control of C. rotun
dus and for the grasses are presented in Table IX.
TABLE IX Experiment VII Mean visual scores for Cyperus rotundus and
grass control
Treatment
Formulation
C.P.50144
C.P.44939
P.P. 493 „
Urox B 2,4-D +
Diuron 2,4-D Control
Rate (units/ha.)
2.3 kga.i. 4.6 „ 2.2 „ 4.3 „ 0.5 „ 1.1 „ 4.2 1. product 3.4 kg a.e.+
4.6 kg 3.2kga.e. —
C. rotundus-d&ys after application
6
5 5 6 6 4 4 4
5 5 4
16
7 7 9 8 4 4 4
6 5 4
30
6 7 9 9 4 3 5
5 5 4
Grass 30
days
4 5 9 9 4 2 9
8 3 3
Discussion The outstanding control of C. rotundus by
C.P.44939, previously observed in Experiment V, was repeated. Maximum scores were obtained even at the low application rate of 2.2 kg a.i./ha and on this Lytton sand full control lasted for over two months. Both grass species were highly susceptible but Amaranthus spinosus and Xanthium spinosus were, in addition to Bidens pilosa, recorded as being resistant.
C.P.50144 was effective and at rates exceeding 3 kg a.i./ha should prove useful for C. rotundus control on light sands. Setaria verticillata appeared to be resistant to C.P.50144 but this species may have been an invader after the herbicide was inactivated. Although the C. rotundus growing in plots treated with Urox B was markedly chlorotic, adequate control was not achieved. Control of S. verticillata was satisfactory both with this herbicide, and with the mixture of 2,4-D and Diuron.
Conclusions Only two out of a large number of prospective
pre-emergent herbicides have performed consistently well in the screening trials reported. The product C.P.50144, for which the proposed common chemical name is Alachlor, has, over a four-year period, consistently been superior to other products both under optimal and sub-optimal conditions of soil moisture and on different soil types. At the rates of application used no phytotoxicity to sugarcane has been observed. The product appears to have a wide spectrum of activity on broad-leaf weeds and has always been found satisfactory, even under relatively dry conditions, for pre-emergence grass control. It must be noted, however, that Rottboellia exaltata is resistant and that some resistance has been exhibited by Panicum maximum. C.P.50144 is active on water-grass, especially on Cyperus esculentus but it could not be generally recommended as an economic control measure where watergrass is likely to be the only species present. The rate of application for general weed control when no additives (such as 2,4-D) are used should not be less than 3 kg a.i./ha and the minimum rate for grass control should be 2 kg a.i./ha.
C.P.44939, which is an analogue of C.P.50144, is the outstanding herbicide selected from the most recent screening trials. It gives better control than C.P.50144 both on broad-leaf weeds and grasses, including P. maximum and R. exaltata and is, in addition, extremely active on watergrass. The long-term control of C. rotundus given by this product has also been reported from Australia and Tanzania7. However, the product has not yet been fully evaluated for phytotoxicity to sugarcane. With excellent results being obtained at the application rate of 2.2 kg a.i./ha, there is a possibility that good weed control will be obtained at even lower application rates, and these may be economically warranted.
Acknowledgements Thanks are extended to Dr. G. D. Thompson and
Messrs. J. J. Landsberg, P. K. Moberly, A. R. Roodt and B. M. Henderson who were responsible for the early experiments. Thanks are also due to the management of Messrs. Natal Estates Ltd. for making available one of the experimental sites and to all the chemical companies who donated experimental material.
References 1. Thompson, G. D., and Gosnell, J. M., 1963. The results
of herbicide trials conducted in the cane belt of Natal, 1962-63. Proc. S. Afr. Sug. Technol. Ass. 37: 143-153.
2. Gosnell, J. M., and Thompson, G. D., 1964. The results of herbicide trials, 1963-64. Proc. S. Afr. Sug. Technol. Ass. 38: 166-174.
3. Gosnell, J. M., 1965. Herbicide trials in Natal Sugar Cane, 1964-65. Proc. S. Afr. Sug. Technol. Ass. 39: 171-180.
4. Gosnell, J. M., and Thompson, G. D., 1966. The results of herbicide screening trials in sugarcane during 1965. Proc. S. Afr. Sug. Technol. Ass. 40: 304-311.
5. Moberly, P. K., 1968. An evaluation of substituted uracil compounds for the South African Sugar Industry. Proc. int. Soc. Sug. Cane Tech. 13: 816-830.
6. Monsanto, 1969. Technical Bulletin No. 31-7 (E). "Lasso" pre-emergence herbicide. Monsanto Company.
7. Monsanto Company, 1970. Private communication.
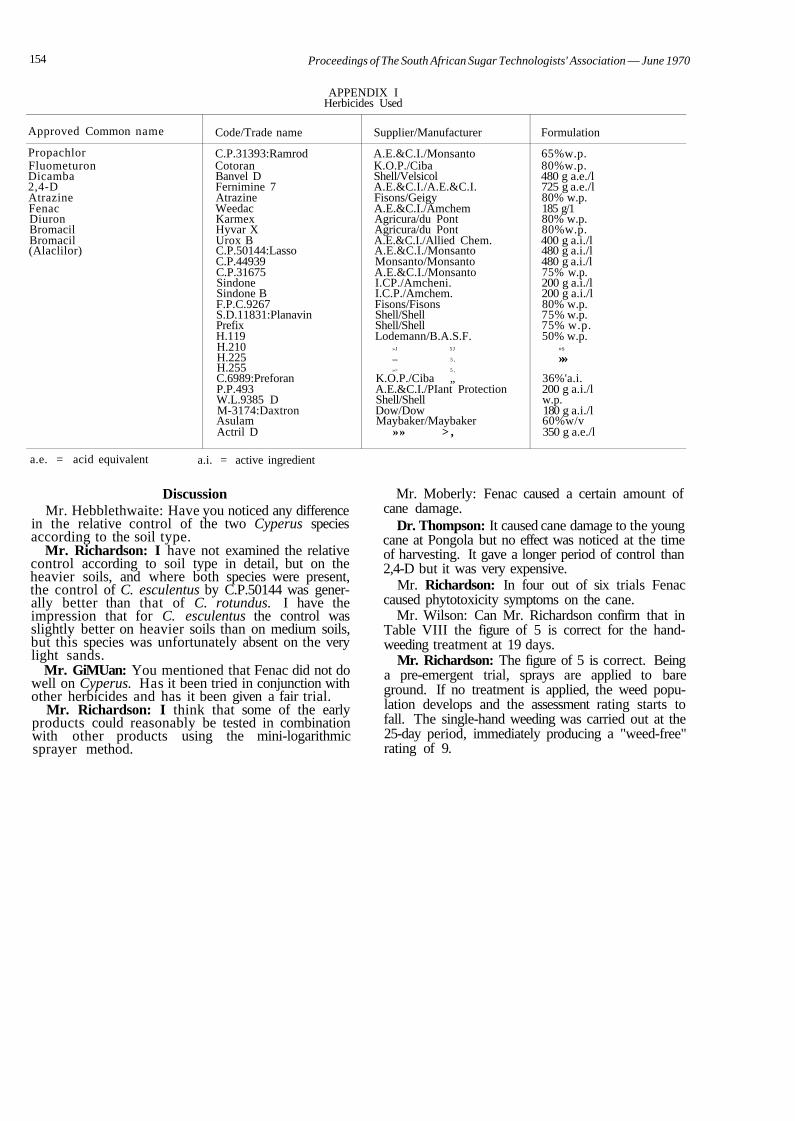
154 Proceedings of The South African Sugar Technologists' Association — June 1970
APPENDIX I Herbicides Used
Approved Common name
Propachlor Fluometuron Dicamba 2,4-D Atrazine Fenac Diuron Bromacil Bromacil (Alaclilor)
Code/Trade name
C.P.31393:Ramrod Cotoran Banvel D Fernimine 7 Atrazine Weedac Karmex Hyvar X Urox B C.P.50144:Lasso C.P.44939 C.P.31675 Sindone Sindone B F.P.C.9267 S.D.11831:Planavin Prefix H.119 H.210 H.225 H.255 C.6989:Preforan P.P.493 W.L.9385 D M-3174:Daxtron Asulam Actril D
Supplier/Manufacturer
A.E.&C.I./Monsanto K.O.P./Ciba Shell/Velsicol A.E.&C.I./A.E.&C.I. Fisons/Geigy A.E.&C.I./Amchem Agricura/du Pont Agricura/du Pont A.E.&C.I./Allied Chem. A.E.&C.I./Monsanto Monsanto/Monsanto A.E.&C.I./Monsanto I.CP./Amcheni. I.C.P./Amchem. Fisons/Fisons Shell/Shell Shell/Shell Lodemann/B.A.S.F.
»J 5J
»» 5 ,
»> 5 ,
K.O.P./Ciba „ A.E.&C.I./PIant Protection Shell/Shell Dow/Dow Maybaker/Maybaker
»» > ,
Formulation
65%w.p. 80%w.p. 480 g a.e./l 725 g a.e./l 80% w.p. 185 g/1 80% w.p. 80%w.p. 400 g a.i./l 480 g a.i./l 480 g a.i./l 75% w.p. 200 g a.i./l 200 g a.i./l 80% w.p. 75% w.p. 75% w.p. 50% w.p.
»s
»»
36%'a.i. 200 g a.i./l w.p. 180 g a.i./l 60%w/v 350 g a.e./l
a.e. = acid equivalent a.i. = active ingredient
Discussion Mr. Hebblethwaite: Have you noticed any difference
in the relative control of the two Cyperus species according to the soil type.
Mr. Richardson: I have not examined the relative control according to soil type in detail, but on the heavier soils, and where both species were present, the control of C. esculentus by C.P.50144 was generally better than that of C. rotundus. I have the impression that for C. esculentus the control was slightly better on heavier soils than on medium soils, but this species was unfortunately absent on the very light sands.
Mr. GiMUan: You mentioned that Fenac did not do well on Cyperus. Has it been tried in conjunction with other herbicides and has it been given a fair trial.
Mr. Richardson: I think that some of the early products could reasonably be tested in combination with other products using the mini-logarithmic sprayer method.
Mr. Moberly: Fenac caused a certain amount of cane damage.
Dr. Thompson: It caused cane damage to the young cane at Pongola but no effect was noticed at the time of harvesting. It gave a longer period of control than 2,4-D but it was very expensive.
Mr. Richardson: In four out of six trials Fenac caused phytotoxicity symptoms on the cane.
Mr. Wilson: Can Mr. Richardson confirm that in Table VIII the figure of 5 is correct for the hand-weeding treatment at 19 days.
Mr. Richardson: The figure of 5 is correct. Being a pre-emergent trial, sprays are applied to bare ground. If no treatment is applied, the weed population develops and the assessment rating starts to fall. The single-hand weeding was carried out at the 25-day period, immediately producing a "weed-free" rating of 9.
Proceedings of The South African Sugar Technologists" Association — June 1970 155
A COMPARISON OF METHODS OF PHOSPHATE APPLICATION TO RATOON CANE
By P. K. MOBERLY and G. H. WOOD*
South African Sugar Association Experimental Station
Abstract
Using a virgin Table Mountain Sandstone (Inanda series) soil with a low P status and high sorption capacity, a comparison of methods of superphosphate application to ratoon cane was carried out. By means of P-32 labelled superphosphate the uptake of fertilizer P by the plant was studied in first ratoon cane at intervals from 2\ to 18 weeks after the date of treatment application.
Uptake of labelled P was greater when the fertilizer was applied over the top of a trash blanket as compared with application to bare soil. Broadcasting was superior to banding irrespective of the presence or absence of a trash blanket, whilst deep placement was no more effective than surface banding on bare soil. Total P uptake showed the same trends but the treatment differences were not as great.
Differences between treatment effects on cane yields did not attain a level of statistical significance in the first ratoon. In the second ratoon, however, when residual effects were measured, the surface-applied treatments were significantly (P<0.01) better than the deep placement treatment, and broadcasting was superior (P<0.05) to surface banding.
Treatment effects on the crop's growth rate, harvested crop characteristics and soil P status were determined.
The results are discussed in the context of the movement of P in the soil, P sorption characteristics of different soils and methods of fertilizer placement which might minimize P fixation.
Introduction It has generally been accepted that fertilizer P
moves from its zone of placement in very small amounts. Mass flow of water carries to the roots of the plant all the nitrogen, calcium, magnesium and some of the potassium needed by the plant but, because the concentration of P in the soil solution, is generally very low, the amount of movement of P in this way is generally insignificant (Cook, 19663). Barber (19642) calculated that only l\% of the plant's requirements reached the plant in this way. The remainder of the supply of P occurs by diffusion to the root zone. As an illustration of the slow rate of P diffusion, Russell (19687) records how, after 15 years of basic slag application to grassland in England, the P content of the soil below 7.6 cm was barely affected.
* Present address: Research Laboratories, Shell and B.P. S.A. Petroleum Refinery (Pty.) Ltd., Island View Laboratory, P.O. Box 400, Durban.
It is also accepted that for good plant growth it is essential that the roots of a young plant should reach the phosphate zone in the soil as soon as possible. In this regard there is no doubt that placement of fertilizer P for the plant crop of sugarcane should be in the bottom of the furrow at planting.
"Where the P status of the soil is very low or the sorption capacity is high it is necessary, by fertilizer placement, to attempt to restrict the amount of soil that the fertilizer actually contacts in order for part of the growing medium at least to reach a satisfactory P level" (Larsen, 1967"). To test the applicability of this statement to sugarcane production in Natal an experiment was established in 1966 to study (i) the uptake of phosphorus by ratoon cane and (ii) the response in terms of cane growth and ultimate yield, using different methods of applying single superphosphate (8.3% P).
Experiment site The experiment was located on virgin land recently
broken from natural grassland in the mistbelt area of Inanda. The soil, an Inanda series derived from Table Mountain Sandstone, is inherently very low in available P ( < 4 p.p.m.) and has an exceptionally high P sorption capacity. | s ^ ^ ' . ' ^ v . ' . ,.«-";T"*" " •"
Experimental design and plot size A 2 x 5 split-plot design with four replications was
employed. Bare soil and a trash blanket were the two whole-plot treatments whilst the split-plot treatments comprised the various methods of phosphate application. The gross plot size was 1/148 ha consisting of six cane rows 9.3 m long and 1.2 m apart. The harvested net plots comprised the two centre rows with 0.9 m of end-effect removed from each end of the plot. A micro plot consisting of 1.6 m of one centre row in each plot was demarcated for the application of labelled P-32 superphosphate.
Sampling In the first ratoon crop punch samples were taken
from the third leaf blade of each well-grown tiller in the microplots at intervals of 2 | , A\, 1\, 11, 14^ and 18 weeks from the treatment date, after which no further P-32 measurements were possible due to radio-active decay. The P-32 was measured with a Geiger Muller pour-in counter and the total P content by the method of Fogg and Wilkinson (19584). In addition, third leaf samples were taken in the first and second ratoons from the net plots of the main
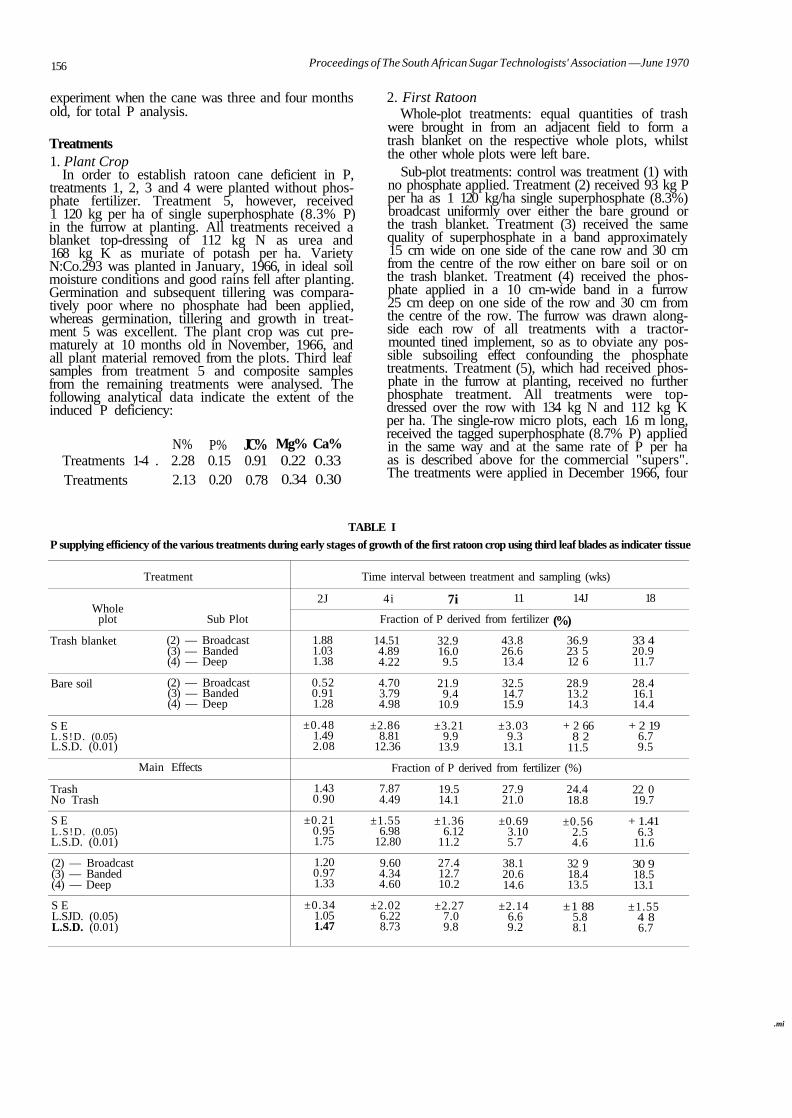
156 Proceedings of The South African Sugar Technologists' Association —June 1970
experiment when the cane was three and four months old, for total P analysis.
Treatments 1. Plant Crop
In order to establish ratoon cane deficient in P, treatments 1, 2, 3 and 4 were planted without phosphate fertilizer. Treatment 5, however, received 1 120 kg per ha of single superphosphate (8.3% P) in the furrow at planting. All treatments received a blanket top-dressing of 112 kg N as urea and 168 kg K as muriate of potash per ha. Variety N:Co.293 was planted in January, 1966, in ideal soil moisture conditions and good rains fell after planting. Germination and subsequent tillering was comparatively poor where no phosphate had been applied, whereas germination, tillering and growth in treatment 5 was excellent. The plant crop was cut prematurely at 10 months old in November, 1966, and all plant material removed from the plots. Third leaf samples from treatment 5 and composite samples from the remaining treatments were analysed. The following analytical data indicate the extent of the induced P deficiency:
Treatments 1-4 . Treatments
N% 2.28 2.13
P% 0.15 0.20
JC% 0.91 0.78
Mg% Ca% 0.22 0.33 0.34 0.30
2. First Ratoon Whole-plot treatments: equal quantities of trash
were brought in from an adjacent field to form a trash blanket on the respective whole plots, whilst the other whole plots were left bare.
Sub-plot treatments: control was treatment (1) with no phosphate applied. Treatment (2) received 93 kg P per ha as 1 120 kg/ha single superphosphate (8.3%) broadcast uniformly over either the bare ground or the trash blanket. Treatment (3) received the same quality of superphosphate in a band approximately 15 cm wide on one side of the cane row and 30 cm from the centre of the row either on bare soil or on the trash blanket. Treatment (4) received the phosphate applied in a 10 cm-wide band in a furrow 25 cm deep on one side of the row and 30 cm from the centre of the row. The furrow was drawn alongside each row of all treatments with a tractor-mounted tined implement, so as to obviate any possible subsoiling effect confounding the phosphate treatments. Treatment (5), which had received phosphate in the furrow at planting, received no further phosphate treatment. All treatments were top-dressed over the row with 134 kg N and 112 kg K per ha. The single-row micro plots, each 1.6 m long, received the tagged superphosphate (8.7% P) applied in the same way and at the same rate of P per ha as is described above for the commercial "supers". The treatments were applied in December 1966, four
TABLE I
P supplying efficiency of the various treatments during early stages of growth of the first ratoon crop using third leaf blades as indicater tissue
Whole plot
Trash blanket
Bare soil
S E L.S!D. (0.05) L.S.D. (0.01)
Trash No Trash
S E L.S!D. (0.05) L.S.D. (0.01)
(2) — Broadcast (3) — Banded (4) — Deep
S E L.SJD. (0.05) L.S.D. (0.01)
Treatment
Sub Plot
(2) — Broadcast (3) — Banded (4) — Deep
(2) — Broadcast (3) — Banded (4) — Deep
Main Effects
2J
1.88 1.03 1.38
0.52 0.91 1.28
±0.48 1.49 2.08
1.43 0.90
±0.21 0.95 1.75
1.20 0.97 1.33
±0.34 1.05 1.47
Time interval between treatment and sampling (wks)
4i 7i 11
Fraction of P derived from fertilizer
14.51 4.89 4.22
4.70 3.79 4.98
±2.86 8.81
12.36
32.9 16.0 9.5
21.9 9.4
10.9
±3.21 9.9
13.9
43.8 26.6 13.4
32.5 14.7 15.9
±3.03 9.3
13.1
14J
(%)
36.9 23 5 12 6
28.9 13.2 14.3
+ 2 66 8 2
11.5
Fraction of P derived from fertilizer (%)
7.87 4.49
±1.55 6.98
12.80
9.60 4.34 4.60
±2.02 6.22 8.73
19.5 14.1
±1.36 6.12
11.2
27.4 12.7 10.2
±2.27 7.0 9.8
27.9 21.0
±0.69 3.10 5.7
38.1 20.6 14.6
±2.14 6.6 9.2
24.4 18.8
±0.56 2.5 4.6
32 9 18.4 13.5
±1 88 5.8 8.1
18
33 4 20.9 11.7
28.4 16.1 14.4
+ 2 19 6.7 9.5
22 0 19.7
+ 1.41 6.3
11.6
30 9 18.5 13.1
±1.55 4 8 6.7
.mi
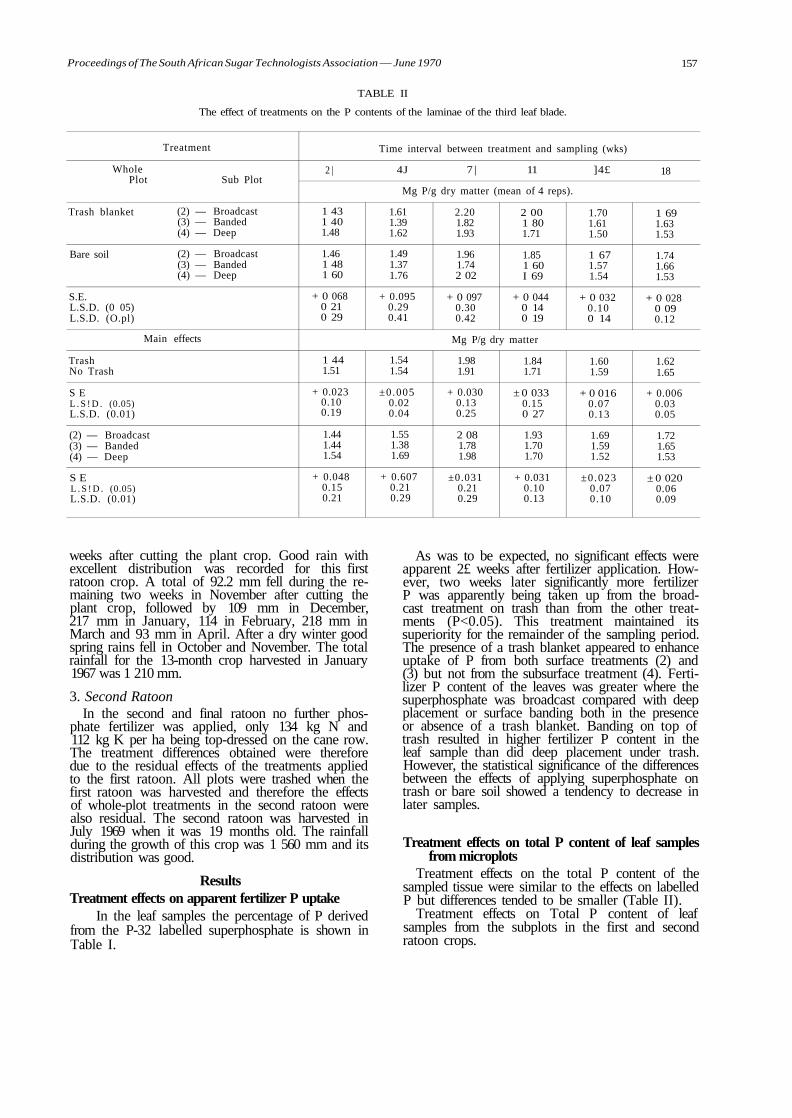
Proceedings of The South African Sugar Technologists Association — June 1970 157
TABLE II
The effect of treatments on the P contents of the laminae of the third leaf blade.
Whole Plot
Trash blanket
Bare soil
S.E. L.S.D. (0 05) L.S.D. (O.pl)
Treatment
Sub Plot
(2) — Broadcast (3) — Banded (4) — Deep
(2) — Broadcast (3) — Banded (4) — Deep
Main effects
Trash No Trash
S E L . S ! D . (0.05) L.S.D. (0.01)
(2) — Broadcast (3) — Banded (4) — Deep
S E L . S ! D . (0.05) L.S.D. (0.01)
2 |
1 43 1 40 1.48
1.46 1 48 1 60
+ 0 068 0 21 0 29
1 44 1.51
+ 0.023 0.10 0.19
1.44 1.44 1.54
+ 0.048 0.15 0.21
Time interval between treatment and sampling (wks)
4J 7 | 11 ]4£
Mg P/g dry matter (mean of 4 reps).
1.61 1.39 1.62
1.49 1.37 1.76
+ 0.095 0.29 0.41
2.20 1.82 1.93
1.96 1.74 2 02
+ 0 097 0.30 0.42
2 00 1 80 1.71
1.85 1 60 I 69
+ 0 044 0 14 0 19
1.70 1.61 1.50
1 67 1.57 1.54
+ 0 032 0.10 0 14
Mg P/g dry matter
1.54 1.54
±0.005 0.02 0.04
1.55 1.38 1.69
+ 0.607 0.21 0.29
1.98 1.91
+ 0.030 0.13 0.25
2 08 1.78 1.98
±0.031 0.21 0.29
1.84 1.71
± 0 033 0.15 0 27
1.93 1.70 1.70
+ 0.031 0.10 0.13
1.60 1.59
+ 0 016 0.07 0.13
1.69 1.59 1.52
±0.023 0.07 0.10
18
1 69 1.63 1.53
1.74 1.66 1.53
+ 0 028 0 09 0.12
1.62 1.65
+ 0.006 0.03 0.05
1.72 1.65 1.53
± 0 020 0.06 0.09
weeks after cutting the plant crop. Good rain with excellent distribution was recorded for this first ratoon crop. A total of 92.2 mm fell during the remaining two weeks in November after cutting the plant crop, followed by 109 mm in December, 217 mm in January, 114 in February, 218 mm in March and 93 mm in April. After a dry winter good spring rains fell in October and November. The total rainfall for the 13-month crop harvested in January 1967 was 1 210 mm.
3. Second Ratoon In the second and final ratoon no further phos
phate fertilizer was applied, only 134 kg N and 112 kg K per ha being top-dressed on the cane row. The treatment differences obtained were therefore due to the residual effects of the treatments applied to the first ratoon. All plots were trashed when the first ratoon was harvested and therefore the effects of whole-plot treatments in the second ratoon were also residual. The second ratoon was harvested in July 1969 when it was 19 months old. The rainfall during the growth of this crop was 1 560 mm and its distribution was good.
Results Treatment effects on apparent fertilizer P uptake
In the leaf samples the percentage of P derived from the P-32 labelled superphosphate is shown in Table I.
As was to be expected, no significant effects were apparent 2£ weeks after fertilizer application. However, two weeks later significantly more fertilizer P was apparently being taken up from the broadcast treatment on trash than from the other treatments (P<0.05). This treatment maintained its superiority for the remainder of the sampling period. The presence of a trash blanket appeared to enhance uptake of P from both surface treatments (2) and (3) but not from the subsurface treatment (4). Fertilizer P content of the leaves was greater where the superphosphate was broadcast compared with deep placement or surface banding both in the presence or absence of a trash blanket. Banding on top of trash resulted in higher fertilizer P content in the leaf sample than did deep placement under trash. However, the statistical significance of the differences between the effects of applying superphosphate on trash or bare soil showed a tendency to decrease in later samples.
Treatment effects on total P content of leaf samples from microplots
Treatment effects on the total P content of the sampled tissue were similar to the effects on labelled P but differences tended to be smaller (Table II).
Treatment effects on Total P content of leaf samples from the subplots in the first and second ratoon crops.
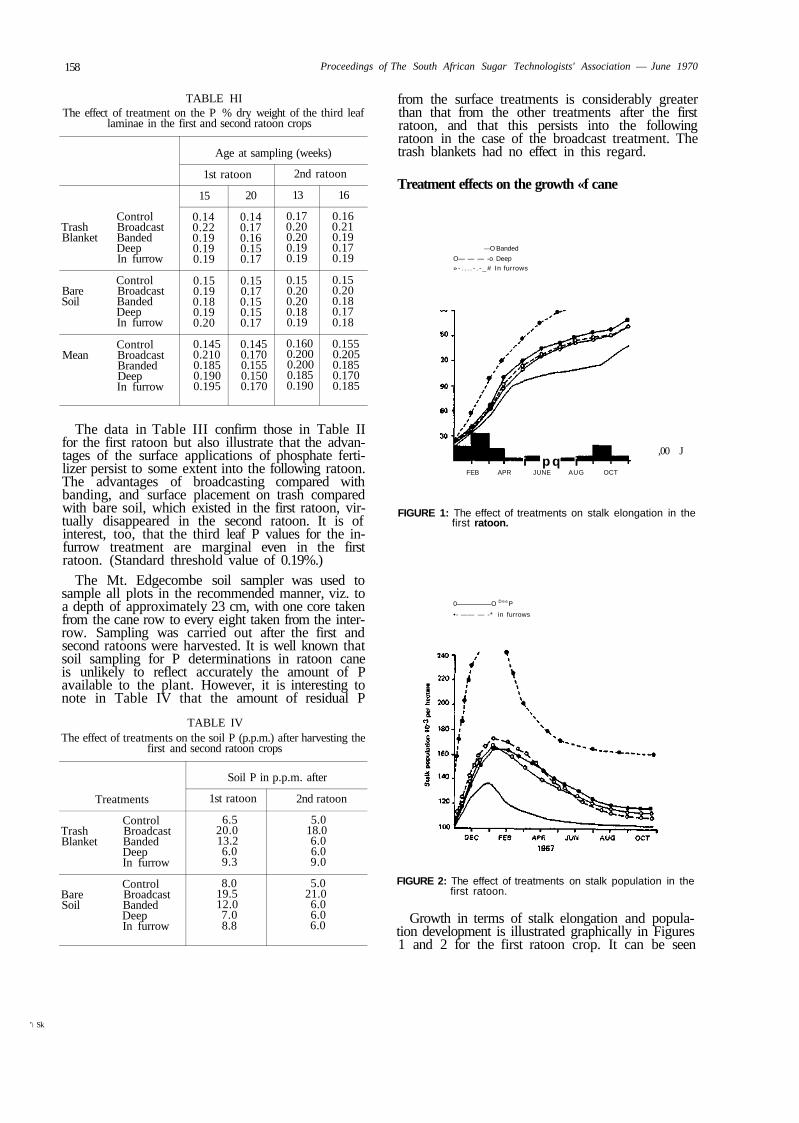
158 Proceedings of The South African Sugar Technologists' Association — June 1970
TABLE HI The effect of treatment on the P % dry weight of the third leaf
laminae in the first and second ratoon crops
Control Trash Broadcast Blanket Banded
Deep In furrow
Control Bare Broadcast Soil Banded
Deep In furrow
Control Mean Broadcast
Branded Deep In furrow
Age at sampling (weeks)
1st ratoon
15
0.14 0.22 0.19 0.19 0.19
0.15 0.19 0.18 0.19 0.20
0.145 0.210 0.185 0.190 0.195
20
0.14 0.17 0.16 0.15 0.17
0.15 0.17 0.15 0.15 0.17
0.145 0.170 0.155 0.150 0.170
2nd ratoon
13
0.17 0.20 0.20 0.19 0.19
0.15 0.20 0.20 0.18 0.19
0.160 0.200 0.200 0.185 0.190
16
0.16 0.21 0.19 0.17 0.19
0.15 0.20 0.18 0.17 0.18
0.155 0.205 0.185 0.170 0.185
The data in Table III confirm those in Table II for the first ratoon but also illustrate that the advantages of the surface applications of phosphate fertilizer persist to some extent into the following ratoon. The advantages of broadcasting compared with banding, and surface placement on trash compared with bare soil, which existed in the first ratoon, virtually disappeared in the second ratoon. It is of interest, too, that the third leaf P values for the in-furrow treatment are marginal even in the first ratoon. (Standard threshold value of 0.19%.)
The Mt. Edgecombe soil sampler was used to sample all plots in the recommended manner, viz. to a depth of approximately 23 cm, with one core taken from the cane row to every eight taken from the inter-row. Sampling was carried out after the first and second ratoons were harvested. It is well known that soil sampling for P determinations in ratoon cane is unlikely to reflect accurately the amount of P available to the plant. However, it is interesting to note in Table IV that the amount of residual P
TABLE IV The effect of treatments on the soil P (p.p.m.) after harvesting the
first and second ratoon crops
Treatments
Control Trash Broadcast Blanket Banded
Deep In furrow
Control Bare Broadcast Soil Banded
Deep In furrow
Soil P in p.p.m. after
1st ratoon
6.5 20.0 13.2 6.0 9.3
8.0 19.5 12.0 7.0 8.8
2nd ratoon
5.0 18.0 6.0 6.0 9.0
5.0 21.0 6.0 6.0 6.0
from the surface treatments is considerably greater than that from the other treatments after the first ratoon, and that this persists into the following ratoon in the case of the broadcast treatment. The trash blankets had no effect in this regard.
Treatment effects on the growth «f cane
—O Banded
O— — — -o Deep » - . . . . - . - _ # In furrows
i p q i FEB APR JUNE AUG OCT
,00 J
FIGURE 1: The effect of treatments on stalk elongation in the first ratoon.
0 O D e eP
•- —— — -* in furrows
FIGURE 2: The effect of treatments on stalk population in the first ratoon.
Growth in terms of stalk elongation and population development is illustrated graphically in Figures 1 and 2 for the first ratoon crop. It can be seen
'\ Sk
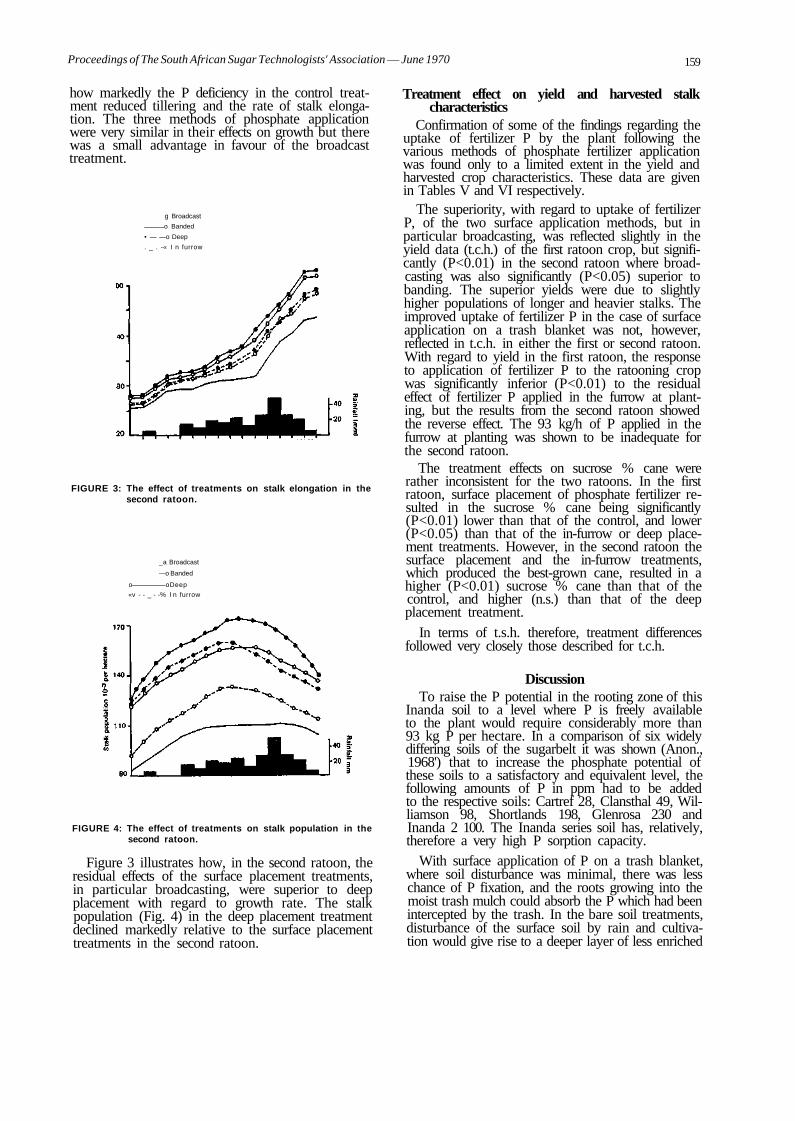
Proceedings of The South African Sugar Technologists' Association — June 1970 159
how markedly the P deficiency in the control treatment reduced tillering and the rate of stalk elongation. The three methods of phosphate application were very similar in their effects on growth but there was a small advantage in favour of the broadcast treatment.
g Broadcast
o Banded
• — —o Deep
. _ . -« I n furrow
FIGURE 3: The effect of treatments on stalk elongation in the second ratoon.
_a Broadcast
—o Banded
o oDeep
«v - - _ - -% I n furrow
FIGURE 4: The effect of treatments on stalk population in the second ratoon.
Figure 3 illustrates how, in the second ratoon, the residual effects of the surface placement treatments, in particular broadcasting, were superior to deep placement with regard to growth rate. The stalk population (Fig. 4) in the deep placement treatment declined markedly relative to the surface placement treatments in the second ratoon.
Treatment effect on yield and harvested stalk characteristics
Confirmation of some of the findings regarding the uptake of fertilizer P by the plant following the various methods of phosphate fertilizer application was found only to a limited extent in the yield and harvested crop characteristics. These data are given in Tables V and VI respectively.
The superiority, with regard to uptake of fertilizer P, of the two surface application methods, but in particular broadcasting, was reflected slightly in the yield data (t.c.h.) of the first ratoon crop, but significantly (P<0.01) in the second ratoon where broadcasting was also significantly (P<0.05) superior to banding. The superior yields were due to slightly higher populations of longer and heavier stalks. The improved uptake of fertilizer P in the case of surface application on a trash blanket was not, however, reflected in t.c.h. in either the first or second ratoon. With regard to yield in the first ratoon, the response to application of fertilizer P to the ratooning crop was significantly inferior (P<0.01) to the residual effect of fertilizer P applied in the furrow at planting, but the results from the second ratoon showed the reverse effect. The 93 kg/h of P applied in the furrow at planting was shown to be inadequate for the second ratoon.
The treatment effects on sucrose % cane were rather inconsistent for the two ratoons. In the first ratoon, surface placement of phosphate fertilizer resulted in the sucrose % cane being significantly (P<0.01) lower than that of the control, and lower (P<0.05) than that of the in-furrow or deep placement treatments. However, in the second ratoon the surface placement and the in-furrow treatments, which produced the best-grown cane, resulted in a higher (P<0.01) sucrose % cane than that of the control, and higher (n.s.) than that of the deep placement treatment.
In terms of t.s.h. therefore, treatment differences followed very closely those described for t.c.h.
Discussion To raise the P potential in the rooting zone of this
Inanda soil to a level where P is freely available to the plant would require considerably more than 93 kg P per hectare. In a comparison of six widely differing soils of the sugarbelt it was shown (Anon., 1968') that to increase the phosphate potential of these soils to a satisfactory and equivalent level, the following amounts of P in ppm had to be added to the respective soils: Cartref 28, Clansthal 49, Williamson 98, Shortlands 198, Glenrosa 230 and Inanda 2 100. The Inanda series soil has, relatively, therefore a very high P sorption capacity.
With surface application of P on a trash blanket, where soil disturbance was minimal, there was less chance of P fixation, and the roots growing into the moist trash mulch could absorb the P which had been intercepted by the trash. In the bare soil treatments, disturbance of the surface soil by rain and cultivation would give rise to a deeper layer of less enriched
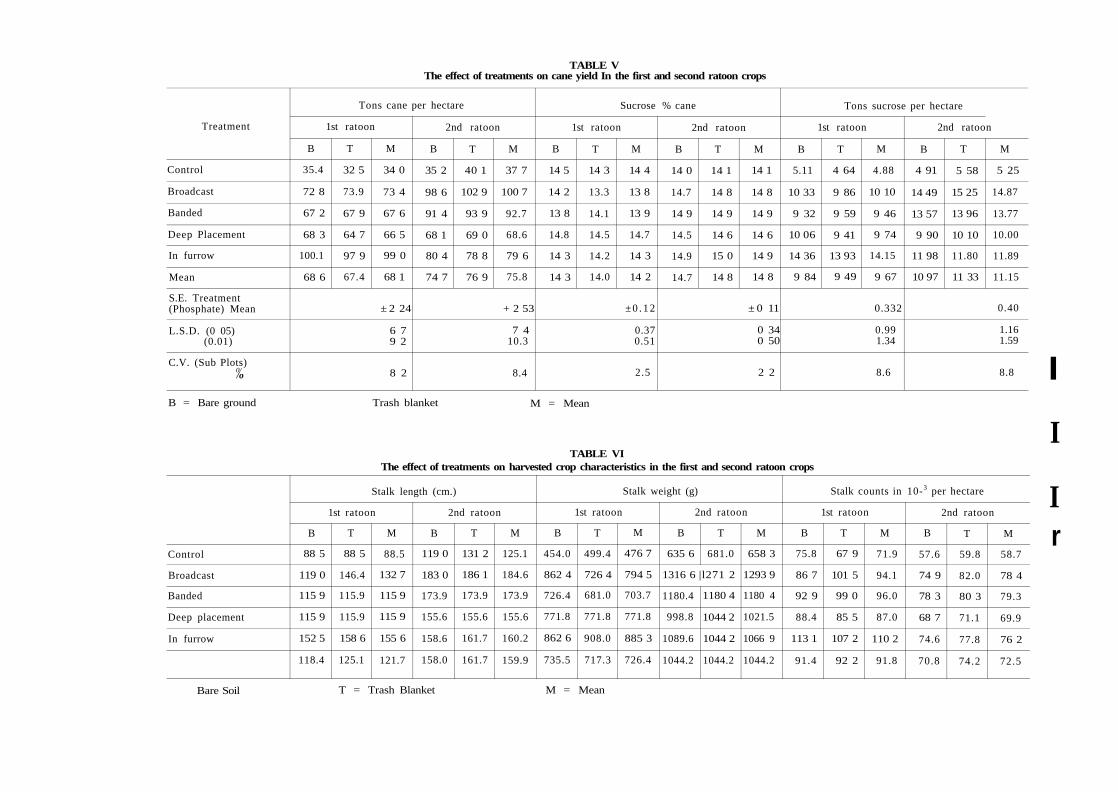
TABLE V The effect of treatments on cane yield In the first and second ratoon crops
Treatment
Control
Broadcast
Banded
Deep Placement
In furrow
Mean
S.E. Treatment (Phosphate) Mean
L.S.D. (0 05) (0.01)
C.V. (Sub Plots) 0/ /o
Tons cane per hectare
1st ratoon
B
35.4
72 8
67 2
68 3
100.1
68 6
T
32 5
73.9
67 9
64 7
97 9
67.4
M
34 0
73 4
67 6
66 5
99 0
68 1
± 2 24
6 7 9 2
8 2
2nd ratoon
B
35 2
98 6
91 4
68 1
80 4
74 7
T
40 1
102 9
93 9
69 0
78 8
76 9
M
37 7
100 7
92.7
68.6
79 6
75.8
+ 2 53
7 4 10.3
8.4
Sucrose % cane
1st ratoon
B
14 5
14 2
13 8
14.8
14 3
14 3
T
14 3
13.3
14.1
14.5
14.2
14.0
M
14 4
13 8
13 9
14.7
14 3
14 2
± 0 . 1 2
0.37 0.51
2.5
2nd ratoon
B
14 0
14.7
14 9
14.5
14.9
14.7
T
14 1
14 8
14 9
14 6
15 0
14 8
M
14 1
14 8
14 9
14 6
14 9
14 8
± 0 11
0 34 0 50
2 2
Tons sucrose per hectare
1st ratoon
B
5.11
10 33
9 32
10 06
14 36
9 84
T
4 64
9 86
9 59
9 41
13 93
9 49
M
4.88
10 10
9 46
9 74
14.15
9 67
0.332
0.99 1.34
8.6
2nd ratoo
B
4 91
14 49
13 57
9 90
11 98
10 97
T
5 58
15 25
13 96
10 10
11.80
11 33
n
M
5 25
14.87
13.77
10.00
11.89
11.15
0.40
1.16 1.59
8.8 I B = Bare ground Trash blanket M = Mean
TABLE VI The effect of treatments on harvested crop characteristics in the first and second ratoon crops
Control
Broadcast
Banded
Deep placement
In furrow
Stalk length (cm.)
1st ratoon
B
88 5
119 0
115 9
115 9
152 5
118.4
T
88 5
146.4
115.9
115.9
158 6
125.1
M
88.5
132 7
115 9
115 9
155 6
121.7
2nd ratoon
B
119 0
183 0
173.9
155.6
158.6
158.0
T
131 2
186 1
173.9
155.6
161.7
161.7
M
125.1
184.6
173.9
155.6
160.2
159.9
Stalk weight (g)
1st ratoon
B
454.0
862 4
726.4
771.8
862 6
735.5
T
499.4
726 4
681.0
771.8
908.0
717.3
M
476 7
794 5
703.7
771.8
885 3
726.4
2nd ratoon
B
635 6
T
681.0
1316 6 |l271 2
1180.4
998.8
1089.6
1044.2
1180 4
1044 2
1044 2
1044.2
M
658 3
1293 9
1180 4
1021.5
1066 9
1044.2
Stalk counts in 10-3 per hectare
1st ratoon
B
75.8
86 7
92 9
88.4
113 1
91.4
T
67 9
101 5
99 0
85 5
107 2
92 2
M
71.9
94.1
96.0
87.0
110 2
91.8
2nd ratoon
B
57.6
74 9
78 3
68 7
74.6
70.8
T
59.8
82.0
80 3
71.1
77.8
74.2
M
58.7
78 4
79.3
69.9
76 2
72.5
I
I r
Bare Soil T = Trash Blanket M = Mean
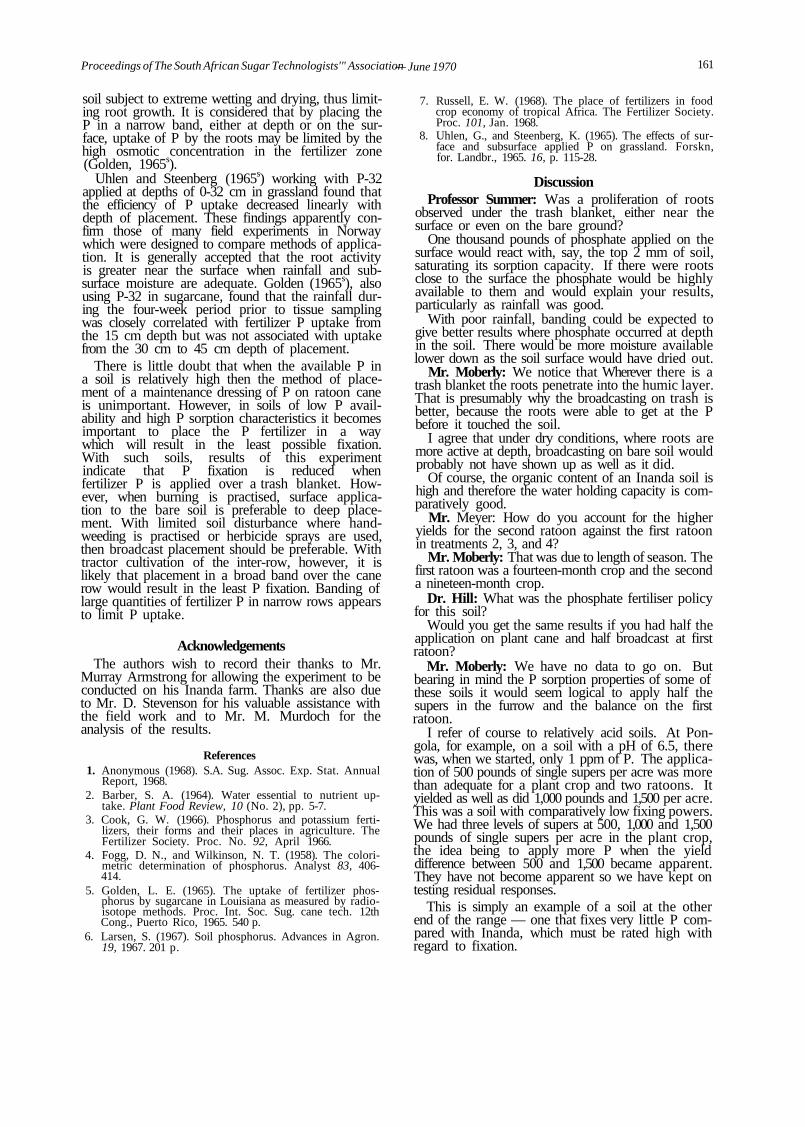
Proceedings of The South African Sugar Technologists'" Association — June 1970 161
soil subject to extreme wetting and drying, thus limiting root growth. It is considered that by placing the P in a narrow band, either at depth or on the surface, uptake of P by the roots may be limited by the high osmotic concentration in the fertilizer zone (Golden, 1965s).
Uhlen and Steenberg (1965s) working with P-32 applied at depths of 0-32 cm in grassland found that the efficiency of P uptake decreased linearly with depth of placement. These findings apparently confirm those of many field experiments in Norway which were designed to compare methods of application. It is generally accepted that the root activity is greater near the surface when rainfall and subsurface moisture are adequate. Golden (1965s), also using P-32 in sugarcane, found that the rainfall during the four-week period prior to tissue sampling was closely correlated with fertilizer P uptake from the 15 cm depth but was not associated with uptake from the 30 cm to 45 cm depth of placement.
There is little doubt that when the available P in a soil is relatively high then the method of placement of a maintenance dressing of P on ratoon cane is unimportant. However, in soils of low P availability and high P sorption characteristics it becomes important to place the P fertilizer in a way which will result in the least possible fixation. With such soils, results of this experiment indicate that P fixation is reduced when fertilizer P is applied over a trash blanket. However, when burning is practised, surface application to the bare soil is preferable to deep placement. With limited soil disturbance where hand-weeding is practised or herbicide sprays are used, then broadcast placement should be preferable. With tractor cultivation of the inter-row, however, it is likely that placement in a broad band over the cane row would result in the least P fixation. Banding of large quantities of fertilizer P in narrow rows appears to limit P uptake.
Acknowledgements The authors wish to record their thanks to Mr.
Murray Armstrong for allowing the experiment to be conducted on his Inanda farm. Thanks are also due to Mr. D. Stevenson for his valuable assistance with the field work and to Mr. M. Murdoch for the analysis of the results.
References 1. Anonymous (1968). S.A. Sug. Assoc. Exp. Stat. Annual
Report, 1968. 2. Barber, S. A. (1964). Water essential to nutrient up
take. Plant Food Review, 10 (No. 2), pp. 5-7. 3. Cook, G. W. (1966). Phosphorus and potassium ferti
lizers, their forms and their places in agriculture. The Fertilizer Society. Proc. No. 92, April 1966.
4. Fogg, D. N., and Wilkinson, N. T. (1958). The colori-metric determination of phosphorus. Analyst 83, 406-414.
5. Golden, L. E. (1965). The uptake of fertilizer phosphorus by sugarcane in Louisiana as measured by radioisotope methods. Proc. Int. Soc. Sug. cane tech. 12th Cong., Puerto Rico, 1965. 540 p.
6. Larsen, S. (1967). Soil phosphorus. Advances in Agron. 19, 1967. 201 p.
7. Russell, E. W. (1968). The place of fertilizers in food crop economy of tropical Africa. The Fertilizer Society. Proc. 101, Jan. 1968.
8. Uhlen, G., and Steenberg, K. (1965). The effects of surface and subsurface applied P on grassland. Forskn, for. Landbr., 1965. 16, p. 115-28.
Discussion Professor Summer: Was a proliferation of roots
observed under the trash blanket, either near the surface or even on the bare ground?
One thousand pounds of phosphate applied on the surface would react with, say, the top 2 mm of soil, saturating its sorption capacity. If there were roots close to the surface the phosphate would be highly available to them and would explain your results, particularly as rainfall was good.
With poor rainfall, banding could be expected to give better results where phosphate occurred at depth in the soil. There would be more moisture available lower down as the soil surface would have dried out.
Mr. Moberly: We notice that Wherever there is a trash blanket the roots penetrate into the humic layer. That is presumably why the broadcasting on trash is better, because the roots were able to get at the P before it touched the soil.
I agree that under dry conditions, where roots are more active at depth, broadcasting on bare soil would probably not have shown up as well as it did.
Of course, the organic content of an Inanda soil is high and therefore the water holding capacity is comparatively good.
Mr. Meyer: How do you account for the higher yields for the second ratoon against the first ratoon in treatments 2, 3, and 4?
Mr. Moberly: That was due to length of season. The first ratoon was a fourteen-month crop and the second a nineteen-month crop.
Dr. Hill: What was the phosphate fertiliser policy for this soil?
Would you get the same results if you had half the application on plant cane and half broadcast at first ratoon?
Mr. Moberly: We have no data to go on. But bearing in mind the P sorption properties of some of these soils it would seem logical to apply half the supers in the furrow and the balance on the first ratoon.
I refer of course to relatively acid soils. At Pon-gola, for example, on a soil with a pH of 6.5, there was, when we started, only 1 ppm of P. The application of 500 pounds of single supers per acre was more than adequate for a plant crop and two ratoons. It yielded as well as did 1,000 pounds and 1,500 per acre. This was a soil with comparatively low fixing powers. We had three levels of supers at 500, 1,000 and 1,500 pounds of single supers per acre in the plant crop, the idea being to apply more P when the yield difference between 500 and 1,500 became apparent. They have not become apparent so we have kept on testing residual responses.
This is simply an example of a soil at the other end of the range — one that fixes very little P compared with Inanda, which must be rated high with regard to fixation.
162 Proceedings of The South African Sugar Technologists' Association — June 1970
SOIL STERILIZATION AND THE GROWTH OF TOPS AND ROOTS AT THE MOUNT EDGECOMBE ROOT LABORATORY
By J. GLOVER
South African Sugar Association Experimental Station
Summary Declining yields of successive ratoon crops on a
Recent Red Sand soil (Clansthal series) were observed and measured at the Mount Edgecombe Root Laboratory.
Sterilization of this soil gave very markedly improved growth of tops and roots. The improved growth of tops apparently resulted from improved root growth.
Root growth in the sterilized soil was rapid, deep and extensive. In the untreated soil it was slow, and was restricted mainly to the superficial layers (0-30 cm) where the roots could be affected by short spells of drought.
Introduction The well-known decline in yields of successive
ratoon crops of sugarcane on our sandy soils has been observed at the Root Laboratory, where on a Recent Red Sand soil (Clansthal series) the yields of varieties N:Co. 376 and N50/211 have declined from very-high in the plant crop to barely-economical in the first ratoon crop and to sub-economic levels in the second ratoon crop.
The symptoms accompanying the decline were of progressively slower growth and increasing susceptibility to drought. Thus in the plant crop on the sand there was no sign of moisture stress even when drought periods were sufficiently severe to cause wilt on similar plants in a heavy clay soil (Shortlands series, Dolerite). In the first ratoon crop, the plants became susceptible to short drought periods after a few months of growth, although there was adequate moisture at all times from about 30 cm below the surface downwards. The second ratoon crop was even more susceptible to short dry spells than the first ratoon, though water was available closer to the surface. Indeed the wilt in the second ratoon was so severe that frequent supplementary irrigation had to be given in order to get sufficient plant material for the investigation of possible causes of failure.
As the growth of the tops differed, so did the growth of the roots. The roots of the ratoon crops grew more slowly, penetrated less deeply and had a different habit of branching. This is illustrated in Figure 1, which shows the deep, widespread and rapid proliferation of the main roots and their long branches in the plant crop, and the successively more shallow, less widespread and stubby branching of roots in succeeding ratoons.
The slower growth of the main roots in the first ratoon crop was at first ascribed to cold, since
the plant crop had been cut at the end of July. Thus they grew at an average rate of less than 2 cm a day compared with some 5 cm a day in the plant crop. It was very noticeable, however, that such roots did not increase their rate of growth as they penetrated warmer, deeper layers, nor did new roots from later tillers grow any faster in the surface soils, which by then were warmer.
Growth of roots of the second ratoon crop was slower still, and the roots were more stubby and twisted than those of the first ratoon crop.
When symptoms of crop failure first appeared the following possible causes were investigated by the Plant Pathology, Microbiology, Entomology, Nematology and Plant Physiology sections of the Experiment Station: ratoon stunting disease (R.S.D.), nutrient deficiencies, root-damaging insects and nematodes, and pathogenic fungi.
There were no visible signs of R.S.D. in the cane stalks, nor, if it were present but symptomless, could it be transmitted to other more sensitive varieties.
Leaf and soil analyses showed that all essential elements were present in more than adequate amounts, except nitrogen, which was marginal by our standards.
There were a few root-damaging insects in the sand but not in greater amount than in other soils carrying healthy crops.
The nematode counts on soil samples at different times of year showed that there was little difference between the populations of various species in the sand and heavy clay soils.
Finally, visual inspection of roots, stalks and leaves, and the culturing of leaf and root samples in the laboratory showed no pathogenic fungi of sufficient importance to produce the symptoms.
In other words, none of these factors appeared to be the cause of failure, either singly or in combination. However, there was a possibility that the very heavy plant crop had removed more nitrogen and/or sulphur from the soil than had been replaced by subsequent fertilization. However, this was unlikely because the first ratoon crop had the equivalent of 130 kg/ha each of nitrogen and potassium, and soil analyses showed that no additional phosphorus applications were needed.
This attempt to produce healthy growth of the second ratoon failed. The failure was puzzling because further repeated checks for the presence of parasites or pathogens also failed, until by accident, while sampling roots near the base of a particularly unhealthy plant, a number of shallow roots were unearthed, each bearing well-developed root knots
-June 1970 163 Proceedings of The South African Sugar Technologists' Association
similar to those caused by parasitic nematodes. Further sampling showed that root knots were not common and the few that could be found were formed only on the very superficial roots. Hence the failure to see them through the windows of the laboratory, which permit viewing only from some 25-30 cm below the surface downwards.
Tomato seedlings were then grown in the inter-rows as a catch crop for some of the nematodes. There was enough light for this purpose because the cane plants were sickly and the leaves did not meet across the inter-row. The tomato seedlings grew only about 75 mm high and no further. Their roots were very knotted and contained nematodes (Meloido-gyne).
Soil sterilization to a depth of 45 cm with E.D.B. (Ethylene dibromide) was then applied beneath the partly grown crop. It was unsuccessful, probably because it was too late: the major flush of root development being past. Nevertheless it seemed possible that sterilization before root growth started might yield interesting results, particularly as field trials on the same soil series were showing that soil fumigation could improve crop growth.
Experiment Because the existing stools of the second ratoon
were of such poor quality that it was doubtful if new tillers would be produced in sufficient numbers to produce even distribution along the rows, it was decided to replant the whole Red Sand plot with freshly heat-treated setts of both varieties.
Three soil treatments were possible within the restricted limits of the plot.
The first treatment involved the removal and complete flash sterilization of a block of sand some 3 m long by 1.4 m wide by 2 m deep with methyl bromide. A further 20 to 30 cm depth of soil below the resulting pit was sterilized with the more persistent ethylene dibromide (E.D.B.). The sterilized sand was-then replaced and repacked layer by layer as it was originally. During the removal of the sand there was some slumping of the sidewalls and the slumped sand was also sterilized before replacement. As a result, instead of having a neatly edged block of soil as shown by the dotted lines in the sectional diagram, Fig. 2, the true shape of the sterilized zone was as shown by the continuous lines. Thin overlapping flexible plastic sheets were placed in the position shown by the dotted lines to impede sideways movement of nematodes. These could only reduce the rate of such travel if it occurred, not block it completely. Indeed, shortly after replanting, termites could be seen through the windows reinvading the sterilized block where the fit between plastic sheet and window was poor.
The second treatment involved the excavation, exposure and replacement of a similar block of sand, but it was not sterilized. This provided a control which would display the result of disturbance if such existed.
The third treatment was the incorporation of additional organic matter in the surface soil. Well-rotted
filter cake containing 2.52% N, 1.22% P and 0.21% K on a dry-matter basis and with a moisture content of 76% was applied at the rate of 125 tonnes/ ha and intimately mixed with the sand to a depth of 60 cm.
The remaining five rows of undisturbed and untreated sand were the controls.
Before planting, all the rows received a heavy application of suitable fertilizer. Thus the row treated with additional organic matter received the same amount of fertilizer as those which were not so treated.
The setts were planted on the 19th August, 1969, in moist soil. Good, well-distributed rain fell shortly afterwards and the whole profile to a depth of at least 2 m was quickly restored to field capacity. There was no shortage of water in the surface layers of the soil during the first four months of growth. Air and soil temperatures were slightly below average in September, but since then they have been about average for the time of year.
Results In all rows the first shoots appeared above ground
at the same time, but within a few weeks marked differences began to appear. Growth was slow and tillering was poor in the untreated rows, in the row treated with additional organic matter and in the row which had been disturbed to a depth of 2 m but was not sterilized. Most of the leaves of the plants were light green in colour but some were yellowish green. A few young tillers died.
By contrast the plants in the sterilized row grew vigorously and tillered well: see Figs. 3 and 4 which illustrate the comparative shoot counts and stalk growth above a 15 cm/ peg as measured to the first visible dewlap. Their leaves were dark green in colour. Plants in the two rows alongside the sterilized row, which had access to some sterilized soil—see Fig. 5—grew much better than the controls but not as well as those on the sterilized block. They, too, had markedly greener leaves than the controls.
There was no doubt that the effect of soil sterilization was beginning to show in the tops of the plants at an early age.
Below ground the effects were even more dramatic. The roots of the plant in the sterilized row grew very rapidly downwards and branched well. For example, even in the relatively cold soil (about 20° Q some shoots were extending at rates up to some 75 mm/day as in the plant crop on warmer soils (about 25° C). Further, the very active shoot roots carried long secondary branches which were growing at rates up to 15 or 20 mm a day. The main roots reached the bottom of the windows, 138 cm below the surface, some eight weeks after planting in the cool August weather. This compared favourably with the rate of root extension in the same soil by the January-planted crop of the same variety (N:Co. 376) which took only one week less to attain the same depth.
By contrast, root growth was extremely poor in the unsterilized sand, whether it had been treated with
164 Proceedings of The South African Sugar Technologists'' Association — June 1970
TABLE I Average numbers of tillers and lengths of stalks per stool in the Red Sand plot 6 months after planting. All grown under natural rainfall.
Variety
N:Co.376
N. 50/211
Soil treatment
Sterilized, disturbed Past sterile, part disturbed Unsterile, disturbed
Unsterile 4- filter cake Unsterile, control
No. Stalks
13.7 9.7 8.3
13.7 3.3
Total length all stalks > 15 cm
887 cm 373 cm 161 cm
245 cm 75
Length of each stalk
65 cm 39 cm 19 cm
22 cm 18
Length of each of 3 tallest stalks
95 cm 60 cm 31 cm
36 cm 34
filter cake or not. Nor did the aeration due to deep disturbance have any effect.
Some three months after replanting a few stubby, twisted roots became visible some 30 cm below the surface of the unsterilized soil. This was at a time when the roots in the sterilized soil were proliferating vigorously at depths more than four times deeper than this!
The roots of the plants in the rows alongside the sterilized block, which had access to sterilized soil on one side, developed mainly in that part of the soil which was sterilized. On average they did not grow as well or as quickly as those in completely sterilized soil.
Fig. 5 illustrates these aspects of top and root behaviour as seen through the windows 23 weeks after planting. It gives a better impression of the growth of the tops at this time than the data contained in Figs. 3 and 4.
Table I contains the comparative measurements of the average growth of the tops of three stools in each 3 m row, six months after replanting in the Red Sand. The results are expressed on a single stool basis.
This table shows how markedly the soil sterilization has increased tiller production, stalk height and total lengths of stalk in each stool of N:Co.376. It also shows the partial gains resulting from the accidental partial sterilization.
Further it shows that, as far as variety No.50/211 is concerned, the beneficial effect of the filter cake in this soil is almost entirely due to the increase in the number of tillers carried at this stage of growth, not to any increase in stalk height; for the plants
receiving the filter cake are no taller than those on the unsterilized soil. This equivalence of plant heights on the treated and untreated soil was mantained at all stages of growth up to this time.
The beneficial effect of sterilization would be of little value if the gains were small relative to normal growth. Table II, therefore, shows how the growth of the replant crop of N.Co. 376 compares with the growth of the third ratoon crops of the same variety in neighbouring plots on other soils where growth appears to be normal. The ratoon crops are, of course, about one month older than the replant crop because of the time taken to prepare the soil for the replanting.
It is obvious from this table that the crop on the sterilized soil has almost caught up in height and total length of stalk per stool with the best of the neighbouring plots (on the disturbed Dolerite) and is apparently better at this time than all the others.
The experiment is not yet complete, being due for harvest at the end of July 1970. Nevertheless, since the differences in growth of tops and roots resulting from sterilization are so large, and since most of the tiller and root formation is nearly over for this year, there is unlikely to be any major change in the behaviour of the plants before harvest.
Acknowledgements I am indebted to many of my colleagues at the
Experiment Station for patient, repetitive examinations of soil and plant in the search for possible causes of yield decline; in particular to Messrs. G. M. Thomson, K. E. F. Alexander, W. B. May and A. A. Hansen as well as Drs. J. Dick and G. Roth.
TABLE II N:Co.376 Average numbers of tillers and lengths of Stalks per Stool in different soils.
Age months
6
7
Plant or
Ratoon
Plant
3rd ratoon
Soil
Red Sand
T.M.S.
Dolerite
Treatment
Disturbed Sterilized
Disturbed
Disturbed Undisturbed Undisturbed
Water Regime
Rain
Rain
Rain Rain Irrigation
No. of
stalks
13.7
9.3
11.7 7.0 9.6
Total length all stalks > 15 cm
887 cm
519 cm
833 cm 389 cm 549 cm
Length of each stalk
> 15 cm
65 cm
56 cm
71 cm 51 cm 56 cm
Length of each of 3 tallest
Stalks > 15 cm
95 cm
81 cm
100 cm 83 cm 89 cm
Proceedings of The South African Sugar Technologists' Association —June 1970 165
PLANT CROP
4 Months
1st RATOON
6 Months
2nd RATOON
8 Months
FIGURE 1: Root patterns in successive crops on Red Sand showing that the declining yield of tops is reflected in the declining extension of the root-systems.
1 6 0 1 N Co. 376
FIGURE 2: Cross-section of soil beneath the rows showing the intended, within the dashed lines, and the actual, within the continuous lines, boundaries of the sterilized block. The rows and plant spacing are shown by "•••
unsterile
N.50/211
FIGURE 3: Weekly shoot counts per 3 m length of rows. > 15 cm in an average stool.
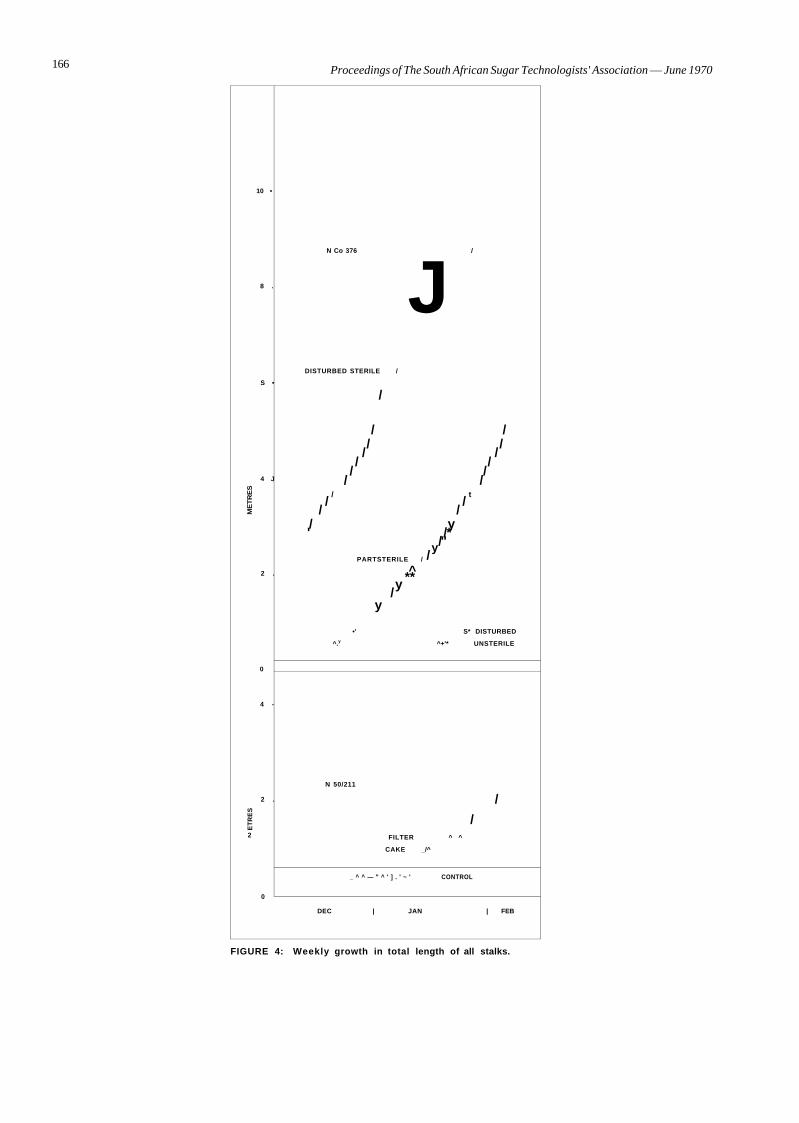
166 Proceedings of The South African Sugar Technologists' Association — June 1970
10 •
8 .
S •
4 J
ME
TR
ES
2 .
0
4 -
2 .
ET
RE
S
2
0
N Co 376 /
J DISTURBED STERILE /
/
/ / / /
/ / / /
/ / / /
/ t / /
/ / / y ' /*
/" y / PARTSTERILE /
^ ** y /
y
•' S* DISTURBED
^.y ^+'* UNSTERILE
N 50/211
/
/ FILTER ^ ^
CAKE _/^
_ ^ ^ — " ^ ' ] . ' ~ ' CONTROL
DEC | JAN | FEB
FIGURE 4: Weekly growth in total length of all stalks.
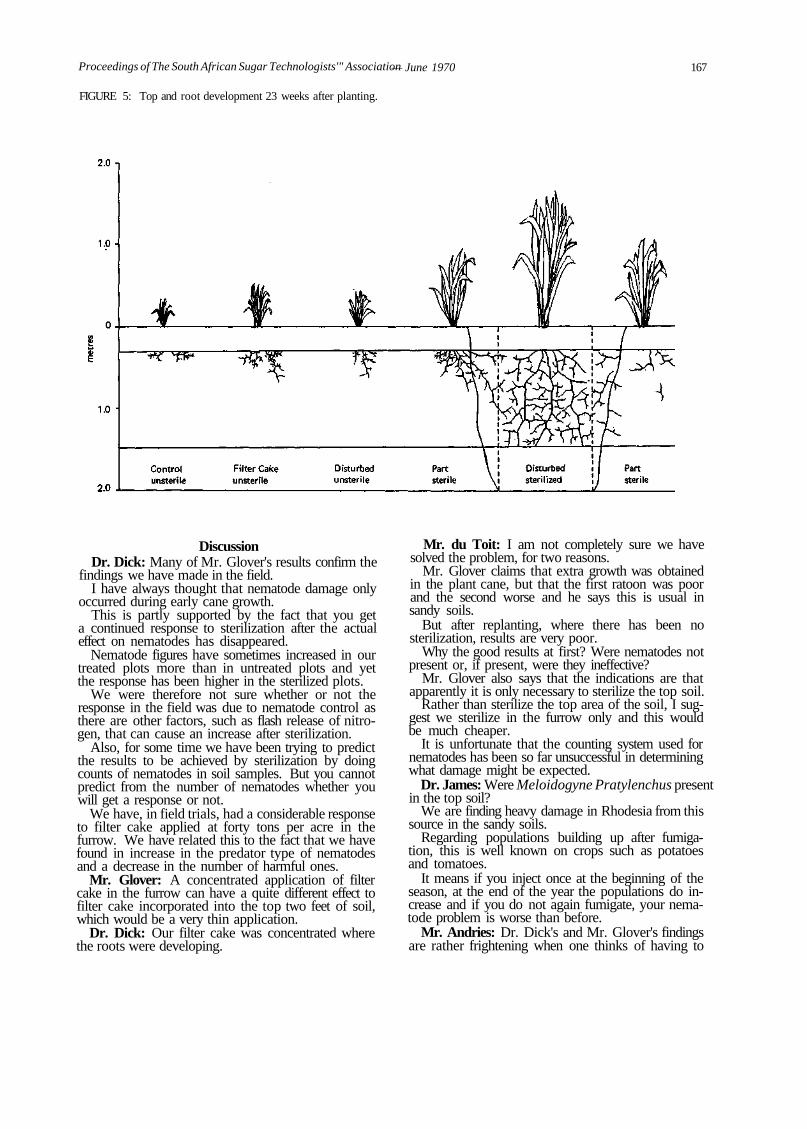
— June 1970 167 Proceedings of The South African Sugar Technologists'" Association
FIGURE 5: Top and root development 23 weeks after planting.
Discussion Dr. Dick: Many of Mr. Glover's results confirm the
findings we have made in the field. I have always thought that nematode damage only
occurred during early cane growth. This is partly supported by the fact that you get
a continued response to sterilization after the actual effect on nematodes has disappeared.
Nematode figures have sometimes increased in our treated plots more than in untreated plots and yet the response has been higher in the sterilized plots.
We were therefore not sure whether or not the response in the field was due to nematode control as there are other factors, such as flash release of nitrogen, that can cause an increase after sterilization.
Also, for some time we have been trying to predict the results to be achieved by sterilization by doing counts of nematodes in soil samples. But you cannot predict from the number of nematodes whether you will get a response or not.
We have, in field trials, had a considerable response to filter cake applied at forty tons per acre in the furrow. We have related this to the fact that we have found in increase in the predator type of nematodes and a decrease in the number of harmful ones.
Mr. Glover: A concentrated application of filter cake in the furrow can have a quite different effect to filter cake incorporated into the top two feet of soil, which would be a very thin application.
Dr. Dick: Our filter cake was concentrated where the roots were developing.
Mr. du Toit: I am not completely sure we have solved the problem, for two reasons.
Mr. Glover claims that extra growth was obtained in the plant cane, but that the first ratoon was poor and the second worse and he says this is usual in sandy soils.
But after replanting, where there has been no sterilization, results are very poor.
Why the good results at first? Were nematodes not present or, if present, were they ineffective?
Mr. Glover also says that the indications are that apparently it is only necessary to sterilize the top soil.
Rather than sterilize the top area of the soil, I suggest we sterilize in the furrow only and this would be much cheaper.
It is unfortunate that the counting system used for nematodes has been so far unsuccessful in determining what damage might be expected.
Dr. James: Were Meloidogyne Pratylenchus present in the top soil?
We are finding heavy damage in Rhodesia from this source in the sandy soils.
Regarding populations building up after fumigation, this is well known on crops such as potatoes and tomatoes.
It means if you inject once at the beginning of the season, at the end of the year the populations do increase and if you do not again fumigate, your nematode problem is worse than before.
Mr. Andries: Dr. Dick's and Mr. Glover's findings are rather frightening when one thinks of having to

168 Proceedings of The South African Sugar Technologists' Association — June 1970
institute control measures on a field scale. What large scale measures should be taken for this
problem? Mr. Gilfillan: We started a trial in 1965 using DBCP
and we have had a residual response over four crops, with a total increased yield of 40 tons of cane because of having treated at four tons of product per acre, plant crop only.
I assumed that nematodes were present in the top twelve inches because of the residual response we did get.
However, when we tried this on a commercial scale it did not work.
With fumigant type nematocides we have been unable to get predictable responses on a field scale.
Some previous findings from the root laboratory indicated that a ratoon crop existed for some time on its previous root system, which would explain the
tremendous build up in eelworm numbers. Mr. Moberly: Was Mr. Gilfillan's fumigation ap
plied by pumping or was it dribbled in under gravity? Mr. Gilfillan: Different methods were used. The biggest trial was with D.B.C.P. which ran
down tubes to nine inches and was then immediately covered.
Trials were under different moisture conditions and at different times of the year.
Dr. Hill: Applying the same product at Tongaat using hand injector guns, on a small field scale, we obtained a remarkable difference between controlled lines of cane and where we had injected.
This possibly indicates that our method of application was inefficient.
Mr. Bartlett (in the chair): Apparently more work should be carried out on the practical aspects of fumigating.
Proceedings of The South African Sugar Technologists' Association — June 1970 169
PERKINSIELLA SACCHARICIDA KIRKALDY (HOM: DELPHACIDAE) AN INSECT PEST OF
SUGARCANE IN SOUTHERN AFRICA By R. H. G. HARRIS
South African Sugar Association, Experiment Station
Abstract A brief description is given of Perkinsiella saccha-
ricida Kirk, as a pest of sugarcane. Population fluctuations, varietal susceptibility, ovipositional habits, natural control, alternate host plants, alary polymorphism, light attraction and the effect on leaf hoppers of trash burning are discussed.
Introduction The sugarcane leafhopper, Perkinsiella sacchari-
cida Kirkaldy has attracted considerable attention as a pest of sugarcane since its discovery in 1900 in Hawaii by Perkins (Swezey, 1936). During the years 1903-1905, as a result of the damage done by this insect, the Hawaiian sugar industry was threatened with ruin. One plantation, which had yielded 18,888 tons in 1903, yielded only 1,620 tons in 1905 (Swezey, 1936). However, from observations in fields and insectary cultures heavily infested with this leaf-hopper in South Africa and Swaziland, such serious damage was not apparent.
The insect has a direct effect on sugarcane by sucking considerable quantities of juice from the plant, but it is also the vector of Fiji disease of sugarcane in Queensland (Mungomery and Bell, 1933) and in Madagascar (Frappa, 1954). This virus disease severely stunts the growth of the plant. Two other species of the same genus- P. vastatrix (Breddin) and P. vitiensis Kirk., are also known to transmit the virus. (Ocfemia, 1934; Pemberton, 1935).
Nineteen species of Perkinsiella have been recorded on sugarcane (Box, 1953), of which P. saccharicida is widely distributed among sugar producing countries which lie within a belt approximately 30° North and South of the equator (Anon., 1963). More recently it has been recorded on the South American continent (Anon., 1967) and in the Ryukyu Islands (Takara and Azuma, 1968). In relation to Southern Africa the nearest geographic occurrence of Fiji disease is in Madagascar.
P. saccharicida was first recorded in South Africa in about 1900 (Metcalf, 1943) and was listed in 1937 amongst insects attacking sugarcane in Natal (van der Merwe, 1937). It attracted little attention until it was observed, at certain times, in very large numbers throughout the recently established sugar producing areas of Pongola, the Eastern Transvaal and Swaziland.
This paper concerns various aspects of the biology of the insect in relation to sugarcane in South Africa and Swaziland.
Methods and Materials The data were obtained from three widely
separated sugarcane producing areas. The most northerly area was Northern Swaziland, the second was Pongola (approximately 160 kilometres to the south) and the third and most southerly area was Illovo (approximately 500 kilometres south of the Swaziland area).
All population figures were based on numbers of adult P. saccharicida. In Swaziland, where populations were higher than in the other two localities, sampling was done by placing a grease-coated or molasses-coated beating sheet (0.4 ma) between two rows of cane at 10 separate stations within a field and shaking the adjacent cane plants vigorously. This caused adults to alight on the sheets and to become trapped and available for counting. In Fig. 1 Nos. 1-23, the total counts of 10 such samplings, taken at approximately weekly intervals, have been plotted.
At Pongola a portable suction trap (Dietrick, 1961) was used for monthly sampling of adults. All sampling was done along a transect within and parallel to the cane rows. Ten samples were taken, each over a distance of 20 paces, with five paces between samples. The total of 10 such samples was used to plot population curves shown for field Nos. 25 and 26 in Fig 1.
Sampling at Illovo (Field No. 24) was done with the same suction sampler, but the method differed in that samples were taken over a period of two minutes while walking between the cane rows at a constant pace.
Beating sheets were unsuitable for sampling in the Illovo area as too few leafhoppers were present to obtain satisfactory readings. At Pongola, although numbers were considerably higher, the suction sampler was again found to be more efficient.
Population Fluctuations In Swaziland during 1969, twenty-three fields,
covering an area of approximately 400 hectares, were sampled as previously described. Fig. 2 shows the layout of this area. The field numbers (1-23)' the cane varieties, the crop stage (plant or ratoon) and the date (month and year) of planting or harvesting are also given.
In Fig. 1 the straight diagonal line shown in each graph represents the increasing age of the cane. The perpendicular straight line, where it occurs, shows che month in which it was harvested.
The most evident feature was the simultaneous
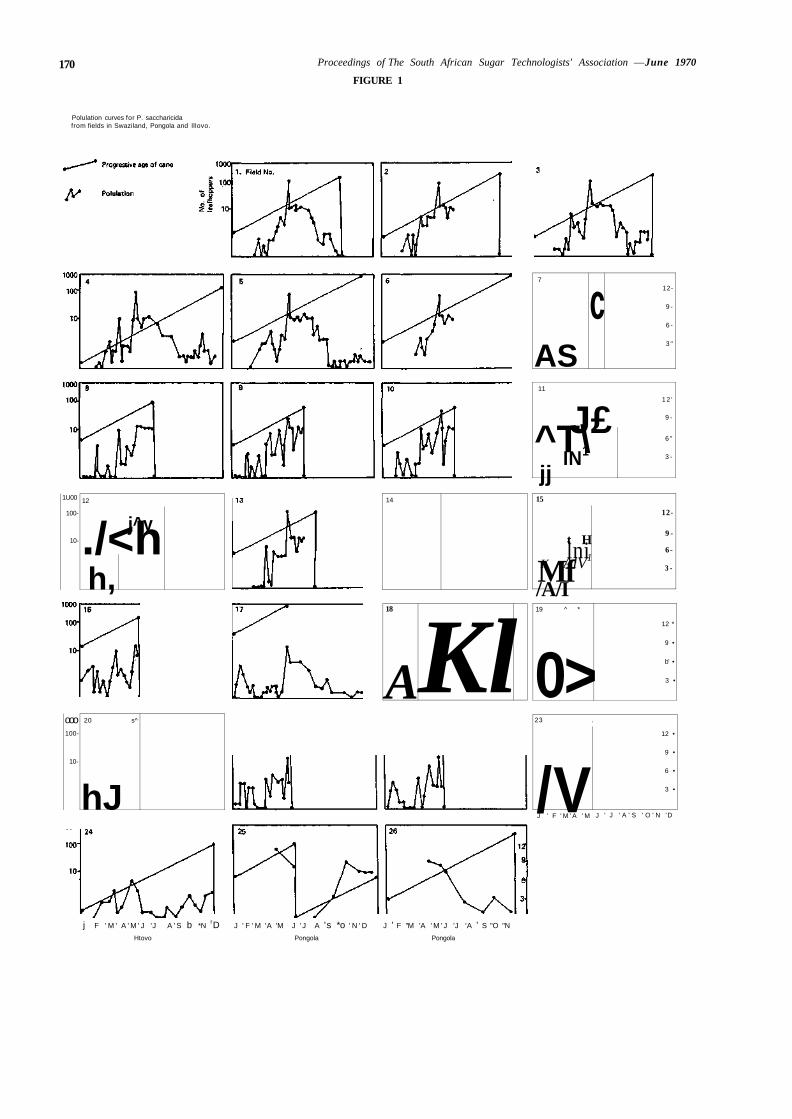
170 Proceedings of The South African Sugar Technologists' Association —June 1970
FIGURE 1
Polulation curves for P. saccharicida from fields in Swaziland, Pongola and lllovo.
1U00
100-
10-
12
j^y ./<h h,
ooo 100-
10-
20 s^
hJ
14
18
A Kl
7
AS
c 12-
9 -
6 -
3 "
11
J£ ^T\ IN1
jj
1 2 '
9 -
6 "
3 -
15
t H lni
K AlV1
Mf /A/I
12-
9 -
6-
3 -
19 ^ *
0> 12 *
9 •
b' •
3 •
23 .
/V J ' F ' M ' A ' M J
12 •
9 •
6 •
3 •
' J ' A ' S ' O ' N 'D
j F ' M ' A ' M ' J 'J A ' S b *N rD J ' F ' M 'A 'M J ' J A 's *o ' N ' D J ' F "M 'A ' M ' J 'J 'A ' S "O "N
Htovo Pongola Pongola
Proceedings of The South African Sugar Technologists' Association —
build-up in numbers in all fields but one. It commenced during the cooler March-April period, and reached a very high peak at the end of the third week in May. Then, within a week, there followed a sudden drop in numbers to previous high levels, which lasted during winter into July. After this there was a steep decline, apparent in unharvested fields, into the hot summer months. The exception was Field 18, where numbers were highest in early April. At Pongola (Fig. 1, No. 26), where counts were started in April and taken less frequently than in Swaziland, a similar situation occurred with high winter numbers declining as summer approached. At Illovo (Fig. 1, No. 24), where population densities were comparatively low throughout the year, the highest peak was again in May, with others occurring during March, August, October and November, indicating a more even distribution of numbers throughout the year.
The factors responsible for the very high numbers of P. saccharicida in Swaziland and Pongola during the winter months, when their life cycle lasts longer, are at present obscure.
For four fields (Fig. 3, Nos. 24, 25, 26 and 17) the percentage of total eggs parasitized have been plotted. All of the eggs from forty of the lowest green leaves, taken throughout the length of the field, were analysed for parasitism, and the results expressed as a percentage. There was an overall tendency for egg parasitism to decrease over the period during which these studies were made. The highest percentages occurred at Illovo. The egg parasites must have had an influence on insect numbers-but they were not shown to be a primary cause of the population fluctuations.
Although a young field of sugarcane is soon populated by P. saccharicida, it seemed unlikely that mass migratory movements were responsible for the sudden increases during May, as there were no fields among those sampled which showed a corresponding fall in numbers, and the insect does not inhabit grasses (see later). In Swaziland the fields with less mature cane (Fig. 1, Nos. 1, 2, 3, 4, 5, 6, 11 and 18) carried far higher numbers at their peaks (with the possible exception of Field 11) than did the other fields with more mature cane. As the fields lay grouped roughly into two sections, one with older cane and the other with younger cane, these differences could possibly be explained on a positional basis. An argument against this was the position of Field 18, which, although surrounded by some of the most mature cane, gave two of the highest counts.
It is known that high levels of nitrogen in sugarcane result in increased fecundity of P. vitiensis (Osborne, 1966), the West Indian canefly, Saccharo-sydne saccharivora Westw. (Metcalfe, 1965) and Numicia viridis Muir (Harris, 1968). This factor could explain- partly if not entirely, the occurrence of proportionately lower numbers in mature cane. The cane in Field 26 (see Fig. 1) was not cut during the period of observation, and numbers dropped from April to November. In Field 25 numbers
— June 1970 171
started dropping at the same time, but rose again between July and September, probably as a result of the presence of young and more nutritious ratoon cane.
Differential Cane Susceptibility Figs. 1 and 2 show that there was no obvious
difference in the populations occurring on plant cane and on ratoon cane. Certain varieties have been reported as being more susceptible to attack by P. saccharicida (Anon., 1967) but no such differences were apparent between the following four varieties sampled in this experiment:
N:Co.310 (Fields 4, 12, 13), N:Co.334 (Field 17), N.55/805 (Fields 5, 6) and N:Co.376 (all others).
Oviposition The most striking visible feature in a sugarcane
field attacked by P. saccharicida is the red blotches on the leaf midrib. This discolouration of the tissue surrounding one or more egg batches, which are inserted into the leaf tissue, is caused by a secondary fungal infection (Williams, 1957).
In Mauritius, egg batches of P. saccharicida usually contained 3-5 eggs (Williams, 1957). In Madagascar six eggs were more common, with a maximum of 10 (Frappa, 1955). In South Africa and Swaziland batches with as many as 12 eggs were found but these were rare. Batches with a double row of eggs were numerous at times, as shown in Fig. 3, No. 17, where the percentage of double-rowed batches over a seven-month period is plotted. This percentage ranged between 2 and 18%. The maximum amount of double-rowed batches occurred during April. This could be indicative of a higher rate of oviposition before the population peaked in May.
The average number of eggs per batch was plotted for Fields 17, 24 and 26, in which it varied between slightly more than three and slightly more than five, Fig. 3. Overall means of eggs per batch were: Field 17, 4.5; 24, 4.2; and 26, 4.3. These figures increased with population densities from one area to the next, but the differences are too small for conclusions to be drawn.
P. saccharicida eggs were found on all aerial portions of the cane plant, most being laid into the proximal upper surface of the leaf midrib. Where adult numbers were very high, heavy oviposition on. the stalk was observed. These observations are similar to those made in other countries (Williams, 1957).
Oviposition into the back of the midrib occurred frequently and the incidence of this is shown in Fig. 3, Nos. 17 and 26, where the percentage of egg batches so laid is plotted. In Field 17 during October as much as 25 % of egg batches were laid in the back of the midrib, and there was a tendency for this to happen more frequently during periods of low population density.
Eggs laid into the leafsheath were less heavily parasitized than those inserted into the midrib.
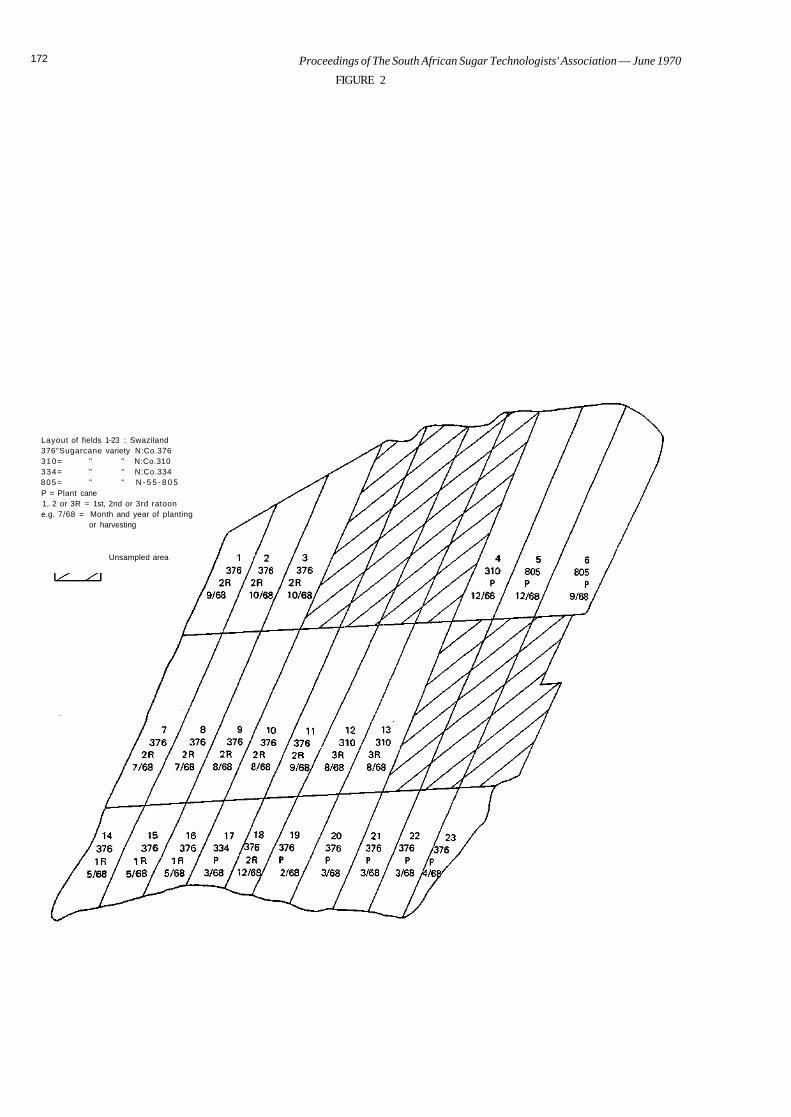
172 Proceedings of The South African Sugar Technologists' Association — June 1970
FIGURE 2
Layout of fields 1-23 : Swaziland 376"Sugarcane variety N:Co.376 310= " " N:Co.310 334= " " N:Co.334 805= " " N - 5 5 - 8 0 5 P = Plant cane 1, 2 or 3R = 1st, 2nd or 3rd ratoon e.g. 7/68 = Month and year of planting
or harvesting
Unsampled area
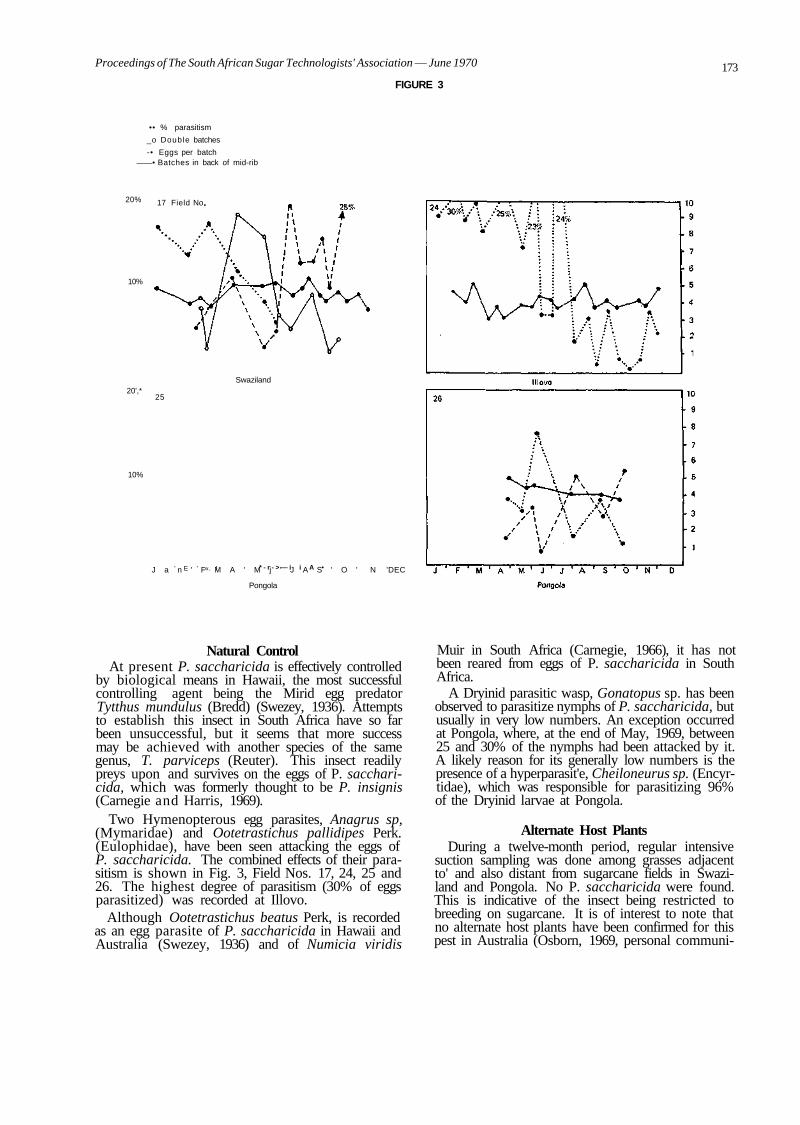
Proceedings of The South African Sugar Technologists' Association — June 1970
FIGURE 3
•• % parasitism
_o Double batches
-• Eggs per batch • Batches in back of mid-rib
20%
10%
17 Field No
Swaziland 20',*
10%
25
' E ' «. I * - r - > — i i A • J a n ' F M A ' M j ' J A S ' O ' N 'DEC
Pongola
173
Natural Control At present P. saccharicida is effectively controlled
by biological means in Hawaii, the most successful controlling agent being the Mirid egg predator Tytthus mundulus (Bredd) (Swezey, 1936). Attempts to establish this insect in South Africa have so far been unsuccessful, but it seems that more success may be achieved with another species of the same genus, T. parviceps (Reuter). This insect readily preys upon and survives on the eggs of P. saccharicida, which was formerly thought to be P. insignis (Carnegie and Harris, 1969).
Two Hymenopterous egg parasites, Anagrus sp, (Mymaridae) and Ootetrastichus pallidipes Perk. (Eulophidae), have been seen attacking the eggs of P. saccharicida. The combined effects of their parasitism is shown in Fig. 3, Field Nos. 17, 24, 25 and 26. The highest degree of parasitism (30% of eggs parasitized) was recorded at Illovo.
Although Ootetrastichus beatus Perk, is recorded as an egg parasite of P. saccharicida in Hawaii and Australia (Swezey, 1936) and of Numicia viridis
Muir in South Africa (Carnegie, 1966), it has not been reared from eggs of P. saccharicida in South Africa.
A Dryinid parasitic wasp, Gonatopus sp. has been observed to parasitize nymphs of P. saccharicida, but usually in very low numbers. An exception occurred at Pongola, where, at the end of May, 1969, between 25 and 30% of the nymphs had been attacked by it. A likely reason for its generally low numbers is the presence of a hyperparasit'e, Cheiloneurus sp. (Encyr-tidae), which was responsible for parasitizing 96% of the Dryinid larvae at Pongola.
Alternate Host Plants During a twelve-month period, regular intensive
suction sampling was done among grasses adjacent to' and also distant from sugarcane fields in Swaziland and Pongola. No P. saccharicida were found. This is indicative of the insect being restricted to breeding on sugarcane. It is of interest to note that no alternate host plants have been confirmed for this pest in Australia (Osborn, 1969, personal communi-
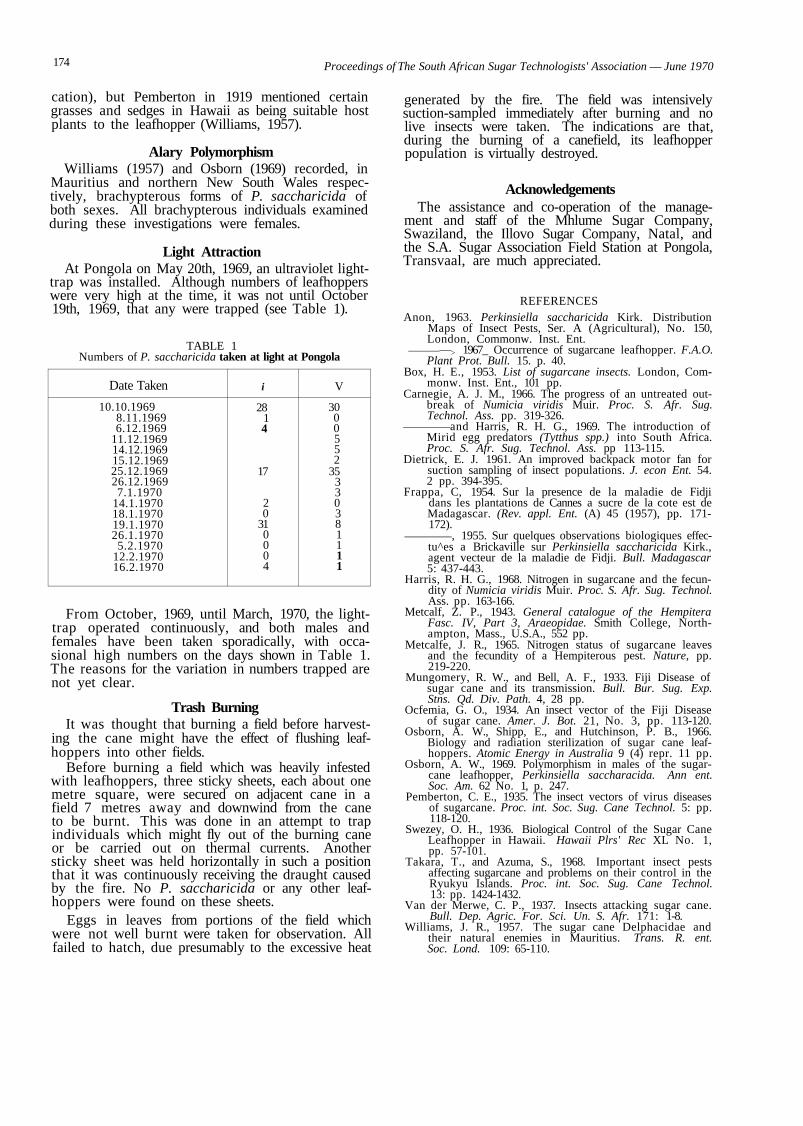
174 Proceedings of The South African Sugar Technologists' Association — June 1970
cation), but Pemberton in 1919 mentioned certain grasses and sedges in Hawaii as being suitable host plants to the leafhopper (Williams, 1957).
Alary Polymorphism Williams (1957) and Osborn (1969) recorded, in
Mauritius and northern New South Wales respectively, brachypterous forms of P. saccharicida of both sexes. All brachypterous individuals examined during these investigations were females.
Light Attraction At Pongola on May 20th, 1969, an ultraviolet light-
trap was installed. Although numbers of leafhoppers were very high at the time, it was not until October 19th, 1969, that any were trapped (see Table 1).
TABLE 1 Numbers of P. saccharicida taken at light at Pongola
Date Taken
10.10.1969 8.11.1969 6.12.1969
11.12.1969 14.12.1969 15.12.1969 25.12.1969 26.12.1969 7.1.1970
14.1.1970 18.1.1970 19.1.1970 26.1.1970 5.2.1970
12.2.1970 16.2.1970
i
28 1 4
17
2 0
31 0 0 0 4
V
30 0 0 5 5 2
35 3 3 0 3 8 1 1 1 1
From October, 1969, until March, 1970, the light-trap operated continuously, and both males and females have been taken sporadically, with occasional high numbers on the days shown in Table 1. The reasons for the variation in numbers trapped are not yet clear.
Trash Burning It was thought that burning a field before harvest
ing the cane might have the effect of flushing leafhoppers into other fields.
Before burning a field which was heavily infested with leafhoppers, three sticky sheets, each about one metre square, were secured on adjacent cane in a field 7 metres away and downwind from the cane to be burnt. This was done in an attempt to trap individuals which might fly out of the burning cane or be carried out on thermal currents. Another sticky sheet was held horizontally in such a position that it was continuously receiving the draught caused by the fire. No P. saccharicida or any other leafhoppers were found on these sheets.
Eggs in leaves from portions of the field which were not well burnt were taken for observation. All failed to hatch, due presumably to the excessive heat
generated by the fire. The field was intensively suction-sampled immediately after burning and no live insects were taken. The indications are that, during the burning of a canefield, its leafhopper population is virtually destroyed.
Acknowledgements The assistance and co-operation of the manage
ment and staff of the Mhlume Sugar Company, Swaziland, the Illovo Sugar Company, Natal, and the S.A. Sugar Association Field Station at Pongola, Transvaal, are much appreciated.
REFERENCES Anon, 1963. Perkinsiella saccharicida Kirk. Distribution
Maps of Insect Pests, Ser. A (Agricultural), No. 150, London, Commonw. Inst. Ent.
—> 1967_ Occurrence of sugarcane leafhopper. F.A.O. Plant Prot. Bull. 15. p. 40.
Box, H. E., 1953. List of sugarcane insects. London, Commonw. Inst. Ent., 101 pp.
Carnegie, A. J. M., 1966. The progress of an untreated outbreak of Numicia viridis Muir. Proc. S. Afr. Sug. Technol. Ass. pp. 319-326.
and Harris, R. H. G., 1969. The introduction of Mirid egg predators (Tytthus spp.) into South Africa. Proc. S. Afr. Sug. Technol. Ass. pp 113-115.
Dietrick, E. J. 1961. An improved backpack motor fan for suction sampling of insect populations. J. econ Ent. 54. 2 pp. 394-395.
Frappa, C, 1954. Sur la presence de la maladie de Fidji dans les plantations de Cannes a sucre de la cote est de Madagascar. (Rev. appl. Ent. (A) 45 (1957), pp. 171-172).
, 1955. Sur quelques observations biologiques effec-tu^es a Brickaville sur Perkinsiella saccharicida Kirk., agent vecteur de la maladie de Fidji. Bull. Madagascar 5: 437-443.
Harris, R. H. G., 1968. Nitrogen in sugarcane and the fecundity of Numicia viridis Muir. Proc. S. Afr. Sug. Technol. Ass. pp. 163-166.
Metcalf, Z. P., 1943. General catalogue of the Hempitera Fasc. IV, Part 3, Araeopidae. Smith College, Northampton, Mass., U.S.A., 552 pp.
Metcalfe, J. R., 1965. Nitrogen status of sugarcane leaves and the fecundity of a Hempiterous pest. Nature, pp. 219-220.
Mungomery, R. W., and Bell, A. F., 1933. Fiji Disease of sugar cane and its transmission. Bull. Bur. Sug. Exp. Stns. Qd. Div. Path. 4, 28 pp.
Ocfemia, G. O., 1934. An insect vector of the Fiji Disease of sugar cane. Amer. J. Bot. 21, No. 3, pp. 113-120.
Osborn, A. W., Shipp, E., and Hutchinson, P. B., 1966. Biology and radiation sterilization of sugar cane leafhoppers. Atomic Energy in Australia 9 (4) repr. 11 pp.
Osborn, A. W., 1969. Polymorphism in males of the sugarcane leafhopper, Perkinsiella saccharacida. Ann ent. Soc. Am. 62 No. 1, p. 247.
Pemberton, C. E., 1935. The insect vectors of virus diseases of sugarcane. Proc. int. Soc. Sug. Cane Technol. 5: pp. 118-120.
Swezey, O. H., 1936. Biological Control of the Sugar Cane Leafhopper in Hawaii. Hawaii Plrs' Rec XL No. 1, pp. 57-101.
Takara, T., and Azuma, S., 1968. Important insect pests affecting sugarcane and problems on their control in the Ryukyu Islands. Proc. int. Soc. Sug. Cane Technol. 13: pp. 1424-1432.
Van der Merwe, C. P., 1937. Insects attacking sugar cane. Bull. Dep. Agric. For. Sci. Un. S. Afr. 171: 1-8.
Williams, J. R., 1957. The sugar cane Delphacidae and their natural enemies in Mauritius. Trans. R. ent. Soc. Lond. 109: 65-110.

— June 1970 175 Proceedings of The South African Sugar Technologists' Association
Discussion
Dr. Dick: This insect is the vector of a very serious virus disease which has already reached Madagascar. It is almost certain that it will reach South Africa eventually so the more we know about it the better.
Mr. Andries: I was associated with the Experiment
Stations' entomologists when they investigated Numicia in Swaziland, a pest we did not take seriously at first and I am glad they are now investigating Perkinsiella.
Mr. Bartlett (in the chair): I think it is most important that we should have some prior knowledge of pests that are likely to arrive in this country.
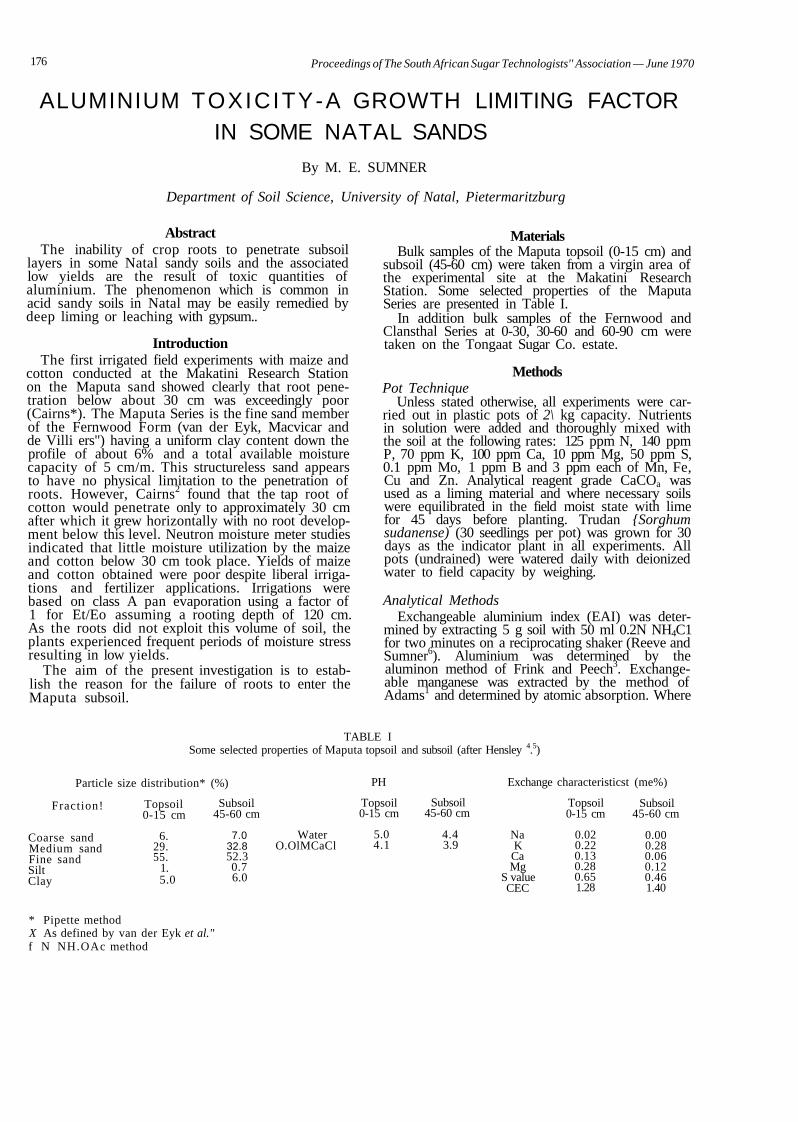
176 Proceedings of The South African Sugar Technologists'' Association — June 1970
ALUMINIUM TOXICITY-A GROWTH LIMITING FACTOR IN SOME NATAL SANDS
By M. E. SUMNER
Department of Soil Science, University of Natal, Pietermaritzburg
Abstract The inability of crop roots to penetrate subsoil
layers in some Natal sandy soils and the associated low yields are the result of toxic quantities of aluminium. The phenomenon which is common in acid sandy soils in Natal may be easily remedied by deep liming or leaching with gypsum..
Introduction The first irrigated field experiments with maize and
cotton conducted at the Makatini Research Station on the Maputa sand showed clearly that root penetration below about 30 cm was exceedingly poor (Cairns*). The Maputa Series is the fine sand member of the Fernwood Form (van der Eyk, Macvicar and de Villi ers") having a uniform clay content down the profile of about 6% and a total available moisture capacity of 5 cm/m. This structureless sand appears to have no physical limitation to the penetration of roots. However, Cairns2 found that the tap root of cotton would penetrate only to approximately 30 cm after which it grew horizontally with no root development below this level. Neutron moisture meter studies indicated that little moisture utilization by the maize and cotton below 30 cm took place. Yields of maize and cotton obtained were poor despite liberal irrigations and fertilizer applications. Irrigations were based on class A pan evaporation using a factor of 1 for Et/Eo assuming a rooting depth of 120 cm. As the roots did not exploit this volume of soil, the plants experienced frequent periods of moisture stress resulting in low yields.
The aim of the present investigation is to establish the reason for the failure of roots to enter the Maputa subsoil.
Materials Bulk samples of the Maputa topsoil (0-15 cm) and
subsoil (45-60 cm) were taken from a virgin area of the experimental site at the Makatini Research Station. Some selected properties of the Maputa Series are presented in Table I.
In addition bulk samples of the Fernwood and Clansthal Series at 0-30, 30-60 and 60-90 cm were taken on the Tongaat Sugar Co. estate.
Methods Pot Technique
Unless stated otherwise, all experiments were carried out in plastic pots of 2\ kg capacity. Nutrients in solution were added and thoroughly mixed with the soil at the following rates: 125 ppm N, 140 ppm P, 70 ppm K, 100 ppm Ca, 10 ppm Mg, 50 ppm S, 0.1 ppm Mo, 1 ppm B and 3 ppm each of Mn, Fe, Cu and Zn. Analytical reagent grade CaCOa was used as a liming material and where necessary soils were equilibrated in the field moist state with lime for 45 days before planting. Trudan {Sorghum sudanense) (30 seedlings per pot) was grown for 30 days as the indicator plant in all experiments. All pots (undrained) were watered daily with deionized water to field capacity by weighing.
Analytical Methods Exchangeable aluminium index (EAI) was deter
mined by extracting 5 g soil with 50 ml 0.2N NH4C1 for two minutes on a reciprocating shaker (Reeve and Sumner6). Aluminium was determined by the aluminon method of Frink and Peech3. Exchangeable manganese was extracted by the method of Adams1 and determined by atomic absorption. Where
TABLE I Some selected properties of Maputa topsoil and subsoil (after Hensley 4.5)
Particle size distribution* (%)
Fraction!
Coarse sand Medium sand Fine sand Silt Clay
Topsoil 0-15 cm
6. 29. 55.
1. 5.0
Subsoil 45-60 cm
7.0 32.8 52.3 0.7 6.0
PH
Water O.OlMCaCl
Topsoil 0-15 cm
5.0 4.1
Subsoil 45-60 cm
4.4 3.9
Exchange characteristicst (me%)
Na K Ca Mg
S value CEC
Topsoil 0-15 cm
0.02 0.22 0.13 0.28 0.65 1.28
Subsoil 45-60 cm
0.00 0.28 0.06 0.12 0.46 1.40
* Pipette method X As defined by van der Eyk et al." f N NH.OAc method
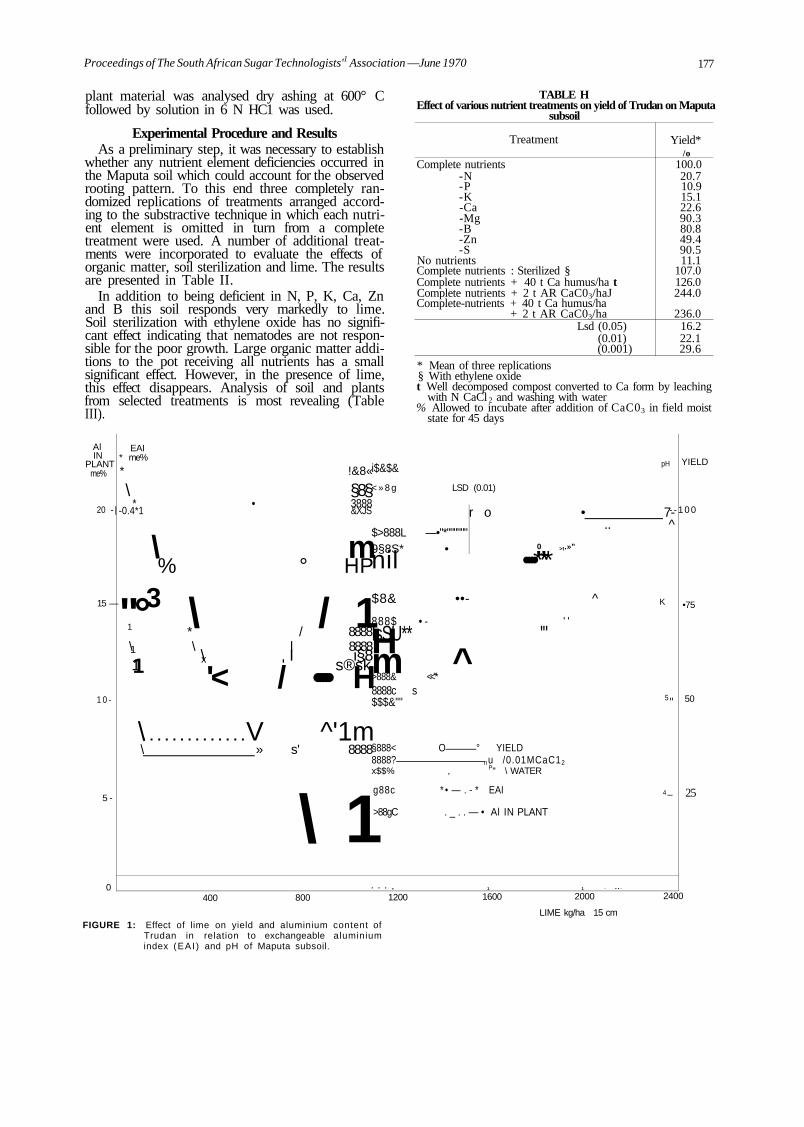
Proceedings of The South African Sugar Technologists'1 Association —June 1970 177
plant material was analysed dry ashing at 600° C followed by solution in 6 N HC1 was used.
Experimental Procedure and Results As a preliminary step, it was necessary to establish
whether any nutrient element deficiencies occurred in the Maputa soil which could account for the observed rooting pattern. To this end three completely randomized replications of treatments arranged according to the substractive technique in which each nutrient element is omitted in turn from a complete treatment were used. A number of additional treatments were incorporated to evaluate the effects of organic matter, soil sterilization and lime. The results are presented in Table II.
In addition to being deficient in N, P, K, Ca, Zn and B this soil responds very markedly to lime. Soil sterilization with ethylene oxide has no significant effect indicating that nematodes are not responsible for the poor growth. Large organic matter additions to the pot receiving all nutrients has a small significant effect. However, in the presence of lime, this effect disappears. Analysis of soil and plants from selected treatments is most revealing (Table III).
TABLE H Effect of various nutrient treatments on yield of Trudan on Maputa
subsoil
Complete nutrients -N -P -K -Ca -Mg -B -Zn -S
No nutrients Complete nutrients
Treatment
: Sterilized § Complete nutrients + 40 t Ca humus/ha t Complete nutrients + 2 t AR CaC03/haJ Complete-nutrients + 40 t Ca humus/ha
+ 2 t AR CaC03/ha Lsd (0.05)
(0.01) (0.001)
Yield* /o
100.0 20.7 10.9 15.1 22.6 90.3 80.8 49.4 90.5 11.1
107.0 126.0 244.0
236.0 16.2 22.1 29.6
* Mean of three replications § With ethylene oxide t Well decomposed compost converted to Ca form by leaching
with N CaCl 2 and washing with water % Allowed to incubate after addition of CaC03 in field moist
state for 45 days
Al IN
PLANT me%
20 - |
15 —
1 0 -
5 -
0
EAI * me%
* !&8«
\ §8§ * • 3888
-0.4*1 &XJS
\ m % ° HP
"°3 \ / 1 1 * / 8888 \ \ l 8888 1 \ I i§8 1 x ' s®sk 1 '< / ••••• H
\ V ^'1m \ » s' 8888
\ 1
i$&$& pH
< » 8 g LSD (0.01)
$>888L —•"*"""""" 9§8S* •
r o • 7-.. ^
0 >t.»"
nil ••••*"** $8& ••- ^ K
888$ • - ' ' IsSU** '" H m ^ >888& <<"* 8888c s $$$&"'' 5 "
§888< O ° YIELD 8888? nu /0.01MCaC12 x$$% , P" \ WATER
g88c * • — . - * EAI 4 _
>88gC . _ . . — • Al IN PLANT
* * * » 1 1 - • • -
YIELD
- - 1 0 0
•75
50
25
400 800 1200 1600
FIGURE 1: Effect of lime on yield and aluminium content of Trudan in relation to exchangeable aluminium index (EAI ) and pH of Maputa subsoil.
2000
LIME kg/ha 15 cm
2400
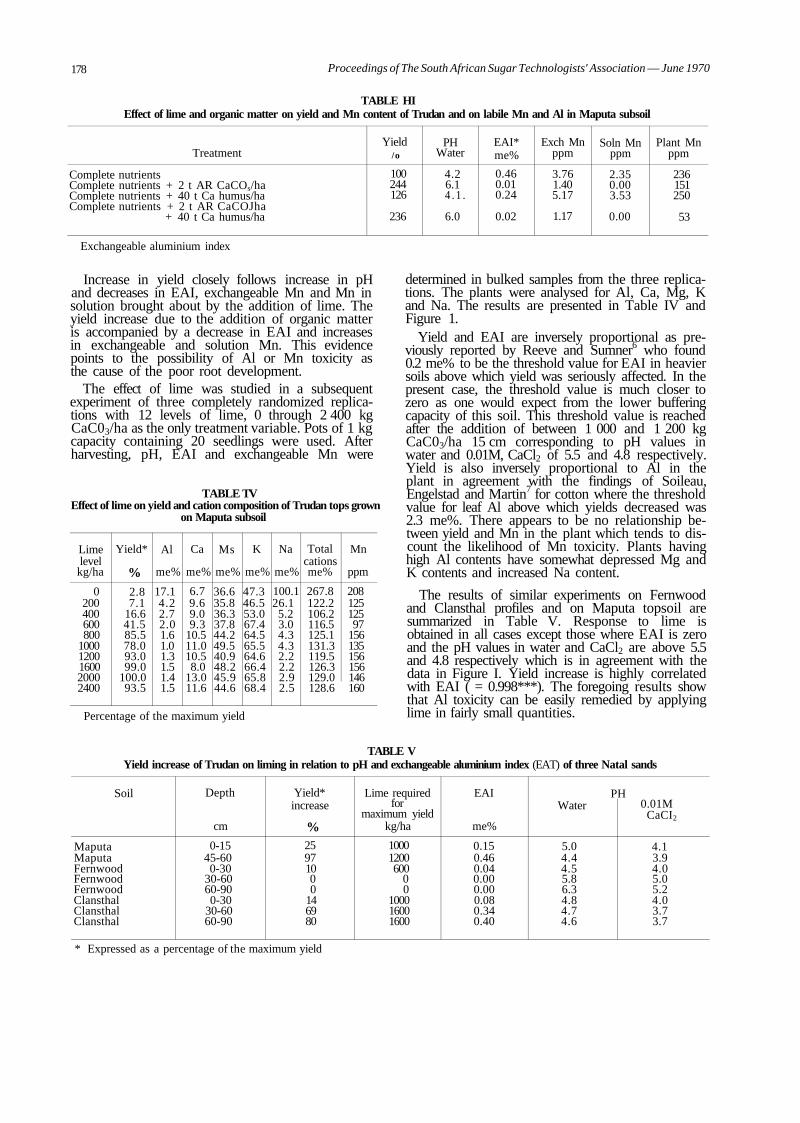
178 Proceedings of The South African Sugar Technologists' Association — June 1970
TABLE HI Effect of lime and organic matter on yield and Mn content of Trudan and on labile Mn and Al in Maputa subsoil
Treatment
Complete nutrients Complete nutrients + 2 t AR CaCOs/ha Complete nutrients + 40 t Ca humus/ha Complete nutrients + 2 t AR CaCOJha
+ 40 t Ca humus/ha
Yield /o
100 244 126
236
PH Water
4.2 6.1 4 . 1 .
6.0
EAI* me%
0.46 0.01 0.24
0.02
Exch Mn ppm
3.76 1.40 5.17
1.17
Soln Mn ppm
2.35 0.00 3.53
0.00
Plant Mn ppm
236 151 250
53
Exchangeable aluminium index
Increase in yield closely follows increase in pH and decreases in EAI, exchangeable Mn and Mn in solution brought about by the addition of lime. The yield increase due to the addition of organic matter is accompanied by a decrease in EAI and increases in exchangeable and solution Mn. This evidence points to the possibility of Al or Mn toxicity as the cause of the poor root development.
The effect of lime was studied in a subsequent experiment of three completely randomized replications with 12 levels of lime, 0 through 2 400 kg CaC03/ha as the only treatment variable. Pots of 1 kg capacity containing 20 seedlings were used. After harvesting, pH, EAI and exchangeable Mn were
TABLE TV Effect of lime on yield and cation composition of Trudan tops grown
on Maputa subsoil
Lime level kg/ha
0 200 400 600 800
1000 1200 1600 2000 2400
Yield*
% 2.8 7.1
16.6 41.5 85.5 78.0 93.0 99.0
100.0 93.5
Al
me%
17.1 4.2 2.7 2.0 1.6 1.0 1.3 1.5 1.4 1.5
Ca
me%
6.7 9.6 9.0 9.3
10.5 11.0 10.5 8.0
13.0 11.6
Ms
me%
36.6 35.8 36.3 37.8 44.2 49.5 40.9 48.2 45.9 44.6
K
me%
47.3 46.5 53.0 67.4 64.5 65.5 64.6 66.4 65.8 68.4
Na
me%
100.1 26.1 5.2 3.0 4.3 4.3 2.2 2.2 2.9 2.5
Total cations me%
267.8 122.2 106.2 116.5 125.1 131.3 119.5 126.3 129.0
Mn
ppm
208 125 125 97
156 135 156 156 146
128.6 160
Percentage of the maximum yield
determined in bulked samples from the three replications. The plants were analysed for Al, Ca, Mg, K and Na. The results are presented in Table IV and Figure 1.
Yield and EAI are inversely proportional as previously reported by Reeve and Sumner6 who found 0.2 me% to be the threshold value for EAI in heavier soils above which yield was seriously affected. In the present case, the threshold value is much closer to zero as one would expect from the lower buffering capacity of this soil. This threshold value is reached after the addition of between 1 000 and 1 200 kg CaC03/ha 15 cm corresponding to pH values in water and 0.01M, CaCl2 of 5.5 and 4.8 respectively. Yield is also inversely proportional to Al in the plant in agreement with the findings of Soileau, Engelstad and Martin7 for cotton where the threshold value for leaf Al above which yields decreased was 2.3 me%. There appears to be no relationship between yield and Mn in the plant which tends to discount the likelihood of Mn toxicity. Plants having high Al contents have somewhat depressed Mg and K contents and increased Na content.
The results of similar experiments on Fernwood and Clansthal profiles and on Maputa topsoil are summarized in Table V. Response to lime is obtained in all cases except those where EAI is zero and the pH values in water and CaCl2 are above 5.5 and 4.8 respectively which is in agreement with the data in Figure I. Yield increase is highly correlated with EAI ( = 0.998***). The foregoing results show that Al toxicity can be easily remedied by applying lime in fairly small quantities.
TABLE V Yield increase of Trudan on liming in relation to pH and exchangeable aluminium index (EAT) of three Natal sands
Soil
Maputa Maputa Fernwood Fernwood Fernwood Clansthal Clansthal Clansthal
Depth
cm
0-15 45-60 0-30
30-60 60-90 0-30
30-60 60-90
Yield* increase
% 25 97 10 0 0
14 69 80
Lime required for
maximum yield kg/ha
1000 1200 600
0 0
1000 1600 1600
EAI
me%
0.15 0.46 0.04 0.00 0.00 0.08 0.34 0.40
PH Water
5.0 4.4 4.5 5.8 6.3 4.8 4.7 4.6
0.01M CaCI2
4.1 3.9 4.0 5.0 5.2 4.0 3.7 3.7
* Expressed as a percentage of the maximum yield
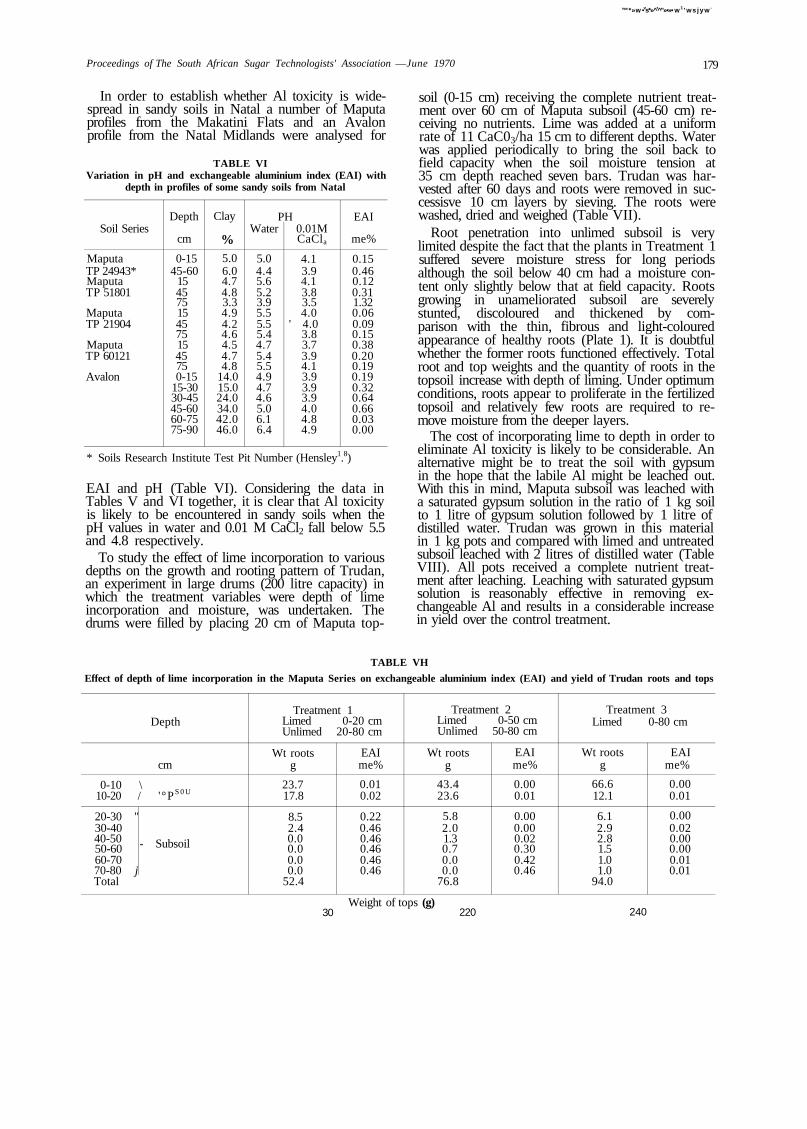
™*»w •vs*» r "»•»• w 1 'ws jyw -
Proceedings of The South African Sugar Technologists' Association —June 1970 179
In order to establish whether Al toxicity is widespread in sandy soils in Natal a number of Maputa profiles from the Makatini Flats and an Avalon profile from the Natal Midlands were analysed for
TABLE VI Variation in pH and exchangeable aluminium index (EAI) with
depth in profiles of some sandy soils from Natal
Soil Series
Maputa TP 24943* Maputa TP 51801
Maputa TP 21904
Maputa TP 60121
Avalon
Depth
cm
0-15 45-60
15 45 75 15 45 75 15 45 75 0-15
15-30 30-45 45-60 60-75 75-90
Clay
% 5.0 6.0 4.7 4.8 3.3 4.9 4.2 4.6 4.5 4.7 4.8
14.0 15.0 24.0 34.0 42.0 46.0
PH Water
5.0 4.4 5.6 5.2 3.9 5.5 5.5 5.4 4.7 5.4 5.5 4.9 4.7 4.6 5.0 6.1 6.4
0.01M CaCla
4.1 3.9 4.1 3.8 3.5 4.0
' 4.0 3.8 3.7 3.9 4.1 3.9 3.9 3.9 4.0 4.8 4.9
EAI
me%
0.15 0.46 0.12 0.31 1.32 0.06 0.09 0.15 0.38 0.20 0.19 0.19 0.32 0.64 0.66 0.03 0.00
* Soils Research Institute Test Pit Number (Hensley1.8)
EAI and pH (Table VI). Considering the data in Tables V and VI together, it is clear that Al toxicity is likely to be encountered in sandy soils when the pH values in water and 0.01 M CaCl2 fall below 5.5 and 4.8 respectively.
To study the effect of lime incorporation to various depths on the growth and rooting pattern of Trudan, an experiment in large drums (200 litre capacity) in which the treatment variables were depth of lime incorporation and moisture, was undertaken. The drums were filled by placing 20 cm of Maputa top-
soil (0-15 cm) receiving the complete nutrient treatment over 60 cm of Maputa subsoil (45-60 cm) receiving no nutrients. Lime was added at a uniform rate of 11 CaC03/ha 15 cm to different depths. Water was applied periodically to bring the soil back to field capacity when the soil moisture tension at 35 cm depth reached seven bars. Trudan was harvested after 60 days and roots were removed in suc-cessisve 10 cm layers by sieving. The roots were washed, dried and weighed (Table VII).
Root penetration into unlimed subsoil is very limited despite the fact that the plants in Treatment 1 suffered severe moisture stress for long periods although the soil below 40 cm had a moisture content only slightly below that at field capacity. Roots growing in unameliorated subsoil are severely stunted, discoloured and thickened by comparison with the thin, fibrous and light-coloured appearance of healthy roots (Plate 1). It is doubtful whether the former roots functioned effectively. Total root and top weights and the quantity of roots in the topsoil increase with depth of liming. Under optimum conditions, roots appear to proliferate in the fertilized topsoil and relatively few roots are required to remove moisture from the deeper layers.
The cost of incorporating lime to depth in order to eliminate Al toxicity is likely to be considerable. An alternative might be to treat the soil with gypsum in the hope that the labile Al might be leached out. With this in mind, Maputa subsoil was leached with a saturated gypsum solution in the ratio of 1 kg soil to 1 litre of gypsum solution followed by 1 litre of distilled water. Trudan was grown in this material in 1 kg pots and compared with limed and untreated subsoil leached with 2 litres of distilled water (Table VIII). All pots received a complete nutrient treatment after leaching. Leaching with saturated gypsum solution is reasonably effective in removing exchangeable Al and results in a considerable increase in yield over the control treatment.
TABLE VH
Effect of depth of lime incorporation in the Maputa Series on exchangeable aluminium index (EAI) and yield of Trudan roots and tops
0-10 \
Depth
cm
10-20 / ' °P S 0 U
20-30 " 30-40 40-50 50-60 60-70 70-80 j Total
- Subsoil
Treatment 1 Limed 0-20 cm Unlimed 20-80 cm
Wt roots g
23.7 17.8
8.5 2.4 0.0 0.0 0.0 0.0
52.4
EAI me%
0.01 0.02
0.22 0.46 0.46 0.46 0.46 0.46
Treatment 2 Limed 0-50 cm Unlimed 50-80 cm
Wt roots g
43.4 23.6
5.8 2.0 1.3 0.7 0.0 0.0
76.8
EAI me%
0.00 0.01
0.00 0.00 0.02 0.30 0.42 0.46
Treatment 3 Limed 0-80 cm
Wt roots g
66.6 12.1
6.1 2.9 2.8 1.5 1.0 1.0
94.0
EAI me%
0.00 0.01
0.00 0.02 0.00 0.00 0.01 0.01
30 Weight of tops (g)
220 240
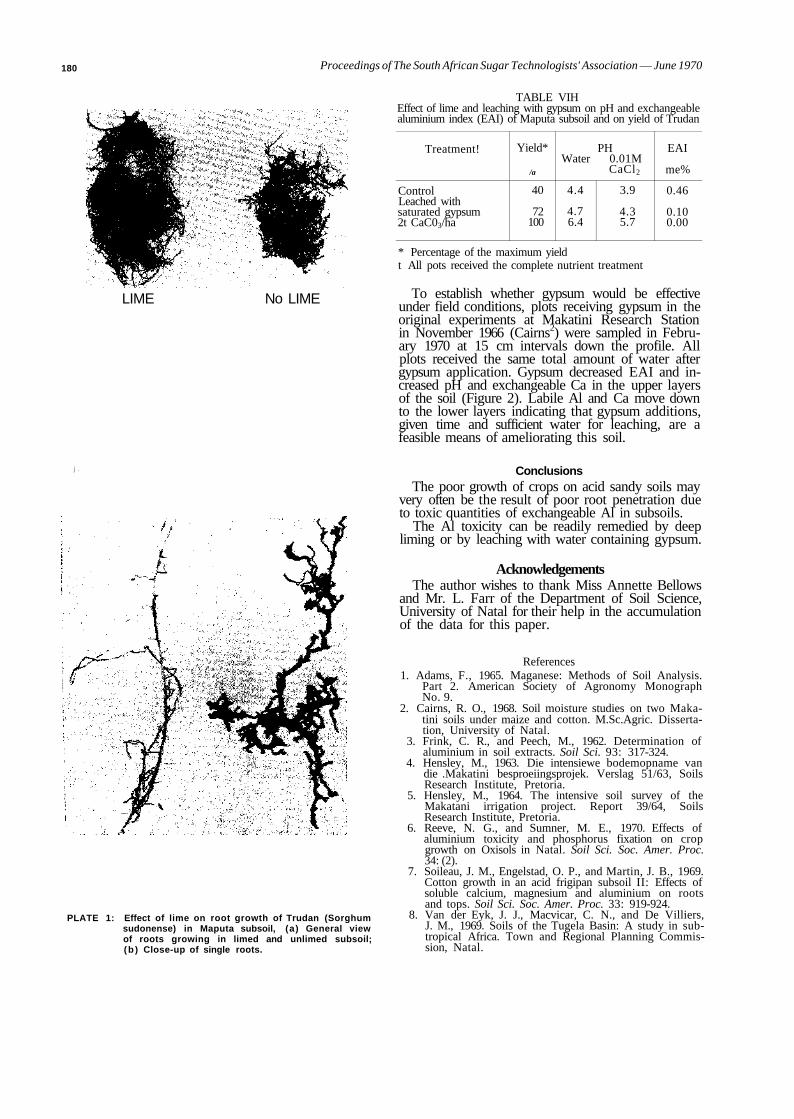
180 Proceedings of The South African Sugar Technologists' Association — June 1970
LIME No LIME
j .
PLATE 1: Effect of lime on root growth of Trudan (Sorghum sudonense) in Maputa subsoil, (a) General view of roots growing in limed and unlimed subsoil; (b ) Close-up of single roots.
TABLE VIH Effect of lime and leaching with gypsum on pH and exchangeable aluminium index (EAI) of Maputa subsoil and on yield of Trudan
Treatment!
Control Leached with saturated gypsum 2t CaC03/ha
Yield*
/a
40
72 100
PH Water 0.01M
CaCl2
4.4
4.7 6.4
3.9
4.3 5.7
EAI
me%
0.46
0.10 0.00
* Percentage of the maximum yield t All pots received the complete nutrient treatment
To establish whether gypsum would be effective under field conditions, plots receiving gypsum in the original experiments at Makatini Research Station in November 1966 (Cairns2) were sampled in February 1970 at 15 cm intervals down the profile. All plots received the same total amount of water after gypsum application. Gypsum decreased EAI and increased pH and exchangeable Ca in the upper layers of the soil (Figure 2). Labile Al and Ca move down to the lower layers indicating that gypsum additions, given time and sufficient water for leaching, are a feasible means of ameliorating this soil.
Conclusions The poor growth of crops on acid sandy soils may
very often be the result of poor root penetration due to toxic quantities of exchangeable Al in subsoils.
The Al toxicity can be readily remedied by deep liming or by leaching with water containing gypsum.
Acknowledgements The author wishes to thank Miss Annette Bellows
and Mr. L. Farr of the Department of Soil Science, University of Natal for their help in the accumulation of the data for this paper.
References 1. Adams, F., 1965. Maganese: Methods of Soil Analysis.
Part 2. American Society of Agronomy Monograph No. 9.
2. Cairns, R. O., 1968. Soil moisture studies on two Makatini soils under maize and cotton. M.Sc.Agric. Dissertation, University of Natal.
3. Frink, C. R., and Peech, M., 1962. Determination of aluminium in soil extracts. Soil Sci. 93: 317-324.
4. Hensley, M., 1963. Die intensiewe bodemopname van die .Makatini besproeiingsprojek. Verslag 51/63, Soils Research Institute, Pretoria.
5. Hensley, M., 1964. The intensive soil survey of the Makatani irrigation project. Report 39/64, Soils Research Institute, Pretoria.
6. Reeve, N. G., and Sumner, M. E., 1970. Effects of aluminium toxicity and phosphorus fixation on crop growth on Oxisols in Natal. Soil Sci. Soc. Amer. Proc. 34: (2).
7. Soileau, J. M., Engelstad, O. P., and Martin, J. B., 1969. Cotton growth in an acid frigipan subsoil II: Effects of soluble calcium, magnesium and aluminium on roots and tops. Soil Sci. Soc. Amer. Proc. 33: 919-924.
8. Van der Eyk, J. J., Macvicar, C. N., and De Villiers, J. M., 1969. Soils of the Tugela Basin: A study in subtropical Africa. Town and Regional Planning Commission, Natal.
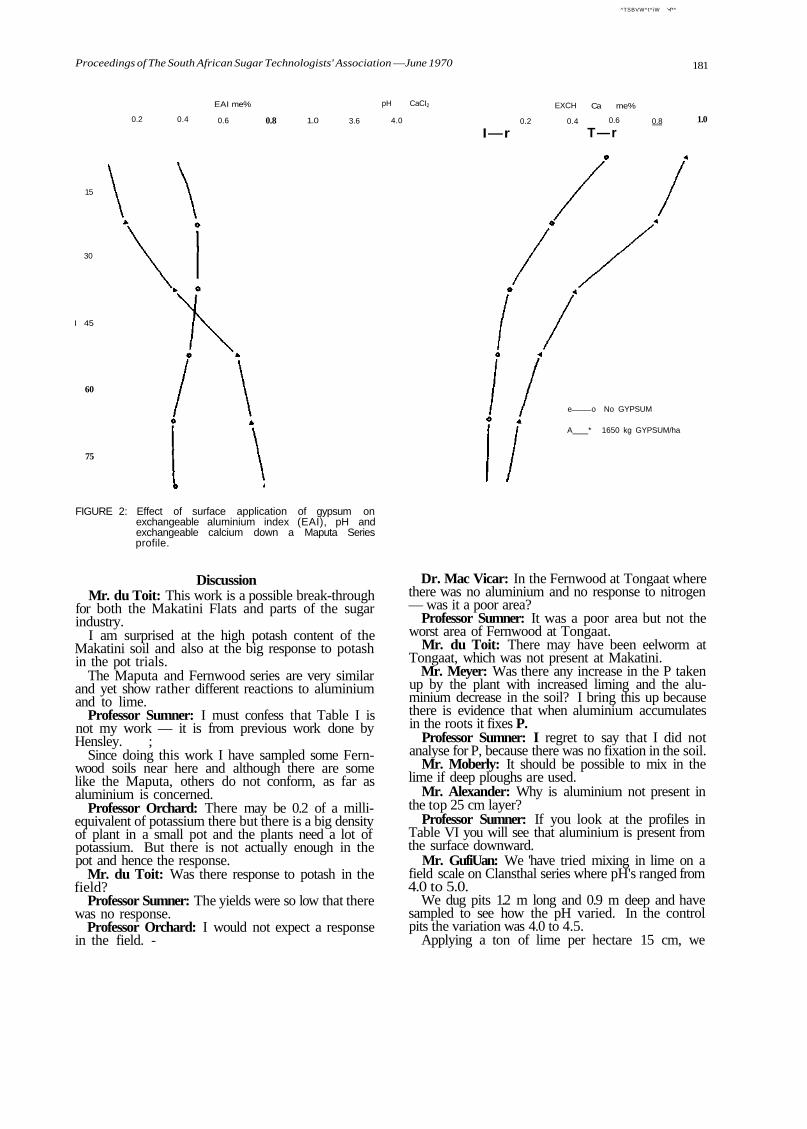
^TSBVW^t^iW '•f*^
Proceedings of The South African Sugar Technologists' Association —June 1970 181
0.2 0.4
EAI me%
0.6 0.8 1.0
15
30
I 45
60
75
3.6
pH CaCI2
4.0
FIGURE 2: Effect of surface application of gypsum on exchangeable aluminium index (EAI), pH and exchangeable calcium down a Maputa Series profile.
0.2
EXCH
0.4
Ca me%
0.6
I—r T—r 0.8 1.0
e o No GYPSUM
A * 1650 kg GYPSUM/ha
Discussion Mr. du Toit: This work is a possible break-through
for both the Makatini Flats and parts of the sugar industry.
I am surprised at the high potash content of the Makatini soil and also at the big response to potash in the pot trials.
The Maputa and Fernwood series are very similar and yet show rather different reactions to aluminium and to lime.
Professor Sumner: I must confess that Table I is not my work — it is from previous work done by Hensley. ;
Since doing this work I have sampled some Fern-wood soils near here and although there are some like the Maputa, others do not conform, as far as aluminium is concerned.
Professor Orchard: There may be 0.2 of a milli-equivalent of potassium there but there is a big density of plant in a small pot and the plants need a lot of potassium. But there is not actually enough in the pot and hence the response.
Mr. du Toit: Was there response to potash in the field?
Professor Sumner: The yields were so low that there was no response.
Professor Orchard: I would not expect a response in the field. -
Dr. Mac Vicar: In the Fernwood at Tongaat where there was no aluminium and no response to nitrogen — was it a poor area?
Professor Sumner: It was a poor area but not the worst area of Fernwood at Tongaat.
Mr. du Toit: There may have been eelworm at Tongaat, which was not present at Makatini.
Mr. Meyer: Was there any increase in the P taken up by the plant with increased liming and the aluminium decrease in the soil? I bring this up because there is evidence that when aluminium accumulates in the roots it fixes P.
Professor Sumner: I regret to say that I did not analyse for P, because there was no fixation in the soil.
Mr. Moberly: It should be possible to mix in the lime if deep ploughs are used.
Mr. Alexander: Why is aluminium not present in the top 25 cm layer?
Professor Sumner: If you look at the profiles in Table VI you will see that aluminium is present from the surface downward.
Mr. GufiUan: We 'have tried mixing in lime on a field scale on Clansthal series where pH's ranged from 4.0 to 5.0.
We dug pits 1.2 m long and 0.9 m deep and have sampled to see how the pH varied. In the control pits the variation was 4.0 to 4.5.
Applying a ton of lime per hectare 15 cm, we

182 Proceedings of The South African Sugar Technologists Association — June 1970
Nardi ploughed to about 75 cm. After six weeks the pH's appear to have gone up slightly but indications are that' mixing has not been uniform. Lime seems to have 'been effective in a line straight up and down the pit where the pH's went from 3.9 to 6.4. We are carrying on the experiment but it appears so far that Nardi ploughing is not the complete answer.
Professor Sumner: The Clansthal, Fernwood and Maputa soils are unbuffered sands. If lime is applied indiscriminately on these soils the growth failure may worsen as a result of overtiming.
The lower level of lime for good growth is about 1,000 kg/ha 15 cm and the upper boundary about 3,000 kg/ha 15 cm.
Dr. Hill: In unbuffered soils, would the addition of lime be reflected immediately in a pH reading without bringing about immediate removal of aluminium?
Professor Sumner: I doubt whether this would be the case.
Mr. Harris: Was it established that nematodes were not a problem?
Professor Sumner: In the initial experiment we sterilized one sample of the Maputa sub-soil. There could have been nematodes in the Maputa top soils and the Fernwood and Clansthal.
Mr. Wood: Have you any idea of threshold values in relation to soil texture?
Professor Sumner: The threshold value for sand is about 0.04 me % Aluminium. In a Balmoral or Clovelly, the heavier textured acid soils of the Midlands it is about 0.2 me % so there is a sliding scale with texture. The heavier the texture the higher the threshold value will be i.e. the more clay there is the higher the aluminium level that can be tolerated. It will of course vary with the crop.
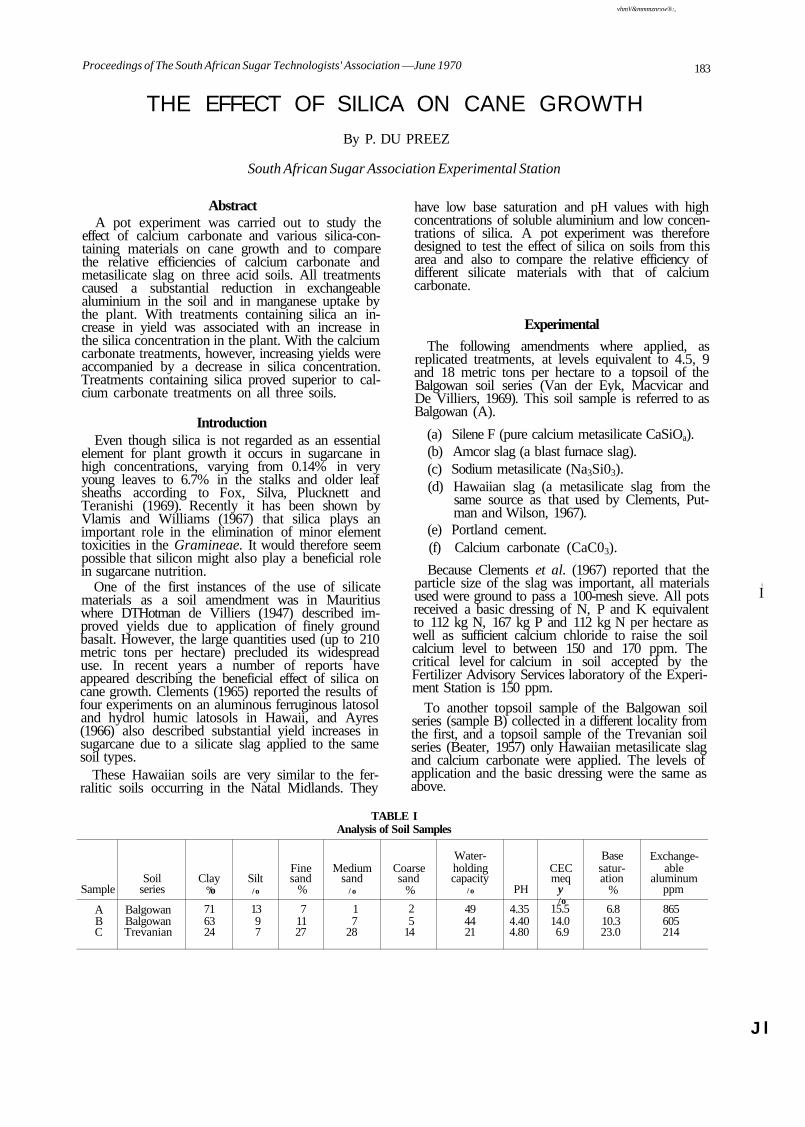
vhmV&mmmznrxw®:,
Proceedings of The South African Sugar Technologists' Association —June 1970 183
THE EFFECT OF SILICA ON CANE GROWTH By P. DU PREEZ
South African Sugar Association Experimental Station
Abstract A pot experiment was carried out to study the
effect of calcium carbonate and various silica-containing materials on cane growth and to compare the relative efficiencies of calcium carbonate and metasilicate slag on three acid soils. All treatments caused a substantial reduction in exchangeable aluminium in the soil and in manganese uptake by the plant. With treatments containing silica an increase in yield was associated with an increase in the silica concentration in the plant. With the calcium carbonate treatments, however, increasing yields were accompanied by a decrease in silica concentration. Treatments containing silica proved superior to calcium carbonate treatments on all three soils.
Introduction Even though silica is not regarded as an essential
element for plant growth it occurs in sugarcane in high concentrations, varying from 0.14% in very young leaves to 6.7% in the stalks and older leaf sheaths according to Fox, Silva, Plucknett and Teranishi (1969). Recently it has been shown by Vlamis and Williams (1967) that silica plays an important role in the elimination of minor element toxicities in the Gramineae. It would therefore seem possible that silicon might also play a beneficial role in sugarcane nutrition.
One of the first instances of the use of silicate materials as a soil amendment was in Mauritius where DTHotman de Villiers (1947) described improved yields due to application of finely ground basalt. However, the large quantities used (up to 210 metric tons per hectare) precluded its widespread use. In recent years a number of reports have appeared describing the beneficial effect of silica on cane growth. Clements (1965) reported the results of four experiments on an aluminous ferruginous latosol and hydrol humic latosols in Hawaii, and Ayres (1966) also described substantial yield increases in sugarcane due to a silicate slag applied to the same soil types.
These Hawaiian soils are very similar to the fer-ralitic soils occurring in the Natal Midlands. They
have low base saturation and pH values with high concentrations of soluble aluminium and low concentrations of silica. A pot experiment was therefore designed to test the effect of silica on soils from this area and also to compare the relative efficiency of different silicate materials with that of calcium carbonate.
Experimental
The following amendments where applied, as replicated treatments, at levels equivalent to 4.5, 9 and 18 metric tons per hectare to a topsoil of the Balgowan soil series (Van der Eyk, Macvicar and De Villiers, 1969). This soil sample is referred to as Balgowan (A).
(a) Silene F (pure calcium metasilicate CaSiOa). (b) Amcor slag (a blast furnace slag). (c) Sodium metasilicate (Na3Si03). (d) Hawaiian slag (a metasilicate slag from the
same source as that used by Clements, Put-man and Wilson, 1967).
(e) Portland cement. (f) Calcium carbonate (CaC03).
Because Clements et al. (1967) reported that the particle size of the slag was important, all materials used were ground to pass a 100-mesh sieve. All pots received a basic dressing of N, P and K equivalent to 112 kg N, 167 kg P and 112 kg N per hectare as well as sufficient calcium chloride to raise the soil calcium level to between 150 and 170 ppm. The critical level for calcium in soil accepted by the Fertilizer Advisory Services laboratory of the Experiment Station is 150 ppm.
To another topsoil sample of the Balgowan soil series (sample B) collected in a different locality from the first, and a topsoil sample of the Trevanian soil series (Beater, 1957) only Hawaiian metasilicate slag and calcium carbonate were applied. The levels of application and the basic dressing were the same as above.
TABLE I Analysis of Soil Samples
Sample
A B C
Soil series
Balgowan Balgowan Trevanian
Clay °/o
71 63 24
Silt / o
13 9 7
Fine sand
%
7 11 27
Medium sand
/ o
1 7
28
Coarse sand
%
2 5
14
Water-holding capacity
/ o
49 44 21
PH
4.35 4.40 4.80
CEC meq
y /o
15.5 14.0 6.9
Base saturation
%
6.8 10.3 23.0
Exchangeable
aluminum ppm
865 605 214
i
I
J l
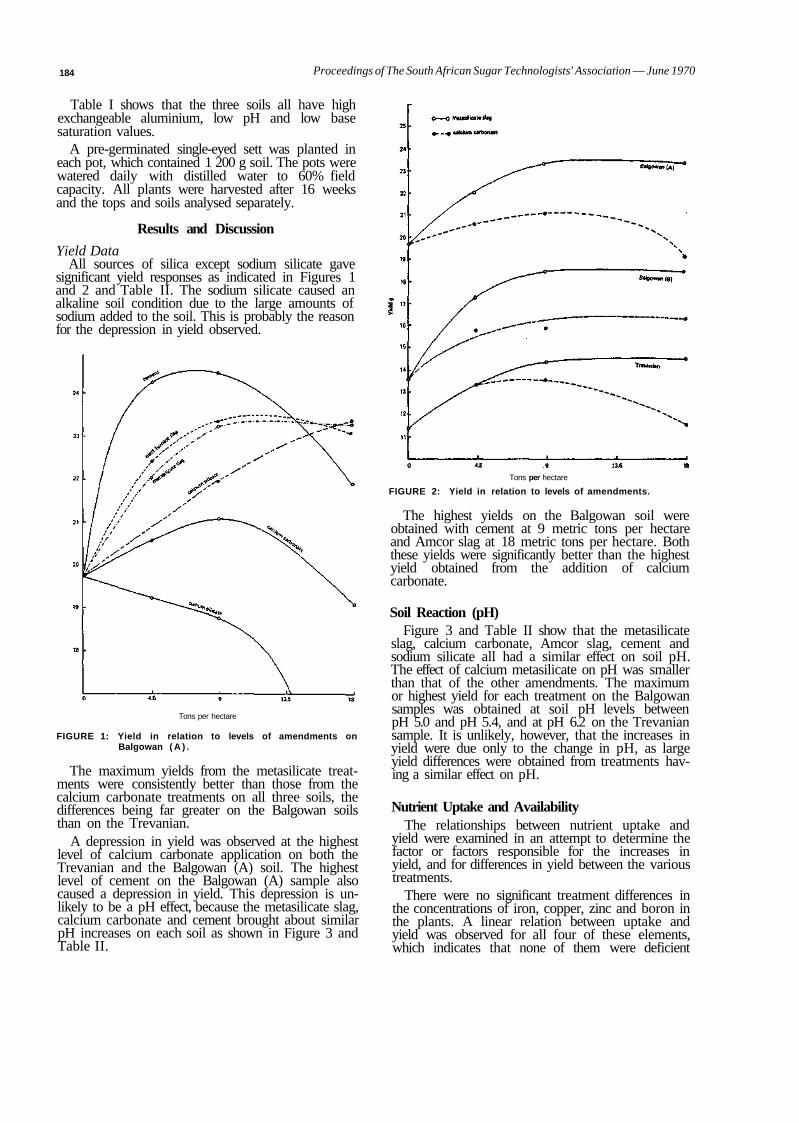
184 Proceedings of The South African Sugar Technologists' Association — June 1970
Table I shows that the three soils all have high exchangeable aluminium, low pH and low base saturation values.
A pre-germinated single-eyed sett was planted in each pot, which contained 1 200 g soil. The pots were watered daily with distilled water to 60% field capacity. All plants were harvested after 16 weeks and the tops and soils analysed separately.
Results and Discussion
Yield Data All sources of silica except sodium silicate gave
significant yield responses as indicated in Figures 1 and 2 and Table II. The sodium silicate caused an alkaline soil condition due to the large amounts of sodium added to the soil. This is probably the reason for the depression in yield observed.
Tons per hectare
FIGURE 1: Yield in relation to levels of amendments on Balgowan ( A ) .
The maximum yields from the metasilicate treatments were consistently better than those from the calcium carbonate treatments on all three soils, the differences being far greater on the Balgowan soils than on the Trevanian.
A depression in yield was observed at the highest level of calcium carbonate application on both the Trevanian and the Balgowan (A) soil. The highest level of cement on the Balgowan (A) sample also caused a depression in yield. This depression is unlikely to be a pH effect, because the metasilicate slag, calcium carbonate and cement brought about similar pH increases on each soil as shown in Figure 3 and Table II.
Tons per hectare
FIGURE 2: Yield in relation to levels of amendments.
The highest yields on the Balgowan soil were obtained with cement at 9 metric tons per hectare and Amcor slag at 18 metric tons per hectare. Both these yields were significantly better than the highest yield obtained from the addition of calcium carbonate.
Soil Reaction (pH) Figure 3 and Table II show that the metasilicate
slag, calcium carbonate, Amcor slag, cement and sodium silicate all had a similar effect on soil pH. The effect of calcium metasilicate on pH was smaller than that of the other amendments. The maximum or highest yield for each treatment on the Balgowan samples was obtained at soil pH levels between pH 5.0 and pH 5.4, and at pH 6.2 on the Trevanian sample. It is unlikely, however, that the increases in yield were due only to the change in pH, as large yield differences were obtained from treatments having a similar effect on pH.
Nutrient Uptake and Availability The relationships between nutrient uptake and
yield were examined in an attempt to determine the factor or factors responsible for the increases in yield, and for differences in yield between the various treatments.
There were no significant treatment differences in the concentrations of iron, copper, zinc and boron in the plants. A linear relation between uptake and yield was observed for all four of these elements, which indicates that none of them were deficient
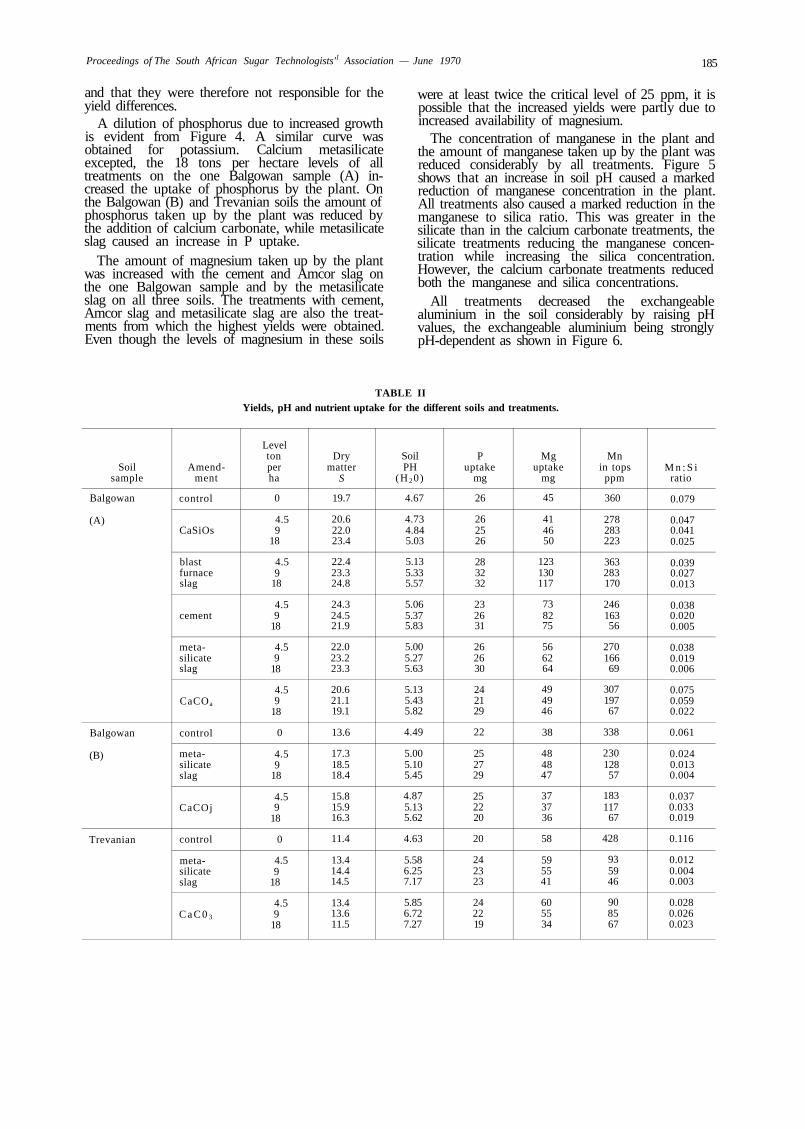
Proceedings of The South African Sugar Technologists'1 Association — June 1970 185
and that they were therefore not responsible for the yield differences.
A dilution of phosphorus due to increased growth is evident from Figure 4. A similar curve was obtained for potassium. Calcium metasilicate excepted, the 18 tons per hectare levels of all treatments on the one Balgowan sample (A) increased the uptake of phosphorus by the plant. On the Balgowan (B) and Trevanian soils the amount of phosphorus taken up by the plant was reduced by the addition of calcium carbonate, while metasilicate slag caused an increase in P uptake.
The amount of magnesium taken up by the plant was increased with the cement and Amcor slag on the one Balgowan sample and by the metasilicate slag on all three soils. The treatments with cement, Amcor slag and metasilicate slag are also the treatments from which the highest yields were obtained. Even though the levels of magnesium in these soils
were at least twice the critical level of 25 ppm, it is possible that the increased yields were partly due to increased availability of magnesium.
The concentration of manganese in the plant and the amount of manganese taken up by the plant was reduced considerably by all treatments. Figure 5 shows that an increase in soil pH caused a marked reduction of manganese concentration in the plant. All treatments also caused a marked reduction in the manganese to silica ratio. This was greater in the silicate than in the calcium carbonate treatments, the silicate treatments reducing the manganese concentration while increasing the silica concentration. However, the calcium carbonate treatments reduced both the manganese and silica concentrations.
All treatments decreased the exchangeable aluminium in the soil considerably by raising pH values, the exchangeable aluminium being strongly pH-dependent as shown in Figure 6.
TABLE II Yields, pH and nutrient uptake for the different soils and treatments.
Soil sample
Balgowan
(A)
Balgowan
(B)
Trevanian
Amendment
control
CaSiOs
blast furnace slag
cement
metasilicate slag
CaCOa
control
metasilicate slag
CaCOj
control
metasilicate slag
C a C 0 3
Level ton per ha
0
4.5 9
18
4.5 9
18
4.5 9
18
4.5 9
18
4.5 9
18
0
4.5 9
18
4.5 9
18
0
4.5 9
18
4.5 9
18
Dry matter
S
19.7
20.6 22.0 23.4
22.4 23.3 24.8
24.3 24.5 21.9
22.0 23.2 23.3
20.6 21.1 19.1
13.6
17.3 18.5 18.4
15.8 15.9 16.3
11.4
13.4 14.4 14.5
13.4 13.6 11.5
Soil PH
(H 2 0)
4.67
4.73 4.84 5.03
5.13 5.33 5.57
5.06 5.37 5.83
5.00 5.27 5.63
5.13 5.43 5.82
4.49
5.00 5.10 5.45
4.87 5.13 5.62
4.63
5.58 6.25 7.17
5.85 6.72 7.27
P uptake
mg
26
26 25 26
28 32 32
23 26 31
26 26 30
24 21 29
22
25 27 29
25 22 20
20
24 23 23
24 22 19
Mg uptake
mg
45
41 46 50
123 130 117
73 82 75
56 62 64
49 49 46
38
48 48 47
37 37 36
58
59 55 41
60 55 34
Mn in tops
ppm
360
278 283 223
363 283 170
246 163 56
270 166 69
307 197 67
338
230 128 57
183 117 67
428
93 59 46
90 85 67
M n : S i ratio
0.079
0.047 0.041 0.025
0.039 0.027 0.013
0.038 0.020 0.005
0.038 0.019 0.006
0.075 0.059 0.022
0.061
0.024 0.013 0.004
0.037 0.033 0.019
0.116
0.012 0.004 0.003
0.028 0.026 0.023
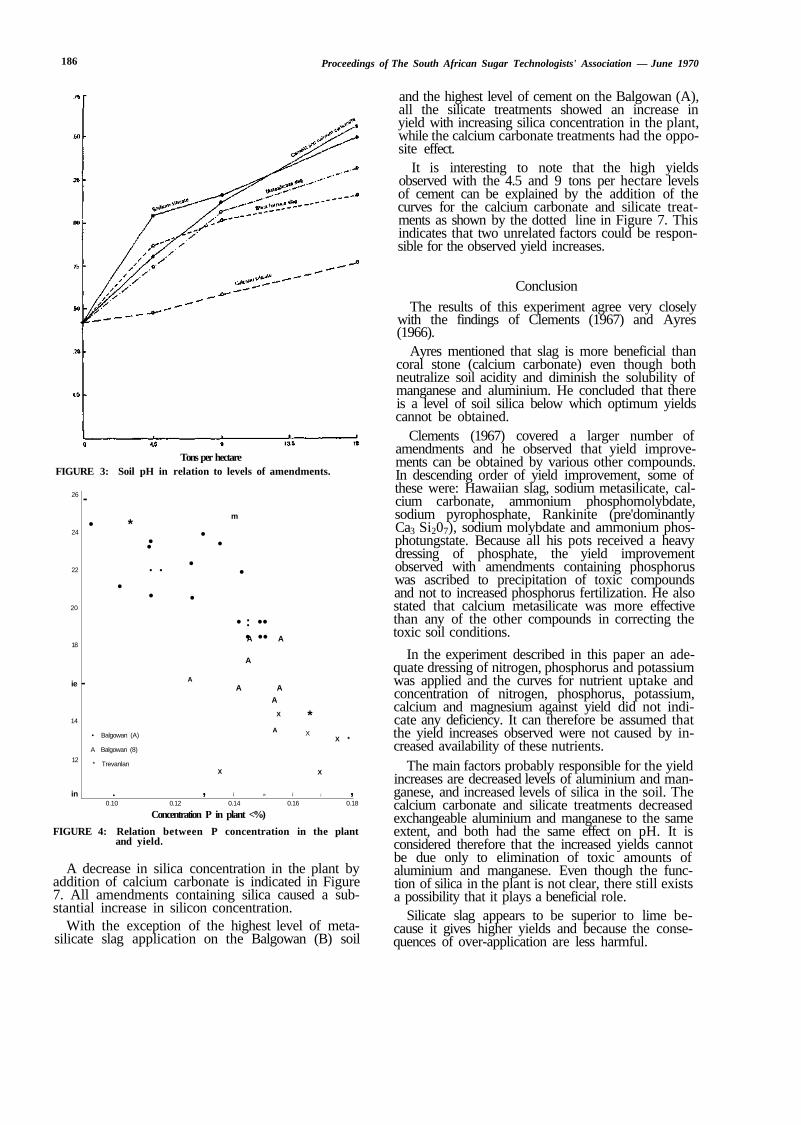
186 Proceedings of The South African Sugar Technologists' Association — June 1970
Tons per hectare FIGURE 3: Soil pH in relation to levels of amendments.
26
24
22
20
18
ie
14
12
in
-
• *
•
-
• Balgowan (A)
A Balgowan (8)
* Trevanlan
•
• •
• •
•
•
•
•
A
,
•
X
m
•
• : •• • •• A A
A
A A
A
X
A
i » i
* X
X
i
X *
, 0.10 0.12 0.14 0.16 0.18
Concentration P in plant <%)
FIGURE 4: Relation between P concentration in the plant and yield.
A decrease in silica concentration in the plant by addition of calcium carbonate is indicated in Figure 7. All amendments containing silica caused a substantial increase in silicon concentration.
With the exception of the highest level of meta-silicate slag application on the Balgowan (B) soil
and the highest level of cement on the Balgowan (A), all the silicate treatments showed an increase in yield with increasing silica concentration in the plant, while the calcium carbonate treatments had the opposite effect.
It is interesting to note that the high yields observed with the 4.5 and 9 tons per hectare levels of cement can be explained by the addition of the curves for the calcium carbonate and silicate treatments as shown by the dotted line in Figure 7. This indicates that two unrelated factors could be responsible for the observed yield increases.
Conclusion
The results of this experiment agree very closely with the findings of Clements (1967) and Ayres (1966).
Ayres mentioned that slag is more beneficial than coral stone (calcium carbonate) even though both neutralize soil acidity and diminish the solubility of manganese and aluminium. He concluded that there is a level of soil silica below which optimum yields cannot be obtained.
Clements (1967) covered a larger number of amendments and he observed that yield improvements can be obtained by various other compounds. In descending order of yield improvement, some of these were: Hawaiian slag, sodium metasilicate, calcium carbonate, ammonium phosphomolybdate, sodium pyrophosphate, Rankinite (pre'dominantly Ca3 Si207), sodium molybdate and ammonium phos-photungstate. Because all his pots received a heavy dressing of phosphate, the yield improvement observed with amendments containing phosphorus was ascribed to precipitation of toxic compounds and not to increased phosphorus fertilization. He also stated that calcium metasilicate was more effective than any of the other compounds in correcting the toxic soil conditions.
In the experiment described in this paper an adequate dressing of nitrogen, phosphorus and potassium was applied and the curves for nutrient uptake and concentration of nitrogen, phosphorus, potassium, calcium and magnesium against yield did not indicate any deficiency. It can therefore be assumed that the yield increases observed were not caused by increased availability of these nutrients.
The main factors probably responsible for the yield increases are decreased levels of aluminium and manganese, and increased levels of silica in the soil. The calcium carbonate and silicate treatments decreased exchangeable aluminium and manganese to the same extent, and both had the same effect on pH. It is considered therefore that the increased yields cannot be due only to elimination of toxic amounts of aluminium and manganese. Even though the function of silica in the plant is not clear, there still exists a possibility that it plays a beneficial role.
Silicate slag appears to be superior to lime because it gives higher yields and because the consequences of over-application are less harmful.
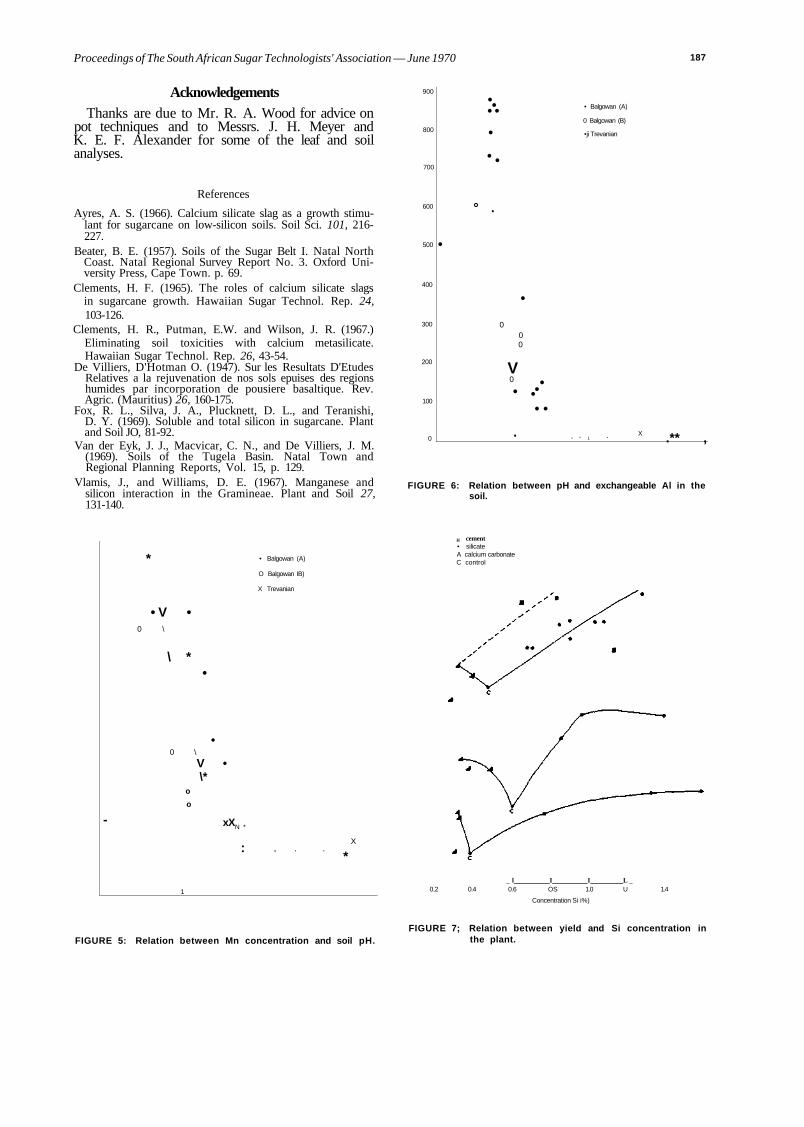
Proceedings of The South African Sugar Technologists' Association — June 1970 187
Acknowledgements Thanks are due to Mr. R. A. Wood for advice on
pot techniques and to Messrs. J. H. Meyer and K. E. F. Alexander for some of the leaf and soil analyses.
References
Ayres, A. S. (1966). Calcium silicate slag as a growth stimulant for sugarcane on low-silicon soils. Soil Sci. 101, 216-227.
Beater, B. E. (1957). Soils of the Sugar Belt I. Natal North Coast. Natal Regional Survey Report No. 3. Oxford University Press, Cape Town. p. 69.
Clements, H. F. (1965). The roles of calcium silicate slags in sugarcane growth. Hawaiian Sugar Technol. Rep. 24, 103-126.
Clements, H. R., Putman, E.W. and Wilson, J. R. (1967.) Eliminating soil toxicities with calcium metasilicate. Hawaiian Sugar Technol. Rep. 26, 43-54.
De Villiers, D'Hotman O. (1947). Sur les Resultats D'Etudes Relatives a la rejuvenation de nos sols epuises des regions humides par incorporation de pousiere basaltique. Rev. Agric. (Mauritius) 26, 160-175.
Fox, R. L., Silva, J. A., Plucknett, D. L., and Teranishi, D. Y. (1969). Soluble and total silicon in sugarcane. Plant and Soil JO, 81-92.
Van der Eyk, J. J., Macvicar, C. N., and De Villiers, J. M. (1969). Soils of the Tugela Basin. Natal Town and Regional Planning Reports, Vol. 15, p. 129.
Vlamis, J., and Williams, D. E. (1967). Manganese and silicon interaction in the Gramineae. Plant and Soil 27, 131-140.
900
800
700
600
500
400
300
200
100
0
• • • •
•
• •
° .
•
•
0 0 0
V 0
•
.
• Balgowan (A)
0 Balgowan (B)
•ji Trevanian
• • • • •
• ^ 1 * X .** ,
FIGURE 6: Relation between pH and exchangeable Al in the soil.
-
*
• V • 0 \
\ *
0 \
o
o
1
•
•
V • \*
xX N *
:
• Balgowan (A)
O Balgowan IB)
X Trevanian
x • •
X
*
H cement • silicate A calcium carbonate C control
_ l I I L _ 0,2 0.4 0.6 OS 1.0 U 1.4
Concentration Si i%)
FIGURE 5: Relation between Mn concentration and soil pH. FIGURE 7; Relation between yield and Si concentration in
the plant.

188 Proceedings of The South African Sugar Technologists' Association —June 1970
Discussion Mr. du Toit (in the chair): Mr. du Preez refers to
the work done by Mr. d'Hotman de Villiers many years ago in Mauritius. It took twenty-five years to recognise his point — that silica plays a role in the plant life of sugarcane.
Now Mr. du Preez says he cannot explain everything by the elimination of aluminium — silica, according to Mr. d'Hotman de Villiers, has an additional significance apart from its elimination of aluminium.
Professor Sumner: The relation between aluminium in the soil and the aluminium taken up by the plant depends on species.
Mr. du Preez does not say how long he equilibrated before he planted.
The time between liming and planting makes a big difference to results.
In table II, if you plot out the two columns — pH versus yield — you will probably get a clear idea of the effect of silica. It does seem that silica is a far more expensive treatment than liming.
Mr. d'Hotman de Villiers: There is unpublished data by me about thirty years ago, when I was working with Craig and Halais at the Sugar Experiment
Station, Mauritius. I obtained significant increases in yield on plots that had received large doses of crushed basalt.
In these same plots cane leaves showed considerably higher silica content compared with control.
Mr. du Preez: The period for equilibration was not more than a week.
The level where we got a depression with calcium carbonate was high — about 18 tons per hectare. Do you feel if we had equilibrated for a longer period we may not have had that drop?
Professor Sumner: We get a drop from high levels of liming on soils like the Balmoral but we are not sure why.
Mr. du Toit: As regards the elimination of aluminium by either lime or silicates. Dr. Clements claims he can get a good response to lime due to the elimination of aluminium toxicity, but he gets a significantly better response to silicates and he feels that the silicates do play a role in plant nutrition.
The relationship between aluminium and pH as shown in this paper is most interesting. There seems to be a break in the area round about 5.4 — I refer to Figure 6.
It is reassuring that this same figure has been found by Professor Sumner in Pietermaritzburg.
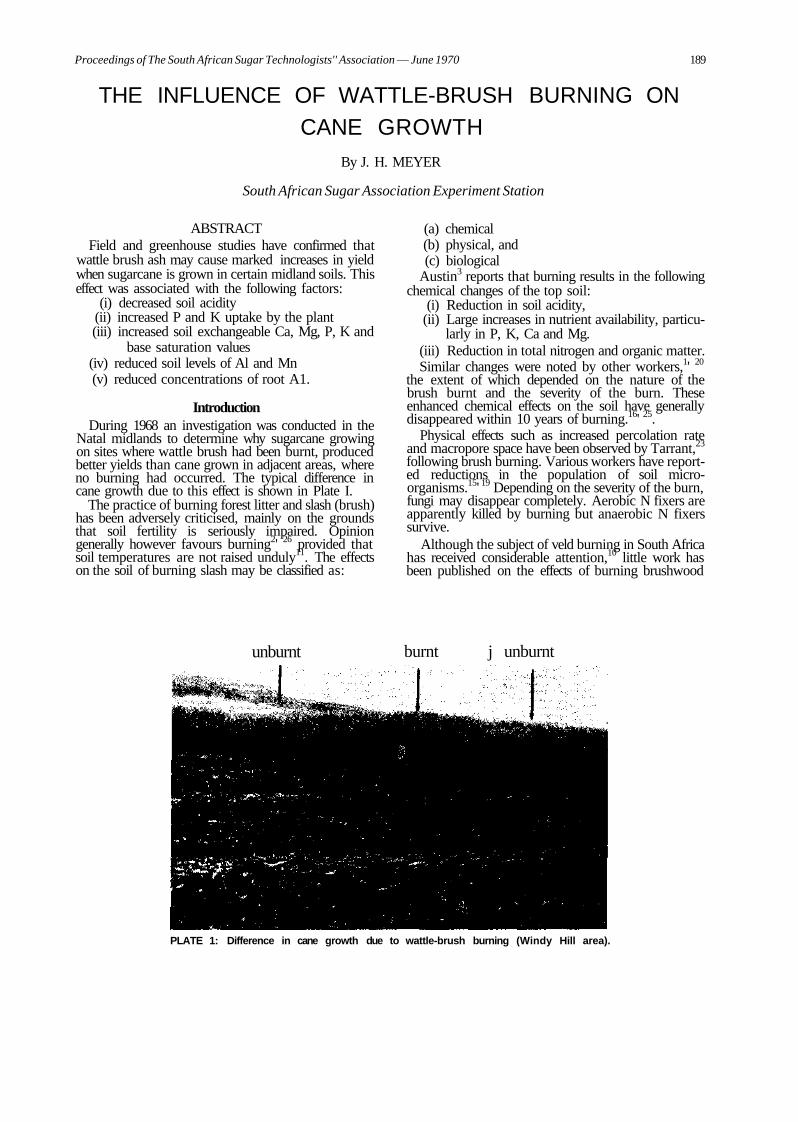
Proceedings of The South African Sugar Technologists'' Association — June 1970 189
THE INFLUENCE OF WATTLE-BRUSH BURNING ON CANE GROWTH
By J. H. MEYER
South African Sugar Association Experiment Station
ABSTRACT Field and greenhouse studies have confirmed that
wattle brush ash may cause marked increases in yield when sugarcane is grown in certain midland soils. This effect was associated with the following factors:
(i) decreased soil acidity (ii) increased P and K uptake by the plant (iii) increased soil exchangeable Ca, Mg, P, K and
base saturation values (iv) reduced soil levels of Al and Mn (v) reduced concentrations of root A1.
Introduction During 1968 an investigation was conducted in the
Natal midlands to determine why sugarcane growing on sites where wattle brush had been burnt, produced better yields than cane grown in adjacent areas, where no burning had occurred. The typical difference in cane growth due to this effect is shown in Plate I.
The practice of burning forest litter and slash (brush) has been adversely criticised, mainly on the grounds that soil fertility is seriously impaired. Opinion generally however favours burning2' 26 provided that soil temperatures are not raised unduly11. The effects on the soil of burning slash may be classified as:
(a) chemical (b) physical, and (c) biological
Austin3 reports that burning results in the following chemical changes of the top soil:
(i) Reduction in soil acidity, (ii) Large increases in nutrient availability, particu
larly in P, K, Ca and Mg. (iii) Reduction in total nitrogen and organic matter. Similar changes were noted by other workers,1' 20
the extent of which depended on the nature of the brush burnt and the severity of the burn. These enhanced chemical effects on the soil have generally disappeared within 10 years of burning.16' 25.
Physical effects such as increased percolation rate and macropore space have been observed by Tarrant,23
following brush burning. Various workers have reported reductions in the population of soil microorganisms.15' 19 Depending on the severity of the burn, fungi may disappear completely. Aerobic N fixers are apparently killed by burning but anaerobic N fixers survive.
Although the subject of veld burning in South Africa has received considerable attention,10 little work has been published on the effects of burning brushwood
unburnt burnt j unburnt
PLATE 1: Difference in cane growth due to wattle-brush burning (Windy Hill area).
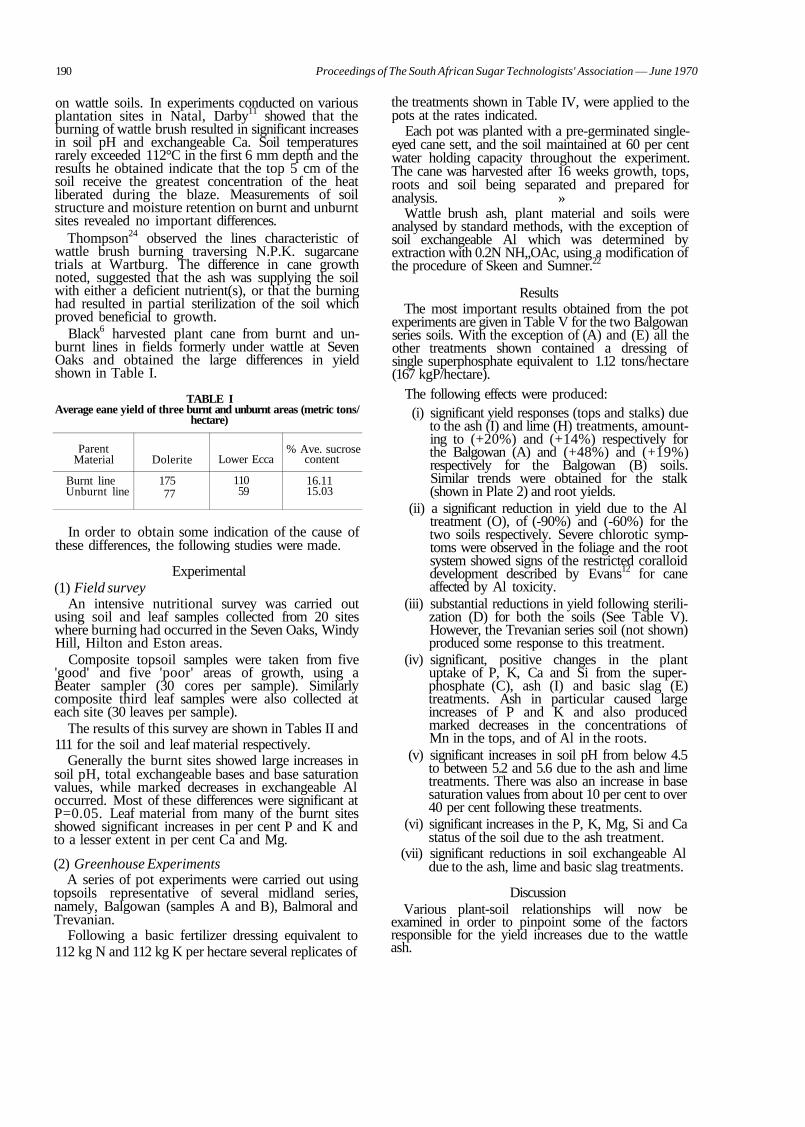
190 Proceedings of The South African Sugar Technologists' Association — June 1970
on wattle soils. In experiments conducted on various plantation sites in Natal, Darby11 showed that the burning of wattle brush resulted in significant increases in soil pH and exchangeable Ca. Soil temperatures rarely exceeded 112°C in the first 6 mm depth and the results he obtained indicate that the top 5 cm of the soil receive the greatest concentration of the heat liberated during the blaze. Measurements of soil structure and moisture retention on burnt and unburnt sites revealed no important differences.
Thompson24 observed the lines characteristic of wattle brush burning traversing N.P.K. sugarcane trials at Wartburg. The difference in cane growth noted, suggested that the ash was supplying the soil with either a deficient nutrient(s), or that the burning had resulted in partial sterilization of the soil which proved beneficial to growth.
Black6 harvested plant cane from burnt and unburnt lines in fields formerly under wattle at Seven Oaks and obtained the large differences in yield shown in Table I.
TABLE I Average eane yield of three burnt and unburnt areas (metric tons/
hectare)
Parent Material
Burnt line Unburnt line
Dolerite
175 77
Lower Ecca
110 59
% Ave. sucrose content
16.11 15.03
In order to obtain some indication of the cause of these differences, the following studies were made.
Experimental (1) Field survey
An intensive nutritional survey was carried out using soil and leaf samples collected from 20 sites where burning had occurred in the Seven Oaks, Windy Hill, Hilton and Eston areas.
Composite topsoil samples were taken from five 'good' and five 'poor' areas of growth, using a Beater sampler (30 cores per sample). Similarly composite third leaf samples were also collected at each site (30 leaves per sample).
The results of this survey are shown in Tables II and 111 for the soil and leaf material respectively.
Generally the burnt sites showed large increases in soil pH, total exchangeable bases and base saturation values, while marked decreases in exchangeable Al occurred. Most of these differences were significant at P=0.05. Leaf material from many of the burnt sites showed significant increases in per cent P and K and to a lesser extent in per cent Ca and Mg.
(2) Greenhouse Experiments A series of pot experiments were carried out using
topsoils representative of several midland series, namely, Balgowan (samples A and B), Balmoral and Trevanian.
Following a basic fertilizer dressing equivalent to 112 kg N and 112 kg K per hectare several replicates of
the treatments shown in Table IV, were applied to the pots at the rates indicated.
Each pot was planted with a pre-germinated single-eyed cane sett, and the soil maintained at 60 per cent water holding capacity throughout the experiment. The cane was harvested after 16 weeks growth, tops, roots and soil being separated and prepared for analysis. »
Wattle brush ash, plant material and soils were analysed by standard methods, with the exception of soil exchangeable Al which was determined by extraction with 0.2N NH„OAc, using a modification of the procedure of Skeen and Sumner.22
Results The most important results obtained from the pot
experiments are given in Table V for the two Balgowan series soils. With the exception of (A) and (E) all the other treatments shown contained a dressing of single superphosphate equivalent to 1.12 tons/hectare (167 kgP/hectare).
The following effects were produced: (i) significant yield responses (tops and stalks) due
to the ash (I) and lime (H) treatments, amounting to (+20%) and (+14%) respectively for the Balgowan (A) and (+48%) and (+19%) respectively for the Balgowan (B) soils. Similar trends were obtained for the stalk (shown in Plate 2) and root yields.
(ii) a significant reduction in yield due to the Al treatment (O), of (-90%) and (-60%) for the two soils respectively. Severe chlorotic symptoms were observed in the foliage and the root system showed signs of the restricted coralloid development described by Evans12 for cane affected by Al toxicity.
(iii) substantial reductions in yield following sterilization (D) for both the soils (See Table V). However, the Trevanian series soil (not shown) produced some response to this treatment.
(iv) significant, positive changes in the plant uptake of P, K, Ca and Si from the superphosphate (C), ash (I) and basic slag (E) treatments. Ash in particular caused large increases of P and K and also produced marked decreases in the concentrations of Mn in the tops, and of Al in the roots.
(v) significant increases in soil pH from below 4.5 to between 5.2 and 5.6 due to the ash and lime treatments. There was also an increase in base saturation values from about 10 per cent to over 40 per cent following these treatments.
(vi) significant increases in the P, K, Mg, Si and Ca status of the soil due to the ash treatment.
(vii) significant reductions in soil exchangeable Al due to the ash, lime and basic slag treatments.
Discussion Various plant-soil relationships will now be
examined in order to pinpoint some of the factors responsible for the yield increases due to the wattle ash.
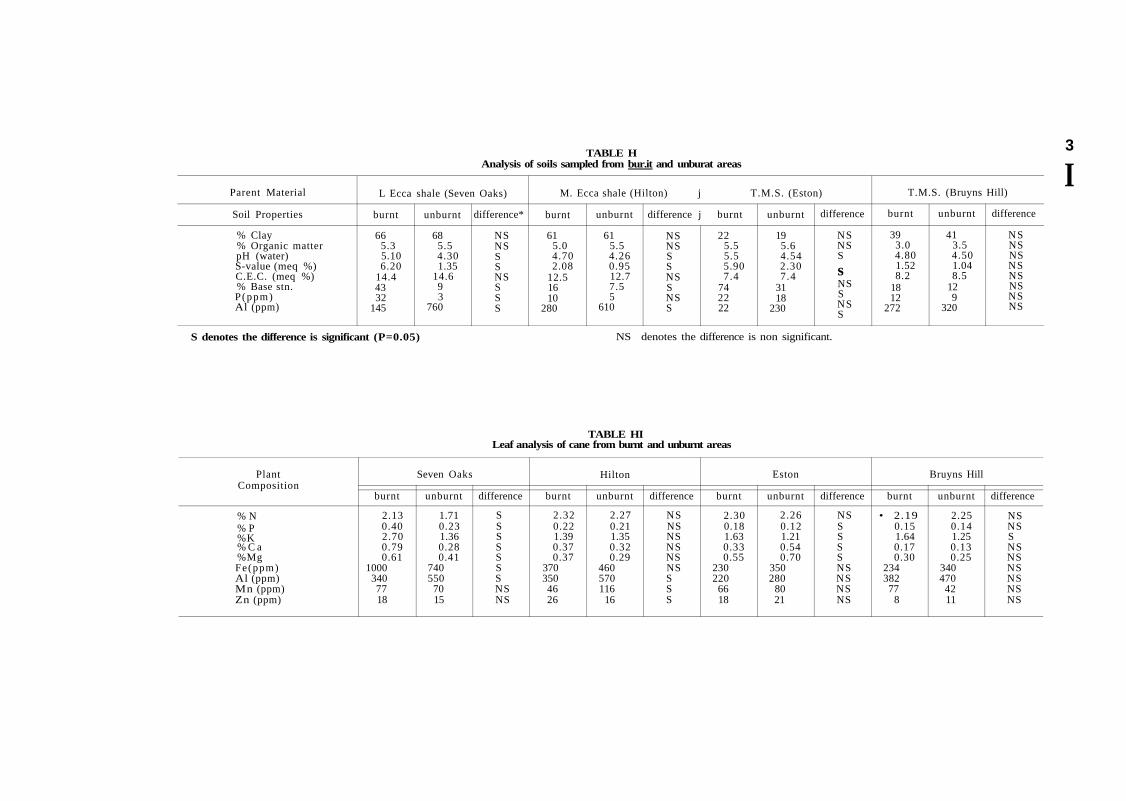
TABLE H Analysis of soils sampled from bur.it and unburat areas
Parent Material
Soil Properties
% Clay % Organic matter pH (water) S-value (meq %) C.E.C. (meq %) % Base stn. P (ppm) Al (ppm)
L Ecca shale (Seven Oaks)
burnt
66 5.3 5.10 6.20
14.4 43 32
145
unburnt
68 5.5 4.30 1.35
14.6 9 3
760
difference*
NS NS S S NS S S S
M. Ecca shale (Hilton) j T.M.S. (Eston)
burnt
61 5.0 4.70 2.08
12.5 16 10
280
unburnt
61 5.5 4.26 0.95 12.7 7.5 5
610
difference j burnt
NS NS S S NS S NS S
22 5.5 5.5 5.90 7.4
74 22 22
unburnt
19 5.6 4.54 2.30 7.4
31 18
230
difference
NS NS S
s NS S NS S
T.M.S. (Bruyns Hill)
burnt
39 3.0 4.80 1.52 8.2
18 12
272
unburnt
41 3.5 4.50 1.04 8.5
12 9
320
difference
NS NS NS NS NS NS NS NS
3
I
S denotes the difference is significant (P=0.05) NS denotes the difference is non significant.
TABLE HI Leaf analysis of cane from burnt and unburnt areas
Plant Composition
% N % P %K % C a %Mg Fe(ppm) Al (ppm) Mn (ppm) Zn (ppm)
burnt
2.13 0.40 2.70 0.79 0.61
1000 340 77 18
Seven Oaks
unburnt
1.71 0.23 1.36 0.28 0.41
740 550
70 15
difference
S S S S S S S NS NS
burnt
2.32 0.22 1.39 0.37 0.37
370 350 46 26
Hilton
unburnt
2.27 0.21 1.35 0.32 0.29
460 570 116
16
difference
NS NS NS NS NS NS S S S
burnt
2.30 0.18 1.63 0.33 0.55
230 220
66 18
Eston
unburnt
2.26 0.12 1.21 0.54 0.70
350 280
80 21
difference
NS S S S S NS NS NS NS
burnt
• 2.19 0.15 1.64 0.17 0.30
234 382 77
8
Bruyns Hill
unburnt
2.25 0.14 1.25 0.13 0.25
340 470
42 11
difference
NS NS S NS NS NS NS NS NS
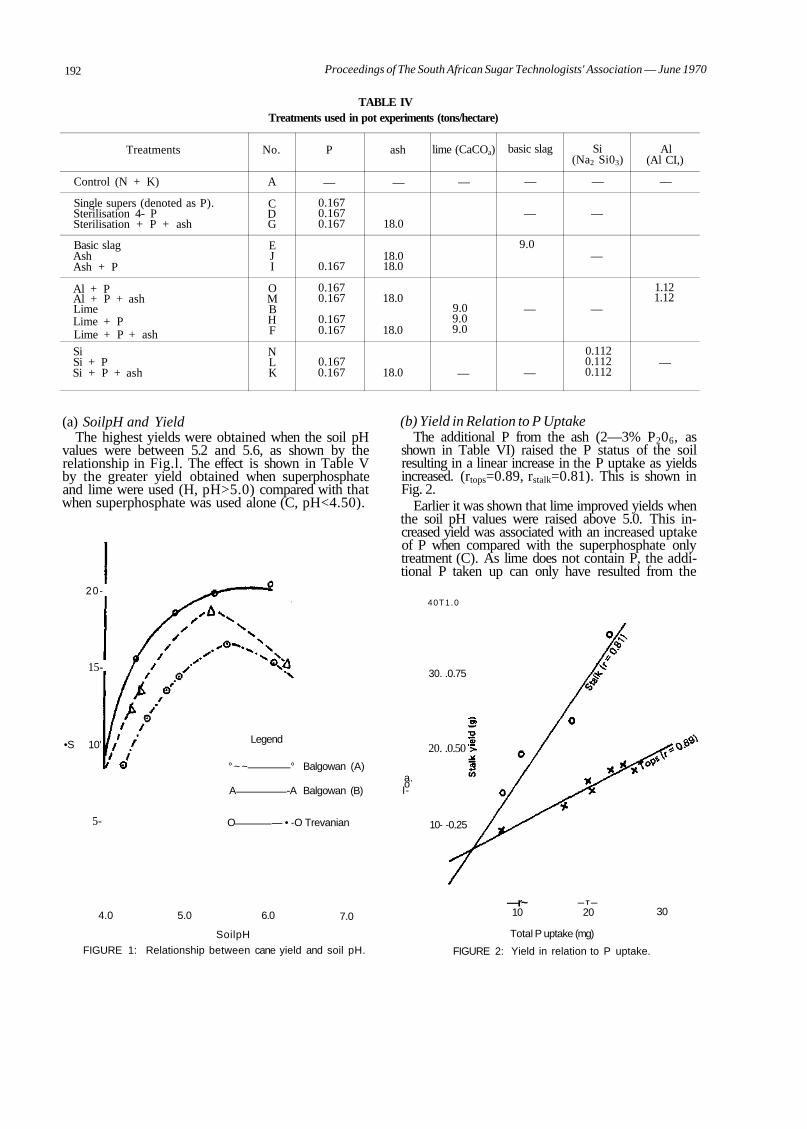
192 Proceedings of The South African Sugar Technologists' Association — June 1970
TABLE IV Treatments used in pot experiments (tons/hectare)
Treatments
Control (N + K)
Single supers (denoted as P). Sterilisation 4- P Sterilisation + P + ash
Basic slag Ash Ash + P
Al + P Al + P + ash Lime Lime + P Lime + P + ash
Si Si + P Si + P + ash
No.
A
C D G
E J I
O M B H F
N L K
P
—
0.167 0.167 0.167
0.167
0.167 0.167
0.167 0.167
0.167 0.167
ash
—
18.0
18.0 18.0
18.0
18.0
18.0
lime (CaCOa)
—
9.0 9.0 9.0
—
basic slag
—
—
9.0
—
—
Si (Na2 Si03)
—
—
—
—
0.112 0.112 0.112
Al (Al CI,)
—
1.12 1.12
—
(a) SoilpH and Yield The highest yields were obtained when the soil pH
values were between 5.2 and 5.6, as shown by the relationship in Fig.l. The effect is shown in Table V by the greater yield obtained when superphosphate and lime were used (H, pH>5.0) compared with that when superphosphate was used alone (C, pH<4.50).
20-
15-
•S 10'
5-
Legend
° ~ ~ ° Balgowan (A)
A -A Balgowan (B)
O — • -O Trevanian
4.0 5.0 6.0 7.0
SoilpH
FIGURE 1: Relationship between cane yield and soil pH.
(b) Yield in Relation to P Uptake The additional P from the ash (2—3% P206, as
shown in Table VI) raised the P status of the soil resulting in a linear increase in the P uptake as yields increased. (rtops=0.89, rstalk=0.81). This is shown in Fig. 2.
Earlier it was shown that lime improved yields when the soil pH values were raised above 5.0. This increased yield was associated with an increased uptake of P when compared with the superphosphate only treatment (C). As lime does not contain P, the additional P taken up can only have resulted from the
40T1.0
30. .0.75
20. .0.50
a. o I-
10- -0.25
—r~ 10
— T —
20 30
Total P uptake (mg)
FIGURE 2: Yield in relation to P uptake.
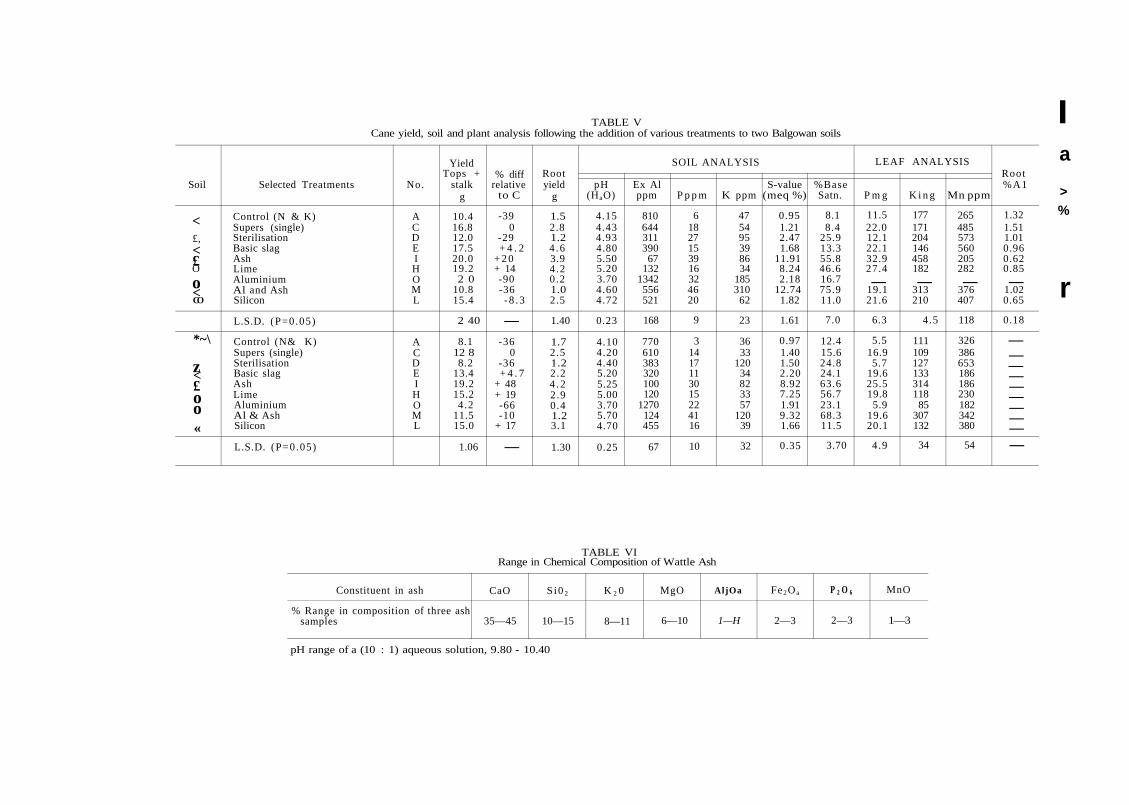
TABLE V Cane yield, soil and plant analysis following the addition of various treatments to two Balgowan soils
Soil
< £, < £ O
o < CO
*~\
z < £ o o «
Selected Treatments
Control (N & K) Supers (single) Sterilisation Basic slag Ash Lime Aluminium Al and Ash Silicon
L.S.D. (P=0.05)
Control (N& K) Supers (single) Sterilisation Basic slag Ash Lime Aluminium Al & Ash Silicon
L.S.D. (P=0.05)
No.
A C D E I H O M L
A C D E I H O M L
Yield Tops +
stalk g
10.4 16.8 12.0 17.5 20.0 19.2 2 0
10.8 15.4
2 40
8.1 12 8 8.2
13.4 19.2 15.2 4.2
11.5 15.0
1.06
% diff relative
to C
-39 0
-29 + 4 . 2
+ 2 0 + 14 -90 -36 - 8 . 3
— -36
0 -36 + 4 . 7
+ 48 + 19 -66 -10
+ 17
—
Root yield
g
1.5 2.8 1.2 4 .6 3.9 4 .2 0.2 1.0 2.5
1.40
1.7 2.5 1.2 2.2 4 . 2 2.9 0.4 1.2 3.1
1.30
pH (HaO)
4.15 4.43 4.93 4.80 5.50 5.20 3.70 4.60 4.72
0.23
4.10 4.20 4.40 5.20 5.25 5.00 3.70 5.70 4.70
0.25
Ex Al ppm
810 644 311 390
67 132
1342 556 521
168
770 610 383 320 100 120
1270 124 455
67
SOIL ANALYSIS
P p p m
6 18 27 15 39 16 32 46 20
9
3 14 17 11 30 15 22 41 16
10
K ppm
47 54 95 39 86 34
185 310
62
23
36 33
120 34 82 33 57
120 39
32
S-value (meq %)
0.95 1.21 2.47 1.68
11.91 8.24 2.18
12.74 1.82
1.61
0.97 1.40 1.50 2.20 8.92 7.25 1.91 9.32 1.66
0.35
%Base Satn.
8.1 8.4
25.9 13.3 55.8 46.6 16.7 75.9 11.0
7.0
12.4 15.6 24.8 24.1 63.6 56.7 23.1 68.3 11.5
3.70
LEAF ANALYSIS
P m g
11.5 22.0 12.1 22.1 32.9 27.4 —
19.1 21.6
6.3
5.5 16.9 5.7
19.6 25.5 19.8
5.9 19.6 20.1
4.9
K i n g
177 171 204 146 458 182 —
313 210
4.5
111 109 127 133 314 118
85 307 132
34
Mn ppm
265 485 573 560 205 282 —
376 407
118
326 386 653 186 186 230 182 342 380
54
Root %A1
1.32 1.51 1.01 0.96 0.62 0.85 —
1.02 0.65
0.18
— — — — — — — — — —
I a
> %
r
TABLE VI Range in Chemical Composition of Wattle Ash
Constituent in ash
% Range in composition of three ash samples
CaO
35—45
S i0 2
10—15
K 2 0
8—11
MgO
6—10
AljOa
1—H
Fe2O a
2—3
P 2 O 6
2—3
MnO
1—3
pH range of a (10 : 1) aqueous solution, 9.80 - 10.40
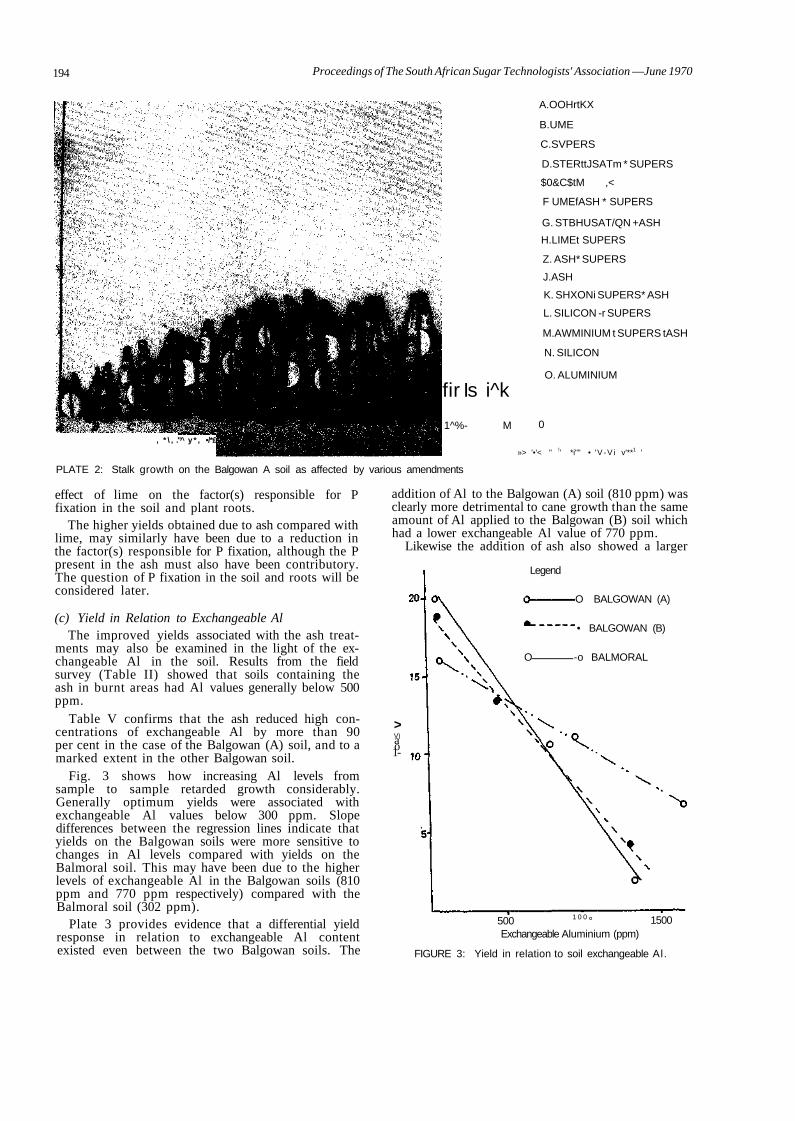
194 Proceedings of The South African Sugar Technologists' Association —June 1970
, * \ , ." y * , •/*£
PLATE 2: Stalk growth on the Balgowan A soil as affected by various amendments
fir Is i^k
1^%- M
A.OOHrtKX
B.UME
C.SVPERS
D.STERttJSATm * SUPERS
$0&C$tM ,<
F UMEfASH * SUPERS
G. STBHUSAT/QN +ASH
H.LIMEt SUPERS
Z. ASH* SUPERS
J.ASH
K. SHXONi SUPERS* ASH
L. SILICON -r SUPERS
M.AWMINIUM t SUPERS tASH
N. SILICON
O. ALUMINIUM
0
»> '•'< " !' *i"" • 'V -V i v'**1 '
effect of lime on the factor(s) responsible for P fixation in the soil and plant roots.
The higher yields obtained due to ash compared with lime, may similarly have been due to a reduction in the factor(s) responsible for P fixation, although the P present in the ash must also have been contributory. The question of P fixation in the soil and roots will be considered later.
(c) Yield in Relation to Exchangeable Al The improved yields associated with the ash treat
ments may also be examined in the light of the exchangeable Al in the soil. Results from the field survey (Table II) showed that soils containing the ash in burnt areas had Al values generally below 500 ppm.
Table V confirms that the ash reduced high concentrations of exchangeable Al by more than 90 per cent in the case of the Balgowan (A) soil, and to a marked extent in the other Balgowan soil.
Fig. 3 shows how increasing Al levels from sample to sample retarded growth considerably. Generally optimum yields were associated with exchangeable Al values below 300 ppm. Slope differences between the regression lines indicate that yields on the Balgowan soils were more sensitive to changes in Al levels compared with yields on the Balmoral soil. This may have been due to the higher levels of exchangeable Al in the Balgowan soils (810 ppm and 770 ppm respectively) compared with the Balmoral soil (302 ppm).
Plate 3 provides evidence that a differential yield response in relation to exchangeable Al content existed even between the two Balgowan soils. The
addition of Al to the Balgowan (A) soil (810 ppm) was clearly more detrimental to cane growth than the same amount of Al applied to the Balgowan (B) soil which had a lower exchangeable Al value of 770 ppm.
Likewise the addition of ash also showed a larger
Legend
O BALGOWAN (A)
• BALGOWAN (B)
O -o BALMORAL
> V) a o 1-
1500 500 1 0 0 ° Exchangeable Aluminium (ppm)
FIGURE 3: Yield in relation to soil exchangeable Al.
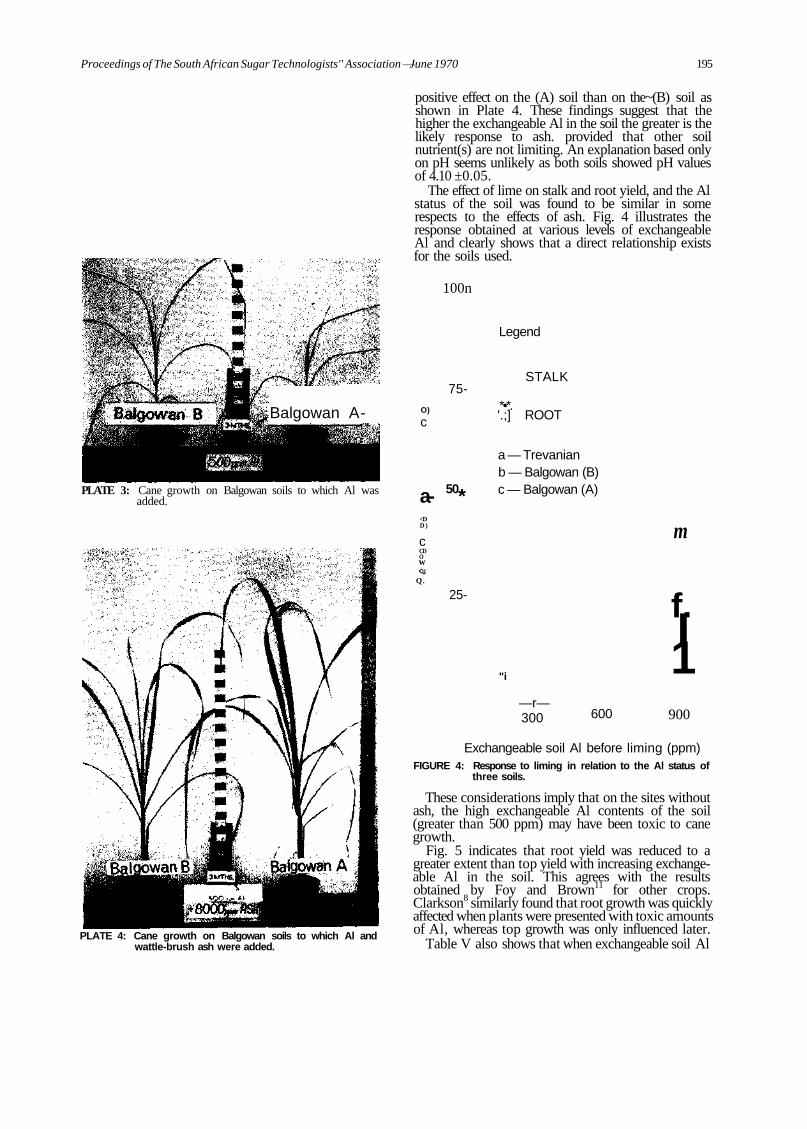
Proceedings of The South African Sugar Technologists'' Association — June 1970 195
Balgowan A-
PLATE 3: Cane growth on Balgowan soils to which Al was added.
positive effect on the (A) soil than on the~(B) soil as shown in Plate 4. These findings suggest that the higher the exchangeable Al in the soil the greater is the likely response to ash. provided that other soil nutrient(s) are not limiting. An explanation based only on pH seems unlikely as both soils showed pH values of 4.10 ±0.05.
The effect of lime on stalk and root yield, and the Al status of the soil was found to be similar in some respects to the effects of ash. Fig. 4 illustrates the response obtained at various levels of exchangeable Al and clearly shows that a direct relationship exists for the soils used.
100n
75-
O)
c
a- 50* <D D )
c CD O w <u
Q.
25-
Legend
STALK
*•*. '.;] ROOT
a — Trevanian b — Balgowan (B) c — Balgowan (A)
"i
—r— 300
m
f. I 1
600 900
PLATE 4: Cane growth on Balgowan soils to which Al and wattle-brush ash were added.
Exchangeable soil Al before liming (ppm) FIGURE 4: Response to liming in relation to the Al status of
three soils.
These considerations imply that on the sites without ash, the high exchangeable Al contents of the soil (greater than 500 ppm) may have been toxic to cane growth.
Fig. 5 indicates that root yield was reduced to a greater extent than top yield with increasing exchangeable Al in the soil. This agrees with the results obtained by Foy and Brown11 for other crops. Clarkson8 similarly found that root growth was quickly affected when plants were presented with toxic amounts of Al, whereas top growth was only influenced later.
Table V also shows that when exchangeable soil Al
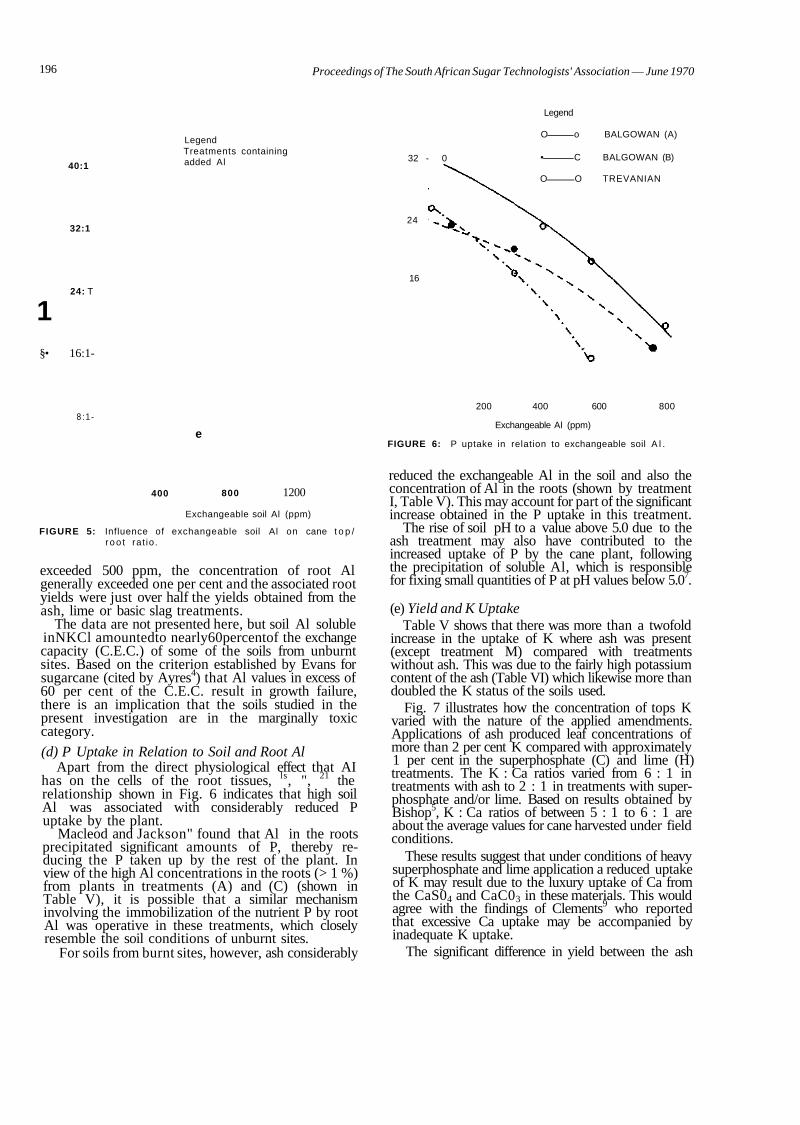
196 Proceedings of The South African Sugar Technologists' Association — June 1970
40:1
32:1
24: T
Legend Treatments containing added Al
1 §• 16:1-
8 : 1 -
e
400 800 1200
Exchangeable soil Al (ppm)
FIGURE 5: Influence of exchangeable soil Al on cane t o p / r oo t rat io.
exceeded 500 ppm, the concentration of root Al generally exceeded one per cent and the associated root yields were just over half the yields obtained from the ash, lime or basic slag treatments.
The data are not presented here, but soil Al soluble inNKCl amountedto nearly60percentof the exchange capacity (C.E.C.) of some of the soils from unburnt sites. Based on the criterion established by Evans for sugarcane (cited by Ayres4) that Al values in excess of 60 per cent of the C.E.C. result in growth failure, there is an implication that the soils studied in the present investigation are in the marginally toxic category.
(d) P Uptake in Relation to Soil and Root Al Apart from the direct physiological effect that AI
has on the cells of the root tissues, ls, ", 21 the relationship shown in Fig. 6 indicates that high soil Al was associated with considerably reduced P uptake by the plant.
Macleod and Jackson" found that Al in the roots precipitated significant amounts of P, thereby reducing the P taken up by the rest of the plant. In view of the high Al concentrations in the roots (> 1 %) from plants in treatments (A) and (C) (shown in Table V), it is possible that a similar mechanism involving the immobilization of the nutrient P by root Al was operative in these treatments, which closely resemble the soil conditions of unburnt sites.
For soils from burnt sites, however, ash considerably
32
24
16
- 0
Legend
O o BALGOWAN (A)
• C BALGOWAN (B)
O O TREVANIAN
200 400 600 800
Exchangeable Al (ppm)
FIGURE 6: P uptake in relation to exchangeable soil A l .
reduced the exchangeable Al in the soil and also the concentration of Al in the roots (shown by treatment I, Table V). This may account for part of the significant increase obtained in the P uptake in this treatment.
The rise of soil pH to a value above 5.0 due to the ash treatment may also have contributed to the increased uptake of P by the cane plant, following the precipitation of soluble Al, which is responsible for fixing small quantities of P at pH values below 5.07.
(e) Yield and K Uptake Table V shows that there was more than a twofold
increase in the uptake of K where ash was present (except treatment M) compared with treatments without ash. This was due to the fairly high potassium content of the ash (Table VI) which likewise more than doubled the K status of the soils used.
Fig. 7 illustrates how the concentration of tops K varied with the nature of the applied amendments. Applications of ash produced leaf concentrations of more than 2 per cent K compared with approximately 1 per cent in the superphosphate (C) and lime (H) treatments. The K : Ca ratios varied from 6 : 1 in treatments with ash to 2 : 1 in treatments with superphosphate and/or lime. Based on results obtained by Bishop5, K : Ca ratios of between 5 : 1 to 6 : 1 are about the average values for cane harvested under field conditions.
These results suggest that under conditions of heavy superphosphate and lime application a reduced uptake of K may result due to the luxury uptake of Ca from the CaS04 and CaC03 in these materials. This would agree with the findings of Clements9 who reported that excessive Ca uptake may be accompanied by inadequate K uptake.
The significant difference in yield between the ash
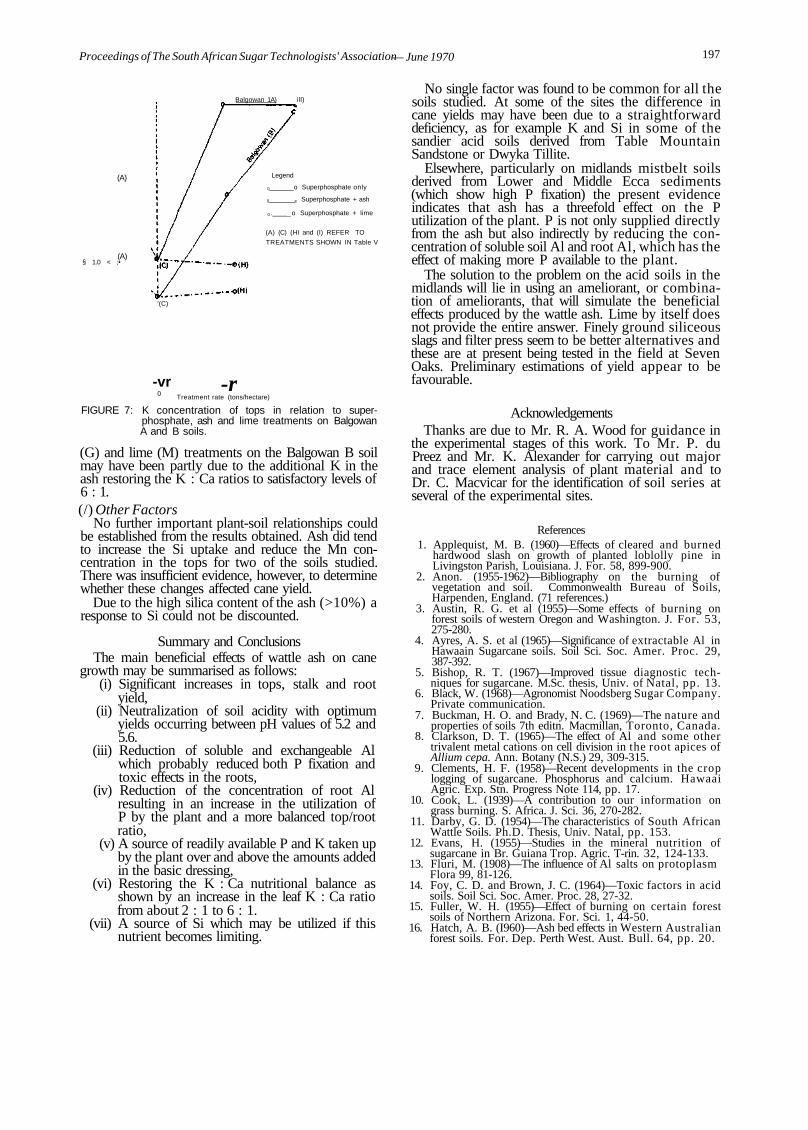
Proceedings of The South African Sugar Technologists' Association — June 1970 197
§ 1.0 < ;•
Balgowan 1A) ill)
(A)
(A)
Legend
0 o Superphosphate only
0 e Superphosphate + ash
0 . _o Superphosphate + lime
(A) (C) (HI and (I) REFER TO
TREATMENTS SHOWN IN Table V
'(C)
-vr 0
-r FIGURE 7:
Treatment rate (tons/hectare)
K concentration of tops in relation to superphosphate, ash and lime treatments on Balgowan A and B soils.
(G) and lime (M) treatments on the Balgowan B soil may have been partly due to the additional K in the ash restoring the K : Ca ratios to satisfactory levels of 6 : 1. (/) Other Factors
No further important plant-soil relationships could be established from the results obtained. Ash did tend to increase the Si uptake and reduce the Mn concentration in the tops for two of the soils studied. There was insufficient evidence, however, to determine whether these changes affected cane yield.
Due to the high silica content of the ash (>10%) a response to Si could not be discounted.
Summary and Conclusions The main beneficial effects of wattle ash on cane
growth may be summarised as follows: (i) Significant increases in tops, stalk and root
yield, (ii) Neutralization of soil acidity with optimum
yields occurring between pH values of 5.2 and 5.6.
(iii) Reduction of soluble and exchangeable Al which probably reduced both P fixation and toxic effects in the roots,
(iv) Reduction of the concentration of root Al resulting in an increase in the utilization of P by the plant and a more balanced top/root ratio,
(v) A source of readily available P and K taken up by the plant over and above the amounts added in the basic dressing,
(vi) Restoring the K : Ca nutritional balance as shown by an increase in the leaf K : Ca ratio from about 2 : 1 to 6 : 1.
(vii) A source of Si which may be utilized if this nutrient becomes limiting.
No single factor was found to be common for all the soils studied. At some of the sites the difference in cane yields may have been due to a straightforward deficiency, as for example K and Si in some of the sandier acid soils derived from Table Mountain Sandstone or Dwyka Tillite.
Elsewhere, particularly on midlands mistbelt soils derived from Lower and Middle Ecca sediments (which show high P fixation) the present evidence indicates that ash has a threefold effect on the P utilization of the plant. P is not only supplied directly from the ash but also indirectly by reducing the concentration of soluble soil Al and root Al, which has the effect of making more P available to the plant.
The solution to the problem on the acid soils in the midlands will lie in using an ameliorant, or combination of ameliorants, that will simulate the beneficial effects produced by the wattle ash. Lime by itself does not provide the entire answer. Finely ground siliceous slags and filter press seem to be better alternatives and these are at present being tested in the field at Seven Oaks. Preliminary estimations of yield appear to be favourable.
Acknowledgements Thanks are due to Mr. R. A. Wood for guidance in
the experimental stages of this work. To Mr. P. du Preez and Mr. K. Alexander for carrying out major and trace element analysis of plant material and to Dr. C. Macvicar for the identification of soil series at several of the experimental sites.
References 1. Applequist, M. B. (1960)—Effects of cleared and burned
hardwood slash on growth of planted loblolly pine in Livingston Parish, Louisiana. J. For. 58, 899-900.
2. Anon. (1955-1962)—Bibliography on the burning of vegetation and soil. Commonwealth Bureau of Soils, Harpenden, England. (71 references.)
3. Austin, R. G. et al (1955)—Some effects of burning on forest soils of western Oregon and Washington. J. For. 53, 275-280.
4. Ayres, A. S. et al (1965)—Significance of extractable Al in Hawaain Sugarcane soils. Soil Sci. Soc. Amer. Proc. 29, 387-392.
5. Bishop, R. T. (1967)—Improved tissue diagnostic techniques for sugarcane. M.Sc. thesis, Univ. of Natal, pp. 13.
6. Black, W. (1968)—Agronomist Noodsberg Sugar Company. Private communication.
7. Buckman, H. O. and Brady, N. C. (1969)—The nature and properties of soils 7th editn. Macmillan, Toronto, Canada.
8. Clarkson, D. T. (1965)—The effect of Al and some other trivalent metal cations on cell division in the root apices of Allium cepa. Ann. Botany (N.S.) 29, 309-315.
9. Clements, H. F. (1958)—Recent developments in the crop logging of sugarcane. Phosphorus and calcium. Hawaai Agric. Exp. Stn. Progress Note 114, pp. 17.
10. Cook, L. (1939)—A contribution to our information on grass burning. S. Africa. J. Sci. 36, 270-282.
11. Darby, G. D. (1954)—The characteristics of South African Wattle Soils. Ph.D. Thesis, Univ. Natal, pp. 153.
12. Evans, H. (1955)—Studies in the mineral nutrition of sugarcane in Br. Guiana Trop. Agric. T-rin. 32, 124-133.
13. Fluri, M. (1908)—The influence of Al salts on protoplasm Flora 99, 81-126.
14. Foy, C. D. and Brown, J. C. (1964)—Toxic factors in acid soils. Soil Sci. Soc. Amer. Proc. 28, 27-32.
15. Fuller, W. H. (1955)—Effect of burning on certain forest soils of Northern Arizona. For. Sci. 1, 44-50.
16. Hatch, A. B. (I960)—Ash bed effects in Western Australian forest soils. For. Dep. Perth West. Aust. Bull. 64, pp. 20.
198 Proceedings of The South African Sugar Technologists' Association —June 1970
17 Macleod, L. B. and Jackson, M. L. (1965)—Effect of concentration of the Al ion on root development and establishment of legume seedlings. Can. J. Soil. Sci. 45, 221-234.
18. Magistad, O. C. (1925)—The Al content of the soil solution and its relation to soil reaction and plant growth. Soil Sci. 20, 181-225.
19. Meiklejohn, J. (1955). The effect of brush burning on the microflora of a Kenya upland soil. J. Soil Sci. 6,111-118.
20. Miller, R. B. (1962)—Biological and chemical changes following scrub burning on a New Zealand hill soil. (N.Z.) J. Sci. 5, 259-268.
21. Rios, M. A. and Pearson, R. W. (1964)—The effect of some chemical environmental factors on cotton root behaviour. Soil Sci. Soc. Amer. Proc. 28, 232-235.
22. Skeen, J. B. and Sumner, M. E. (1965)—The efficiency of various electrolytes for extracting Al from acids soils. S. Afr. J. Agric. Sci. 10, 3-10.
23. Tarrant. R. F. (1956)—Effects of slash burning on some soils of the Douglas-fir region. Soil Sci. Soc. Amer. Proc. 20,408-411.
24. Thompson, G. D. (1968)—S.A.S.A. Experiment Station. Private communication.
25. Uggla, E. (1957)—Soil and air temperatures during burning of clear-felled areas and the effect of fire on vegetation and humus. Norrlands Skogsv. Forb. Tidskr. 4, 443-450.
26. West, O. (1965)—Fire in vegetation and its use in pasture management. Commonwealth Bureau of Pastures and Field Crops, Hurley, Berkshire. (199 references.)
Discussion Mr. du Toit (in the chair): In Figure 5 we are not
indicating a better growth of tops with increased aluminium but rather a very poor root growth.
Dr. Hill: In Table VI the pH of the wattle ash solution is high and no mention is made of sodium content.
Is it high in sodium, and what effect would sodium have on aluminium in the soil?
Mr. Meyer: The sodium oxide content was low — about 1 to 2 per cent.
The reason for the high pH is due to the presence of large concentrations of calcium oxide and potassium oxide in the ash.
Professor Sumner: Sodium carbonate or sodium hydroxide will have an effect on aluminium but will spoil the soil.
Dr. MacVicar: Wattle brush has the effect of increasing yield. In trying to match this we treat the land in various ways.
We overcome some of the problem with aluminium, but not all.
Mr. du Preez mentions a possible additional effect of silica.
May not phosphate fixation also play a role? For example, at Shongweni, there is a marked effect
from wattle brush burning on soils that do not have any aluminium at all but have fixed phosphate.
What is the effect of phosphate fixation and reduction of aluminium toxicity?
Professor Sumner: These are unrelated problems. Aluminium toxicity is not present in all soils but
in ferralitic soils in the Midlands phosphate fixation is invariably found. There is no point in applying heavy doses of phosphate unless you increase the pH to such an extent that the aluminium is eliminated.
Thereafter, for quite large applications of phosphate a linear response is obtained. But the response to phosphate is poor if it is added without taking care of the aluminium.
We have not found phosphate more available as the result of adding lime except in so far as the lime has removed aluminium toxicity.
Mr. Meyer: Results from the pot experiments have shown that a lime dressing improves the amount of P assimilated by the plant. This implies that P availability in soils of below pH 5.2 is increased due to the elimination of soluble Al which is one of the factors responsible for the fixation of P, as insoluble aluminium phosphate, as far as we know. The other more predominant P fixation factors such as the hydrous oxides of Al and Fe are not affeoted by liming and will therefore not contribute towards the increased P uptake.
Mr. du Preez: It has been found overseas that massive applications of phosphate will also reduce aluminium concentration in soils.
Mr. Gilfillan: Could we not achieve our object by ploughing in gypsum? Its greater solubility might offset the uneven distribution.
Professor Sumner: I am at present gathering evidence about this which I hope to present at the Congress next year.
Gypsum's efficacy depends on the use of water with it — it must have a large amount of water and this involves economic consideration.
Dr. Hill: What is the mechanism of aluminium removal?
Professor Sumner: By lime it is:— A1+30H=A1 (OH)3
By gypsum it is:— Clay Al+CaSo4=Clay Ca+Al
Mr. Odendaal: Is there an easy method to determine if aluminium is the problem?
Also, is there a scale, of either lime or gypsum, for various levels of aluminium, exchangeable calcium or possibly pH?
Professor Sumner: When referring to any of the series we have been discussing today, if the pH in water is above 5.4 you are safe.
The critical level in 0.01M calcium chloride, which I prefer, is pH 4.8.
The break starts between 4.8 and 4.6, and below 4.6 there is definitely aluminium.
On sands an application of between 1,000 and 3,000 kg of lime per hectare 15 cm is necessary.
On heavy soils you can go up to 8,000 kg. Mr. Odendaal: Is calcium carbonate more efficient
than calcium sulphate? Professor Sumner: For this reaction it is much more
efficient but for the leaching reaotion the gypsum is better.
I would like to ask Mr. Meyer what the roots looked like in the bad treatments.
Mr. Meyer: The roots produced by treatments other than ash or lime were generally stunted, thickened, red in colour and with a restricted development of secondary roots in contrast to the thinner, lighter and

•June 1970 199 Proceedings of The South African Sugar Technologists Association
greater proliferation of branch roots in the healthy root systems, obtained from the ash and lime treatments.
Mr. Cougnet: Has manganese toxicity as such been identified?
Mr. du Preez: From our experiments it was not possible to determine exactly whether there was a
manganese or an aluminium toxicity. Both are highly dependent on pH.
However, evidence is mainly in favour of aluminium and not manganese toxicity.
Professor Sumner: Manganese is a problem if the soil is flooded. But in our soils it is aluminium and not manganese.
200 l'rt>cceilings of The South African Sugar Technologists' Association — June 1970
A COMPARISON OF THE EFFECTS OF UREA AND SULPHATE OF AMMONIA ON SUGARCANE
By J. M. GOSNELL
Rhodesia Sugar Association Experiment Station, Chiredzi
Abstract Urea resulted in lower cane yields and higher sucrose
% cane than did sulphate of ammonia and the two carriers produced virtually identical yields of sucrose per hectare. There was significantly less lodging in the urea treatments, which might account for the higher sucrose content. These effects occurred in N:Co.376, but not in N :Co.310 or C.P.29/116. Similar responses took place at a level of 101 kg N/ha and at the mean of 5 levels between 101 and 258 kg N/ha. The reduction in flowering which occurred with increasing levels of nitrogen was much more marked with sulphate of ammonia than with urea.
Introduction Numerous experiments have been carried out in
various parts of the world comparing the use of urea and sulphate of ammonia on sugarcane. In a comprehensive review, du Toit (1967) concluded that in the majority of countries, little or no difference had been found between the two carriers, but that sulphate of ammonia produced higher yields of cane than urea on a number of occasions. In many of the experiments quoted, sucrose analyses were not carried out but on several occasions it appeared that urea caused less depression of sucrose than did sulphate of ammonia. However it was not possible to identify or describe the conditions under which these results occurred and the conclusions regarding differential sucrose content between the carriers were challenged by Parish (1967) who contended that a higher sucrose content with urea must have been the result of less efficient utilization of nitrogen. More recently, Gill et. al. (1968) summarized results from over 50 trials in India, and found that sulphate of ammonia produced slightly more cane but lower sucrose content than urea to give equal yields of sucrose per hectare, thus confirming du Toit's conclusions.
Two experiments were established in 1966 at Chiredzi in which a comparison of urea vs. sulphate of ammonia was combined with other treatments in order to ascertain whether some of the factors affecting the comparison of the carriers could be identified. In trial No. 1, three varieties (N:Co.310, N:Co.376 and C P 29/116) were treated with 5 levels of N (101, 140, 179, 219, 258 kg/ha) applied in both forms. Optimum irrigation was given throughout. In trial No. 2 N -Co 376 was subjected to 6 levels of irrigation ranging from 1.0 x Class "A" Pan evaporation to 0.37 x Pan, and the comparison of urea and sulphate of ammonia was factorially arranged with a burning vs. trashing comparison.
The soil on which both trials were established was a
PE1 red brown sandy clay loam, recently cleared from virgin bush, with the following mean analysis :-
Clay pH(CaCI2) Sp. Conductivity (mmho/cm.) Carbon % Total N % Mineral N p.p.m. initially Mineral N p.p.m. after incubation Available P205 (p.p.m.) Ex. K(m.e. %) Ex. Ca(m.e. %) Ex. Mg(m.e. %)
20% 6.7 0.120 0.68 0.053
17 28 13 0.89 9.1 3.5
The urea and sulphate of ammonia were applied on the surface over the cane row and immediately irrigated in to prevent losses of N through volatilization. Applications were split in the plant crop but a single application was made in the ratoons.
TABLE 1 Effect of N carrier on yield and sucrose content
Experiment
1
1
1
2
2
Mean
Crop
P
1R
2R
P
1R
T.C.H. S. % C.
T.S.H.
T.C.H. S. % C. T.S.H.
T.C.H. E.R.S. % C T.E.R.S.H.
T.C.H. S. % C. T.S.H.
T.C.H. s. % c. T.S.H. T.C.H. S. % C. T.S.H.
Urea
139.9 14.36 20.00
155.3 13.74 21.22
127.5 12.75 16.23
115.0 14.36 16.43
117.7 12.89 15.38
131.1 13.98 18.32
Sulphate of Ammonia
144.1 14.14 20.29
158.5 13.23 20.83
129.1 12.15 15.63
118.1 13.98 16.52
121.9 12.61 15.42
134.3 13.58 18.22
L.s.d. (5%)
4.9 0.39 0.74
4.4 0.45* 0.87
3.9 0.41** 0.71
2.5* 0.32* 0.49
4.0* 0.32 0.67
I N.B. T.C.H.
T.S.H. E.R.S. % C.
T.E.R.S.H.
Metric tonnes cane per hectare Metric tonnes sucrose per hectare Estimated Recoverable Sugar % Cane S—0.451 (B—S) — 0.077F where S = Sucrose % cane, B = Brix and F = Fibre by direct analysis. Metric tonnes Estimated Recoverable Sugar/hectare = T.C.H. x E.R.S. % C. xl0-»
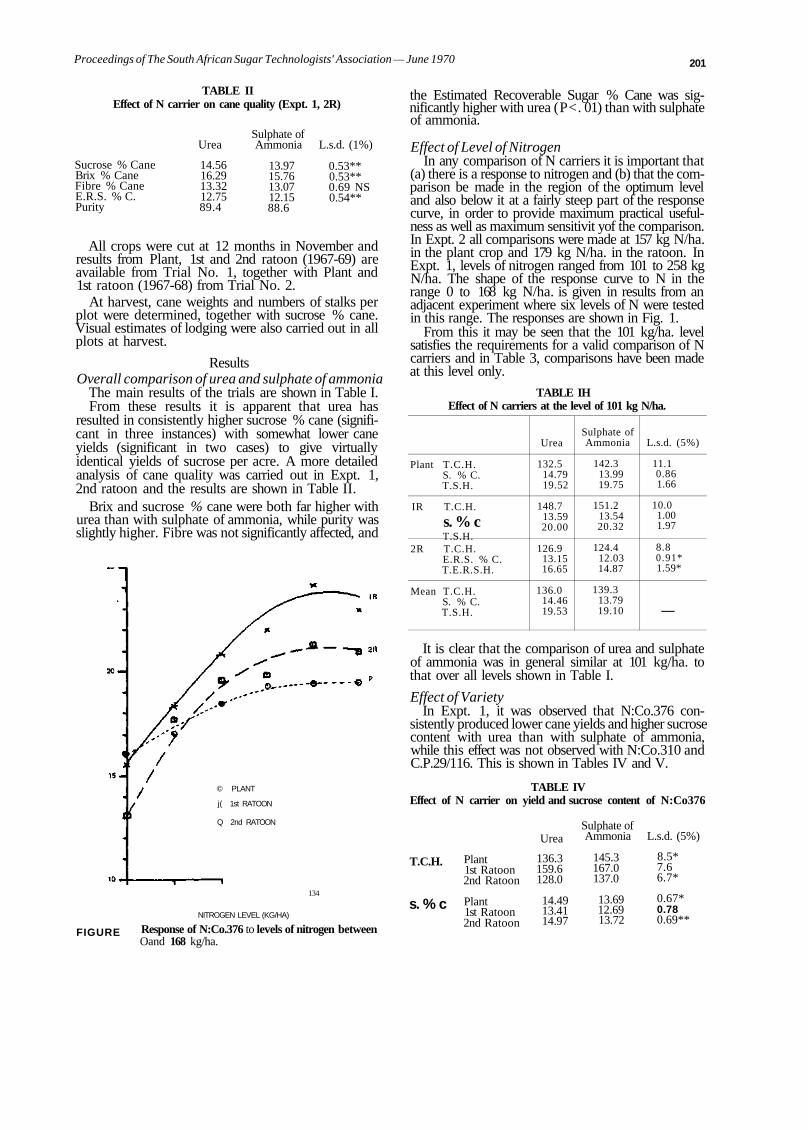
Proceedings of The South African Sugar Technologists' Association — June 1970 201
TABLE II Effect of N carrier on cane quality (Expt. 1, 2R)
Sucrose % Cane Brix % Cane Fibre % Cane E.R.S. % C. Purity
Urea
14.56 16.29 13.32 12.75 89.4
Sulphate of Ammonia
13.97 15.76 13.07 12.15 88.6
L.s.d. (1%)
0.53** 0.53** 0.69 NS 0.54**
All crops were cut at 12 months in November and results from Plant, 1st and 2nd ratoon (1967-69) are available from Trial No. 1, together with Plant and 1st ratoon (1967-68) from Trial No. 2.
At harvest, cane weights and numbers of stalks per plot were determined, together with sucrose % cane. Visual estimates of lodging were also carried out in all plots at harvest.
Results Overall comparison of urea and sulphate of ammonia
The main results of the trials are shown in Table I. From these results it is apparent that urea has
resulted in consistently higher sucrose % cane (significant in three instances) with somewhat lower cane yields (significant in two cases) to give virtually identical yields of sucrose per acre. A more detailed analysis of cane quality was carried out in Expt. 1, 2nd ratoon and the results are shown in Table II.
Brix and sucrose % cane were both far higher with urea than with sulphate of ammonia, while purity was slightly higher. Fibre was not significantly affected, and
© PLANT
j( 1st RATOON
Q 2nd RATOON
134
FIGURE
NITROGEN LEVEL (KG/HA)
Response of N:Co.376 to levels of nitrogen between Oand 168 kg/ha.
the Estimated Recoverable Sugar % Cane was significantly higher with urea (P<. 01) than with sulphate of ammonia.
Effect of Level of Nitrogen In any comparison of N carriers it is important that
(a) there is a response to nitrogen and (b) that the comparison be made in the region of the optimum level and also below it at a fairly steep part of the response curve, in order to provide maximum practical usefulness as well as maximum sensitivit yof the comparison. In Expt. 2 all comparisons were made at 157 kg N/ha. in the plant crop and 179 kg N/ha. in the ratoon. In Expt. 1, levels of nitrogen ranged from 101 to 258 kg N/ha. The shape of the response curve to N in the range 0 to 168 kg N/ha. is given in results from an adjacent experiment where six levels of N were tested in this range. The responses are shown in Fig. 1.
From this it may be seen that the 101 kg/ha. level satisfies the requirements for a valid comparison of N carriers and in Table 3, comparisons have been made at this level only.
TABLE IH Effect of N carriers at the level of 101 kg N/ha.
Plant T.C.H. S. % C. T.S.H.
IR T.C.H.
s. % c T.S.H.
2R T.C.H. E.R.S. % C. T.E.R.S.H.
Mean T.C.H. S. % C. T.S.H.
Urea
132.5 14.79 19.52
148.7 13.59 20.00
126.9 13.15 16.65
136.0 14.46 19.53
Sulphate of Ammonia
142.3 13.99 19.75
151.2 13.54 20.32
124.4 12.03 14.87
139.3 13.79 19.10
L.s.d. (5%)
11.1 0.86 1.66
10.0 1.00 1.97
8.8 0.91* 1.59*
—
It is clear that the comparison of urea and sulphate of ammonia was in general similar at 101 kg/ha. to that over all levels shown in Table I.
Effect of Variety In Expt. 1, it was observed that N:Co.376 con
sistently produced lower cane yields and higher sucrose content with urea than with sulphate of ammonia, while this effect was not observed with N:Co.310 and C.P.29/116. This is shown in Tables IV and V.
TABLE IV Effect of N carrier on yield and sucrose content of N:Co376
T.C.H.
s. % c
Plant 1st Ratoon 2nd Ratoon
Plant 1st Ratoon 2nd Ratoon
Urea
136.3 159.6 128.0
14.49 13.41 14.97
Sulphate of Ammonia
145.3 167.0 137.0
13.69 12.69 13.72
L.s.d. (5%)
8.5* 7.6 6.7*
0.67* 0.78 0.69**
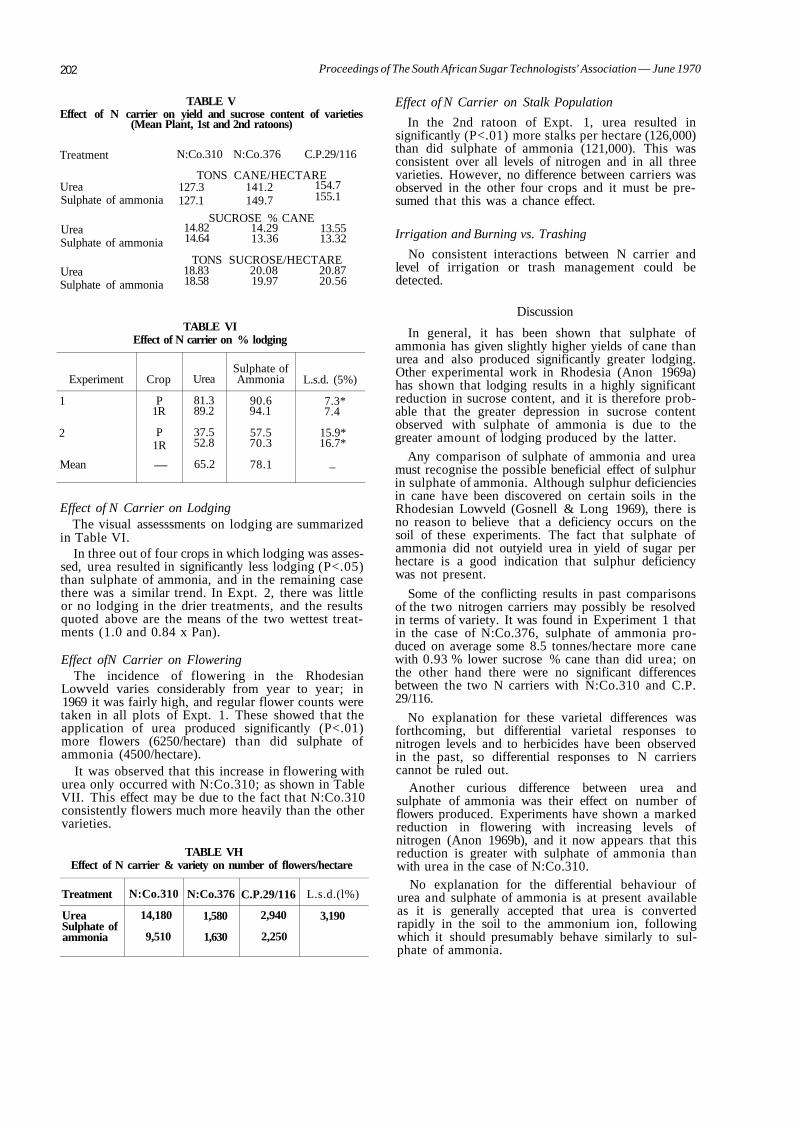
202 Proceedings of The South African Sugar Technologists' Association — June 1970
TABLE V Effect of N carrier on yield and sucrose content of varieties
(Mean Plant, 1st and 2nd ratoons)
Treatment
Urea Sulphate of ammonia
Urea Sulphate of ammonia
Urea Sulphate of ammonia
N:Co.310 N:Co.376 C.P.29/116
TONS CANE/HECTARE 127.3 141.2 127.1 149.7
154.7 155.1
14.82 14.64
SUCROSE % CANE 14.29 13.36
13.55 13.32
TONS SUCROSE/HECTARE 18.83 20.08 20.87 18.58 19.97 20.56
TABLE VI Effect of N carrier on % lodging
Experiment
1
2
Mean
Crop
P 1R
P 1R
—
Urea
81.3 89.2
37.5 52.8
65.2
Sulphate of Ammonia
90.6 94.1
57.5 70.3
78.1
L.s.d. (5%)
7.3* 7.4
15.9* 16.7*
_
Effect of N Carrier on Lodging The visual assesssments on lodging are summarized
in Table VI. In three out of four crops in which lodging was asses
sed, urea resulted in significantly less lodging (P<.05) than sulphate of ammonia, and in the remaining case there was a similar trend. In Expt. 2, there was little or no lodging in the drier treatments, and the results quoted above are the means of the two wettest treatments (1.0 and 0.84 x Pan).
Effect ofN Carrier on Flowering The incidence of flowering in the Rhodesian
Lowveld varies considerably from year to year; in 1969 it was fairly high, and regular flower counts were taken in all plots of Expt. 1. These showed that the application of urea produced significantly (P<.01) more flowers (6250/hectare) than did sulphate of ammonia (4500/hectare).
It was observed that this increase in flowering with urea only occurred with N:Co.310; as shown in Table VII. This effect may be due to the fact that N:Co.310 consistently flowers much more heavily than the other varieties.
TABLE VH Effect of N carrier & variety on number of flowers/hectare
Treatment
Urea Sulphate of ammonia
N:Co.310
14,180
9,510
N:Co.376
1,580
1,630
C.P.29/116
2,940
2,250
L.s.d.(l%)
3,190
Effect of N Carrier on Stalk Population
In the 2nd ratoon of Expt. 1, urea resulted in significantly (P<.01) more stalks per hectare (126,000) than did sulphate of ammonia (121,000). This was consistent over all levels of nitrogen and in all three varieties. However, no difference between carriers was observed in the other four crops and it must be presumed that this was a chance effect.
Irrigation and Burning vs. Trashing
No consistent interactions between N carrier and level of irrigation or trash management could be detected.
Discussion
In general, it has been shown that sulphate of ammonia has given slightly higher yields of cane than urea and also produced significantly greater lodging. Other experimental work in Rhodesia (Anon 1969a) has shown that lodging results in a highly significant reduction in sucrose content, and it is therefore probable that the greater depression in sucrose content observed with sulphate of ammonia is due to the greater amount of lodging produced by the latter.
Any comparison of sulphate of ammonia and urea must recognise the possible beneficial effect of sulphur in sulphate of ammonia. Although sulphur deficiencies in cane have been discovered on certain soils in the Rhodesian Lowveld (Gosnell & Long 1969), there is no reason to believe that a deficiency occurs on the soil of these experiments. The fact that sulphate of ammonia did not outyield urea in yield of sugar per hectare is a good indication that sulphur deficiency was not present.
Some of the conflicting results in past comparisons of the two nitrogen carriers may possibly be resolved in terms of variety. It was found in Experiment 1 that in the case of N:Co.376, sulphate of ammonia produced on average some 8.5 tonnes/hectare more cane with 0.93 % lower sucrose % cane than did urea; on the other hand there were no significant differences between the two N carriers with N:Co.310 and C.P. 29/116.
No explanation for these varietal differences was forthcoming, but differential varietal responses to nitrogen levels and to herbicides have been observed in the past, so differential responses to N carriers cannot be ruled out.
Another curious difference between urea and sulphate of ammonia was their effect on number of flowers produced. Experiments have shown a marked reduction in flowering with increasing levels of nitrogen (Anon 1969b), and it now appears that this reduction is greater with sulphate of ammonia than with urea in the case of N:Co.310.
No explanation for the differential behaviour of urea and sulphate of ammonia is at present available as it is generally accepted that urea is converted rapidly in the soil to the ammonium ion, following which it should presumably behave similarly to sulphate of ammonia.
Proceedings of The South African Sugar Technologists' Association —June 1970 203
Urea CO(NH2)2 urease NH4+ N02 ' N03 '
> > > Sulphate of ammonia
(NH4)2S04 > NH,+ > N<V >N0 3 '
The main practical conclusion from these trials is that there was no difference between the two carriers in yield of sucrose per acre; however urea is the recommended carrier because it has a lower cost per unit nitrogen. In addition, the higher sucrose content combined with lower yields obtained with urea results in lower costs in transporting cane to the mill. These conclusions are only valid, however, where urea can be irrigated in or cultivated, in order to prevent volatilization losses of nitrogen.
References 1. Anon, 1969 (a) Lodging. Sugarcane Newsletter (Rhodesia
Sugar Association Experiment Station) 15 p. 6. 2. Anon, 1969 (b). Flowering in Cane. Sugarcane Newsletter
(Rhodesia Sugar Association Experiment Station) 14 p. 8. 3. Du Toit, J. L., 1967. The use and efficacy of different forms
of nitrogen in sugarcane. S.A. Sug. J. 51, 3 : 213 4. Gill, P. S., Motiwale, M. P., and Singh, B., 1968. on the res
ponse of sugarcane to urea. Indian Sugar 18 : 679-682. 5. Gosnell, J. M., and Long, A. C, 1969. A Sulphur deficiency
in Sugarcane. Proc. S.A. Sug.Tech. Ass. 43 : 26. 6. Parish , D. H., 1967. Urea as a fertilizer for sugarcane. S.A.
Sug. J. 51, 12 : 1023.
Discussion Mr. du Toit: We have noticed that when ammonium
sulphate is used the cane has a better appearance — it looks greener — than when urea is used.
I have always thought that very soon after the application of either urea or ammonium sulphate the nitrogenous form would always be in the form of a nitrate. Therefore why do these differences persist?
Dr. Gosnell: We have observed no colour differences at all.
Professor Orchard: In any comparison where sulphate of ammonia is involved, the final cost must be kept in mind.
It is all right in a neutral soil with 20% clay, but with sandy, less buffered soils that are slightly acid, if sulphate of ammonia is used the soil will eventually become acid and have to be limed.
Mr. du Toit: I understand that Iran is using urea on an alkaline soil with irrigation.
Have experiments comparing urea and ammonium sulphate been carried out in Iran?
Mr. Abbassi: In Iran we found urea gave a better yield and better sucrose on the ratoon crop. There was no difference in the plant cane crop.
Mr. d'Hotman de Villiers: Will not continued use of urea result in sulphur deficiency in the soil?
Dr. Gosnell: We have found sulphur deficiencies in Rhodesia due to use of urea and double and triple supers. By returning to the use of single supers we have corrected this.
Dr. Cleasby (in the chair): In Natal, where urea has been used for a long time, there are signs of sulphur deficiency.
Mr. Odendaal: Did Dr. Gosnell notice a difference in lodging between the various varieties?
Also, why does ammonium sulphate cause more lodging than urea.
Dr. Gosnell: CP 29/116 lodged more than the other two varieties.
I do not know why there is more lodging with ammonium sulphate .
Mr. Wood: We are carrying out a comprehensive nutrient survey at present throughout the industry and sulphur is one of the elements being considered.
Mr. Moberly: Are there any third leaf differences in content, particularly in respect of varieties?
Dr. Gosnell: We have not yet analysed many third leaf samples and so far results are confusing.
Mr. Alexander: Our main reason for recommending urea is that sulphate of ammonia at present prices is about 10% per unit of N higher than urea, apart from higher transport and storage costs.
201 Proceedings of The South African Sugar Technologists' Association — June 1970
LEAF SCALD DISEASE OF SUGARCANE IN SOUTH AFRICA By G. ROTH and G. M. THOMSON
South African Sugar Association Experiment Station
Abstract The history of leaf scald disease is briefly traced in
South Africa and in other countries. Symptoms, transmission and control measures are described and observations made on varietal resistance in South Africa.
Historical Introduction The bacterial disease now known as leaf scald is con
sidered to be one of the most destructive diseases which infect sugarcane, and in Queensland last year was described as potentially the industry's most dangerous disease (Anon 1969)1.
Leaf scald probably originated in the East Indies and was confined for many years to the Eastern Hemisphere. In Java the disease was first known as "Hundred Brown disease" indicating the susceptibility of a variety of that name. It was later called 'gom-ziekte' or gum disease and thought to be identical with gummosis (Wiehe 1951)9. They were subsequently found to be two distinct diseases and the Java gum disease was recognised as being identical with the Australian leaf scald. The name leaf scald was then adopted for the disease, the causal organism being the bacterium Xanthomonas albilineans (Ashby) Dowson.
Leaf scald probably occurred in Australia before 1900 having possibly been introduced from Java or New Guinea. The disease was subsequently recorded for other Eastern Hemisphere countries - Fiji (1911), Taiwan (1919), Philippines (1921), Mauritius (1928) and Malagasy (1936).
The disease arrived in the Western Hemisphere by way of Brazil between 1926 and 1930 and was probably introduced into Guyana during the same period. In the South American and Caribbean regions leaf scald has been recorded in Argentina, Dutch Guiana, Martinique, Puerto Rico and St. Lucia.
The first report of leaf scald in Hawaii came in 1930, but evidence suggests that the disease had been present for some years prior to this.
Within the last few years leaf scald has been found for the first time in a number of countries. In Africa it was found in Rhodesia in 1965. Since then it has been reported in Ghana, Tanzania, Malawi, Mocambique, Swaziland and South Africa (Thompson 1969)7.
In countries abroad, the disease was recorded in 1968 in both Florida and Barbados.
In 1965 leaf scald was intercepted in the Durban quarantine glasshouse on a variety imported from Argentina eight months previously and has recently been discovered a second time on a variety introduced from Reunion. In Kenya the disease has appeared on two occasions on canes being held in quarantine (Sheffield 1969) 6.
Leaf scald in South Africa and Swaziland Leaf scald was first recorded from South Africa and
from Swaziland towards the end of 1968 (Thomson 1969)7'8.
Specimens of the varieties N.50/211 and N.53/216 from Ubombo Ranches in Swaziland were sent to the Experiment Station in 1968 for diagnosis after reports of die-back of isolated stools in the field. None of the characteristic chronic phase symptoms of leaf scald was present on the samples and a thorough examination failed to reveal the cause of the problem. It was only after a stool of N.50/211, planted in the glasshouse for further observation, developed typical symptoms that leaf scald was finally diagnosed.
Early in 1969 a propagation plot of the variety N.6 at Mhlume Sugar Company in Swaziland developed sideshoots for no apparent reason. These sideshoots later showed the typical white lines, scalded appearance and reddened vascular tissues of leaf scald disease. On the same estate N.51/168 and N.53/216 were also found infected. At Ubombo Ranches the variety N.6 also exhibited typical leaf scald symptoms in a young ratoon crop.
Specimens of CB.36/14 from an estate in the Natal portion of the Pongola settlement were also diagnosed as cases of leaf scald but only after replanting in the glasshouse.
In the Eastern Transvaal the first positive identification of leaf scald came from a series of demonstration stools of N.50/211 and N.53/216 in November 1968 while three months later the disease was found in a stool of N.51/539.
Two ratooning variety trials in the Eastern Trans-vaa ldeveloped leaf scald symptoms in N :Co.334, N.50/ 211, CB.36/14 and N.6 while propagation plots of the latter were also found to be infected.
In Natal leaf scald has now been reported from single fields of CB.36/14 in the Umzinto district of the South Coast and in the Eshowe area, and in the varieties N:Co.310, N.53/216., N.55/805, CB.36/14and N.6 in the Glendale Valley of the North Coast.
Symptoms Leaf scald as a bacterial, vascular disease can occur
in two distinct phases, known as the chronic and acute forms respectively (Martin and Robinson 1961)5.
The Chronic Phase In young newly-infected plants the initial symptom
of the chronic phase is the development of long, narrow white leaf stripes which are at first sharply defined running parallel to the veins (see Plate 1). With age, the white lines become more diffuse in outline and some reddening of the white tissue occurs. The widening stripes wither from the leaf tip downwards and in curling upwards and inwards produce the characteristic "scalded" appearance ' Prominent features of the chronic phase are the sideshoots which develop at
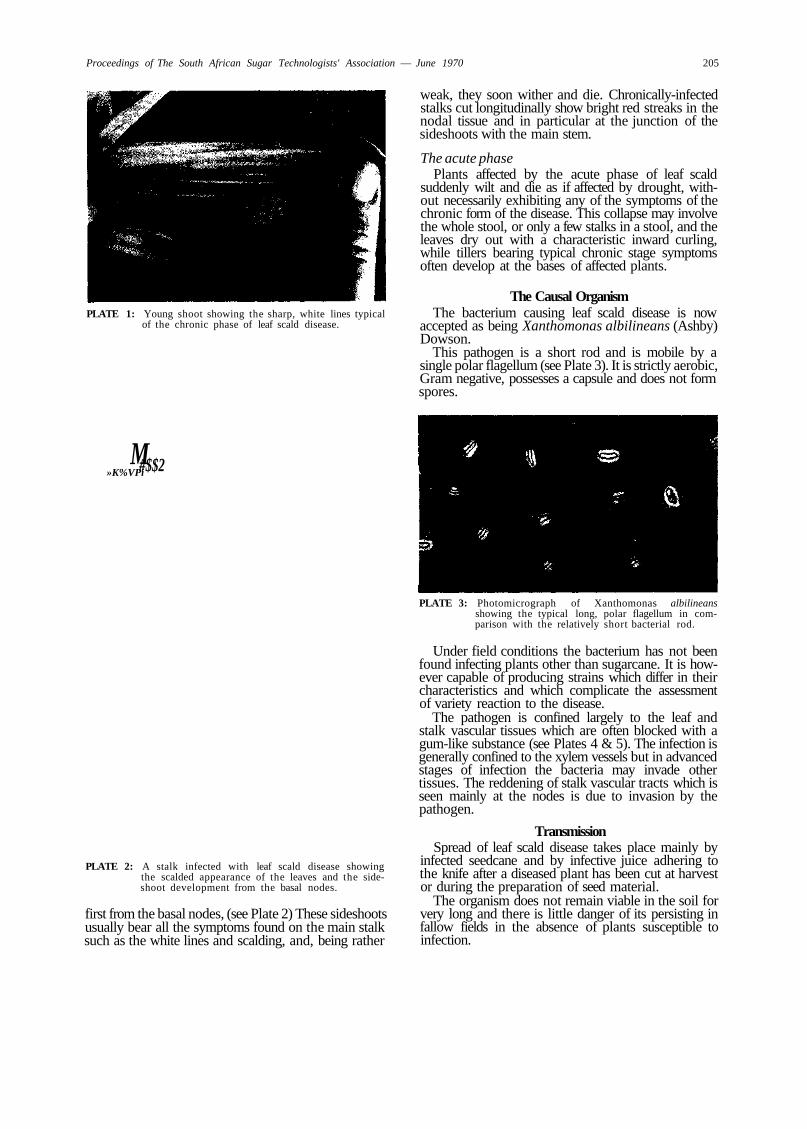
Proceedings of The South African Sugar Technologists' Association — June 1970 205
PLATE 1: Young shoot showing the sharp, white lines typical of the chronic phase of leaf scald disease.
M »K%VPi #$$2
PLATE 2: A stalk infected with leaf scald disease showing the scalded appearance of the leaves and the side-shoot development from the basal nodes.
first from the basal nodes, (see Plate 2) These sideshoots usually bear all the symptoms found on the main stalk such as the white lines and scalding, and, being rather
weak, they soon wither and die. Chronically-infected stalks cut longitudinally show bright red streaks in the nodal tissue and in particular at the junction of the sideshoots with the main stem.
The acute phase Plants affected by the acute phase of leaf scald
suddenly wilt and die as if affected by drought, without necessarily exhibiting any of the symptoms of the chronic form of the disease. This collapse may involve the whole stool, or only a few stalks in a stool, and the leaves dry out with a characteristic inward curling, while tillers bearing typical chronic stage symptoms often develop at the bases of affected plants.
The Causal Organism The bacterium causing leaf scald disease is now
accepted as being Xanthomonas albilineans (Ashby) Dowson.
This pathogen is a short rod and is mobile by a single polar flagellum (see Plate 3). It is strictly aerobic, Gram negative, possesses a capsule and does not form spores.
PLATE 3: Photomicrograph of Xanthomonas albilineans showing the typical long, polar flagellum in comparison with the relatively short bacterial rod.
Under field conditions the bacterium has not been found infecting plants other than sugarcane. It is however capable of producing strains which differ in their characteristics and which complicate the assessment of variety reaction to the disease.
The pathogen is confined largely to the leaf and stalk vascular tissues which are often blocked with a gum-like substance (see Plates 4 & 5). The infection is generally confined to the xylem vessels but in advanced stages of infection the bacteria may invade other tissues. The reddening of stalk vascular tracts which is seen mainly at the nodes is due to invasion by the pathogen.
Transmission Spread of leaf scald disease takes place mainly by
infected seedcane and by infective juice adhering to the knife after a diseased plant has been cut at harvest or during the preparation of seed material.
The organism does not remain viable in the soil for very long and there is little danger of its persisting in fallow fields in the absence of plants susceptible to infection.
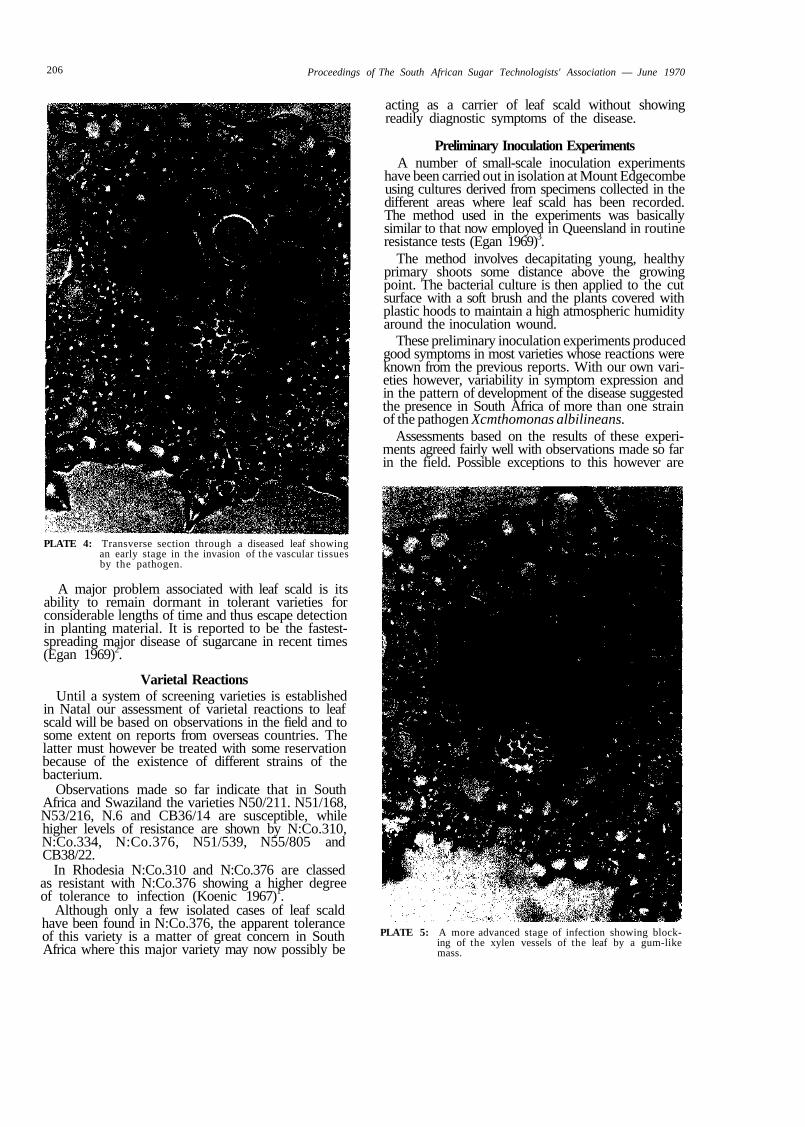
206 Proceedings of The South African Sugar Technologists' Association — June 1970
PLATE 4: Transverse section through a diseased leaf showing an early stage in the invasion of the vascular tissues by the pathogen.
A major problem associated with leaf scald is its ability to remain dormant in tolerant varieties for considerable lengths of time and thus escape detection in planting material. It is reported to be the fastest-spreading major disease of sugarcane in recent times (Egan 1969)2.
Varietal Reactions Until a system of screening varieties is established
in Natal our assessment of varietal reactions to leaf scald will be based on observations in the field and to some extent on reports from overseas countries. The latter must however be treated with some reservation because of the existence of different strains of the bacterium.
Observations made so far indicate that in South Africa and Swaziland the varieties N50/211. N51/168, N53/216, N.6 and CB36/14 are susceptible, while higher levels of resistance are shown by N:Co.310, N:Co.334, N:Co.376, N51/539, N55/805 and CB38/22.
In Rhodesia N:Co.310 and N:Co.376 are classed as resistant with N:Co.376 showing a higher degree of tolerance to infection (Koenic 1967)1.
Although only a few isolated cases of leaf scald have been found in N:Co.376, the apparent tolerance of this variety is a matter of great concern in South Africa where this major variety may now possibly be
acting as a carrier of leaf scald without showing readily diagnostic symptoms of the disease.
Preliminary Inoculation Experiments A number of small-scale inoculation experiments
have been carried out in isolation at Mount Edgecombe using cultures derived from specimens collected in the different areas where leaf scald has been recorded. The method used in the experiments was basically similar to that now employed in Queensland in routine resistance tests (Egan 1969)3.
The method involves decapitating young, healthy primary shoots some distance above the growing point. The bacterial culture is then applied to the cut surface with a soft brush and the plants covered with plastic hoods to maintain a high atmospheric humidity around the inoculation wound.
These preliminary inoculation experiments produced good symptoms in most varieties whose reactions were known from the previous reports. With our own varieties however, variability in symptom expression and in the pattern of development of the disease suggested the presence in South Africa of more than one strain of the pathogen Xcmthomonas albilineans.
Assessments based on the results of these experiments agreed fairly well with observations made so far in the field. Possible exceptions to this however are
PLATE 5: A more advanced stage of infection showing blocking of the xylen vessels of the leaf by a gum-like mass.
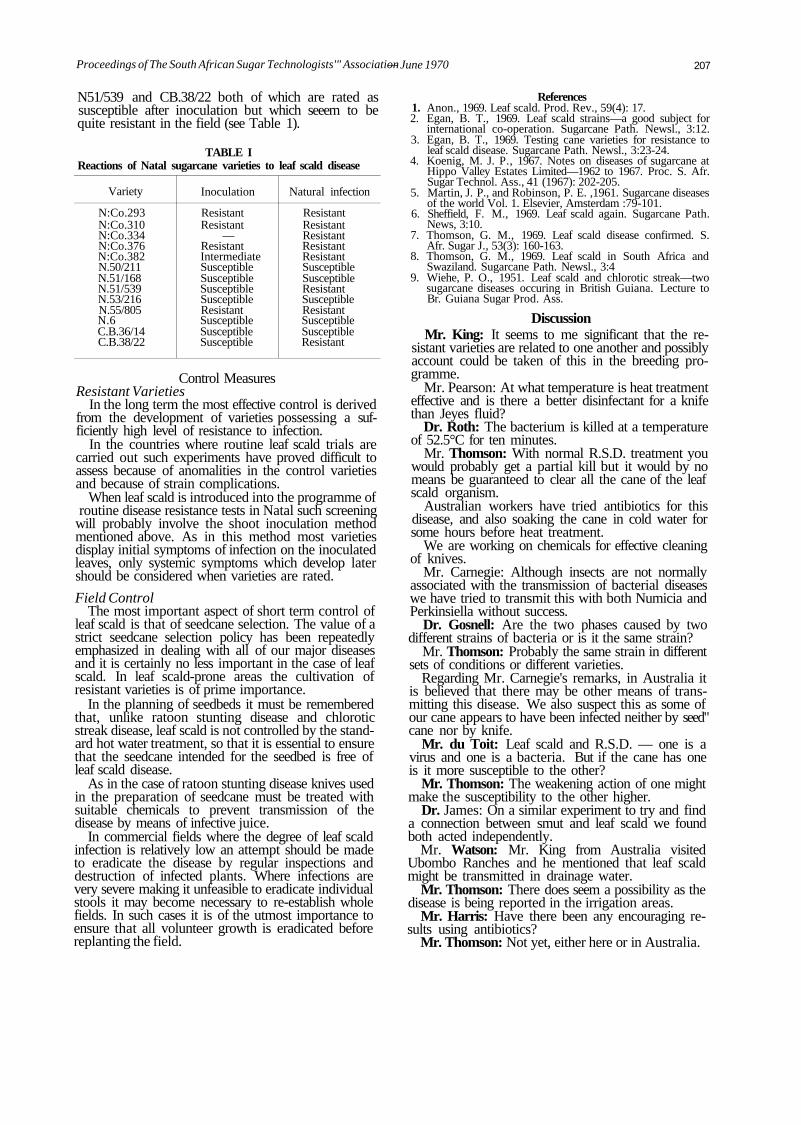
Proceedings of The South African Sugar Technologists'" Association — June 1970 207
N51/539 and CB.38/22 both of which are rated as susceptible after inoculation but which seeem to be quite resistant in the field (see Table 1).
TABLE I Reactions of Natal sugarcane varieties to leaf scald disease
Variety
N:Co.293 N:Co.310 N:Co.334 N:Co.376 N:Co.382 N.50/211 N.51/168 N.51/539 N.53/216 N.55/805 N.6 C.B.36/14 C.B.38/22
Inoculation
Resistant Resistant
— Resistant Intermediate Susceptible Susceptible Susceptible Susceptible Resistant Susceptible Susceptible Susceptible
Natural infection
Resistant Resistant Resistant Resistant Resistant Susceptible Susceptible Resistant Susceptible Resistant Susceptible Susceptible Resistant
Control Measures Resistant Varieties
In the long term the most effective control is derived from the development of varieties possessing a sufficiently high level of resistance to infection.
In the countries where routine leaf scald trials are carried out such experiments have proved difficult to assess because of anomalities in the control varieties and because of strain complications.
When leaf scald is introduced into the programme of routine disease resistance tests in Natal such screening
will probably involve the shoot inoculation method mentioned above. As in this method most varieties display initial symptoms of infection on the inoculated leaves, only systemic symptoms which develop later should be considered when varieties are rated.
Field Control The most important aspect of short term control of
leaf scald is that of seedcane selection. The value of a strict seedcane selection policy has been repeatedly emphasized in dealing with all of our major diseases and it is certainly no less important in the case of leaf scald. In leaf scald-prone areas the cultivation of resistant varieties is of prime importance.
In the planning of seedbeds it must be remembered that, unlike ratoon stunting disease and chlorotic streak disease, leaf scald is not controlled by the standard hot water treatment, so that it is essential to ensure that the seedcane intended for the seedbed is free of leaf scald disease.
As in the case of ratoon stunting disease knives used in the preparation of seedcane must be treated with suitable chemicals to prevent transmission of the disease by means of infective juice.
In commercial fields where the degree of leaf scald infection is relatively low an attempt should be made to eradicate the disease by regular inspections and destruction of infected plants. Where infections are very severe making it unfeasible to eradicate individual stools it may become necessary to re-establish whole fields. In such cases it is of the utmost importance to ensure that all volunteer growth is eradicated before replanting the field.
References 1. Anon., 1969. Leaf scald. Prod. Rev., 59(4): 17. 2. Egan, B. T., 1969. Leaf scald strains—a good subject for
international co-operation. Sugarcane Path. Newsl., 3:12. 3. Egan, B. T., 1969. Testing cane varieties for resistance to
leaf scald disease. Sugarcane Path. Newsl., 3:23-24. 4. Koenig, M. J. P., 1967. Notes on diseases of sugarcane at
Hippo Valley Estates Limited—1962 to 1967. Proc. S. Afr. Sugar Technol. Ass., 41 (1967): 202-205.
5. Martin, J. P., and Robinson, P. E. ,1961. Sugarcane diseases of the world Vol. 1. Elsevier, Amsterdam :79-101.
6. Sheffield, F. M., 1969. Leaf scald again. Sugarcane Path. News, 3:10.
7. Thomson, G. M., 1969. Leaf scald disease confirmed. S. Afr. Sugar J., 53(3): 160-163.
8. Thomson, G. M., 1969. Leaf scald in South Africa and Swaziland. Sugarcane Path. Newsl., 3:4
9. Wiehe, P. O., 1951. Leaf scald and chlorotic streak—two sugarcane diseases occuring in British Guiana. Lecture to Br. Guiana Sugar Prod. Ass.
Discussion Mr. King: It seems to me significant that the re
sistant varieties are related to one another and possibly account could be taken of this in the breeding programme.
Mr. Pearson: At what temperature is heat treatment effective and is there a better disinfectant for a knife than Jeyes fluid?
Dr. Roth: The bacterium is killed at a temperature of 52.5°C for ten minutes.
Mr. Thomson: With normal R.S.D. treatment you would probably get a partial kill but it would by no means be guaranteed to clear all the cane of the leaf scald organism.
Australian workers have tried antibiotics for this disease, and also soaking the cane in cold water for some hours before heat treatment.
We are working on chemicals for effective cleaning of knives.
Mr. Carnegie: Although insects are not normally associated with the transmission of bacterial diseases we have tried to transmit this with both Numicia and Perkinsiella without success.
Dr. Gosnell: Are the two phases caused by two different strains of bacteria or is it the same strain?
Mr. Thomson: Probably the same strain in different sets of conditions or different varieties.
Regarding Mr. Carnegie's remarks, in Australia it is believed that there may be other means of transmitting this disease. We also suspect this as some of our cane appears to have been infected neither by seed" cane nor by knife.
Mr. du Toit: Leaf scald and R.S.D. — one is a virus and one is a bacteria. But if the cane has one is it more susceptible to the other?
Mr. Thomson: The weakening action of one might make the susceptibility to the other higher.
Dr. James: On a similar experiment to try and find a connection between smut and leaf scald we found both acted independently.
Mr. Watson: Mr. King from Australia visited Ubombo Ranches and he mentioned that leaf scald might be transmitted in drainage water.
Mr. Thomson: There does seem a possibility as the disease is being reported in the irrigation areas.
Mr. Harris: Have there been any encouraging results using antibiotics?
Mr. Thomson: Not yet, either here or in Australia.
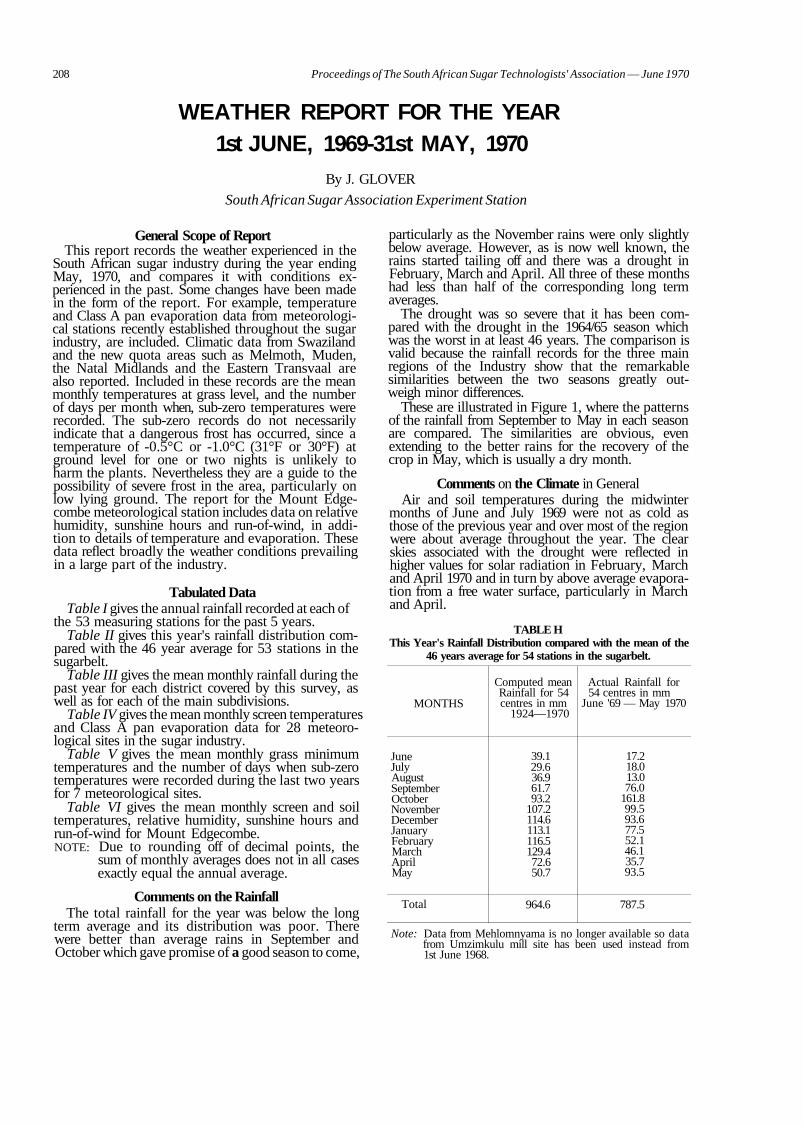
208 Proceedings of The South African Sugar Technologists' Association — June 1970
WEATHER REPORT FOR THE YEAR 1st JUNE, 1969-31st MAY, 1970
By J. GLOVER
South African Sugar Association Experiment Station
General Scope of Report This report records the weather experienced in the
South African sugar industry during the year ending May, 1970, and compares it with conditions experienced in the past. Some changes have been made in the form of the report. For example, temperature and Class A pan evaporation data from meteorological stations recently established throughout the sugar industry, are included. Climatic data from Swaziland and the new quota areas such as Melmoth, Muden, the Natal Midlands and the Eastern Transvaal are also reported. Included in these records are the mean monthly temperatures at grass level, and the number of days per month when, sub-zero temperatures were recorded. The sub-zero records do not necessarily indicate that a dangerous frost has occurred, since a temperature of -0.5°C or -1.0°C (31°F or 30°F) at ground level for one or two nights is unlikely to harm the plants. Nevertheless they are a guide to the possibility of severe frost in the area, particularly on low lying ground. The report for the Mount Edgecombe meteorological station includes data on relative humidity, sunshine hours and run-of-wind, in addition to details of temperature and evaporation. These data reflect broadly the weather conditions prevailing in a large part of the industry.
Tabulated Data Table I gives the annual rainfall recorded at each of
the 53 measuring stations for the past 5 years. Table II gives this year's rainfall distribution com
pared with the 46 year average for 53 stations in the sugarbelt.
Table III gives the mean monthly rainfall during the past year for each district covered by this survey, as well as for each of the main subdivisions.
Table IV gives the mean monthly screen temperatures and Class A pan evaporation data for 28 meteorological sites in the sugar industry.
Table V gives the mean monthly grass minimum temperatures and the number of days when sub-zero temperatures were recorded during the last two years for 7 meteorological sites.
Table VI gives the mean monthly screen and soil temperatures, relative humidity, sunshine hours and run-of-wind for Mount Edgecombe. NOTE: Due to rounding off of decimal points, the
sum of monthly averages does not in all cases exactly equal the annual average.
Comments on the Rainfall The total rainfall for the year was below the long
term average and its distribution was poor. There were better than average rains in September and October which gave promise of a good season to come,
particularly as the November rains were only slightly below average. However, as is now well known, the rains started tailing off and there was a drought in February, March and April. All three of these months had less than half of the corresponding long term averages.
The drought was so severe that it has been compared with the drought in the 1964/65 season which was the worst in at least 46 years. The comparison is valid because the rainfall records for the three main regions of the Industry show that the remarkable similarities between the two seasons greatly outweigh minor differences.
These are illustrated in Figure 1, where the patterns of the rainfall from September to May in each season are compared. The similarities are obvious, even extending to the better rains for the recovery of the crop in May, which is usually a dry month.
Comments on the Climate in General Air and soil temperatures during the midwinter
months of June and July 1969 were not as cold as those of the previous year and over most of the region were about average throughout the year. The clear skies associated with the drought were reflected in higher values for solar radiation in February, March and April 1970 and in turn by above average evaporation from a free water surface, particularly in March and April.
TABLE H This Year's Rainfall Distribution compared with the mean of the
46 years average for 54 stations in the sugarbelt.
MONTHS
June July August September October November December January February March April May
Total
Computed mean Rainfall for 54 centres in mm
1924—1970
39.1 29.6 36.9 61.7 93.2
107.2 114.6 113.1 116.5 129.4 72.6 50.7
964.6
Actual Rainfall for 54 centres in mm
June '69 — May 1970
17.2 18.0 13.0 76.0
161.8 99.5 93.6 77.5 52.1 46.1 35.7 93.5
787.5
Note: Data from Mehlomnyama is no longer available so data from Umzimkulu mill site has been used instead from 1st June 1968.
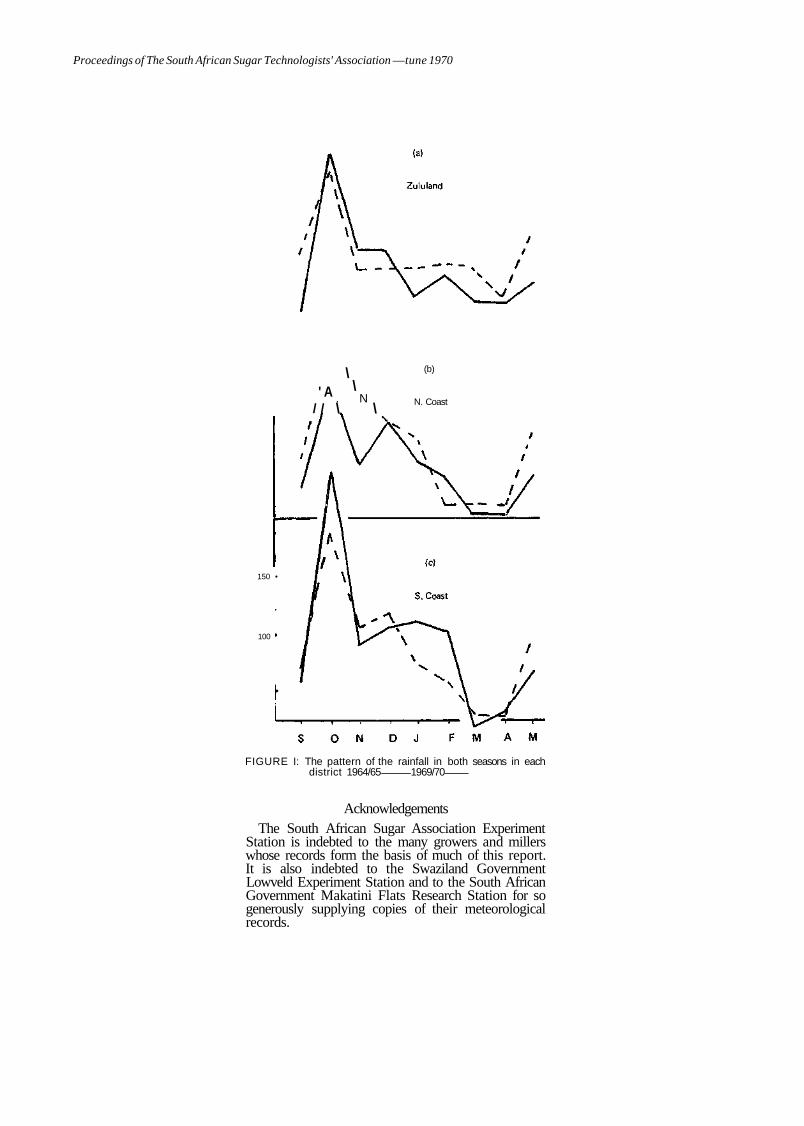
Proceedings of The South African Sugar Technologists' Association —tune 1970
150 •
100
' A / /
\ \
. N \ \
(b)
N. Coast
FIGURE I: The pattern of the rainfall in both seasons in each district 1964/65 1969/70
Acknowledgements The South African Sugar Association Experiment
Station is indebted to the many growers and millers whose records form the basis of much of this report. It is also indebted to the Swaziland Government Lowveld Experiment Station and to the South African Government Makatini Flats Research Station for so generously supplying copies of their meteorological records.
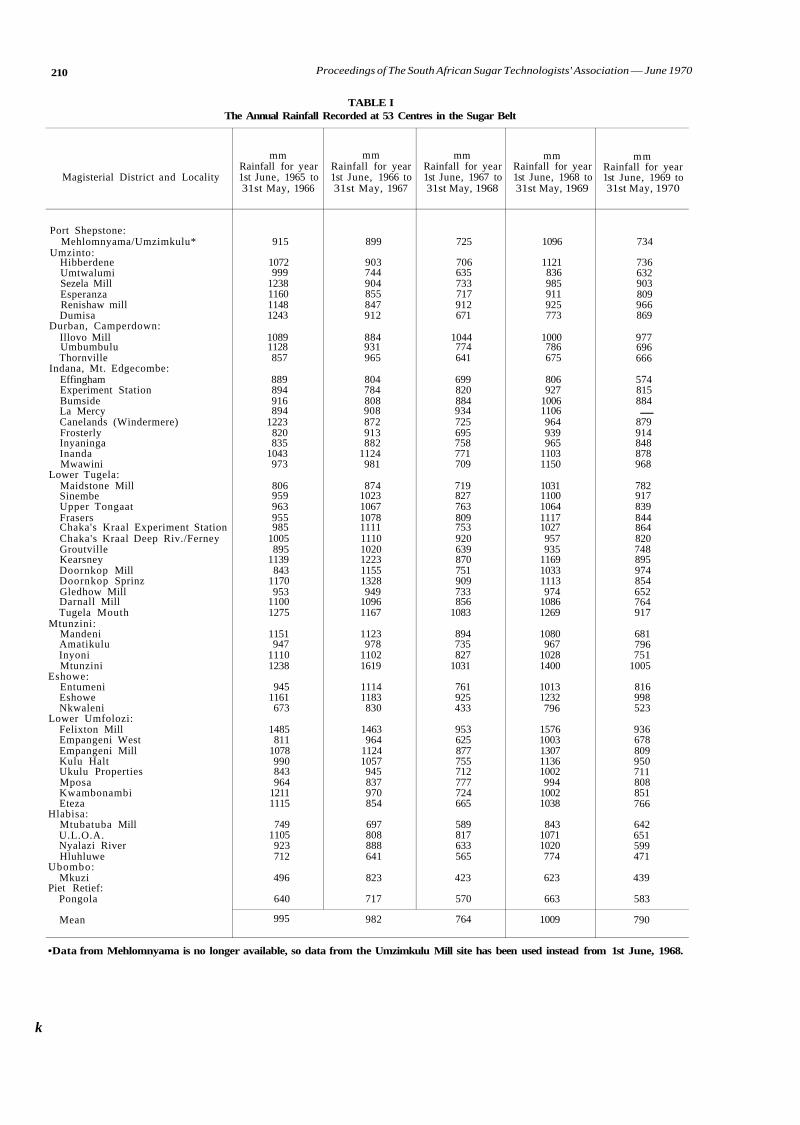
210 Proceedings of The South African Sugar Technologists' Association — June 1970
TABLE I The Annual Rainfall Recorded at 53 Centres in the Sugar Belt
Magisterial District and Locality
Port Shepstone: Mehlomnyama/Umzimkulu*
Umzinto: Hibberdene Umtwalumi Sezela Mill Esperanza Renishaw mill Dumisa
Durban, Camperdown: Illovo Mill Umbumbulu Thornville
Indana, Mt. Edgecombe: Effingham Experiment Station Bumside La Mercy Canelands (Windermere) Frosterly Inyaninga Inanda Mwawini
Lower Tugela: Maidstone Mill Sinembe Upper Tongaat Frasers Chaka's Kraal Experiment Station Chaka's Kraal Deep Riv./Ferney Groutville Kearsney Doornkop Mill Doornkop Sprinz Gledhow Mill Darnall Mill Tugela Mouth
Mtunzini: Mandeni Amatikulu Inyoni Mtunzini
Eshowe: Entumeni Eshowe Nkwaleni
Lower Umfolozi: Felixton Mill Empangeni West Empangeni Mill Kulu Halt Ukulu Properties Mposa Kwambonambi Eteza
Hlabisa: Mtubatuba Mill U.L.O.A. Nyalazi River Hluhluwe
Ubombo: Mkuzi
Piet Retief: Pongola
Mean
mm Rainfall for year 1st June, 1965 to 31st May, 1966
915
1072 999
1238 1160 1148 1243
1089 1128 857
889 894 916 894
1223 820 835
1043 973
806 959 963 955 985
1005 895
1139 843
1170 953
1100 1275
1151 947
1110 1238
945 1161 673
1485 811
1078 990 843 964
1211 1115
749 1105 923 712
496
640
995
mm Rainfall for year 1st June, 1966 to 31st May, 1967
899
903 744 904 855 847 912
884 931 965
804 784 808 908 872 913 882
1124 981
874 1023 1067 1078 1111 1110 1020 1223 1155 1328 949
1096 1167
1123 978
1102 1619
1114 1183 830
1463 964
1124 1057 945 837 970 854
697 808 888 641
823
717
982
mm Rainfall for year 1st June, 1967 to 31st May, 1968
725
706 635 733 717 912 671
1044 774 641
699 820 884 934 725 695 758 771 709
719 827 763 809 753 920 639 870 751 909 733 856
1083
894 735 827
1031
761 925 433
953 625 877 755 712 777 724 665
589 817 633 565
423
570
764
mm Rainfall for year 1st June, 1968 to 31st May, 1969
1096
1121 836 985 911 925 773
1000 786 675
806 927
1006 1106 964 939 965
1103 1150
1031 1100 1064 1117 1027 957 935
1169 1033 1113 974
1086 1269
1080 967
1028 1400
1013 1232 796
1576 1003 1307 1136 1002 994
1002 1038
843 1071 1020 774
623
663
1009
mm Rainfall for year 1st June, 1969 to 31st May, 1970
734
736 632 903 809 966 869
977 696 666
574 815 884 —
879 914 848 878 968
782 917 839 844 864 820 748 895 974 854 652 764 917
681 796 751
1005
816 998 523
936 678 809 950 711 808 851 766
642 651 599 471
439
583
790
•Data from Mehlomnyama is no longer available, so data from the Umzimkulu Mill site has been used instead from 1st June, 1968.
k
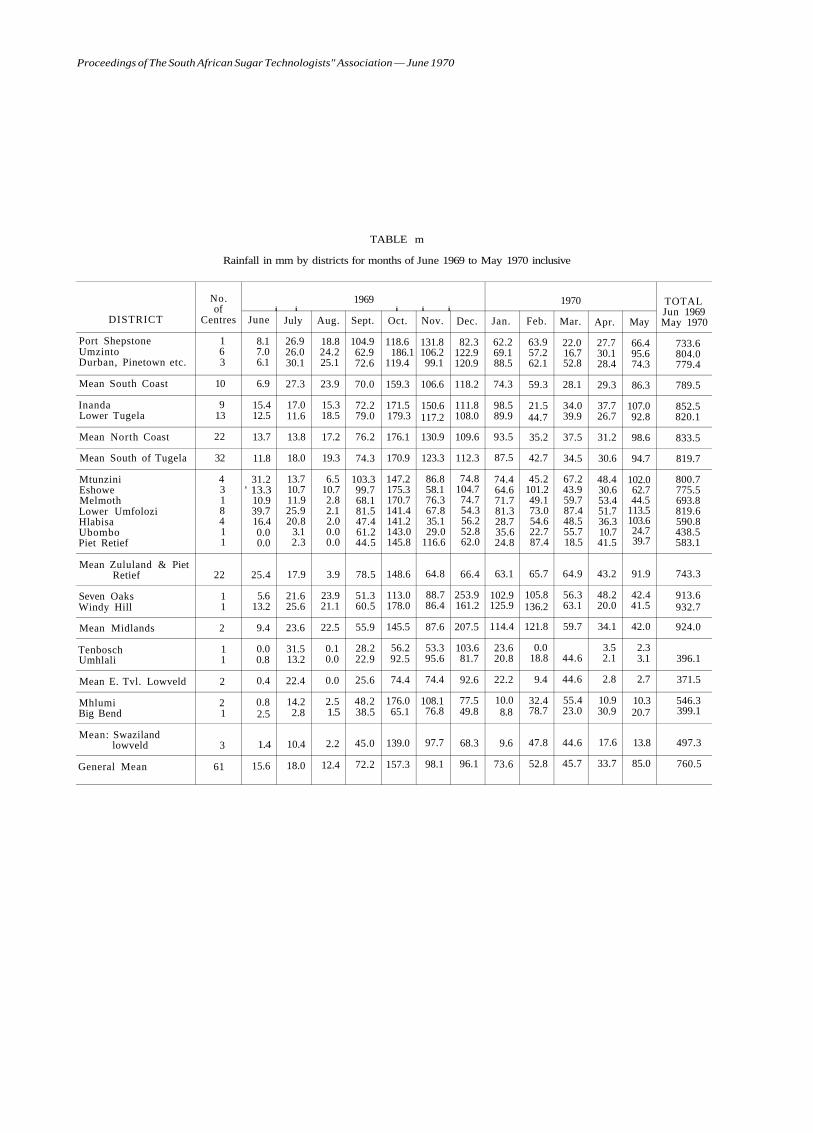
Proceedings of The South African Sugar Technologists" Association — June 1970
TABLE m
Rainfall in mm by districts for months of June 1969 to May 1970 inclusive
DISTRICT
Port Shepstone Umzinto Durban, Pinetown etc.
Mean South Coast
Inanda Lower Tugela
Mean North Coast
Mean South of Tugela
Mtunzini Eshowe Melmoth Lower Umfolozi Hlabisa Ubombo Piet Retief
Mean Zululand & Piet Retief
Seven Oaks Windy Hill
Mean Midlands
Tenbosch Umhlali
Mean E. Tvl. Lowveld
Mhlumi Big Bend
Mean: Swaziland lowveld
General Mean
No. of
Centres
1 6 3
10
9 13
22
32
4 3 1 8 4 1 1
22
1 1
2
1 1
2
2 1
3
61
1969 i i i i i
June
8.1 7.0 6.1
6.9
15.4 12.5
13.7
11.8
31.2 ' 13.3
10.9 39.7 16.4 0.0 0.0
25.4
5.6 13.2
9.4
0.0 0.8
0.4
0.8 2.5
1.4
15.6
July
26.9 26.0 30.1
27.3
17.0 11.6
13.8
18.0
13.7 10.7 11.9 25.9 20.8
3.1 2.3
17.9
21.6 25.6
23.6
31.5 13.2
22.4
14.2 2.8
10.4
18.0
Aug.
18.8 24.2 25.1
23.9
15.3 18.5
17.2
19.3
6.5 10.7 2.8 2.1 2.0 0.0 0.0
3.9
23.9 21.1
22.5
0.1 0.0
0.0
2.5 1.5
2.2
12.4
Sept.
104.9 62.9 72.6
70.0
72.2 79.0
76.2
74.3
103.3 99.7 68.1 81.5 47.4 61.2 44.5
78.5
51.3 60.5
55.9
28.2 22.9
25.6
48.2 38.5
45.0
72.2
Oct.
118.6 186.1
119.4
159.3
171.5 179.3
176.1
170.9
147.2 175.3 170.7 141.4 141.2 143.0 145.8
148.6
113.0 178.0
145.5
56.2 92.5
74.4
176.0 65.1
139.0
157.3
Nov.
131.8 106.2 99.1
106.6
150.6 117.2
130.9
123.3
86.8 58.1 76.3 67.8 35.1 29.0
116.6
64.8
88.7 86.4
87.6
53.3 95.6
74.4
108.1 76.8
97.7
98.1
Dec.
82.3 122.9 120.9
118.2
111.8 108.0
109.6
112.3
74.8 104.7 74.7 54.3 56.2 52.8 62.0
66.4
253.9 161.2
207.5
103.6 81.7
92.6
77.5 49.8
68.3
96.1
Jan.
62.2 69.1 88.5
74.3
98.5 89.9
93.5
87.5
74.4 64.6 71.7 81.3 28.7 35.6 24.8
63.1
102.9 125.9
114.4
23.6 20.8
22.2
10.0 8.8
9.6
73.6
1970
Feb.
63.9 57.2 62.1
59.3
21.5 44.7
35.2
42.7
45.2 101.2 49.1 73.0 54.6 22.7 87.4
65.7
105.8 136.2
121.8
0.0 18.8
9.4
32.4 78.7
47.8
52.8
Mar.
22.0 16.7 52.8
28.1
34.0 39.9
37.5
34.5
67.2 43.9 59.7 87.4 48.5 55.7 18.5
64.9
56.3 63.1
59.7
44.6
44.6
55.4 23.0
44.6
45.7
Apr.
27.7 30.1 28.4
29.3
37.7 26.7
31.2
30.6
48.4 30.6 53.4 51.7 36.3 10.7 41.5
43.2
48.2 20.0
34.1
3.5 2.1
2.8
10.9 30.9
17.6
33.7
May
66.4 95.6 74.3
86.3
107.0 92.8
98.6
94.7
102.0 62.7 44.5
113.5 103.6 24.7 39.7
91.9
42.4 41.5
42.0
2.3 3.1
2.7
10.3 20.7
13.8
85.0
TOTAL Jun 1969 May 1970
733.6 804.0 779.4
789.5
852.5 820.1
833.5
819.7
800.7 775.5 693.8 819.6 590.8 438.5 583.1
743.3
913.6 932.7
924.0
396.1
371.5
546.3 399.1
497.3
760.5
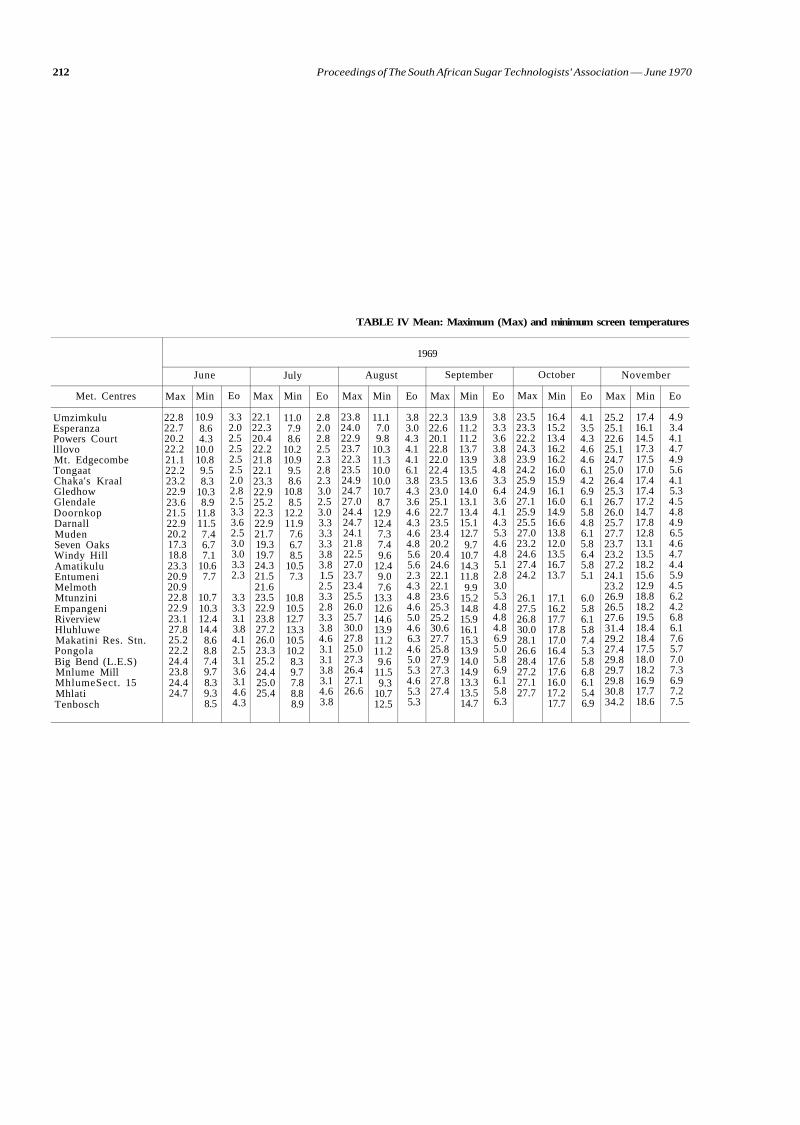
212 Proceedings of The South African Sugar Technologists' Association — June 1970
TABLE IV Mean: Maximum (Max) and minimum screen temperatures
Met. Centres
Umzimkulu Esperanza Powers Court lllovo Mt. Edgecombe Tongaat Chaka's Kraal Gledhow Glendale Doornkop Darnall Muden Seven Oaks Windy Hill Amatikulu Entumeni Melmoth Mtunzini Empangeni Riverview Hluhluwe Makatini Res. Stn. Pongola Big Bend (L.E.S) Mnlume Mill MhlumeSect. 15 Mhlati Tenbosch
1969
June
Max
22.8 22.7 20.2 22.2 21.1 22.2 23.2 22.9 23.6 21.5 22.9 20.2 17.3 18.8 23.3 20.9 20.9 22.8 22.9 23.1 27.8 25.2 22.2 24.4 23.8 24.4 24.7
Min
10.9 8.6 4.3
10.0 10.8 9.5 8.3
10.3 8.9
11.8 11.5 7.4 6.7 7.1
10.6 7.7
10.7 10.3 12.4 14.4 8.6 8.8 7.4 9.7 8.3 9.3 8.5
Eo
3.3 2.0 2.5 2.5 2.5 2.5 2.0 2.8 2.5 3.3 3.6 2.5 3.0 3.0 3.3 2.3
3.3 3.3 3.1 3.8 4.1 2.5 3.1 3.6 3.1 4.6 4.3
July
Max
22.1 22.3 20.4 22.2 21.8 22.1 23.3 22.9 25.2 22.3 22.9 21.7 19.3 19.7 24.3 21.5 21.6 23.5 22.9 23.8 27.2 26.0 23.3 25.2 24.4 25.0 25.4
Min
11.0 7.9 8.6
10.2 10.9 9.5 8.6
10.8 8.5
12.2 11.9 7.6 6.7 8.5
10.5 7.3
10.8 10.5 12.7 13.3 10.5 10.2 8.3 9.7 7.8 8.8 8.9
Eo
2.8 2.0 2.8 2.5 2.3 2.8 2.3 3.0 2.5 3.0 3.3 3.3 3.3 3.8 3.8 1.5 2.5 3.3 2.8 3.3 3.8 4.6 3.1 3.1 3.8 3.1 4.6 3.8
August
Max
23.8 24.0 22.9 23.7 22.3 23.5 24.9 24.7 27.0 24.4 24.7 24.1 21.8 22.5 27.0 23.7 23.4 25.5 26.0 25.7 30.0 27.8 25.0 27.3 26.4 27.1 26.6
Min
11.1 7.0 9.8
10.3 11.3 10.0 10.0 10.7 8.7
12.9 12.4 7.3 7.4 9.6
12.4 9.0 7.6
13.3 12.6 14.6 13.9 11.2 11.2 9.6
11.5 9.3
10.7 12.5
Eo
3.8 3.0 4.3 4.1 4.1 6.1 3.8 4.3 3.6 4.6 4.3 4.6 4.8 5.6 5.6 2.3 4.3 4.8 4.6 5.0 4.6 6.3 4.6 5.0 5.3 4.6 5.3 5.3
September
Max
22.3 22.6 20.1 22.8 22.0 22.4 23.5 23.0 25.1 22.7 23.5 23.4 20.2 20.4 24.6 22.1 22.1 23.6 25.3 25.2 30.6 27.7 25.8 27.9 27.3 27.8 27.4
Min
13.9 11.2 11.2 13.7 13.9 13.5 13.6 14.0 13.1 13.4 15.1 12.7 9.7
10.7 14.3 11.8 9.9
15.2 14.8 15.9 16.1 15.3 13.9 14.0 14.9 13.3 13.5 14.7
Eo
3.8 3.3 3.6 3.8 3.8 4.8 3.3 6.4 3.6 4.1 4.3 5.3 4.6 4.8 5.1 2.8 3.0 5.3 4.8 4.8 4.8 6.9 5.0 5.8 6.9 6.1 5.8 6.3
October
Max
23.5 23.3 22.2 24.3 23.9 24.2 25.9 24.9 27.1 25.9 25.5 27.0 23.2 24.6 27.4 24.2
26.1 27.5 26.8 30.0 28.1 26.6 28.4 27.2 27.1 27.7
Min
16.4 15.2 13.4 16.2 16.2 16.0 15.9 16.1 16.0 14.9 16.6 13.8 12.0 13.5 16.7 13.7
17.1 16.2 17.7 17.8 17.0 16.4 17.6 17.6 16.0 17.2 17.7
Eo
4.1 3.5 4.3 4.6 4.6 6.1 4.2 6.9 6.1 5.8 4.8 6.1 5.8 6.4 5.8 5.1
6.0 5.8 6.1 5.8 7.4 5.3 5.8 6.8 6.1 5.4 6.9
November
Max
25.2 25.1 22.6 25.1 24.7 25.0 26.4 25.3 26.7 26.0 25.7 27.7 23.7 23.2 27.2 24.1 23.2 26.9 26.5 27.6 31.4 29.2 27.4 29.8 29.7 29.8 30.8 34.2
Min
17.4 16.1 14.5 17.3 17.5 17.0 17.4 17.4 17.2 14.7 17.8 12.8 13.1 13.5 18.2 15.6 12.9 18.8 18.2 19.5 18.4 18.4 17.5 18.0 18.2 16.9 17.7 18.6
Eo
4.9 3.4 4.1 4.7 4.9 5.6 4.1 5.3 4.5 4.8 4.9 6.5 4.6 4.7 4.4 5.9 4.5 6.2 4.2 6.8 6.1 7.6 5.7 7.0 7.3 6.9 7.2 7.5
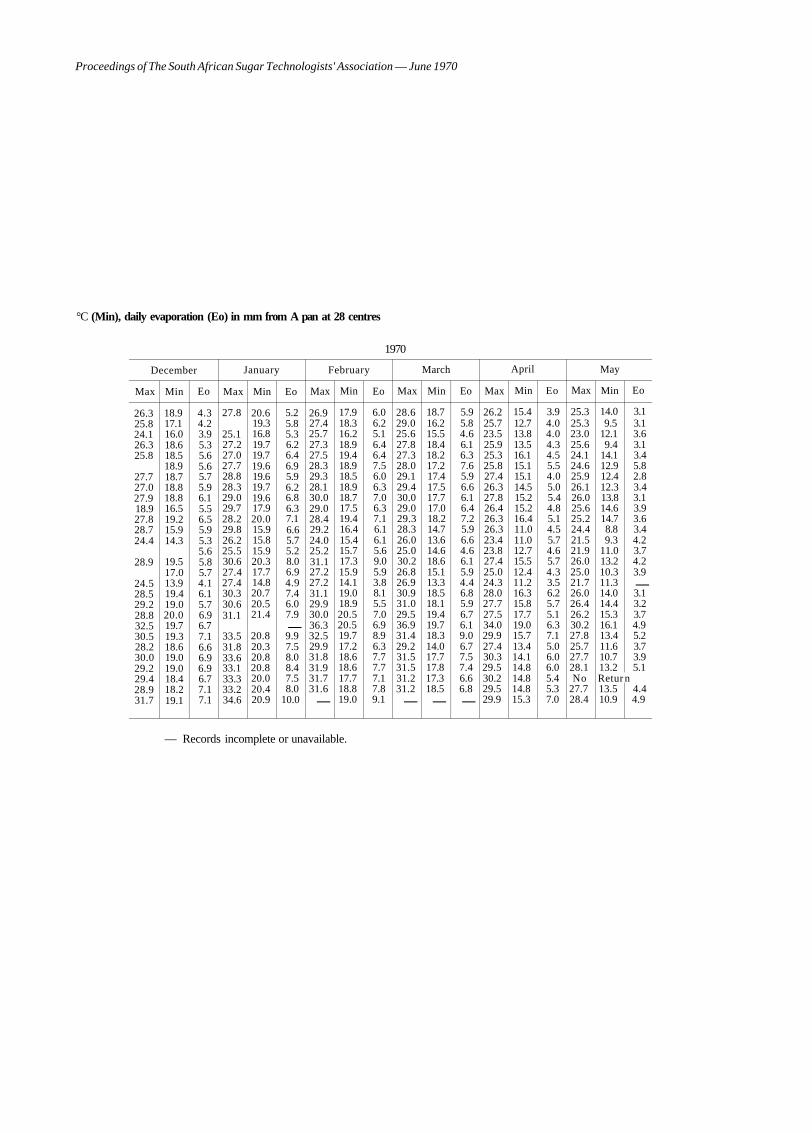
Proceedings of The South African Sugar Technologists' Association — June 1970
°C (Min), daily evaporation (Eo) in mm from A pan at 28 centres
1970
December
Max
26.3 25.8 24.1 26.3 25.8
27.7 27.0 27.9 18.9 27.8 28.7 24.4
28.9
24.5 28.5 29.2 28.8 32.5 30.5 28.2 30.0 29.2 29.4 28.9 31.7
Min
18.9 17.1 16.0 18.6 18.5 18.9 18.7 18.8 18.8 16.5 19.2 15.9 14.3
19.5 17.0 13.9 19.4 19.0 20.0 19.7 19.3 18.6 19.0 19.0 18.4 18.2 19.1
Eo
4.3 4.2 3.9 5.3 5.6 5.6 5.7 5.9 6.1 5.5 6.5 5.9 5.3 5.6 5.8 5.7 4.1 6.1 5.7 6.9 6.7 7.1 6.6 6.9 6.9 6.7 7.1 7.1
January
Max
27.8
25.1 27.2 27.0 27.7 28.8 28.3 29.0 29.7 28.2 29.8 26.2 25.5 30.6 27.4 27.4 30.3 30.6 31.1
33.5 31.8 33.6 33.1 33.3 33.2 34.6
Min
20.6 19.3 16.8 19.7 19.7 19.6 19.6 19.7 19.6 17.9 20.0 15.9 15.8 15.9 20.3 17.7 14.8 20.7 20.5 21.4
20.8 20.3 20.8 20.8 20.0 20.4 20.9
Eo
5.2 5.8 5.3 6.2 6.4 6.9 5.9 6.2 6.8 6.3 7.1 6.6 5.7 5.2 8.0 6.9 4.9 7.4 6.0 7.9 —
9.9 7.5 8.0 8.4 7.5 8.0
10.0
February
Max
26.9 27.4 25.7 27.3 27.5 28.3 29.3 28.1 30.0 29.0 28.4 29.2 24.0 25.2 31.1 27.2 27.2 31.1 29.9 30.0 36.3 32.5 29.9 31.8 31.9 31.7 31.6
—
Min
17.9 18.3 16.2 18.9 19.4 18.9 18.5 18.9 18.7 17.5 19.4 16.4 15.4 15.7 17.3 15.9 14.1 19.0 18.9 20.5 20.5 19.7 17.2 18.6 18.6 17.7 18.8 19.0
Eo
6.0 6.2 5.1 6.4 6.4 7.5 6.0 6.3 7.0 6.3 7.1 6.1 6.1 5.6 9.0 5.9 3.8 8.1 5.5 7.0 6.9 8.9 6.3 7.7 7.7 7.1 7.8 9.1
March
Max
28.6 29.0 25.6 27.8 27.3 28.0 29.1 29.4 30.0 29.0 29.3 28.3 26.0 25.0 30.2 26.8 26.9 30.9 31.0 29.5 36.9 31.4 29.2 31.5 31.5 31.2 31.2
—
Min
18.7 16.2 15.5 18.4 18.2 17.2 17.4 17.5 17.7 17.0 18.2 14.7 13.6 14.6 18.6 15.1 13.3 18.5 18.1 19.4 19.7 18.3 14.0 17.7 17.8 17.3 18.5
—
Eo
5.9 5.8 4.6 6.1 6.3 7.6 5.9 6.6 6.1 6.4 7.2 5.9 6.6 4.6 6.1 5.9 4.4 6.8 5.9 6.7 6.1 9.0 6.7 7.5 7.4 6.6 6.8 —
April
Max
26.2 25.7 23.5 25.9 25.3 25.8 27.4 26.3 27.8 26.4 26.3 26.3 23.4 23.8 27.4 25.0 24.3 28.0 27.7 27.5 34.0 29.9 27.4 30.3 29.5 30.2 29.5 29.9
Min
15.4 12.7 13.8 13.5 16.1 15.1 15.1 14.5 15.2 15.2 16.4 11.0 11.0 12.7 15.5 12.4 11.2 16.3 15.8 17.7 19.0 15.7 13.4 14.1 14.8 14.8 14.8 15.3
Eo
3.9 4.0 4.0 4.3 4.5 5.5 4.0 5.0 5.4 4.8 5.1 4.5 5.7 4.6 5.7 4.3 3.5 6.2 5.7 5.1 6.3 7.1 5.0 6.0 6.0 5.4 5.3 7.0
May
Max
25.3 25.3 23.0 25.6 24.1 24.6 25.9 26.1 26.0 25.6 25.2 24.4 21.5 21.9 26.0 25.0 21.7 26.0 26.4 26.2 30.2 27.8 25.7 27.7 28.1 No
27.7 28.4
Min
14.0 9.5
12.1 9.4
14.1 12.9 12.4 12.3 13.8 14.6 14.7 8.8 9.3
11.0 13.2 10.3 11.3 14.0 14.4 15.3 16.1 13.4 11.6 10.7 13.2 Retur 13.5 10.9
Eo
3.1 3.1 3.6 3.1 3.4 5.8 2.8 3.4 3.1 3.9 3.6 3.4 4.2 3.7 4.2 3.9 — 3.1 3.2 3.7 4.9 5.2 3.7 3.9 5.1
n 4.4 4.9
— Records incomplete or unavailable.
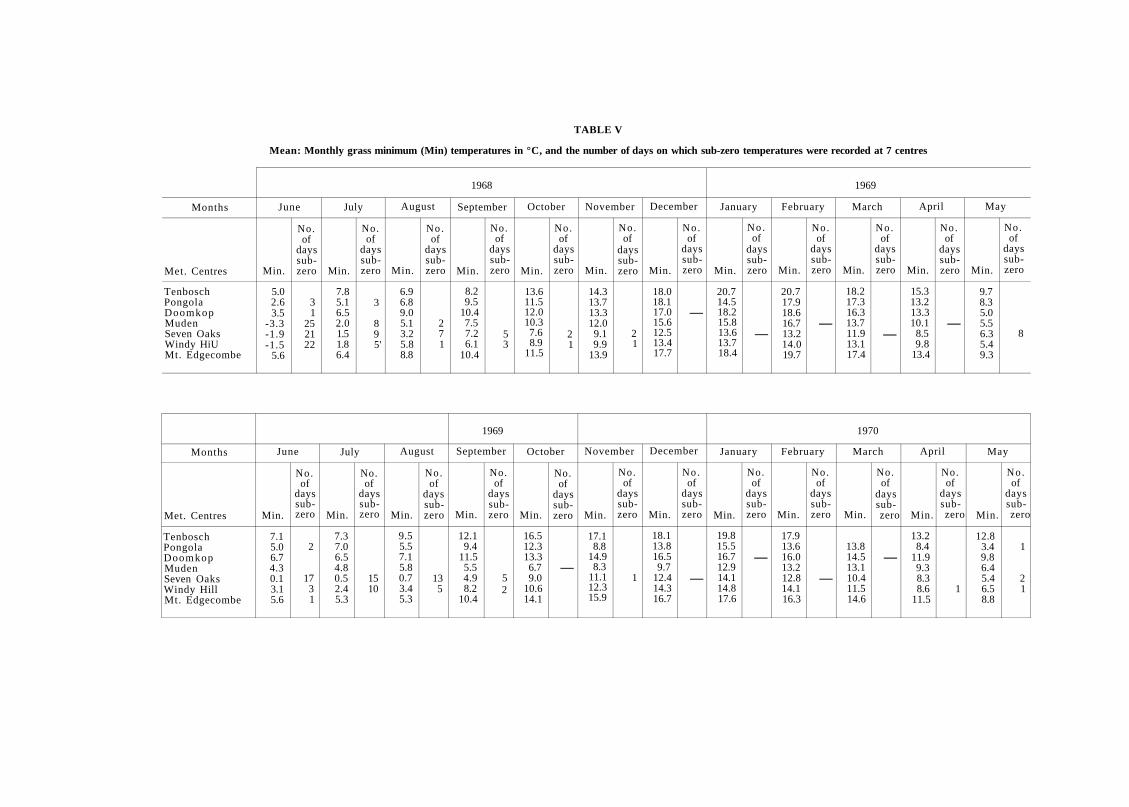
TABLE V
Mean: Monthly grass minimum (Min) temperatures in °C, and the number of days on which sub-zero temperatures were recorded at 7 centres
Months
Met. Centres
Tenbosch Pongola Doomkop Muden Seven Oaks Windy HiU Mt. Edgecombe
1968
June
Min.
5.0 2.6 3.5
-3.3 -1.9 -1.5
5.6
No. of
days subzero
3 1
25 21 22
July
Min.
7.8 5.1 6.5 2.0 1.5 1.8 6.4
No. of
days subzero
3
8 9 5'
August
Min.
6.9 6.8 9.0 5.1 3.2 5.8 8.8
No . of
days subzero
2 7 1
September
Min.
8.2 9.5
10.4 7.5 7.2 6.1
10.4
No. of
days subzero
5 3
October
Min.
13.6 11.5 12.0 10.3 7.6 8.9
11.5
No. of
days subzero
2 1
November
Min.
14.3 13.7 13.3 12.0 9.1 9.9
13.9
No. of
days subzero
2 1
December
Min.
18.0 18.1 17.0 15.6 12.5 13.4 17.7
No . of
days subzero
—
1969
January
Min.
20.7 14.5 18.2 15.8 13.6 13.7 18.4
No . of
days subzero
—
February
Min.
20.7 17.9 18.6 16.7 13.2 14.0 19.7
No. of
days subzero
—
March
Min.
18.2 17.3 16.3 13.7 11.9 13.1 17.4
No . of
days subzero
—
April
Min.
15.3 13.2 13.3 10.1
8.5 9.8
13.4
No. of
days subzero
—
May
Min.
9.7 8.3 5.0 5.5 6.3 5.4 9.3
No. of
days subzero
8
Months
Met. Centres
Tenbosch Pongola Doomkop Muden Seven Oaks Windy Hill Mt. Edgecombe
June
Min.
7.1 5.0 6.7 4.3 0.1 3.1 5.6
No. of
days subzero
2
17 3 1
July
Min.
7.3 7.0 6.5 4.8 0.5 2.4 5.3
No. of
days subzero
15 10
August
Min.
9.5 5.5 7.1 5.8 0.7 3.4 5.3
No. of
days subzero
13 5
1969
September
Min.
12.1 9.4
11.5 5.5 4.9 8.2
10.4
No. of
days subzero
5 2
October
Min.
16.5 12.3 13.3 6.7 9.0
10.6 14.1
No. of
days subzero
—
November
Min.
17.1 8.8
14.9 8.3
11.1 12.3 15.9
No. of
days subzero
1
December
Min.
18.1 13.8 16.5 9.7
12.4 14.3 16.7
No . of
days subzero
—
1970
January
Min.
19.8 15.5 16.7 12.9 14.1 14.8 17.6
No. of
days subzero
—
February
Min.
17.9 13.6 16.0 13.2 12.8 14.1 16.3
No. of
days subzero
—
March
Min.
13.8 14.5 13.1 10.4 11.5 14.6
No. of
days subzero
—
April
Min.
13.2 8.4
11.9 9.3 8.3 8.6
11.5
No. of
days subzero
1
May
Min.
12.8 3.4 9.8 6.4 5.4 6.5 8.8
No . of
days subzero
1
2 1
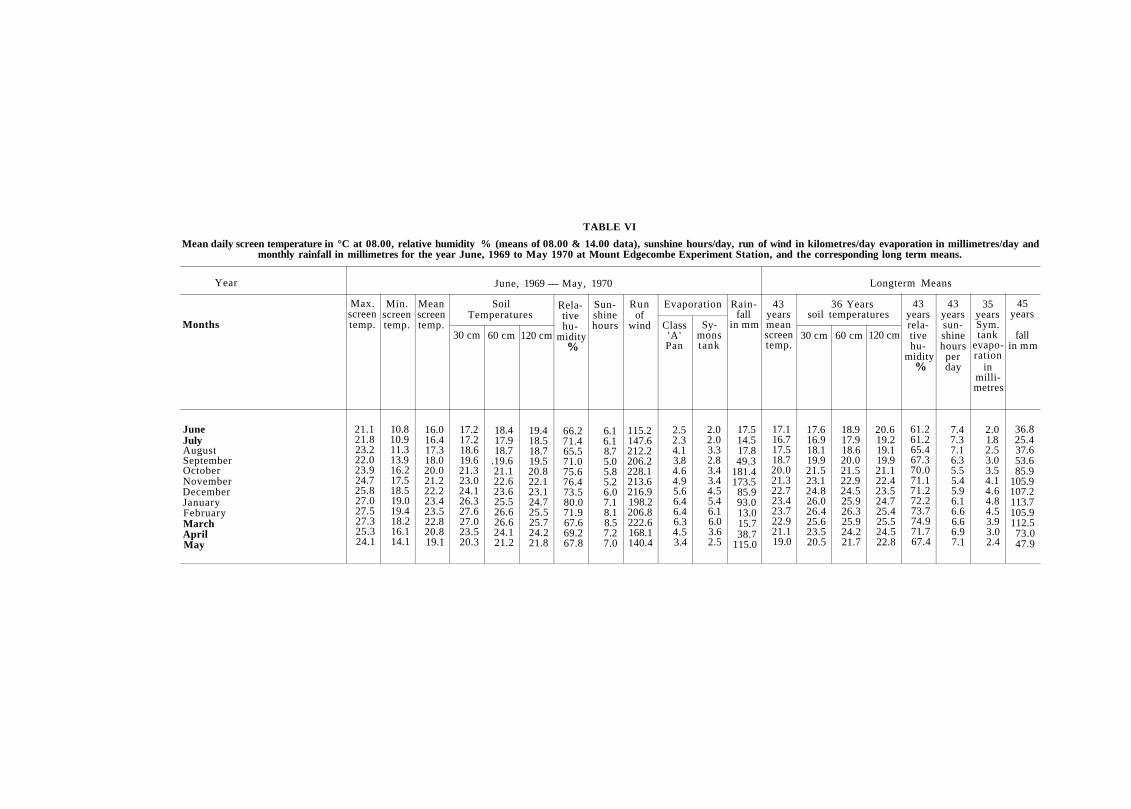
TABLE VI
Mean daily screen temperature in °C at 08.00, relative humidity % (means of 08.00 & 14.00 data), sunshine hours/day, run of wind in kilometres/day evaporation in millimetres/day and monthly rainfall in millimetres for the year June, 1969 to May 1970 at Mount Edgecombe Experiment Station, and the corresponding long term means.
Year
Months
June July August September October November December January February March April May
June, 1969 — May, 1970
Max. screen temp.
21.1 21.8 23.2 22.0 23.9 24.7 25.8 27.0 27.5 27.3 25.3 24.1
Min. screen temp.
10.8 10.9 11.3 13.9 16.2 17.5 18.5 19.0 19.4 18.2 16.1 14.1
Mean screen temp.
16.0 16.4 17.3 18.0 20.0 21.2 22.2 23.4 23.5 22.8 20.8 19.1
Soil Temperatures
30 cm
17.2 17.2 18.6 19.6 21.3 23.0 24.1 26.3 27.6 27.0 23.5 20.3
60 cm
18.4 17.9 18.7
.19.6 21.1 22.6 23.6 25.5 26.6 26.6 24.1 21.2
120 cm
19.4 18.5 18.7 19.5 20.8 22.1 23.1 24.7 25.5 25.7 24.2 21.8
Relative hu
midity %
66.2 71.4 65.5 71.0 75.6 76.4 73.5 80.0 71.9 67.6 69.2 67.8
Sunshine hours
6.1 6.1 8.7 5.0 5.8 5.2 6.0 7.1 8.1 8.5 7.2 7.0
Run of
wind
115.2 147.6 212.2 206.2 228.1 213.6 216.9 198.2 206.8 222.6 168.1 140.4
Evaporation
Class 'A' Pan
2.5 2.3 4.1 3.8 4.6 4.9 5.6 6.4 6.4 6.3 4.5 3.4
Sy-mons tank
2.0 2.0 3.3 2.8 3.4 3.4 4.5 5.4 6.1 6.0 3.6 2.5
Rainfall
in mm
17.5 14.5 17.8 49.3
181.4 173.5 85.9 93.0 13.0 15.7 38.7
115.0
Longterm Means
43 years mean screen temp.
17.1 16.7 17.5 18.7 20.0 21.3 22.7 23.4 23.7 22.9 21.1 19.0
36 Years soil temperatures
30 cm
17.6 16.9 18.1 19.9 21.5 23.1 24.8 26.0 26.4 25.6 23.5 20.5
60 cm
18.9 17.9 18.6 20.0 21.5 22.9 24.5 25.9 26.3 25.9 24.2 21.7
120 cm
20.6 19.2 19.1 19.9 21.1 22.4 23.5 24.7 25.4 25.5 24.5 22.8
43 years relative hu
midity %
61.2 61.2 65.4 67.3 70.0 71.1 71.2 72.2 73.7 74.9 71.7 67.4
43 years sunshine hours
per day
7.4 7.3 7.1 6.3 5.5 5.4 5.9 6.1 6.6 6.6 6.9 7.1
35 years Sym. tank
evaporation
in millimetres
2.0 1.8 2.5 3.0 3.5 4.1 4.6 4.8 4.5 3.9 3.0 2.4
45 years
fall in mm
36.8 25.4 37.6 53.6 85.9
105.9 107.2 113.7 105.9 112.5 73.0 47.9

216 Proceedings of The South African Sugar Technologists' Association —June 1970
INSTRUCTIONS TO AUTHORS
1. All papers for Congress must be in the hands of the Technical Secretary not less than sixty days before the meeting.
2. Scripts should be typewritten in English, on one side of the paper only. Double spacing must be used, with a 1 inch margin all round. Pages are to be numbered in the top right-hand corner.
3. Layout. The sequence of items in the script should be (1) Title and authors' names; (2) Abstract; (3) Main text; (4) Acknowledgements (if any); (5) References (literature actually cited); (6) Tables; (7) Captions for figures; and (8) Figures.
4. Titles should be short and concise, and be followed by the authors' names and present addresses.
5. The text should be clearly divided into separate sections, bearing such sub titles as: Introduction, Method, Materials. Experimental results, Discussion, Acknowledgements, and References. Lower-case letters should always be used, except for the initial letters of first words and proper nouns. Headings, words or phrases should not be underscored unless they are to be placed in italics. Quotations from publications must invariably be placed within inverted commas; their source, and those of any diagrams copied, being suitably acknowledged.
6. The abstract should be a brief, non-critical, informative digest of the important features of the paper.
7. Tables must be submitted separately on individual sheets of paper, numbered consecutively in roman numerals. The position of each table must be indicated in the text. Title, column headings and side headings should be in lowercase letters, except for the initial letter of first words and proper nouns.
8. Figures in the form of graphs, diagrams and photographs must be numbered consecutively using arabic numerals, and initialled lightly in pencil on the back. The approximate location of each should be indicated in the text. Graphs and diagrams should be carefully prepared on smooth, white drawing paper, using indian ink.
They should be drawn proportionate to the 2.6 cm type area they are to replace. Each to be submitted on a separate sheet. Lettering, including that for the legend, should be written in pencil and located correctly, so permitting easy replacement with printers type. Legends, quoting the appropriate figure numbers, must be typed on a separate and suitably designated sheet.
9. References. Literature cited must be arranged alphabetically after the acknowledgements (if any). In the text, the surnames of the authors or a suitable collective title are followed by the number of the reference, placed in a superior position (e.g. Jones5). Each citation in the reference list should indicate the names of all authors, the year of publication, complete title, publication, volume number, and inclusive page numbers, e.g. (1) BARNES, A. C. 1964. The sugarcane.
Leonard Hill, London. 456 p. (2) KING, N. C. and DICK, J. 1957. A critical
comparison of methods of testing for resistance to mosaic. Proc. S. Afr. Sug. Technol. Ass. 31: (1957), 116-117.
Abbreviations for periodicals should be as quoted in The World List of Scientific Periodicals, 1965.
10. Units. The metric system of units must be used. 11. Style and abbreviations not specifically men
tioned here should be in accordance with the second edition of the Style manual for biological journals, 1964, published by the Conference of Biological Editors, Committee on Form and Style, American Institute of Biological Sciences, Washington, D.C. Spelling should be in accordance with the Oxford English Dictionary.
12. The editorial committee reserves the right to reject any paper. Papers read at Congress and discussions thereon will not necessarily be published in the Proceedings.
13. The complete script should be sent to: The Technical Secretary, Sugar Milling Research Institute, University Private Bag, King George V Avenue, DURBAN.