Embed Size (px)
Citation preview
British Society of Sugar Technologists 2014 ANNUAL GENERAL MEETING
April 3rd 2014 London, UK.
On-Line Sugar Colour Measurement
Needs and Benefits by
Amelia A. Ferraz and Bjarne C. Nielsen
Neltec Denmark
Key Words: Energy and water savings, on-line colour measurement, centrifugal optimization,
sugar colour, wash water control.
Introduction
Sugar colour is one of the important specifications for clients, and thus one of the most
important parameters to control in a sugar factory. However, it can only be checked close
to the end of the production line, after centrifugation, so sugar with higher than specified
colour needs to be mixed with lower colour sugar or even reprocessed. To avoid
producing sugar that does not meet specifications wide safety margins are usually
applied, resulting in the production of sugar with colour substantially below specifications,
higher than necessary water and steam consumption, and sub-optimal sugar production
per centrifugal cycle.
Nevertheless, in many factories the colour of sugar discharged by the centrifugals is still
checked by collecting periodic samples and analysing them in the laboratory. This is
clearly insufficient to ensure that the colour of all the sugar produced is close to optimal,
because a tiny percentage of all the sugar produced is checked and there is a
considerable delay in the colour determination, so the results are not known until the
sugar may already be in the silo or even dispatched to the client.
For effective control of the process a real-time system is required that provides reliable
information about the quality of all the sugar produced. The examples presented below
illustrate why collecting samples after discharge from centrifugals for lab analyses is
insufficient for efficient process control and cannot ensure that all the sugar sent to the
client meets colour specifications.
The data were all obtained by the Neltec ColourQ on-line colorimeter, which is being used in many sugar factories for numerous applications, including monitoring wet, dry white or raw sugar on belt, screw or grasshopper conveyors. The first colorimeter was installed in 1987 and since then the instrument has been continuously updated to improve its accuracy and provide more useful information for process control.
On-line and laboratory colour measurements of wet sugar: interpreting results
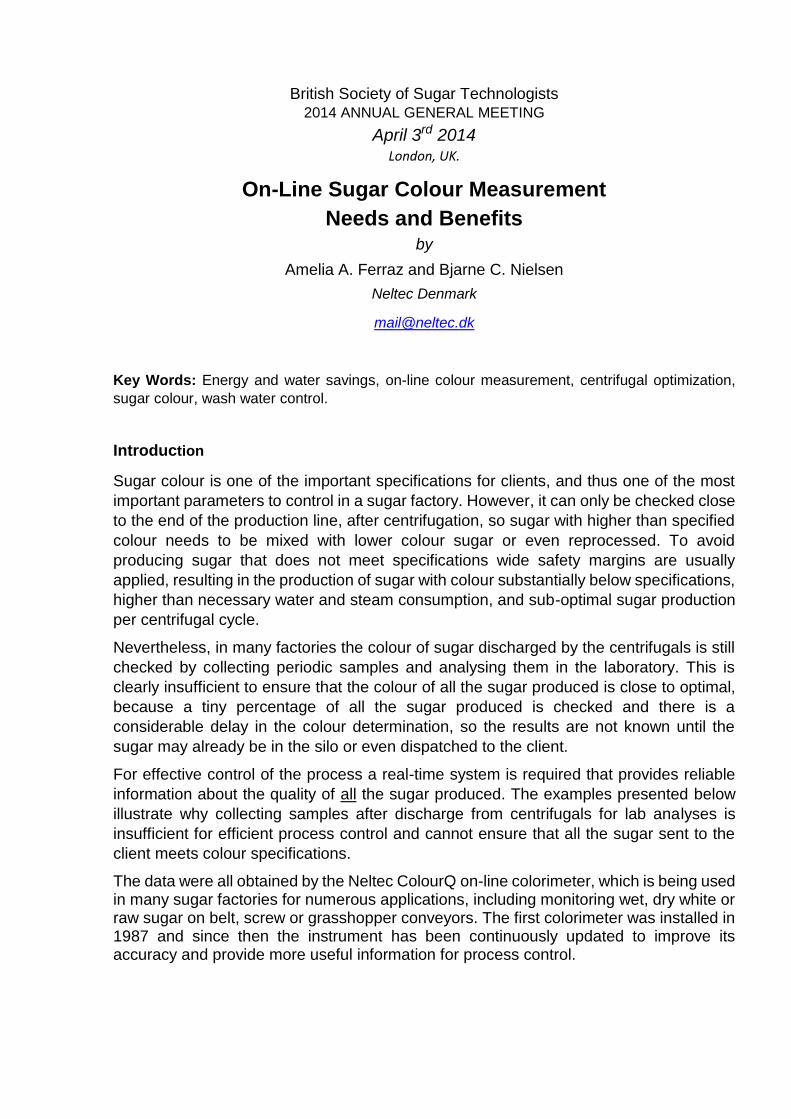
Figure 1. Neltec ColourQ measurements of wet sugar discharged from four centrifugals fed with the same massecuite
Figure 1 shows the information delivered by the Neltec ColourQ about sugar discharged by four centrifugals (C1-C4) fed with the same massecuite. C1 discharged sugar with colour above 28 IU (ICUMSA units), while C3 and C4 discharged some sugar with 17 IU. The average colour of the sugar discharged from C4 and C1 was 19.9 and 27.0 IU, respectively. Thus, spot samples collected after the centrifugals in this case may have given any colour between 17 and 28 IU.
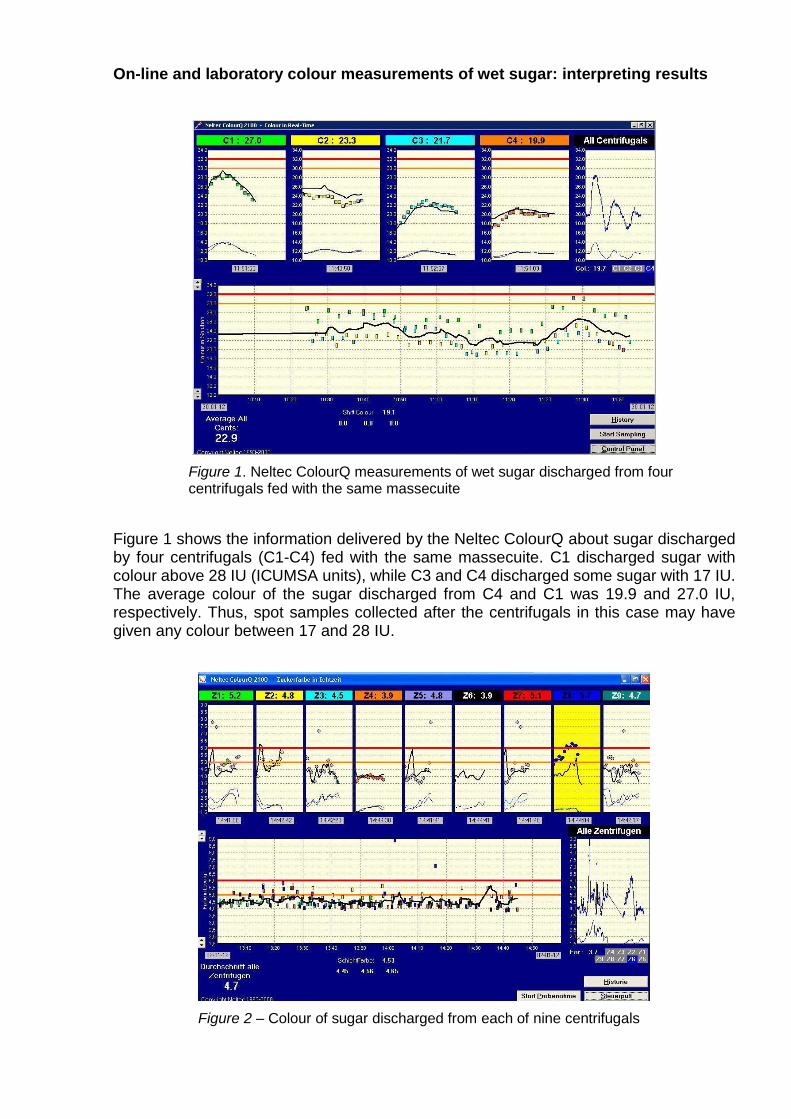
Figure 2 – Colour of sugar discharged from each of nine centrifugals
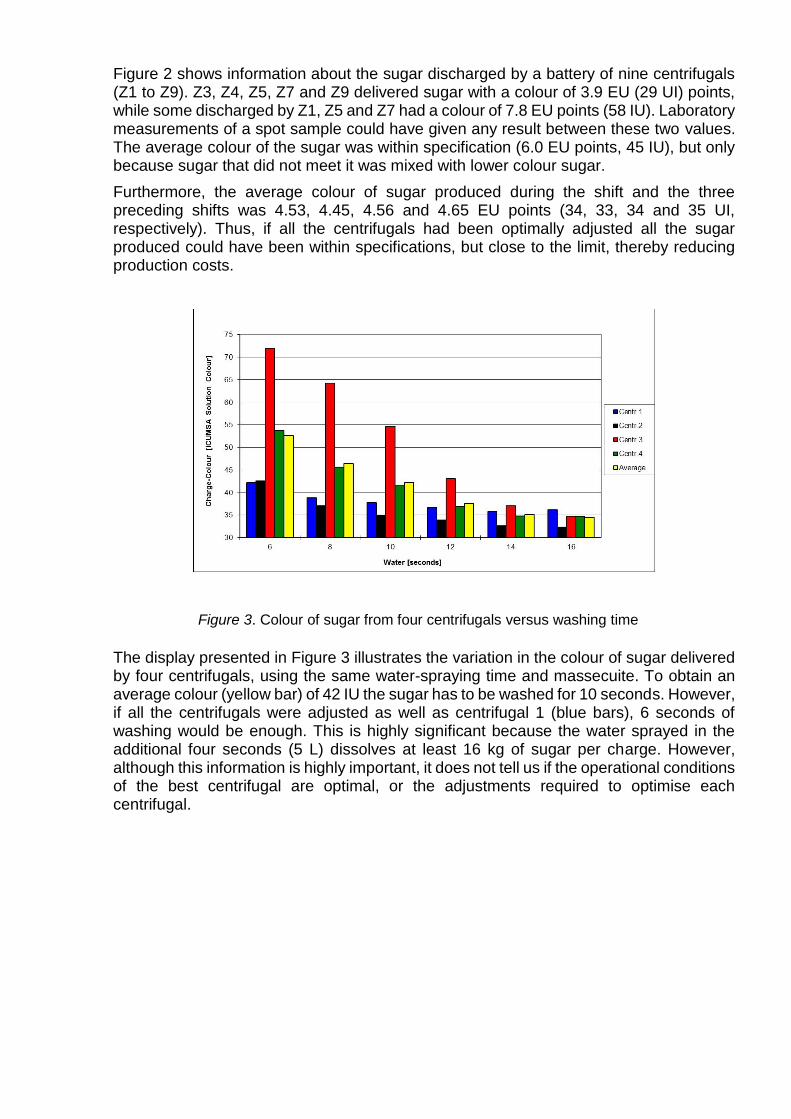
Figure 2 shows information about the sugar discharged by a battery of nine centrifugals (Z1 to Z9). Z3, Z4, Z5, Z7 and Z9 delivered sugar with a colour of 3.9 EU (29 UI) points, while some discharged by Z1, Z5 and Z7 had a colour of 7.8 EU points (58 IU). Laboratory measurements of a spot sample could have given any result between these two values. The average colour of the sugar was within specification (6.0 EU points, 45 IU), but only because sugar that did not meet it was mixed with lower colour sugar.
Furthermore, the average colour of sugar produced during the shift and the three preceding shifts was 4.53, 4.45, 4.56 and 4.65 EU points (34, 33, 34 and 35 UI, respectively). Thus, if all the centrifugals had been optimally adjusted all the sugar produced could have been within specifications, but close to the limit, thereby reducing production costs.
Figure 3. Colour of sugar from four centrifugals versus washing time
The display presented in Figure 3 illustrates the variation in the colour of sugar delivered by four centrifugals, using the same water-spraying time and massecuite. To obtain an average colour (yellow bar) of 42 IU the sugar has to be washed for 10 seconds. However, if all the centrifugals were adjusted as well as centrifugal 1 (blue bars), 6 seconds of washing would be enough. This is highly significant because the water sprayed in the additional four seconds (5 L) dissolves at least 16 kg of sugar per charge. However, although this information is highly important, it does not tell us if the operational conditions of the best centrifugal are optimal, or the adjustments required to optimise each centrifugal.
Applying accurate real-time information for troubleshooting
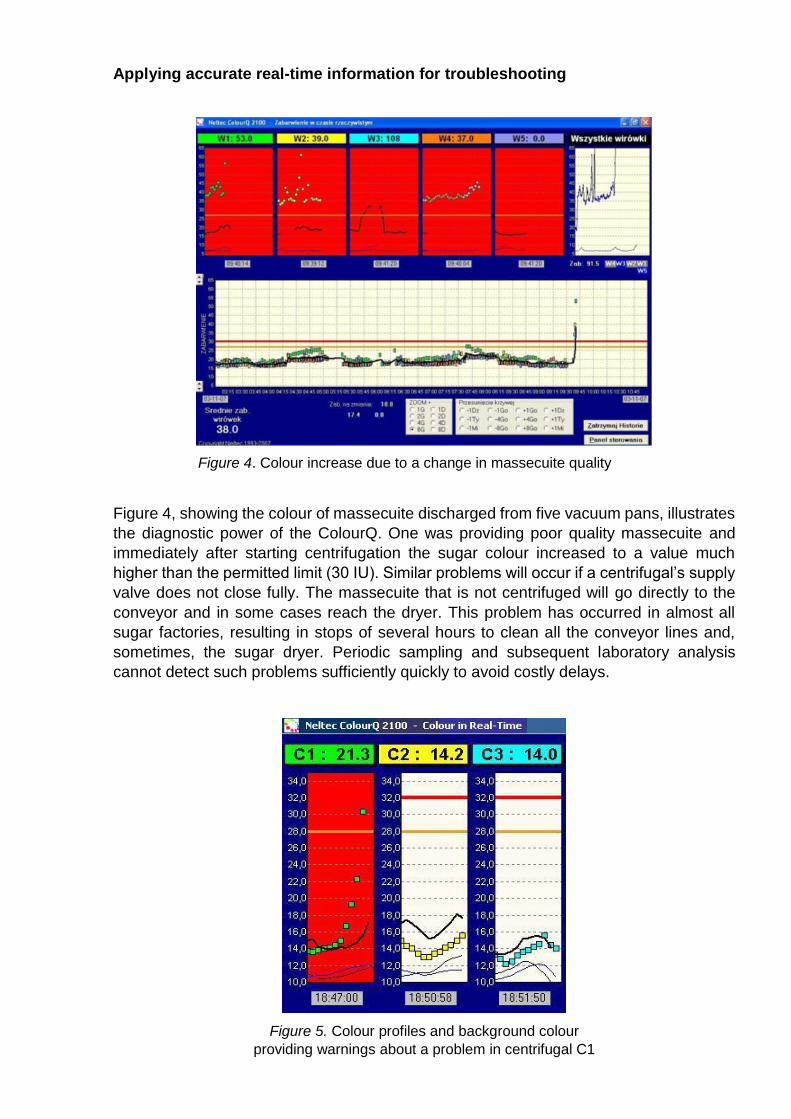
Figure 4. Colour increase due to a change in massecuite quality
Figure 4, showing the colour of massecuite discharged from five vacuum pans, illustrates
the diagnostic power of the ColourQ. One was providing poor quality massecuite and
immediately after starting centrifugation the sugar colour increased to a value much
higher than the permitted limit (30 IU). Similar problems will occur if a centrifugal’s supply
valve does not close fully. The massecuite that is not centrifuged will go directly to the
conveyor and in some cases reach the dryer. This problem has occurred in almost all
sugar factories, resulting in stops of several hours to clean all the conveyor lines and,
sometimes, the sugar dryer. Periodic sampling and subsequent laboratory analysis
cannot detect such problems sufficiently quickly to avoid costly delays.
Figure 5. Colour profiles and background colour
providing warnings about a problem in centrifugal C1
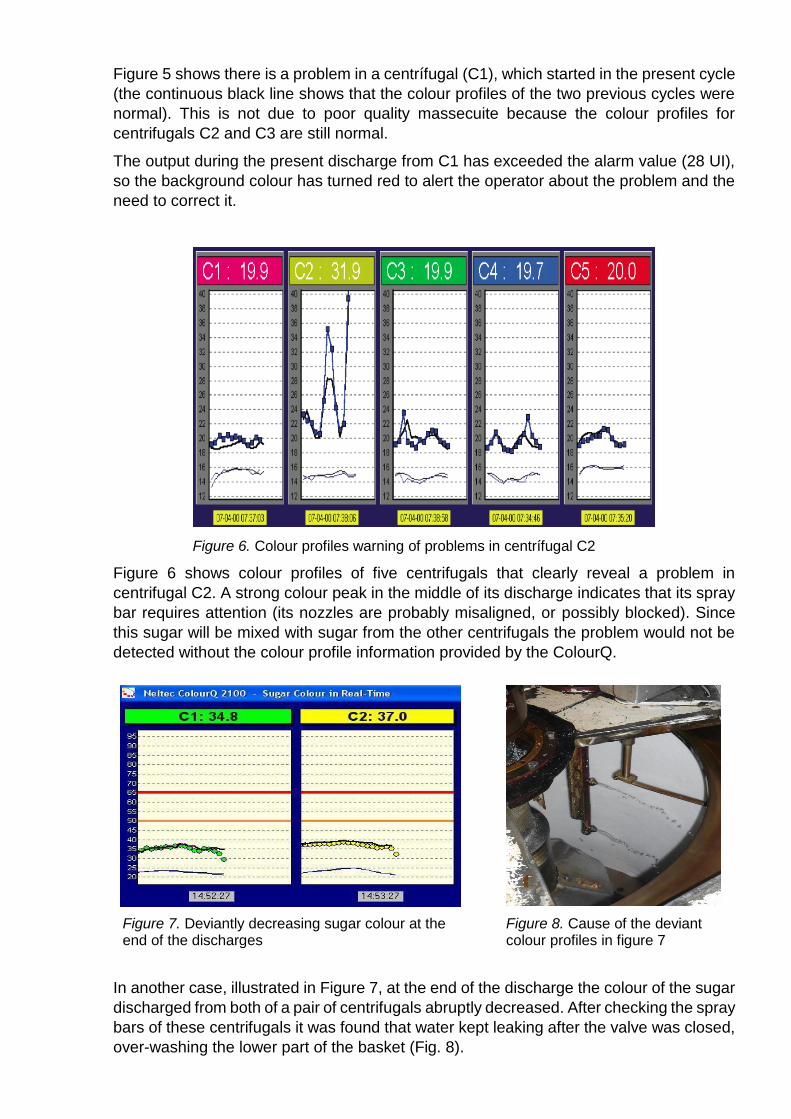
Figure 5 shows there is a problem in a centrífugal (C1), which started in the present cycle
(the continuous black line shows that the colour profiles of the two previous cycles were
normal). This is not due to poor quality massecuite because the colour profiles for
centrifugals C2 and C3 are still normal.
The output during the present discharge from C1 has exceeded the alarm value (28 UI),
so the background colour has turned red to alert the operator about the problem and the
need to correct it.
Figure 6. Colour profiles warning of problems in centrífugal C2
Figure 6 shows colour profiles of five centrifugals that clearly reveal a problem in
centrifugal C2. A strong colour peak in the middle of its discharge indicates that its spray
bar requires attention (its nozzles are probably misaligned, or possibly blocked). Since
this sugar will be mixed with sugar from the other centrifugals the problem would not be
detected without the colour profile information provided by the ColourQ.
Figure 7. Deviantly decreasing sugar colour at the end of the discharges
Figure 8. Cause of the deviant colour profiles in figure 7
In another case, illustrated in Figure 7, at the end of the discharge the colour of the sugar
discharged from both of a pair of centrifugals abruptly decreased. After checking the spray
bars of these centrifugals it was found that water kept leaking after the valve was closed,
over-washing the lower part of the basket (Fig. 8).
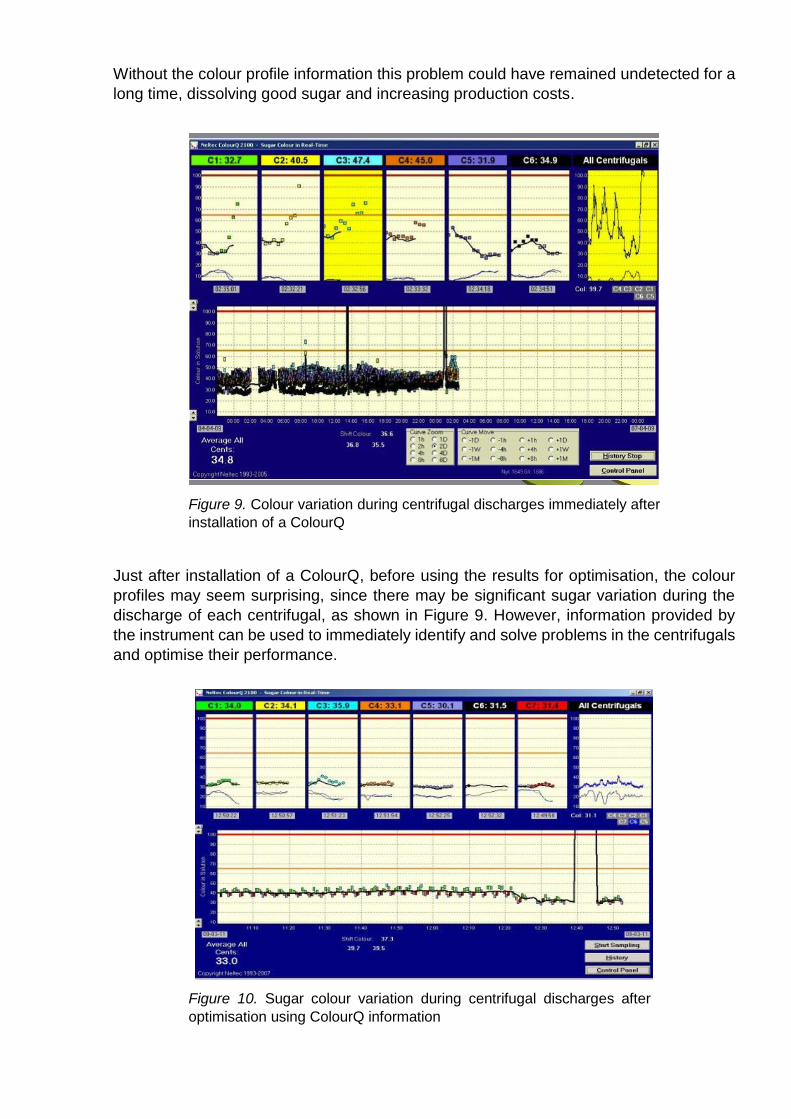
Without the colour profile information this problem could have remained undetected for a
long time, dissolving good sugar and increasing production costs.
Figure 9. Colour variation during centrifugal discharges immediately after
installation of a ColourQ
Just after installation of a ColourQ, before using the results for optimisation, the colour
profiles may seem surprising, since there may be significant sugar variation during the
discharge of each centrifugal, as shown in Figure 9. However, information provided by
the instrument can be used to immediately identify and solve problems in the centrifugals
and optimise their performance.
Figure 10. Sugar colour variation during centrifugal discharges after
optimisation using ColourQ information
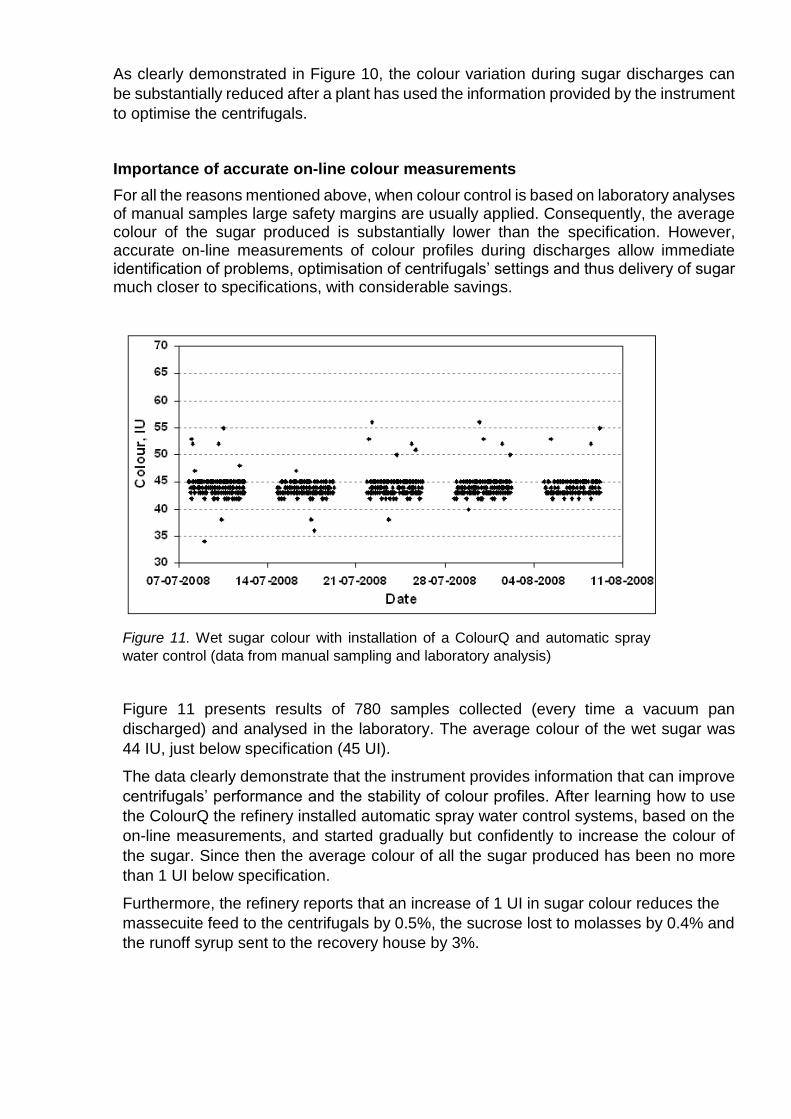
As clearly demonstrated in Figure 10, the colour variation during sugar discharges can
be substantially reduced after a plant has used the information provided by the instrument
to optimise the centrifugals.
Importance of accurate on-line colour measurements
For all the reasons mentioned above, when colour control is based on laboratory analyses of manual samples large safety margins are usually applied. Consequently, the average colour of the sugar produced is substantially lower than the specification. However, accurate on-line measurements of colour profiles during discharges allow immediate identification of problems, optimisation of centrifugals’ settings and thus delivery of sugar much closer to specifications, with considerable savings.
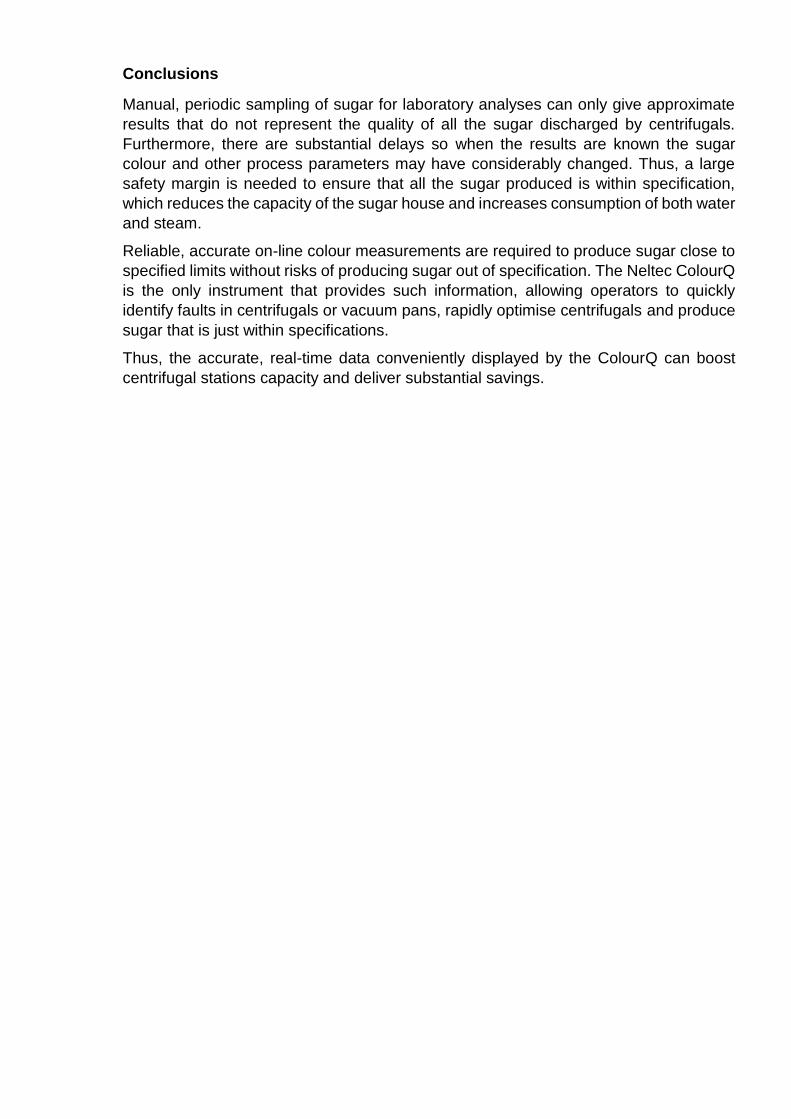
Figure 11. Wet sugar colour with installation of a ColourQ and automatic spray
water control (data from manual sampling and laboratory analysis)
Figure 11 presents results of 780 samples collected (every time a vacuum pan
discharged) and analysed in the laboratory. The average colour of the wet sugar was
44 IU, just below specification (45 UI).
The data clearly demonstrate that the instrument provides information that can improve
centrifugals’ performance and the stability of colour profiles. After learning how to use
the ColourQ the refinery installed automatic spray water control systems, based on the
on-line measurements, and started gradually but confidently to increase the colour of
the sugar. Since then the average colour of all the sugar produced has been no more
than 1 UI below specification.
Furthermore, the refinery reports that an increase of 1 UI in sugar colour reduces the
massecuite feed to the centrifugals by 0.5%, the sucrose lost to molasses by 0.4% and
the runoff syrup sent to the recovery house by 3%.
Conclusions
Manual, periodic sampling of sugar for laboratory analyses can only give approximate
results that do not represent the quality of all the sugar discharged by centrifugals.
Furthermore, there are substantial delays so when the results are known the sugar
colour and other process parameters may have considerably changed. Thus, a large
safety margin is needed to ensure that all the sugar produced is within specification,
which reduces the capacity of the sugar house and increases consumption of both water
and steam.
Reliable, accurate on-line colour measurements are required to produce sugar close to
specified limits without risks of producing sugar out of specification. The Neltec ColourQ
is the only instrument that provides such information, allowing operators to quickly
identify faults in centrifugals or vacuum pans, rapidly optimise centrifugals and produce
sugar that is just within specifications.
Thus, the accurate, real-time data conveniently displayed by the ColourQ can boost
centrifugal stations capacity and deliver substantial savings.
References
1. Bienaimé, L. and Nielsen, B. (1999), “White sugar colour in solution, Comparison of laboratory and in-line methods“, Proc. C.I.T.S. Conference, Antwerp, Belgium.
2. Nielsen, B.C., (2003), “On-line continuous measurement of sugar colour in sugar factories”, Symposium of the Association Andrew Van Hook, Reims, France.
3. Nielsen, B., (2008), “Better process control and large savings”, SPRI conference, Florida, USA.
4. Nielsen, B., (2010), “Process deviations in the sugar house, detectable by the Neltec ColourQ on-line colorimeter, only”, SPRI Conference, Louisiana, USA.
5. Diringer,T., Nielsen, B.C., (2012), “To get and apply accurate and real-time process information for troubleshooting and trouble prevention in the sugar house”, Symposium of the Association Andrew Van Hook, Reims, France.
6. Nielsen, B.C., Diringer,T., Ferraz, A., A., (2012), “Is meaningful sampling of wet sugar possible?” SPRI Conference, New Orleans, USA.
7. Chorão, J. M., (2012), “ A refiner´s experience of on-line colour measurement”, SIT Conference, Auckland, New Zealand.
8. Rein, P. (2007), “Cane Sugar Engineering”, Verlag Dr Albert Bartens KG, Berlin.