Embed Size (px)
Citation preview

UNITED STATESSECURITIES AND EXCHANGE COMMISSION
Washington, D.C. 20549______________________________________
FORM 10-Q______________________________________
(Mark One)☒ QUARTERLY REPORT PURSUANT TO SECTION 13 OR 15(d) OF THE SECURITIES EXCHANGE ACT OF 1934
For the quarterly period ended June 30, 2019
OR
☐ TRANSITION REPORT PURSUANT TO SECTION 13 OR 15(d) OF THE SECURITIES EXCHANGE ACT OF 1934
For the transition period from to
Commission File Number: 1-13395______________________________________
SONIC AUTOMOTIVE, INC.(Exact name of registrant as specified in its charter)
______________________________________
Delaware 56-2010790(State or other jurisdiction of
incorporation or organization)(I.R.S. Employer
Identification No.)
4401 Colwick Road28211Charlotte, North Carolina
(Address of principal executive offices) (Zip Code)
(704) 566-2400(Registrant’s telephone number, including area code)
______________________________________
Securities registered pursuant to Section 12(b) of the Act:Title of each class Trading Symbol(s) Name of each exchange on which registered
Class A Common Stock, par value $0.01 per share SAH New York Stock Exchange
Indicate by check mark whether the registrant (1) has filed all reports required to be filed by Section 13 or 15(d) of the Securities Exchange Act of 1934 during the preceding 12 months (or forsuch shorter period that the registrant was required to file such reports), and (2) has been subject to such filing requirements for the past 90 days. Yes ☒ No ☐Indicate by check mark whether the registrant has submitted electronically every Interactive Data File required to be submitted pursuant to Rule 405 of Regulation S-T (§232.405 of thischapter) during the preceding 12 months (or for such shorter period that the registrant was required to submit such files). Yes ☒ No ☐Indicate by check mark whether the registrant is a large accelerated filer, an accelerated filer, a non-accelerated filer, a smaller reporting company, or an emerging growth company. See thedefinitions of “large accelerated filer,” “accelerated filer,” “smaller reporting company,” and “emerging growth company” in Rule 12b-2 of the Exchange Act.Large accelerated filer ☒ Accelerated filer ☐Non-accelerated filer ☐ Smaller reporting company ☐
Emerging growth company ☐
If an emerging growth company, indicate by check mark if the registrant has elected not to use the extended transition period for complying with any new or revised financial accountingstandards provided pursuant to Section 13(a) of the Exchange Act. ☐ Indicate by check mark whether the registrant is a shell company (as defined in Rule 12b-2 of the Exchange Act). Yes ☐ No ☒As of July 24, 2019, there were 31,099,439 shares of the registrant’s Class A Common Stock and 12,029,375 shares of the registrant’s Class B Common Stock outstanding.

UNCERTAINTY OF FORWARD-LOOKING STATEMENTS AND INFORMATION
This Quarterly Report on Form 10-Q contains, and written or oral statements made from time to time by us or by our authorized officers may contain, “forward-lookingstatements” within the meaning of the Private Securities Litigation Reform Act of 1995. These forward-looking statements address our future objectives, plans and goals, aswell as our intent, beliefs and current expectations regarding future operating performance, results and events, and can generally be identified by words such as “may,” “will,”“should,” “believe,” “expect,” “estimate,” “anticipate,” “intend,” “plan,” “foresee” and other similar words or phrases.
These forward-looking statements are based on our current estimates and assumptions and involve various risks and uncertainties. As a result, you are cautioned thatthese forward-looking statements are not guarantees of future performance, and that actual results could differ materially from those projected in these forward-lookingstatements. Factors which may cause actual results to differ materially from our projections include those risks described in “Item 1A. Risk Factors” of our Annual Report onForm 10-K for the year ended December 31, 2018 and in “Item 1A. Risk Factors” of this report and elsewhere herein, as well as:
• the number of new and used vehicles sold in the United States as compared to our expectations and the expectations of the market;
• our ability to generate sufficient cash flows or to obtain additional financing to fund our EchoPark expansion, capital expenditures, our share repurchase program,dividends on our common stock, acquisitions and general operating activities;
• our business and growth strategies, including, but not limited to, our EchoPark store operations;
• the reputation and financial condition of vehicle manufacturers whose brands we represent, the financial incentives vehicle manufacturers offer and their ability to design,manufacture, deliver and market their vehicles successfully;
• our relationships with manufacturers, which may affect our ability to obtain desirable new vehicle models in inventory or to complete additional acquisitions ordispositions;
• the adverse resolution of one or more significant legal proceedings against us or our franchised dealerships or EchoPark stores;
• changes in laws and regulations governing the operation of automobile franchises, accounting standards, taxation requirements and environmental laws;
• changes in vehicle and parts import quotas, duties, tariffs or other restrictions;
• general economic conditions in the markets in which we operate, including fluctuations in interest rates, employment levels, the level of consumer spending and consumercredit availability;
• high competition in the retail automotive industry, which not only creates pricing pressures on the products and services we offer, but also on businesses we may seek toacquire;
• our ability to successfully integrate potential future acquisitions; and
• the rate and timing of overall economic recovery or decline.
These forward-looking statements speak only as of the date of this report or when made, and we undertake no obligation to revise or update these statements to reflectsubsequent events or circumstances, except as required under the federal securities laws and the rules and regulations of the Securities and Exchange Commission.

SONIC AUTOMOTIVE, INC.QUARTERLY REPORT ON FORM 10-Q
FOR THE THREE AND SIX MONTHS ENDED JUNE 30, 2019
TABLE OF CONTENTSPage
PART I – FINANCIAL INFORMATION 1Item 1. Financial Statements (unaudited) 1
Condensed Consolidated Statements of Income (unaudited) 1Condensed Consolidated Statements of Comprehensive Income (unaudited) 2Condensed Consolidated Balance Sheets (unaudited) 3Condensed Consolidated Statements of Stockholders’ Equity (unaudited) 4Condensed Consolidated Statements of Cash Flows (unaudited) 6Notes to Condensed Consolidated Financial Statements (unaudited) 7
Item 2. Management’s Discussion and Analysis of Financial Condition and Results of Operations 23Item 3. Quantitative and Qualitative Disclosures About Market Risk 67Item 4. Controls and Procedures 68PART II – OTHER INFORMATION 69Item 1. Legal Proceedings 69Item 1A. Risk Factors 70Item 2. Unregistered Sales of Equity Securities and Use of Proceeds 71Item 6. Exhibits 72SIGNATURES 73

PART I – FINANCIAL INFORMATIONItem 1. Financial Statements.
SONIC AUTOMOTIVE, INC.CONDENSED CONSOLIDATED STATEMENTS OF INCOME
(Unaudited)
Three Months Ended June 30, Six Months Ended June 30,2019 2018 2019 2018
(Dollars and shares in thousands, except per share amounts)
Revenues:New vehicles $ 1,204,754 $ 1,238,571 $ 2,271,088 $ 2,419,416 Used vehicles 885,627 762,572 1,705,992 1,471,618 Wholesale vehicles 50,039 53,748 104,810 119,148
Total vehicles 2,140,420 2,054,891 4,081,890 4,010,182 Parts, service and collision repair 355,312 346,754 696,742 698,512 Finance, insurance and other, net 118,349 104,104 224,587 197,829
Total revenues 2,614,081 2,505,749 5,003,219 4,906,523 Cost of Sales:
New vehicles (1,148,354) (1,181,303) (2,160,892) (2,305,349)Used vehicles (848,898) (725,263) (1,632,256) (1,397,538)Wholesale vehicles (50,752) (57,105) (106,789) (126,929)
Total vehicles (2,048,004) (1,963,671) (3,899,937) (3,829,816)Parts, service and collision repair (184,766) (179,703) (362,960) (361,833)
Total cost of sales (2,232,770) (2,143,374) (4,262,897) (4,191,649)Gross profit 381,311 362,375 740,322 714,874 Selling, general and administrative expenses (294,532) (277,462) (541,626) (582,387)Impairment charges — (10,317) (1,952) (13,960)Depreciation and amortization (23,806) (23,949) (46,456) (47,692)Operating income (loss) 62,973 50,647 150,288 70,835 Other income (expense):
Interest expense, floor plan (12,518) (11,945) (25,744) (22,622)Interest expense, other, net (13,628) (13,375) (26,481) (26,831)Other income (expense), net (5) 17 95 106
Total other income (expense) (26,151) (25,303) (52,130) (49,347)Income (loss) from continuing operations before taxes 36,822 25,344 98,158 21,488 Provision for income taxes for continuing operations - benefit (expense) (10,071) (8,222) (29,058) (6,380)Income (loss) from continuing operations 26,751 17,122 69,100 15,108 Discontinued operations:
Income (loss) from discontinued operations before taxes (213) (297) (393) (545)Provision for income taxes for discontinued operations - benefit (expense) 61 80 114 148
Income (loss) from discontinued operations (152) (217) (279) (397)
Net income (loss) $ 26,599 $ 16,905 $ 68,821 $ 14,711
Basic earnings (loss) per common share:Earnings (loss) per share from continuing operations $ 0.62 $ 0.40 $ 1.61 $ 0.35 Earnings (loss) per share from discontinued operations — — (0.01) (0.01)
Earnings (loss) per common share $ 0.62 $ 0.40 $ 1.60 $ 0.34
Weighted-average common shares outstanding 43,066 42,662 42,953 42,725
Diluted earnings (loss) per common share:Earnings (loss) per share from continuing operations $ 0.62 $ 0.40 $ 1.60 $ 0.35 Earnings (loss) per share from discontinued operations (0.01) (0.01) — (0.01)
Earnings (loss) per common share $ 0.61 $ 0.39 $ 1.60 $ 0.34
Weighted-average common shares outstanding 43,230 42,920 43,060 42,948
See notes to unaudited condensed consolidated financial statements.
1

SONIC AUTOMOTIVE, INC.CONDENSED CONSOLIDATED STATEMENTS OF COMPREHENSIVE INCOME
(Unaudited)
Three Months Ended June 30, Six Months Ended June 30,2019 2018 2019 2018
(Dollars in thousands)
Net income (loss) $ 26,599 $ 16,905 $ 68,821 $ 14,711 Other comprehensive income (loss) before taxes:
Change in fair value of interest rate swap and interest rate cap agreements (1,400) 1,197 (3,748) 5,203 Amortization of terminated interest rate swap agreements (632) — (921) —
Total other comprehensive income (loss) before taxes (2,032) 1,197 (4,669) 5,203 Provision for income tax benefit (expense) related to components of othercomprehensive income (loss) 620 (326) 1,396 (1,418)Other comprehensive income (loss) (1,412) 871 (3,273) 3,785
Comprehensive income (loss) $ 25,187 $ 17,776 $ 65,548 $ 18,496
See notes to unaudited condensed consolidated financial statements.
2

SONIC AUTOMOTIVE, INC.CONDENSED CONSOLIDATED BALANCE SHEETS
(Unaudited)
June 30, 2019 December 31, 2018(Dollars in thousands)
ASSETSCurrent Assets:
Cash and cash equivalents $ 2,140 $ 5,854 Receivables, net 364,026 438,186 Inventories 1,521,567 1,528,461 Other current assets 133,445 20,886
Total current assets 2,021,178 1,993,387 Property and Equipment, net 1,130,942 1,178,489 Goodwill 487,306 509,592 Other Intangible Assets, net 64,300 69,705 Operating Right-of-Use Lease Assets 333,525 — Finance Right-of-Use Lease Assets 38,928 — Other Assets 43,148 45,634
Total Assets $ 4,119,327 $ 3,796,807
LIABILITIES AND STOCKHOLDERS’ EQUITYCurrent Liabilities:
Notes payable - floor plan - trade $ 753,239 $ 821,074 Notes payable - floor plan - non-trade 714,609 712,966 Trade accounts payable 128,579 114,263 Operating short-term lease liabilities 44,477 — Finance short-term lease liabilities 5,150 — Accrued interest 12,518 13,417 Other accrued liabilities 243,869 257,823 Current maturities of long-term debt 62,968 26,304
Total current liabilities 1,965,409 1,945,847 Long-Term Debt 851,283 918,779 Other Long-Term Liabilities 68,265 75,887 Operating Long-Term Lease Liabilities 299,009 — Finance Long-Term Lease Liabilities 36,220 — Deferred Income Taxes 23,416 33,178 Commitments and ContingenciesStockholders’ Equity:
Class A Convertible Preferred Stock, none issued — — Class A Common Stock, $0.01 par value; 100,000,000 shares authorized; 64,728,106 shares issued and31,099,439 shares outstanding at June 30, 2019; 64,197,385 shares issued and 30,721,226 sharesoutstanding at December 31, 2018 647 642 Class B Common Stock, $0.01 par value; 30,000,000 shares authorized; 12,029,375 shares issued andoutstanding at June 30, 2019 and December 31, 2018 121 121
Paid-in capital 750,532 745,052 Retained earnings 723,469 670,691
Accumulated other comprehensive income (loss) 960 4,233 Treasury stock, at cost; 33,628,667 Class A Common Stock shares held at June 30, 2019 and 33,476,159Class A Common Stock shares held at December 31, 2018 (600,004) (597,623)
Total Stockholders’ Equity 875,725 823,116
Total Liabilities and Stockholders’ Equity $ 4,119,327 $ 3,796,807
See notes to unaudited condensed consolidated financial statements.
3

SONIC AUTOMOTIVE, INC.CONDENSED CONSOLIDATED STATEMENTS OF STOCKHOLDERS’ EQUITY
(Unaudited)
Class A Common Stock
Class ATreasury Stock
Class B Common Stock
Paid-In CapitalRetainedEarnings
Accumulated OtherComprehensive Income
(Loss)Total Stockholders’
EquityShares Amount Shares Amount Shares Amount
(Dollars and shares in thousands, except per share amounts)
Balance at March 31, 2018 64,085 $ 641 (33,443) $ (596,962) 12,029 $ 121 $ 736,161 $ 624,535 $ 4,221 $ 768,717
Shares awarded under stock compensation plans 41 — — — — — 2 — — 2
Purchases of treasury stock — — (1) (19) — — — — — (19)
Change in fair value of interest rate swap andinterest rate cap agreements, net of tax expenseof $288 — — — — — — — — 871 871
Restricted stock amortization — — — — — — 3,049 — — 3,049
Net income (loss) — — — — — — — 16,905 — 16,905
Class A dividends declared ($0.06) — — — — — — — (1,537) — (1,537)
Class B dividends declared ($0.06) — — — — — — — (1,008) — (1,008)
Balance at June 30, 2018 64,126 $ 641 (33,444) $ (596,981) 12,029 $ 121 $ 739,212 $ 638,895 $ 5,092 $ 786,980
Class A Common Stock
Class ATreasury Stock
Class B Common Stock
Paid-In CapitalRetainedEarnings
Accumulated OtherComprehensive Income
(Loss)Total Stockholders’
EquityShares Amount Shares Amount Shares Amount
(Dollars and shares in thousands, except per share amounts)
Balance at March 31, 2019 64,677 $ 647 (33,625) $ (599,956) 12,029 $ 121 $ 747,920 $ 701,182 $ 2,372 $ 852,286
Shares awarded under stock compensation plans 51 — — — — — — — — —
Purchases of treasury stock — — (4) (48) — — — — — (48)
Change in fair value of interest rate swap andinterest rate cap agreements, net of tax benefit of$620 — — — — — — — — (1,412) (1,412)
Restricted stock amortization — — — — — — 2,612 — — 2,612
Net income (loss) — — — — — — — 26,599 — 26,599
Class A dividends declared ($0.10) — — — — — — — (3,109) — (3,109)
Class B dividends declared ($0.10) — — — — — — — (1,203) — (1,203)
Balance at June 30, 2019 64,728 $ 647 (33,629) $ (600,004) 12,029 $ 121 $ 750,532 $ 723,469 $ 960 $ 875,725
See notes to unaudited condensed consolidated financial statements.
4

SONIC AUTOMOTIVE, INC.CONDENSED CONSOLIDATED STATEMENTS OF STOCKHOLDERS’ EQUITY
(Unaudited)
Class A Common Stock
Class ATreasury Stock
Class B Common Stock
Paid-In CapitalRetainedEarnings
Accumulated OtherComprehensive Income
(Loss)Total Stockholders’
EquityShares Amount Shares Amount Shares Amount
(Dollars and shares in thousands, except per share amounts)
Balance at December 31, 2017 63,457 $ 635 (32,290) $ (573,513) 12,029 $ 121 $ 732,854 $ 625,356 $ 1,307 $ 786,760
Shares awarded under stock compensationplans 669 6 — — — — 347 — — 353
Purchases of treasury stock — — (1,154) (23,468) — — — — — (23,468)
Change in fair value of interest rate swap andinterest rate cap agreements, net of tax expenseof $1,418 — — — — — — — — 3,785 3,785
Restricted stock amortization — — — — — — 6,011 — — 6,011
Net income (loss) — — — — — — — 14,711 — 14,711
Cumulative effect of change in accountingprinciple — — — — — — — 3,918 — 3,918
Class A dividends declared ($0.06) — — — — — — — (3,646) — (3,646)
Class B dividends declared ($0.06) — — — — — — — (1,444) — (1,444)
Balance at June 30, 2018 64,126 $ 641 (33,444) $ (596,981) 12,029 $ 121 $ 739,212 $ 638,895 $ 5,092 $ 786,980
Class A Common Stock
Class ATreasury Stock
Class B Common Stock
Paid-In CapitalRetainedEarnings
Accumulated OtherComprehensive Income
(Loss)Total Stockholders’
EquityShares Amount Shares Amount Shares Amount
(Dollars and shares in thousands, except per share amounts)
Balance at December 31, 2018 64,197 $ 642 (33,476) $ (597,623) 12,029 $ 121 $ 745,052 $ 670,691 $ 4,233 $ 823,116
Shares awarded under stock compensationplans 531 5 — — — — 54 — — 59
Purchases of treasury stock — — (153) (2,381) — — — — — (2,381)
Change in fair value of interest rate swap andinterest rate cap agreements, net of tax benefitof $1,396 — — — — — — — — (3,273) (3,273)
Restricted stock amortization — — — — — — 5,426 — — 5,426
Net income (loss) — — — — — — — 68,821 — 68,821
Cumulative effect of change in accountingprinciple (1) — — — — — — — (7,428) — (7,428)
Class A dividends declared ($0.10) — — — — — — — (6,209) — (6,209)
Class B dividends declared ($0.10) — — — — — — — (2,406) — (2,406)
Balance at June 30, 2019 64,728 $ 647 (33,629) $ (600,004) 12,029 $ 121 $ 750,532 $ 723,469 $ 960 $ 875,725
(1) See Note 1, “Summary of Significant Accounting Policies,” for further discussion.
See notes to unaudited condensed consolidated financial statements.
5

SONIC AUTOMOTIVE, INC.CONDENSED CONSOLIDATED STATEMENTS OF CASH FLOWS
(Unaudited)Six Months Ended June 30,
2019 2018(Dollars in thousands)
CASH FLOWS FROM OPERATING ACTIVITIES:Net income (loss) $ 68,821 $ 14,711 Adjustments to reconcile net income (loss) to net cash provided by (used in) operating activities:
Depreciation and amortization of property and equipment 44,881 47,689 Provision for bad debt expense 205 283 Other amortization 3 310 Debt issuance cost amortization 1,189 1,217 Stock-based compensation expense 5,426 6,011 Deferred income taxes (5,560) (6,188)Net distributions from equity investee 205 162 Asset impairment charges 1,952 13,960 Loss (gain) on disposal of dealerships and property and equipment (46,065) (41,439)Loss (gain) on exit of leased dealerships (170) 2,564 Changes in assets and liabilities that relate to operations:
Receivables 82,537 151,391 Inventories (31,566) (73,100)Other assets (65,637) 500 Notes payable - floor plan - trade (67,835) (59,738)Trade accounts payable and other liabilities (45,245) (20,225)
Total adjustments (125,680) 23,397 Net cash provided by (used in) operating activities (56,859) 38,108
CASH FLOWS FROM INVESTING ACTIVITIES:Purchases of land, property and equipment (51,234) (99,602)Proceeds from sales of property and equipment 2,301 12,584 Proceeds from sales of dealerships 121,337 122,404
Net cash provided by (used in) investing activities 72,404 35,386 CASH FLOWS FROM FINANCING ACTIVITIES:
Net (repayments) borrowings on notes payable - floor plan - non-trade 1,643 11,135 Borrowings on revolving credit facilities 303,235 514,915 Repayments on revolving credit facilities (303,235) (572,519)Proceeds from issuance of long-term debt — 21,072 Debt issuance costs 2 (131)Principal payments and repurchase of long-term debt (11,715) (18,344)Purchases of treasury stock (2,381) (23,468)Issuance of shares under stock compensation plans 59 353 Dividends paid (6,867) (4,705)
Net cash provided by (used in) financing activities (19,259) (71,692)NET INCREASE (DECREASE) IN CASH AND CASH EQUIVALENTS (3,714) 1,802 CASH AND CASH EQUIVALENTS, BEGINNING OF YEAR 5,854 6,352
CASH AND CASH EQUIVALENTS, END OF PERIOD $ 2,140 $ 8,154
SUPPLEMENTAL SCHEDULE OF NON-CASH FINANCING ACTIVITIES:Change in fair value of interest rate swap and interest rate cap agreements (net of tax benefit of $1,396 in the six months ended June 30, 2019 andnet of tax expense of $1,418 in the six months ended June 30, 2018) $ (3,273) $ 3,785
SUPPLEMENTAL DISCLOSURES OF CASH FLOW INFORMATION:Cash paid (received) during the period for:
Interest, including amount capitalized $ 53,143 $ 48,355 Income taxes $ 41,305 $ 18,682
See notes to unaudited condensed consolidated financial statements.
6

SONIC AUTOMOTIVE, INC.NOTES TO UNAUDITED CONDENSED CONSOLIDATED FINANCIAL STATEMENTS
1. Summary of Significant Accounting Policies
Basis of Presentation – The accompanying condensed consolidated financial statements of Sonic Automotive, Inc. and its wholly owned subsidiaries (“Sonic,” the“Company,” “we,” “us” and “our”) for the three and six months ended June 30, 2019 and 2018 are unaudited and have been prepared in accordance with U.S. generallyaccepted accounting principles (“U.S. GAAP”) for interim financial information and applicable rules and regulations of the Securities and Exchange Commission. Accordingly,they do not include all of the information and footnotes required by U.S. GAAP for complete financial statements. The accompanying unaudited condensed consolidatedfinancial statements reflect, in the opinion of management, all material normal recurring adjustments necessary to fairly state the financial position, results of operations andcash flows for the periods presented. The operating results for interim periods are not necessarily indicative of the results to be expected for the entire fiscal year or futureinterim periods, because the first quarter historically has contributed less operating profit than the second, third and fourth quarters. The accompanying unaudited condensedconsolidated financial statements should be read in conjunction with the consolidated financial statements and related notes thereto included in Sonic’s Annual Report on Form10-K for the year ended December 31, 2018.
Recent Accounting Pronouncements – In February 2016, the Financial Accounting Standards Board (the “FASB”) established Accounting Standards Codification(“ASC”) 842, “Leases,” by issuing Accounting Standards Update (“ASU”) 2016-02 (and subsequent amendments via ASU 2018-01, ASU 2018-10 and ASU 2018-11) in orderto increase transparency and comparability among organizations by recognizing operating lease assets and lease liabilities on the balance sheet and disclosing key informationabout leasing arrangements. Prior to adoption of the new lease standard, only leases classified as capital leases under ASC 840, “Leases,” were recorded in the consolidatedbalance sheets. Under ASC 842, “Leases,” an entity must classify leases as either finance leases (formerly capital leases) or operating leases, and a right-of-use asset (“ROUasset”) and lease liability are required to be recognized in the consolidated balance sheets for both finance and operating leases with a term longer than 12 months. The new leasestandard requires a modified retrospective transition approach and provides an optional transition method to either (1) record current existing leases as of the effective date; or(2) record leases existing as of the earliest comparative period presented in the financial statements by recasting comparative period financial statements. We adopted the newlease standard as of January 1, 2019 using the effective date as our date of application. As such, financial statement information and disclosures required under the new leasestandard have not been provided for dates and periods prior to January 1, 2019. The new lease standard provides for a number of optional practical expedients in transition,which include: (1) not requiring an entity to reassess prior conclusions about lease identification, lease classification or initial direct costs; (2) allowing an entity to use aportfolio approach for similar lease assets; (3) allowing an entity to elect an accounting policy to choose not to separate non-lease components of an agreement from leasecomponents (by asset class); (4) allowing the use of hindsight in estimating lease term or assessing impairment of ROU assets; and (5) not requiring an entity to reassess priorconclusions about land easements. We have elected all of the practical expedients permitted under the transition guidance within the new lease standard. The new lease standardalso provides practical expedients for ongoing accounting. We have elected the short-term lease recognition exemption for our real estate and equipment leases, which meansthat for those leases that qualify (less than 1-year term), we will not recognize ROU assets or lease liabilities. We have also elected not to separate non-lease components of anagreement from lease components (by asset class).
The cumulative effect of the adoption of ASC 842, “Leases,” on our unaudited condensed consolidated balance sheet as of January 1, 2019 was the recognition of ROUassets of approximately $406.9 million (including approximately $18.9 million related to capital leases that was reclassified from property and equipment, net in theaccompanying unaudited condensed consolidated balance sheet as of December 31, 2018) and lease liabilities of approximately $419.5 million (including approximately $20.6million related to capital leases that was reclassified from current maturities of long-term debt and long-term debt in the accompanying unaudited condensed consolidatedbalance sheet as of December 31, 2018). Upon adoption of ASC 842, “Leases,” we evaluated ROU assets for impairment and determined that approximately $10.5 million ofimpairment was required related to newly recognized ROU assets that would have been impaired in previous periods. This impairment of the ROU asset as of January 1, 2019was recorded, net of related income tax effects, as a $7.4 million reduction of beginning retained earnings. The adoption of ASC 842, “Leases,” did not have a material effect onour unaudited condensed consolidated statements of income or our unaudited condensed consolidated statements of cash flows. The effect of the adoption of ASC 842,“Leases,” on our unaudited condensed consolidated balance sheets as of January 1, 2019 and June 30, 2019 was as follows:
7

SONIC AUTOMOTIVE, INC.NOTES TO UNAUDITED CONDENSED CONSOLIDATED FINANCIAL STATEMENTS
Before Impact of ASC 842 Effects of Adoption of ASC842
After Impact of ASC 842December 31, 2018 January 1, 2019
Balance Sheet (In thousands)Assets:
Property and Equipment, net $ 1,178,489 $ (18,948) $ 1,159,541 Other Intangible Assets, net 69,705 (4,005) 65,700 Right-of-Use Assets — 406,918 406,918
Liabilities:
Current lease liabilities $ — $ 48,832 $ 48,832 Other accrued liabilities 257,823 (1,987) 255,836 Long-Term Debt 918,779 (20,557) 898,222 Long-Term Lease Liabilities — 370,647 370,647 Other Long-Term Liabilities 75,887 (2,508) 73,379 Deferred Income Taxes 33,178 (3,034) 30,144
Stockholders' Equity:
Retained earnings $ 670,691 $ (7,428) $ 663,263
Adoptionof ASC 842 as ofJanuary 1, 2019
NewLeases Modifications (1) Amortization
As Reported June 30,2019
(In thousands)Right-of-Use Assets:
Finance Leases $ 18,948 $ 38 $ 21,514 $ (1,572) $ 38,928 Operating Leases 387,970 — (33,710) (20,735) 333,525 Total Right-of-Use Assets $ 406,918 $ 38 $ (12,196) $ (22,307) $ 372,453
Current Lease Liabilities:
Finance Leases $ 728 $ 3 $ 4,552 $ (133) $ 5,150 Operating Leases 48,104 89 (1,615) (2,101) 44,477 Total Current Lease Liabilities $ 48,832 $ 92 $ 2,937 $ (2,234) $ 49,627
Long-Term Lease Liabilities:
Finance Leases $ 19,829 $ 35 $ 16,935 $ (579) $ 36,220 Operating Leases 350,818 — (32,200) (19,609) 299,009 Total Long-Term Lease Liabilities $ 370,647 $ 35 $ (15,265) $ (20,188) $ 335,229
(1) Includes the impact of remeasurements related to lease terminations and changes in assumptions around the probability of exercise of extension options.Three Months Ended June 30, 2019 Six Months Ended June 30, 2019
Lease Expense (In thousands)Finance lease expense:
Amortization of right-of-use assets $ 862 $ 1,572 Interest on lease liabilities 1,339 2,515
Operating lease expense (1) 17,057 35,054 Short-term lease expense (1) 473 900 Variable lease expense 683 797 Sublease income (3,806) (7,384)
Total $ 16,608 $ 33,454
(1) Included in operating cash flows in the accompanying unaudited condensed consolidated statements of cash flows.
8

SONIC AUTOMOTIVE, INC.NOTES TO UNAUDITED CONDENSED CONSOLIDATED FINANCIAL STATEMENTS
Three Months Ended June 30, 2019 Six Months Ended June 30, 2019(In thousands)
Other InformationCash paid for amounts included in the measurement of lease liabilities:
Financing cash flows for finance leases $ 502 $ 782 Operating cash flows for finance leases $ 1,339 $ 2,515 Operating cash flows for operating leases $ 18,315 $ 36,784 Right-of-use assets obtained in exchange for lease liabilities:
Finance leases $ 9,290 $ 19,273 Operating leases (1) $ 1,541 $ (9,170)
(1) Includes the impact of reclassification of right-of-use assets from operating leases to finance leases due to remeasurement.
June 30, 2019Other InformationWeighted-average remaining lease term (in years):
Finance leases 11.22 Operating leases 9.66Weighted-average discount rate:
Finance leases 18.33 % Operating leases 6.87 %
Undiscounted Lease Cash Flows Under ASC 842 as of June 30, 2019Finance Operating Receipts from Subleases
Year Ending December 31, (In thousands)
2019 $ 6,965 $ 33,956 $ (8,045)2020 6,535 63,257 (11,545)2021 6,667 55,960 (9,299)2022 6,667 48,103 (6,612)2023 6,719 46,335 (6,612)Thereafter 49,922 235,548 (9,744)
Total $ 83,475 $ 483,159 $ (51,857)
Less: Present value discount (42,105) (139,673)
Lease liabilities $ 41,370 $ 343,486
For comparison purposes the following table provides the future minimum lease payments as presented in our Annual Report on Form 10-K for the year ended December31, 2018 in accordance with ASC 840, “Leases,”.
Undiscounted Lease Cash Flows Under ASC 842 as of December 31, 2018Finance Operating Receipts from Subleases
Year Ending December 31, (In thousands)
2019 $ 6,985 $ 82,177 $ (13,430)2020 7,165 66,023 (10,508)2021 7,357 51,501 (8,534)2022 7,374 37,152 (7,232)2023 7,609 33,486 (7,013)Thereafter 482,390 127,026 (13,116)
Total minimum lease payments (receipts) $ 518,880 $ 397,365 $ (59,833)Less: Present value discount (498,291)Lease liabilities $ 20,589 Current portion of lease liabilities $ 643 Long-term portion of lease liabilities $ 19,946
9

SONIC AUTOMOTIVE, INC.NOTES TO UNAUDITED CONDENSED CONSOLIDATED FINANCIAL STATEMENTS
The majority of our leases are related to dealership properties that are subject to long-term lease arrangements. In addition, we have certain equipment leases andcontracts containing embedded leased assets that have been evaluated and included in the ROU assets and lease liabilities above as appropriate.
We recognize a ROU asset and a lease liability at the lease commencement date. For operating leases, the lease liability is initially and subsequently measured at thepresent value of the unpaid lease payments at the lease commencement date. For finance leases, the lease liability is initially measured in the same manner and date as foroperating leases, and is subsequently measured at amortized cost using the effective interest method.
The ROU asset is initially measured at cost, which comprises the initial amount of the lease liability adjusted for lease payments made at or before the leasecommencement date, plus any initial direct costs incurred or previously recognized favorable lease assets, less any lease incentives received or previously recognized lease exitaccruals. For operating leases, the ROU asset is subsequently measured throughout the lease term at the carrying amount of the lease liability, plus initial direct costs, plus(minus) any prepaid (accrued) lease payments, less the unamortized balance of lease incentives received. Lease expense for lease payments is recognized on a straight-line basisover the lease term. For finance leases, the ROU asset is subsequently amortized using the straight-line method from the lease commencement date to the earlier of the end of itsuseful life or the end of the lease term unless the lease transfers ownership of the underlying asset to us or we are reasonably certain to exercise an option to purchase theunderlying asset. In those cases, the ROU asset is amortized over the useful life of the underlying asset. Amortization of the ROU asset is recognized and presented separatelyfrom interest expense on the lease liability.
Variable lease payments associated with our leases are recognized when the event, activity or circumstance in the lease agreement on which those payments are assessedoccurs. Variable lease payments are presented as operating expense in our consolidated financial statements of income in the same line item as expense arising from fixed leasepayments (operating leases) or amortization of the ROU asset (finance leases).
ROU assets for operating and finance leases are periodically reduced by impairment losses. We use the long-lived assets impairment guidance in ASC 360, “Property,Plant, and Equipment,” to determine whether an ROU asset is impaired and, if so, the amount of the impairment loss to recognize.
The Company monitors for events or changes in circumstances that require a reassessment of one of its leases. When a reassessment results in the remeasurement of alease liability, a corresponding adjustment is made to the carrying amount of the corresponding ROU asset unless doing so would reduce the carrying amount of the ROU assetto an amount less than zero. In that case, the amount of the adjustment that would result in a negative ROU asset balance, is recorded in profit or loss.
Key estimates and judgments include how we determine: (1) the discount rate used to discount the unpaid lease payments to present value; (2) the expected lease term,including any extension options; and (3) future lease payments.
ASC 842, “Leases,” requires a lessee to discount its unpaid lease payments using the interest rate implicit in the lease or, if that rate cannot be readily determined, itsincremental borrowing rate. Generally, we cannot determine the interest rate implicit in the lease because we do not have access to the lessor’s estimated residual value or theamount of the lessor’s deferred initial direct costs. Therefore, we generally use our incremental borrowing rate as the discount rate for the lease. We determined the discountrate for our leases based on the risk-free rate as of the measurement date for varying maturities corresponding to the remaining lease term, adjusted for the risk-premiumattributed to Sonic’s corporate credit rating for a secured or collateralized instrument.
Many of our lease arrangements have one or multiple options to extend the lease term (typically five- to ten-year options), which were considered in the calculation of theROU assets and lease liabilities if it was reasonably certain that an extension option would be exercised. The lease term for all of the Company’s leases includes thenoncancellable period of the lease plus any additional periods covered by our option to extend the lease that we are reasonably certain to exercise. We determined the probabilityof the exercise of a lease extension option based on our long-term strategic business outlook and the condition and remaining useful life of the fixed assets at the locationsubject to the lease agreement, among other factors.
The majority of our lease agreements require fixed monthly payments (subject to either specific or index-based escalations in future periods) while other agreementsrequire variable lease payments based on changes in the London Interbank Offer Rate (“LIBOR”). Lease payments included in the measurement of the lease liability comprisethe: (1) fixed payments, including in-substance fixed payments, owed over the lease term, which include termination penalties we would owe if the lease term assumesCompany exercise of a termination option; (2) variable lease payments that depend on an index or rate, initially measured using the index or rate at the lease commencementdate; and (3) the exercise price of our option to purchase the underlying asset if we are reasonably certain to exercise the option. Our leases do not typically contain residualvalue guarantees.
10

SONIC AUTOMOTIVE, INC.NOTES TO UNAUDITED CONDENSED CONSOLIDATED FINANCIAL STATEMENTS
In certain situations, we have entered into sublease agreements whereby we sublease all or a portion of a leased real estate asset to a third party. To the extent that wehave a sublease related to a lease agreement for an asset that we are no longer using in operations, we have reduced the ROU asset by the net deficiency in expected cash flowsfrom that sublease (either due to partial monthly sublease proceeds or a sublease term less than the remaining master lease term). As of December 31, 2018, the net liabilityrelated to these lease exit accruals was approximately $4.6 million as discussed in Note 7, “Commitments and Contingencies.” Upon the adoption of ASC 842, “Leases,” thisbalance was reclassified from other accrued liabilities and other long-term liabilities to a reduction in right-of-use assets in the accompanying unaudited condensed consolidatedbalance sheets.
Prior to the adoption of ASC 842, “Leases,” we had recorded definite life intangible assets related to favorable lease assets acquired in business combinations. As ofDecember 31, 2018, the net unamortized balance related to these definite life intangible assets was approximately $4.0 million. Upon adoption of ASC 842, “Leases,” thisbalance was reclassified from other intangible assets, net to right-of-use assets in the accompanying unaudited condensed consolidated balance sheets as of June 30, 2019 andcontinues to be amortized over the remaining lease term.
As part of the lease standard implementation process, we assessed our existing real estate and equipment lease agreements, identified certain lease components embeddedwithin existing service contracts, evaluated transition guidance and practical expedient elections, implemented lease accounting software and designed internal controls overlease accounting under the new standard.
In August 2017, the FASB issued ASU 2017-12, which amends the hedge accounting recognition and presentation requirements in ASC 815, “Derivatives andHedging.” This ASU expands and refines hedge accounting for both non-financial and financial risk components and aligns the recognition and presentation of the effects of thehedging instrument and the hedged item in the financial statements. It also includes certain targeted improvements to simplify the application of current guidance related tohedge accounting. For public companies, this ASU is effective for fiscal years, and interim periods within those fiscal years, beginning after December 15, 2018. The effects ofthis ASU did not materially impact our consolidated financial statements.
In February 2018, the FASB issued ASU 2018-02, which allows the reclassification of stranded tax effects, as a result of the Tax Cuts and Jobs Acts of 2017, fromaccumulated other comprehensive income to retained earnings. For public companies, this ASU is effective for fiscal years, and interim periods within those fiscal years,beginning after December 15, 2018. The effects of this ASU did not materially impact our consolidated financial statements.
In June 2018, the FASB issued ASU 2018-07 to expand the scope of ASC 718, Compensation - “Stock - Compensation,” to include share-based payment transactionsfor acquiring goods and services from non-employees. For public companies, this ASU is effective for fiscal years, and interim periods within those fiscal years, beginning afterDecember 15, 2018. The effects of this ASU did not materially impact our consolidated financial statements.
Principles of Consolidation – All of our subsidiaries are wholly owned and consolidated in the accompanying unaudited condensed consolidated financial statements,except for one 50%-owned dealership that is accounted for under the equity method. All material intercompany balances and transactions have been eliminated in theaccompanying unaudited condensed consolidated financial statements.
Revenue from Contracts with Customers – As of January 1, 2018, we adopted ASC 606, “Revenue from Contracts with Customers.” Under this standard, revenue isrecognized when a customer obtains control of promised goods or services and in an amount that reflects the consideration that the entity expects to receive in exchange forthose goods or services. The standard applies a five-step model that includes: (1) identifying the contract(s) with the customer; (2) identifying the performance obligation(s) inthe contract(s); (3) determining the transaction price; (4) allocating the transaction price to the performance obligation(s) in the contract(s); and (5) recognizing revenue as theperformance obligation(s) are satisfied. The standard also requires disclosure of the nature, amount, timing and uncertainty of revenue and cash flows arising from contractswith customers. We do not include the cost of obtaining contracts within the related revenue streams since we elected the practical expedient to expense the costs to obtain acontract when incurred.
Management has evaluated our established business processes, revenue transaction streams and accounting policies, and identified our material revenue streams to be: (1)the sale of new vehicles; (2) the sale of used vehicles to retail customers; (3) the sale of wholesale used vehicles at third-party auctions; (4) the arrangement of vehicle financingand the sale of service and other insurance contracts; and (5) the performance of vehicle maintenance and repair services and the sale of related parts and accessories. Generally,performance conditions are satisfied when the associated vehicle is either delivered or returned to a customer and customer acceptance has occurred, or over time as themaintenance and repair services are performed. We do not have any revenue streams with significant financing components as payments are typically received within a shortperiod of time following completion of the performance obligation(s). Upon adoption, we accelerated the timing of revenue recognition related to: (1) service and collisionrepair orders that are incomplete as of a reporting date (“work in process”) and (2) certain
11

SONIC AUTOMOTIVE, INC.NOTES TO UNAUDITED CONDENSED CONSOLIDATED FINANCIAL STATEMENTS
retrospective finance and insurance revenue earned in periods subsequent to the completion of the initial performance obligation (“F&I retro revenues”). Work in processrevenues are recognized over time based on the completed work to date and F&I retro revenues are recognized when the product contract has been executed with the endcustomer and are estimated each reporting period based on the expected value method using historical and projected data. F&I retro revenues, which represent variableconsideration, subject to constraint, are to be included in the transaction price and recognized when or as the performance obligation is satisfied. F&I retro revenues can varybased on a variety of factors, including number of contracts and history of cancellations and claims. Accordingly, we utilize this historical and projected data to constrain theconsideration to the extent that it is probable that a significant reversal in the amount of cumulative revenue will not occur when the uncertainty associated with the variableconsideration is subsequently resolved.
Receivables, net in the accompanying unaudited condensed consolidated balance sheets as of June 30, 2019 and December 31, 2018 include approximately $4.8 millionand $4.7 million, respectively, related to work in process and contract assets related to F&I retro revenues of approximately $5.9 million and $5.4 million, respectively. Changesin contract assets from December 31, 2018 to June 30, 2019 were primarily due to ordinary business activity. Please refer to Note 1, “Description of Business and Summary ofSignificant Accounting Policies,” to the consolidated financial statements in Sonic’s Annual Report on Form 10-K for the year ended December 31, 2018 for further discussionof our revenue recognition policies and processes.
Income Tax Expense – The overall effective tax rate from continuing operations was 27.4% and 29.6% for the three and six months ended June 30, 2019, respectively,and 32.4% and 29.7% for the three and six months ended June 30, 2018. Income tax expense for the three months ended June 30, 2019 includes a $0.4 million discrete benefitrelated to the favorable resolution of certain tax matters. Income tax expense for the six months ended June 30, 2019 includes a $1.5 million discrete charge for non-deductibleexecutive officer compensation related to executive transition costs, a $0.2 million discrete charge related to changes in uncertain tax positions and a $0.2 million discretecharge related to vested or exercised stock compensation awards, offset partially by a $0.4 million discrete benefit related to the favorable resolution of certain tax matters.Income tax expense for the three months ended June 30, 2018 includes a $0.6 million discrete charge for non-deductible book goodwill related to dealership dispositions duringthe period. Income tax expense for the six months ended June 30, 2018 includes a $0.9 million discrete benefit related to vested or exercised stock compensation awards, offsetpartially by a $0.2 million discrete charge related to changes in uncertain tax positions and a $0.6 million discrete charge for non-deductible book goodwill related to dealershipdispositions during the period. Sonic’s effective tax rate varies from year to year based on the level of taxable income, the distribution of taxable income between states inwhich the Company operates and other tax adjustments. Sonic expects the annual effective tax rate in future periods to fall within a range of 26.0% to 29.0% before the impact,if any, of changes in valuation allowances related to deferred income tax assets or discrete tax adjustments.
Earnings Per Share – The calculation of diluted earnings per share considers the potential dilutive effect of restricted stock units, restricted stock awards and stockoptions granted under Sonic’s stock compensation plans, in addition to Class A Common Stock purchase warrants.
2. Business Dispositions
We disposed of one luxury franchised dealership and three mid-line import franchised dealerships during the six months ended June 30, 2019 that generated net cash ofapproximately $121.3 million. We disposed of two luxury franchised dealerships and four mid-line import franchised dealerships during the six months ended June 30, 2018that generated net cash of approximately $122.4 million. Additionally, we terminated one luxury franchised dealership and ceased operations at a previously acquired pre-ownedstore in Florida during the six months ended June 30, 2018.
Revenues and other activities associated with disposed franchised dealerships that remain in continuing operations were as follows:
Three Months Ended June 30, Six Months Ended June 30,2019 2018 2019 2018
(In thousands)
Income (loss) from operations $ (339) $ 739 $ (1,842) $ (5,505)Gain (loss) on disposal (356) 38,422 46,394 39,613 Lease exit accrual adjustments and charges — 2 169 (18)
Pre-tax income (loss) $ (695) $ 39,163 $ 44,721 $ 34,090
Total revenues $ — $ 30,751 $ 26,473 $ 108,777
12
SONIC AUTOMOTIVE, INC.NOTES TO UNAUDITED CONDENSED CONSOLIDATED FINANCIAL STATEMENTS
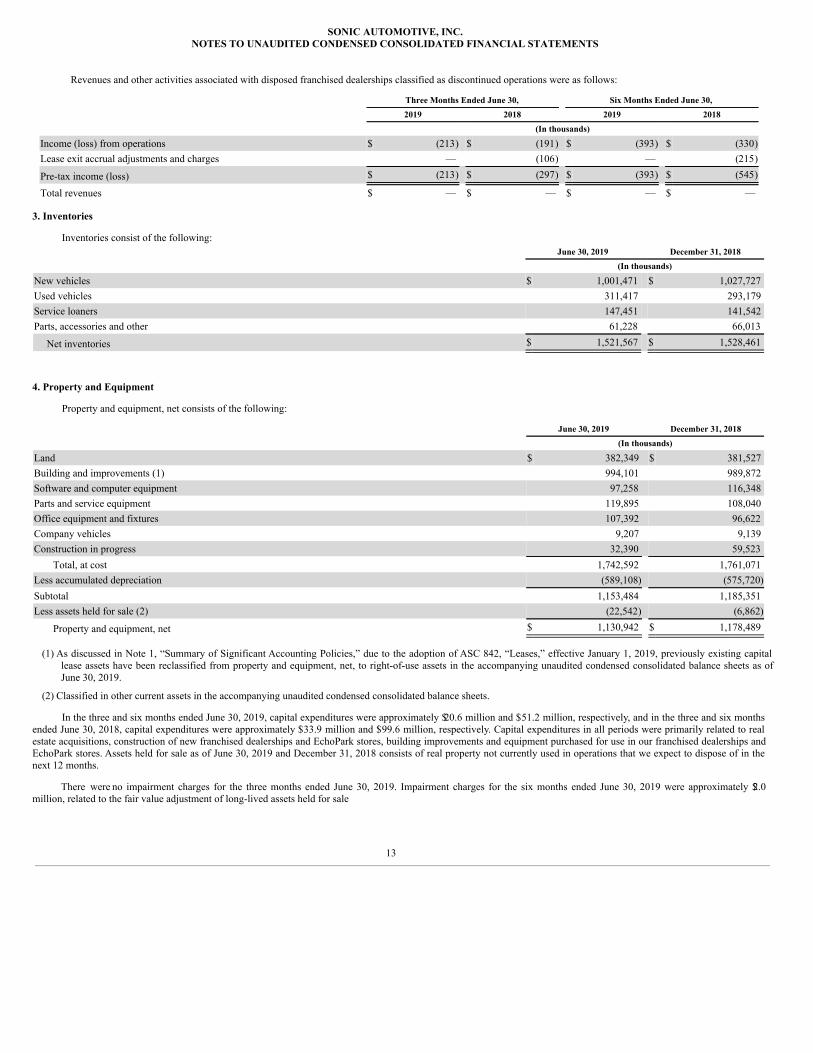
Revenues and other activities associated with disposed franchised dealerships classified as discontinued operations were as follows:
Three Months Ended June 30, Six Months Ended June 30,2019 2018 2019 2018
(In thousands)
Income (loss) from operations $ (213) $ (191) $ (393) $ (330)Lease exit accrual adjustments and charges — (106) — (215)
Pre-tax income (loss) $ (213) $ (297) $ (393) $ (545)
Total revenues $ — $ — $ — $ —
3. Inventories
Inventories consist of the following:June 30, 2019 December 31, 2018
(In thousands)
New vehicles $ 1,001,471 $ 1,027,727 Used vehicles 311,417 293,179 Service loaners 147,451 141,542 Parts, accessories and other 61,228 66,013
Net inventories $ 1,521,567 $ 1,528,461
4. Property and Equipment
Property and equipment, net consists of the following:
June 30, 2019 December 31, 2018(In thousands)
Land $ 382,349 $ 381,527 Building and improvements (1) 994,101 989,872 Software and computer equipment 97,258 116,348 Parts and service equipment 119,895 108,040 Office equipment and fixtures 107,392 96,622 Company vehicles 9,207 9,139 Construction in progress 32,390 59,523
Total, at cost 1,742,592 1,761,071 Less accumulated depreciation (589,108) (575,720)Subtotal 1,153,484 1,185,351 Less assets held for sale (2) (22,542) (6,862)
Property and equipment, net $ 1,130,942 $ 1,178,489
(1) As discussed in Note 1, “Summary of Significant Accounting Policies,” due to the adoption of ASC 842, “Leases,” effective January 1, 2019, previously existing capitallease assets have been reclassified from property and equipment, net, to right-of-use assets in the accompanying unaudited condensed consolidated balance sheets as ofJune 30, 2019.
(2) Classified in other current assets in the accompanying unaudited condensed consolidated balance sheets.
In the three and six months ended June 30, 2019, capital expenditures were approximately $20.6 million and $51.2 million, respectively, and in the three and six monthsended June 30, 2018, capital expenditures were approximately $33.9 million and $99.6 million, respectively. Capital expenditures in all periods were primarily related to realestate acquisitions, construction of new franchised dealerships and EchoPark stores, building improvements and equipment purchased for use in our franchised dealerships andEchoPark stores. Assets held for sale as of June 30, 2019 and December 31, 2018 consists of real property not currently used in operations that we expect to dispose of in thenext 12 months.
There were no impairment charges for the three months ended June 30, 2019. Impairment charges for the six months ended June 30, 2019 were approximately $2.0million, related to the fair value adjustment of long-lived assets held for sale
13

SONIC AUTOMOTIVE, INC.NOTES TO UNAUDITED CONDENSED CONSOLIDATED FINANCIAL STATEMENTS
related to real estate at former EchoPark locations. Impairment charges for the three and six months ended June 30, 2018 were approximately $10.3 million and $14.0 million,respectively, which include the write-off of certain costs associated with internally developed software as well as the write-off of capitalized costs associated with theabandonment of certain construction projects.
5. Goodwill and Intangible Assets
The carrying amount of goodwill was approximately $487.3 million and $509.6 million as of June 30, 2019 and December 31, 2018, respectively. The carrying amountof goodwill is net of accumulated impairment losses of approximately $797.6 million as of both June 30, 2019 and December 31, 2018. The carrying amount of franchise assetswas approximately $64.3 million and $65.7 million as of June 30, 2019 and December 31, 2018, respectively. The changes in the carrying amount of both goodwill andfranchise assets are related to the disposition of several franchised dealerships during the six months ended June 30, 2019. At December 31, 2018, we had approximately $4.0million of definite life intangible assets related to favorable lease agreements. As discussed in Note 1, “Summary of Significant Accounting Policies,” due to the adoption ofASC 842, “Leases,” effective January 1, 2019, previously existing definite life intangible assets have been reclassified from other intangible assets, net to right-of-use assets inthe accompanying unaudited condensed consolidated balance sheets as of June 30, 2019.
6. Long-Term Debt
Long-term debt consists of the following:June 30, 2019 December 31, 2018
(In thousands)
2016 Revolving Credit Facility (1) $ — $ — 5.0% Senior Subordinated Notes due 2023 (the “5.0% Notes”) 289,273 289,273 6.125% Senior Subordinated Notes due 2027 (the “6.125% Notes”) 250,000 250,000 Mortgage notes to finance companies - fixed rate, bearing interest from 3.51% to 7.03% 208,788 215,196 Mortgage notes to finance companies - variable rate, bearing interest at 1.50 to 2.90 percentage points above one-monthor three-month LIBOR 175,933 180,959 Other (2) — 20,589 Subtotal $ 923,994 $ 956,017 Debt issuance costs (9,743) (10,934)Total debt $ 914,251 $ 945,083
Less current maturities of long-term debt (62,968) (26,304)
Long-term debt $ 851,283 $ 918,779
(1) The interest rate on the 2016 Revolving Credit Facility (as defined below) was 200 basis points and 250 basis points above LIBOR at June 30, 2019 and December 31, 2018,respectively.
(2) As discussed in Note 1, “Summary of Significant Accounting Policies,” due to the adoption of ASC 842, “Leases,” effective January 1, 2019, previously existing capitallease liabilities have been reclassified from current maturities of long-term debt and long-term debt to current lease liabilities and long-term lease liabilities in theaccompanying unaudited condensed consolidated balance sheets as of June 30, 2019.
2016 Credit Facilities
On November 30, 2016, we entered into an amended and restated syndicated revolving credit facility (the “2016 Revolving Credit Facility”) and amended and restatedsyndicated new and used vehicle floor plan credit facilities (the “2016 Floor Plan Facilities” and, together with the 2016 Revolving Credit Facility, the “2016 Credit Facilities”),which are scheduled to mature on November 30, 2021.
Availability under the 2016 Revolving Credit Facility is calculated as the lesser of $250.0 million or a borrowing base calculated based on certain eligible assets, less theaggregate face amount of any outstanding letters of credit under the 2016 Revolving Credit Facility (the “2016 Revolving Borrowing Base”). The 2016 Revolving CreditFacility may be increased at our option up to $300.0 million upon satisfaction of certain conditions. As of June 30, 2019, the 2016 Revolving Borrowing Base wasapproximately $217.2 million based on balances as of such date. As of June 30, 2019, we had no outstanding borrowings and approximately $14.6 million in outstanding lettersof credit under the 2016 Revolving Credit Facility, resulting in total borrowing availability of approximately $202.6 million under the 2016 Revolving Credit Facility.
14

SONIC AUTOMOTIVE, INC.NOTES TO UNAUDITED CONDENSED CONSOLIDATED FINANCIAL STATEMENTS
The 2016 Floor Plan Facilities are comprised of a new vehicle revolving floor plan facility (the “2016 New Vehicle Floor Plan Facility”) and a used vehicle revolvingfloor plan facility (the “2016 Used Vehicle Floor Plan Facility”), subject to a borrowing base, in a combined amount of up to $1.015 billion. We may, under certain conditions,request an increase in the 2016 Floor Plan Facilities to a maximum borrowing limit of up to $1.265 billion, which shall be allocated between the 2016 New Vehicle Floor PlanFacility and the 2016 Used Vehicle Floor Plan Facility as we request, with no more than 30% of the aggregate commitments allocated to the commitments under the 2016 UsedVehicle Floor Plan Facility. Outstanding obligations under the 2016 Floor Plan Facilities are guaranteed by us and certain of our subsidiaries and are secured by a pledge ofsubstantially all of our and our subsidiaries’ assets. The amounts outstanding under the 2016 Credit Facilities bear interest at variable rates based on specified percentages aboveLIBOR.
We agreed under the 2016 Credit Facilities not to pledge any assets to any third parties (other than those explicitly allowed under the amended terms of the 2016 CreditFacilities), including other lenders, subject to certain stated exceptions, including floor plan financing arrangements. In addition, the 2016 Credit Facilities contain certainnegative covenants, including covenants which could restrict or prohibit indebtedness, liens, the payment of dividends, capital expenditures and material dispositions andacquisitions of assets, as well as other customary covenants and default provisions. Specifically, the 2016 Credit Facilities permit cash dividends on our Class A and Class BCommon Stock so long as no event of default (as defined in the 2016 Credit Facilities) has occurred and is continuing and provided that we remain in compliance with allfinancial covenants under the 2016 Credit Facilities.
5.0% Notes
On May 9, 2013, we issued $300.0 million in aggregate principal amount of unsecured senior subordinated 5.0% Notes which mature on May 15, 2023. The 5.0% Noteswere issued at a price of 100.0% of the principal amount thereof. Balances outstanding under the 5.0% Notes are guaranteed by all of our domestic operating subsidiaries. Theseguarantees are full and unconditional and joint and several. The parent company has no independent assets or operations. The non-domestic operating subsidiary that is not aguarantor is considered to be minor. Interest on the 5.0% Notes is payable semi-annually in arrears on May 15 and November 15 of each year. During 2016, we repurchasedapproximately $10.7 million of the outstanding 5.0% Notes for approximately $10.6 million in cash, plus accrued and unpaid interest related thereto.
We may redeem the remaining outstanding 5.0% Notes, in whole or in part, at any time on at the following redemption prices, which are expressed as percentages of theprincipal amount:
Redemption Price
Beginning on May 15, 2019 101.667 %Beginning on May 15, 2020 100.833 %Beginning on May 15, 2021 and thereafter 100.000 %
The indenture governing the 5.0% Notes provides that holders of the 5.0% Notes may require us to repurchase the 5.0% Notes at a purchase price equal to 101.0% of theaggregate principal amount of the 5.0% Notes, plus accrued and unpaid interest, if any, to the date of purchase if we undergo a Change of Control (as defined in the indenturegoverning the 5.0% Notes).
The indenture governing the 5.0% Notes contains certain specified restrictive covenants. We have agreed not to pledge any assets to any third-party lender of seniorsubordinated debt except under certain limited circumstances. We also have agreed to certain other limitations or prohibitions concerning the incurrence of other indebtedness,guarantees, liens, certain types of investments, certain transactions with affiliates, mergers, consolidations, issuance of preferred stock, cash dividends to stockholders,distributions, redemptions and the sale, assignment, lease, conveyance or disposal of certain assets. Specifically, the indenture governing the 5.0% Notes limits our ability to payquarterly cash dividends on our Class A and Class B Common Stock in excess of $ 0.10 per share. We may only pay quarterly cash dividends on our Class A and Class BCommon Stock if we comply with the terms of the indenture governing the 5.0% Notes. We were in compliance with all restrictive covenants in the indenture governing the5.0% Notes as of June 30, 2019.
Our obligations under the 5.0% Notes may be accelerated by the holders of 25% of the outstanding principal amount of the 5.0% Notes then outstanding if certain eventsof default occur, including: (1) defaults in the payment of principal or interest when due; (2) defaults in the performance, or breach, of our covenants under the 5.0% Notes; and(3) certain defaults under other agreements under which we or our subsidiaries have outstanding indebtedness in excess of $50.0 million.
15

SONIC AUTOMOTIVE, INC.NOTES TO UNAUDITED CONDENSED CONSOLIDATED FINANCIAL STATEMENTS
6.125% Notes
On March 10, 2017, we issued $250.0 million in aggregate principal amount of unsecured senior subordinated 6.125% Notes which mature on March 15, 2027. The6.125% Notes were issued at a price of 100.0% of the principal amount thereof. Balances outstanding under the 6.125% Notes are guaranteed by all of our domestic operatingsubsidiaries. These guarantees are full and unconditional and joint and several. The parent company has no independent assets or operations. The non-domestic operatingsubsidiary that is not a guarantor is considered to be minor. Interest on the 6.125% Notes is payable semi-annually in arrears on March 15 and September 15 of each year.
We may redeem the 6.125% Notes, in whole or in part, at any time on or after March 15, 2022 at the following redemption prices, which are expressed as percentages ofthe principal amount:
Redemption Price
Beginning on March 15, 2022 103.063 %Beginning on March 15, 2023 102.042 %Beginning on March 15, 2024 101.021 %Beginning on March 15, 2025 and thereafter 100.000 %
Before March 15, 2022, we may redeem all or a part of the 6.125% Notes at a redemption price equal to 100.0% of the principal amount of the 6.125% Notes redeemed,plus the Applicable Premium (as defined in the indenture governing the 6.125% Notes) and any accrued and unpaid interest, if any, to the redemption date. In addition, on orbefore March 15, 2020, we may redeem up to 35% of the aggregate principal amount of the 6.125% Notes at a redemption price equal to 106.125% of the aggregate principalamount of the 6.125% Notes redeemed, plus accrued and unpaid interest, if any, to the redemption date with proceeds from certain equity offerings. The indenture governing the6.125% Notes also provides that holders of the 6.125% Notes may require us to repurchase the 6.125% Notes at a purchase price equal to 101.0% of the aggregate principalamount of the 6.125% Notes, plus accrued and unpaid interest, if any, to the date of purchase if we undergo a Change of Control (as defined in the indenture governing the6.125% Notes).
The indenture governing the 6.125% Notes contains certain specified restrictive covenants. We have agreed not to pledge any assets to any third-party lender of seniorsubordinated debt except under certain limited circumstances. We also have agreed to certain other limitations or prohibitions concerning the incurrence of other indebtedness,guarantees, liens, certain types of investments, certain transactions with affiliates, mergers, consolidations, issuance of preferred stock, cash dividends to stockholders,distributions, redemptions and the sale, assignment, lease, conveyance or disposal of certain assets. Specifically, the indenture governing the 6.125% Notes limits our ability topay quarterly cash dividends on our Class A and Class B Common Stock in excess of $ 0.12 per share. We may only pay quarterly cash dividends on our Class A and Class BCommon Stock if we comply with the terms of the indenture governing the 6.125% Notes. We were in compliance with all restrictive covenants in the indenture governing the6.125% Notes as of June 30, 2019.
Our obligations under the 6.125% Notes may be accelerated by the holders of 25% of the outstanding principal amount of the 6.125% Notes then outstanding if certainevents of default occur, including: (1) defaults in the payment of principal or interest when due; (2) defaults in the performance, or breach, of our covenants under the 6.125%Notes; and (3) certain defaults under other agreements under which we or our subsidiaries have outstanding indebtedness in excess of $50.0 million.
Mortgage Notes
As of June 30, 2019, the weighted-average interest rate was 4.64% and the total outstanding mortgage principal balance was approximately $384.7 million. Thesemortgage notes require monthly payments of principal and interest through their respective maturities, are secured by the underlying properties and contain certain cross-defaultprovisions. Maturity dates for these mortgage notes range between 2019 and 2033.
Covenants
Under the 2016 Credit Facilities, we agreed not to pledge any assets to any third parties (other than those explicitly allowed under the amended terms of the 2016 CreditFacilities), including other lenders, subject to certain stated exceptions, including floor plan financing arrangements. In addition, the 2016 Credit Facilities contain certainnegative covenants, including covenants which could restrict or prohibit indebtedness, liens, the payment of dividends, capital expenditures and material dispositions andacquisitions of assets, as well as other customary covenants and default provisions.
16

SONIC AUTOMOTIVE, INC.NOTES TO UNAUDITED CONDENSED CONSOLIDATED FINANCIAL STATEMENTS
We were in compliance with the financial covenants under the 2016 Credit Facilities as of June 30, 2019. The financial covenants include required specified ratios (aseach is defined in the 2016 Credit Facilities) of:
Covenant
Minimum ConsolidatedLiquidity Ratio
Minimum ConsolidatedFixed Charge Coverage
Ratio
Maximum ConsolidatedTotal Lease Adjusted
Leverage Ratio
Required ratio 1.05 1.20 5.75 June 30, 2019 actual 1.17 1.55 4.20
The 2016 Credit Facilities contain events of default, including cross defaults to other material indebtedness, change of control events and other events of defaultcustomary for syndicated commercial credit facilities. Upon the future occurrence of an event of default, we could be required to immediately repay all outstanding amountsunder the 2016 Credit Facilities.
After giving effect to the applicable restrictions on the payment of dividends under our debt agreements, as of June 30, 2019, we had approximately $206.8 million of netincome and retained earnings free of such restrictions. We were in compliance with all restrictive covenants under our debt agreements as of June 30, 2019.
In addition, many of our facility leases are governed by a guarantee agreement between the landlord and us that contains financial and operating covenants. The financialcovenants under the guarantee agreement are identical to those under the 2016 Credit Facilities with the exception of one financial covenant related to the ratio of EBTDAR toRent (as defined in the guarantee agreement) with a required ratio of no less than 1.50 to 1.00. As of June 30, 2019, the ratio was 4.50 to 1.00.
Derivative Instruments and Hedging Activities
Prior to March 9, 2018, we had outstanding interest rate cash flow swap agreements to effectively convert a portion of our LIBOR-based variable rate debt to a fixed rate(these interest rate cash flow swap agreements were terminated on March 9, 2018 with a net $4.8 million payment to us from the counterparties that is being amortized intointerest expense, other, net in the accompanying unaudited condensed consolidated statements of income over the initial term of the interest rate swap agreements). As of bothJune 30, 2019 and December 31, 2018, we had interest rate cap agreements to limit our exposure to increases in LIBOR rates above certain levels. Under the terms of theseinterest rate cash flow swap agreements and interest rate cap agreements, interest rates reset monthly. We paid cash premiums of approximately $ 2.8 million and $1.9 million inthe years ended December 31, 2018 and 2017, respectively, upon entering into new interest rate cap agreements. The total unamortized premium amounts related to theoutstanding interest rate caps were approximately $4.3 million and $4.6 million as of June 30, 2019 and December 31, 2018, respectively, and will be amortized into interestexpense, other, net in the accompanying unaudited condensed consolidated statements of income over the remaining term of the interest rate cap agreements. The fair value ofthe outstanding interest rate cap positions at June 30, 2019 was a net asset of approximately $0.7 million, with approximately $0.4 million included in other current assets andapproximately $0.3 million included in other assets in the accompanying unaudited condensed consolidated balance sheets. The fair value of the outstanding interest rate cappositions at December 31, 2018 was a net asset of approximately $4.8 million, with approximately $1.8 million included in other current assets and approximately $3.0 millionincluded in other assets in the accompanying unaudited condensed consolidated balance sheets.
Under the terms of the interest rate cap agreements, we will receive interest based on the following:
NotionalAmount Cap Rate (1) Receive Rate (2) Start Date End Date
(In millions)
$ 375.0 2.000% one-month LIBOR July 1, 2018 June 30, 2019$ 375.0 3.000% one-month LIBOR July 1, 2018 June 30, 2019$ 312.5 2.000% one-month LIBOR July 1, 2019 June 30, 2020$ 250.0 3.000% one-month LIBOR July 1, 2019 June 30, 2020$ 225.0 3.000% one-month LIBOR July 1, 2020 June 30, 2021$ 150.0 2.000% one-month LIBOR July 1, 2020 July 1, 2021$ 250.0 3.000% one-month LIBOR July 1, 2021 July 1, 2022
(1) Under these interest rate cap agreements, no payment from the counterparty will occur unless the stated receive rate exceeds the stated cap rate, in which case a net paymentto us from the counterparty, based on the spread between the
17

SONIC AUTOMOTIVE, INC.NOTES TO UNAUDITED CONDENSED CONSOLIDATED FINANCIAL STATEMENTS
receive rate and the cap rate, will be recognized as a reduction of interest expense, other, net in the accompanying unaudited condensed consolidated statements of income.(2) The one-month LIBOR rate was approximately 2.398% at June 30, 2019.
The interest rate caps are designated as cash flow hedges, and the changes in the fair value of these instruments are recorded in other comprehensive income (loss) in theaccompanying unaudited condensed consolidated statements of comprehensive income and are disclosed in the supplemental schedule of non-cash financing activities in theaccompanying unaudited condensed consolidated statements of cash flows. The incremental interest income (the excess of interest received above the cap rate) related to interestrate caps was approximately $0.5 million and $0.9 million for the three and six months ended June 30, 2019, respectively, and is included in interest expense, other, net in theaccompanying unaudited condensed consolidated statements of income and disclosed in the supplemental disclosures of cash flow information in the accompanying unauditedcondensed consolidated statements of cash flows. The incremental interest expense (the excess of interest paid over interest received on interest rate swaps, offset partially byinterest received above the cap rate) related to interest rate swaps and interest rate caps was approximately $0 and $0.1 million for the three and six months ended June 30, 2018,respectively, and is included in interest expense, other, net in the accompanying unaudited condensed consolidated statements of income, and disclosed in the supplementaldisclosures of cash flow information in the accompanying unaudited condensed consolidated statements of cash flows. The estimated net benefit expected to be reclassified outof accumulated other comprehensive income (loss) into results of operations during the next 12 months is approximately $2.4 million.
7. Commitments and Contingencies
Lease Exit Accruals
A significant number of our dealership properties are leased under long-term operating lease arrangements. Prior to January 1, 2019, when leased properties were nolonger utilized in operations, we recorded lease exit accruals. These situations could include the relocation of an existing facility or the sale of a dealership when the buyer willnot be subleasing the property for either the remaining term of the lease or for an amount equal to our obligation under the lease, or situations in which a facility is closed as aresult of the associated franchise being terminated by us or the manufacturer and no other operations continue on the leased property. The lease exit accruals represent thepresent value of the lease payments, net of estimated sublease rentals, for the remaining life of the operating leases and other accruals necessary to satisfy lease commitments tothe landlords. As of December 31, 2018, the net liability related to these lease exit accruals was approximately $4.6 million. As discussed in Note 1, “Summary of SignificantAccounting Policies,” due to the adoption of ASC 842, “Leases,” effective January 1, 2019, previously existing lease exit accruals have been reclassified from other accruedliabilities and other long-term liabilities to a reduction in right-of-use assets in the accompanying unaudited condensed consolidated balance sheet as of June 30, 2019. SinceJanuary 1, 2019, ROU assets have been evaluated for impairment consistent with the guidance of ASC 842, “Leases,” which is similar to our historical practice of recordinglease exit accruals. However, since January 1, 2019, instead of recording lease exit accruals, the result has been the reduction of the related ROU asset as an impairment charge.
A summary of the activity of operating lease exit accruals consists of the following:
(In thousands)Balance at December 31, 2018 $ 4,634 Effect of adoption of ASC 842, “Leases” (4,634)
Balance at June 30, 2019 $ —
Legal and Other Proceedings
Sonic is involved, and expects to continue to be involved, in various legal and administrative proceedings arising out of the conduct of its business, including regulatoryinvestigations and private civil actions brought by plaintiffs purporting to represent a potential class or for which a class has been certified. Although Sonic vigorously defendsitself in all legal and administrative proceedings, the outcomes of pending and future proceedings arising out of the conduct of Sonic’s business, including litigation withcustomers, employment-related lawsuits, contractual disputes, class actions, purported class actions and actions brought by governmental authorities, cannot be predicted withcertainty. An unfavorable resolution of one or more of these matters could have a material adverse effect on Sonic’s business, financial condition, results of operations, cashflows or prospects.
Included in other accrued liabilities and other long-term liabilities in the accompanying unaudited condensed consolidated balance sheet as of June 30, 2019 wasapproximately $1.4 million and $0.3 million, respectively, in reserves that Sonic was holding for pending proceedings. Included in other accrued liabilities and other long-termliabilities in the
18
SONIC AUTOMOTIVE, INC.NOTES TO UNAUDITED CONDENSED CONSOLIDATED FINANCIAL STATEMENTS
accompanying unaudited condensed consolidated balance sheet as of December 31, 2018 was approximately $2.1 million and $0.3 million, respectively, for such reserves.Except as reflected in such reserves, Sonic is currently unable to estimate a range of reasonably possible loss, or a range of reasonably possible loss in excess of the amountaccrued, for pending proceedings.
Guarantees and Indemnification Obligations
In accordance with the terms of Sonic’s operating lease agreements, Sonic’s dealership subsidiaries, acting as lessees, generally agree to indemnify the lessor fromcertain exposure arising as a result of the use of the leased premises, including environmental exposure and repairs to leased property upon termination of the lease. In addition,Sonic has generally agreed to indemnify the lessor in the event of a breach of the lease by the lessee.
In connection with dealership dispositions and facility relocations, certain of Sonic’s subsidiaries have assigned or sublet to the buyer their interests in real propertyleases associated with such dealerships. In general, the subsidiaries retain responsibility for the performance of certain obligations under such leases, including rent paymentsand repairs to leased property upon termination of the lease, to the extent that the assignee or sublessee does not perform. In the event an assignee or a sublessee does notperform its obligations, Sonic remains liable for such obligations.
In accordance with the terms of agreements entered into for the sale of Sonic’s dealerships, Sonic generally agrees to indemnify the buyer from certain liabilities andcosts arising subsequent to the date of sale, including environmental exposure and exposure resulting from the breach of representations or warranties made in accordance withthe agreements. While Sonic’s exposure with respect to environmental remediation and repairs is difficult to quantify, Sonic’s maximum exposure associated with these generalindemnifications was approximately $28.0 million and $13.2 million at June 30, 2019 and December 31, 2018, respectively. These indemnifications typically expire within aperiod of one to three years following the date of sale. The estimated fair value of these indemnifications was not material and the amount recorded for this contingency was notsignificant at June 30, 2019.
Sonic also guarantees the floor plan commitments of its 50%-owned joint venture, the amount of which was approximately $4.3 million at both June 30, 2019 andDecember 31, 2018.
8. Fair Value Measurements
In determining fair value, Sonic uses various valuation approaches, including market, income and/or cost approaches. “Fair Value Measurements and Disclosures” in theASC establishes a hierarchy for inputs used in measuring fair value that maximizes the use of observable inputs and minimizes the use of unobservable inputs by requiring thatthe most observable inputs be used when available. Observable inputs are inputs that market participants would use in pricing the asset or liability developed based on marketdata obtained from sources independent of Sonic. Unobservable inputs are inputs that reflect Sonic’s assumptions about the assumptions market participants would use inpricing the asset or liability developed based on the best information available in the circumstances. The hierarchy is broken down into three levels based on the reliability ofinputs as follows:
Level 1 – Valuations based on quoted prices in active markets for identical assets or liabilities that Sonic has the ability to access. Assets utilizing Level 1 inputs includemarketable securities that are actively traded, including Sonic’s stock or public bonds.
Level 2 – Valuations based on quoted prices in markets that are not active or for which all significant inputs are observable, either directly or indirectly. Assets andliabilities utilizing Level 2 inputs include cash flow swap instruments and deferred compensation plan balances.
Level 3 – Valuations based on inputs that are unobservable and significant to the overall fair value measurement. Asset and liability measurements utilizing Level 3inputs include those used in estimating fair value of non-financial assets and non-financial liabilities in purchase acquisitions, those used in assessing impairment of property,plant and equipment and other intangibles and those used in the reporting unit valuation in the annual goodwill impairment evaluation.
The availability of observable inputs can vary and is affected by a wide variety of factors. To the extent that valuation is based on models or inputs that are lessobservable or unobservable in the market, the determination of fair value requires more judgment. Accordingly, the degree of judgment required by Sonic in determining fairvalue is greatest for assets and liabilities categorized in Level 3. In certain cases, the inputs used to measure fair value may fall into different levels of the fair value hierarchy. Insuch cases, for disclosure purposes, the level in the fair value hierarchy within which the fair value measurement is disclosed is determined based on the lowest level input(Level 3 being the lowest level) that is significant to the fair value measurement.
19

SONIC AUTOMOTIVE, INC.NOTES TO UNAUDITED CONDENSED CONSOLIDATED FINANCIAL STATEMENTS
Fair value is a market-based measure considered from the perspective of a market participant who holds the asset or owes the liability rather than an entity-specificmeasure. Therefore, even when market assumptions are not readily available, Sonic’s own assumptions are set to reflect those that market participants would use in pricing theasset or liability at the measurement date. Sonic uses inputs that are current as of the measurement date, including during periods when the market may be abnormally high orabnormally low. Accordingly, fair value measurements can be volatile based on various factors that may or may not be within Sonic’s control.
Assets and liabilities recorded at fair value in the accompanying unaudited condensed consolidated balance sheets as of June 30, 2019 and December 31, 2018 are asfollows:
Fair Value Based on Significant Other Observable Inputs(Level 2)
June 30, 2019 December 31, 2018(In thousands)
Assets:Cash surrender value of life insurance policies (1) $ 31,836 $ 31,395 Interest rate caps designated as hedges (2) 703 4,839
Total assets $ 32,539 $ 36,234
Liabilities:Deferred compensation plan (3) $ 17,602 $ 19,848
Total liabilities $ 17,602 $ 19,848
(1) Included in other assets in the accompanying unaudited condensed consolidated balance sheets.(2) As of June 30, 2019, approximately $0.4 million and $0.3 million were included in other current assets and other assets, respectively, in the accompanying unaudited
condensed consolidated balance sheets. As of December 31, 2018, approximately $1.8 million and $3.0 million were included in other current assets and other assets,respectively, in the accompanying unaudited condensed consolidated balance sheets.
(3) Included in other long-term liabilities in the accompanying unaudited condensed consolidated balance sheets.
There were no instances during the six months ended June 30, 2019 which required a fair value measurement of assets ordinarily measured at fair value on a non-recurring basis. Therefore, the carrying value of assets measured at fair value on a non-recurring basis in the accompanying unaudited condensed consolidated balance sheet asof June 30, 2019 has not changed since December 31, 2018. These assets will be evaluated as of the annual valuation assessment date of October 1, 2019 or as events orchanges in circumstances require.
As of June 30, 2019 and December 31, 2018, the fair values of Sonic’s financial instruments, including receivables, notes receivable from finance contracts, notespayable – floor plan, trade accounts payable, borrowings under the revolving credit facilities and certain mortgage notes, approximated their carrying values due either to lengthof maturity or existence of variable interest rates that approximate prevailing market rates.
At June 30, 2019 and December 31, 2018, the fair value and carrying value of Sonic’s significant fixed rate long-term debt were as follows:June 30, 2019 December 31, 2018
Fair Value Carrying Value Fair Value Carrying Value(In thousands)
5.0% Notes (1) $ 290,719 $ 289,273 $ 262,515 $ 289,273 6.125% Notes (1) $ 246,250 $ 250,000 $ 216,250 $ 250,000 Mortgage Notes (2) $ 210,435 $ 208,788 $ 218,402 $ 215,196 Other (2) (3) $ — $ — $ 20,437 $ 20,588
(1) As determined by market quotations as of June 30, 2019 and December 31, 2018, respectively (Level 1).(2) As determined by discounted cash flows (Level 3) based on estimated current market interest rates for comparable instruments.(3) As discussed in Note 1, “Summary of Significant Accounting Policies,” due to the adoption of ASC 842, “Leases,” effective January 1, 2019, previously existing capital
lease liabilities have been reclassified from current maturities of long-term debt and long-term debt to current lease liabilities and long-term lease liabilities in theaccompanying unaudited condensed consolidated balance sheet as of June 30, 2019.
20
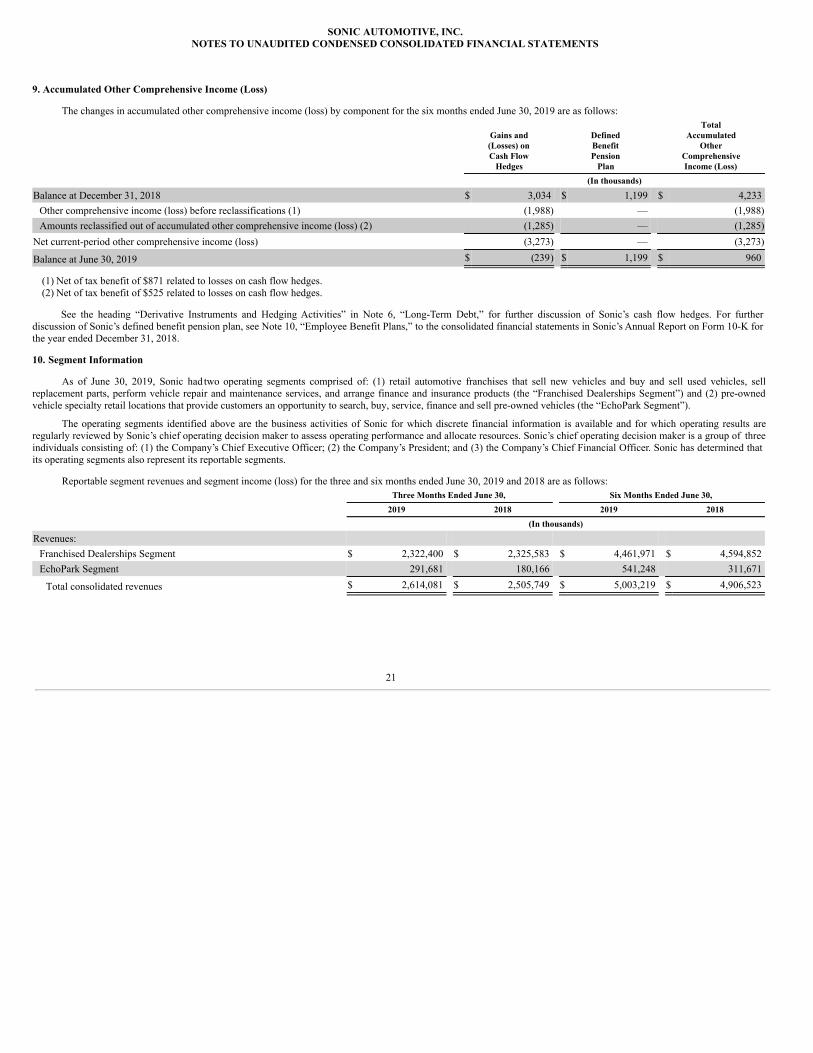
SONIC AUTOMOTIVE, INC.NOTES TO UNAUDITED CONDENSED CONSOLIDATED FINANCIAL STATEMENTS
9. Accumulated Other Comprehensive Income (Loss)
The changes in accumulated other comprehensive income (loss) by component for the six months ended June 30, 2019 are as follows:
Gains and(Losses) onCash Flow
Hedges
DefinedBenefitPension
Plan
TotalAccumulated
OtherComprehensiveIncome (Loss)
(In thousands)
Balance at December 31, 2018 $ 3,034 $ 1,199 $ 4,233 Other comprehensive income (loss) before reclassifications (1) (1,988) — (1,988)Amounts reclassified out of accumulated other comprehensive income (loss) (2) (1,285) — (1,285)
Net current-period other comprehensive income (loss) (3,273) — (3,273)
Balance at June 30, 2019 $ (239) $ 1,199 $ 960
(1) Net of tax benefit of $871 related to losses on cash flow hedges.(2) Net of tax benefit of $525 related to losses on cash flow hedges.
See the heading “Derivative Instruments and Hedging Activities” in Note 6, “Long-Term Debt,” for further discussion of Sonic’s cash flow hedges. For furtherdiscussion of Sonic’s defined benefit pension plan, see Note 10, “Employee Benefit Plans,” to the consolidated financial statements in Sonic’s Annual Report on Form 10-K forthe year ended December 31, 2018.
10. Segment Information
As of June 30, 2019, Sonic had two operating segments comprised of: (1) retail automotive franchises that sell new vehicles and buy and sell used vehicles, sellreplacement parts, perform vehicle repair and maintenance services, and arrange finance and insurance products (the “Franchised Dealerships Segment”) and (2) pre-ownedvehicle specialty retail locations that provide customers an opportunity to search, buy, service, finance and sell pre-owned vehicles (the “EchoPark Segment”).
The operating segments identified above are the business activities of Sonic for which discrete financial information is available and for which operating results areregularly reviewed by Sonic’s chief operating decision maker to assess operating performance and allocate resources. Sonic’s chief operating decision maker is a group of threeindividuals consisting of: (1) the Company’s Chief Executive Officer; (2) the Company’s President; and (3) the Company’s Chief Financial Officer. Sonic has determined thatits operating segments also represent its reportable segments.
Reportable segment revenues and segment income (loss) for the three and six months ended June 30, 2019 and 2018 are as follows:Three Months Ended June 30, Six Months Ended June 30,
2019 2018 2019 2018(In thousands)
Revenues:Franchised Dealerships Segment $ 2,322,400 $ 2,325,583 $ 4,461,971 $ 4,594,852 EchoPark Segment 291,681 180,166 541,248 311,671
Total consolidated revenues $ 2,614,081 $ 2,505,749 $ 5,003,219 $ 4,906,523
21

SONIC AUTOMOTIVE, INC.NOTES TO UNAUDITED CONDENSED CONSOLIDATED FINANCIAL STATEMENTS
Three Months Ended June 30, Six Months Ended June 30,2019 2018 2019 2018
(In thousands)
Segment income (loss) (1):Franchised Dealerships Segment (2) $ 48,326 $ 66,049 $ 121,856 $ 89,885 EchoPark Segment (3) 2,129 (27,347) 2,688 (41,672)
Total segment income (loss) 50,455 38,702 124,544 48,213 Interest expense, other, net (13,628) (13,375) (26,481) (26,831)Other income (expense), net (5) 17 95 106
Income (loss) from continuing operations before taxes $ 36,822 $ 25,344 $ 98,158 $ 21,488
(1) Segment income (loss) for each segment is defined as operating income (loss) less interest expense, floor plan.
(2) For the three months ended June 30, 2018, the above amount includes approximately $38.0 million of net gain on the disposal of franchised dealerships and approximately$2.6 million of benefit related to lease exit adjustments, offset partially by approximately $10.3 million of impairment expense and approximately $3.1 million of storm-related physical damage and legal costs.
For the six months ended June 30, 2019, the above amount includes approximately $46.7 million of net gain on the disposal of franchised dealerships and approximately $6.3million of executive transition costs. For the six months ended June 30, 2018, the above amount includes approximately $39.2 million of net gain on the disposal offranchised dealerships, offset partially by approximately $4.6 million of storm-related physical damage and legal costs, approximately $2.2 million of lease exit chargesand approximately $14.0 million of impairment expense.
(3) For the three months ended June 30, 2018, the above amount includes approximately $23.3 million of non-recurring compensation-related charges.
For the six months ended June 30, 2019, the above amount includes approximately $1.9 million of impairment expense. For the six months ended June 30, 2018, the aboveamount includes approximately $32.5 million of non-recurring compensation-related charges.
22

SONIC AUTOMOTIVE, INC.MANAGEMENT’S DISCUSSION AND ANALYSIS OF FINANCIAL CONDITION AND RESULTS OF OPERATIONS
Item 2. Management’s Discussion and Analysis of Financial Condition and Results of Operations.
The following discussion and analysis of our financial condition and results of operations should be read in conjunction with the accompanying unaudited condensedconsolidated financial statements and related notes thereto and “Item 1A. Risk Factors” in this report, as well as the consolidated financial statements and related notes thereto,“Item 1A. Risk Factors” and “Item 7. Management’s Discussion and Analysis of Financial Condition and Results of Operations” appearing in our Annual Report on Form 10-Kfor the year ended December 31, 2018.
Except to the extent that differences among operating segments are material to an understanding of our business taken as a whole, we present the discussion in thisManagement’s Discussion and Analysis of Financial Condition and Results of Operations on a consolidated basis.
Overview
We are one of the largest automotive retailers in the United States (as measured by total revenue). As a result of the way we manage our business, we had two operatingsegments as of June 30, 2019: (1) the Franchised Dealerships Segment and (2) the EchoPark Segment. For management and operational reporting purposes, we group certainbusinesses together that share management and inventory (principally used vehicles) into “stores.” As of June 30, 2019, we operated 92 stores in the Franchised DealershipsSegment and eight stores in the EchoPark Segment. The Franchised Dealerships Segment consists of 104 new vehicle franchises (representing 23 different brands of cars andlight trucks) and 15 collision repair centers in 13 states.
The Franchised Dealerships Segment provides comprehensive services, including (1) sales of both new and used cars and light trucks; (2) sales of replacement parts andperformance of vehicle maintenance, manufacturer warranty repairs, and paint and collision repair services (collectively, “Fixed Operations”); and (3) arrangement of extendedwarranties, service contracts, financing, insurance and other aftermarket products (collectively, “finance and insurance” or “F&I”) for our customers. The EchoPark Segmentsells used cars and light trucks and arranges F&I product sales for our customers in pre-owned vehicle specialty retail locations. Our EchoPark business operates independentlyfrom our franchised dealerships business. Sales operations in our first EchoPark market in Denver, Colorado began in the fourth quarter of 2014. As of June 30, 2019, we hadthree EchoPark stores in operation in Colorado, four in Texas and one in North Carolina. We believe that the continued expansion of our EchoPark business will provide long-term benefits to the Company, our stockholders and our guests.
Executive Summary
The U.S. retail automotive industry’s total new vehicle seasonally adjusted annual rate of sales (“SAAR”) decreased 1.2%, to 17.0 million vehicles, in the three monthsended June 30, 2019, compared to 17.2 million vehicles in the three months ended June 30, 2018, according to data from Bloomberg Financial Markets, provided by StephensInc. For 2019, analysts’ average industry expectation for the new vehicle SAAR ranges from 16.8 million to 17.0 million vehicles. We currently estimate the 2019 new vehicleSAAR will be between 16.5 million and 17.0 million vehicles. Changes in consumer confidence, replacement demand as a result of natural disasters, availability of consumerfinancing, manufacturer inventory production levels or incentive levels from automotive manufacturers could cause actual 2019 new vehicle SAAR to vary from expectations.Many factors, including brand and geographic concentrations as well as the industry sales mix between retail and fleet new vehicle unit sales volume, have caused our pastresults to differ from the industry’s overall trend. As a result of our minimal fleet new vehicle unit sales volume, we believe it is appropriate to compare our new vehicle unitsales volume to the retail new vehicle SAAR (which excludes fleet new vehicle sales). According to the Power Information Network (“PIN”) from J.D. Power, retail newvehicle SAAR was 13.5 million vehicles for the three months ended June 30, 2019, a decrease of 0.7% from the prior year period, and 13.1 million vehicles for the six monthsended June 30, 2019, a decrease of 3.0% from the prior year period.
As a result of the disposition, termination or closure of several franchised dealerships and EchoPark stores since June 30, 2018, the change in consolidated reportedamounts from period to period may not be indicative of the actual operational or financial performance of our current group of operating stores. Unless otherwise noted, alldiscussion of increases or decreases are for the three and six months ended June 30, 2019 and are compared to the same prior year period, as applicable. The followingdiscussion of new vehicles, used vehicles, wholesale vehicles, parts, service and collision repair, and finance, insurance and other, net are on a same store basis, except whereotherwise noted. All currently operating continuing operations stores (both our franchised dealerships and EchoPark stores) are included within the same store group in the firstfull month following the first anniversary of the store’s opening or acquisition.
New vehicle revenue increased 2.6% during the three months ended June 30, 2019, due to higher average selling prices, offset partially by a 2.4% decrease in newvehicle unit sales volume, and decreased 0.9% during the six months ended June 30,
23

SONIC AUTOMOTIVE, INC.MANAGEMENT’S DISCUSSION AND ANALYSIS OF FINANCIAL CONDITION AND RESULTS OF OPERATIONS
2019, driven primarily by a 5.2% decrease in new vehicle unit sales volume. New vehicle gross profit increased 1.6% during the three months ended June 30, 2019, drivenprimarily by a 4.1% increase in new vehicle gross profit per unit, and decreased 0.5% during the six months ended June 30, 2019, offset partially by a 5.0% increase in newvehicle gross profit per unit. New vehicle gross profit per unit increased $78 per unit, or 4.1%, to $1,983 per unit in the three months ended June 30, 2019, and increased $98per unit, or 5.0%, to $2,059 per unit in the six months ended June 30, 2019.
Retail used vehicle revenue increased 13.5% and 14.1% during the three and six months ended June 30, 2019, respectively. Retail used vehicle unit sales volumeincreased 13.5% during both the three and six months ended June 30, 2019, primarily driven by increased volumes at our franchised dealerships and EchoPark stores. Retailused vehicle unit sales volume at our EchoPark stores increased 42.9% and 55.8% in the three and six months ended June 30, 2019, respectively, and increased 6.1% and 4.2%at our franchised dealerships in the three and six months ended June 30, 2019, respectively. Retail used vehicle gross profit decreased 0.4% during the three months ended June30, 2019, primarily driven by lower retail used vehicle gross profit per unit as a result of the increasing impact of the EchoPark inventory acquisition and pricing strategy onconsolidated results as EchoPark unit sales volume continues to grow. Retail used vehicle gross profit increased 1.2% during the six months ended June 30, 2019, primarilydriven by an increase in retail used vehicle unit sales volume. Retail used vehicle gross profit per unit decreased $125 per unit, or 12.2%, to $897 per unit in the three monthsended June 30, 2019 and decreased $112 per unit, or 10.8%, to $921 per unit in the six months ended June 30, 2019, driven primarily by a shift in the inventory acquisition andpricing strategy at our EchoPark stores which reduces front-end gross profit per unit but increases unit sales volume and F&I gross profit, more than offsetting the decrease infront-end gross profit. Wholesale vehicle gross loss decreased approximately $2.4 million during the three months ended June 30, 2019, primarily driven by a decrease inwholesale vehicle gross loss per unit of $335, or 81.3%. Wholesale vehicle gross loss decreased approximately $5.2 million during the six months ended June 30, 2019,primarily driven by higher wholesale vehicle gross loss in the first quarter of 2018 as a result of market pricing declines, inventory supply and allocation challenges related to theHouston market following the effects of Hurricane Harvey. We focus on maintaining used vehicle inventory days’ supply in the 30 to 40 day range in order to limit our exposureto market pricing volatility. Our used vehicle inventory days’ supply was approximately 28 and 29 days as of June 30, 2019 and 2018, respectively.
Fixed Operations revenue increased 6.0% and 4.2% during the three and six months ended June 30, 2019, respectively. Fixed Operations gross profit increased 6.4% and4.2% during the three and six months ended June 30, 2019, respectively, driven primarily by a 7.9% and 6.6% increase in customer pay (as hereinafter defined) gross profit,respectively. Fixed Operations gross margin increased 20-basis points, to 48.2%, during the three months ended June 30, 2019 and was 48.0%, flat for the six months endedJune 30, 2019.
F&I revenue increased 13.6% and 13.8% during the three and six months ended June 30, 2019, respectively, driven primarily by an increase in F&I gross profit per retailunit. F&I gross profit per retail unit increased $108 per unit, or 7.0%, to $1,644 per unit, for the three months ended June 30, 2019, and increased $127 per unit, or 8.4%, to$1,631 per unit, for the six months ended June 30, 2019. We believe that our proprietary software applications, playbook processes, customer-centric selling approach and ourEchoPark inventory acquisition and pricing strategy enable us to maximize gross profit per F&I contract and penetration rates (the number of F&I products sold per vehicle)across our F&I product lines. We believe that we will continue to increase revenue in this area as we refine our processes, train our associates and continue to sell high levels ofretail new and used vehicles at our stores.
The tables below list other items of interest that affected reported amounts in the accompanying unaudited condensed consolidated statements of income:
Three Months Ended June 30, 2019 Three Months Ended June 30, 2018(Amounts are before the effect of
income taxes)Franchised
Dealerships Segment EchoPark Segment TotalFranchised
Dealerships Segment EchoPark Segment TotalIncome Statement Line
Impacted(In thousands)
Gain on franchise disposals $ — $ — $ — $ 38,048 $ — $ 38,048 SG&A expenses
Long-term compensation charges — — — — (23,333) (23,333) SG&A expenses
Impairment charges — — — (10,315) — (10,315) Impairment charges
Lease exit adjustments — — — 2,579 — 2,579 SG&A expenses
Legal and storm damage charges — — — (3,064) — (3,064) SG&A expenses
24

SONIC AUTOMOTIVE, INC.MANAGEMENT’S DISCUSSION AND ANALYSIS OF FINANCIAL CONDITION AND RESULTS OF OPERATIONS
Six Months Ended June 30, 2019 Six Months Ended June 30, 2018(Amounts are before the effect of
income taxes)Franchised
Dealerships Segment EchoPark Segment TotalFranchised
Dealerships Segment EchoPark Segment TotalIncome Statement Line
Impacted(In thousands)
Gain on franchise disposals $ 46,680 $ — $ 46,680 $ 39,239 $ — $ 39,239 SG&A expenses
Executive transition costs (6,264) — (6,264) — — — SG&A expenses
Long-term compensation charges — — — — (32,522) (32,522) SG&A expenses
Impairment charges — (1,926) (1,926) (13,876) (82) (13,958) Impairment charges
Lease exit adjustments — — — (2,235) — (2,235) SG&A expenses
Legal and storm damage charges — — — (4,564) — (4,564) SG&A expenses
The following table depicts the breakdown of our new vehicle revenues from continuing operations by brand for the three and six months ended June 30, 2019 and 2018:Three Months Ended June 30, Six Months Ended June 30,
Brand 2019 2018 2019 2018
Luxury:BMW 24.0 % 19.3 % 22.7 % 19.2 %Mercedes 12.0 % 11.1 % 12.1 % 11.0 %Audi 6.9 % 6.6 % 6.8 % 6.4 %Lexus 4.6 % 6.1 % 4.8 % 5.7 %Land Rover 4.1 % 4.3 % 4.5 % 4.6 %Porsche 2.6 % 2.4 % 2.9 % 2.4 %Cadillac 2.4 % 2.3 % 2.3 % 2.4 %MINI 1.1 % 1.3 % 1.1 % 1.3 %Other luxury (1) 2.8 % 3.1 % 2.8 % 2.9 %
Total Luxury 60.5 % 56.5 % 60.0 % 55.9 %Mid-line Import:
Honda 16.5 % 17.1 % 16.5 % 17.4 %Toyota 9.4 % 10.4 % 9.4 % 10.6 %Volkswagen 1.6 % 2.1 % 1.6 % 2.1 %Hyundai 1.6 % 1.6 % 1.6 % 1.5 %Other imports (2) 0.8 % 1.9 % 1.4 % 1.8 %
Total Mid-line Import 29.9 % 33.1 % 30.5 % 33.4 %Domestic:
Ford 5.0 % 5.6 % 4.9 % 6.0 %General Motors (“GM”) (3) 4.6 % 4.8 % 4.6 % 4.7 %
Total Domestic 9.6 % 10.4 % 9.5 % 10.7 %
Total 100.0 % 100.0 % 100.0 % 100.0 %
(1) Includes Volvo, Acura, Infiniti and Jaguar.(2) Includes Nissan, Kia and Subaru.(3) Includes Buick, Chevrolet and GMC.
Results of Operations
As a result of the disposition, termination or closure of several franchised dealerships and EchoPark stores since June 30, 2018, the change in consolidated reportedamounts from period to period may not be indicative of the actual operational or financial performance of our current group of operating stores. Please refer to the same storetables and discussion on the following pages for more meaningful comparison and discussion of financial results on a comparable store basis.
Unless otherwise noted, all discussion of increases or decreases are for the three and six months ended June 30, 2019 and are compared to the same prior year period, asapplicable. The following discussion of new vehicles, used vehicles, wholesale
25

SONIC AUTOMOTIVE, INC.MANAGEMENT’S DISCUSSION AND ANALYSIS OF FINANCIAL CONDITION AND RESULTS OF OPERATIONS
vehicles, parts, service and collision repair, and finance, insurance and other, net are on a same store basis, except where otherwise noted. All currently operating continuingoperations stores (both our franchised dealerships and EchoPark stores) are included within the same store group in the first full month following the first anniversary of thestore’s opening or acquisition.
Results of Operations – Consolidated
New Vehicles – Consolidated
The retail automotive industry uses the total new vehicle SAAR to measure the annual amount of expected new vehicle unit sales activity (both retail and fleet sales)within the United States. The total and retail SAAR below reflect all brands marketed or sold in the United States. The total and retail SAAR include brands we do not sell andmarkets in which we do not operate; therefore, our new vehicle sales may not trend directly in line with the total and retail SAAR. We believe that retail SAAR is a moremeaningful metric for comparing our new vehicle unit sales volume to the industry due to our minimal fleet vehicle business.
Three Months Ended June 30, Better / (Worse) Six Months Ended June 30, Better / (Worse)2019 2018 % Change 2019 2018 % Change
(In millions of vehicles)
Retail SAAR (1) 13.5 13.6 (0.7) % 13.1 13.5 (3.0) %Fleet SAAR 3.5 3.6 (2.8) % 3.9 3.6 8.3 %Total SAAR (2) 17.0 17.2 (1.2) % 17.0 17.1 (0.6) %
(1) Source: PIN from J.D. Power(2) Source: Bloomberg Financial Markets, provided by Stephens Inc.
The following tables provide a reconciliation of consolidated same store basis and reported basis for total new vehicles (combined retail and fleet data):Three Months Ended June 30, Better / (Worse)
2019 2018 Change % Change(In thousands, except unit data)
Total new vehicle revenue:Same store $ 1,200,352 $ 1,170,278 $ 30,074 2.6 %Acquisitions, open points and dispositions 4,402 68,293 (63,891) NM
Total as reported $ 1,204,754 $ 1,238,571 $ (33,817) (2.7)%Total new vehicle gross profit:
Same store $ 55,803 $ 54,904 $ 899 1.6 %Acquisitions, open points and dispositions 597 2,364 (1,767) NM
Total as reported $ 56,400 $ 57,268 $ (868) (1.5)%Total new vehicle unit sales:
Same store 28,134 28,826 (692) (2.4)%Acquisitions, open points and dispositions 62 2,051 (1,989) NM
Total as reported 28,196 30,877 (2,681) (8.7)%
NM = Not Meaningful
26

SONIC AUTOMOTIVE, INC.MANAGEMENT’S DISCUSSION AND ANALYSIS OF FINANCIAL CONDITION AND RESULTS OF OPERATIONS
Six Months Ended June 30, Better / (Worse)2019 2018 Change % Change
(In thousands, except unit data)
Total new vehicle revenue:Same store $ 2,248,029 $ 2,267,998 $ (19,969) (0.9)%Acquisitions, open points and dispositions 23,059 151,418 (128,359) NM
Total as reported $ 2,271,088 $ 2,419,416 $ (148,328) (6.1)%Total new vehicle gross profit:
Same store $ 108,763 $ 109,282 $ (519) (0.5)%Acquisitions, open points and dispositions 1,433 4,785 (3,352) NM
Total as reported $ 110,196 $ 114,067 $ (3,871) (3.4)%Total new vehicle unit sales:
Same store 52,829 55,736 (2,907) (5.2)%Acquisitions, open points and dispositions 564 4,641 (4,077) NM
Total as reported 53,393 60,377 (6,984) (11.6)%NM = Not Meaningful
Our consolidated reported new vehicle results (combined retail and fleet data) are as follows:
Three Months Ended June 30, Better / (Worse)2019 2018 Change % Change
(In thousands, except unit and per unit data)
Reported new vehicle:Revenue $ 1,204,754 $ 1,238,571 $ (33,817) (2.7)%Gross profit $ 56,400 $ 57,268 $ (868) (1.5)%Unit sales 28,196 30,877 (2,681) (8.7)%Revenue per unit $ 42,728 $ 40,113 $ 2,615 6.5 %Gross profit per unit $ 2,000 $ 1,855 $ 145 7.8 %Gross profit as a % of revenue 4.7 % 4.6 % 10 bps
Six Months Ended June 30, Better / (Worse)2019 2018 Change % Change
(In thousands, except unit and per unit data)
Reported new vehicle:Revenue $ 2,271,088 $ 2,419,416 $ (148,328) (6.1)%Gross profit $ 110,196 $ 114,067 $ (3,871) (3.4)%Unit sales 53,393 60,377 (6,984) (11.6)%Revenue per unit $ 42,535 $ 40,072 $ 2,463 6.1 %Gross profit per unit $ 2,064 $ 1,889 $ 175 9.3 %Gross profit as a % of revenue 4.9 % 4.7 % 20 bps
27

SONIC AUTOMOTIVE, INC.MANAGEMENT’S DISCUSSION AND ANALYSIS OF FINANCIAL CONDITION AND RESULTS OF OPERATIONS
Our consolidated same store new vehicle results (combined retail and fleet data) are as follows:Three Months Ended June 30, Better / (Worse)
2019 2018 Change % Change(In thousands, except unit and per unit data)
Same store new vehicle:Revenue $ 1,200,352 $ 1,170,278 $ 30,074 2.6 %Gross profit $ 55,803 $ 54,904 $ 899 1.6 %Unit sales 28,134 28,826 (692) (2.4)%Revenue per unit $ 42,666 $ 40,598 $ 2,068 5.1 %Gross profit per unit $ 1,983 $ 1,905 $ 78 4.1 %Gross profit as a % of revenue 4.6 % 4.7 % (10) bps
Six Months Ended June 30, Better / (Worse)2019 2018 Change % Change
(In thousands, except unit and per unit data)
Same store new vehicle:Revenue $ 2,248,029 $ 2,267,998 $ (19,969) (0.9)%Gross profit $ 108,763 $ 109,282 $ (519) (0.5)%Unit sales 52,829 55,736 (2,907) (5.2)%Revenue per unit $ 42,553 $ 40,692 $ 1,861 4.6 %Gross profit per unit $ 2,059 $ 1,961 $ 98 5.0 %Gross profit as a % of revenue 4.8 % 4.8 % — bps
For further analysis of new vehicle results, see the tables and discussion under the heading “New Vehicles – Franchised Dealerships Segment” in the FranchisedDealerships Segment section below.
Used Vehicles – Consolidated
Used vehicle revenues are directly affected by a number of factors, including the level of manufacturer incentives on new vehicles, the number and quality of trade-insand lease turn-ins, the availability and pricing of used vehicles acquired at auction and the availability of consumer credit.
28

SONIC AUTOMOTIVE, INC.MANAGEMENT’S DISCUSSION AND ANALYSIS OF FINANCIAL CONDITION AND RESULTS OF OPERATIONS
The following tables provides a reconciliation of consolidated same store basis and reported basis for retail used vehicles:Three Months Ended June 30, Better / (Worse)
2019 2018 Change % Change(In thousands, except unit data)
Total used vehicle revenue:Same store $ 826,666 $ 728,393 $ 98,273 13.5 %Acquisitions, open points and dispositions 58,961 34,179 24,782 NM
Total as reported $ 885,627 $ 762,572 $ 123,055 16.1 %Total used vehicle gross profit:
Same store $ 34,540 $ 34,677 $ (137) (0.4)%Acquisitions, open points and dispositions 2,189 2,632 (443) NM
Total as reported $ 36,729 $ 37,309 $ (580) (1.6)%Total used vehicle unit sales:
Same store 38,517 33,930 4,587 13.5 %Acquisitions, open points and dispositions 2,941 1,849 1,092 NM
Total as reported 41,458 35,779 5,679 15.9 %
NM = Not Meaningful
Six Months Ended June 30, Better / (Worse)2019 2018 Change % Change
(In thousands, except unit data)
Total used vehicle revenue:Same store $ 1,591,287 $ 1,394,490 $ 196,797 14.1 %Acquisitions, open points and dispositions 114,705 77,128 37,577 NM
Total as reported $ 1,705,992 $ 1,471,618 $ 234,374 15.9 %Total used vehicle gross profit:
Same store $ 68,263 $ 67,477 $ 786 1.2 %Acquisitions, open points and dispositions 5,473 6,603 (1,130) NM
Total as reported $ 73,736 $ 74,080 $ (344) (0.5)%Total used vehicle unit sales:
Same store 74,126 65,293 8,833 13.5 %Acquisitions, open points and dispositions 5,795 4,225 1,570 NM
Total as reported 79,921 69,518 10,403 15.0 %NM = Not Meaningful
Our consolidated reported used vehicle results are as follows:Three Months Ended June 30, Better / (Worse)
2019 2018 Change % Change(In thousands, except unit and per unit data)
Reported used vehicle:Revenue $ 885,627 $ 762,572 $ 123,055 16.1 %Gross profit $ 36,729 $ 37,309 $ (580) (1.6)%Unit sales 41,458 35,779 5,679 15.9 %Revenue per unit $ 21,362 $ 21,313 $ 49 0.2 %Gross profit per unit $ 886 $ 1,043 $ (157) (15.1)%Gross profit as a % of revenue 4.1 % 4.9 % (80) bps
29

SONIC AUTOMOTIVE, INC.MANAGEMENT’S DISCUSSION AND ANALYSIS OF FINANCIAL CONDITION AND RESULTS OF OPERATIONS
Six Months Ended June 30, Better / (Worse)2019 2018 Change % Change
(In thousands, except unit and per unit data)
Reported used vehicle:Revenue $ 1,705,992 $ 1,471,618 $ 234,374 15.9 %Gross profit $ 73,736 $ 74,080 $ (344) (0.5)%Unit sales 79,921 69,518 10,403 15.0 %Revenue per unit $ 21,346 $ 21,169 $ 177 0.8 %Gross profit per unit $ 923 $ 1,066 $ (143) (13.4)%Gross profit as a % of revenue 4.3 % 5.0 % (70) bps
Our consolidated same store used vehicle results are as follows:Three Months Ended June 30, Better / (Worse)
2019 2018 Change % Change(In thousands, except unit and per unit data)
Same store used vehicle:Revenue $ 826,666 $ 728,393 $ 98,273 13.5 %Gross profit $ 34,540 $ 34,677 $ (137) (0.4)%Unit sales 38,517 33,930 4,587 13.5 %Revenue per unit $ 21,462 $ 21,468 $ (6) —%Gross profit per unit $ 897 $ 1,022 $ (125) (12.2)%Gross profit as a % of revenue 4.2 % 4.8 % (60) bps
Six Months Ended June 30, Better / (Worse)2019 2018 Change % Change
(In thousands, except unit and per unit data)
Same store used vehicle:Revenue $ 1,591,287 $ 1,394,490 $ 196,797 14.1 %Gross profit $ 68,263 $ 67,477 $ 786 1.2 %Unit sales 74,126 65,293 8,833 13.5 %Revenue per unit $ 21,467 $ 21,357 $ 110 0.5 %Gross profit per unit $ 921 $ 1,033 $ (112) (10.8)%Gross profit as a % of revenue 4.3 % 4.8 % (50) bps
For further analysis of used vehicle results, see the tables and discussion under the headings “Used Vehicles – Franchised Dealerships Segment” and “Used Vehicles andF&I – EchoPark Segment” in the Franchised Dealerships Segment and EchoPark Segment sections, respectively, below.
Wholesale Vehicles – Consolidated
Wholesale vehicle revenues are highly correlated with new and used vehicle retail sales and the associated trade-in volume. Wholesale vehicle revenues are alsosignificantly affected by our corporate inventory management strategy and policies, which are designed to optimize our total used vehicle inventory.
30
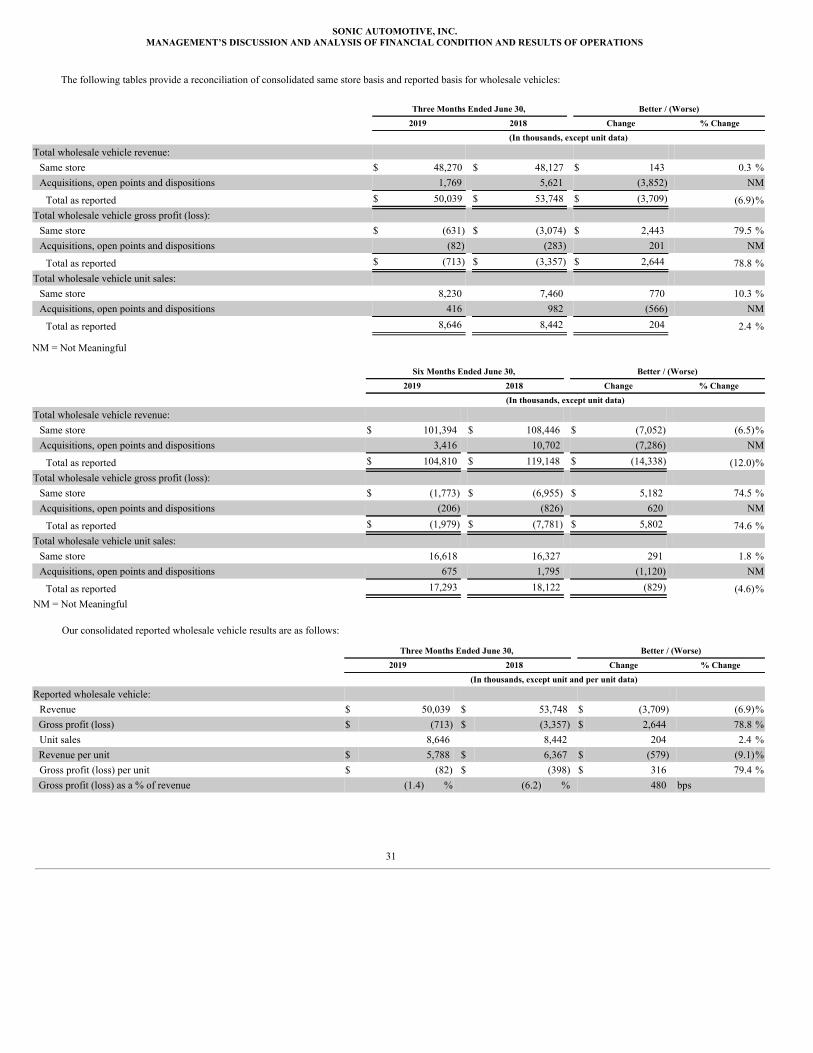
SONIC AUTOMOTIVE, INC.MANAGEMENT’S DISCUSSION AND ANALYSIS OF FINANCIAL CONDITION AND RESULTS OF OPERATIONS
The following tables provide a reconciliation of consolidated same store basis and reported basis for wholesale vehicles:
Three Months Ended June 30, Better / (Worse)2019 2018 Change % Change
(In thousands, except unit data)
Total wholesale vehicle revenue:Same store $ 48,270 $ 48,127 $ 143 0.3 %Acquisitions, open points and dispositions 1,769 5,621 (3,852) NM
Total as reported $ 50,039 $ 53,748 $ (3,709) (6.9)%Total wholesale vehicle gross profit (loss):
Same store $ (631) $ (3,074) $ 2,443 79.5 %Acquisitions, open points and dispositions (82) (283) 201 NM
Total as reported $ (713) $ (3,357) $ 2,644 78.8 %Total wholesale vehicle unit sales:
Same store 8,230 7,460 770 10.3 %Acquisitions, open points and dispositions 416 982 (566) NM
Total as reported 8,646 8,442 204 2.4 %
NM = Not Meaningful
Six Months Ended June 30, Better / (Worse)2019 2018 Change % Change
(In thousands, except unit data)
Total wholesale vehicle revenue:Same store $ 101,394 $ 108,446 $ (7,052) (6.5)%Acquisitions, open points and dispositions 3,416 10,702 (7,286) NM
Total as reported $ 104,810 $ 119,148 $ (14,338) (12.0)%Total wholesale vehicle gross profit (loss):
Same store $ (1,773) $ (6,955) $ 5,182 74.5 %Acquisitions, open points and dispositions (206) (826) 620 NM
Total as reported $ (1,979) $ (7,781) $ 5,802 74.6 %Total wholesale vehicle unit sales:
Same store 16,618 16,327 291 1.8 %Acquisitions, open points and dispositions 675 1,795 (1,120) NM
Total as reported 17,293 18,122 (829) (4.6)%NM = Not Meaningful
Our consolidated reported wholesale vehicle results are as follows:
Three Months Ended June 30, Better / (Worse)2019 2018 Change % Change
(In thousands, except unit and per unit data)
Reported wholesale vehicle:Revenue $ 50,039 $ 53,748 $ (3,709) (6.9)%Gross profit (loss) $ (713) $ (3,357) $ 2,644 78.8 %Unit sales 8,646 8,442 204 2.4 %Revenue per unit $ 5,788 $ 6,367 $ (579) (9.1)%Gross profit (loss) per unit $ (82) $ (398) $ 316 79.4 %Gross profit (loss) as a % of revenue (1.4) % (6.2) % 480 bps
31

SONIC AUTOMOTIVE, INC.MANAGEMENT’S DISCUSSION AND ANALYSIS OF FINANCIAL CONDITION AND RESULTS OF OPERATIONS
Six Months Ended June 30, Better / (Worse)2019 2018 Change % Change
(In thousands, except unit and per unit data)
Reported wholesale vehicle:Revenue $ 104,810 $ 119,148 $ (14,338) (12.0)%Gross profit (loss) $ (1,979) $ (7,781) $ 5,802 74.6 %Unit sales 17,293 18,122 (829) (4.6)%Revenue per unit $ 6,061 $ 6,575 $ (514) (7.8)%Gross profit (loss) per unit $ (114) $ (429) $ 315 73.4 %Gross profit (loss) as a % of revenue (1.9) % (6.5) % 460 bps
Our consolidated same store wholesale vehicle results are as follows:
Three Months Ended June 30, Better / (Worse)2019 2018 Change % Change
(In thousands, except unit and per unit data)
Same store wholesale vehicle:Revenue $ 48,270 $ 48,127 $ 143 0.3 %Gross profit (loss) $ (631) $ (3,074) $ 2,443 79.5 %Unit sales 8,230 7,460 770 10.3 %Revenue per unit $ 5,865 $ 6,451 $ (586) (9.1)%Gross profit (loss) per unit $ (77) $ (412) $ 335 81.3 %Gross profit (loss) as a % of revenue (1.3) % (6.4) % 510 bps
Six Months Ended June 30, Better / (Worse)2019 2018 Change % Change
(In thousands, except unit and per unit data)
Same store wholesale vehicle:Revenue $ 101,394 $ 108,446 $ (7,052) (6.5)%Gross profit (loss) $ (1,773) $ (6,955) $ 5,182 74.5 %Unit sales 16,618 16,327 291 1.8 %Revenue per unit $ 6,101 $ 6,642 $ (541) (8.1)%Gross profit (loss) per unit $ (107) $ (426) $ 319 74.9 %Gross profit (loss) as a % of revenue (1.7) % (6.4) % 470 bps
For further analysis of wholesale vehicle results, see the tables and discussion under the headings “Wholesale Vehicles – Franchised Dealerships Segment” and“Wholesale Vehicles – EchoPark Segment” in the Franchised Dealerships Segment and EchoPark Segment sections, respectively, below.
Fixed Operations – Consolidated
Parts, service and collision repair revenues consist of customer requested repair orders (“customer pay”), warranty repairs, wholesale parts and internal, sublet and other.Parts and service revenue is driven by the mix of warranty repairs versus customer pay repairs, available service capacity, vehicle quality, manufacturer recalls, customer loyaltyand prepaid maintenance programs. Internal, sublet and other primarily relates to preparation and reconditioning work performed on vehicles that are sold to customers. Whenthat work is performed by one of our dealerships or stores, the work is classified as internal. In the event the work is performed by a third party on our behalf, it is classified assublet.
We believe that, over time, vehicle quality will continue to improve, but vehicle complexity and the associated demand for repairs by qualified technicians at franchiseddealerships will offset any revenue lost from improvement in vehicle quality. We also believe that, over the long term, we have the ability to continue to add service capacity atour dealerships and stores to further increase revenues. Manufacturers continue to extend new vehicle warranty periods and have also begun to include regular maintenanceitems in the warranty or complimentary maintenance program coverage. These factors, over the long term,
32

SONIC AUTOMOTIVE, INC.MANAGEMENT’S DISCUSSION AND ANALYSIS OF FINANCIAL CONDITION AND RESULTS OF OPERATIONS
combined with the extended manufacturer warranties on certified pre-owned vehicles, should facilitate long-term growth in our parts and service business. Barriers to long-termgrowth may include reductions in the rate paid by manufacturers to dealers for warranty work performed, as well as the improved quality of vehicles that may affect the leveland frequency of future customer pay or warranty-related revenues.
The following tables provide a reconciliation of consolidated same store basis and reported basis for Fixed Operations:
Three Months Ended June 30, Better / (Worse)2019 2018 Change % Change
(In thousands)
Total Fixed Operations revenue:Same store $ 352,385 $ 332,282 $ 20,103 6.0 %Acquisitions, open points and dispositions 2,927 14,472 (11,545) NM
Total as reported $ 355,312 $ 346,754 $ 8,558 2.5 %Total Fixed Operations gross profit:
Same store $ 169,794 $ 159,577 $ 10,217 6.4 %Acquisitions, open points and dispositions 752 7,474 (6,722) NM
Total as reported $ 170,546 $ 167,051 $ 3,495 2.1 %
NM = Not Meaningful
Six Months Ended June 30, Better / (Worse)2019 2018 Change % Change
(In thousands)
Total Fixed Operations revenue:Same store $ 687,573 $ 659,839 $ 27,734 4.2 %Acquisitions, open points and dispositions 9,169 38,673 (29,504) NM
Total as reported $ 696,742 $ 698,512 $ (1,770) (0.3)%Total Fixed Operations gross profit:
Same store $ 329,802 $ 316,447 $ 13,355 4.2 %Acquisitions, open points and dispositions 3,980 20,232 (16,252) NM
Total as reported $ 333,782 $ 336,679 $ (2,897) (0.9)%NM = Not Meaningful
33

SONIC AUTOMOTIVE, INC.MANAGEMENT’S DISCUSSION AND ANALYSIS OF FINANCIAL CONDITION AND RESULTS OF OPERATIONS
Our consolidated reported Fixed Operations results are as follows:Three Months Ended June 30, Better / (Worse)
2019 2018 Change % Change(In thousands)
Reported Fixed Operations:Revenue
Customer pay $ 142,113 $ 140,351 $ 1,762 1.3 %Warranty 69,809 63,888 5,921 9.3 %Wholesale parts 40,027 40,844 (817) (2.0)%Internal, sublet and other 103,363 101,671 1,692 1.7 %
Total revenue $ 355,312 $ 346,754 $ 8,558 2.5 %Gross profit
Customer pay $ 77,652 $ 75,100 $ 2,552 3.4 %Warranty 39,039 35,871 3,168 8.8 %Wholesale parts 6,872 6,900 (28) (0.4)%Internal, sublet and other 46,983 49,180 (2,197) (4.5)%
Total gross profit $ 170,546 $ 167,051 $ 3,495 2.1 %Gross profit as a % of revenue
Customer pay 54.6 % 53.5 % 110 bpsWarranty 55.9 % 56.1 % (20) bpsWholesale parts 17.2 % 16.9 % 30 bpsInternal, sublet and other 45.5 % 48.4 % (290) bps
Total gross profit as a % of revenue 48.0 % 48.2 % (20) bps
Six Months Ended June 30, Better / (Worse)2019 2018 Change % Change
(In thousands)
Reported Fixed Operations:Revenue
Customer pay $ 279,834 $ 282,706 $ (2,872) (1.0)%Warranty 138,782 131,489 7,293 5.5 %Wholesale parts 79,325 83,345 (4,020) (4.8)%Internal, sublet and other 198,801 200,972 (2,171) (1.1)%
Total revenue $ 696,742 $ 698,512 $ (1,770) (0.3)%Gross profit
Customer pay $ 151,978 $ 151,449 $ 529 0.3 %Warranty 77,447 73,772 3,675 5.0 %Wholesale parts 13,668 14,165 (497) (3.5)%Internal, sublet and other 90,689 97,293 (6,604) (6.8)%
Total gross profit $ 333,782 $ 336,679 $ (2,897) (0.9)%Gross profit as a % of revenue
Customer pay 54.3 % 53.6 % 70 bpsWarranty 55.8 % 56.1 % (30) bpsWholesale parts 17.2 % 17.0 % 20 bpsInternal, sublet and other 45.6 % 48.4 % (280) bps
Total gross profit as a % of revenue 47.9 % 48.2 % (30) bps
34

SONIC AUTOMOTIVE, INC.MANAGEMENT’S DISCUSSION AND ANALYSIS OF FINANCIAL CONDITION AND RESULTS OF OPERATIONS
Our consolidated same store Fixed Operations results are as follows:Three Months Ended June 30, Better / (Worse)
2019 2018 Change % Change(In thousands)
Same store Fixed Operations:Revenue
Customer pay $ 141,061 $ 134,096 $ 6,965 5.2 %Warranty 70,283 62,323 7,960 12.8 %Wholesale parts 39,696 39,057 639 1.6 %Internal, sublet and other 101,345 96,806 4,539 4.7 %
Total revenue $ 352,385 $ 332,282 $ 20,103 6.0 %Gross profit
Customer pay $ 77,079 $ 71,426 $ 5,653 7.9 %Warranty 39,247 34,874 4,373 12.5 %Wholesale parts 6,813 6,557 256 3.9 %Internal, sublet and other 46,655 46,720 (65) (0.1)%
Total gross profit $ 169,794 $ 159,577 $ 10,217 6.4 %Gross profit as a % of revenue
Customer pay 54.6 % 53.3 % 130 bpsWarranty 55.8 % 56.0 % (20) bpsWholesale parts 17.2 % 16.8 % 40 bpsInternal, sublet and other 46.0 % 48.3 % (230) bps
Total gross profit as a % of revenue 48.2 % 48.0 % 20 bps
Six Months Ended June 30, Better / (Worse)2019 2018 Change % Change
(In thousands)
Same store Fixed Operations:Revenue
Customer pay $ 277,155 $ 264,824 $ 12,331 4.7 %Warranty 137,720 126,537 11,183 8.8 %Wholesale parts 78,277 79,069 (792) (1.0)%Internal, sublet and other 194,421 189,409 5,012 2.6 %
Total revenue $ 687,573 $ 659,839 $ 27,734 4.2 %Gross profit
Customer pay $ 150,513 $ 141,236 $ 9,277 6.6 %Warranty 76,859 70,778 6,081 8.6 %Wholesale parts 13,449 13,347 102 0.8 %Internal, sublet and other 88,981 91,086 (2,105) (2.3)%
Total gross profit $ 329,802 $ 316,447 $ 13,355 4.2 %Gross profit as a % of revenue
Customer pay 54.3 % 53.3 % 100 bpsWarranty 55.8 % 55.9 % (10) bpsWholesale parts 17.2 % 16.9 % 30 bpsInternal, sublet and other 45.8 % 48.1 % (230) bps
Total gross profit as a % of revenue 48.0 % 48.0 % — bps
For further analysis of Fixed Operations results, see the tables and discussion under the headings “Fixed Operations – Franchised Dealerships Segment” and “FixedOperations - EchoPark Segment” in the Franchised Dealerships Segment and EchoPark Segment sections, respectively, below.
35

SONIC AUTOMOTIVE, INC.MANAGEMENT’S DISCUSSION AND ANALYSIS OF FINANCIAL CONDITION AND RESULTS OF OPERATIONS
F&I – Consolidated
Finance, insurance and other, net revenues include commissions for arranging vehicle financing and insurance, sales of third-party extended warranties and servicecontracts for vehicles, and sales of other aftermarket products. In connection with finance contracts, extended warranties and service contracts, other aftermarket products andinsurance contracts, we receive commissions from the providers for originating contracts. F&I revenues are recognized net of estimated chargebacks and other costs associatedwith originating contracts. F&I revenues are affected by the level of new and used vehicle unit sales, the age and average selling price of vehicles sold, the level of manufacturerfinancing specials or leasing incentives and our F&I penetration rate. The F&I penetration rate represents the number of finance contracts, extended warranties and servicecontracts, other aftermarket products or insurance contracts that we are able to originate per vehicle sold, expressed as a percentage.
The following tables provide a reconciliation of consolidated same store basis and reported basis for F&I:
Three Months Ended June 30, Better / (Worse)2019 2018 Change % Change
(In thousands, except unit and per unit data)
Total F&I revenue:Same store $ 108,818 $ 95,816 $ 13,002 13.6 %Acquisitions, open points and dispositions 9,531 8,288 1,243 NM
Total as reported $ 118,349 $ 104,104 $ 14,245 13.7 %
Total F&I gross profit per retail unit (excludes fleet):Same store $ 1,644 $ 1,536 $ 108 7.0 %Reported $ 1,710 $ 1,572 $ 138 8.8 %
Total combined new and used retail unit sales: Same store 66,210 62,363 3,847 6.2 %Acquisitions, open points and dispositions 3,003 3,875 (872) NM
Total as reported 69,213 66,238 2,975 4.5 %
NM = Not Meaningful
Six Months Ended June 30, Better / (Worse)2019 2018 Change % Change
(In thousands, except unit and per unit data)
Total F&I revenue:Same store $ 205,936 $ 180,977 $ 24,959 13.8 %Acquisitions, open points and dispositions 18,651 16,852 1,799 NM
Total as reported $ 224,587 $ 197,829 $ 26,758 13.5 %
Total F&I gross profit per retail unit (excludes fleet):Same store $ 1,631 $ 1,504 $ 127 8.4 %Reported $ 1,694 $ 1,532 $ 162 10.6 %
Total combined new and used retail unit sales: Same store 126,235 120,333 5,902 4.9 %Acquisitions, open points and dispositions 6,359 8,821 (2,462) (27.9)%
Total as reported 132,594 129,154 3,440 2.7 %
NM = Not Meaningful
For further analysis of F&I results, see the tables and discussion under the headings “F&I – Franchised Dealerships Segment” and “Used Vehicles and F&I – EchoParkSegment” in the Franchised Dealerships Segment and EchoPark Segment sections, respectively, below.
36

SONIC AUTOMOTIVE, INC.MANAGEMENT’S DISCUSSION AND ANALYSIS OF FINANCIAL CONDITION AND RESULTS OF OPERATIONS
Results of Operations - Franchised Dealerships Segment
As a result of the disposition, termination or closure of several franchised dealerships since June 30, 2018, the change in reported amounts from period to period may notbe indicative of the actual operational or financial performance of our current group of operating stores. Please refer to the same store tables and discussion on the followingpages for more meaningful comparison and discussion of financial results on a comparable store basis.
Unless otherwise noted, all discussion of increases or decreases are for the three and six months ended June 30, 2019 and are compared to the same prior year period, asapplicable. The following discussion of new vehicles, used vehicles, wholesale vehicles, parts, service and collision repair, and finance, insurance and other, net are on a samestore basis, except where otherwise noted. All currently operating continuing operations stores are included within the same store group in the first full month following the firstanniversary of the store’s opening or acquisition.
New Vehicles – Franchised Dealerships Segment
New vehicle revenues include the sale of new vehicles to retail customers, as well as the sale of fleet vehicles. New vehicle revenues and gross profit can be influencedby vehicle manufacturer incentives to consumers (which vary from cash-back incentives to low interest rate financing, among other things), the availability of consumer creditand the level and type of manufacturer-to-dealer incentives, as well as manufacturers providing adequate inventory allocations to our dealerships to meet customer demands.The automobile manufacturing industry is cyclical and historically has experienced periodic downturns characterized by oversupply and weak demand, both as a whole and forindividual brands. As an automotive retailer, we seek to mitigate the effects of this sales cycle by maintaining a diverse brand mix of dealerships. Our brand diversity allows usto offer a broad range of products at a wide range of prices from lower-priced/economy vehicles to luxury vehicles.
The following tables provide a reconciliation of Franchised Dealerships Segment same store basis and reported basis for total new vehicles (combined retail and fleetdata):
Three Months Ended June 30, Better / (Worse)2019 2018 Change % Change
(In thousands, except unit data)
Total new vehicle revenue:Same store $ 1,200,352 $ 1,170,278 $ 30,074 2.6 %Acquisitions, open points and dispositions 4,402 68,293 (63,891) NM
Total as reported $ 1,204,754 $ 1,238,571 $ (33,817) (2.7)%Total new vehicle gross profit:
Same store $ 55,803 $ 54,904 $ 899 1.6 %Acquisitions, open points and dispositions 597 2,364 (1,767) NM
Total as reported $ 56,400 $ 57,268 $ (868) (1.5)%Total new vehicle unit sales:
Same store 28,134 28,826 (692) (2.4)%Acquisitions, open points and dispositions 62 2,051 (1,989) NM
Total as reported 28,196 30,877 (2,681) (8.7)%
NM = Not Meaningful
37

SONIC AUTOMOTIVE, INC.MANAGEMENT’S DISCUSSION AND ANALYSIS OF FINANCIAL CONDITION AND RESULTS OF OPERATIONS
Six Months Ended June 30, Better / (Worse)2019 2018 Change % Change
(In thousands, except unit data)
Total new vehicle revenue:Same store $ 2,248,029 $ 2,267,998 $ (19,969) (0.9)%Acquisitions, open points and dispositions 23,059 151,418 (128,359) NM
Total as reported $ 2,271,088 $ 2,419,416 $ (148,328) (6.1)%Total new vehicle gross profit:
Same store $ 108,763 $ 109,282 $ (519) (0.5)%Acquisitions, open points and dispositions 1,433 4,785 (3,352) NM
Total as reported $ 110,196 $ 114,067 $ (3,871) (3.4)%Total new vehicle unit sales:
Same store 52,829 55,736 (2,907) (5.2)%Acquisitions, open points and dispositions 564 4,641 (4,077) NM
Total as reported 53,393 60,377 (6,984) (11.6)%NM = Not Meaningful
Our Franchised Dealerships Segment reported new vehicle results (combined retail and fleet data) are as follows:Three Months Ended June 30, Better / (Worse)
2019 2018 Change % Change(In thousands, except unit and per unit data)
Reported new vehicle:Revenue $ 1,204,754 $ 1,238,571 $ (33,817) (2.7)%Gross profit $ 56,400 $ 57,268 $ (868) (1.5)%Unit sales 28,196 30,877 (2,681) (8.7)%Revenue per unit $ 42,728 $ 40,113 $ 2,615 6.5 %Gross profit per unit $ 2,000 $ 1,855 $ 145 7.8 %Gross profit as a % of revenue 4.7 % 4.6 % 10 bps
Six Months Ended June 30, Better / (Worse)2019 2018 Change % Change
(In thousands, except unit and per unit data)
Reported new vehicle:Revenue $ 2,271,088 $ 2,419,416 $ (148,328) (6.1)%Gross profit $ 110,196 $ 114,067 $ (3,871) (3.4)%Unit sales 53,393 60,377 (6,984) (11.6)%Revenue per unit $ 42,535 $ 40,072 $ 2,463 6.1 %Gross profit per unit $ 2,064 $ 1,889 $ 175 9.3 %Gross profit as a % of revenue 4.9 % 4.7 % 20 bps
38

SONIC AUTOMOTIVE, INC.MANAGEMENT’S DISCUSSION AND ANALYSIS OF FINANCIAL CONDITION AND RESULTS OF OPERATIONS
Our Franchised Dealerships Segment same store new vehicle results (combined retail and fleet data) are as follows:Three Months Ended June 30, Better / (Worse)
2019 2018 Change % Change(In thousands, except unit and per unit data)
Same store new vehicle:Revenue $ 1,200,352 $ 1,170,278 $ 30,074 2.6 %Gross profit $ 55,803 $ 54,904 $ 899 1.6 %Unit sales 28,134 28,826 (692) (2.4)%Revenue per unit $ 42,666 $ 40,598 $ 2,068 5.1 %Gross profit per unit $ 1,983 $ 1,905 $ 78 4.1 %Gross profit as a % of revenue 4.6 % 4.7 % (10) bps
Six Months Ended June 30, Better / (Worse)2019 2018 Change % Change
(In thousands, except unit and per unit data)
Same store new vehicle:Revenue $ 2,248,029 $ 2,267,998 $ (19,969) (0.9)%Gross profit $ 108,763 $ 109,282 $ (519) (0.5)%Unit sales 52,829 55,736 (2,907) (5.2)%Revenue per unit $ 42,553 $ 40,692 $ 1,861 4.6 %Gross profit per unit $ 2,059 $ 1,961 $ 98 5.0 %Gross profit as a % of revenue 4.8 % 4.8 % — bps
Franchised Dealerships Segment New Vehicles - Three Months Ended June 30, 2019 Compared to Three Months Ended June 30, 2018
New vehicle revenue increased 2.6% due to higher average selling prices, while new vehicle unit sales volume decreased 2.4%, driven primarily by decreases in newvehicle unit sales volume at our Ford, Honda and GM dealerships. New vehicle gross profit increased approximately $0.9 million, or 1.6%, primarily driven by increases in newvehicle gross profit at our BMW, Mercedes and Honda dealerships, offset partially by decreases in new vehicle gross profit at our Land Rover, Ford and GM dealerships. Newvehicle gross profit per unit increased $78 per unit, or 4.1%, primarily driven by increases in new vehicle gross profit per unit at our BMW, Mercedes and Honda dealerships,offset partially by decreases in new vehicle gross profit per unit at our Land Rover, Ford and GM dealerships.
Franchised Dealerships Segment New Vehicles - Six Months Ended June 30, 2019 Compared to Six Months Ended June 30, 2018
New vehicle revenue decreased 0.9% and new vehicle unit sales volume decreased 5.2%, driven primarily by lower industry retail unit sales volume and, morespecifically, by decreases in new vehicle unit sales volume at our Toyota, Ford and GM dealerships. New vehicle gross profit decreased approximately $0.5 million, or 0.5%,primarily driven by decreases in new vehicle gross profit at our Land Rover, Ford and GM dealerships, offset partially by increases in new vehicle gross profit at our BMW,Mercedes and Honda dealerships. New vehicle gross profit per unit increased $98 per unit, or 5.0%, primarily driven by increases in new vehicle gross profit per unit at ourBMW, Mercedes and Honda dealerships, offset partially by decreases in new vehicle gross profit per unit at our Land Rover, Ford and GM dealerships.
Used Vehicles – Franchised Dealerships Segment
Used vehicle revenues are directly affected by a number of factors, including the level of manufacturer incentives on new vehicles, the number and quality of trade-insand lease turn-ins, the availability and pricing of used vehicles acquired at auction and the availability of consumer credit.
39

SONIC AUTOMOTIVE, INC.MANAGEMENT’S DISCUSSION AND ANALYSIS OF FINANCIAL CONDITION AND RESULTS OF OPERATIONS
The following tables provide a reconciliation of Franchised Dealerships Segment same store basis and reported basis for retail used vehicles:
Three Months Ended June 30, Better / (Worse)2019 2018 Change % Change
(In thousands, except unit data)
Total used vehicle revenue:Same store $ 634,051 $ 587,143 $ 46,908 8.0 %Acquisitions, open points and dispositions 3,039 22,609 (19,570) NM
Total as reported $ 637,090 $ 609,752 $ 27,338 4.5 %Total used vehicle gross profit:
Same store $ 36,583 $ 36,301 $ 282 0.8 %Acquisitions, open points and dispositions 871 2,944 (2,073) NM
Total as reported $ 37,454 $ 39,245 $ (1,791) (4.6)%Total used vehicle unit sales:
Same store 28,760 27,102 1,658 6.1 %Acquisitions, open points and dispositions 111 1,218 (1,107) NM
Total as reported 28,871 28,320 551 1.9 %
NM = Not Meaningful
Six Months Ended June 30, Better / (Worse)2019 2018 Change % Change
(In thousands, except unit data)
Total used vehicle revenue:Same store $ 1,229,585 $ 1,154,799 $ 74,786 6.5 %Acquisitions, open points and dispositions 11,454 54,304 (42,850) NM
Total as reported $ 1,241,039 $ 1,209,103 $ 31,936 2.6 %Total used vehicle gross profit:
Same store $ 70,419 $ 68,412 $ 2,007 2.9 %Acquisitions, open points and dispositions 3,772 7,073 (3,301) NM
Total as reported $ 74,191 $ 75,485 $ (1,294) (1.7)%Total used vehicle unit sales:
Same store 55,747 53,499 2,248 4.2 %Acquisitions, open points and dispositions 536 3,042 (2,506) NM
Total as reported 56,283 56,541 (258) (0.5)%NM = Not Meaningful
Our Franchised Dealerships Segment reported used vehicle results are as follows:
Three Months Ended June 30, Better / (Worse)2019 2018 Change % Change
(In thousands, except unit and per unit data)
Reported used vehicle:Revenue $ 637,090 $ 609,752 $ 27,338 4.5 %Gross profit $ 37,454 $ 39,245 $ (1,791) (4.6)%Unit sales 28,871 28,320 551 1.9 %Revenue per unit $ 22,067 $ 21,531 $ 536 2.5 %Gross profit per unit $ 1,297 $ 1,386 $ (89) (6.4)%Gross profit as a % of revenue 5.9 % 6.4 % (50) bps
40

SONIC AUTOMOTIVE, INC.MANAGEMENT’S DISCUSSION AND ANALYSIS OF FINANCIAL CONDITION AND RESULTS OF OPERATIONS
Six Months Ended June 30, Better / (Worse)2019 2018 Change % Change
(In thousands, except unit and per unit data)
Reported used vehicle:Revenue $ 1,241,039 $ 1,209,103 $ 31,936 2.6 %Gross profit $ 74,191 $ 75,485 $ (1,294) (1.7)%Unit sales 56,283 56,541 (258) (0.5)%Revenue per unit $ 22,050 $ 21,385 $ 665 3.1 %Gross profit per unit $ 1,318 $ 1,335 $ (17) (1.3)%Gross profit as a % of revenue 6.0 % 6.2 % (20) bps
Our Franchised Dealerships Segment same store used vehicle results are as follows:
Three Months Ended June 30, Better / (Worse)2019 2018 Change % Change
(In thousands, except unit and per unit data)
Same store used vehicle:Revenue $ 634,051 $ 587,143 $ 46,908 8.0 %Gross profit $ 36,583 $ 36,301 $ 282 0.8 %Unit sales 28,760 27,102 1,658 6.1 %Revenue per unit $ 22,046 $ 21,664 $ 382 1.8 %Gross profit per unit $ 1,272 $ 1,339 $ (67) (5.0)%Gross profit as a % of revenue 5.8 % 6.2 % (40) bps
Six Months Ended June 30, Better / (Worse)2019 2018 Change % Change
(In thousands, except unit and per unit data)
Same store used vehicle:Revenue $ 1,229,585 $ 1,154,799 $ 74,786 6.5 %Gross profit $ 70,419 $ 68,412 $ 2,007 2.9 %Unit sales 55,747 53,499 2,248 4.2 %Revenue per unit $ 22,057 $ 21,585 $ 472 2.2 %Gross profit per unit $ 1,263 $ 1,279 $ (16) (1.3)%Gross profit as a % of revenue 5.7 % 5.9 % (20) bps
Franchised Dealerships Segment Used Vehicles - Three Months Ended June 30, 2019 Compared to Three Months Ended June 30, 2018
Retail used vehicle revenue increased 8.0%, driven primarily by a 6.1% increase in retail used vehicle unit sales volume as a result of increases in retail used vehicle unitsales volume at our Honda, Toyota and Audi dealerships. Retail used vehicle gross profit increased approximately $0.3 million , or 0.8%, driven primarily by increases in retailused vehicle gross profit per unit at our Mercedes, Porsche and Toyota dealerships, offset partially by decreases in retail used vehicle gross profit at our BMW, GM and MINIdealerships. Retail used vehicle gross profit per unit decreased $67 per unit, or (5.0)%, driven primarily by decreases in retail used vehicle gross profit per unit at our BMW,GM and MINI dealerships.
Franchised Dealerships Segment Used Vehicles - Six Months Ended June 30, 2019 Compared to Six Months Ended June 30, 2018
Retail used vehicle revenue increased 6.5%, driven primarily by a 4.2% increase in retail used vehicle unit sales volume as a result of increases in retail used vehicle unitsales volume at our Honda, Toyota and Mercedes dealerships. Retail used vehicle gross profit increased approximately $2.0 million, or 2.9%, driven primarily by increases inretail used vehicle gross profit per unit at our BMW, Mercedes and Toyota dealerships. Retail used vehicle gross profit per unit decreased $16 per unit,
41

SONIC AUTOMOTIVE, INC.MANAGEMENT’S DISCUSSION AND ANALYSIS OF FINANCIAL CONDITION AND RESULTS OF OPERATIONS
or 1.3%, driven primarily by decreases in retail used vehicle gross profit per unit at our Volkswagen, Ford and MINI dealerships.
Wholesale Vehicles - Franchised Dealerships Segment
Wholesale vehicle revenues are highly correlated with new and used vehicle retail sales and the associated trade-in volume. Wholesale vehicle revenues are alsosignificantly affected by our corporate inventory management strategy and policies, which are designed to optimize our total used vehicle inventory.
The following tables provide a reconciliation of Franchised Dealerships Segment same store basis and reported basis for wholesale vehicles:
Three Months Ended June 30, Better / (Worse)2019 2018 Change % Change
(In thousands, except unit data)
Total wholesale vehicle revenue:Same store $ 43,393 $ 43,718 $ (325) (0.7)%Acquisitions, open points and dispositions 327 2,757 (2,430) NM
Total as reported $ 43,720 $ 46,475 $ (2,755) (5.9)%Total wholesale vehicle gross profit (loss):
Same store $ (587) $ (3,367) $ 2,780 82.6 %Acquisitions, open points and dispositions (83) (300) 217 NM
Total as reported $ (670) $ (3,667) $ 2,997 81.7 %Total wholesale vehicle unit sales:
Same store 6,938 6,676 262 3.9 %Acquisitions, open points and dispositions 22 425 (403) NM
Total as reported 6,960 7,101 (141) (2.0)%
NM = Not Meaningful
Six Months Ended June 30, Better / (Worse)2019 2018 Change % Change
(In thousands, except unit data)
Total wholesale vehicle revenue:Same store $ 94,689 $ 96,969 $ (2,280) (2.4)%Acquisitions, open points and dispositions 1,564 7,688 (6,124) NM
Total as reported $ 96,253 $ 104,657 $ (8,404) (8.0)%Total wholesale vehicle gross profit (loss):
Same store $ (1,678) $ (7,664) $ 5,986 78.1 %Acquisitions, open points and dispositions (196) (784) 588 NM
Total as reported $ (1,874) $ (8,448) $ 6,574 77.8 %Total wholesale vehicle unit sales:
Same store 14,909 14,338 571 4.0 %Acquisitions, open points and dispositions 199 1,210 (1,011) NM
Total as reported 15,108 15,548 (440) (2.8)%NM = Not Meaningful
42

SONIC AUTOMOTIVE, INC.MANAGEMENT’S DISCUSSION AND ANALYSIS OF FINANCIAL CONDITION AND RESULTS OF OPERATIONS
Our Franchised Dealerships Segment reported wholesale vehicle results are as follows:
Three Months Ended June 30, Better / (Worse)2019 2018 Change % Change
(In thousands, except unit and per unit data)
Reported wholesale vehicle:Revenue $ 43,720 $ 46,475 $ (2,755) (5.9)%Gross profit (loss) $ (670) $ (3,667) $ 2,997 81.7 %Unit sales 6,960 7,101 (141) (2.0)%Revenue per unit $ 6,282 $ 6,545 $ (263) (4.0)%Gross profit (loss) per unit $ (96) $ (516) $ 420 81.4 %Gross profit (loss) as a % of revenue (1.5) % (7.9) % 640 bps
Six Months Ended June 30, Better / (Worse)2019 2018 Change % Change
(In thousands, except unit and per unit data)
Reported wholesale vehicle:Revenue $ 96,253 $ 104,657 $ (8,404) (8.0)%Gross profit (loss) $ (1,874) $ (8,448) $ 6,574 77.8 %Unit sales 15,108 15,548 (440) (2.8)%Revenue per unit $ 6,371 $ 6,731 $ (360) (5.3)%Gross profit (loss) per unit $ (124) $ (543) $ 419 77.2 %Gross profit (loss) as a % of revenue (1.9) % (8.1) % 620 bps
Our Franchised Dealerships Segment same store wholesale vehicle results are as follows:
Three Months Ended June 30, Better / (Worse)2019 2018 Change % Change
(In thousands, except unit and per unit data)
Same store wholesale vehicle:Revenue $ 43,393 $ 43,718 $ (325) (0.7)%Gross profit (loss) $ (587) $ (3,367) $ 2,780 82.6 %Unit sales 6,938 6,676 262 3.9 %Revenue per unit $ 6,254 $ 6,549 $ (295) (4.5)%Gross profit (loss) per unit $ (85) $ (504) $ 419 83.1 %Gross profit (loss) as a % of revenue (1.4) % (7.7) % 630 bps
Six Months Ended June 30, Better / (Worse)2019 2018 Change % Change
(In thousands, except unit and per unit data)
Same store wholesale vehicle:Revenue $ 94,689 $ 96,969 $ (2,280) (2.4)%Gross profit (loss) $ (1,678) $ (7,664) $ 5,986 78.1 %Unit sales 14,909 14,338 571 4.0 %Revenue per unit $ 6,351 $ 6,763 $ (412) (6.1)%Gross profit (loss) per unit $ (113) $ (535) $ 422 78.9 %Gross profit (loss) as a % of revenue (1.8) % (7.9) % 610 bps
We focus on maintaining used vehicle inventory days’ supply in the 30- to 40- day range in order to limit our exposure to market pricing volatility. Our franchiseddealerships used vehicle inventory days’ supply was approximately 27 and 26 days as
43

SONIC AUTOMOTIVE, INC.MANAGEMENT’S DISCUSSION AND ANALYSIS OF FINANCIAL CONDITION AND RESULTS OF OPERATIONS
of June 30, 2019 and 2018, respectively. Wholesale vehicle revenue and wholesale vehicle unit sales volume fluctuations are typically a result of retail new and used vehicleunit sales volumes that generate additional trade-in vehicle volume that we are not always able to sell as retail used vehicles and choose to sell at auction. Whenever possible, weprefer to sell a used vehicle through retail channels rather than wholesaling the vehicle at auction.
Franchised Dealerships Segment Wholesale Vehicles - Three Months Ended June 30, 2019 Compared to Three Months Ended June 30, 2018
Wholesale vehicle revenue and wholesale vehicle gross loss decreased, while wholesale vehicle unit sales volume increased in the three months ended June 30, 2019. Thedecrease in wholesale vehicle gross loss was primarily due to a prior year initiative to tighten a policy of wholesaling aged or undesirable units at auction in a timely manner,thereby achieving a better wholesale vehicle gross loss per unit and improved inventory levels and quality.
Franchised Dealerships Segment Wholesale Vehicles - Six Months Ended June 30, 2019 Compared to Six Months Ended June 30, 2018
Wholesale vehicle revenue and wholesale vehicle gross loss decreased, while wholesale vehicle unit sales volume increased in the six months ended June 30, 2019. Thedecrease in wholesale vehicle gross loss was primarily due to a prior year initiative to tighten a policy of wholesaling aged or undesirable units at auction in a timely manner,thereby achieving a better wholesale vehicle gross loss per unit and improved inventory levels and quality. In addition, we experienced higher wholesale vehicle gross loss inthe first quarter of 2018 as a result of market pricing declines, inventory supply and allocation challenges related to the Houston market following the effects of HurricaneHarvey.
Fixed Operations - Franchised Dealerships Segment
Parts, service and collision repair revenues consist of customer pay repairs, warranty repairs, wholesale parts and internal, sublet and other. Parts and service revenue isdriven by the mix of warranty repairs versus customer pay repairs, available service capacity, vehicle quality, manufacturer recalls, customer loyalty and prepaid maintenanceprograms. Internal, sublet and other primarily relates to preparation and reconditioning work performed on vehicles that are sold to customers. When that work is performed byone of our dealerships, the work is classified as internal. In the event the work is performed by a third party on our behalf, it is classified as sublet.
We believe that, over time, vehicle quality will continue to improve, but vehicle complexity and the associated demand for repairs by qualified technicians at franchiseddealerships will offset any revenue lost from improvement in vehicle quality. We also believe that, over the long term, we have the ability to continue to add service capacity atour dealerships to further increase revenues. Manufacturers continue to extend new vehicle warranty periods and have also begun to include regular maintenance items in thewarranty or complimentary maintenance program coverage. These factors, over the long term, combined with the extended manufacturer warranties on certified pre-ownedvehicles, should facilitate long-term growth in our parts and service business. Barriers to long-term growth may include reductions in the rate paid by manufacturers to dealersfor warranty work performed, as well as the improved quality of vehicles that may affect the level and frequency of future customer pay or warranty-related revenues.
The following tables provide a reconciliation of Franchised Dealerships Segment same store basis and reported basis for Fixed Operations:Three Months Ended June 30, Better / (Worse)
2019 2018 Change % Change(In thousands)
Total Fixed Operations revenue:Same store $ 346,223 $ 328,312 $ 17,911 5.5 %Acquisitions, open points and dispositions 1,114 13,931 (12,817) NM
Total as reported $ 347,337 $ 342,243 $ 5,094 1.5 %Total Fixed Operations gross profit:
Same store $ 169,919 $ 159,049 $ 10,870 6.8 %Acquisitions, open points and dispositions 789 7,432 (6,643) NM
Total as reported $ 170,708 $ 166,481 $ 4,227 2.5 %
NM = Not Meaningful
44

SONIC AUTOMOTIVE, INC.MANAGEMENT’S DISCUSSION AND ANALYSIS OF FINANCIAL CONDITION AND RESULTS OF OPERATIONS
Six Months Ended June 30, Better / (Worse)2019 2018 Change % Change
(In thousands)
Total Fixed Operations revenue:Same store $ 677,243 $ 651,814 $ 25,429 3.9 %Acquisitions, open points and dispositions 6,320 37,479 (31,159) NM
Total as reported $ 683,563 $ 689,293 $ (5,730) (0.8)%Total Fixed Operations gross profit:
Same store $ 330,095 $ 314,895 $ 15,200 4.8 %Acquisitions, open points and dispositions 4,059 19,889 (15,830) NM
Total as reported $ 334,154 $ 334,784 $ (630) (0.2)%
NM = Not Meaningful
Our Franchised Dealerships Segment reported Fixed Operations results are as follows:
Three Months Ended June 30, Better / (Worse)2019 2018 Change % Change
(In thousands)
Reported Fixed Operations:Revenue
Customer pay $ 141,944 $ 140,059 $ 1,885 1.3 %Warranty 69,809 63,888 5,921 9.3 %Wholesale parts 40,027 40,844 (817) (2.0)%Internal, sublet and other 95,557 97,452 (1,895) (1.9)%
Total revenue $ 347,337 $ 342,243 $ 5,094 1.5 %Gross profit
Customer pay $ 77,653 $ 75,024 $ 2,629 3.5 %Warranty 39,039 35,871 3,168 8.8 %Wholesale parts 6,872 6,900 (28) (0.4)%Internal, sublet and other 47,144 48,686 (1,542) (3.2)%
Total gross profit $ 170,708 $ 166,481 $ 4,227 2.5 %Gross profit as a % of revenue
Customer pay 54.7 % 53.6 % 110 bpsWarranty 55.9 % 56.1 % (20) bpsWholesale parts 17.2 % 16.9 % 30 bpsInternal, sublet and other 49.3 % 50.0 % (70) bps
Total gross profit as a % of revenue 49.1 % 48.6 % 50 bps
45

SONIC AUTOMOTIVE, INC.MANAGEMENT’S DISCUSSION AND ANALYSIS OF FINANCIAL CONDITION AND RESULTS OF OPERATIONS
Six Months Ended June 30, Better / (Worse)2019 2018 Change % Change
(In thousands)
Reported Fixed Operations:RevenueCustomer pay $ 279,513 $ 281,980 $ (2,467) (0.9)%Warranty 138,782 131,489 7,293 5.5 %Wholesale parts 79,325 83,345 (4,020) (4.8)%Internal, sublet and other 185,943 192,479 (6,536) (3.4)%
Total revenue $ 683,563 $ 689,293 $ (5,730) (0.8)%Gross profit
Customer pay $ 151,977 $ 151,223 $ 754 0.5 %Warranty 77,447 73,772 3,675 5.0 %Wholesale parts 13,668 14,165 (497) (3.5)%Internal, sublet and other 91,062 95,624 (4,562) (4.8)%
Total gross profit $ 334,154 $ 334,784 $ (630) (0.2)%Gross profit as a % of revenue
Customer pay 54.4 % 53.6 % 80 bpsWarranty 55.8 % 56.1 % (30) bpsWholesale parts 17.2 % 17.0 % 20 bpsInternal, sublet and other 49.0 % 49.7 % (70) bps
Total gross profit as a % of revenue 48.9 % 48.6 % 30 bps
Our Franchised Dealerships Segment same store Fixed Operations results are as follows:Three Months Ended June 30, Better / (Worse)
2019 2018 Change % Change(In thousands)
Same store Fixed Operations:Revenue
Customer pay $ 140,950 $ 133,977 $ 6,973 5.2 %Warranty 70,283 62,323 7,960 12.8 %Wholesale parts 39,696 39,057 639 1.6 %Internal, sublet and other 95,294 92,955 2,339 2.5 %
Total revenue $ 346,223 $ 328,312 $ 17,911 5.5 %Gross profit
Customer pay $ 77,078 $ 71,421 $ 5,657 7.9 %Warranty 39,247 34,874 4,373 12.5 %Wholesale parts 6,813 6,557 256 3.9 %Internal, sublet and other 46,781 46,197 584 1.3 %
Total gross profit $ 169,919 $ 159,049 $ 10,870 6.8 %Gross profit as a % of revenue
Customer pay 54.7 % 53.3 % 140 bpsWarranty 55.8 % 56.0 % (20) bpsWholesale parts 17.2 % 16.8 % 40 bpsInternal, sublet and other 49.1 % 49.7 % (60) bps
Total gross profit as a % of revenue 49.1 % 48.4 % 70 bps
46

SONIC AUTOMOTIVE, INC.MANAGEMENT’S DISCUSSION AND ANALYSIS OF FINANCIAL CONDITION AND RESULTS OF OPERATIONS
Six Months Ended June 30, Better / (Worse)2019 2018 Change % Change
(In thousands)
Same store Fixed Operations:Revenue
Customer pay $ 276,944 $ 264,489 $ 12,455 4.7 %Warranty 137,720 126,537 11,183 8.8 %Wholesale parts 78,277 79,069 (792) (1.0)%Internal, sublet and other 184,302 181,719 2,583 1.4 %
Total revenue $ 677,243 $ 651,814 $ 25,429 3.9 %Gross profit
Customer pay $ 150,512 $ 141,167 $ 9,345 6.6 %Warranty 76,859 70,778 6,081 8.6 %Wholesale parts 13,449 13,347 102 0.8 %Internal, sublet and other 89,275 89,603 (328) (0.4)%
Total gross profit $ 330,095 $ 314,895 $ 15,200 4.8 %Gross profit as a % of revenue
Customer pay 54.3 % 53.4 % 90 bpsWarranty 55.8 % 55.9 % (10) bpsWholesale parts 17.2 % 16.9 % 30 bpsInternal, sublet and other 48.4 % 49.3 % (90) bps
Total gross profit as a % of revenue 48.7 % 48.3 % 40 bps
Franchised Dealerships Segment Fixed Operations - Three Months Ended June 30, 2019 Compared to Three Months Ended June 30, 2018
Fixed Operations revenue increased approximately $17.9 million, or 5.5%, and Fixed Operations gross profit increased approximately $10.9 million, or 6.8%, drivenprimarily by an increase in customer pay gross profit of approximately $5.7 million, or 7.9%, as a result of a strategic emphasis on maximizing growth opportunities in thecustomer pay business. In addition, warranty gross profit increased approximately $4.4 million, or 12.5%, wholesale parts gross profit increased approximately $0.3 million, or3.9%, and internal, sublet and other gross profit increased approximately $0.6 million, or 1.3%.
Franchised Dealerships Segment Fixed Operations - Six Months Ended June 30, 2019 Compared to Six Months Ended June 30, 2018
Fixed Operations revenue increased approximately $25.4 million, or 3.9%, and Fixed Operations gross profit increased approximately $15.2 million, or 4.8%. Customerpay gross profit increased approximately $9.3 million, or 6.6%, warranty gross profit increased approximately $6.1 million, or 8.6%, wholesale parts gross profit increasedapproximately $0.1 million, or 0.8%, and internal, sublet and other gross profit decreased approximately $0.3 million, or 0.4%.
F&I - Franchised Dealerships Segment
Finance, insurance and other, net revenues include commissions for arranging vehicle financing and insurance, sales of third-party extended warranties and servicecontracts for vehicles, and sales of other aftermarket products. In connection with finance contracts, extended warranties and service contracts, other aftermarket products andinsurance contracts, we receive commissions from the providers for originating contracts. F&I revenues are recognized net of estimated chargebacks and other costs associatedwith originating contracts. F&I revenues are affected by the level of new and used vehicle unit sales, the age and average selling price of vehicles sold, the level of manufacturerfinancing specials or leasing incentives and our F&I penetration rate. The F&I penetration rate represents the number of finance contracts, extended warranties and servicecontracts, other aftermarket products or insurance contracts that we are able to originate per vehicle sold, expressed as a percentage.
47

SONIC AUTOMOTIVE, INC.MANAGEMENT’S DISCUSSION AND ANALYSIS OF FINANCIAL CONDITION AND RESULTS OF OPERATIONS
The following tables provide a reconciliation of Franchised Dealerships Segment same store basis and reported basis for F&I:
Three Months Ended June 30, Better / (Worse)2019 2018 Change % Change
(In thousands, except unit and per unit data)
Total F&I revenue:Same store $ 86,687 $ 81,868 $ 4,819 5.9 %Acquisitions, open points and dispositions 2,820 6,675 (3,855) NM
Total as reported $ 89,507 $ 88,543 $ 964 1.1 %
Total F&I gross profit per retail unit (excludes fleet):Same store $ 1,536 $ 1,474 $ 62 4.2 %Reported $ 1,581 $ 1,506 $ 75 5.0 %
Total combined new and used retail unit sales:Same store 56,453 55,535 918 1.7 %Acquisitions, open points and dispositions 173 3,244 (3,071) NM
Total as reported 56,626 58,779 (2,153) (3.7)%
NM = Not Meaningful
Six Months Ended June 30, Better / (Worse)2019 2018 Change % Change
(In thousands, except unit and per unit data)
Total F&I revenue:Same store $ 163,765 $ 158,345 $ 5,420 3.4 %Acquisitions, open points and dispositions 6,263 14,039 (7,776) NM
Total as reported $ 170,028 $ 172,384 $ (2,356) (1.4)%
Total F&I gross profit per retail unit (excludes fleet):Same store $ 1,518 $ 1,459 $ 59 4.0 %Reported $ 1,561 $ 1,484 $ 77 5.2 %
Total combined new and used retail unit sales: Same store 107,856 108,539 (683) (0.6)%Acquisitions, open points and dispositions 1,100 7,638 (6,538) NM
Total as reported 108,956 116,177 (7,221) (6.2)%
NM = Not Meaningful
Franchised Dealerships Segment F&I - Three Months Ended June 30, 2019 Compared to Three Months Ended June 30, 2018
F&I revenues increased approximately $4.8 million, or 5.9%, and F&I gross profit per retail unit increased $62 per unit, or 4.2%, to $1,536 per unit. The growth in F&Irevenues and F&I gross profit per retail unit was primarily due to an increase in gross profit per finance contract and an increase in retail used vehicle unit sales volume.
Finance contract revenue increased 11.7% primarily due to an 8.6% increase in gross profit per finance contract, a 2.9% increase in finance contract volume as a result ofhigher retail used vehicle unit sales volume and a 90-basis point increase in the finance contract penetration rate. Service contract revenue increased 10.0% primarily due to a7.5% increase in gross profit per service contract, a 2.3% increase in service contract volume as a result of higher retail used vehicle unit sales volume and a 20-basis pointincrease in the service contract penetration rate. Other aftermarket contract revenue increased 14.6% primarily due to a 10.9% increase in gross profit per other aftermarketcontract, a 3.4% increase in other aftermarket contract volume and a 230-basis point increase in the other aftermarket contract penetration rate.
48

SONIC AUTOMOTIVE, INC.MANAGEMENT’S DISCUSSION AND ANALYSIS OF FINANCIAL CONDITION AND RESULTS OF OPERATIONS
Franchised Dealerships Segment F&I - Six Months Ended June 30, 2019 Compared to Six Months Ended June 30, 2018
F&I revenues increased approximately $5.4 million, or 3.4%, and F&I gross profit per retail unit increased $59 per unit, or 4.0%, to $1,518 per unit. The growth in F&Irevenues and F&I gross profit per retail unit was primarily due to an increase in gross profit per finance contract, gross profit per service contract and gross profit per otheraftermarket contract due to additional product offerings and increased visibility into performance drivers provided by our proprietary internal software applications.
Finance contract revenue increased 7.0% primarily due to a 6.1% increase in gross profit per finance contract and a 110-basis point increase in the finance contractpenetration rate. Service contract revenue increased 8.6% due primarily to an 8.4% increase in gross profit per service contract and a 30-basis point increase in the servicecontract penetration rate. Other aftermarket contract revenue increased 13.1%, primarily driven by an 11.8% increase in gross profit per other aftermarket contract and a 230-basis point increase in the other aftermarket contract penetration rate.
Results of Operations - EchoPark Segment
Unless otherwise noted, all discussion of increases or decreases are for the three and six months ended June 30, 2019 and are compared to the same prior year period, asapplicable. The following discussion of used vehicles and F&I, wholesale vehicles, and parts, service and collision repair are on a same store basis, except where otherwisenoted. All currently operating continuing operations stores are included within the same store group in the first full month following the first anniversary of the store’s openingor acquisition.
The EchoPark Segment same store results consist of results of operations from three EchoPark stores in Colorado and three EchoPark stores in Texas for the three and sixmonths ended June 30, 2019 compared to the same prior year period, as applicable. Due to the ongoing expansion of our EchoPark Segment, same store results may varysignificantly from reported results due to stores that began operations or were acquired in the last 12 months.
Used Vehicles and F&I - EchoPark Segment
Based on the way we manage the EchoPark Segment, our operating strategy focuses on maximizing total used-related gross profit (based on a combination of retail usedvehicle unit sales volume, front-end retail used vehicle gross profit per unit and F&I gross profit per unit) rather than realizing traditional levels of front-end retail used vehiclegross profit per unit. As such, we believe the best per unit measure of gross profit performance at our EchoPark stores is a combined total gross profit per unit, which includesboth front-end retail used vehicle gross profit and F&I gross profit per unit sold.
See the discussion in Franchised Dealerships Segment Results of Operations for a discussion of the macro drivers of used vehicle revenues and F&I revenues.
The following tables provide a reconciliation of EchoPark Segment same store basis and reported basis for retail used vehicles:
Three Months Ended June 30, Better / (Worse)2019 2018 Change % Change
(In thousands, except unit data)
Total used vehicle revenue:Same store $ 192,615 $ 141,250 $ 51,365 36.4 %Acquisitions, open points and closures 55,922 11,570 44,352 NM
Total as reported $ 248,537 $ 152,820 $ 95,717 62.6 %Total used vehicle gross profit (loss):
Same store $ (2,043) $ (1,624) $ (419) (25.8)%Acquisitions, open points and closures 1,318 (312) 1,630 NM
Total as reported $ (725) $ (1,936) $ 1,211 62.6 %Total used vehicle unit sales:
Same store 9,757 6,828 2,929 42.9 %Acquisitions, open points and closures 2,830 631 2,199 NM
Total as reported 12,587 7,459 5,128 68.7 %
NM = Not Meaningful
49

SONIC AUTOMOTIVE, INC.MANAGEMENT’S DISCUSSION AND ANALYSIS OF FINANCIAL CONDITION AND RESULTS OF OPERATIONS
Six Months Ended June 30, Better / (Worse)2019 2018 Change % Change
(In thousands, except unit data)
Total used vehicle revenue:Same store $ 361,702 $ 239,691 $ 122,011 50.9 %Acquisitions, open points and closures 103,251 22,824 80,427 NM
Total as reported $ 464,953 $ 262,515 $ 202,438 77.1 %Total used vehicle gross profit (loss):
Same store $ (2,156) $ (935) $ (1,221) (130.6)%Acquisitions, open points and closures 1,701 (470) 2,171 NM
Total as reported $ (455) $ (1,405) $ 950 67.6 %Total used vehicle unit sales:
Same store 18,379 11,794 6,585 55.8 %Acquisitions, open points and closures 5,259 1,183 4,076 NM
Total as reported 23,638 12,977 10,661 82.2 %
NM = Not Meaningful
The following tables provide a reconciliation of EchoPark Segment same store basis and reported basis for F&I:
Three Months Ended June 30, Better / (Worse)2019 2018 Change % Change
(In thousands)
Total F&I revenue:Same store $ 22,131 $ 13,948 $ 8,183 58.7 %Acquisitions, open points and closures 6,711 1,613 5,098 NM
Total as reported $ 28,842 $ 15,561 $ 13,281 85.3 %
NM = Not Meaningful
Six Months Ended June 30, Better / (Worse)2019 2018 Change % Change
(In thousands)
Total F&I revenue:Same store $ 42,171 $ 22,632 $ 19,539 86.3 %Acquisitions, open points and closures 12,388 2,813 9,575 NM
Total as reported $ 54,559 $ 25,445 $ 29,114 114.4 %
NM = Not Meaningful
Our EchoPark Segment reported retail used vehicle and F&I results are as follows:
Three Months Ended June 30, Better / (Worse)2019 2018 Change % Change
(In thousands, except unit and per unit data)
Reported used vehicle and F&I:Used vehicle revenue $ 248,537 $ 152,820 $ 95,717 62.6 %Used vehicle gross profit (loss) $ (725) $ (1,936) $ 1,211 62.6 %Used vehicle unit sales 12,587 7,459 5,128 68.7 %Used vehicle revenue per unit $ 19,746 $ 20,488 $ (742) (3.6)%F&I revenue $ 28,842 $ 15,561 $ 13,281 85.3 %Combined used vehicle gross profit and F&I revenue $ 28,117 $ 13,625 $ 14,492 106.4 %Total used vehicle and F&I gross profit per unit $ 2,234 $ 1,827 $ 407 22.3 %
50

SONIC AUTOMOTIVE, INC.MANAGEMENT’S DISCUSSION AND ANALYSIS OF FINANCIAL CONDITION AND RESULTS OF OPERATIONS
Six Months Ended June 30, Better / (Worse)2019 2018 Change % Change
(In thousands, except unit and per unit data)
Reported used vehicle and F&I:Used vehicle revenue $ 464,953 $ 262,515 $ 202,438 77.1 %Used vehicle gross profit (loss) $ (455) $ (1,405) $ 950 67.6 %Used vehicle unit sales 23,638 12,977 10,661 82.2 %Used vehicle revenue per unit $ 19,670 $ 20,229 $ (559) (2.8)%F&I revenue $ 54,559 $ 25,445 $ 29,114 114.4 %Combined used vehicle gross profit and F&I revenue $ 54,104 $ 24,040 $ 30,064 125.1 %Total used vehicle and F&I gross profit per unit $ 2,289 $ 1,853 $ 436 23.5 %
Our EchoPark Segment same store retail used vehicle and F&I results are as follows:
Three Months Ended June 30, Better / (Worse)2019 2018 Change % Change
(In thousands, except unit and per unit data)
Same store used vehicle and F&I:Used vehicle revenue $ 192,615 $ 141,250 $ 51,365 36.4 %Used vehicle gross profit (loss) $ (2,043) $ (1,624) $ (419) (25.8)%Used vehicle unit sales 9,757 6,828 2,929 42.9 %Used vehicle revenue per unit $ 19,741 $ 20,687 $ (946) (4.6)%F&I revenue $ 22,131 $ 13,948 $ 8,183 58.7 %Combined used vehicle gross profit and F&I revenue $ 20,088 $ 12,324 $ 7,764 63.0 %Total used vehicle and F&I gross profit per unit $ 2,059 $ 1,805 $ 254 14.1 %
Six Months Ended June 30, Better / (Worse)2019 2018 Change % Change
(In thousands, except unit and per unit data)
Same store used vehicle and F&I:Used vehicle revenue $ 361,702 $ 239,691 $ 122,011 50.9 %Used vehicle gross profit (loss) $ (2,156) $ (935) $ (1,221) (130.6)%Used vehicle unit sales 18,379 11,794 6,585 55.8 %Used vehicle revenue per unit $ 19,680 $ 20,323 $ (643) (3.2)%F&I revenue $ 42,171 $ 22,632 $ 19,539 86.3 %Combined used vehicle gross profit and F&I revenue $ 40,015 $ 21,697 $ 18,318 84.4 %Total used vehicle and F&I gross profit per unit $ 2,177 $ 1,840 $ 337 18.3 %
EchoPark Segment Used Vehicles and F&I - Three Months Ended June 30, 2019 Compared to Three Months Ended June 30, 2018
Retail used vehicle revenue increased by approximately $51.4 million, or 36.4%, driven primarily by a 42.9% increase in retail used vehicle unit sales volume as ourEchoPark stores continue to mature. Combined retail used vehicle and F&I gross profit per unit increased approximately $254 per unit, or 14.1%, to $2,059 per unit, drivenprimarily by an increase in F&I gross profit, partially offset by lower retail used vehicle gross profit. F&I revenue increased approximately $8.2 million, or 58.7%, drivenprimarily by higher retail used vehicle unit sales volume and a 500-basis point increase in finance contract penetration rate, a 670-basis point increase in service contractpenetration rate and a 650-basis point increase in other aftermarket contract penetration rate. F&I penetration rates are generally higher in our EchoPark Segment than in ourFranchised Dealerships Segment as a result of lower vehicle pricing relative to market price and the unique approach that our associates use to present F&I product value to ourguests.
51

SONIC AUTOMOTIVE, INC.MANAGEMENT’S DISCUSSION AND ANALYSIS OF FINANCIAL CONDITION AND RESULTS OF OPERATIONS
EchoPark Segment Used Vehicles and F&I - Six Months Ended June 30, 2019 Compared to Six Months Ended June 30, 2018
Retail used vehicle revenue increased by approximately $122.0 million, or 50.9%, driven primarily by a 55.8% increase in retail used vehicle unit sales volume as ourEchoPark stores continue to mature. Combined retail used vehicle and F&I gross profit per unit increased approximately $337 per unit, or 18.3%, to $2,177 per unit, drivenprimarily by an increase in F&I gross profit, partially offset by lower retail used vehicle gross profit. F&I revenue increased approximately $19.5 million, or 86.3%, drivenprimarily by higher retail used vehicle unit sales volume and a 590-basis point increase in finance contract penetration rate, a 700-basis point increase in service contractpenetration rate and a 370-basis point increase in other aftermarket contract penetration rate. F&I penetration rates are generally higher in our EchoPark Segment than in ourFranchised Dealerships Segment as a result of lower vehicle pricing relative to market price and the unique approach that our associates use to present F&I product value to ourguests.
Wholesale Vehicles - EchoPark Segment
See the discussion in Franchised Dealerships Segment Results of Operations for a discussion of the macro drivers of wholesale vehicle revenues.
The following tables provide a reconciliation of EchoPark Segment same store basis and reported basis for wholesale vehicles:
Three Months Ended June 30, Better / (Worse)2019 2018 Change % Change
(In thousands, except unit data)
Total wholesale vehicle revenue:Same store $ 4,878 $ 4,409 $ 469 10.6 %Acquisitions, open points and closures 1,441 2,864 (1,423) NM
Total as reported $ 6,319 $ 7,273 $ (954) (13.1)%Total wholesale vehicle gross profit (loss):
Same store $ (45) $ 293 $ (338) (115.4)%Acquisitions, open points and closures 2 17 (15) NM
Total as reported $ (43) $ 310 $ (353) (113.9)%Total wholesale vehicle unit sales:
Same store 1,292 784 508 64.8 %Acquisitions, open points and closures 394 557 (163) NM
Total as reported 1,686 1,341 345 25.7 %
NM = Not Meaningful
52

SONIC AUTOMOTIVE, INC.MANAGEMENT’S DISCUSSION AND ANALYSIS OF FINANCIAL CONDITION AND RESULTS OF OPERATIONS
Six Months Ended June 30, Better / (Worse)2019 2018 Change % Change
(In thousands, except unit data)
Total wholesale vehicle revenue:Same store $ 6,705 $ 11,477 $ (4,772) (41.6)%Acquisitions, open points and closures 1,852 3,014 (1,162) NM
Total as reported $ 8,557 $ 14,491 $ (5,934) (40.9)%Total wholesale vehicle gross profit (loss):
Same store $ (95) $ 709 $ (804) (113.4)%Acquisitions, open points and closures (10) (42) 32 NM
Total as reported $ (105) $ 667 $ (772) (115.7)%Total wholesale vehicle unit sales:
Same store 1,709 1,989 (280) (14.1)%Acquisitions, open points and closures 476 585 (109) NM
Total as reported 2,185 2,574 (389) (15.1)%
NM = Not Meaningful
Our EchoPark Segment reported wholesale vehicle results are as follows:
Three Months Ended June 30, Better / (Worse)2019 2018 Change % Change
(In thousands, except unit and per unit data)
Reported wholesale vehicle:Revenue $ 6,319 $ 7,273 $ (954) (13.1)%Gross profit (loss) $ (43) $ 310 $ (353) (113.9)%Unit sales 1,686 1,341 345 25.7 %Revenue per unit $ 3,748 $ 5,424 $ (1,676) (30.9)%Gross profit (loss) per unit $ (26) $ 231 $ (257) (111.3)%Gross profit (loss) as a % of revenue (0.7) % 4.3 % (500) bps
Six Months Ended June 30, Better / (Worse)2019 2018 Change % Change
(In thousands, except unit and per unit data)
Reported wholesale vehicle:Revenue $ 8,557 $ 14,491 $ (5,934) (40.9)%Gross profit (loss) $ (105) $ 667 $ (772) (115.7)%Unit sales 2,185 2,574 (389) (15.1)%Revenue per unit $ 3,916 $ 5,630 $ (1,714) (30.4)%Gross profit (loss) per unit $ (48) $ 259 $ (307) (118.5)%Gross profit (loss) as a % of revenue (1.2) % 4.6 % (580) bps
53

SONIC AUTOMOTIVE, INC.MANAGEMENT’S DISCUSSION AND ANALYSIS OF FINANCIAL CONDITION AND RESULTS OF OPERATIONS
Our EchoPark Segment same store wholesale vehicle results are as follows:
Three Months Ended June 30, Better / (Worse)2019 2018 Change % Change
(In thousands, except unit and per unit data)
Same store wholesale vehicle:Revenue $ 4,878 $ 4,409 $ 469 10.6 %Gross profit (loss) $ (45) $ 293 $ (338) (115.4)%Unit sales 1,292 784 508 64.8 %Revenue per unit $ 3,776 $ 5,624 $ (1,848) (32.9)%Gross profit (loss) per unit $ (35) $ 374 $ (409) (109.4)%Gross profit (loss) as a % of revenue (0.9) % 6.6 % (750) bps
Six Months Ended June 30, Better / (Worse)2019 2018 Change % Change
(In thousands, except unit and per unit data)
Same store wholesale vehicle:Revenue $ 6,705 $ 11,477 $ (4,772) (41.6)%Gross profit (loss) $ (95) $ 709 $ (804) (113.4)%Unit sales 1,709 1,989 (280) (14.1)%Revenue per unit $ 3,923 $ 5,770 $ (1,847) (32.0)%Gross profit (loss) per unit $ (56) $ 356 $ (412) (115.7)%Gross profit (loss) as a % of revenue (1.4) % 6.2 % (760) bps
EchoPark Segment Wholesale Vehicles - Three Months Ended June 30, 2019 Compared to Three Months Ended June 30, 2018
Wholesale vehicle revenue increased due to increased wholesale vehicle unit sales volume, partially offset by a decrease in wholesale vehicle revenue per unit. Wholesalevehicle gross profit decreased as a result of the evolution of our customer trade-in vehicle appraisal strategy, which has enabled us to trade for more customer vehicles. GivenEchoPark’s retail inventory mix, ultimately the majority of vehicles acquired from customers on trade-ins cannot be sold as retail at our EchoPark stores and are subsequentlysold at auction, affecting our wholesale gross profit (loss). However, a successful acquisition of a customer’s trade-in vehicle often facilitates a retail used vehicle saletransaction that otherwise may not have occurred, driving higher overall gross profit. Our overall EchoPark inventory acquisition and pricing strategy reduces the risk of agedinventory that must be sold at auction (which would typically have a higher gross loss per unit), and increases the volume of trade-ins that we obtain from customers.
EchoPark Segment Wholesale Vehicles - Six Months Ended June 30, 2019 Compared to Six Months Ended June 30, 2018
Wholesale vehicle revenue and wholesale vehicle unit sales volume decreased as a result of a shift in our inventory acquisition and pricing strategy at our EchoParkstores during the second quarter of 2018. Prior to this, EchoPark inventory was subject to increased risk of aging and wholesale loss, which drove higher wholesale transactionvolumes. Wholesale vehicle gross profit decreased as a result of the evolution of our customer trade-in vehicle appraisal strategy, which has enabled us to trade for morecustomer vehicles. Given EchoPark’s retail inventory mix, ultimately the majority of vehicles acquired from customers on trade-ins cannot be sold as retail at our EchoParkstores and are subsequently sold at auction, affecting our wholesale gross profit (loss). However, a successful acquisition of a customer’s trade-in vehicle often facilitates a retailused vehicle sale transaction that otherwise may not have occurred, driving higher overall gross profit.
Fixed Operations - EchoPark Segment
Parts, service and collision repair revenues primarily consist of internal, sublet and other work related to inventory preparation and reconditioning performed on vehiclesthat are sold to customers. When that work is performed by one of our stores, the work is classified as internal. In the event the work is performed by a third party on our behalf,it is classified as sublet.
54

SONIC AUTOMOTIVE, INC.MANAGEMENT’S DISCUSSION AND ANALYSIS OF FINANCIAL CONDITION AND RESULTS OF OPERATIONS
The following tables provide a reconciliation of EchoPark Segment same store basis and reported basis for Fixed Operations:
Three Months Ended June 30, Better / (Worse)2019 2018 Change % Change
(In thousands)
Total Fixed Operations revenue:Same store $ 6,162 $ 3,970 $ 2,192 55.2 %Acquisitions, open points and closures 1,813 541 1,272 235.1 %
Total as reported $ 7,975 $ 4,511 $ 3,464 76.8 %Total Fixed Operations gross profit (loss):
Same store $ (125) $ 528 $ (653) (123.7)%Acquisitions, open points and closures (37) 42 (79) (188.1)%
Total as reported $ (162) $ 570 $ (732) (128.4)%
Six Months Ended June 30, Better / (Worse)2019 2018 Change % Change
(In thousands)
Total Fixed Operations revenue:Same store $ 10,330 $ 8,025 $ 2,305 28.7 %Acquisitions, open points and closures 2,849 1,194 1,655 138.6 %
Total as reported $ 13,179 $ 9,219 $ 3,960 43.0 %Total Fixed Operations gross profit (loss):
Same store $ (293) $ 1,552 $ (1,845) (118.9)%Acquisitions, open points and closures (79) 343 (422) (123.0)%
Total as reported $ (372) $ 1,895 $ (2,267) (119.6)%
Our EchoPark Segment reported Fixed Operations results are as follows:
Three Months Ended June 30, Better / (Worse)2019 2018 Change % Change
(In thousands)
Total reported Fixed Operations:Revenue $ 7,975 $ 4,511 $ 3,464 76.8 %Gross profit (loss) $ (162) $ 570 $ (732) (128.4)%Gross profit (loss) as a % of revenue (2.0) % 12.6 % (1,460) bps
Six Months Ended June 30, Better / (Worse)2019 2018 Change % Change
(In thousands)
Total reported Fixed Operations:Revenue $ 13,179 $ 9,219 $ 3,960 43.0 %Gross profit (loss) $ (372) $ 1,895 $ (2,267) (119.6)%Gross profit (loss) as a % of revenue (2.8) % 20.6 % (2,340) bps
55

SONIC AUTOMOTIVE, INC.MANAGEMENT’S DISCUSSION AND ANALYSIS OF FINANCIAL CONDITION AND RESULTS OF OPERATIONS
Our EchoPark Segment same store Fixed Operations results are as follows:
Three Months Ended June 30, Better / (Worse)2019 2018 Change % Change
(In thousands)
Total same store Fixed Operations:Revenue $ 6,162 $ 3,970 $ 2,192 55.2 %Gross profit (loss) $ (125) $ 528 $ (653) (123.7)%Gross profit (loss) as a % of revenue (2.0) % 13.3 % (1,530) bps
Six Months Ended June 30, Better / (Worse)2019 2018 Change % Change
(In thousands)
Total same store Fixed Operations:Revenue $ 10,330 $ 8,025 $ 2,305 28.7 %Gross profit (loss) $ (293) $ 1,552 $ (1,845) (118.9)%Gross profit (loss) as a % of revenue (2.8) % 19.3 % (2,210) bps
EchoPark Segment Fixed Operations - Three Months Ended June 30, 2019 Compared to Three Months Ended June 30, 2018
Fixed Operations revenue increased approximately $2.2 million, or 55.2%, and Fixed Operations gross profit decreased approximately $0.7 million, or 123.7%, primarilydue to higher vehicle unit sales volume (and resulting inventory requirements) and lower levels of required reconditioning per vehicle based on a shift in our inventoryacquisition and pricing strategy during the second quarter of 2018.
EchoPark Segment Fixed Operations - Six Months Ended June 30, 2019 Compared to Six Months Ended June 30, 2018
Fixed Operations revenue increased approximately $2.3 million, or 28.7%, and Fixed Operations gross profit decreased approximately $1.8 million, or 118.9%, primarilydue to higher vehicle unit sales volume (and resulting inventory requirements) and lower levels of required reconditioning per vehicle based on a shift in our inventoryacquisition and pricing strategy during the second quarter of 2018.
56

SONIC AUTOMOTIVE, INC.MANAGEMENT’S DISCUSSION AND ANALYSIS OF FINANCIAL CONDITION AND RESULTS OF OPERATIONS
Segment Results Summary
In the following tables of financial data, total segment income (loss) of the operating segments is reconciled to consolidated operating income (loss) less interest expense,floor plan:
Three Months Ended June 30, Better / (Worse)2019 2018 Change % Change
(In thousands, except unit data)
Revenues:Franchised Dealerships Segment $ 2,322,400 $ 2,325,583 $ (3,183) (0.1)%EchoPark Segment 291,681 180,166 111,515 61.9 %
Total revenues $ 2,614,081 $ 2,505,749 $ 108,332 4.3 %
Segment income (loss) (1):Franchised Dealerships Segment (2) $ 48,326 $ 66,049 $ (17,723) (26.8)%EchoPark Segment (3) 2,129 (27,347) 29,476 107.8 %
Total segment income (loss) 50,455 38,702 11,753 30.4 %Interest expense, other, net (13,628) (13,375) (253) (1.9)%Other income (expense), net (5) 17 (22) (129.4)%
Income (loss) from continuing operations before taxes $ 36,822 $ 25,344 $ 11,478 45.3 %
Retail new and used vehicle unit sales volume:Franchised Dealerships Segment 57,067 59,197 (2,130) (3.6)%EchoPark Segment 12,587 7,459 5,128 68.7 %
Total retail new and used vehicle unit sales volume 69,654 66,656 2,998 4.5 %
(1) Segment income (loss) for each segment is defined as operating income (loss) less interest expense, floor plan.
(2) For the three months ended June 30, 2018, the above amount includes approximately $38.0 million of net gain on the disposal of franchised dealerships and approximately$2.6 million of benefit related to lease exit adjustments, offset partially by approximately $10.3 million of impairment expense and approximately $3.1 million of storm-related physical damage and legal costs.
(3) For the three months ended June 30, 2018, the above amount includes approximately $23.3 million of non-recurring compensation-related charges.
57

SONIC AUTOMOTIVE, INC.MANAGEMENT’S DISCUSSION AND ANALYSIS OF FINANCIAL CONDITION AND RESULTS OF OPERATIONS
Six Months Ended June 30, Better / (Worse)2019 2018 Change % Change
(In thousands, except unit data)
Revenues:Franchised Dealerships Segment $ 4,461,971 $ 4,594,852 $ (132,881) (2.9)%EchoPark Segment 541,248 311,671 229,577 73.7 %
Total revenues $ 5,003,219 $ 4,906,523 $ 96,696 2.0 %
Segment income (loss) (1):Franchised Dealerships Segment (2) $ 121,856 $ 89,885 $ 31,971 35.6 %EchoPark Segment (3) 2,688 (41,672) 44,360 106.5 %
Total segment income (loss) 124,544 48,213 76,331 158.3 %Interest expense, other, net (26,481) (26,831) 350 1.3 %Other income (expense), net 95 106 (11) (10.4)%
Income (loss) from continuing operations before taxes $ 98,158 $ 21,488 $ 76,670 356.8 %
Retail new and used vehicle unit sales volume:Franchised Dealerships Segment 109,676 116,918 (7,242) (6.2)%EchoPark Segment 23,638 12,977 10,661 82.2 %
Total retail new and used vehicle unit sales volume 133,314 129,895 3,419 2.6 %
(1) Segment income (loss) for each segment is defined as operating income (loss) less interest expense, floor plan.
(2) For the six months ended June 30, 2019, the above amount includes approximately $46.7 million of net gain on the disposal of franchised dealerships, offset partially byapproximately $6.3 million of executive transition costs. For the six months ended June 30, 2018, the above amount includes approximately $39.2 million of net gain onthe disposal of franchised dealerships, offset partially by approximately $4.6 million of storm-related physical damage and legal costs, approximately $2.2 million of leaseexit charges, and approximately $14.0 million of impairment expense.
(3) For the six months ended June 30, 2019, the above amount includes approximately $1.9 million of impairment charges related to fair value adjustments of real estate atformer locations classified as held for sale. For the six months ended June 30, 2018, the above amount includes approximately $32.5 million of non-recurringcompensation-related charges.
Selling, General and Administrative (“SG&A”) Expenses - Consolidated
Consolidated SG&A expenses are comprised of four major groups: compensation expense, advertising expense, rent expense and other expense. Compensation expenseprimarily relates to store personnel who are paid a commission or a salary plus commission and support personnel who are paid a fixed salary. Commissions paid to storepersonnel typically vary depending on gross profits realized and sales volume objectives. Due to the salary component for certain store and corporate personnel, gross profitsand compensation expense do not change in direct proportion to one another. Advertising expense and other expense vary based on the level of actual or anticipated businessactivity and the number of dealerships in operation. Rent expense typically varies with the number of store locations owned, investments made for facility improvements andinterest rates. Other expense includes various fixed and variable expenses, including gain on disposal of franchises, certain customer-related costs such as gasoline and serviceloaners, insurance, training, legal and IT expenses, which may not change in proportion to gross profit levels.
58

SONIC AUTOMOTIVE, INC.MANAGEMENT’S DISCUSSION AND ANALYSIS OF FINANCIAL CONDITION AND RESULTS OF OPERATIONS
The following tables set forth information related to our consolidated reported SG&A expenses:
Three Months Ended June 30, Better / (Worse)2019 2018 Change % Change
(In thousands)
SG&A expenses:Compensation $ 181,197 $ 197,641 $ 16,444 8.3 %Advertising 15,402 16,270 868 5.3 %Rent 13,336 13,702 366 2.7 %Other 84,597 49,849 (34,748) (69.7)%
Total SG&A expenses $ 294,532 $ 277,462 $ (17,070) (6.2)%
SG&A expenses as a % of gross profit:Compensation 47.5 % 54.5 % 700 bpsAdvertising 4.0 % 4.5 % 50 bpsRent 3.5 % 3.8 % 30 bpsOther 22.2 % 13.8 % (840) bps
Total SG&A expenses as a % of gross profit 77.2 % 76.6 % (60) bps
Six Months Ended June 30, Better / (Worse)2019 2018 Change % Change
(In thousands)
SG&A expenses:Compensation $ 365,381 $ 382,678 $ 17,297 4.5 %Advertising 30,453 32,287 1,834 5.7 %Rent 28,586 35,570 6,984 19.6 %Other 117,206 131,852 14,646 11.1 %
Total SG&A expenses $ 541,626 $ 582,387 $ 40,761 7.0 %
SG&A expenses as a % of gross profit:Compensation 49.4 % 53.5 % 410 bpsAdvertising 4.1 % 4.5 % 40 bpsRent 3.9 % 5.0 % 110 bpsOther 15.8 % 18.5 % 270 bps
Total SG&A expenses as a % of gross profit 73.2 % 81.5 % 830 bps
Three Months Ended June 30, 2019 Compared to Three Months Ended June 30, 2018
Overall SG&A expenses increased both in dollar amount and as a percentage of gross profit, primarily due to a net gain on the disposal of franchised dealerships in theprior year period, offset partially by non-recurring compensation-related charges in the prior year period. Compensation expense decreased both in dollar amount and as apercentage of gross profit, primarily due to non-recurring compensation-related charges in the prior year period, offset partially by a higher level of variable sales expenses inthe current year period due to higher levels of sales activity and related gross profit. Advertising expense decreased both in dollar amount and as a percentage of gross profit, aswe focused on targeted advertising where we would expect the best returns for our business. Rent expense decreased both in dollar amount and as a percentage of gross profit,primarily due to the disposal of franchised dealerships, offset partially by a benefit related to lease exit adjustments in the prior year period. Other SG&A expenses increasedboth in dollar amount and as a percentage of gross profit due primarily to a net gain on the disposal of franchised dealerships in the prior year period, offset partially by storm-related physical damage costs in the prior year period.
For the three months ended June 30, 2018, SG&A expenses include approximately $38.0 million of net gain on the disposal of franchised dealerships and approximately$2.6 million of benefit related to lease exit adjustments, offset partially by
59

SONIC AUTOMOTIVE, INC.MANAGEMENT’S DISCUSSION AND ANALYSIS OF FINANCIAL CONDITION AND RESULTS OF OPERATIONS
approximately $23.3 million of non-recurring compensation-related charges and approximately $3.1 million of storm-related physical damage and legal costs.
Six Months Ended June 30, 2019 Compared to Six Months Ended June 30, 2018
Overall SG&A expenses decreased both in dollar amount and as a percentage of gross profit, primarily due to non-recurring compensation-related charges in the prioryear period and a higher net gain on the disposal of franchised dealerships in the current year period. Compensation expense decreased both in dollar amount and as a percentageof gross profit, primarily due to non-recurring compensation-related charges in the prior year period, offset partially by a higher level of variable sales expenses in the currentyear period due to higher levels of sales activity and related gross profit. Advertising expense decreased both in dollar amount and as a percentage of gross profit, as we focusedon targeted advertising where we would expect the best returns for our business. Rent expense decreased both in dollar amount and as a percentage of gross profit, primarily dueto the disposal of franchised dealerships and lease exit charges in the prior year period. Other SG&A expenses decreased both in dollar amount and as a percentage of grossprofit due primarily to a higher net gain on the disposal of franchised dealerships in the current year period and storm-related physical damage and legal costs in the prior yearperiod, in addition to lower training and IT expenses in the current year period as a result of strategic cost-reduction initiatives.
For the six months ended June 30, 2019, SG&A expenses include approximately $46.7 million of net gain on the disposal of franchised dealerships, offset partially byapproximately $6.3 million of executive transition costs. For the six months ended June 30, 2018, SG&A expenses include approximately $39.2 million of net gain on thedisposal of franchised dealerships, offset partially by approximately $32.5 million of non-recurring compensation-related charges, approximately $4.6 million of storm-relatedphysical damage and legal costs and approximately $2.2 million of lease exit charges.
Impairment Charges - Consolidated
Impairment charges decreased approximately $10.3 million and $12.0 million during the three and six months ended June 30, 2019, respectively. There were noimpairment charges for the three months ended June 30, 2019. Impairment charges for the six months ended June 30, 2019 were related to fair value adjustment of long-livedassets held for sale related to real estate at former EchoPark locations. Impairment charges for the six months ended June 30, 2018 include the write-off of certain costsassociated with internally developed software as well as the write-off of capitalized costs associated with the abandonment of certain construction projects.
Depreciation and Amortization - Consolidated
Depreciation expense decreased approximately $0.1 million, or 0.6%, and $1.2 million or 2.6% during the three and six months ended June 30, 2019, respectively. Thedecreases were due primarily to the disposition of four franchised dealerships in the first quarter of 2019.
Interest Expense, Floor Plan - Consolidated
Three Months Ended June 30, 2019 Compared to Three Months Ended June 30, 2018
Interest expense, floor plan for new vehicles increased approximately $0.2 million, or 2.0%. The average new vehicle floor plan notes payable balance decreasedapproximately $10.1 million, resulting in a decrease in new vehicle floor plan interest expense of approximately $0.1 million. The average new vehicle floor plan interest ratewas 3.14%, up from 3.06% in the prior year period, resulting in an increase in new vehicle floor plan interest expense of approximately $0.3 million.
Interest expense, floor plan for used vehicles increased approximately $0.4 million, or 28.6%. The average used vehicle floor plan notes payable balance increasedapproximately $27.3 million, resulting in an increase in used vehicle floor plan interest expense of approximately $0.2 million. The average used vehicle floor plan interest ratewas 3.17%, up from 2.84% in the prior year period, resulting in an increase in used vehicle floor plan interest expense of approximately $0.2 million.
Six Months Ended June 30, 2019 Compared to Six Months Ended June 30, 2018
Interest expense, floor plan for new vehicles increased approximately $2.5 million, or 12.3%. The average new vehicle floor plan notes payable balance decreasedapproximately $4.6 million, resulting in a decrease in new vehicle floor plan interest expense of approximately $0.1 million. The average new vehicle floor plan interest ratewas 3.28%, up from 2.92% in the prior year period, resulting in an increase in new vehicle floor plan interest expense of approximately $2.6 million.
Interest expense, floor plan for used vehicles increased approximately $0.7 million, or 26.3%. The average used vehicle floor plan notes payable balance increasedapproximately $22.8 million, resulting in an increase in used vehicle floor plan
60

SONIC AUTOMOTIVE, INC.MANAGEMENT’S DISCUSSION AND ANALYSIS OF FINANCIAL CONDITION AND RESULTS OF OPERATIONS
interest expense of approximately $0.3 million. The average used vehicle floor plan interest rate was 3.12%, up from 2.78% in the prior year period, resulting in an increase inused vehicle floor plan interest expense of approximately $0.4 million.
Interest Expense, Other, Net - Consolidated
Interest expense, other, net is summarized in the tables below:
Three Months Ended June 30, Better / (Worse)2019 2018 Change % Change
(In thousands)
Stated/coupon interest $ 12,468 $ 13,010 $ 542 4.2 %Deferred loan cost amortization 598 619 21 3.4 %Interest rate hedge expense (benefit) (917) (139) 778 559.7 %Capitalized interest (205) (329) (124) (37.7)%Interest on finance lease liabilities 1,339 — (1,339) (100.0)%Other interest 345 214 (131) (61.2)%
Total interest expense, other, net $ 13,628 $ 13,375 $ (253) (1.9)%
Six Months Ended June 30, Better / (Worse)2019 2018 Change % Change
(In thousands)
Stated/coupon interest $ 24,907 $ 25,755 $ 848 3.3 %Deferred loan cost amortization 1,189 1,217 28 2.3 %Interest rate hedge expense (benefit) (1,514) 50 1,564 3,128.0 %Capitalized interest (884) (649) 235 36.2 %Interest on finance lease liabilities 2,515 — (2,515) (100.0)%Other interest 268 458 190 41.5 %
Total interest expense, other, net $ 26,481 $ 26,831 $ 350 1.3 %
Interest expense, other, net increased approximately $0.3 million during the three months ended June 30, 2019, primarily due to an increase in interest expense related tofinance leases (formerly known as capital leases prior to the adoption of ASC 842, “Leases”) that were entered into during the second half of 2018, offset partially by anincrease in net interest rate hedge receipts. Interest expense, other, net decreased approximately $0.4 million during the six months ended June 30, 2019, primarily due to anincrease in net interest rate hedge receipts and lower stated/coupon interest related to a decrease in mortgage notes payable balances, offset partially by an increase in interestexpense related to finance leases (formerly known as capital leases prior to the adoption of ASC 842, “Leases”) that were entered into during the second half of 2018.
Income Taxes
The overall effective tax rate from continuing operations was 27.4% and 29.6% for the three and six months ended June 30, 2019, respectively, and 32.4% and 29.7% forthe three and six months ended June 30, 2018. Income tax expense for the three months ended June 30, 2019 includes a $0.4 million discrete benefit related to the favorableresolution of certain tax matters. Income tax expense for the six months ended June 30, 2019 includes a $1.5 million discrete charge for non-deductible executive officercompensation related to executive transition costs, a $0.2 million discrete charge related to changes in uncertain tax positions and a $0.2 million discrete charge related to vestedor exercised stock compensation awards, offset partially by a $0.4 million discrete benefit related to the favorable resolution of certain tax matters. Income tax expense for thethree months ended June 30, 2018 includes a $0.6 million discrete charge for non-deductible book goodwill related to dealership dispositions during the period. Income taxexpense for the six months ended June 30, 2018 includes a $0.9 million discrete benefit related to vested or exercised stock compensation awards, offset partially by a$0.2 million discrete charge related to changes in uncertain tax positions and a $0.6 million discrete charge for non-deductible book goodwill related to dealership dispositionsduring the period. Sonic’s effective tax rate varies from year to year based on the level of taxable income, the distribution of taxable income between states in which theCompany operates and other tax adjustments. Sonic expects the annual effective tax rate in future periods to fall within a range of 26.0% to 29.0% before the impact, if any, ofchanges in valuation allowances related to deferred income tax assets or discrete tax adjustments.
61

SONIC AUTOMOTIVE, INC.MANAGEMENT’S DISCUSSION AND ANALYSIS OF FINANCIAL CONDITION AND RESULTS OF OPERATIONS
Liquidity and Capital Resources
We require cash to fund debt service, operating lease obligations, working capital requirements, facility improvements and other capital improvements, dividends on ourcommon stock and to finance acquisitions and otherwise invest in our business. We rely on cash flows from operations, borrowings under our revolving credit and floor planborrowing arrangements, real estate mortgage financing, asset sales and offerings of debt and equity securities to meet these requirements. We closely monitor our availableliquidity and projected future operating results in order to remain in compliance with restrictive covenants under the 2016 Credit Facilities and our other debt obligations andlease arrangements. However, our liquidity could be negatively affected if we fail to comply with the financial covenants in our existing debt or lease arrangements. After givingeffect to the applicable restrictions on the payment of dividends under our debt agreements, as of June 30, 2019, we had approximately $206.8 million of net income andretained earnings free of such restrictions. Cash flows provided by our dealerships are derived from various sources. The primary sources include individual consumers,automobile manufacturers, automobile manufacturers’ captive finance subsidiaries and finance companies. Disruptions in these cash flows could have a material adverse impacton our operations and overall liquidity.
Because the majority of our consolidated assets are held by our dealership subsidiaries, the majority of our cash flows from operations are generated by thesesubsidiaries. As a result, our cash flows and our ability to service our obligations depend to a substantial degree on the results of operations of these subsidiaries and their abilityto provide us with cash.
We had the following liquidity resources available as of June 30, 2019 and December 31, 2018:June 30, 2019 December 31, 2018
(In thousands)
Cash and cash equivalents $ 2,140 $ 5,854 Availability under the 2016 Revolving Credit Facility 202,575 223,922 Availability under our used vehicle floor plan facilities 2,245 1,979 Floor plan deposit balance 95,046 —
Total available liquidity resources $ 302,006 $ 231,755
We participate in a program with two of our manufacturer-affiliated finance companies wherein we maintain a deposit balance (included in the table above) with thelender that earns interest based on the agreed upon rate. This deposit balance is not designated as a prepayment of notes payable – floor plan, nor is it our intent to use thisamount to offset principal amounts owed under notes payable – floor plan in the future, although we have the right and ability to do so. The deposit balance of approximately$95.0 million as of June 30, 2019 is classified in other current assets in the accompanying unaudited condensed consolidated balance sheet as of June 30, 2019. There was nodeposit balance as of December 31, 2018.
Floor Plan Facilities
We finance our new and certain of our used vehicle inventory through standardized floor plan facilities with manufacturer captive finance companies and a syndicate ofmanufacturer-affiliated finance companies and commercial banks. These floor plan facilities are due on demand and bear interest at variable rates based on either LIBOR or theprime rate. The weighted-average interest rate for our combined new and used vehicle floor plan facilities was 3.15% and 3.03% in the three months ended June 30, 2019 and2018, respectively, and 3.26% and 2.90% in the six months ended June 30, 2019 and 2018, respectively.
We receive floor plan assistance from certain manufacturers. Floor plan assistance received is capitalized in inventory and charged against cost of sales when theassociated inventory is sold. We received approximately $9.9 million and $10.3 million in floor plan assistance in the three months ended June 30, 2019 and 2018, respectively,and approximately $19.2 million and $20.7 million in floor plan assistance in the six months ended June 30, 2019 and 2018, respectively. We recognized manufacturer floorplan assistance in cost of sales of approximately $10.3 million and $10.6 million in the three months ended June 30, 2019 and 2018, respectively, and approximately $19.3million and $20.7 million in the six months ended June 30, 2019 and 2018, respectively. Interest payments under each of our floor plan facilities are due monthly and wegenerally are not required to make principal repayments prior to the sale of the associated vehicles.
Long-Term Debt and Credit Facilities
See Note 6, “Long-Term Debt,” to the accompanying unaudited condensed consolidated financial statements for a discussion of our long-term debt and credit facilitiesand compliance with debt covenants.
62

SONIC AUTOMOTIVE, INC.MANAGEMENT’S DISCUSSION AND ANALYSIS OF FINANCIAL CONDITION AND RESULTS OF OPERATIONS
Capital Expenditures
Our capital expenditures include the purchase of land and buildings, the construction of new franchised dealerships, EchoPark stores, collision repair centers, buildingimprovements and equipment purchased for use in our franchised dealerships and EchoPark stores. We selectively construct new or improve existing dealership facilities tomaintain compliance with manufacturers’ image requirements. We typically finance these projects through cash flows from operations, new mortgages or, alternatively, throughour credit facilities.
Capital expenditures in the six months ended June 30, 2019 were approximately $51.2 million. Of this amount, approximately $42.0 million was related to facilityconstruction projects, while fixed assets utilized in our store operations accounted for the remaining $9.2 million of capital expenditures.
All of the capital expenditures in the six months ended June 30, 2019 were funded through cash from operations. As of June 30, 2019, commitments for facilityconstruction projects totaled approximately $26.3 million. We expect investments related to capital expenditures to be partly dependent upon our overall liquidity position andthe availability of mortgage financing to fund significant capital projects.
Stock Repurchase Program
Our Board of Directors has authorized us to repurchase shares of our Class A Common Stock. Historically, we have used our share repurchase authorization to offsetdilution caused by the exercise of stock options or the vesting of equity compensation awards and to maintain our desired capital structure. During the six months ended June30, 2019, we repurchased approximately 0.2 million shares of our Class A Common Stock for approximately $2.4 million in connection with tax withholding on the vesting ofequity compensation awards. As of June 30, 2019, our total remaining repurchase authorization was approximately $81.2 million. Under the 2016 Credit Facilities, sharerepurchases are permitted to the extent that no event of default exists and we do not exceed the restrictions set forth in the agreements. After giving effect to the applicablerestrictions on share repurchases and certain other transactions under our debt agreements, as of June 30, 2019, we had at least $206.8 million of net income and retainedearnings free of such restrictions.
Our share repurchase activity is subject to the business judgment of our Board of Directors and management, taking into consideration our historical and projectedresults of operations, financial condition, cash flows, capital requirements, covenant compliance, current economic environment and other factors considered relevant. Thesefactors are considered each quarter and will be scrutinized as our Board of Directors and management determine our share repurchase policy in the future.
Dividends
During the three months ended June 30, 2019, our Board of Directors approved a cash dividend of $0.10 per share on all outstanding shares of Class A and Class BCommon Stock as of June 14, 2019, which was paid on July 15, 2019. Subsequent to June 30, 2019, our Board of Directors approved a cash dividend of $0.10 per share on alloutstanding shares of Class A and Class B Common Stock as of September 13, 2019 to be paid on October 15, 2019. Under the 2016 Credit Facilities, dividends are permittedto the extent that no event of default exists and we are in compliance with the financial covenants contained therein. The indentures governing the 5.0% Notes and the 6.125%Notes also contain restrictions on our ability to pay dividends. After giving effect to the applicable restrictions on share repurchases and certain other transactions under ourdebt agreements, as of June 30, 2019, we had at least $206.8 million of net income and retained earnings free of such restrictions. The payment of any future dividend is subjectto the business judgment of our Board of Directors, taking into consideration our historical and projected results of operations, financial condition, cash flows, capitalrequirements, covenant compliance, share repurchases, current economic environment and other factors considered relevant. These factors are considered each quarter and willbe scrutinized as our Board of Directors determines our future dividend policy. There is no guarantee that additional dividends will be declared and paid at any time in thefuture. See Note 6, “Long-Term Debt,” to the accompanying unaudited condensed consolidated financial statements for a description of restrictions on the payment ofdividends.
Cash Flows
Net cash used in operating activities in the six months ended June 30, 2019 was approximately $56.9 million. This use of cash was comprised primarily of an increase inother assets and a decrease in notes payable – floor plan – trade and inventories, offset partially by a decrease in receivables and cash inflows related to operating profits. In thesix months ended June 30, 2018, net cash provided by operating activities was approximately $38.1 million. This provision of cash was comprised primarily of cash inflowsrelated to operating profits and a decrease in receivables, offset partially by an increase in inventories and a decrease in notes payable – floor plan – trade.
Net cash provided by investing activities in the six months ended June 30, 2019 was approximately $72.4 million. This provision of cash was comprised primarily ofproceeds from the sale of four franchised dealerships and property and equipment, offset partially by purchases of land, property and equipment. Net cash provided by investingactivities in the six
63

SONIC AUTOMOTIVE, INC.MANAGEMENT’S DISCUSSION AND ANALYSIS OF FINANCIAL CONDITION AND RESULTS OF OPERATIONS
months ended June 30, 2018 was approximately $35.4 million. This provision of cash was comprised primarily of proceeds from the sale of five franchised dealerships, offsetpartially by purchases of land, property and equipment.
Net cash used in financing activities in the six months ended June 30, 2019 was approximately $19.3 million. This use of cash was comprised primarily of payments onlong-term debt, dividends paid and purchases of treasury stock, offset partially by net borrowings on notes payable - floor plan - non-trade. Net cash used in financing activitiesin the six months ended June 30, 2018 was approximately $71.7 million. This use of cash was comprised primarily of net payments on revolving credit facilities, purchases oftreasury stock and payments on long-term debt, offset partially by proceeds from mortgage notes.
We arrange our inventory floor plan financing through both manufacturer captive finance companies and a syndicate of manufacturer-affiliated finance companies andcommercial banks. Our floor plan financed with manufacturer captives is recorded as trade floor plan liabilities (with the resulting change being reflected as operating cashflows). Our dealerships that obtain floor plan financing from a syndicate of manufacturer-affiliated finance companies and commercial banks record their obligation as non-trade floor plan liabilities (with the resulting change being reflected as financing cash flows). Due to the presentation differences for changes in trade floor plan and non-tradefloor plan in the accompanying unaudited condensed consolidated statements of cash flows, decisions made by us to move dealership floor plan financing arrangements fromone finance source to another may cause significant variations in operating and financing cash flows without affecting our overall liquidity, working capital or cash flow. Netcash used in combined trade and non-trade floor plan financing was approximately $66.2 million and $48.6 million in the six months ended June 30, 2019 and 2018,respectively. Accordingly, if all changes in floor plan notes payable were classified as an operating activity, the result would have been net cash used in operating activities ofapproximately $55.2 million in the six months ended June 30, 2019 and net cash provided by operating activities of approximately $49.2 million in the six months ended June30, 2018.
One factor that management uses to measure cash flow generation or use is the Adjusted EBITDA, a non-GAAP measure, for each of the Company’s operatingsegments. That measure is provided in the tables below:
Three Months Ended June 30, 2019 Three Months Ended June 30, 2018FranchisedDealerships
SegmentEchoParkSegment
DiscontinuedOperations Total
FranchisedDealerships
SegmentEchoParkSegment
DiscontinuedOperations Total
(In thousands)Net income (loss) $ 26,599 $ 16,905
Provision for income taxes 10,010 8,142 Income (loss) before taxes $ 35,129 $ 1,693 $ (213) $ 36,609 $ 53,176 $ (27,832) $ (297) $ 25,047 Non-floor plan interest (1) 12,013 426 — 12,439 11,757 401 106 12,264 Depreciation & amortization (2) 22,322 2,674 — 24,996 23,393 1,925 — 25,318 Stock-based compensation expense 2,612 — — 2,612 3,049 — — 3,049 Loss (gain) on exit of leased dealerships (170) — — (170) 2,337 12 215 2,564 Asset impairment charges — — — — 10,317 — — 10,317 Loss (gain) on debt extinguishment — — — — — — — — Long-term compensation charges — — — — — 23,333 — 23,333 Loss (gain) on franchise disposals 356 — — 356 (38,047) — — (38,047)
Adjusted EBITDA (3) $ 72,262 $ 4,793 $ (213) $ 76,842 $ 65,982 $ (2,161) $ 24 $ 63,845
(1) Includes the following line items from the accompanying unaudited condensed consolidated statements of income, net of any amortization of debt issuance costs or net debtdiscount/premium included in (2) below: interest expense, other, net; interest expense, non-cash, convertible debt; and interest expense/amortization, non-cash, cash flowswaps.
(2) Includes the following line items from the accompanying unaudited condensed consolidated statements of cash flows: depreciation and amortization of property andequipment; debt issuance cost amortization; and net debt discount/premium amortization and other amortization.
(3) Adjusted EBITDA is a non-GAAP measure.
64

SONIC AUTOMOTIVE, INC.MANAGEMENT’S DISCUSSION AND ANALYSIS OF FINANCIAL CONDITION AND RESULTS OF OPERATIONS
Six Months Ended June 30, 2019 Six Months Ended June 30, 2018FranchisedDealerships
SegmentEchoParkSegment
DiscontinuedOperations Total
FranchisedDealerships
SegmentEchoParkSegment
DiscontinuedOperations Total
(In thousands)Net income (loss) $ 68,821 $ 14,711
Provision for income taxes 28,944 6,232 Income (loss) before taxes $ 96,284 $ 1,874 $ (393) $ 97,765 $ 64,006 $ (42,518) $ (545) $ 20,943 Non-floor plan interest (1) 24,428 864 — 25,292 24,819 795 221 25,835 Depreciation & amortization (2) 42,560 5,085 — 47,645 45,630 3,586 — 49,216 Stock-based compensation expense 5,426 — — 5,426 6,011 — — 6,011 Loss (gain) on exit of leased dealerships (170) — — (170) 2,337 12 215 2,564 Asset impairment charges 26 1,926 — 1,952 13,878 82 — 13,960 Loss (gain) on debt extinguishment — — — — — — — — Long-term compensation charges — — — — — 32,522 — 32,522 Loss (gain) on franchise disposals (46,394) — — (46,394) (39,238) — — (39,238)
Adjusted EBITDA (3) $ 122,160 $ 9,749 $ (393) $ 131,516 $ 117,443 $ (5,521) $ (109) $ 111,813
(1) Includes the following line items from the accompanying unaudited condensed consolidated statements of income, net of any amortization of debt issuance costs or net debtdiscount/premium included in (2) below: interest expense, other, net; interest expense, non-cash, convertible debt; interest expense/amortization, non-cash, cash flowswaps.
(2) Includes the following line items from the accompanying unaudited condensed consolidated statements of cash flows: depreciation and amortization of property andequipment, debt issuance cost amortization, net debt discount/premium amortization and other amortization.
(3) Adjusted EBITDA is a non-GAAP measure.
Future Liquidity Outlook
We believe our best sources of liquidity for operations and debt service remain cash flows generated from operations combined with the availability of borrowings underour floor plan facilities (or any replacements thereof) and the 2016 Credit Facilities (or any replacements thereof), real estate mortgage financing, selected dealership and otherasset sales and our ability to raise funds in the capital markets through offerings of debt or equity securities. Because the majority of our consolidated assets are held by ourdealership subsidiaries, the majority of our cash flows from operations are generated by these subsidiaries. As a result, our cash flows and our ability to service our obligationsdepend to a substantial degree on the results of operations of these subsidiaries and their ability to provide us with cash.
Off-Balance Sheet Arrangements
Guarantees and Indemnification Obligations
In accordance with the terms of our operating lease agreements, our dealership subsidiaries, acting as lessees, generally agree to indemnify the lessor from certainexposure arising as a result of the use of the leased premises, including environmental exposure and repairs to leased property upon termination of the lease. In addition, wehave generally agreed to indemnify the lessor in the event of a breach of the lease by the lessee.
In connection with dealership dispositions and facility relocations, certain of our subsidiaries have assigned or sublet to the buyer their interests in real property leasesassociated with such dealerships. In general, the subsidiaries retain responsibility for the performance of certain obligations under such leases, including rent payments andrepairs to leased property upon termination of the lease, to the extent that the assignee or sublessee does not perform. In the event an assignee or a sublessee does not perform itsobligations, we remain liable for such obligations.
In accordance with the terms of agreements entered into for the sale of our dealerships, we generally agree to indemnify the buyer from certain liabilities and costsarising subsequent to the date of sale, including environmental exposure and exposure resulting from the breach of representations or warranties made in accordance with theagreements. While our exposure with respect to environmental remediation and repairs is difficult to quantify, our maximum exposure associated with these generalindemnifications was approximately $28.0 million and $13.2 million at June 30, 2019 and December 31, 2018, respectively. These indemnifications typically expire within aperiod of one to three years following the date of sale. The
65

SONIC AUTOMOTIVE, INC.MANAGEMENT’S DISCUSSION AND ANALYSIS OF FINANCIAL CONDITION AND RESULTS OF OPERATIONS
estimated fair value of these indemnifications was not material and the amount recorded for this contingency was not significant at June 30, 2019.
We also guarantee the floor plan commitments of our 50%-owned joint venture, the amount of which was approximately $4.3 million at both June 30, 2019 andDecember 31, 2018.
See Note 7, “Commitments and Contingencies,” to the accompanying unaudited condensed consolidated financial statements and Note 12, “Commitments andContingencies,” to the consolidated financial statements in our Annual Report on Form 10-K for the year ended December 31, 2018 for further discussion regarding theseguarantees and indemnification obligations.
Seasonality
Our operations are subject to seasonal variations. The first quarter historically has contributed less operating profit than the second and third quarters, while the fourthquarter historically has contributed the highest operating profit of any quarter. Weather conditions, the timing of manufacturer incentive programs and model changeovers causeseasonality and may adversely affect vehicle demand and, consequently, our profitability. Comparatively, parts and service demand remains stable throughout the year.
66

SONIC AUTOMOTIVE, INC.
Item 3. Quantitative and Qualitative Disclosures About Market Risk.
Interest Rate Risk
Our variable rate floor plan facilities, the 2016 Revolving Credit Facility and our other variable rate notes expose us to risks caused by fluctuations in the applicableinterest rates. The total outstanding balance of such variable instruments, after considering the effect of our interest rate caps (see below), was approximately $893.8 million atJune 30, 2019. An increase in interest rates of 100 basis points would have caused a change in interest expense of approximately $5.5 million in the six months ended June 30,2019. Of the total change in interest expense, approximately $4.6 million would have resulted from our floor plan facilities.
In addition to our variable rate debt, certain of our dealership lease facilities have monthly lease payments that fluctuate based on LIBOR interest rates. An increase ininterest rates of 100 basis points would not have had a significant impact on rent expense in the six months ended June 30, 2019 due to the leases containing LIBOR floorswhich were above the LIBOR rate during the six months ended June 30, 2019.
We also have interest rate cap agreements designated as hedging instruments to limit our exposure to increases in LIBOR rates above certain levels. Under the terms ofthese interest rate caps, interest rates reset monthly. The fair value of the outstanding interest rate cap positions at June 30, 2019 was an asset of approximately $0.7 million, withapproximately $0.4 million included in other current assets and approximately $0.3 million included in other assets in the accompanying unaudited condensed consolidatedbalance sheets. During the six months ended June 30, 2018, we terminated all of our previously outstanding interest rate cash flow swap agreements for net cash proceeds ofapproximately $4.8 million, which will be amortized into income as a reduction of interest expense, other, net on a ratable basis over the original term of these agreements(through July 1, 2020). The fair value of the outstanding interest rate cap positions at December 31, 2018 was a net asset of approximately $4.8 million, with approximately $1.8million included in other current assets and approximately $3.0 million included in other assets in the accompanying unaudited condensed consolidated balance sheets. SeeNote 6, “Long-Term Debt,” to the accompanying unaudited condensed consolidated financial statements for a discussion of our outstanding interest rate instruments.
Foreign Currency Risk
We purchase certain of our new vehicle and parts inventories from foreign manufacturers. Although we purchase our inventories in U.S. dollars, our business is subjectto foreign exchange rate risk that may influence automobile manufacturers’ ability to provide their products at competitive prices in the United States. To the extent that wecannot recapture this volatility in prices charged to customers or if this volatility negatively impacts consumer demand for our products, this volatility could adversely affect ourfuture operating results.
67

SONIC AUTOMOTIVE, INC.
Item 4. Controls and Procedures.
Disclosure Controls and Procedures – Under the supervision and with the participation of our management, including our Chief Executive Officer (“CEO”) and ChiefFinancial Officer (“CFO”), we evaluated the effectiveness of our disclosure controls and procedures (as such term is defined in Rule 13a-15(e) and Rule 15d-15(e) under theSecurities Exchange Act of 1934, as amended) as of June 30, 2019. Based upon that evaluation, our CEO and CFO concluded that our disclosure controls and procedures wereeffective as of June 30, 2019.
Changes in Internal Control over Financial Reporting – We implemented the new lease standard as of January 1, 2019. As a result, we made significant modificationsto internal control over financial reporting during the first quarter of 2019, including changes to accounting policies and procedures, operational processes and documentationpractices.
Other than the items described above, there has been no change in our internal control over financial reporting during the three months ended June 30, 2019, that hasmaterially affected, or is reasonably likely to materially affect, our internal control over financial reporting.
Because of its inherent limitations, internal control over financial reporting can provide only reasonable assurance that the objectives of the control system are met andmay not prevent or detect misstatements. In addition, any evaluation of the effectiveness of internal control over financial reporting in future periods is subject to risk that thoseinternal controls may become inadequate because of changes in conditions, or that the degree of compliance with the policies or procedures may deteriorate.
68

SONIC AUTOMOTIVE, INC.
PART II – OTHER INFORMATION
Item 1. Legal Proceedings.
We are involved, and expect to continue to be involved, in various legal and administrative proceedings arising out of the conduct of our business, including regulatoryinvestigations and private civil actions brought by plaintiffs purporting to represent a potential class or for which a class has been certified. Although we vigorously defendourselves in all legal and administrative proceedings, the outcomes of pending and future proceedings arising out of the conduct of our business, including litigation withcustomers, employment-related lawsuits, contractual disputes, class actions, purported class actions and actions brought by governmental authorities, cannot be predicted withcertainty. An unfavorable resolution of one or more of these matters could have a material adverse effect on our business, financial condition, results of operations, cash flowsor prospects.
Included in other accrued liabilities and other long-term liabilities in the accompanying unaudited condensed consolidated balance sheet as of June 30, 2019 wasapproximately $1.4 million and $0.3 million, respectively, in reserves that we were holding for pending proceedings. Except as reflected in such reserves, we are currentlyunable to estimate a range of reasonably possible loss, or a range of reasonably possible loss in excess of the amount accrued, for pending proceedings.
69

SONIC AUTOMOTIVE, INC.
Item 1A. Risk Factors.
There have been no material changes in our risk factors from those included in “Item 1A. Risk Factors” in our Annual Report on Form 10-K for the year endedDecember 31, 2018, except as noted below.
Our business may be adversely affected by import product restrictions and foreign trade risks that may impair our ability to sell foreign vehicles profitably.
A significant portion of our new vehicle business involves the sale of vehicles, parts, or vehicles composed of parts that are manufactured outside the United States. As aresult, our operations are subject to risks of importing merchandise, including fluctuations in the relative values of currencies, import duties or tariffs, exchange controls, traderestrictions, work stoppages, and general political and socioeconomic conditions in other countries. The United States or the countries from which our products are importedmay, from time to time, impose new quotas, duties, tariffs or other restrictions, or adjust presently prevailing quotas, duties or tariffs, which may affect our operations and ourability to purchase imported vehicles and/or parts at reasonable prices, which may negatively affect the consumer-affordability of certain new vehicles and reduce demand forcertain vehicle makes and models.
Reforms to and uncertainty regarding the London InterBank Offered Rate (“LIBOR”) may adversely affect our business, financial condition and results ofoperations.
The United Kingdom Financial Conduct Authority announced in July 2017 that it will no longer persuade or require banks to submit rates for LIBOR after 2021. Thisannouncement, in conjunction with financial benchmark reforms more generally and changes in the interbank lending markets, have resulted in uncertainty about the future ofLIBOR and certain other rates or indices which have historically been used as interest rate “benchmarks” in financial contracts, including, but not limited to, floor plan notespayable, variable-rate mortgage notes, interest rate swap agreements and interest rate cap agreements. These actions and uncertainties may have the effect of triggering futurechanges in the rules or methodologies used to calculate benchmarks or lead to the discontinuation or unavailability of benchmarks. Additionally, there can be no assurance thatwe and other market participants will be adequately prepared for an actual discontinuation of benchmarks, including LIBOR, that existing assets and liabilities based on orlinked to benchmarks will transition successfully to alternative reference rates or benchmarks or of the timing of adoption and degree of integration of such alternative referencerates or benchmarks in the markets. The discontinuation of benchmarks, including LIBOR, may have an unpredictable impact on the contractual mechanics of financialcontracts (including, but not limited to, interest rates to be paid to or by us), require renegotiation of outstanding financial assets and liabilities, cause significant disruption tofinancial markets that are relevant to our business, increase the risk of litigation and/or increase expenses related to the transition to alternative reference rates or benchmarks,among other adverse consequences. Additionally, any transition from current benchmarks may alter the Company’s risk profiles and models, valuation tools, cost of financingand effectiveness of hedging strategies. Reforms to and uncertainty regarding transitions from current benchmarks may adversely affect our business, financial condition orresults of operations.
70

SONIC AUTOMOTIVE, INC.
Item 2. Unregistered Sales of Equity Securities and Use of Proceeds.
The following table sets forth information about the shares of Class A Common Stock we repurchased during the three months ended June 30, 2019:
Total Number of SharesPurchased
Average Price Paid perShare
Total Number of SharesPurchased as Part of
Publicly Announced Plansor Programs (1)
Approximate Dollar Valueof Shares that May Yet BePurchased Under the Plans
or Programs (1)(In thousands, except per share data)
April 2019 4 $ 14.81 4 $ 81,194 May 2019 — $ — — $ 81,194 June 2019 — $ — — $ 81,194
Total 4 4
(1) On February 13, 2017, we announced that our Board of Directors had increased the dollar amount authorized for us to repurchase shares of our Class A Common Stockpursuant to our share repurchase program. Our share repurchase program does not have an expiration date and current remaining availability under the program is asfollows:
(In thousands)
February 2017 authorization $ 100,000 Total active program repurchases prior to June 30, 2019 (18,806)Current remaining availability as of June 30, 2019 $ 81,194
See “Item 2. Management’s Discussion and Analysis of Financial Condition and Results of Operations” for additional discussion of restrictions on share repurchases andpayment of dividends.
71

SONIC AUTOMOTIVE, INC.
Item 6. Exhibits.
Exhibit No. Description
3.1 Amended and Restated Certificate of Incorporation of Sonic Automotive, Inc., dated August 7, 1997 (incorporated by reference to Exhibit 3.1 to the QuarterlyReport on Form 10-Q for the quarter ended March 31, 2017 (File No. 001-13395)).
3.2 Certificate of Designation, Preferences and Rights of Class A Convertible Preferred Stock, dated March 20, 1998 (incorporated by reference to Exhibit 3.2 to theQuarterly Report on Form 10-Q for the quarter ended March 31, 2017 (File No. 001-13395)).
3.3 Certificate of Amendment to the Amended and Restated Certificate of Incorporation of Sonic Automotive, Inc., dated June 16, 1999 (incorporated by reference toExhibit 3.3 to the Quarterly Report on Form 10-Q for the quarter ended March 31, 2017 (File No. 001-13395)).
3.4 Certificate of Amendment to the Amended and Restated Certificate of Incorporation of Sonic Automotive, Inc., dated April 18, 2017 (incorporated by referenceto Exhibit 3.4 to the Quarterly Report on Form 10-Q for the quarter ended March 31, 2017 (File No. 001-13395)).
3.5 Amended and Restated Bylaws of Sonic Automotive, Inc., dated July 27, 2017 (incorporated by reference to Exhibit 3.5 to the Quarterly Report on Form 10-Qfor the quarter ended June 30, 2017 (File No. 001-13395)).
10.1 Sonic Automotive, Inc. 2012 Stock Incentive Plan, amended and restated as of April 24, 2019 (incorporated by reference to Exhibit 10.1 to the Current Report onForm 8-K filed April 26, 2019 (File No. 001-13395)). (1)
31.1* Certification of Principal Financial Officer pursuant to Rule 13a-14(a)/15d-14(a), as adopted pursuant to Section 302 of the Sarbanes-Oxley Act of 2002.
31.2* Certification of Principal Executive Officer pursuant to Rule 13a-14(a)/15d-14(a), as adopted pursuant to Section 302 of the Sarbanes-Oxley Act of 2002.
32.1** Certification of Principal Financial Officer pursuant to 18 U.S.C. Section 1350, as adopted pursuant to Section 906 of the Sarbanes-Oxley Act of 2002.
32.2** Certification of Principal Executive Officer pursuant to 18 U.S.C. Section 1350, as adopted pursuant to Section 906 of the Sarbanes-Oxley Act of 2002.
101.INS* XBRL Instance Document.
101.SCH* XBRL Taxonomy Extension Schema Document.
101.CAL* XBRL Taxonomy Extension Calculation Linkbase Document.
101.DEF* XBRL Taxonomy Extension Definition Linkbase Document.
101.LAB* XBRL Taxonomy Extension Label Linkbase Document.
101.PRE* XBRL Taxonomy Extension Presentation Linkbase Document.
_______________________________* Filed herewith.** Furnished herewith.(1) Indicates a management contract or compensatory plan or arrangement.
72

SONIC AUTOMOTIVE, INC.
SIGNATURES
Pursuant to the requirements of the Securities Exchange Act of 1934, the registrant has duly caused this report to be signed on its behalf by the undersigned thereuntoduly authorized.
SONIC AUTOMOTIVE, INC.
July 25, 2019 By: /s/ DAVID BRUTON SMITHDavid Bruton Smith
Chief Executive Officer
July 25, 2019 By: /s/ HEATH R. BYRDHeath R. Byrd
Executive Vice President and Chief Financial Officer

Exhibit 31.1
CERTIFICATION
I, Heath R. Byrd, certify that:1. I have reviewed this Quarterly Report on Form 10-Q of Sonic Automotive, Inc.;2. Based on my knowledge, this report does not contain any untrue statement of a material fact or omit to state a material fact necessary to make the statements made, in
light of the circumstances under which such statements were made, not misleading with respect to the period covered by this report;3. Based on my knowledge, the financial statements, and other financial information included in this report, fairly present in all material respects the financial condition,
results of operations and cash flows of the registrant as of, and for, the periods presented in this report;4. The registrant’s other certifying officer and I are responsible for establishing and maintaining disclosure controls and procedures (as defined in Exchange Act Rules 13a-
15(e) and 15d-15(e)) and internal control over financial reporting (as defined in Exchange Act Rules 13a-15(f) and 15d-15(f)) for the registrant and have:a. Designed such disclosure controls and procedures, or caused such disclosure controls and procedures to be designed under our supervision, to ensure that
material information relating to the registrant, including its consolidated subsidiaries, is made known to us by others within those entities, particularly duringthe period in which this report is being prepared;
b. Designed such internal control over financial reporting, or caused such internal control over financial reporting to be designed under our supervision, to providereasonable assurance regarding the reliability of financial reporting and the preparation of financial statements for external purposes in accordance withgenerally accepted accounting principles;
c. Evaluated the effectiveness of the registrant’s disclosure controls and procedures and presented in this report our conclusions about the effectiveness of thedisclosure controls and procedures, as of the end of the period covered by this report based on such evaluation; and
d. Disclosed in this report any change in the registrant’s internal control over financial reporting that occurred during the registrant’s most recent fiscal quarter (theregistrant’s fourth fiscal quarter in the case of an annual report) that has materially affected, or is reasonably likely to materially affect, the registrant’s internalcontrol over financial reporting; and
5. The registrant’s other certifying officer and I have disclosed, based on our most recent evaluation of internal control over financial reporting, to the registrant’s auditorsand the audit committee of the registrant’s board of directors (or persons performing the equivalent functions):
a. All significant deficiencies and material weaknesses in the design or operation of internal control over financial reporting which are reasonably likely toadversely affect the registrant’s ability to record, process, summarize and report financial information; and
b. Any fraud, whether or not material, that involves management or other employees who have a significant role in the registrant’s internal control over financialreporting.
July 25, 2019
By: /s/ HEATH R. BYRDHeath R. ByrdExecutive Vice President and Chief Financial Officer

Exhibit 31.2
CERTIFICATION
I, David Bruton Smith, certify that:1. I have reviewed this Quarterly Report on Form 10-Q of Sonic Automotive, Inc.;2. Based on my knowledge, this report does not contain any untrue statement of a material fact or omit to state a material fact necessary to make the statements made, in
light of the circumstances under which such statements were made, not misleading with respect to the period covered by this report;3. Based on my knowledge, the financial statements, and other financial information included in this report, fairly present in all material respects the financial condition,
results of operations and cash flows of the registrant as of, and for, the periods presented in this report;4. The registrant’s other certifying officer and I are responsible for establishing and maintaining disclosure controls and procedures (as defined in Exchange Act Rules 13a-
15(e) and 15d-15(e)) and internal control over financial reporting (as defined in Exchange Act Rules 13a-15(f) and 15d-15(f)) for the registrant and have:a. Designed such disclosure controls and procedures, or caused such disclosure controls and procedures to be designed under our supervision, to ensure that
material information relating to the registrant, including its consolidated subsidiaries, is made known to us by others within those entities, particularly duringthe period in which this report is being prepared;
b. Designed such internal control over financial reporting, or caused such internal control over financial reporting to be designed under our supervision, to providereasonable assurance regarding the reliability of financial reporting and the preparation of financial statements for external purposes in accordance withgenerally accepted accounting principles;
c. Evaluated the effectiveness of the registrant’s disclosure controls and procedures and presented in this report our conclusions about the effectiveness of thedisclosure controls and procedures, as of the end of the period covered by this report based on such evaluation; and
d. Disclosed in this report any change in the registrant’s internal control over financial reporting that occurred during the registrant’s most recent fiscal quarter (theregistrant’s fourth fiscal quarter in the case of an annual report) that has materially affected, or is reasonably likely to materially affect, the registrant’s internalcontrol over financial reporting; and
5. The registrant’s other certifying officer and I have disclosed, based on our most recent evaluation of internal control over financial reporting, to the registrant’s auditorsand the audit committee of the registrant’s board of directors (or persons performing the equivalent functions):
a. All significant deficiencies and material weaknesses in the design or operation of internal control over financial reporting which are reasonably likely toadversely affect the registrant’s ability to record, process, summarize and report financial information; and
b. Any fraud, whether or not material, that involves management or other employees who have a significant role in the registrant’s internal control over financialreporting.
July 25, 2019
By: /s/ DAVID BRUTON SMITHDavid Bruton SmithChief Executive Officer

Exhibit 32.1
CERTIFICATION PURSUANT TO18 U.S.C. SECTION 1350,
AS ADOPTED PURSUANT TOSECTION 906 OF THE SARBANES-OXLEY ACT OF 2002
In connection with the Quarterly Report of Sonic Automotive, Inc. (the Company) on Form 10-Q for the period ended June 30, 2019, as filed with the Securities and ExchangeCommission on the date hereof (the Report), I, Heath R. Byrd, Executive Vice President and Chief Financial Officer of the Company, certify, pursuant to 18 U.S.C. § 1350, asadopted pursuant to § 906 of the Sarbanes-Oxley Act of 2002, that to my knowledge:
1. The Report fully complies with the requirements of Section 13(a) or 15(d) of the Securities Exchange Act of 1934, as amended; and2. The information contained in the Report fairly presents, in all material respects, the financial condition and results of operations of the Company.
/s/ HEATH R. BYRDHeath R. ByrdExecutive Vice President and Chief Financial OfficerJuly 25, 2019

Exhibit 32.2
CERTIFICATION PURSUANT TO18 U.S.C. SECTION 1350,
AS ADOPTED PURSUANT TOSECTION 906 OF THE SARBANES-OXLEY ACT OF 2002
In connection with the Quarterly Report of Sonic Automotive, Inc. (the Company) on Form 10-Q for the period ended June 30, 2019, as filed with the Securities and ExchangeCommission on the date hereof (the Report), I, David Bruton Smith, Chief Executive Officer of the Company, certify, pursuant to 18 U.S.C. § 1350, as adopted pursuant to §906 of the Sarbanes-Oxley Act of 2002, that to my knowledge:
1. The Report fully complies with the requirements of Section 13(a) or 15(d) of the Securities Exchange Act of 1934, as amended; and2. The information contained in the Report fairly presents, in all material respects, the financial condition and results of operations of the Company.
/s/ DAVID BRUTON SMITHDavid Bruton SmithChief Executive OfficerJuly 25, 2019