Embed Size (px)
Citation preview
Automotive Aftermarket | April 1, 2016 1 Jefferies.com
Automotive Aftermarket JEFFERIES WEEKLY GLOBAL AUTOMOTIVE AFTERMARKET REPORT April 1, 2016
INVESTMENT BANKING
LTM Trading Multiples (EV / LTM EBITDA)
Automotive Aftermarket
Trading Multiples
4/1/2016 1 Year Ago
Automotive Aftermarket Index 12.5x 12.2x
Suppliers 9.5x 9.5x
Parts Retailers & Distributors 13.3x 13.0x
Service Providers 16.5x 16.4x
Collision 13.1x 12.6x
Source: Capital IQ
9.5x
13.3x
16.5x
13.1x 12.5x
8.0x
9.0x
10.0x
11.0x
12.0x
13.0x
14.0x
15.0x
16.0x
17.0x
18.0x
19.0x
Suppliers Parts Retailers & Distributors
Retail Service Providers Collision
Automotive Aftermarket Index
Twelve Month Price Performance
105.1%
117.8%
110.9% 113.2%
105.5%
100.0%
80%
90%
100%
110%
120%
130%
Suppliers Parts Retailers & DistributorsRetail Service Providers CollisionAutomotive Aftermarket Index S&P 500Automotive Aftermarket Equity
Index Returns
1 Week 1 Month
S&P 500 1.8% 4.8%
Automotive Aftermarket Index 1.0% 3.2%
Suppliers 1.2% 6.1%
Parts Retailers & Distributors 0.8% 3.2%
Service Providers 2.7% 4.6%
Collision 3.5% 7.2%
Note: Represents market-weighted indexSource: Capital IQ
Suppliers: AXTA, CTB, DORM, FDML, GT, HZN, MPAA, SMP; Parts Retailers & Distributors: AAP, AZO, GPC, KAR, ORLY, PRTS, SNA, UNS; Retail Service Provider: MNRO; Collision: BYD.UN, CPRT, FENX, KAR, LKQ
4.0% 5.0% 5.1%
4.1% 5.1%
(0.9%)
3.5%
5.4%
3.5%
5.0% 5.1%
1.4%
$1.50
$1.70
$1.90
$2.10
$2.30
$2.50
$2.70
$2.90
(7.0%)
(5.0%)
(3.0%)
(1.0%)
1.0%
3.0%
5.0%
7.0%
9.0%
Feb-15 Mar-15 Apr-15 May-15 Jun-15 Jul-15 Aug-15 Sep-15 Oct-15 Nov-15 Dec-15 Jan-16
Average G
asoline Price P
er Gallon
Vehi
cle
Mile
s Tr
avel
ed (
Year
-Ove
r-Ye
ar
Cha
nge)
MILES TRAVELED AND AVERAGE GASOLINE PRICE PER GALLON
Source: Miles Traveled – U.S. Department of Transportation Gas Prices – U.S. Energy Information Administration
Automotive Aftermarket | April 1, 2016 2 Jefferies.com
INVESTMENT BANKING • AUTOMOTIVE AFTERMARKET
Source: Capital IQ, Jefferies LLC Notes:
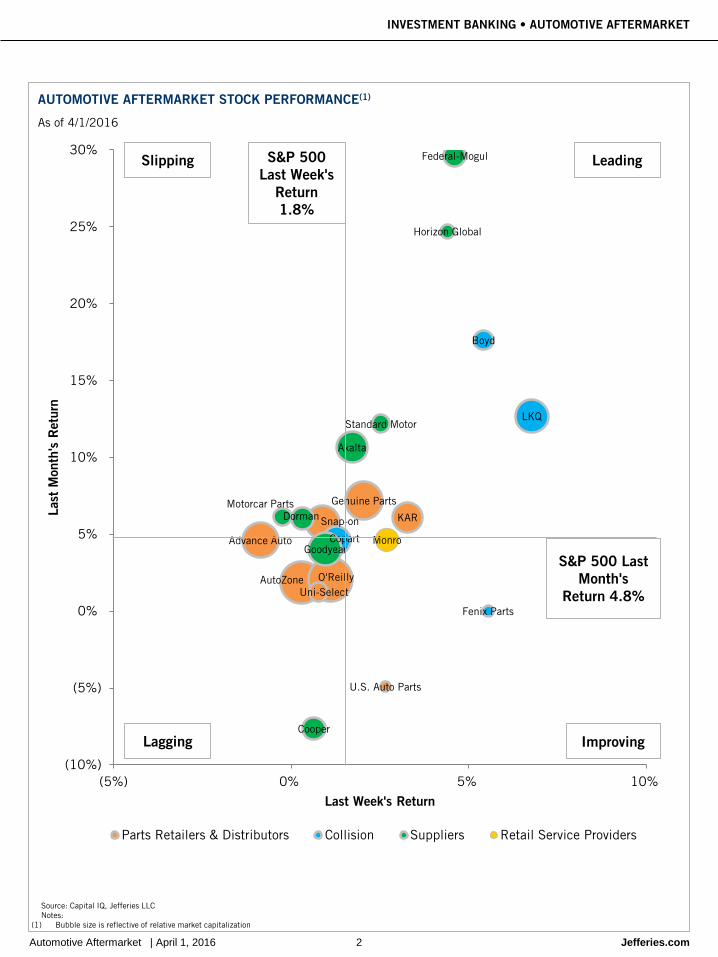
(1) Bubble size is reflective of relative market capitalization
AUTOMOTIVE AFTERMARKET STOCK PERFORMANCE(1)
As of 4/1/2016
Advance Auto
AutoZone
Genuine Parts
O'Reilly
KARSnap-on
Uni-Select
U.S. Auto Parts
Boyd
Copart
LKQ
Fenix Parts
Axalta
Cooper
Dorman
Goodyear
Horizon Global
Motorcar Parts
Federal-Mogul
Standard Motor
Monro
(10%)
(5%)
0%
5%
10%
15%
20%
25%
30%
(5%) 0% 5% 10%
Last
Mon
th's
Ret
urn
Last Week's Return
Parts Retailers & Distributors Collision Suppliers Retail Service Providers
Slipping Leading
Lagging Improving
S&P 500 Last Week's
Return1.8%
S&P 500 Last Month's
Return 4.8%
Automotive Aftermarket | April 1, 2016 3 Jefferies.com
INVESTMENT BANKING • AUTOMOTIVE AFTERMARKET
Source: Capital IQ, Jefferies LLC
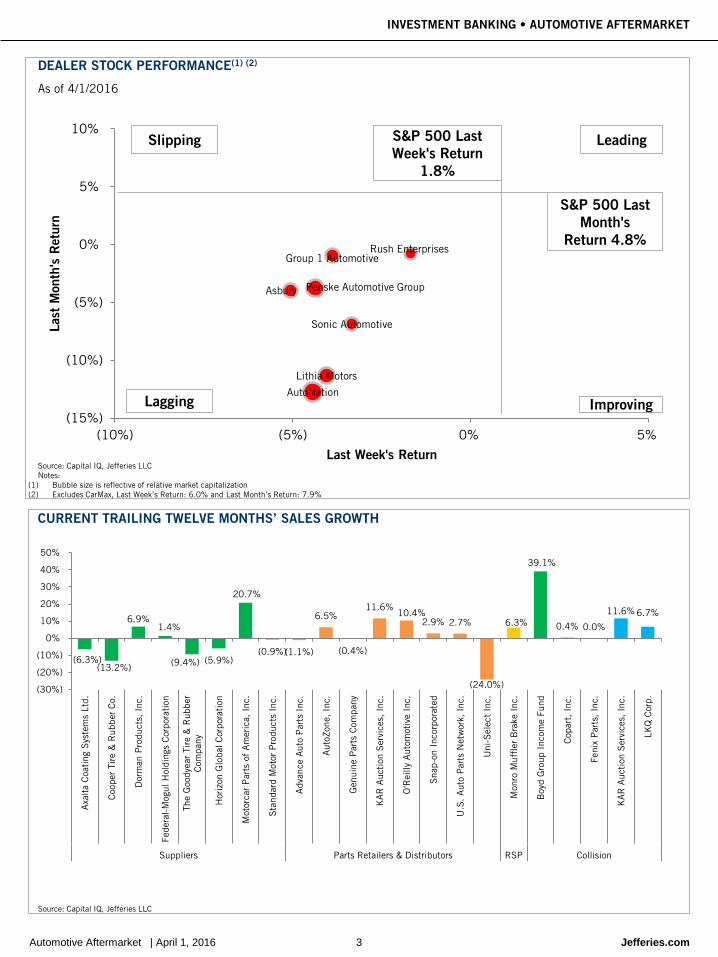
CURRENT TRAILING TWELVE MONTHS’ SALES GROWTH
(6.3%)(13.2%)
6.9% 1.4%
(9.4%) (5.9%)
20.7%
(0.9%)(1.1%)
6.5%
(0.4%)
11.6% 10.4%
2.9% 2.7%
(24.0%)
6.3%
39.1%
0.4% 0.0%
11.6% 6.7%
(30%)
(20%)
(10%)
0%
10%
20%
30%
40%
50%
Axa
lta
Coa
ting
Sys
tem
s Lt
d.
Coo
per
Tire
& R
ubbe
r C
o.
Dor
man
Pro
duct
s, I
nc.
Fede
ral-M
ogul
Hol
ding
s C
orpo
ration
The
Goo
dyea
r Ti
re &
Rub
ber
Com
pany
Hor
izon
Glo
bal C
orpo
rati
on
Mot
orca
r P
arts
of
Am
eric
a, I
nc.
Sta
ndar
d M
otor
Pro
duct
s In
c.
Adv
ance
Aut
o P
arts
Inc
.
Aut
oZon
e, I
nc.
Gen
uine
Par
ts C
ompa
ny
KA
R A
ucti
on S
ervi
ces,
Inc
.
O'R
eilly
Aut
omot
ive
Inc.
Sna
p-on
Inc
orpo
rate
d
U.S
. A
uto
Par
ts N
etw
ork,
Inc
.
Uni
-Sel
ect
Inc.
Mon
ro M
uffl
er B
rake
Inc
.
Boy
d G
roup
Inc
ome
Fund
Cop
art,
Inc
.
Feni
x P
arts
, In
c.
KA
R A
ucti
on S
ervi
ces,
Inc
.
LKQ
Cor
p.
Suppliers Parts Retailers & Distributors RSP Collision
Asbury
AutoNation
Group 1 Automotive
Lithia Motors
Penske Automotive Group
Rush Enterprises
Sonic Automotive
(15%)
(10%)
(5%)
0%
5%
10%
(10%) (5%) 0% 5%
Last
Mon
th's
Ret
urn
Last Week's Return
Slipping Leading
Lagging Improving
S&P 500 Last Week's Return
1.8%
S&P 500 Last Month's
Return 4.8%
DEALER STOCK PERFORMANCE(1) (2)
As of 4/1/2016
Source: Capital IQ, Jefferies LLC Notes:
(1) Bubble size is reflective of relative market capitalization (2) Excludes CarMax, Last Week’s Return: 6.0% and Last Month’s Return: 7.9%
Automotive Aftermarket | April 1, 2016 4 Jefferies.com
INVESTMENT BANKING • AUTOMOTIVE AFTERMARKET
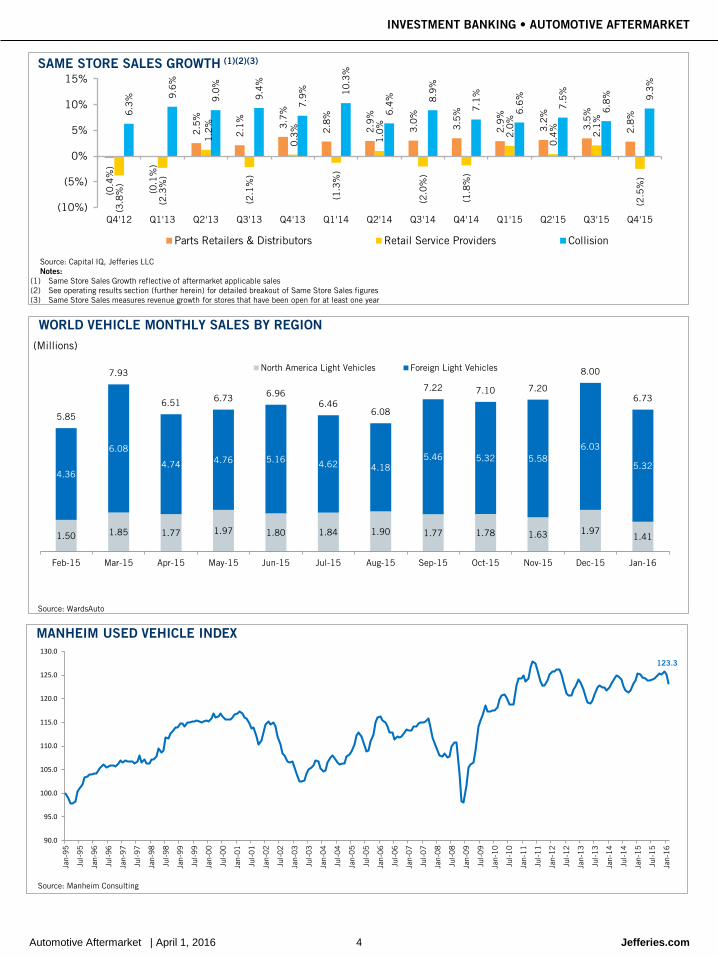
SAME STORE SALES GROWTH (1)(2)(3)
(0.4
%)
(0.1
%)
2.5
%
2.1
%
3.7
%
2.8
%
2.9
%
3.0
%
3.5
%
2.9
%
3.2
%
3.5
%
2.8
%
(3.8
%)
(2.3
%)
1.2
%
(2.1
%)
0.3
%
(1.3
%)
1.0
%
(2.0
%)
(1.8
%)
2.0
%
0.4
%
2.1
%
(2.5
%)
6.3
%
9.6
%
9.0
%
9.4
%
7.9
%
10.3
%
6.4
%
8.9
%
7.1
%
6.6
%
7.5
%
6.8
%
9.3
%
(10%)
(5%)
0%
5%
10%
15%
Q4'12 Q1'13 Q2'13 Q3'13 Q4'13 Q1'14 Q2'14 Q3'14 Q4'14 Q1'15 Q2'15 Q3'15 Q4'15
Parts Retailers & Distributors Retail Service Providers Collision
Source: Capital IQ, Jefferies LLC Notes:
(1) Same Store Sales Growth reflective of aftermarket applicable sales (2) See operating results section (further herein) for detailed breakout of Same Store Sales figures (3) Same Store Sales measures revenue growth for stores that have been open for at least one year
WORLD VEHICLE MONTHLY SALES BY REGION
Source: WardsAuto
1.50 1.85 1.77 1.97 1.80 1.84 1.90 1.77 1.78 1.63 1.971.41
4.36
6.08
4.74 4.76 5.16 4.62 4.185.46 5.32 5.58
6.03
5.32
5.85
7.93
6.51 6.73 6.966.46
6.08
7.22 7.10 7.20
8.00
6.73
Feb-15 Mar-15 Apr-15 May-15 Jun-15 Jul-15 Aug-15 Sep-15 Oct-15 Nov-15 Dec-15 Jan-16
North America Light Vehicles Foreign Light Vehicles
(Millions)
Source: Manheim Consulting
MANHEIM USED VEHICLE INDEX
Source: Jefferies LLC
123.3
90.0
95.0
100.0
105.0
110.0
115.0
120.0
125.0
130.0
Jan-
95
Jul-9
5
Jan-
96
Jul-9
6
Jan-
97
Jul-9
7
Jan-
98
Jul-9
8
Jan-
99
Jul-9
9
Jan-
00
Jul-0
0
Jan-
01
Jul-0
1
Jan-
02
Jul-0
2
Jan-
03
Jul-0
3
Jan-
04
Jul-0
4
Jan-
05
Jul-0
5
Jan-
06
Jul-0
6
Jan-
07
Jul-0
7
Jan-
08
Jul-0
8
Jan-
09
Jul-0
9
Jan-
10
Jul-1
0
Jan-
11
Jul-1
1
Jan-
12
Jul-1
2
Jan-
13
Jul-1
3
Jan-
14
Jul-1
4
Jan-
15
Jul-1
5
Jan-
16
Automotive Aftermarket | April 1, 2016 5 Jefferies.com
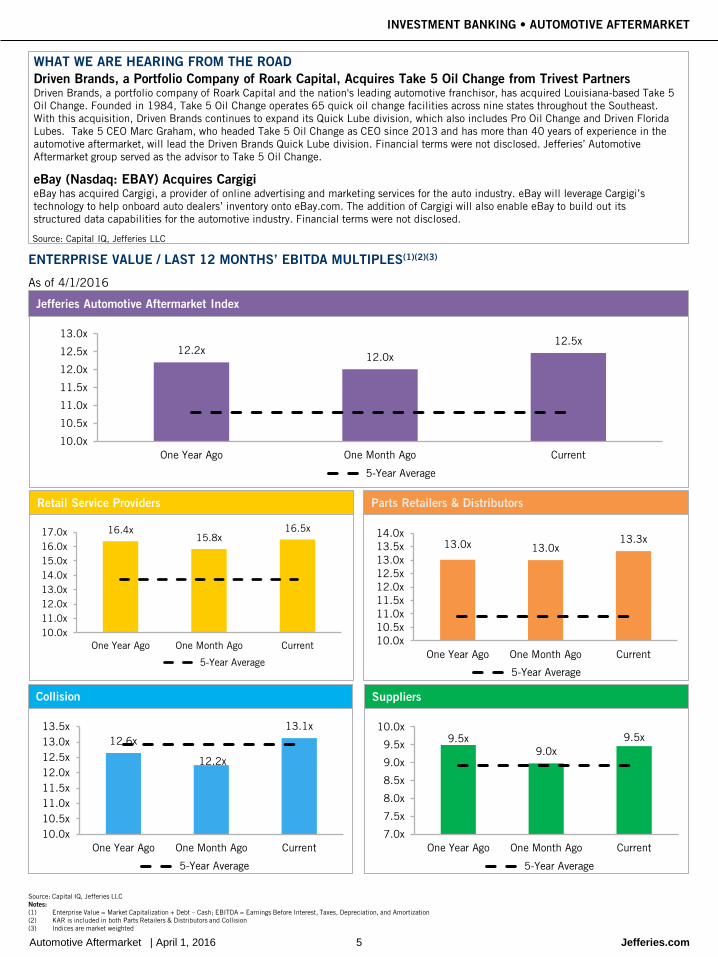
Source: Capital IQ, Jefferies LLC Notes: (1) Enterprise Value = Market Capitalization + Debt – Cash; EBITDA = Earnings Before Interest, Taxes, Depreciation, and Amortization (2) KAR is included in both Parts Retailers & Distributors and Collision (3) Indices are market weighted
INVESTMENT BANKING • AUTOMOTIVE AFTERMARKET
WHAT WE ARE HEARING FROM THE ROAD Driven Brands, a Portfolio Company of Roark Capital, Acquires Take 5 Oil Change from Trivest Partners Driven Brands, a portfolio company of Roark Capital and the nation's leading automotive franchisor, has acquired Louisiana-based Take 5 Oil Change. Founded in 1984, Take 5 Oil Change operates 65 quick oil change facilities across nine states throughout the Southeast. With this acquisition, Driven Brands continues to expand its Quick Lube division, which also includes Pro Oil Change and Driven Florida Lubes. Take 5 CEO Marc Graham, who headed Take 5 Oil Change as CEO since 2013 and has more than 40 years of experience in the automotive aftermarket, will lead the Driven Brands Quick Lube division. Financial terms were not disclosed. Jefferies’ Automotive Aftermarket group served as the advisor to Take 5 Oil Change.
eBay (Nasdaq: EBAY) Acquires Cargigi eBay has acquired Cargigi, a provider of online advertising and marketing services for the auto industry. eBay will leverage Cargigi’s technology to help onboard auto dealers’ inventory onto eBay.com. The addition of Cargigi will also enable eBay to build out its structured data capabilities for the automotive industry. Financial terms were not disclosed.
Source: Capital IQ, Jefferies LLC
ENTERPRISE VALUE / LAST 12 MONTHS’ EBITDA MULTIPLES(1)(2)(3)
As of 4/1/2016
Jefferies Automotive Aftermarket Index
12.2x12.0x
12.5x
10.0x
10.5x
11.0x
11.5x
12.0x
12.5x
13.0x
One Year Ago One Month Ago Current
5-Year Average
Retail Service Providers Parts Retailers & Distributors
16.4x15.8x
16.5x
10.0x11.0x12.0x13.0x14.0x15.0x16.0x17.0x
One Year Ago One Month Ago Current
5-Year Average
13.0x 13.0x13.3x
10.0x10.5x11.0x11.5x12.0x12.5x13.0x13.5x14.0x
One Year Ago One Month Ago Current
5-Year Average
Collision Suppliers
12.6x
12.2x
13.1x
10.0x10.5x11.0x11.5x12.0x12.5x13.0x13.5x
One Year Ago One Month Ago Current
5-Year Average
9.5x9.0x
9.5x
7.0x
7.5x
8.0x
8.5x
9.0x
9.5x
10.0x
One Year Ago One Month Ago Current
5-Year Average
Automotive Aftermarket | April 1, 2016 6 Jefferies.com
INVESTMENT BANKING • AUTOMOTIVE AFTERMARKET
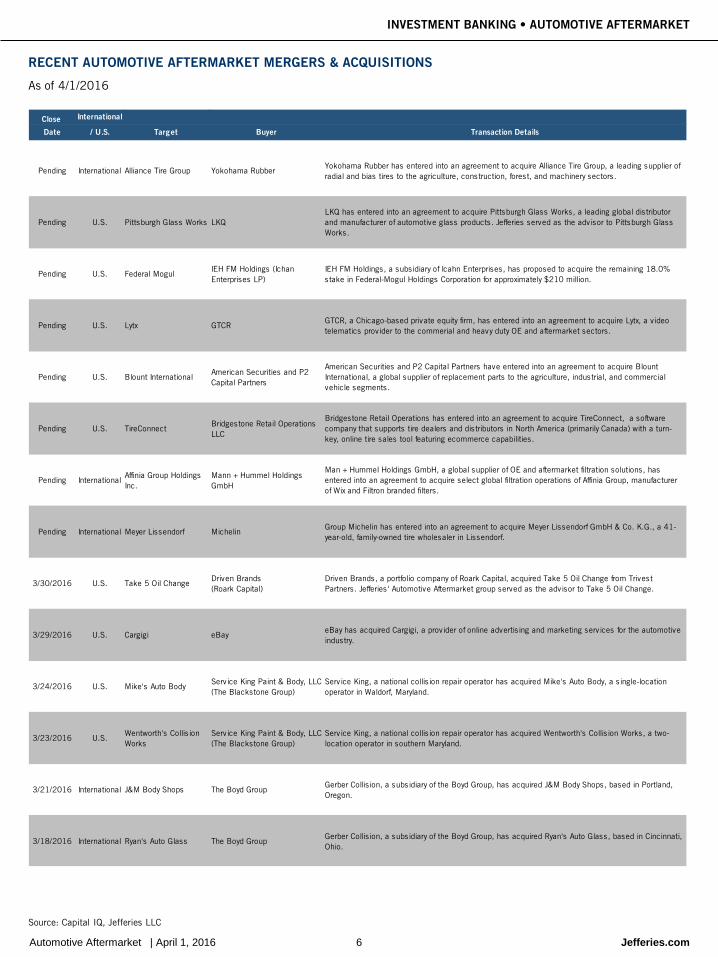
RECENT AUTOMOTIVE AFTERMARKET MERGERS & ACQUISITIONS
As of 4/1/2016
Source: Capital IQ, Jefferies LLC
Close International
Date / U.S. Target Buyer Transaction Details
Pending International Alliance Tire Group Yokohama RubberYokohama Rubber has entered into an agreement to acquire Alliance Tire Group, a leading supplier of radial and bias tires to the agriculture, construction, forest, and machinery sectors.
Pending U.S. Pittsburgh Glass Works LKQLKQ has entered into an agreement to acquire Pittsburgh Glass Works, a leading global distributor and manufacturer of automotive glass products. Jefferies served as the advisor to Pittsburgh Glass Works.
Pending U.S. Federal MogulIEH FM Holdings (Ichan Enterprises LP)
IEH FM Holdings, a subsidiary of Icahn Enterprises, has proposed to acquire the remaining 18.0% stake in Federal-Mogul Holdings Corporation for approximately $210 million.
Pending U.S. Lytx GTCRGTCR, a Chicago-based private equity firm, has entered into an agreement to acquire Lytx, a video telematics provider to the commerial and heavy duty OE and aftermarket sectors.
Pending U.S. Blount InternationalAmerican Securities and P2 Capital Partners
American Securities and P2 Capital Partners have entered into an agreement to acquire Blount International, a global supplier of replacement parts to the agriculture, industrial, and commercial vehicle segments.
Pending U.S. TireConnectBridgestone Retail Operations LLC
Bridgestone Retail Operations has entered into an agreement to acquire TireConnect, a software company that supports tire dealers and distributors in North America (primarily Canada) with a turn-key, online tire sales tool featuring ecommerce capabilities.
Pending InternationalAffinia Group Holdings Inc.
Mann + Hummel Holdings GmbH
Man + Hummel Holdings GmbH, a global supplier of OE and aftermarket filtration solutions, has entered into an agreement to acquire select global filtration operations of Affinia Group, manufacturer of Wix and Filtron branded filters.
Pending International Meyer Lissendorf MichelinGroup Michelin has entered into an agreement to acquire Meyer Lissendorf GmbH & Co. K.G., a 41-year-old, family-owned tire wholesaler in Lissendorf.
3/30/2016 U.S. Take 5 Oil ChangeDriven Brands(Roark Capital)
Driven Brands, a portfolio company of Roark Capital, acquired Take 5 Oil Change from Trivest Partners. Jefferies' Automotive Aftermarket group served as the advisor to Take 5 Oil Change.
3/29/2016 U.S. Cargigi eBayeBay has acquired Cargigi, a provider of online advertising and marketing services for the automotive industry.
3/24/2016 U.S. Mike's Auto BodyService King Paint & Body, LLC (The Blackstone Group)
Service King, a national collision repair operator has acquired Mike's Auto Body, a single-location operator in Waldorf, Maryland.
3/23/2016 U.S.Wentworth's Collision Works
Service King Paint & Body, LLC (The Blackstone Group)
Service King, a national collision repair operator has acquired Wentworth's Collision Works, a two-location operator in southern Maryland.
3/21/2016 International J&M Body Shops The Boyd GroupGerber Collision, a subsidiary of the Boyd Group, has acquired J&M Body Shops, based in Portland, Oregon.
3/18/2016 International Ryan's Auto Glass The Boyd GroupGerber Collision, a subsidiary of the Boyd Group, has acquired Ryan's Auto Glass, based in Cincinnati, Ohio.
Automotive Aftermarket | April 1, 2016 7 Jefferies.com
INVESTMENT BANKING • AUTOMOTIVE AFTERMARKET
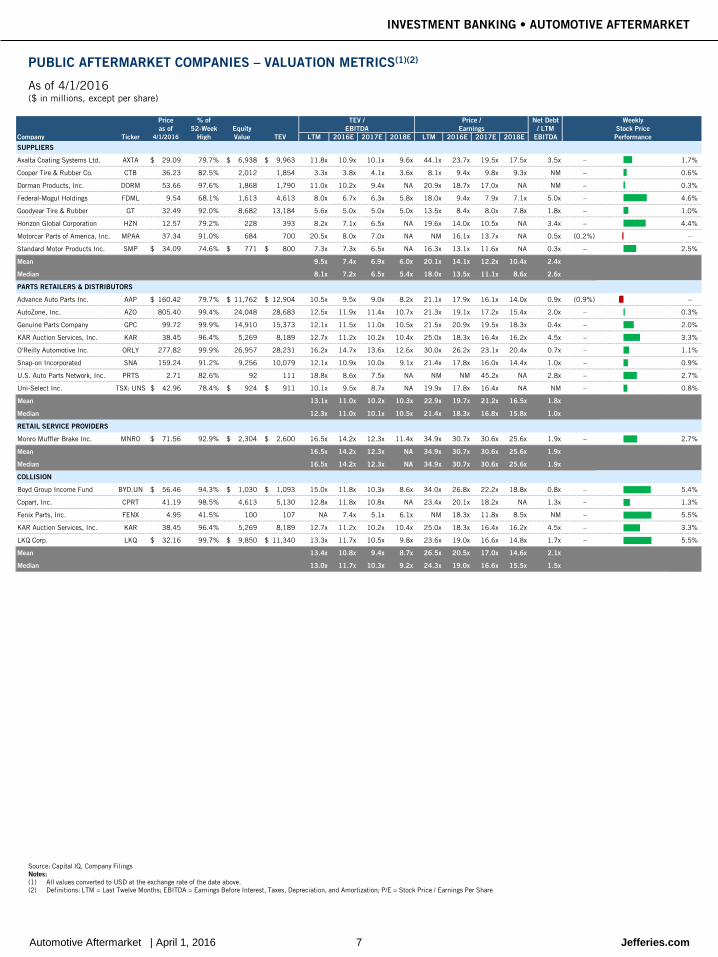
PUBLIC AFTERMARKET COMPANIES – VALUATION METRICS(1)(2)
As of 4/1/2016 ($ in millions, except per share)
Source: Capital IQ, Company Filings Notes: (1) All values converted to USD at the exchange rate of the date above. (2) Definitions: LTM = Last Twelve Months; EBITDA = Earnings Before Interest, Taxes, Depreciation, and Amortization; P/E = Stock Price / Earnings Per Share
Price % of TEV / Price / Net Debt Weeklyas of 52-Week Equity EBITDA Earnings / LTM Stock Price
Company Ticker 4/1/2016 High Value TEV LTM 2016E 2017E 2018E LTM 2016E 2017E 2018E EBITDA Performance
SUPPLIERS
Axalta Coating Systems Ltd. AXTA 29.09$ 79.7% 6,938$ 9,963$ 11.8x 10.9x 10.1x 9.6x 44.1x 23.7x 19.5x 17.5x 3.5x – 1.7%
Cooper Tire & Rubber Co. CTB 36.23 82.5% 2,012 1,854 3.3x 3.8x 4.1x 3.6x 8.1x 9.4x 9.8x 9.3x NM – 0.6%
Dorman Products, Inc. DORM 53.66 97.6% 1,868 1,790 11.0x 10.2x 9.4x NA 20.9x 18.7x 17.0x NA NM – 0.3%
Federal-Mogul Holdings FDML 9.54 68.1% 1,613 4,613 8.0x 6.7x 6.3x 5.8x 18.0x 9.4x 7.9x 7.1x 5.0x – 4.6%
Goodyear Tire & Rubber GT 32.49 92.0% 8,682 13,184 5.6x 5.0x 5.0x 5.0x 13.5x 8.4x 8.0x 7.8x 1.8x – 1.0%
Horizon Global Corporation HZN 12.57 79.2% 228 393 8.2x 7.1x 6.5x NA 19.6x 14.0x 10.5x NA 3.4x – 4.4%
Motorcar Parts of America, Inc. MPAA 37.34 91.0% 684 700 20.5x 8.0x 7.0x NA NM 16.1x 13.7x NA 0.5x (0.2%) –
Standard Motor Products Inc. SMP 34.09$ 74.6% 771$ 800$ 7.3x 7.3x 6.5x NA 16.3x 13.1x 11.6x NA 0.3x – 2.5%
Mean 9.5x 7.4x 6.9x 6.0x 20.1x 14.1x 12.2x 10.4x 2.4x
Median 8.1x 7.2x 6.5x 5.4x 18.0x 13.5x 11.1x 8.6x 2.6x
PARTS RETAILERS & DISTRIBUTORS
Advance Auto Parts Inc. AAP 160.42$ 79.7% 11,762$ 12,904$ 10.5x 9.5x 9.0x 8.2x 21.1x 17.9x 16.1x 14.0x 0.9x (0.9%) –
AutoZone, Inc. AZO 805.40 99.4% 24,048 28,683 12.5x 11.9x 11.4x 10.7x 21.3x 19.1x 17.2x 15.4x 2.0x – 0.3%
Genuine Parts Company GPC 99.72 99.9% 14,910 15,373 12.1x 11.5x 11.0x 10.5x 21.5x 20.9x 19.5x 18.3x 0.4x – 2.0%
KAR Auction Services, Inc. KAR 38.45 96.4% 5,269 8,189 12.7x 11.2x 10.2x 10.4x 25.0x 18.3x 16.4x 16.2x 4.5x – 3.3%
O'Reilly Automotive Inc. ORLY 277.82 99.9% 26,957 28,231 16.2x 14.7x 13.6x 12.6x 30.0x 26.2x 23.1x 20.4x 0.7x – 1.1%
Snap-on Incorporated SNA 159.24 91.2% 9,256 10,079 12.1x 10.9x 10.0x 9.1x 21.4x 17.8x 16.0x 14.4x 1.0x – 0.9%
U.S. Auto Parts Network, Inc. PRTS 2.71 82.6% 92 111 18.8x 8.6x 7.5x NA NM NM 45.2x NA 2.8x – 2.7%
Uni-Select Inc. TSX: UNS 42.96$ 78.4% 924$ 911$ 10.1x 9.5x 8.7x NA 19.9x 17.8x 16.4x NA NM – 0.8%
Mean 13.1x 11.0x 10.2x 10.3x 22.9x 19.7x 21.2x 16.5x 1.8x
Median 12.3x 11.0x 10.1x 10.5x 21.4x 18.3x 16.8x 15.8x 1.0x
RETAIL SERVICE PROVIDERS
Monro Muffler Brake Inc. MNRO 71.56$ 92.9% 2,304$ 2,600$ 16.5x 14.2x 12.3x 11.4x 34.9x 30.7x 30.6x 25.6x 1.9x – 2.7%
Mean 16.5x 14.2x 12.3x NA 34.9x 30.7x 30.6x 25.6x 1.9x
Median 16.5x 14.2x 12.3x NA 34.9x 30.7x 30.6x 25.6x 1.9x
COLLISION
Boyd Group Income Fund BYD.UN 56.46$ 94.3% 1,030$ 1,093$ 15.0x 11.8x 10.3x 8.6x 34.0x 26.8x 22.2x 18.8x 0.8x – 5.4%
Copart, Inc. CPRT 41.19 98.5% 4,613 5,130 12.8x 11.8x 10.8x NA 23.4x 20.1x 18.2x NA 1.3x – 1.3%
Fenix Parts, Inc. FENX 4.95 41.5% 100 107 NA 7.4x 5.1x 6.1x NM 18.3x 11.8x 8.5x NM – 5.5%
KAR Auction Services, Inc. KAR 38.45 96.4% 5,269 8,189 12.7x 11.2x 10.2x 10.4x 25.0x 18.3x 16.4x 16.2x 4.5x – 3.3%
LKQ Corp. LKQ 32.16$ 99.7% 9,850$ 11,340$ 13.3x 11.7x 10.5x 9.8x 23.6x 19.0x 16.6x 14.8x 1.7x – 5.5%
Mean 13.4x 10.8x 9.4x 8.7x 26.5x 20.5x 17.0x 14.6x 2.1x
Median 13.0x 11.7x 10.3x 9.2x 24.3x 19.0x 16.6x 15.5x 1.5x
Automotive Aftermarket | April 1, 2016 8 Jefferies.com
INVESTMENT BANKING • AUTOMOTIVE AFTERMARKET
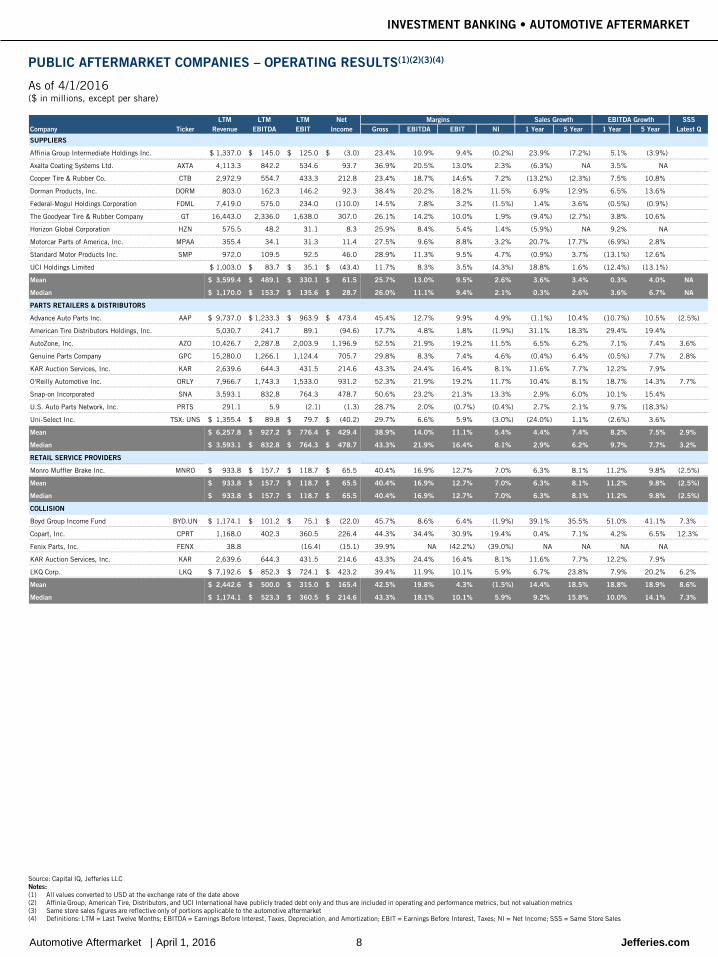
PUBLIC AFTERMARKET COMPANIES – OPERATING RESULTS(1)(2)(3)(4)
As of 4/1/2016 ($ in millions, except per share)
Source: Capital IQ, Jefferies LLC Notes: (1) All values converted to USD at the exchange rate of the date above (2) Affinia Group, American Tire, Distributors, and UCI International have publicly traded debt only and thus are included in operating and performance metrics, but not valuation metrics (3) Same store sales figures are reflective only of portions applicable to the automotive aftermarket (4) Definitions: LTM = Last Twelve Months; EBITDA = Earnings Before Interest, Taxes, Depreciation, and Amortization; EBIT = Earnings Before Interest, Taxes; NI = Net Income; SSS = Same Store Sales
LTM LTM LTM Net Margins Sales Growth EBITDA Growth SSSCompany Ticker Revenue EBITDA EBIT Income Gross EBITDA EBIT NI 1 Year 5 Year 1 Year 5 Year Latest Q
SUPPLIERS
Affinia Group Intermediate Holdings Inc. 1,337.0$ 145.0$ 125.0$ (3.0)$ 23.4% 10.9% 9.4% (0.2%) 23.9% (7.2%) 5.1% (3.9%)
Axalta Coating Systems Ltd. AXTA 4,113.3 842.2 534.6 93.7 36.9% 20.5% 13.0% 2.3% (6.3%) NA 3.5% NA
Cooper Tire & Rubber Co. CTB 2,972.9 554.7 433.3 212.8 23.4% 18.7% 14.6% 7.2% (13.2%) (2.3%) 7.5% 10.8%
Dorman Products, Inc. DORM 803.0 162.3 146.2 92.3 38.4% 20.2% 18.2% 11.5% 6.9% 12.9% 6.5% 13.6%
Federal-Mogul Holdings Corporation FDML 7,419.0 575.0 234.0 (110.0) 14.5% 7.8% 3.2% (1.5%) 1.4% 3.6% (0.5%) (0.9%)
The Goodyear Tire & Rubber Company GT 16,443.0 2,336.0 1,638.0 307.0 26.1% 14.2% 10.0% 1.9% (9.4%) (2.7%) 3.8% 10.6%
Horizon Global Corporation HZN 575.5 48.2 31.1 8.3 25.9% 8.4% 5.4% 1.4% (5.9%) NA 9.2% NA
Motorcar Parts of America, Inc. MPAA 355.4 34.1 31.3 11.4 27.5% 9.6% 8.8% 3.2% 20.7% 17.7% (6.9%) 2.8%
Standard Motor Products Inc. SMP 972.0 109.5 92.5 46.0 28.9% 11.3% 9.5% 4.7% (0.9%) 3.7% (13.1%) 12.6%
UCI Holdings Limited 1,003.0$ 83.7$ 35.1$ (43.4)$ 11.7% 8.3% 3.5% (4.3%) 18.8% 1.6% (12.4%) (13.1%)
Mean 3,599.4$ 489.1$ 330.1$ 61.5$ 25.7% 13.0% 9.5% 2.6% 3.6% 3.4% 0.3% 4.0% NA
Median 1,170.0$ 153.7$ 135.6$ 28.7$ 26.0% 11.1% 9.4% 2.1% 0.3% 2.6% 3.6% 6.7% NA
PARTS RETAILERS & DISTRIBUTORS
Advance Auto Parts Inc. AAP 9,737.0$ 1,233.3$ 963.9$ 473.4$ 45.4% 12.7% 9.9% 4.9% (1.1%) 10.4% (10.7%) 10.5% (2.5%)
American Tire Distributors Holdings, Inc. 5,030.7 241.7 89.1 (94.6) 17.7% 4.8% 1.8% (1.9%) 31.1% 18.3% 29.4% 19.4%
AutoZone, Inc. AZO 10,426.7 2,287.8 2,003.9 1,196.9 52.5% 21.9% 19.2% 11.5% 6.5% 6.2% 7.1% 7.4% 3.6%
Genuine Parts Company GPC 15,280.0 1,266.1 1,124.4 705.7 29.8% 8.3% 7.4% 4.6% (0.4%) 6.4% (0.5%) 7.7% 2.8%
KAR Auction Services, Inc. KAR 2,639.6 644.3 431.5 214.6 43.3% 24.4% 16.4% 8.1% 11.6% 7.7% 12.2% 7.9%
O'Reilly Automotive Inc. ORLY 7,966.7 1,743.3 1,533.0 931.2 52.3% 21.9% 19.2% 11.7% 10.4% 8.1% 18.7% 14.3% 7.7%
Snap-on Incorporated SNA 3,593.1 832.8 764.3 478.7 50.6% 23.2% 21.3% 13.3% 2.9% 6.0% 10.1% 15.4%
U.S. Auto Parts Network, Inc. PRTS 291.1 5.9 (2.1) (1.3) 28.7% 2.0% (0.7%) (0.4%) 2.7% 2.1% 9.7% (18.3%)
Uni-Select Inc. TSX: UNS 1,355.4$ 89.8$ 79.7$ (40.2)$ 29.7% 6.6% 5.9% (3.0%) (24.0%) 1.1% (2.6%) 3.6%
Mean 6,257.8$ 927.2$ 776.4$ 429.4$ 38.9% 14.0% 11.1% 5.4% 4.4% 7.4% 8.2% 7.5% 2.9%
Median 3,593.1$ 832.8$ 764.3$ 478.7$ 43.3% 21.9% 16.4% 8.1% 2.9% 6.2% 9.7% 7.7% 3.2%
RETAIL SERVICE PROVIDERS
Monro Muffler Brake Inc. MNRO 933.8$ 157.7$ 118.7$ 65.5$ 40.4% 16.9% 12.7% 7.0% 6.3% 8.1% 11.2% 9.8% (2.5%)
Mean 933.8$ 157.7$ 118.7$ 65.5$ 40.4% 16.9% 12.7% 7.0% 6.3% 8.1% 11.2% 9.8% (2.5%)
Median 933.8$ 157.7$ 118.7$ 65.5$ 40.4% 16.9% 12.7% 7.0% 6.3% 8.1% 11.2% 9.8% (2.5%)
COLLISION
Boyd Group Income Fund BYD.UN 1,174.1$ 101.2$ 75.1$ (22.0)$ 45.7% 8.6% 6.4% (1.9%) 39.1% 35.5% 51.0% 41.1% 7.3%
Copart, Inc. CPRT 1,168.0 402.3 360.5 226.4 44.3% 34.4% 30.9% 19.4% 0.4% 7.1% 4.2% 6.5% 12.3%
Fenix Parts, Inc. FENX 38.8 (16.4) (15.1) 39.9% NA (42.2%) (39.0%) NA NA NA NA
KAR Auction Services, Inc. KAR 2,639.6 644.3 431.5 214.6 43.3% 24.4% 16.4% 8.1% 11.6% 7.7% 12.2% 7.9%
LKQ Corp. LKQ 7,192.6$ 852.3$ 724.1$ 423.2$ 39.4% 11.9% 10.1% 5.9% 6.7% 23.8% 7.9% 20.2% 6.2%
Mean 2,442.6$ 500.0$ 315.0$ 165.4$ 42.5% 19.8% 4.3% (1.5%) 14.4% 18.5% 18.8% 18.9% 8.6%
Median 1,174.1$ 523.3$ 360.5$ 214.6$ 43.3% 18.1% 10.1% 5.9% 9.2% 15.8% 10.0% 14.1% 7.3%
Automotive Aftermarket | April 1, 2016 9 Jefferies.com
INVESTMENT BANKING • AUTOMOTIVE AFTERMARKET
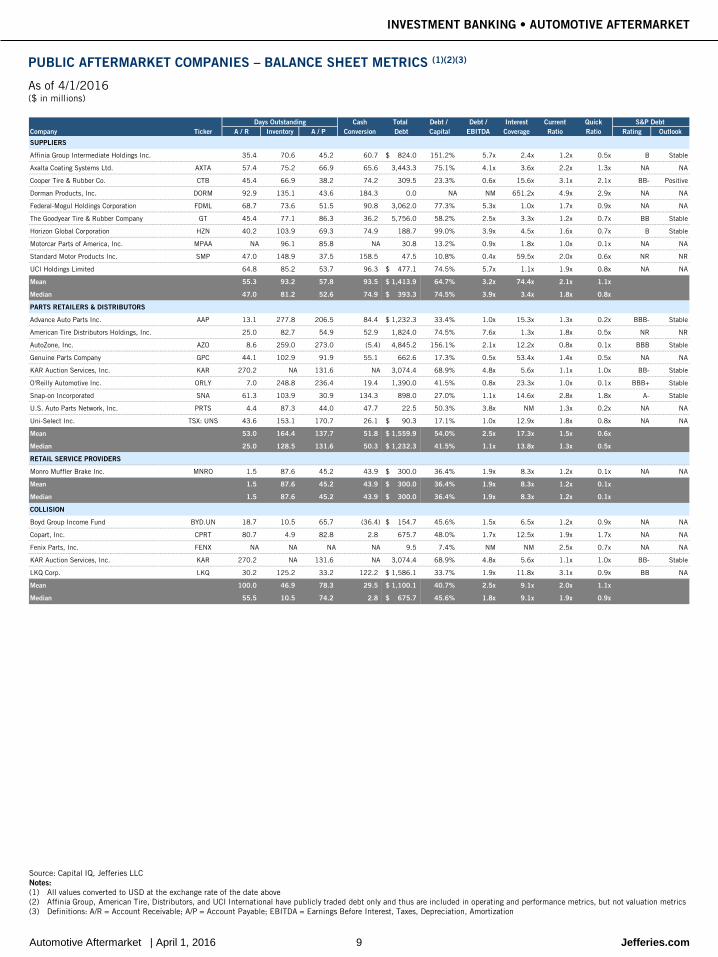
PUBLIC AFTERMARKET COMPANIES – BALANCE SHEET METRICS (1)(2)(3)
As of 4/1/2016 ($ in millions)
Source: Capital IQ, Jefferies LLC Notes: (1) All values converted to USD at the exchange rate of the date above (2) Affinia Group, American Tire, Distributors, and UCI International have publicly traded debt only and thus are included in operating and performance metrics, but not valuation metrics (3) Definitions: A/R = Account Receivable; A/P = Account Payable; EBITDA = Earnings Before Interest, Taxes, Depreciation, Amortization
Days Outstanding Cash Total Debt / Debt / Interest Current Quick S&P Debt Company Ticker A / R Inventory A / P Conversion Debt Capital EBITDA Coverage Ratio Ratio Rating Outlook
SUPPLIERS
Affinia Group Intermediate Holdings Inc. 35.4 70.6 45.2 60.7 824.0$ 151.2% 5.7x 2.4x 1.2x 0.5x B Stable
Axalta Coating Systems Ltd. AXTA 57.4 75.2 66.9 65.6 3,443.3 75.1% 4.1x 3.6x 2.2x 1.3x NA NA
Cooper Tire & Rubber Co. CTB 45.4 66.9 38.2 74.2 309.5 23.3% 0.6x 15.6x 3.1x 2.1x BB- Positive
Dorman Products, Inc. DORM 92.9 135.1 43.6 184.3 0.0 NA NM 651.2x 4.9x 2.9x NA NA
Federal-Mogul Holdings Corporation FDML 68.7 73.6 51.5 90.8 3,062.0 77.3% 5.3x 1.0x 1.7x 0.9x NA NA
The Goodyear Tire & Rubber Company GT 45.4 77.1 86.3 36.2 5,756.0 58.2% 2.5x 3.3x 1.2x 0.7x BB Stable
Horizon Global Corporation HZN 40.2 103.9 69.3 74.9 188.7 99.0% 3.9x 4.5x 1.6x 0.7x B Stable
Motorcar Parts of America, Inc. MPAA NA 96.1 85.8 NA 30.8 13.2% 0.9x 1.8x 1.0x 0.1x NA NA
Standard Motor Products Inc. SMP 47.0 148.9 37.5 158.5 47.5 10.8% 0.4x 59.5x 2.0x 0.6x NR NR
UCI Holdings Limited 64.8 85.2 53.7 96.3 477.1$ 74.5% 5.7x 1.1x 1.9x 0.8x NA NA
Mean 55.3 93.2 57.8 93.5 1,413.9$ 64.7% 3.2x 74.4x 2.1x 1.1x
Median 47.0 81.2 52.6 74.9 393.3$ 74.5% 3.9x 3.4x 1.8x 0.8x
PARTS RETAILERS & DISTRIBUTORS
Advance Auto Parts Inc. AAP 13.1 277.8 206.5 84.4 1,232.3$ 33.4% 1.0x 15.3x 1.3x 0.2x BBB- Stable
American Tire Distributors Holdings, Inc. 25.0 82.7 54.9 52.9 1,824.0 74.5% 7.6x 1.3x 1.8x 0.5x NR NR
AutoZone, Inc. AZO 8.6 259.0 273.0 (5.4) 4,845.2 156.1% 2.1x 12.2x 0.8x 0.1x BBB Stable
Genuine Parts Company GPC 44.1 102.9 91.9 55.1 662.6 17.3% 0.5x 53.4x 1.4x 0.5x NA NA
KAR Auction Services, Inc. KAR 270.2 NA 131.6 NA 3,074.4 68.9% 4.8x 5.6x 1.1x 1.0x BB- Stable
O'Reilly Automotive Inc. ORLY 7.0 248.8 236.4 19.4 1,390.0 41.5% 0.8x 23.3x 1.0x 0.1x BBB+ Stable
Snap-on Incorporated SNA 61.3 103.9 30.9 134.3 898.0 27.0% 1.1x 14.6x 2.8x 1.8x A- Stable
U.S. Auto Parts Network, Inc. PRTS 4.4 87.3 44.0 47.7 22.5 50.3% 3.8x NM 1.3x 0.2x NA NA
Uni-Select Inc. TSX: UNS 43.6 153.1 170.7 26.1 90.3$ 17.1% 1.0x 12.9x 1.8x 0.8x NA NA
Mean 53.0 164.4 137.7 51.8 1,559.9$ 54.0% 2.5x 17.3x 1.5x 0.6x
Median 25.0 128.5 131.6 50.3 1,232.3$ 41.5% 1.1x 13.8x 1.3x 0.5x
RETAIL SERVICE PROVIDERS
Monro Muffler Brake Inc. MNRO 1.5 87.6 45.2 43.9 300.0$ 36.4% 1.9x 8.3x 1.2x 0.1x NA NA
Mean 1.5 87.6 45.2 43.9 300.0$ 36.4% 1.9x 8.3x 1.2x 0.1x
Median 1.5 87.6 45.2 43.9 300.0$ 36.4% 1.9x 8.3x 1.2x 0.1x
COLLISION
Boyd Group Income Fund BYD.UN 18.7 10.5 65.7 (36.4) 154.7$ 45.6% 1.5x 6.5x 1.2x 0.9x NA NA
Copart, Inc. CPRT 80.7 4.9 82.8 2.8 675.7 48.0% 1.7x 12.5x 1.9x 1.7x NA NA
Fenix Parts, Inc. FENX NA NA NA NA 9.5 7.4% NM NM 2.5x 0.7x NA NA
KAR Auction Services, Inc. KAR 270.2 NA 131.6 NA 3,074.4 68.9% 4.8x 5.6x 1.1x 1.0x BB- Stable
LKQ Corp. LKQ 30.2 125.2 33.2 122.2 1,586.1$ 33.7% 1.9x 11.8x 3.1x 0.9x BB NA
Mean 100.0 46.9 78.3 29.5 1,100.1$ 40.7% 2.5x 9.1x 2.0x 1.1x
Median 55.5 10.5 74.2 2.8 675.7$ 45.6% 1.8x 9.1x 1.9x 0.9x
Automotive Aftermarket | April 1, 2016 10 Jefferies.com
INVESTMENT BANKING • AUTOMOTIVE AFTERMARKET
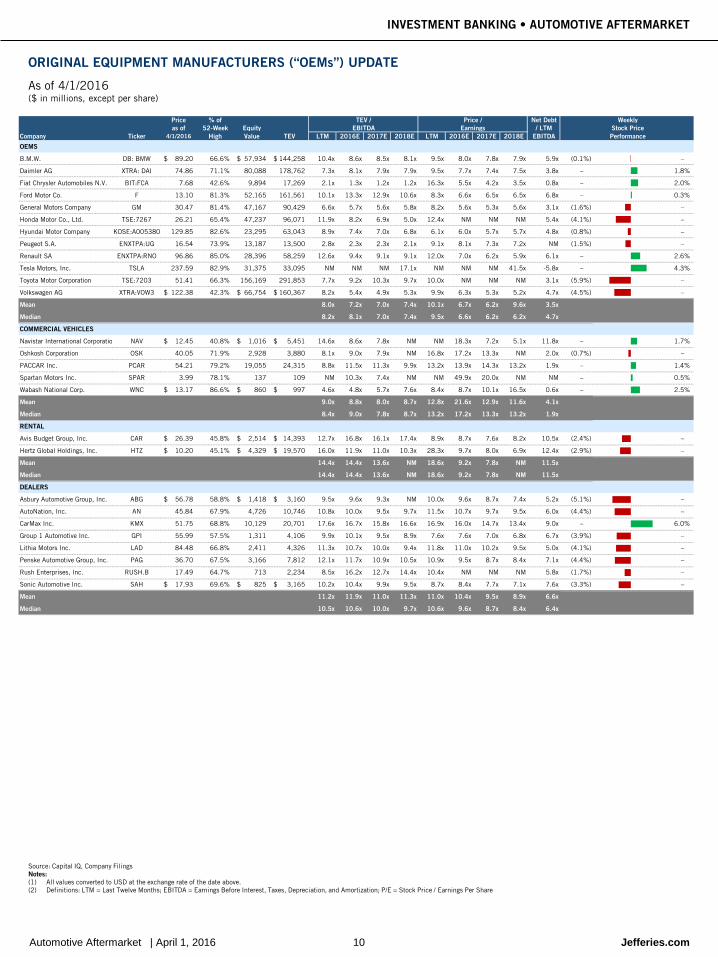
ORIGINAL EQUIPMENT MANUFACTURERS (“OEMs”) UPDATE
As of 4/1/2016 ($ in millions, except per share)
Source: Capital IQ, Company Filings Notes: (1) All values converted to USD at the exchange rate of the date above. (2) Definitions: LTM = Last Twelve Months; EBITDA = Earnings Before Interest, Taxes, Depreciation, and Amortization; P/E = Stock Price / Earnings Per Share
Price % of TEV / Price / Net Debt Weeklyas of 52-Week Equity EBITDA Earnings / LTM Stock Price
Company Ticker 4/1/2016 High Value TEV LTM 2016E 2017E 2018E LTM 2016E 2017E 2018E EBITDA Performance
OEMS
B.M.W. DB: BMW 89.20$ 66.6% 57,934$ 144,258$ 10.4x 8.6x 8.5x 8.1x 9.5x 8.0x 7.8x 7.9x 5.9x (0.1%) –
Daimler AG XTRA: DAI 74.86 71.1% 80,088 178,762 7.3x 8.1x 7.9x 7.9x 9.5x 7.7x 7.4x 7.5x 3.8x – 1.8%
Fiat Chrysler Automobiles N.V. BIT:FCA 7.68 42.6% 9,894 17,269 2.1x 1.3x 1.2x 1.2x 16.3x 5.5x 4.2x 3.5x 0.8x – 2.0%
Ford Motor Co. F 13.10 81.3% 52,165 161,561 10.1x 13.3x 12.9x 10.6x 8.3x 6.6x 6.5x 6.5x 6.8x – 0.3%
General Motors Company GM 30.47 81.4% 47,167 90,429 6.6x 5.7x 5.6x 5.8x 8.2x 5.6x 5.3x 5.6x 3.1x (1.6%) –
Honda Motor Co., Ltd. TSE:7267 26.21 65.4% 47,237 96,071 11.9x 8.2x 6.9x 5.0x 12.4x NM NM NM 5.4x (4.1%) –
Hyundai Motor Company KOSE:A005380 129.85 82.6% 23,295 63,043 8.9x 7.4x 7.0x 6.8x 6.1x 6.0x 5.7x 5.7x 4.8x (0.8%) –
Peugeot S.A. ENXTPA:UG 16.54 73.9% 13,187 13,500 2.8x 2.3x 2.3x 2.1x 9.1x 8.1x 7.3x 7.2x NM (1.5%) –
Renault SA ENXTPA:RNO 96.86 85.0% 28,396 58,259 12.6x 9.4x 9.1x 9.1x 12.0x 7.0x 6.2x 5.9x 6.1x – 2.6%
Tesla Motors, Inc. TSLA 237.59 82.9% 31,375 33,095 NM NM NM 17.1x NM NM NM 41.5x -5.8x – 4.3%
Toyota Motor Corporation TSE:7203 51.41 66.3% 156,169 291,853 7.7x 9.2x 10.3x 9.7x 10.0x NM NM NM 3.1x (5.9%) –
Volkswagen AG XTRA:VOW3 122.38$ 42.3% 66,754$ 160,367$ 8.2x 5.4x 4.9x 5.3x 9.9x 6.3x 5.3x 5.2x 4.7x (4.5%) –
Mean 8.0x 7.2x 7.0x 7.4x 10.1x 6.7x 6.2x 9.6x 3.5x
Median 8.2x 8.1x 7.0x 7.4x 9.5x 6.6x 6.2x 6.2x 4.7x
COMMERCIAL VEHICLES
Navistar International Corporatio NAV 12.45$ 40.8% 1,016$ 5,451$ 14.6x 8.6x 7.8x NM NM 18.3x 7.2x 5.1x 11.8x – 1.7%
Oshkosh Corporation OSK 40.05 71.9% 2,928 3,880 8.1x 9.0x 7.9x NM 16.8x 17.2x 13.3x NM 2.0x (0.7%) –
PACCAR Inc. PCAR 54.21 79.2% 19,055 24,315 8.8x 11.5x 11.3x 9.9x 13.2x 13.9x 14.3x 13.2x 1.9x – 1.4%
Spartan Motors Inc. SPAR 3.99 78.1% 137 109 NM 10.3x 7.4x NM NM 49.9x 20.0x NM NM – 0.5%
Wabash National Corp. WNC 13.17$ 86.6% 860$ 997$ 4.6x 4.8x 5.7x 7.6x 8.4x 8.7x 10.1x 16.5x 0.6x – 2.5%
Mean 9.0x 8.8x 8.0x 8.7x 12.8x 21.6x 12.9x 11.6x 4.1x
Median 8.4x 9.0x 7.8x 8.7x 13.2x 17.2x 13.3x 13.2x 1.9x
RENTAL
Avis Budget Group, Inc. CAR 26.39$ 45.8% 2,514$ 14,393$ 12.7x 16.8x 16.1x 17.4x 8.9x 8.7x 7.6x 8.2x 10.5x (2.4%) –
Hertz Global Holdings, Inc. HTZ 10.20$ 45.1% 4,329$ 19,570$ 16.0x 11.9x 11.0x 10.3x 28.3x 9.7x 8.0x 6.9x 12.4x (2.9%) –
Mean 14.4x 14.4x 13.6x NM 18.6x 9.2x 7.8x NM 11.5x
Median 14.4x 14.4x 13.6x NM 18.6x 9.2x 7.8x NM 11.5x
DEALERS
Asbury Automotive Group, Inc. ABG 56.78$ 58.8% 1,418$ 3,160$ 9.5x 9.6x 9.3x NM 10.0x 9.6x 8.7x 7.4x 5.2x (5.1%) –
AutoNation, Inc. AN 45.84 67.9% 4,726 10,746 10.8x 10.0x 9.5x 9.7x 11.5x 10.7x 9.7x 9.5x 6.0x (4.4%) –
CarMax Inc. KMX 51.75 68.8% 10,129 20,701 17.6x 16.7x 15.8x 16.6x 16.9x 16.0x 14.7x 13.4x 9.0x – 6.0%
Group 1 Automotive Inc. GPI 55.99 57.5% 1,311 4,106 9.9x 10.1x 9.5x 8.9x 7.6x 7.6x 7.0x 6.8x 6.7x (3.9%) –
Lithia Motors Inc. LAD 84.48 66.8% 2,411 4,326 11.3x 10.7x 10.0x 9.4x 11.8x 11.0x 10.2x 9.5x 5.0x (4.1%) –
Penske Automotive Group, Inc. PAG 36.70 67.5% 3,166 7,812 12.1x 11.7x 10.9x 10.5x 10.9x 9.5x 8.7x 8.4x 7.1x (4.4%) –
Rush Enterprises, Inc. RUSH.B 17.49 64.7% 713 2,234 8.5x 16.2x 12.7x 14.4x 10.4x NM NM NM 5.8x (1.7%) –
Sonic Automotive Inc. SAH 17.93$ 69.6% 825$ 3,165$ 10.2x 10.4x 9.9x 9.5x 8.7x 8.4x 7.7x 7.1x 7.6x (3.3%) –
Mean 11.2x 11.9x 11.0x 11.3x 11.0x 10.4x 9.5x 8.9x 6.6x
Median 10.5x 10.6x 10.0x 9.7x 10.6x 9.6x 8.7x 8.4x 6.4x

Automotive Aftermarket | April 1, 2016 11 Jefferies.com
INVESTMENT BANKING • AUTOMOTIVE AFTERMARKET
AUTOMOTIVE AFTERMARKET INVESTMENT BANKING TEAM
Please see the important disclosures at the end of this report.
Jefferies LLC is the leading full-service, global investment bank serving the automotive aftermarket. Jefferies’ Aftermarket team provides unparalleled industry expertise with best-in-class transaction execution. Jefferies offers end-to-end financial advisory services including M&A, equity underwriting, leverage financing, and restructuring.
To find out how we can help your company, please contact us.
Jonathan Carey Managing Director Global Co-Head +1 617.342.7865 [email protected]
Rex Green Managing Director Global Co-Head +1 617.342.7886 [email protected]
Treavor Hill Vice President +1 617.342.7929 [email protected]
Yogesh Punjabi Vice President +1 617.342.7927 [email protected]
Matthew Grau Associate +1 617.342.7889 [email protected]
Jack Walsh Associate +1 617.342.7868 [email protected]
Automotive Aftermarket | April 1, 2016 12 Jefferies.com
INVESTMENT BANKING • AUTOMOTIVE AFTERMARKET
IMPORTANT DISCLAIMER
This material has been prepared by Jefferies Group LLC or one of its affiliates as noted below (herein collectively referred to as “Jefferies”).
• United States: Jefferies LLC, an SEC-registered broker dealer, a CFTC-registered introducing broker and a member of FINRA and NFA; Jefferies Bache LLC, a CFTC-registered futures commission merchant and a member of NFA; Jefferies Bache Financial Services, Inc., a CFTC-provisionally registered swap dealer and pending membership with NFA; and Jefferies Derivative Products, LLC, CFTC-provisionally registered swap dealer and pending membership with NFA, each located at 520 Madison Avenue, New York, NY 10022.
• United Kingdom: Jefferies International Limited, authorized and regulated by the Financial Conduct Authority and registered in England and Wales No. 1978628; and Jefferies Bache Limited, authorized and regulated by the Financial Conduct Authority and registered in England and Wales No. 512397, each with their registered offices at Vintners Place, 68 Upper Thames Street, London EC4V 3BJ.
• Hong Kong: Jefferies Hong Kong Limited, licensed by the Securities and Futures Commission of Hong Kong, CE number ATS546; located at Suite 2201, 22nd Floor, Cheung Kong Center, 2 Queen's Road Central, Hong Kong.
• India: Jefferies India Private Limited (CIN - U74140MH2007PTC200509), licensed by the Securities and Exchange Board of India for: NSE Capital Market Segment INB231491037; BSE Capital Market Segment INB011491033, Research Analyst INH000000701 and Merchant Banker INM000011443, located at 42/43, 2 North Avenue, Maker Maxity, Bandra-Kurla Complex, Bandra (East) ,Mumbai 400 051.
• Japan: Jefferies (Japan) Limited, Tokyo Branch, registered by the Financial Services Agency of Japan and member of the Japan Securities Dealers Association; located at Hibiya Marine Bldg, 3F, 1-5-1 Yuraku-cho, Chiyoda-ku, Tokyo 100-0006.
• Singapore: Jefferies Singapore Limited, registered in Singapore No. 200605049K and licensed by the Monetary Authority of Singapore; located at 80 Raffles Place #15-20, UOB Plaza 2, Singapore 048624.
This document has been prepared employing appropriate expertise, and in the belief that it is fair and not misleading. The information upon which this material is based was obtained from sources believed to be reliable, but has not been independently verified, therefore, we do not guarantee its accuracy or completeness. It may be based on subjective assessments and assumptions and may utilize one among alternative methodologies that produce differing results; accordingly, it should not be relied upon as an accurate representation of future events. This is not an offer or solicitation of an offer to buy or sell any security or investment. Any opinion or estimates constitute our best judgment as of this date, and are subject to change without notice. Jefferies and its affiliates, officers, directors, employees and agents may from time to time hold long or short positions in, buy or sell (on a principal basis or otherwise), or act as market maker in any securities, futures or other financial instruments or products related to matters discussed herein and may make trading decisions that are different from or contrary to any of those which may be discussed. Jefferies is not an adviser as to legal, taxation, accounting or regulatory matters in any jurisdiction, and is not providing any advice as to any such matter to the recipient. Recipients of this document should take their own independent advice with respect to such matters. This communication is being provided strictly for informational purposes only. Any views or opinions expressed herein are solely those of the institutions identified, not Jefferies. This information is not a solicitation or recommendation to purchase securities of Jefferies and should not be construed as such. No responsibility is accepted, and no representation, undertaking or warranty is made or given, in either case, expressly or impliedly, by Jefferies as to the accuracy, reliability or completeness of the information contained herein or as to the reasonableness of any assumptions on which any of the same is based or the use of any of the same. Accordingly, neither Jefferies nor any of its officers, directors, employees, agents or representatives will be liable for any direct, indirect or consequential loss or damage suffered by any person resulting from the use of the information contained herein, or for any opinions expressed by any such person, or any errors, omissions or misstatements made by any of them. In the UK, this document is intended for use only by persons who have professional experience in matters relating to investments falling within Articles 19(5) and 49(2)(a) to (d) of the Financial Services and Markets Act 2000 (Financial Promotion) Order 2005 (as amended), or by persons to whom it can be otherwise lawfully distributed. Recipients of this document in jurisdictions outside the United Kingdom should inform themselves about and observe any applicable legal requirements in relation to the receipt of this document. Reproduction without written permission of Jefferies is expressly forbidden. All Jefferies logos, trademarks and service marks appearing herein are property of Jefferies Group LLC. © 2016 Jefferies LLC. Member SIPC.