Embed Size (px)
Citation preview
Solar3D - Company PresentationMarch 2015
Building the Next Solar Powerhouse
Forward Looking Statements
This presentation contains forward-looking statements that involve risks and uncertainties, including statements regarding relating to our future business expectations and predictions and financial conditions and results of the operations. These forward-looking statements are based on our current expectations and projections about future events and they are subject to risks and uncertainties known and unknown that could cause actual results and developments to differ materially from those expressed or implied in such statements. In some cases, you can identify forward-looking statements by terminology, such as “expects,” “anticipates,” “intends,” “estimates,” “plans,” “believes,” “seeks,” “may,” “should”, “could” or the negative of such terms or other similar expressions. They include statements regarding the timing and expected benefits of our acquisitions and acquisitions strategy, and also include statements relating to or regarding: estimates and projections for our 2014 and 2015 financial results; plans and strategies for growth; expectations for the market for solar energy; and other objectives, expectations and intentions and other statements that are not historical facts. These forward-looking statements are based largely on the expectations of the Company and are subject to a number of risks and uncertainties. These include, but are not limited to, risks and uncertainties associated with: the impact of economic, competitive and other factors affecting the Company and its operations, markets, product, and distributor performance, the impact on the national and local economies resulting from terrorist actions, and U.S. actions subsequently; and other factors detailed in reports filed by the Company. Forward-looking statements should not be read as a guarantee of future performance or results, and will not necessarily be accurate indications of the times at, or by, which such performance or results will be achieved, if at all. A full discussion of our operations and financial condition, including factors that may affect our business and future prospects is contained in documents we have filed with the SEC and will be contained in subsequent filings with the SEC. While we believe that our assumptions are reasonable, it is very difficult to predict the impact of known factors on, and it is impossible to anticipate all factors that could affect, our actual results. We undertake no obligation to publicly update or revise any forward-looking statement as a result of new information, future events or otherwise, except as otherwise required by law.Non-GAAP MeasuresThis presentation refers to Adjusted EBITDA, a non-GAAP financial measure. Adjusted EBITDA should not be considered a replacement for, and should be read together with, the most comparable GAAP financial measure, which is [Operating Profit(Loss)]. A reconciliation of Adjusted EBITDA to [Operating Profit(Loss)] can be found on slide 14 of this presentation..
2
Company Overview
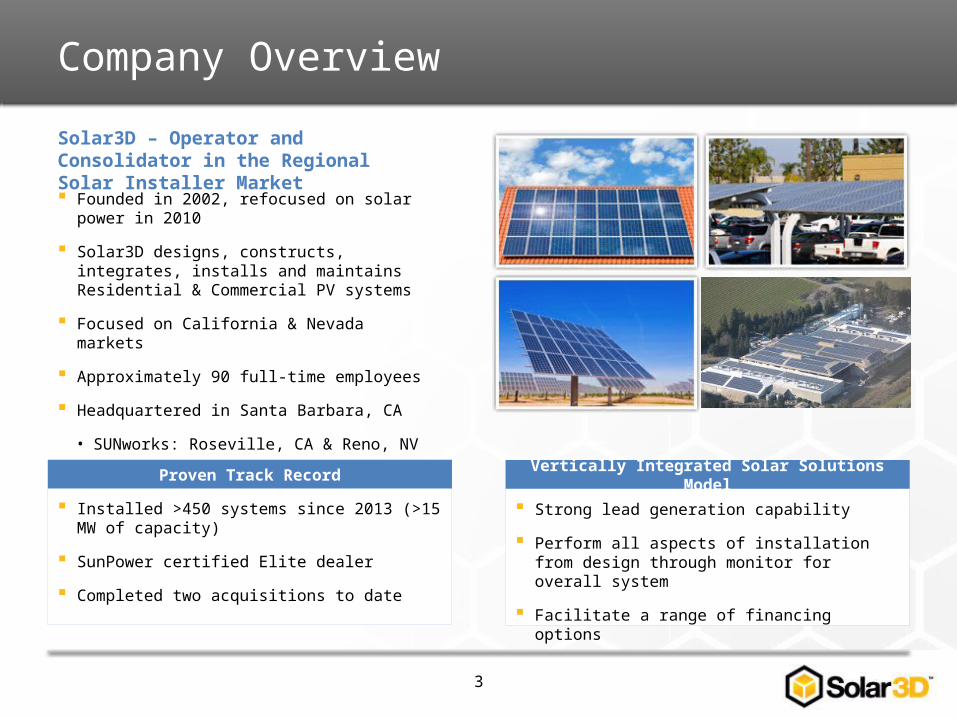
Solar3D – Operator and Consolidator in the Regional Solar Installer Market
Founded in 2002, refocused on solar power in 2010
Solar3D designs, constructs, integrates, installs and maintains Residential & Commercial PV systems
Focused on California & Nevada markets
Approximately 90 full-time employees
Headquartered in Santa Barbara, CA
• SUNworks: Roseville, CA & Reno, NV
• MD Energy: Rancho Cucamonga, CA
Installed >450 systems since 2013 (>15 MW of capacity)
SunPower certified Elite dealer
Completed two acquisitions to date
Proven Track Record
Strong lead generation capability
Perform all aspects of installation from design through monitor for overall system
Facilitate a range of financing options
Vertically Integrated Solar Solutions Model
3
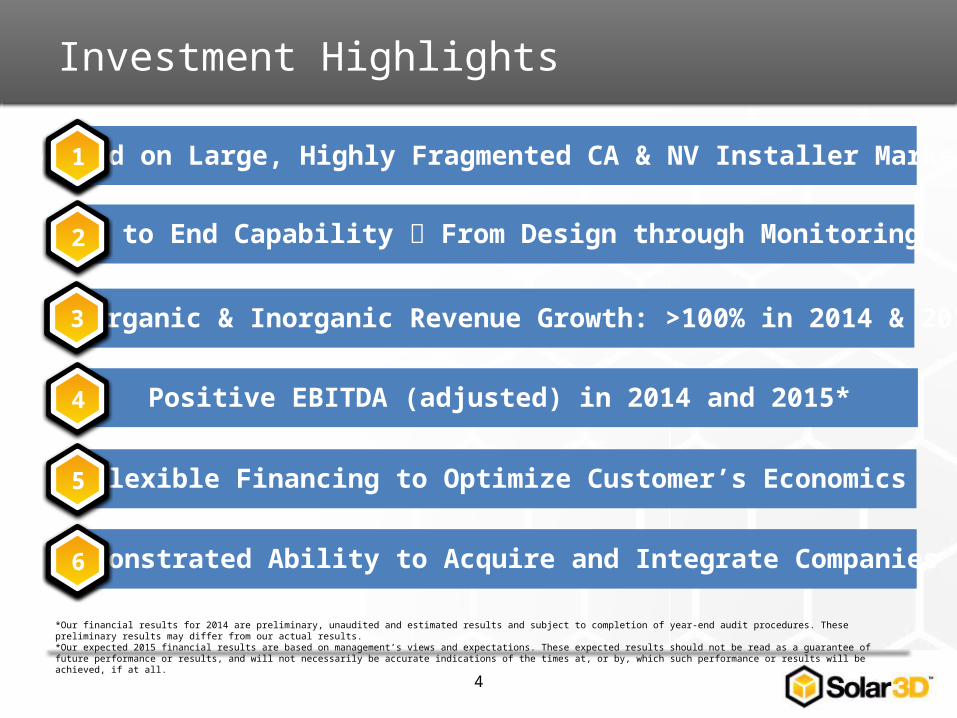
Focused on Large, Highly Fragmented CA & NV Installer Markets
Investment Highlights
Demonstrated Ability to Acquire and Integrate Companies
4
End to End Capability From Design through Monitoring
Rapid Organic & Inorganic Revenue Growth: >100% in 2014 & 2015*
Positive EBITDA (adjusted) in 2014 and 2015*
Flexible Financing to Optimize Customer’s Economics
1
2
3
4
6
5
Demonstrated Ability to Acquire and Integrate Companies6
Focused on Large, Highly Fragmented CA & NV Installer Markets1
*Our financial results for 2014 are preliminary, unaudited and estimated results and subject to completion of year-end audit procedures. These preliminary results may differ from our actual results.*Our expected 2015 financial results are based on management’s views and expectations. These expected results should not be read as a guarantee of future performance or results, and will not necessarily be accurate indications of the times at, or by, which such performance or results will be achieved, if at all.
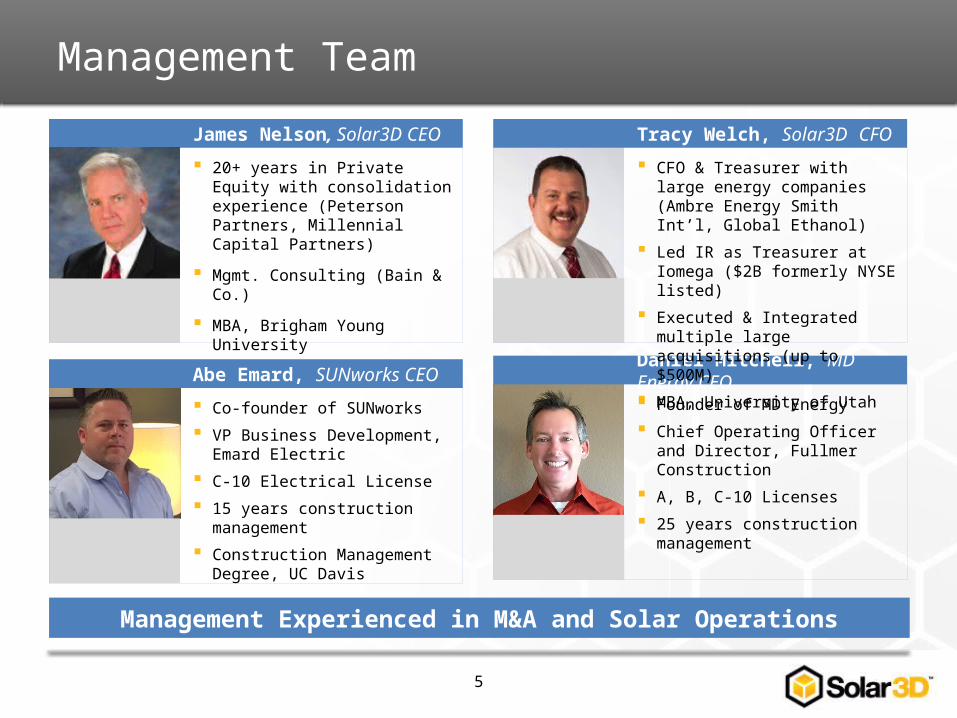
Management Team
5
Management Experienced in M&A and Solar Operations
James Nelson, Solar3D CEO
Daniel Mitchell, MD Energy CEO
20+ years in Private Equity with consolidation experience (Peterson Partners, Millennial Capital Partners)
Mgmt. Consulting (Bain & Co.)
MBA, Brigham Young University
Tracy Welch, Solar3D CFO
CFO & Treasurer with large energy companies (Ambre Energy Smith Int’l, Global Ethanol)
Led IR as Treasurer at Iomega ($2B formerly NYSE listed)
Executed & Integrated multiple large acquisitions (up to $500M)
MBA, University of Utah
Abe Emard, SUNworks CEO
Co-founder of SUNworks
VP Business Development, Emard Electric
C-10 Electrical License
15 years construction management
Construction Management Degree, UC Davis
Founder of MD Energy
Chief Operating Officer and Director, Fullmer Construction
A, B, C-10 Licenses
25 years construction management
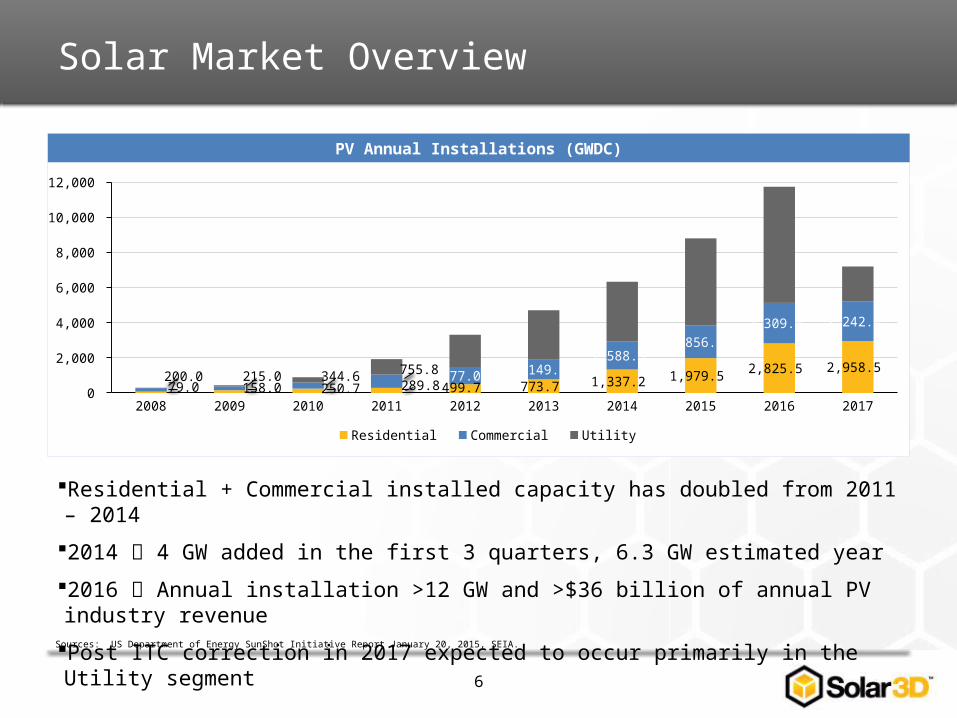
PV Annual Installations (GWDC)
Solar Market Overview
Residential + Commercial installed capacity has doubled from 2011 – 2014
2014 4 GW added in the first 3 quarters, 6.3 GW estimated year
2016 Annual installation >12 GW and >$36 billion of annual PV industry revenue
Post ITC correction in 2017 expected to occur primarily in the Utility segment
2008 2009 2010 2011 2012 2013 2014 2015 2016 20170
2,000
4,000
6,000
8,000
10,000
12,000
79.0 158.0 250.7 289.8 499.7 773.7 1,337.2 1,979.5 2,825.5 2,958.5 200.0 215.0 344.6 755.8 977.0 1,149.9
1,588.3 1,856.2
2,309.0 2,242.0
Residential Commercial Utility
Sources: US Department of Energy SunShot Initiative Report January 20, 2015, SEIA.
6
2007 2008 2009 2010 2011 2012 2013 20140
300
600
900
1200
0 - 25 kW 25 -250 kW250 kW - 5 MW
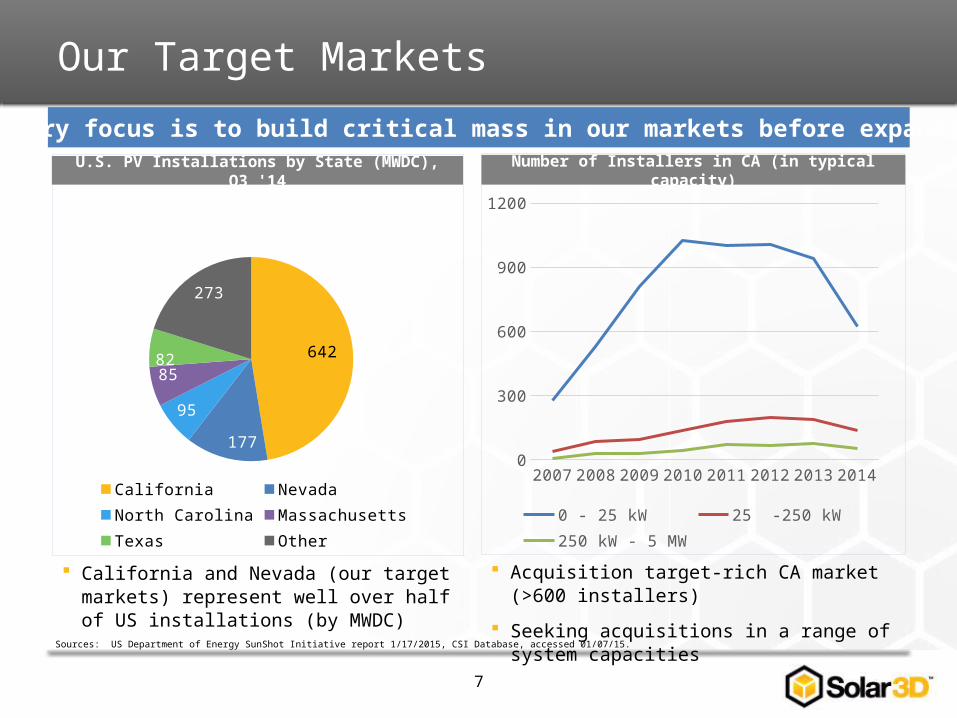
642
177
95
85 82
273
California Nevada North CarolinaMassachusetts Texas Other
Our Target Markets
California and Nevada (our target markets) represent well over half of US installations (by MWDC)
7
U.S. PV Installations by State (MWDC), Q3 '14
Sources: US Department of Energy SunShot Initiative report 1/17/2015, CSI Database, accessed 01/07/15.
Primary focus is to build critical mass in our markets before expanding
Number of Installers in CA (in typical capacity)
Acquisition target-rich CA market (>600 installers)
Seeking acquisitions in a range of system capacities
Consolidation Strategy
A large number of solar installers are:• Small (install systems < 250 kW), close to profitable• Possess limited resources to scale their business and/or have limited exit
opportunities
Profile of typical solar installer target for consolidation:• Profitable with annual revenue ranging between $10MM - $30MM• Same target segment focus (Residential & Commercial)• Location – initially in CA & NV• Willingness to continue future participation by running the business as a division
of Solar3D
We believe that we have an advantage in the consolidation strategy due to:• Experience in acquiring and integrating companies• Collaborative working environment• First-mover advantage
8
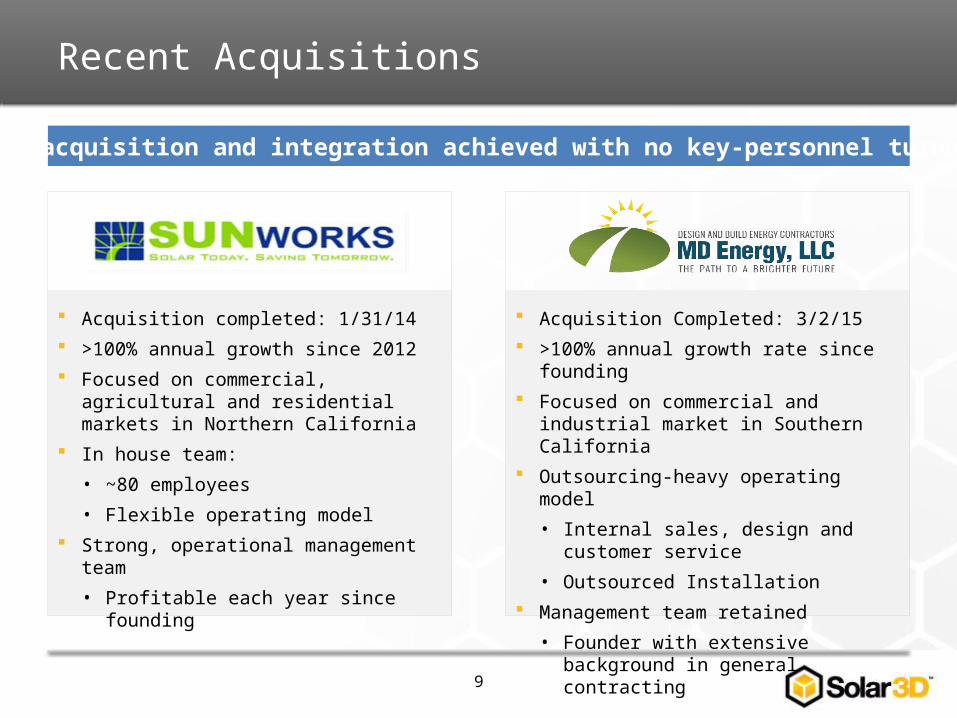
Recent Acquisitions
9
Rapid acquisition and integration achieved with no key-personnel turnover
Acquisition completed: 1/31/14 >100% annual growth since 2012 Focused on commercial, agricultural and
residential markets in Northern California In house team:
• ~80 employees
• Flexible operating model Strong, operational management team
• Profitable each year since founding
Acquisition Completed: 3/2/15 >100% annual growth rate since founding Focused on commercial and industrial market
in Southern California Outsourcing-heavy operating model
• Internal sales, design and customer service
• Outsourced Installation Management team retained
• Founder with extensive background in general contracting
Financing Support for Customers
10
Flexibility in working with different financing methods leads to higher conversion
Competing business models often call for third party system ownership• “One size fits all” finance product only—typically a zero-money-down solar lease• Non-optimal long-run economics for the customer• We believe that there are inherent customer advantages in ownership vs. leasing
Solar3D originates and arranges financing options for customers • Emphasis on optimizing customer economics leads to best financing source• Frequently encourage customer ownership of systems to maximize their returns• We have experienced strong success in head-to-head competition
We can coordinate many sources of financing that we work with to support the customer including
• Financial Institutions • PACE Programs • Farm Credit
• Leasing Companies • SunPower Financing
Customer Acquisition and Quality Reputation
11
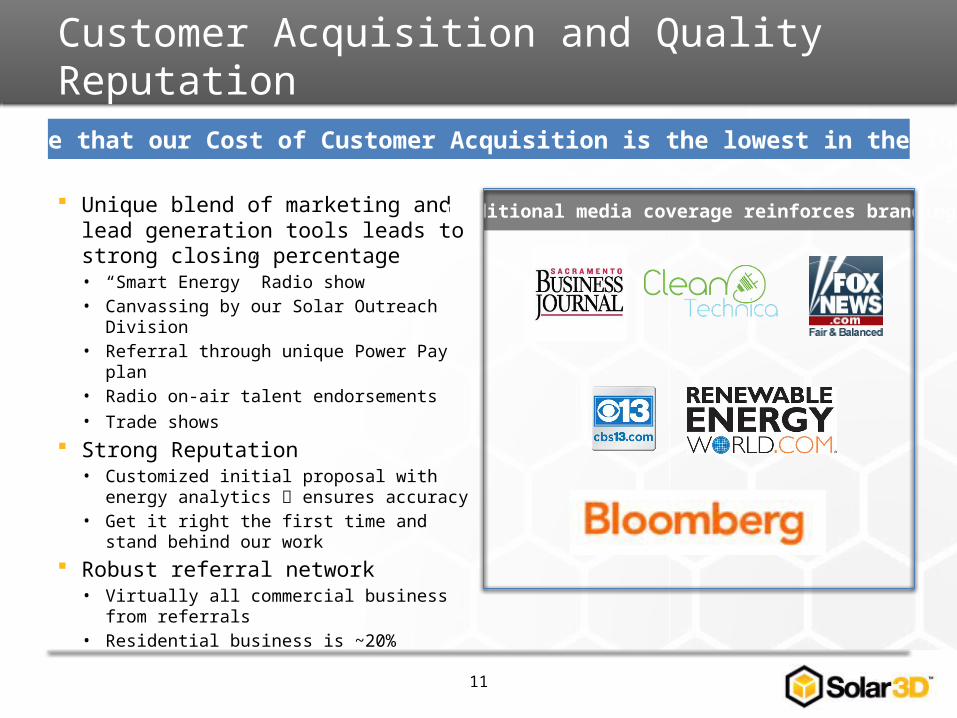
We believe that our Cost of Customer Acquisition is the lowest in the Industry
Unique blend of marketing and lead generation tools leads to strong closing percentage• “Smart Energy” Radio show• Canvassing by our Solar Outreach Division• Referral through unique Power Pay plan• Radio on-air talent endorsements• Trade shows
Strong Reputation• Customized initial proposal with energy analytics
ensures accuracy• Get it right the first time and stand behind our work
Robust referral network• Virtually all commercial business from referrals• Residential business is ~20%
Traditional media coverage reinforces branding
Strong Technology and After-Sales Support
Proprietary, scalable CRM system enhances customer acquisition
Monitoring capability to optimize O&M and provide real time data to customers
Strong after-sale customer support program:• Extended factory equipment technical support and liaison services with manufacturers• Standard comprehensive warranty program• Technical support “800 hot-line” for customers• Fast response within 24 hours for on-site service issues
New enterprise management system planned for 2015• Can facilitate more efficient integration of acquisitions• Objective is to support multiple subsidiaries with room for significant operational growth
We care about our customers and take pride in our reputation for outstanding service
12
Infrastructure in Place to Support Organic and Inorganic Growth
Financial Highlights
13
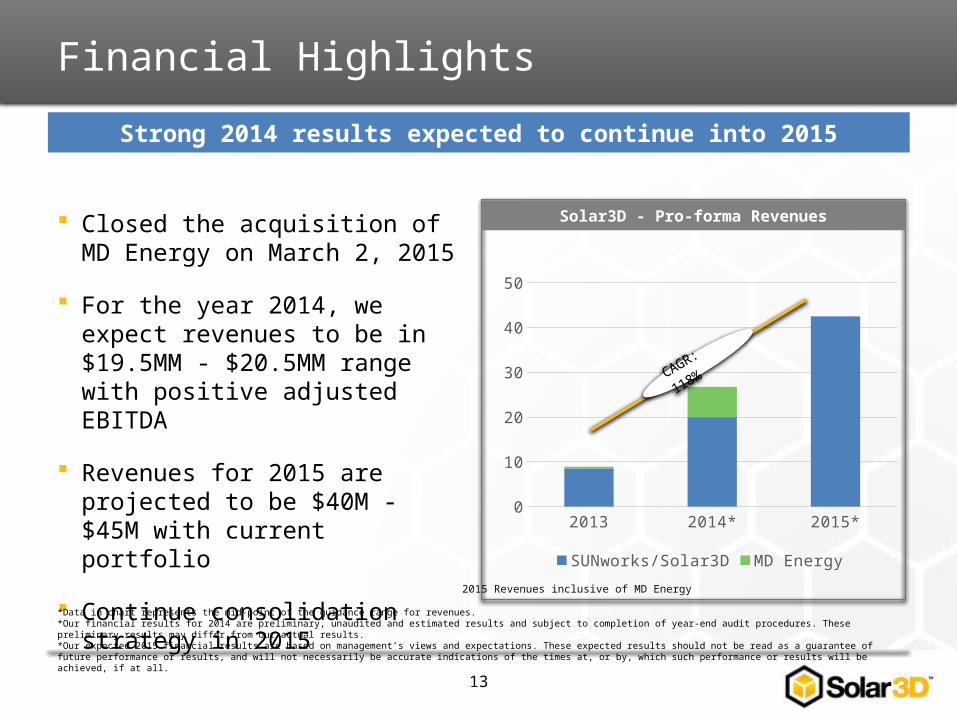
Closed the acquisition of MD Energy on March 2, 2015
For the year 2014, we expect revenues to be in $19.5MM - $20.5MM range with positive adjusted EBITDA
Revenues for 2015 are projected to be $40M - $45M with current portfolio
Continue consolidation strategy in 2015
Strong 2014 results expected to continue into 2015
2013 2014* 2015*0
10
20
30
40
50
SUNworks/Solar3D MD Energy
CAGR: 118%
Solar3D - Pro-forma Revenues
*Data in chart represents the mid-point of the guidance range for revenues. *Our financial results for 2014 are preliminary, unaudited and estimated results and subject to completion of year-end audit procedures. These preliminary results may differ from our actual results.*Our expected 2015 financial results are based on management’s views and expectations. These expected results should not be read as a guarantee of future performance or results, and will not necessarily be accurate indications of the times at, or by, which such performance or results will be achieved, if at all.
2015 Revenues inclusive of MD Energy
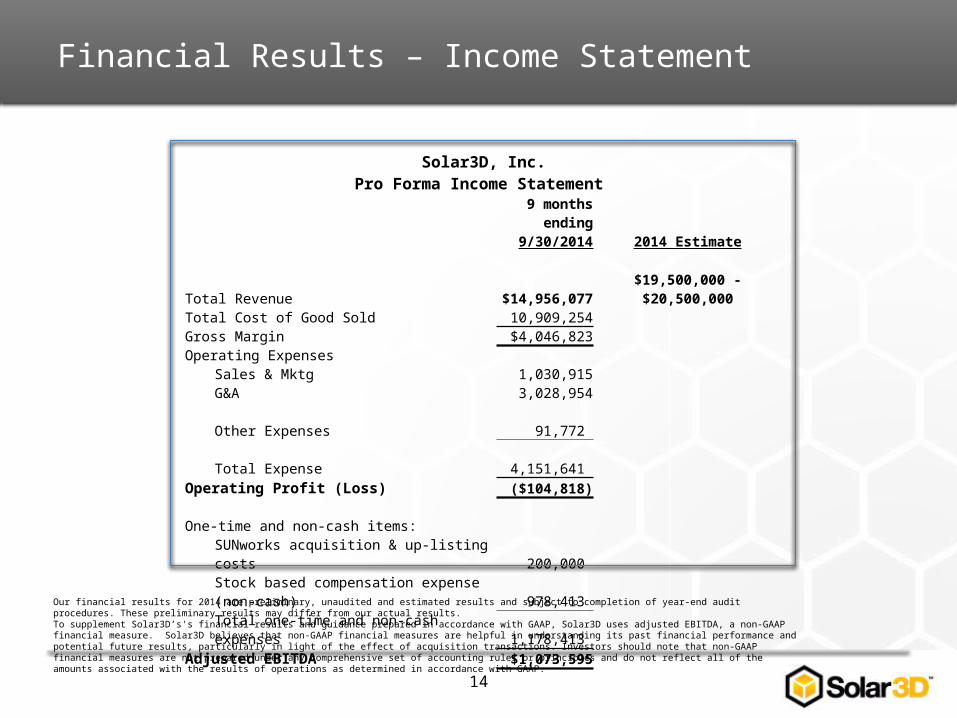
Solar3D, Inc.Pro Forma Income Statement
9 months ending
9/30/2014 2014 Estimate
Total Revenue $14,956,077 $19,500,000 - $20,500,000Total Cost of Good Sold 10,909,254Gross Margin $4,046,823Operating Expenses
Sales & Mktg 1,030,915G&A 3,028,954Other Expenses 91,772 Total Expense 4,151,641
Operating Profit (Loss) ($104,818)
One-time and non-cash items:SUNworks acquisition & up-listing costs 200,000 Stock based compensation expense (non-cash) 978,413 Total one-time and non-cash expenses 1,178,413
Adjusted EBITDA $1,073,595
Financial Results – Income Statement
14
Our financial results for 2014 are preliminary, unaudited and estimated results and subject to completion of year-end audit procedures. These preliminary results may differ from our actual results.To supplement Solar3D’s's financial results and guidance prepared in accordance with GAAP, Solar3D uses adjusted EBITDA, a non-GAAP financial measure. Solar3D believes that non-GAAP financial measures are helpful in understanding its past financial performance and potential future results, particularly in light of the effect of acquisition transactions. Investors should note that non-GAAP financial measures are not prepared under any comprehensive set of accounting rules or principles and do not reflect all of the amounts associated with the results of operations as determined in accordance with GAAP.
Financial Results - 2014
15
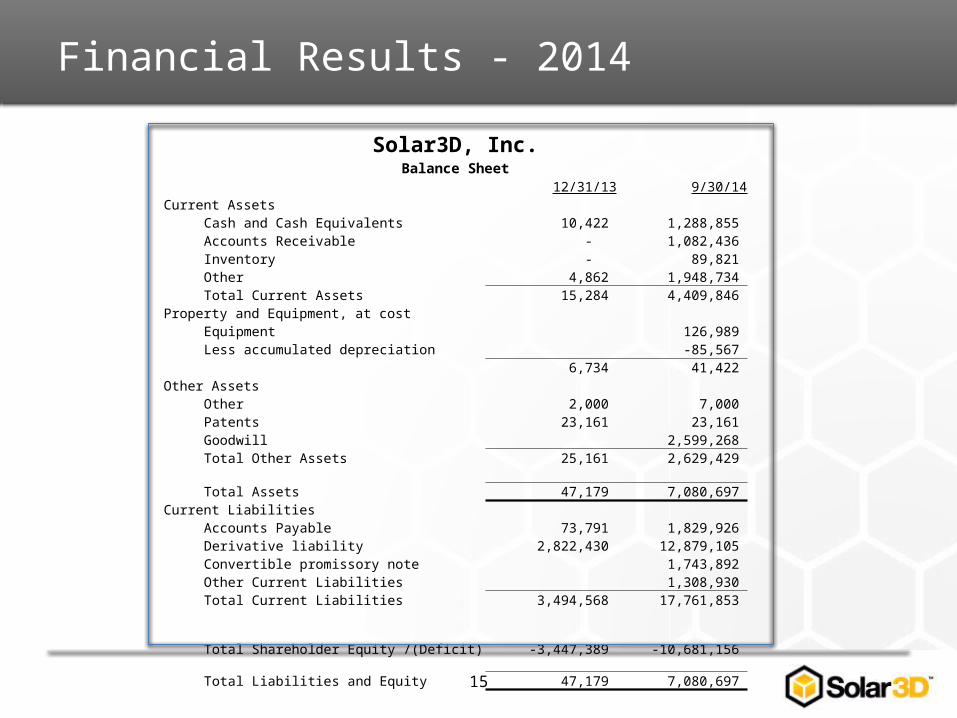
Solar3D, Inc.Balance Sheet
12/31/13 9/30/14Current Assets
Cash and Cash Equivalents 10,422 1,288,855 Accounts Receivable - 1,082,436 Inventory - 89,821 Other 4,862 1,948,734 Total Current Assets 15,284 4,409,846
Property and Equipment, at costEquipment 126,989 Less accumulated depreciation -85,567
6,734 41,422 Other Assets
Other 2,000 7,000 Patents 23,161 23,161 Goodwill 2,599,268 Total Other Assets 25,161 2,629,429
Total Assets 47,179 7,080,697 Current Liabilities
Accounts Payable 73,791 1,829,926 Derivative liability 2,822,430 12,879,105 Convertible promissory note 1,743,892 Other Current Liabilities 1,308,930 Total Current Liabilities 3,494,568 17,761,853
Total Shareholder Equity /(Deficit) -3,447,389 -10,681,156
Total Liabilities and Equity 47,179 7,080,697

Focused on Large, Highly Fragmented CA & NV Installer Markets
Investment Highlights
Demonstrated Ability to Acquire and Integrate Companies
16
End to End Capability From Design through Monitoring
Rapid Organic & Inorganic Revenue Growth: >100% in 2014 & 2015*
Positive EBITDA (adjusted) in 2014 and 2015*
Flexible Financing to Optimize Customer’s Economics
1
2
3
4
6
5
Demonstrated Ability to Acquire and Integrate Companies6
Focused on Large, Highly Fragmented CA & NV Installer Markets1
*Our financial results for 2014 are preliminary, unaudited and estimated results and subject to completion of year-end audit procedures. These preliminary results may differ from our actual results.*Our expected 2015 financial results are based on management’s views and expectations. These expected results should not be read as a guarantee of future performance or results, and will not necessarily be accurate indications of the times at, or by, which such performance or results will be achieved, if at all.
17
Thank You!