Embed Size (px)
Citation preview

CANADA:Becoming a Sustainable Energy Powerhouse
F I R S T E D I T I O N
A project undertaken by the
Canadian Academy of Engineering
Prepared by the CAE Energy Pathways Task ForceEdited by Richard J. Marceau and Clement W. Bowman
Sponsored by

1
CANADA:Becoming a Sustainable Energy Powerhouse
Katherine J. AlbionDirector, Bowman Centre, WesternSarnia-Lambton Research Park
Gilbert BennettVice-President, Lower Churchill, Nalcor Energy
Clement W. BowmanFCAE, Chairman, CAE Energy PathwaysTask Force
Terri ChuProject Analyst, FVB Energy Inc.
F. Pierre GingrasHydroelectricity Specialist, Hydro-Québec(retired)
Marshall J. KernProduct Stewardship Expertise CentreLeader, Dow Chemical Canada (retired)
Richard J. MarceauFCAE, Vice-President (Research), Memorial University of Newfoundland;President, Canadian Academy of Engineering
Daniel A. MeneleyAdjunct Professor, University of OntarioInstitute of Technology
Jatin NathwaniExecutive Director, Waterloo Institute forSustainable Energy (WISE), University ofWaterloo
Walter F. PetryschukFCAE, Associate, Bowman Centre, Western Sarnia-Lambton Research Park; SiteDirector, Suncor Sarnia Refinery (retired)
Mary Ellen RichardsonPresident, Mary Ellen Richardson Inc.
Marlena RogowskaUrban and Regional Planner
Mark ShrimptonPrincipal, Stantec Consulting Ltd.
Jim StanfordEconomist, Unifor; Globe and Mail Columnist
Donald E. WoodAssociate, Bowman Centre, Western Sarnia-Lambton Research Park; Vice President,Logistics and Business Development, Polysar (retired)
Edited by Richard J. Marceau and Clement W. Bowman
First edition, July 2014
For print copies of this publication,please contact:
Canadian Academy of Engineering180 Elgin Street, Suite 1402Ottawa, Ontario K2P 2K3Tel: 613-235-9056Fax: 613-235-6861Email: [email protected]
Registered Charity Number:134994375RR0001
This publication is also availableelectronically at the followingaddress: www.cae-acg.ca
Permission to Reproduce
Except as otherwise specifically noted,the information in this publicationmay be reproduced, in part or inwhole and by any means, withoutcharge or further permission from theCanadian Academy of Engineering,provided that due diligence isexercised in ensuring the accuracy ofthe information reproduced; that theCanadian Academy of Engineering isidentified as the source institution;and that the reproduction is notrepresented as an official version ofthe information reproduced, nor ashaving been made in affiliation with,or endorsement of the CanadianAcademy of Engineering.
Opinions and statements in thepublication attributed to namedauthors do not necessarily reflect thepolicy of the Canadian Academy ofEngineering.
ISBN: 978-1-928194-00-2
© Canadian Academy of Engineering 2014
This book, “Canada: Becoming a Sustainable Energy Powerhouse” is the work of many people,some as primary authors, some as sources of information, some as reviewers, and some asMembers of the long standing Canadian Academy of Engineering’s Energy Pathways Task Force.Whatever their role, they all believed that energy was, and would continue to be, one of thedrivers of the Canadian economy and a source of prosperity and jobs. They are identified below.
Authors
2
AlbertaInnovates: Energy and EnvironmentSolutions
Our goal is to help Alberta become aglobal leader in sustainable energyproduction and exceptional watermanagement. We work with ourpartners to identify criticaltechnology gaps and apply world-class innovation managementstrategies and research to developsolutions for the biggest challengesfacing Alberta’s energy andenvironment sector.
Bowman Centre, Western Sarnia-Lambton Research Park
Our goal is to catalyze theimplementation of new “big energyprojects,” representing the CanadianInnovation Strategy for the currenthalf century. Our focus is on thegeneration of value-added productsand services from Canada’shydrocarbon and biomassfeedstocks for the improvement of Canada’s GDP and the generationof jobs.
Bruce AnderPresident & CEO, Markham District Energy
Ed BrostPresident, JE&M Consulting Ltd.
Bruce CaterRefinery Economics, Suncor (retired)
Zhewen ChenManager, Program Development andPartnerships, Waterloo Institute forSustainable Energy, University of Waterloo
Duke du PlessisSenior Advisor, Alberta Innovates: Energyand Environment Solutions
Richard DamecourCEO, FVB Energy Inc.
Steve DoreyChair, Energy Council of Canada’s StudiesCommittee
Dana FelthamStantec Consulting Ltd.
Raymond GosineFCAE, Associate Vice-President (Research),Memorial University of Newfoundland
H. Clarke HenryResearch Manager, Imperial Oil (retired)
Ken HicksDepartment of Finance, Government ofNewfoundland and Labrador
Terrence HoffmanEmeritus Professor of Chemical Engineering,McMaster University; Principal ChemicalEngineer, Polysar Ltd. (retired)
Eddy IsaacsFCAE, President/CEO, Alberta Innovates:Energy and Environment Solutions
John KramersCEO, ProGrid Evaluation Solutions
Larry MacDonaldCFO, Nova Chemicals (retired)
Aung N. OoCommercialization Engineer, BowmanCentre, Western Sarnia-Lambton ResearchPark
Surindar SinghExecutive Director, Renewables & EmergingTechnologies, Alberta Innovates: Energy andEnvironment Solutions
Kirk M. WilsonSenior Vice President and Head, BayerTechnology Services Americas, BayerBusiness and Technology Services, LLC.(retired)
ContributorsSponsors
Preface 5
Executive Summary 7
Chapter 1 Canada 2050: Roadmap to an Energy Powerhouse 11
Chapter 2 Adding Value to Canada’s Petroleum Wealth: A National Economicand Environmental Priority
23
Chapter 3 Bitumen – Adding Value: Canada’s National Opportunity 45
Chapter 4 Responding to the Call to Action: The Case for a Sarnia-LambtonBitumen Upgrader Refinery
59
Chapter 5 The Case of the Dramatic Emergence of Newfoundland &Labrador’s Petroleum Industry
77
Chapter 6 Canada’s Low Carbon Electricity Advantage: Unlocking thePotential of Inter-Regional Trade
97
Chapter 7 The Muskrat Falls Project Development 123
Chapter 8 The Mackenzie River Hydroelectric Complex – Concept Study 137
Chapter 9 Nuclear Energy – The Path Forward 151
Chapter 10 The Importance of District Energy in Building Resilient Cities 169
Table of Contents

4

W e have worked together over the past nine years, to the fullest extent that ourrespective “day jobs” permitted. We started with an understanding that energyis an important sector of the Canadian economy and of life in this country.
Our understanding has now evolved into a belief that energy is the only pathway toCanadian economic and social well-being inthis current half century. We also believe thatenergy presents a unique opportunity ofbringing greater unity to our country in spirit,thought and action, in a way that haschallenged Canadians for decades.
This leads us to propose the following threegoals for unleashing unparalleled opportunityfor all Canadians over the next half century:
• Add value to Canada’s energy exports,extending our country’s value chain andstrengthening our innovation ecosystem.
• Contribute to reducing North America’scarbon footprint, such as being the lowest-cost producer of low-GHG electricity.
• Contribute to the increasing global energydemand, recognizing Canada's massiveenergy endowment.
In our 2012 book entitled “Canada: Winningas a Sustainable Energy Superpower”sponsored by the Canadian Academy ofEngineering, we demonstrated how Canada’saspirations of global energy leadership are wellwithin its grasp.
In this new book, also sponsored by theCanadian Academy of Engineering, “Canada:Becoming a Sustainable Energy Powerhouse,”we take the next step and present a plan formaking this a reality.
Preface
Prime Minister Stephen Harper,July 2006: “[Investors] ... have recognized
Canada’s emergence as a global energy
powerhouse – the emerging ‘energy
superpower’ our government intends to
build.”
Peter Lougheed,March 2007: “I just find it completely unacceptable that
our resource involves shipping jobs down
the pipeline with bitumen to the United
States...”
Jim Prentice, May 2012: “The era ofnation-building is far from over. Canada still
has enormous untapped resource wealth,
and planned megaprojects across the
country hold out the promise of unlocking
that potential and securing new markets for
Canadian energy.”
Frank McKenna, May 2013: Canada isseeing “value destruction of a scale we’ve
never witnessed before in this country.”
Jim Stanford,May 2013: “Canadians areasking is there not more for us in the world
economy than just digging stuff out of the
ground?” “The pejorative term of ‘hewers
of wood and drawers of water’ now has
been expanded... to ‘hewers of wood,
drawers of water, and scrapers of tar’.”
Thomas Mulcair, December 2013:“Canada’s natural resources are a tremendous
blessing, and our energy sector is the motor
of the Canadian economy.”
Brian Mulroney, April 2014 (addressingCanada as a resource superpower): “The
question is not ‘Why?’ but rather ‘Why not?’”
Richard J. Marceau
Clement W. Bowman
“.....”
5

6
To this end, we have brought together experts from across the country to chart the wayforward to the incredible opportunities open to all Canadians. Other prominent Canadiansshare our enthusiasm, as evidenced by the quotes in the side-bar.
We hope that you agree with our plan. We especially hope that you will partner with us tomake it a reality. It indeed comes down to “Why not”?
Richard J. MarceauPEng, PhD, FCAEPresident, The Canadian Academyof EngineeringVice-President (Research),Memorial University of Newfoundland
Clement W. BowmanC.M. PEng, PhD, HCIC, FCAEChair, The Canadian Academy ofEngineering Energy Pathways Task Force
A s presented at the 2011 World Energy Congress in Montreal, our planet faces twocivilization-changing challenges in this century: access to energy by the 2 billionpeople who have limited or no access to energy, and climate change. With Canada’s
unique endowment of energy sources, both renewable and non-renewable, the nation has thecapacity - some would say the responsibility - of contributing to the resolution of both of thesechallenges. To provide greater opportunity to its people and strengthen its long-term financialsustainability, Canada has an additional major challenge; that of capturing greater value fromits natural resources by upgrading them to higher value products, thus capturing added wealthand jobs. This book presents a roadmap depicting how Canada can meet these threechallenges through ‘big projects’.
In our previous book, “Canada: Winning as a Sustainable Energy Superpower,” sponsored by the Canadian Academy of Engineering, we described the significant impact that twelveprevious national projects had in creating the Canada we now know. Wide-reaching projects of this nature have, in fact, constituted the key Canadian innovation strategy, releasing a torrentof new entrepreneurial activity and new technology. In each case, the resulting “innovationecosystem” developed value chains and supply chains which brought these projects to fruition,and lifted Canada’s national technological and business foundation to a new level of capabilityand performance. How were these big projects launched and how were they financed? Theywere launched by visionaries who overcame critical obstacles at crucial times. Eight of theendeavours were launched as crown corporations by various governments, but also activelyinvolved the private sector in their implementation. Five of these have since been divested tothe private sector. Four were launched as private sector initiatives, but with a significantportion of the risk shared by governments, through a variety of incentives, including equity.Nine of the twelve large-scale projects are now fully private-sector enterprises. All twelve weresuccessful, and continue to generate incredible value.
The message here is clear: big, nation-building projects often take decades to reachcommercial fruition and are not jobs for single companies and a single set of shareholders.They are national projects serving a long-term national interest. This is clearly the view ofenergy experts who gathered at the “Bitumen – Adding Value” conference (May 21-22, 2013),sponsored by the Canadian Academy of Engineering. In their Communiqué (discussed fullyin Chapter 3), they stated that “Canada should launch national-scale energy projects as thefoundation of its energy strategy and its pathway to sustainable wealth creation and jobs.” A “Call for Action” was the theme of keynote presentations by the Honourable FrankMcKenna (Deputy Chair, TD Bank Group), Senator Elaine McCoy, and Dr. Jim Stanford(Economist, Unifor).
What are the most compelling new energy projects that should now be carried out in Canada?In our previous book, “Canada: Winning as a Sustainable Energy Superpower,” nine bigenergy projects were proposed for implementation between now and 2050 as a continuationof Canada’s ongoing nation building.
Executive Summary
7
CANADA’S THREE ENERGYCHALLENGES
• Add value to Canada’s energy
exports, extending our country’s
value chain and strengthening
our innovation ecosystem.
• Contribute to reducing North
America’s carbon footprint, by
becoming the lowest-cost
producer of low-GHG electricity.
• Contribute to the increasing
global energy demand,
recognizing Canada's massive
energy endowment.
CANADA’S INNOVATIONSTRATEGY
• Big national-scale projects.
• Led by visionaries.
• Implemented by private/public
sector collaboration.
NINE PROPOSED BIGPROJECTS
• For Implementation this half
century.
• Substantial increase in energy
production.
• Carbon content of energy input
reduced from 86% to 61%.
8
In this follow-up book, “Canada: Becoming a Sustainable Energy Powerhouse,” Chapter 1examines how these nine new big projects would impact both Canada’s energy productionand carbon footprint if they were implemented, as suggested, between now and 2050. Aspointed out in this chapter, these new energy ventures would increase the amount of energy-related products that Canada could produce and export by 85%, and decrease the carboncontent of its energy input from 86% to 61%. Clearly, Canada has the ability to be a sustainableenergy powerhouse for the foreseeable future.
The next four chapters (Chapters 2 to 5) examine Canada’s progress in adding value to itsnatural resources.
Chapter 2 describes the fundamental structural transformation of Canada’s economyresulting from the dramatic expansion of petroleum extraction since the year 2000. Canada isonce again primarily reliant on extracting resource wealth from the ground beneath our feet.We export that wealth to others who transform it, manipulate it, and add value to it –importing it back in the forms of advanced products and services. Because of this, policy-makers should aim to develop and implement policies which maximize the economic benefits(and minimize the environmental and social costs) of Canada’s petroleum and other non-renewable resources. Examples of such policies would be measures to, )a) boost Canadianvalue-add content in inputs to petroleum and other resource sectors, (b) increase Canadianprocessing and manufacturing of our resource commodities after they are extracted, and (c)support and protect other value-added export industries (with no direct connection toresources) from being damaged by the macroeconomic side-effects of the resource boom.
Chapter 3 provides additional value-added policy suggestions from participants at the May 2013 “Bitumen – Adding Value” conference organized by the Canadian Academy ofEngineering. The consensus was captured in eight communiqué statements which outlinedstrategies and tactics to dramatically change Canada’s value-added performance. Bitumenupgrading was clearly identified as a current, significant opportunity for adding value toCanada’s massive bitumen resource, offering one of those few historic opportunities to reversethe country’s trajectory of exporting its raw natural resources with little or no added value tothe domestic economy.
Chapter 4 builds on the conclusions of Chapter 3, and provides a case study for a potentialbitumen upgrading project in southwestern Ontario, providing access to markets in the centraland eastern United States and Canada, and global markets via the St. Lawrence Seaway. Thisproject, led by the Academy’s Energy Pathways Task Force, is under review by several potentialcommercial partners, with the logical next step being a feasibility study on project design andproduct slate.
Chapter 5 describes the dramatic emergence of the Newfoundland offshore petroleumindustry, illustrating the impact of a provincial megaproject not only on its host province, but the country as a whole. The result is the creation of a new economic sector serving local,national and international markets, increased business confidence, a highly entrepreneurialenvironment, new industrial investment, and significantly enhanced government revenues.This is a clear 21st-century example of the emergence of a high value-added innovationecosystem arising from “big projects,” resulting in the transformation of both the economy
ENERGY INNEWFOUNDLAND ANDLABRADOR
• Case study of an energy-driven
innovation ecosystem having a
transformative effect on the
provincial economy.
IMPACT OF DRAMATICINCREASE IN RESOURCEEXTRACTION
• Canada again returning to
reliance on extracting and
exporting unprocessed resources.
• Policies needed to increase value-
add upstream and downstream,
and to minimize damage to
other export industries.
ACTION ON VALUE-ADD
• Eight-statement strategy from
energy leaders.
• Bitumen upgrading a major
current opportunity.
• Sarnia-Lambton upgrader a
logical next step.
and the social structure of the host region. This shows that Canada’s nation-building “bigproject innovation strategy” is as relevant today as it was at the birth of Confederation!
The next five chapters (Chapters 6 to 10) drill deeper into Canada’s energy opportunities,such as the establishment of a national electricity grid which would enable Canada to be thepremier low-cost provider of low-carbon electricity to North America, and the establishmentdistrict energy systems for more optimal delivery of municipal thermal energy requirements.
Chapter 6 presents an opportunity for Canada to achieve a ten- to twenty-fold increase inclean electricity trade with the United States over the next 30 to 50 years, compared to currentlevels of about $2 billion per year. This would deliver on goals of enhanced energy securityand substantial reduction of greenhouse gases (GHGs) on a continental scale. Newinterconnections and transmission links acting as “regional hubs” between provinces andneighbouring states would be required to meet these goals. Canada’s low-carbon electricityadvantage, fully integrated with energy trade and climate change policies of Canada and theUS, represents a major “big project” opportunity. A dramatic shift in thinking and support fora national energy strategy will be required that has, at its fulcrum, large-scale cross border inter-regional trade in electricity.
Chapter 7 describes another ground-breaking “big project” currently underway in theProvince of Newfoundland and Labrador; the Muskrat Falls hydroelectric powerdevelopment. It incorporates a major, low-carbon, hydroelectric development on Labrador’sChurchill River coupled to overhead and undersea high voltage AC and DC transmissionlines. It will deliver power from Labrador, under the Strait of Belle Isle, through Newfoundland,then under the Gulf of St. Lawrence River to Nova Scotia. At the time of commissioning, thiswill be one of the most complex transmission systems in the world, and will open new avenuesfor integrating low-carbon hydroelectric power to continental power grids.
Chapter 8 presents the conclusions of one of the first complete studies dedicated toharnessing the Northwest Territories’ Mackenzie River potential for hydroelectricdevelopment. This project is enormous by any standard, similar in scale to Quebec’s JamesBay Hydroelectric Complex. Describing flows of up to 9,000 cubic meters per second, steepshorelines avoiding wide-area submersion, and large lakes acting as flow regulation reservoirs,this chapter depicts a practical implementation scenario for harnessing the Mackenzie River’spotential, with an overall capacity slightly greater than 13,000 MW. The chapter describes keyfeatures of the project, including an upstream water control structure and six downstreampowerhouses. The Mackenzie River hydroelectric complex would help the provinces ofAlberta and Saskatchewan transition from high-carbon footprint thermal generating stationsto low-carbon hydroelectric power stations as the thermal generating stations of these twoprovinces approach the end of their useful life spans.
Chapter 9 proposes the concept of large nuclear generating sites producing both bulkelectricity and process steam, for use by adjacent industrial parks consisting of high-affinity,energy-intensive plant operations. A key feature of this concept is that of the “energy cascade”in which the inputs and outputs of different industrial activities would be both complementaryand mutually supportive. Ontario’s Bruce Energy Centre is an example of this concept.Canada’s fully established fission energy system (CANDU) would be the backbone of this
9
CANADA’S HUGE ELECTRICPOWER POTENTIAL
• New interconnected grid with
regional hubs would make
Canada a low-cost supplier of
low-carbon electricity to the
continent, resulting in a major
decrease in North America's
greenhouse gas emissions.
REALIZATION OF CANADA’SHYDROELECTRIC POTENTIAL
• Muskrat Falls is already
underway.
• Mackenzie River is ready for
detailed engineering evaluation.
PATHWAY FOR NUCLEARENERGY
• Large nuclear sites generating
both electricity and steam offer
the unique opportunity of
supplying low-carbon electricity
to the grid, and steam for
producing a broad range of
value-added, energy-intensive
products.
10
development, with the required resources of expertise, fuel and other materials fully availablewithin Canada.
Chapter 10 explores the potential – and presents the pathway forward – for a dramaticdecrease in energy dependence from electricity grids and conventional energy deliverysystems for home and business space heating and cooling, through the establishment ofDistrict Energy (DE) thermal grids in Canada’s major cities. Thermal energy use representsroughly one third of all energy consumed in the country. Nearly all of this energy is nowprovided by high-grade energy sources (e.g., electricity, natural gas, oil, etc.), which areinherently inefficient for maintaining building temperatures between 20 and 23 degreesCelsius. This chapter provides a description of District Energy Systems and how communitiesinside Canada, and in the international arena, have successfully deployed district energysolutions to meet their energy needs while increasing flexibility in the choice of energyresource, decreasing operating costs, and lowering carbon footprint. It also points the way tosignificant new opportunities for Canadian know-how and business in developing this area inCanada and abroad.
DISTRICT ENERGYPOTENTIAL
• Thermal grids in cities can
dramatically reduce dependence
on electricity grids and
conventional energy delivery
systems.
• Emerging Canadian know-how
in partnership with existing
international technology
providers present a significant
business opportunity.
The Canadian Academy of Engineering is committed to pursuing and promoting itsongoing work on sustainable energy development, an initiative launched in 2005. Theactions described in this book will contribute to Canada’s three urgent nation-buildingenergy objectives: contributing to global energy demand, reducing North America’scarbon footprint, and adding value to our raw resources.
As an ongoing task, the Energy Pathways Task Force will monitor Canada's progressin capturing the energy opportunities presented in this book.

11
ABSTRACT
In this chapter, we explore how the nine energy projects proposed in
“Canada: Winning as a Sustainable Energy Superpower” would increase
the amount of energy-related products that Canada could export, and
significantly raise the proportion of renewable and non-GHG-emitting
energy sources in the total energy mix. These projects would also
dramatically increase the added value of the energy products that
Canada uses and exports, reversing Canada’s current trend presented
in Chapter 2 of this book. Chapters 3 and 4 emphasize the urgency and
opportunity of upgrading bitumen in Canada’s strategy of moving up
the value chain, while subsequent chapters identify other important
energy opportunities.
The three objectives of increasing energy production, decreasing
the carbon content of our energy mix and adding value prior to export
are the key energy challenges that Canada faces in this century. The
nine “big energy projects” proposed by the Canadian Academy of
Engineering (CAE) would significantly contribute to these goals,
and position Canada as a “sustainable energy powerhouse.”
Canada 2050: Roadmap to an Energy Powerhouse
Richard J. MarceauClement W. Bowman
1
12
Introduction
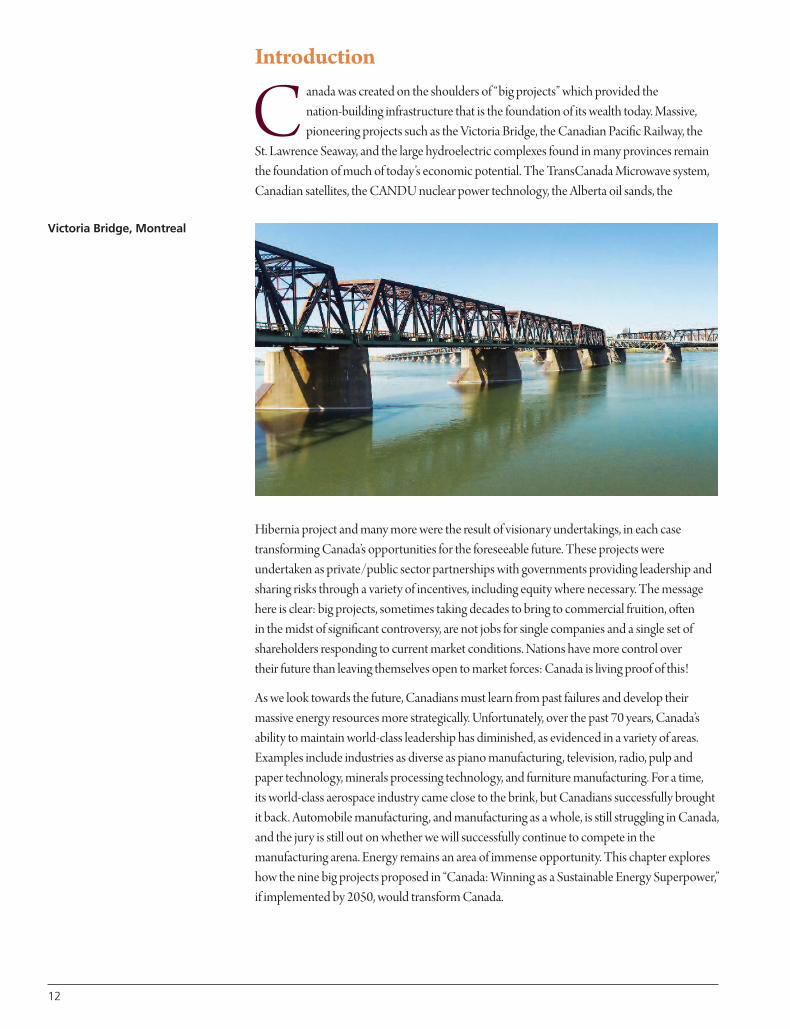
C anada was created on the shoulders of “big projects” which provided the nation-building infrastructure that is the foundation of its wealth today. Massive, pioneering projects such as the Victoria Bridge, the Canadian Pacific Railway, the
St. Lawrence Seaway, and the large hydroelectric complexes found in many provinces remainthe foundation of much of today’s economic potential. The TransCanada Microwave system,Canadian satellites, the CANDU nuclear power technology, the Alberta oil sands, the
Hibernia project and many more were the result of visionary undertakings, in each casetransforming Canada’s opportunities for the foreseeable future. These projects wereundertaken as private/public sector partnerships with governments providing leadership andsharing risks through a variety of incentives, including equity where necessary. The messagehere is clear: big projects, sometimes taking decades to bring to commercial fruition, often in the midst of significant controversy, are not jobs for single companies and a single set ofshareholders responding to current market conditions. Nations have more control over their future than leaving themselves open to market forces: Canada is living proof of this!
As we look towards the future, Canadians must learn from past failures and develop theirmassive energy resources more strategically. Unfortunately, over the past 70 years, Canada’sability to maintain world-class leadership has diminished, as evidenced in a variety of areas.Examples include industries as diverse as piano manufacturing, television, radio, pulp andpaper technology, minerals processing technology, and furniture manufacturing. For a time, its world-class aerospace industry came close to the brink, but Canadians successfully broughtit back. Automobile manufacturing, and manufacturing as a whole, is still struggling in Canada,and the jury is still out on whether we will successfully continue to compete in themanufacturing arena. Energy remains an area of immense opportunity. This chapter exploreshow the nine big projects proposed in “Canada: Winning as a Sustainable Energy Superpower,”if implemented by 2050, would transform Canada.
Victoria Bridge, Montreal
Canada’s Current Energy Production
A s one of the world’s top 10 energy producers and a net energy exporter, Canada plays a key role in providing access to energy for the citizens of our planet. Canada’scontribution to global energy production could be substantially increased in a
sustainable manner, since Canada is endowed with a wide range of energy sources, including:
• Huge, non-renewable carbon-bearing sources of gas, oil, bitumen and coal,
• Vast uranium and thorium ores, and proven nuclear power technology,
• Massive developed and undeveloped hydroelectric power, and
• Large renewable energy resources from its vast agricultural and forestry residues.
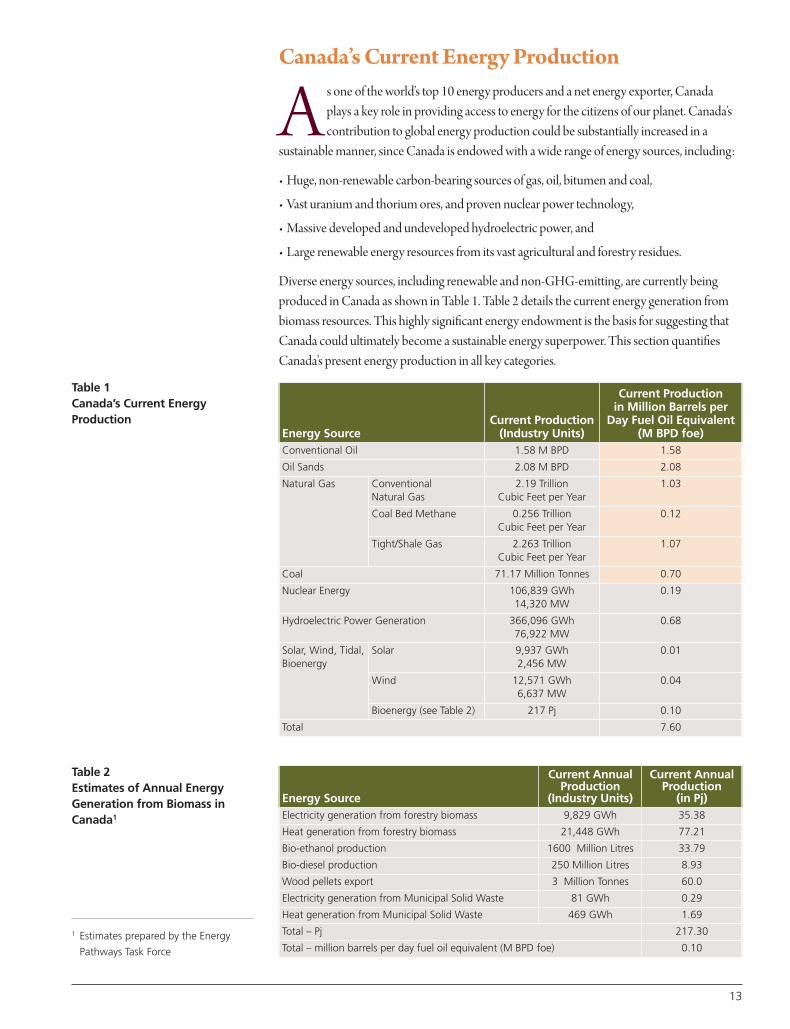
Diverse energy sources, including renewable and non-GHG-emitting, are currently beingproduced in Canada as shown in Table 1. Table 2 details the current energy generation frombiomass resources. This highly significant energy endowment is the basis for suggesting thatCanada could ultimately become a sustainable energy superpower. This section quantifiesCanada’s present energy production in all key categories.
13
Table 1Canada’s Current EnergyProduction
Table 2Estimates of Annual EnergyGeneration from Biomass inCanada1
Energy SourceCurrent Production
(Industry Units)
Current Production in Million Barrels per
Day Fuel Oil Equivalent(M BPD foe)
Conventional Oil 1.58 M BPD 1.58
Oil Sands 2.08 M BPD 2.08
Natural Gas ConventionalNatural Gas
2.19 TrillionCubic Feet per Year
1.03
Coal Bed Methane 0.256 TrillionCubic Feet per Year
0.12
Tight/Shale Gas 2.263 TrillionCubic Feet per Year
1.07
Coal 71.17 Million Tonnes 0.70
Nuclear Energy 106,839 GWh14,320 MW
0.19
Hydroelectric Power Generation 366,096 GWh76,922 MW
0.68
Solar, Wind, Tidal,Bioenergy
Solar 9,937 GWh2,456 MW
0.01
Wind 12,571 GWh6,637 MW
0.04
Bioenergy (see Table 2) 217 Pj 0.10
Total 7.60
Energy Source
Current AnnualProduction
(Industry Units)
Current AnnualProduction
(in Pj)Electricity generation from forestry biomass 9,829 GWh 35.38
Heat generation from forestry biomass 21,448 GWh 77.21
Bio-ethanol production 1600 Million Litres 33.79
Bio-diesel production 250 Million Litres 8.93
Wood pellets export 3 Million Tonnes 60.0
Electricity generation from Municipal Solid Waste 81 GWh 0.29
Heat generation from Municipal Solid Waste 469 GWh 1.69
Total – Pj 217.30
Total – million barrels per day fuel oil equivalent (M BPD foe) 0.10
1 Estimates prepared by the Energy
Pathways Task Force

14
Conventional Oil
The first significant discovery of conventional oil was in Oil Springs, Ontario in 1865. Before the village was formed, the indigenous people already knew about the gum beds and used the sticky oil to waterproof their canoes2. The place, originally called Black Creek,became the site of North America’s first commercial oil well when asphalt producer JamesMiller Williams set out to dig a water well in 1858 and found free oil instead. Williams’discovery triggered North America’s first oil rush and the village’s name was changed to Oil Springs that same year. Within a few years, Oil Springs was a bustling town with fourthousand residents and, in its peak days, boasted paved roads, horse-drawn buses and streetlamps. This led to a world-wide reputation for the drillers and engineers involved. However,the reserves proved to be limited. Today, production continues at a low level using the originalequipment, preserving the historical significance of the site.
A huge oil discovery occurred in Leduc, Alberta in 19473. This provided the geological key to Alberta’s prolific conventional oil reserves and resulted in a boom in petroleum explorationand development across Western Canada. The discovery transformed the Alberta economy;oil and gas supplanted farming as the primary industry, and resulted in the province becomingone of the richest in the country. Nationally, the discovery allowed Canada to become self-sufficient within a decade and ultimately a major exporter of oil. Canada’s current conventionaloil production is 1.58 million barrels per day (M BPD).
Oil Sands
Oil sands represent a very different story. The existence of the heavy and viscous bitumen was known by native people and explorers for many decades prior to 1900. The oil sands areaswere subjected to extensive survey and early experimentation over many decades. The Albertagovernment decided to build and test a demonstration bitumen recovery plant at BitumountAlberta in 19474. Although the recovery process was shown to be commercially viable, large-scale commercial production did not occur until 1967 by Suncor, and a few years later bySyncrude. Production is currently 2.08 M BPD and is likely to at least double by 2030. Newproduction will come from both new mining projects and also a major expansion in in-situproduction from the deeply buried deposits representing close to 90% of the total resource.Environmental issues may slow down the pace of production but advances are being made in site restoration and in the development of new processes with less environmental impact.Reducing greenhouse gas emissions will be a continuing challenge. It is believed that there are close to 2 trillion barrels in Alberta’s various bituminous deposits.
Natural Gas
The energy equivalent of Canada’s current natural gas production of 4.7 trillion cubic feet per year (including conventional natural gas, coal bed methane and tight/shale gas) is higherthan that of either conventional oil or oil sands production , equivalent to to 2.22 M BPD foe5.Although conventional production appears to have peaked and decreased somewhat, thepicture has recently changed with new production expected from coal bed methane, tight gasand shale gas. The emergence of advanced fracturing technology has opened major new gasdeposits in both the US and Canada. The major issue for Canada will be the loss of US
2 http://en.wikipedia.org/wiki/
Oil_Springs,_Ontario
3 http://en.wikipedia.org/wiki/
Leduc_No._1
4 http://en.wikipedia.org/wiki/
Bitumount
5 foe – Fuel Oil Equivalent – an index
used by the energy industry to
compare the size of various energy
sources
Photo courtesy of Tourism Sarnia-Lambton
markets, and the need to shift direction to liquefied natural gas for international markets.Canada will not be running out of natural gas for the foreseeable future. However,environmental concerns in the public arena over the use of fracturing technology will need to be addressed.
Coal
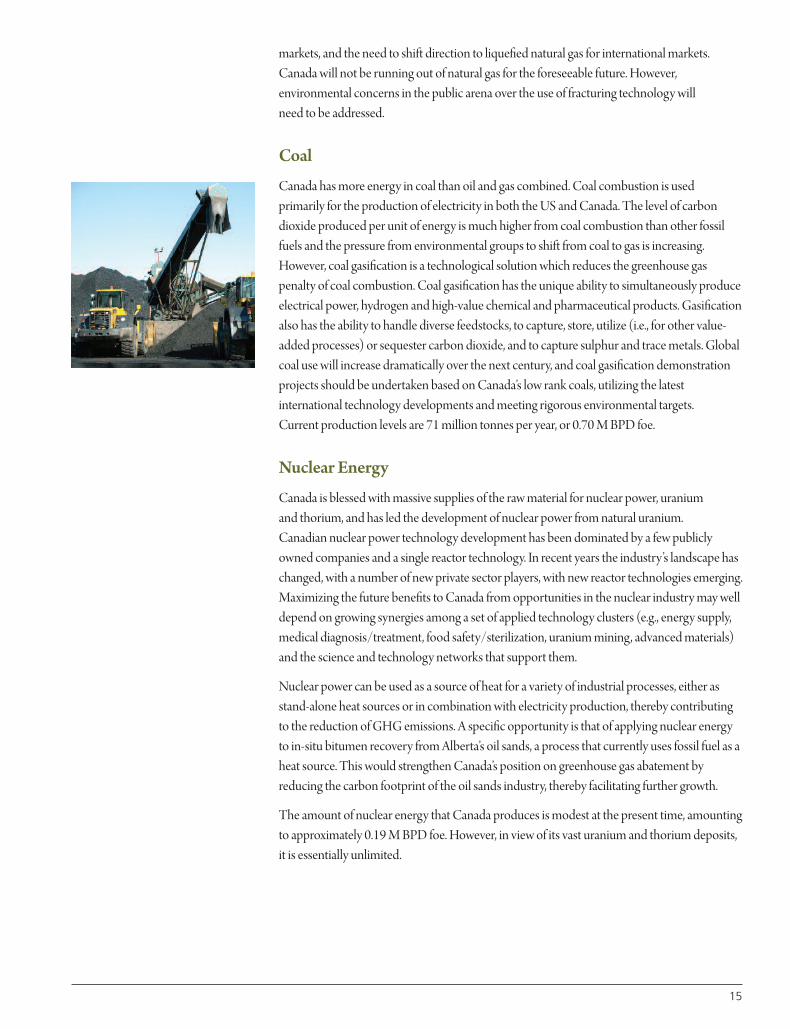
Canada has more energy in coal than oil and gas combined. Coal combustion is usedprimarily for the production of electricity in both the US and Canada. The level of carbondioxide produced per unit of energy is much higher from coal combustion than other fossilfuels and the pressure from environmental groups to shift from coal to gas is increasing.However, coal gasification is a technological solution which reduces the greenhouse gaspenalty of coal combustion. Coal gasification has the unique ability to simultaneously produceelectrical power, hydrogen and high-value chemical and pharmaceutical products. Gasificationalso has the ability to handle diverse feedstocks, to capture, store, utilize (i.e., for other value-added processes) or sequester carbon dioxide, and to capture sulphur and trace metals. Globalcoal use will increase dramatically over the next century, and coal gasification demonstrationprojects should be undertaken based on Canada’s low rank coals, utilizing the latestinternational technology developments and meeting rigorous environmental targets. Current production levels are 71 million tonnes per year, or 0.70 M BPD foe.
Nuclear Energy
Canada is blessed with massive supplies of the raw material for nuclear power, uranium and thorium, and has led the development of nuclear power from natural uranium. Canadian nuclear power technology development has been dominated by a few publiclyowned companies and a single reactor technology. In recent years the industry’s landscape haschanged, with a number of new private sector players, with new reactor technologies emerging.Maximizing the future benefits to Canada from opportunities in the nuclear industry may welldepend on growing synergies among a set of applied technology clusters (e.g., energy supply,medical diagnosis/treatment, food safety/sterilization, uranium mining, advanced materials)and the science and technology networks that support them.
Nuclear power can be used as a source of heat for a variety of industrial processes, either asstand-alone heat sources or in combination with electricity production, thereby contributingto the reduction of GHG emissions. A specific opportunity is that of applying nuclear energyto in-situ bitumen recovery from Alberta’s oil sands, a process that currently uses fossil fuel as aheat source. This would strengthen Canada’s position on greenhouse gas abatement byreducing the carbon footprint of the oil sands industry, thereby facilitating further growth.
The amount of nuclear energy that Canada produces is modest at the present time, amountingto approximately 0.19 M BPD foe. However, in view of its vast uranium and thorium deposits,it is essentially unlimited.
15
Hydroelectric Power Generation
With 73,000 MW of installed hydroelectric generating capacity, producing 366,096 GWh of electrical energy annually (or 0.68 M BPD foe), Canada is a leader in the development andapplication of advanced hydroelectric power generation and transmission technology. Theuntapped power in Canada’s hydraulic systems, amounting to more than 163,000 MW, ismore than double the current installed capacity. Priority areas for development can be foundin nearly every province.
The lack of a national power grid results in uneven energy costs across the country andstranded power reserves, not to mention the loss of potential north-south trade opportunities.
A prerequisite for moving ahead with major new hydroelectric projects is the establishment of a Canada-wide high-capacity transmission network, with three objectives:
1. Link new hydroelectric projects to areas of consumption.
2. Interconnect existing provincial networks.
3. Replace thermal power plants at the end of their useful life to reduce Canada’s GHGfootprint.
4. Seize the opportunity to become North America's premier low-cost provider of low-carbon electricity
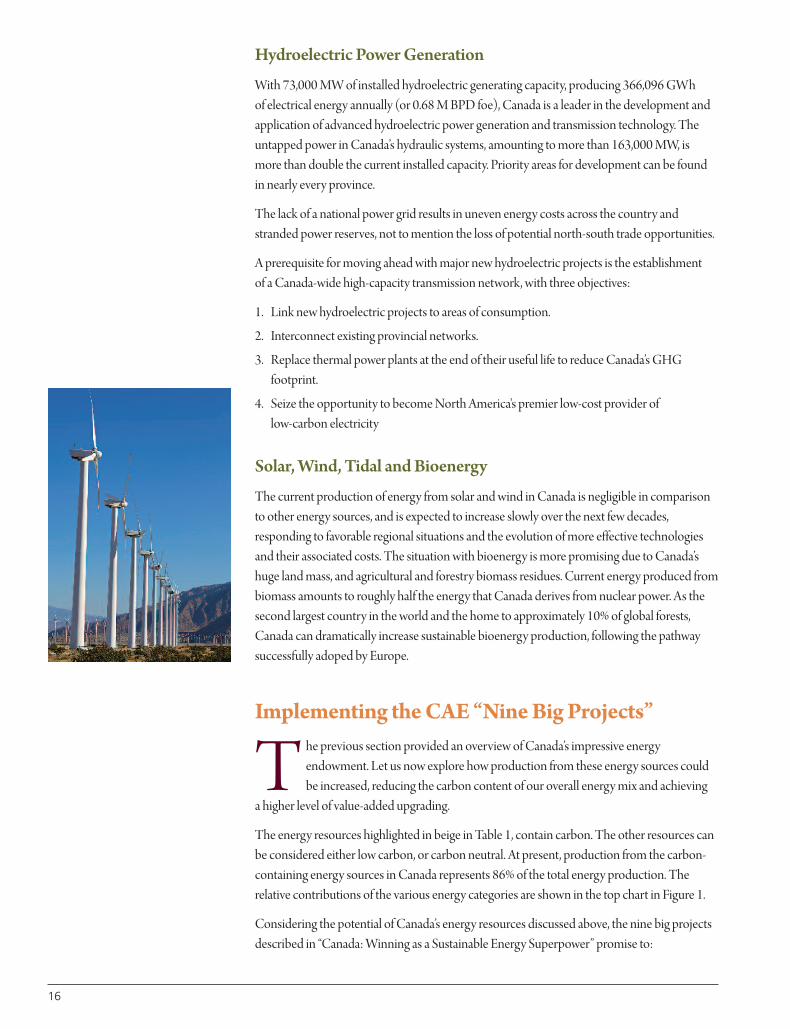
Solar, Wind, Tidal and Bioenergy
The current production of energy from solar and wind in Canada is negligible in comparisonto other energy sources, and is expected to increase slowly over the next few decades,responding to favorable regional situations and the evolution of more effective technologiesand their associated costs. The situation with bioenergy is more promising due to Canada’shuge land mass, and agricultural and forestry biomass residues. Current energy produced frombiomass amounts to roughly half the energy that Canada derives from nuclear power. As thesecond largest country in the world and the home to approximately 10% of global forests,Canada can dramatically increase sustainable bioenergy production, following the pathwaysuccessfully adoped by Europe.
Implementing the CAE “Nine Big Projects”
T he previous section provided an overview of Canada’s impressive energyendowment. Let us now explore how production from these energy sources couldbe increased, reducing the carbon content of our overall energy mix and achieving
a higher level of value-added upgrading.
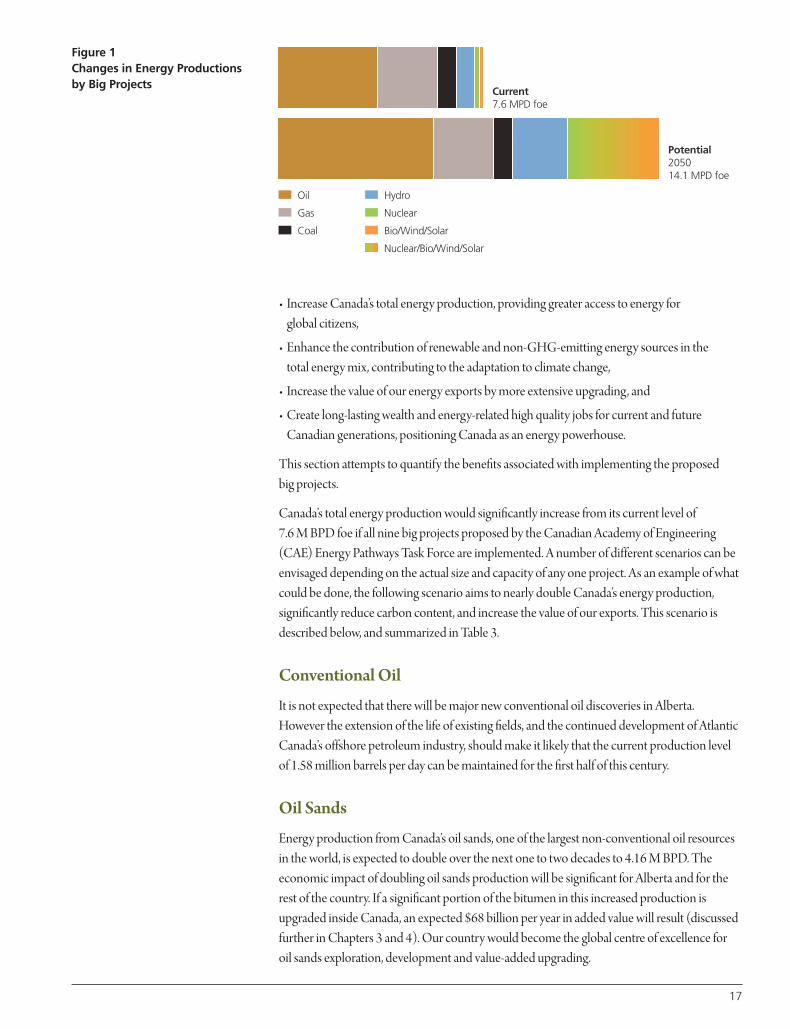
The energy resources highlighted in beige in Table 1, contain carbon. The other resources canbe considered either low carbon, or carbon neutral. At present, production from the carbon-containing energy sources in Canada represents 86% of the total energy production. Therelative contributions of the various energy categories are shown in the top chart in Figure 1.
Considering the potential of Canada’s energy resources discussed above, the nine big projectsdescribed in “Canada: Winning as a Sustainable Energy Superpower” promise to:
16
• Increase Canada’s total energy production, providing greater access to energy for global citizens,
• Enhance the contribution of renewable and non-GHG-emitting energy sources in the total energy mix, contributing to the adaptation to climate change,
• Increase the value of our energy exports by more extensive upgrading, and
• Create long-lasting wealth and energy-related high quality jobs for current and futureCanadian generations, positioning Canada as an energy powerhouse.
This section attempts to quantify the benefits associated with implementing the proposed big projects.
Canada’s total energy production would significantly increase from its current level of7.6 M BPD foe if all nine big projects proposed by the Canadian Academy of Engineering(CAE) Energy Pathways Task Force are implemented. A number of different scenarios can beenvisaged depending on the actual size and capacity of any one project. As an example of whatcould be done, the following scenario aims to nearly double Canada’s energy production,significantly reduce carbon content, and increase the value of our exports. This scenario isdescribed below, and summarized in Table 3.
Conventional Oil
It is not expected that there will be major new conventional oil discoveries in Alberta.However the extension of the life of existing fields, and the continued development of AtlanticCanada’s offshore petroleum industry, should make it likely that the current production levelof 1.58 million barrels per day can be maintained for the first half of this century.
Oil Sands
Energy production from Canada’s oil sands, one of the largest non-conventional oil resourcesin the world, is expected to double over the next one to two decades to 4.16 M BPD. Theeconomic impact of doubling oil sands production will be significant for Alberta and for therest of the country. If a significant portion of the bitumen in this increased production isupgraded inside Canada, an expected $68 billion per year in added value will result (discussedfurther in Chapters 3 and 4). Our country would become the global centre of excellence for oil sands exploration, development and value-added upgrading.
17
Current7.6 MPD foe
Potential205014.1 MPD foe
Oil
Gas
Coal
Hydro
Nuclear
Bio/Wind/Solar
Nuclear/Bio/Wind/Solar
Figure 1Changes in Energy Productionsby Big Projects
18
Natural Gas
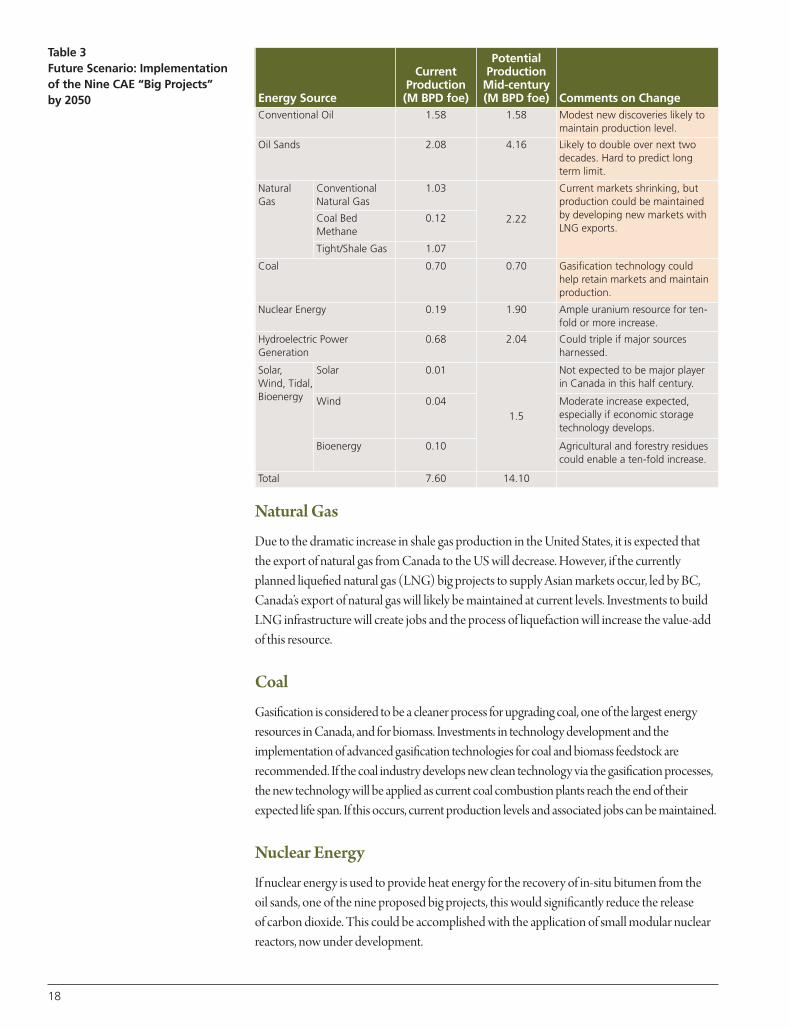
Due to the dramatic increase in shale gas production in the United States, it is expected thatthe export of natural gas from Canada to the US will decrease. However, if the currentlyplanned liquefied natural gas (LNG) big projects to supply Asian markets occur, led by BC,Canada’s export of natural gas will likely be maintained at current levels. Investments to buildLNG infrastructure will create jobs and the process of liquefaction will increase the value-addof this resource.
Coal
Gasification is considered to be a cleaner process for upgrading coal, one of the largest energyresources in Canada, and for biomass. Investments in technology development and theimplementation of advanced gasification technologies for coal and biomass feedstock arerecommended. If the coal industry develops new clean technology via the gasification processes,the new technology will be applied as current coal combustion plants reach the end of theirexpected life span. If this occurs, current production levels and associated jobs can be maintained.
Nuclear Energy
If nuclear energy is used to provide heat energy for the recovery of in-situ bitumen from the oil sands, one of the nine proposed big projects, this would significantly reduce the release of carbon dioxide. This could be accomplished with the application of small modular nuclearreactors, now under development.
Energy Source
CurrentProduction (M BPD foe)
PotentialProduction
Mid-century(M BPD foe) Comments on Change
Conventional Oil 1.58 1.58 Modest new discoveries likely tomaintain production level.
Oil Sands 2.08 4.16 Likely to double over next twodecades. Hard to predict longterm limit.
NaturalGas
ConventionalNatural Gas
1.03
2.22
Current markets shrinking, butproduction could be maintainedby developing new markets withLNG exports.
Coal BedMethane
0.12
Tight/Shale Gas 1.07
Coal 0.70 0.70 Gasification technology couldhelp retain markets and maintainproduction.
Nuclear Energy 0.19 1.90 Ample uranium resource for ten-fold or more increase.
Hydroelectric PowerGeneration
0.68 2.04 Could triple if major sourcesharnessed.
Solar, Wind, Tidal,Bioenergy
Solar 0.01
1.5
Not expected to be major playerin Canada in this half century.
Wind 0.04 Moderate increase expected,especially if economic storagetechnology develops.
Bioenergy 0.10 Agricultural and forestry residuescould enable a ten-fold increase.
Total 7.60 14.10
Table 3Future Scenario: Implementationof the Nine CAE “Big Projects” by 2050
Another major nuclear application is the concept of large nuclear generating sites (oftentermed “nuclear farms”) supplying electricity to a national high voltage grid. This would enable the export of low-GHG power to the United States and also could feed both electricityand process steam to adjacent industrial parks comprising energy-intensive industries. Thispotential contribution to a national grid is described in Chapter 6, and that of nucleargenerating sites producing both electricity and steam is described in Chapter 9.
For illustration purposes, a ten -fold increase in nuclear energy generation from Canada’scurrent relatively low level production would represent the energy equivalent of 1.9 M BPDfoe. This would certainly be a stretch goal but would represent the energy content only slightlyabove the current production of conventional oil.
Hydroelectric Power Generation
A three-fold increase in hydroelectric power generation would represent the energy equivalentof 2.04 M BPD foe. In addition to job creation and investment from new hydroelectric powerplants, Canada could regain its global expert status in the hydroelectric sector.
Solar, Wind, Tidal and Bioenergy
Bioenergy, still in its infancy, currently produces 0.10 M BPD foe, dwarfing the total from both solar and wind. Biomass resources from Canada’s agricultural and forestry sectors could enable a ten-fold increase in Canada’s renewable energy production to an energy levelequivalent to 1.5 M BPD foe. This would also be a stretch goal, with the energy contentequivalent to the current production of conventional oil. Bioenergy would also likely beproduced in combination with bio-chemicals and other bio-products. This project could lead to the development of an entirely new industry.
Scenario Summary
The changes in total energy production and the increases in the relative contributions ofrenewable and non-GHG-emitting energy sources are illustrated in the lower chart of Figure 1.
If all nine big projects are implemented, total energy production would increase by 85%, andthe amount of carbon containing sources in our energy mix would decrease from 86% to 61%.All of the proposed additional energy production would be produced at a significantly highervalue-added level compared to current production. Additionally, these big projects will createjobs and wealth for Canadians, and position Canada as a sustainable energy powerhouse.
An Alternative Scenario – None of the Nine Big Projects are Implemented
F ailure to implement the proposed nine big projects will have significant negativeimpacts on the current status of Canada as a major energy producer, not to mentionits internal social and economic conditions.
19
20
• If the oil sands “big project” is not undertaken, the majority of the increase in oil sandsproduction will be upgraded in United States refineries, and the expected $68 billion dollarper year value-added will be captured by those refineries.
• If the currently planned liquefied natural gas (LNG) big projects to supply Asian markets do not occur, Canada’s export of natural gas to the United States will likely decrease by 50%,driven by the recent dramatic increases in the US natural gas resources.
• If the coal industry does not develop new clean technology via gasification processes, the use of coal as a power source will continue to diminish as existing power plants reach the endof their lives. In the absence of the development of appropriate coal gasification technology, a 50% decrease in coal production over the next forty years is likely, primarily due to theclosure of coal-fired power plants.
• If nuclear heat energy is not applied to the recovery of bitumen from the deeply buried oilsands, the release of carbon dioxide will continue to grow, reflecting the increased bitumenproduction. If no new nuclear electricity generation capacity is developed, none of theexpected benefits arising from the production of additional non-GHG-emitting energy, and the expansion of the nuclear industry will materialize.
• If a national power grid is not established, Canada will not capture the opportunity of being a major exporter of low-GHG electrical power to the continent.
• If no new hydroelectric power generation capacity is developed, none of the expectedbenefits arising from the production of additional non-GHG-emitting energy, and theexpansion of the hydroelectric power industry, will materialize.
• If Canada’s bioenergy potential remains undeveloped, none of the expected benefits arisingfrom access to additional GHG-neutral energy, and the emergence of new bio-energy andbio-chemical industries will materialize.
In summary, if none of the big projects are undertaken during the next forty years, Canada will miss the opportunity of being the global energy powerhouse that it presently promises tobecome. This threat is real, since the US and other countries are exploring both conventionaland unconventional energy resources at an unprecedented pace. The negative impacts of notimplementing these big projects on GDP and jobs/wealth creation will be substantial, a loss of yearly economic activity on the order of $100 billion dollars, while the impact of doingnothing will not substantially improve the proportion of non-GHG-emitting energy!
The Pathway Forward
E ach of the nine big projects described here will contribute in its own way to transitionCanada to a sustainable energy powerhouse. The private sector alone is not able toeffectively implement these nine nation-building projects. Government must provide
a nurturing environment, through vision, leadership, incentives, supportive regulations, andpublic education programs. Most of the projects will require public-private partnerships,undertaken by the private sector with appropriate risk-sharing incentives. In the past, Canadahas proven that it can implement such nation-building projects. With the appropriategovernment leadership, Canada’s energy sector is prepared to seize the opportunities totransform Canada into a world-leading sustainable energy powerhouse.
Biography
21
Richard J. Marceau, PEng, FCAE, Vice President (Research), Memorial University: Dr. Richard J.
Marceau is the Vice-President (Research) at Memorial University and President of the Canadian
Academy of Engineering (2012-2014). He has served as Provost and Vice-President Academic at
the University of Ontario Institute of Technology (2005-2013), Dean of the Faculty of Engineering
at the Université de Sherbrooke (2001-2004), and Chair of Electrical and Computer Engineering at
École Polytechnique de Montréal (2008-2001). Prior to his academic career, he practiced
engineering for twelve years, first at MONENCO, then at Hydro-Québec. An active member of his
community, he has been invited to participate on numerous committees and board, including as
President of the Parkwood Foundation (2009-2013), a National Historic Site and former home of
the founder of General Motors of Canada, R.S. McLaughlin. He is a registered Professional
Engineer in the Provinces of Newfoundland and Labrador, Ontario and Québec.
C. W. (Clem) Bowman: Dr. C. W. (Clem) Bowman has worked in the energy industry for the past
50 years, in various research, management and executive capacities, including vice-president Esso
Petroleum Canada, founding chairman Alberta Oil Sands Technology and Research Authority
(AOSTRA), president of the Alberta Research Council, and Presidents of the Canadian Society for
Chemical Engineering and Chemical Institute of Canada. Bowman’s career contribution to energy
technology development led to the 2008 Global Energy International Prize, awarded by Russian
President Dmitry Medvedev. In 2010, the University of Western Ontario established the Bowman
Centre at their Sarnia-Lambton campus to expand energy technology development. Included in a
list of award and recognition was induction into the Canadian Petroleum Hall of Fame in 2013 and
granting of an honorary degree by the University of Ontario Institute of Technology in 2013.

22
23
ABSTRACT
For some, there is nothing wrong with Canada becoming increasingly
dependent on the extraction and export of raw resources. Merely
extracting the resource, in this world view, is all the “value-added” that
is needed. This approach implies that unexploited natural resources are
value-less and hence “wasted,” and that it is, in fact, preferable to focus
on extraction and allow other nations to do the work of innovation,
engineering, design, and manufacturing required to convert our raw
resources into value-added products and services. Fortunately, most
Canadians appreciate the risks – economic, environmental, geopolitical
– of our country becoming a mere source of raw materials for other,
more developed economies, who then process those resources and sell
us back the (more expensive) finished products. They want something
bigger for our country: an economy based on talent, innovation,
ingenuity, and productivity. With active attention paid to ensuring that
resource industries contribute, rather than detract, from the prospects
of other value-added sectors, Canada’s resource wealth could become
a stepping stone toward a more diversified, prosperous, and sustainable
economic future.
In this chapter, we begin by reviewing several empirical indications of
Canada’s growing and dangerous reliance on raw resource extraction
and export, and our resulting national specialization at the very bottom
rungs of the value-added ladder. Next, we consider some broader risks
and consequences of this growing resource-dependence, including
stagnant productivity and innovation, future economic instability, and
environmental degradation. Following this, we consider in detail the
economic evidence regarding the negative spillover effects of the
petroleum boom (experienced largely through an over-valued exchange
rate) onto non-resource export industries. Finally, we conclude with
some preliminary proposals for enhancing the value-added linkages
and spin-offs associated with Canada’s petroleum industry.
Adding Value to Canada’s Petroleum Wealth:A National Economic and Environmental Priority Jim Stanford
2
Introduction: Canada’s Structural U-Turn
T he dramatic expansion of petroleum extraction since the turn of the 21st Centuryhas sparked a fundamental structural transformation of Canada’s economy.Booming investment and employment in new petroleum projects in northern
Alberta has been the most important driver of this growth. There are many economic andfiscal benefits generated by the petroleum boom including new jobs, incomes, exports, and tax revenues. But there are many challenges and problems associated with the unbridledexpansion of this sector too. It is important for policy-makers to examine both sides of theledger, and to develop and implement policies which maximize the benefits for Canadians(and minimize the costs) of our important non-renewable resources. In particular, proactiveefforts to increase Canadian value-added content throughout the value chain of our economy,even as our production of resources grows, would enhance the net benefits to Canadians fromresource extraction. Measures to this end could include boosting Canadian content in inputsto petroleum and other resource sectors; increasing Canadian processing and manufacturingof our resource commodities after they are extracted; and being careful to support and protectother value-added export industries (with no direct connection to resources) from beingdamaged by the macroeconomic side-effects of the resource boom.
Of course, as a resource-rich and relatively sparsely populated country, Canada has alwaysdepended on resource industries as the first step in economic development. Successive wavesof resource development, oriented toward export markets, motivated corresponding waves ofsettlement, transportation development, and government. Fish, furs, timber, wheat, minerals,and now petroleum were the industries (called “staples” by economic historians) that led theway through these successive chapters of our national economic history.
The leading role of resource industries in the economic development of Canada is a historicalfact. But Canadians have been traditionally concerned, and rightly so, with the potentialdownside of unthinking resource-dependence. Historians and economists (including
24
pioneering thinkers like W.A. Mackintosh, Harold Innis, and Mel Watkins) described howeach successive wave of staples-led development shaped the resulting pattern of economic,political and social development – and not always for the better. It was possible for Canada to become caught in a “staples trap,” in which the dominance of a particular form of resourceextraction and export inadvertently undermined our ability to develop and diversify afull-fledged modern economy.1
To counteract this risk, economic policy-makers since Confederation were preoccupied with measures to supplement resource industries by nurturing a more diverse “value-added”economy. Instead of simply extracting and exporting raw resources as fast as possible, and then using the resulting export revenues to pay for necessary imports (of manufactures andother value-added products), Canada should develop more value-added industries of our own.This would contribute to greater prosperity, productivity, and stability. It would also expandthe range of vocations available to Canadians. Examples of policies aimed at expanding thevalue-added diversity of Canada’s economy included the early National Policy of tariffs tosupport domestic industry, the Canada-U.S. Auto Pact of 1965, various sector-focusedstrategies to develop key industries (like aerospace and telecommunications equipment), and limits placed on incoming foreign investment (especially in resource industries).
For some decades after World War II, those strategies seemed to be paying off. The share ofCanada’s merchandise exports which consisted of unprocessed or barely processed resourcesdeclined, eventually outweighed by valuable exports of automotive products, aerospaceproducts, and other technology-intensive, high-value exports. By the 1990s it was no longeraccurate to describe Canada as “hewers of wood and drawers of water.” Foreign ownership as a share of Canadian GDP also declined (reaching a historic low in the mid-1980s).
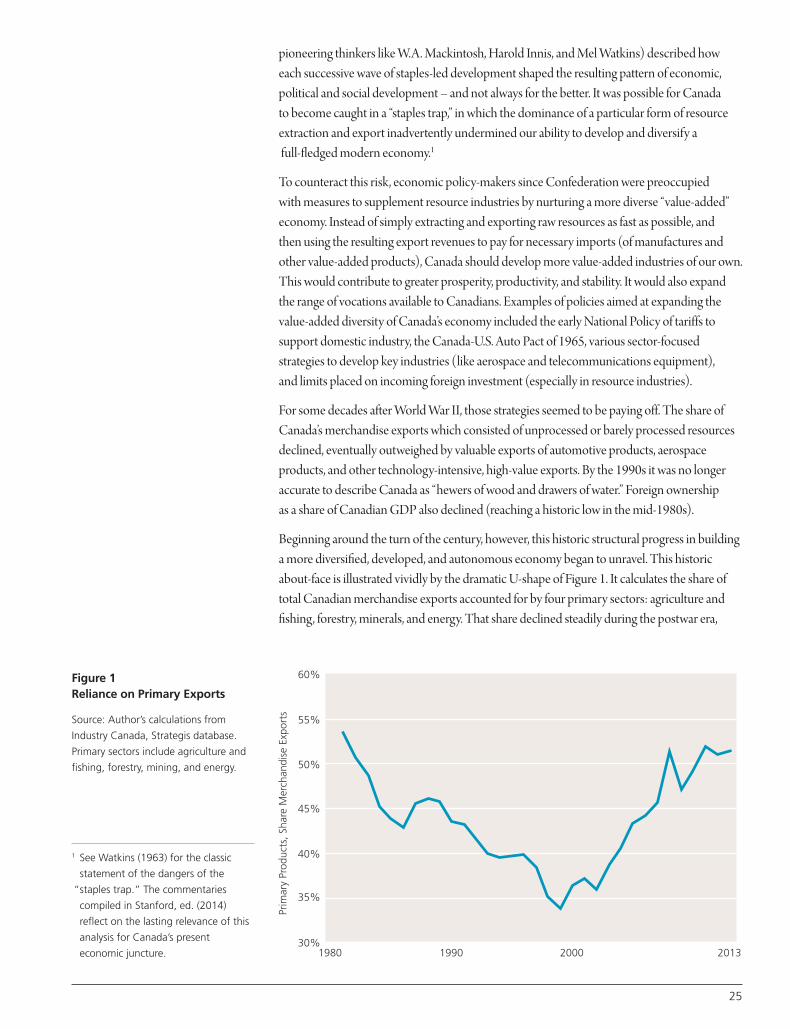
Beginning around the turn of the century, however, this historic structural progress in buildinga more diversified, developed, and autonomous economy began to unravel. This historicabout-face is illustrated vividly by the dramatic U-shape of Figure 1. It calculates the share oftotal Canadian merchandise exports accounted for by four primary sectors: agriculture andfishing, forestry, minerals, and energy. That share declined steadily during the postwar era,
1980
60%
55%
50%
45%
Prim
ary
Prod
ucts
, Sha
re M
erch
andi
se E
xpor
ts
40%
35%
30%1990 2000 2013
Figure 1Reliance on Primary Exports
Source: Author’s calculations from
Industry Canada, Strategis database.
Primary sectors include agriculture and
fishing, forestry, mining, and energy.
1 See Watkins (1963) for the classic
statement of the dangers of the
“staples trap.” The commentaries
compiled in Stanford, ed. (2014)
reflect on the lasting relevance of this
analysis for Canada’s present
economic juncture.
25
26
and by the end of the twentieth century (famously defined as “Canada’s Century” by Sir Wilfred Laurier) barely one-third of Canada’s total exports originated in these basicresource-dependent sectors. That year Canada ranked as the fourth largest assembler of motorvehicles in the world – an astounding achievement for a country of our size. We punched aboveour weight in several other high-value, technology-intensive sectors as well. Business innovation(measured, for example, by business R&D spending as a share of GDP) reached its highest levelever. It seemed that Canadians were poised to escape our resource-dominated history.
But after 2000, all that progress was reversed, and dramatically. World commodity pricessurged, whetting the appetites of investors for Canada’s resource riches – especially for ourpetroleum. At the same time the prospects for Canada’s value-added industries dimmed, forvarious reasons. The 9-11 terrorist attacks produced a short-lived recession in the U.S., and amore lasting change in national consciousness there (including a thickening of the Canada-U.S.border, and a renewed “America-first” attitude on the part of political leaders). Companieswhich had led the way in Canada’s value-added transformation (from North American-basedautomakers to Northern Telecom) faltered. The take-off of the Canadian currency (whichappreciated by 65 percent in five years, beginning in 2002) made Canadian-made productsand services fantastically expensive in the eyes of the rest of the world. Foreign capital surgedback into Canada; an unprecedented frenzy of takeovers of iconic Canadian firms (Stelco, Inco, Falconbridge, Alcan, Algoma, IPSCO, and more) added a stunning $112 billion to thestockpile of foreign direct investment here in just two years (2006 and 2007). But once thecommodity price cycle turned down (as it inevitably does), most of those takeovers went sour.
Today those four primary sectors (agriculture, forestry, minerals, and energy) once againaccount for a clear majority of total merchandise exports, and the qualitative regression in thecomposition of our exports is continuing. In essence, Canada has “undeveloped.” Much like a Third World country (although, to be sure, with more income, more democracy, and moreproductivity), Canada is once again primarily reliant on extracting resource wealth from theground beneath our feet. We export that wealth to others who transform it, manipulate it, and add value to it – importing it back in the forms of advanced products and services.
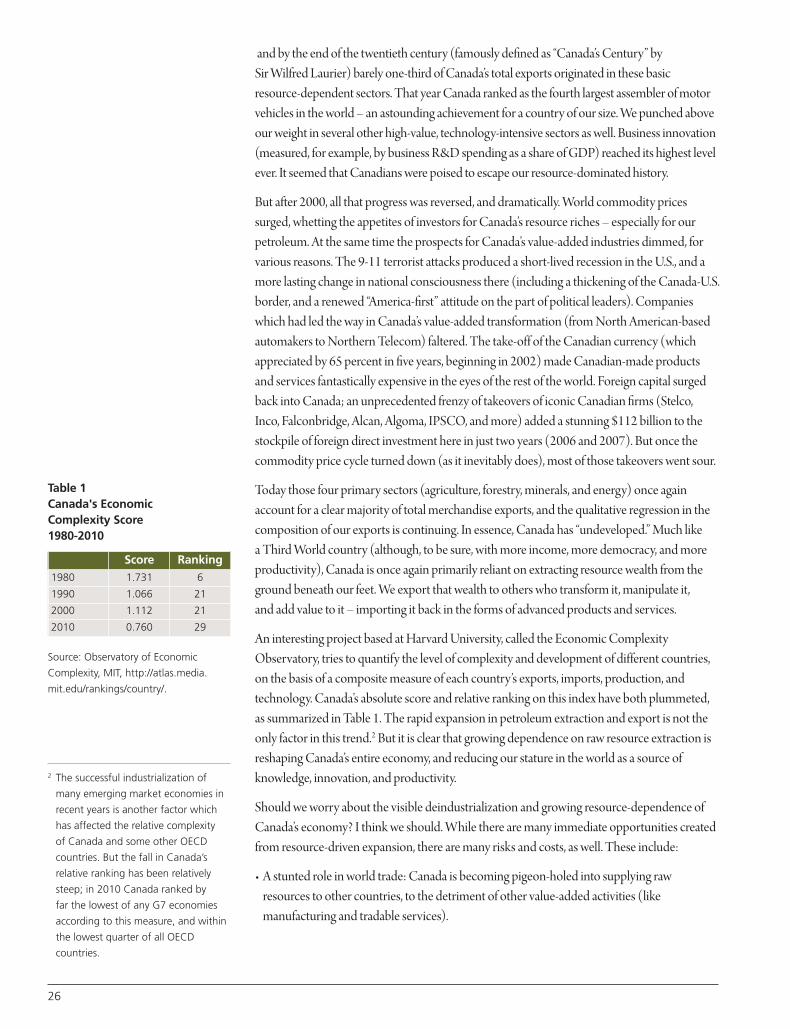
An interesting project based at Harvard University, called the Economic ComplexityObservatory, tries to quantify the level of complexity and development of different countries,on the basis of a composite measure of each country’s exports, imports, production, andtechnology. Canada’s absolute score and relative ranking on this index have both plummeted,as summarized in Table 1. The rapid expansion in petroleum extraction and export is not theonly factor in this trend.2 But it is clear that growing dependence on raw resource extraction isreshaping Canada’s entire economy, and reducing our stature in the world as a source ofknowledge, innovation, and productivity.
Should we worry about the visible deindustrialization and growing resource-dependence ofCanada’s economy? I think we should. While there are many immediate opportunities createdfrom resource-driven expansion, there are many risks and costs, as well. These include:
• A stunted role in world trade: Canada is becoming pigeon-holed into supplying rawresources to other countries, to the detriment of other value-added activities (likemanufacturing and tradable services).
Table 1Canada's EconomicComplexity Score1980-2010
Source: Observatory of Economic
Complexity, MIT, http://atlas.media.
mit.edu/rankings/country/.
Score Ranking1980 1.731 6
1990 1.066 21
2000 1.112 21
2010 0.760 29
2 The successful industrialization of
many emerging market economies in
recent years is another factor which
has affected the relative complexity
of Canada and some other OECD
countries. But the fall in Canada’s
relative ranking has been relatively
steep; in 2010 Canada ranked by
far the lowest of any G7 economies
according to this measure, and within
the lowest quarter of all OECD
countries.
• Perpetual economic uncertainty, with regions and even the entire national economy heldhostage to the inevitable ups and downs of resource prices and profits.
• Poor innovation and productivity performance associated with the growing concentrationof economic activity in resource extraction, and the corresponding decline of manufacturing.
• Massive costs, usually subsidized by government, of economic infrastructure required forresource extraction and export (including railways, ports, and pipelines). This expensiveinfrastructure becomes a sunk cost which in turn compels even faster extraction and exportof resources to amortize their heavy costs.
• An unbalanced political culture, in which super-profitable resource companies are able toexert disproportionate influence over economic and social policy.
• Growing influence for foreign companies, which have invested huge amounts of capital inresource extraction and export and which wield tremendous influence as a result.
• The environmental consequences (both local and global) of irresponsible management ofnon-renewable resources. Chief among these concerns today, of course, is the threat of globalclimate change. Canada’s petroleum boom holds major consequences for our national role inaddressing this top-priority issue.
In light of these risks and drawbacks, it would be prudent for Canadians to consider whetherwe are managing the exploitation of our resource wealth in the best way possible. Yes, resourceindustries are important. They have always been crucial sources of jobs and incomes forCanadians, and they will always play a central role in Canada’s economy. After all, all economicactivity begins with the necessary raw materials and inputs we harvest from nature. But weneed to perform that work in a more deliberate, strategic, responsible, and sustainable manner.Instead of confining our national economic destiny to simple extraction, we need to emphasizeand develop our capacity to add value to our own resources. We need to see resourceextraction – sustainable and responsible – as just the first step in the value-added chain, ratherthan as the all-consuming goal in its own right.
We can leverage more Canadian jobs both “upstream” (through more Canadian-sourcedinputs to resource projects) and “downstream” (through more Canadian refining, processing,and manufacturing of our produced resources). But this will only happen on the strength ofdeliberate strategies to link petroleum production to value-added activity. We need a nationalenergy strategy to redirect energy production to meeting the needs of Canadians, and leveragethose upstream and downstream value-added opportunities – instead of focusing on theextraction and export of raw energy. At the same time, we also need proactive efforts tomanage the economic, fiscal, and environmental side-effects of the resource boom, and tosupport other Canadian industries capable of producing value-added goods and services forthe world market. Those are the major planks of a strategy to reverse the visible regression inour economic structure since the onset of the petroleum boom.
The remainder of this chapter is organized in the following sections. First, we review severalempirical indications of Canada’s growing and dangerous reliance on raw resource extractionand export, and our resulting national specialization in primary products. Second, we considersome broader risks and consequences of this growing resource-dependence: includingstagnant productivity and innovation, future economic instability, and environmental
27
degradation. Third, we consider in detail economic evidence regarding the negative spillovereffects of the petroleum boom (experienced largely through an over-valued exchange rate)onto non-resource export industries. This phenomenon is commonly called “Dutch disease,”but I will argue for a different terminology. Finally, the article concludes with some preliminaryproposals for enhancing the value-added linkages and spin-offs associated with Canada’spetroleum industry.
Describing Canada’s Lopsided Trajectory
C anada’s worrisome reliance on extraction and exports of unprocessed resources(and especially petroleum) is visible in a wide range of statistical indicators.Together they paint a clear picture of a national economy that fundamentally shifted
direction, both quantitatively and qualitatively, beginning shortly after the turn of the century.
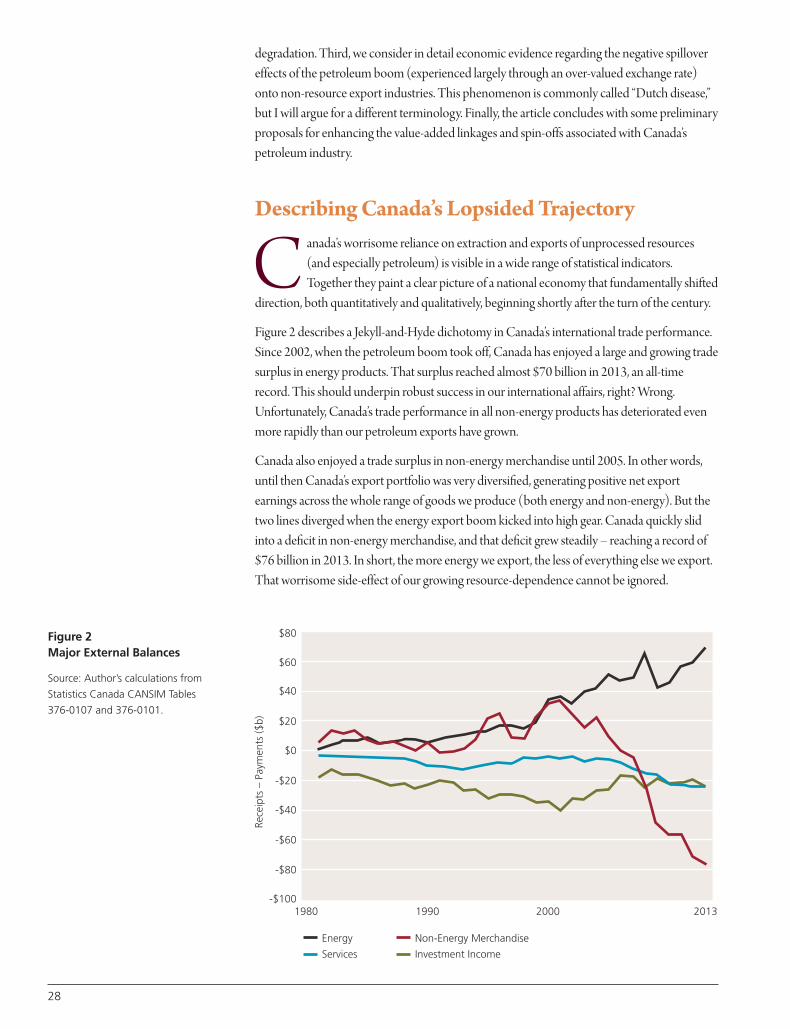
Figure 2 describes a Jekyll-and-Hyde dichotomy in Canada’s international trade performance.Since 2002, when the petroleum boom took off, Canada has enjoyed a large and growing tradesurplus in energy products. That surplus reached almost $70 billion in 2013, an all-timerecord. This should underpin robust success in our international affairs, right? Wrong.Unfortunately, Canada’s trade performance in all non-energy products has deteriorated evenmore rapidly than our petroleum exports have grown.
Canada also enjoyed a trade surplus in non-energy merchandise until 2005. In other words,until then Canada’s export portfolio was very diversified, generating positive net exportearnings across the whole range of goods we produce (both energy and non-energy). But thetwo lines diverged when the energy export boom kicked into high gear. Canada quickly slidinto a deficit in non-energy merchandise, and that deficit grew steadily – reaching a record of$76 billion in 2013. In short, the more energy we export, the less of everything else we export.That worrisome side-effect of our growing resource-dependence cannot be ignored.
1980
Energy
Services
$80
$60
$40
$20
$0
-$20
-$40
-$60
-$80
-$100
Rece
ipts
– P
aym
ents
($b)
1990 2000 2013
Non-Energy Merchandise
Investment Income
Figure 2Major External Balances
Source: Author’s calculations from
Statistics Canada CANSIM Tables
376-0107 and 376-0101.
28
The other components of our international balance of payments remain firmly in the red aswell. Our trade deficit in services reached $25 billion in 2013. It is not unusual for Canada tohave a trade deficit in services, but it was traditionally quite small. Since 2002, however, ourtrade performance in services (which are often heralded as the “next frontier” of globalization)has deteriorated dramatically. This is partly due to the dramatic increase in the Canadian dollar,which makes Canadian-made services seem very expensive to foreign customers. Netoutflows of investment income (resulting in part from the growth of foreign investment inCanada) produce another chronic drain on the national balance of payments. Put it alltogether, and Canada has been experiencing a large and now-chronic deficit on its balance ofpayments that has totalled around $60 billion in recent years. Whereas we once were able tosuccessfully export both resources and value-added products to the rest of the world, ourcapacities have become increasingly concentrated in resources (especially energy). Even ourhuge trade surplus in energy products is not enough to offset growing deficits in non-energymerchandise, services, and investment income. We are learning the hard way that we needmore than oil to pay our way in world trade.
Even within the broad category of energy exports, Canada’s trade has become deindustrializedas we move further and further toward the low-value end of the economic continuum. Mostpetroleum-producing jurisdictions, in an effort to capture more of the value-added potential of their non-renewable resources, invest heavily in developing upgrading, refining, andpetrochemical capacities. Typically, strong policy interventions are used to expand this value-added activity: for example, through requirements for domestic processing, limits on exportsof unrefined resources, the use of fiscal subsidies to encourage downstream investments, andeven the direct allocation of public equity capital to refining and petrochemical projects. Evenin Canada this has been a traditional priority – for example, as with Alberta’s effort to nurturea domestic petrochemical industry in the 1970s. In recent years, however, the importance ofadding downstream value to our petroleum production has largely faded from the radarscreens of policy-makers. Petroleum companies are now given free rein to export the energythey produce in any form. Indeed, the integrated global producers that account for a largeshare of Canadian petroleum output naturally prefer to refine their feedstock in their ownrefineries (often located in the U.S.). In this way, corporate decisions regarding what is cheapestor most profitable can easily diverge from broader cost-benefit calculations about whatproduces most value for Canada.
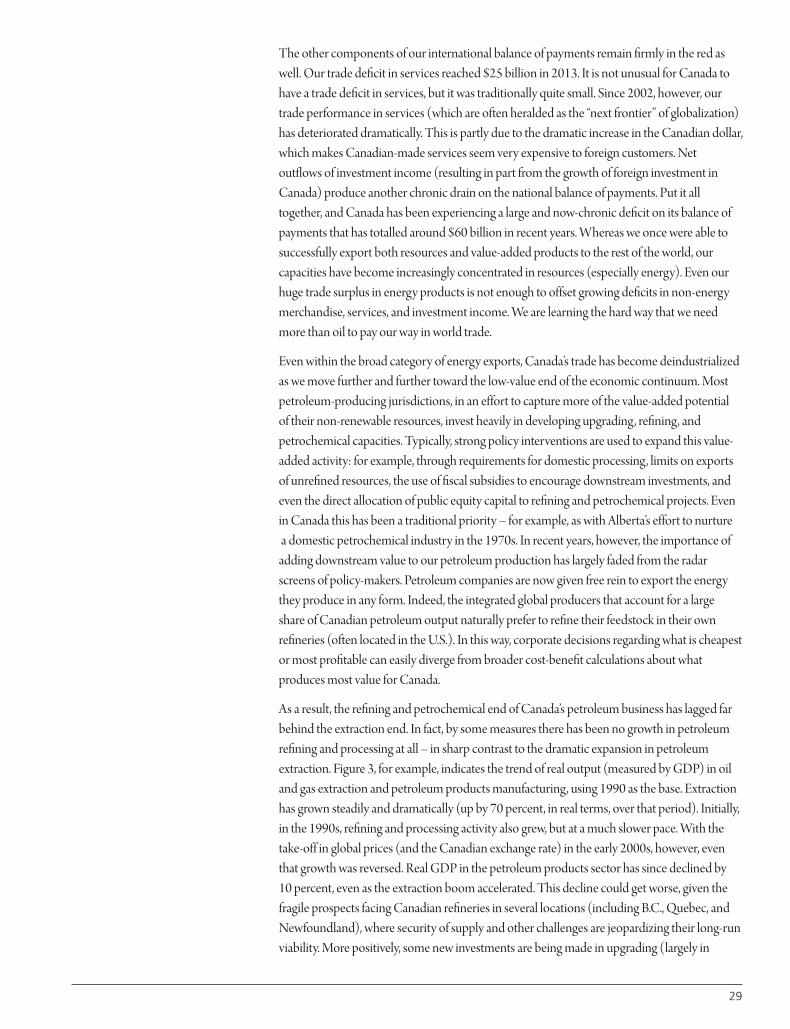
As a result, the refining and petrochemical end of Canada’s petroleum business has lagged farbehind the extraction end. In fact, by some measures there has been no growth in petroleumrefining and processing at all – in sharp contrast to the dramatic expansion in petroleumextraction. Figure 3, for example, indicates the trend of real output (measured by GDP) in oiland gas extraction and petroleum products manufacturing, using 1990 as the base. Extractionhas grown steadily and dramatically (up by 70 percent, in real terms, over that period). Initially,in the 1990s, refining and processing activity also grew, but at a much slower pace. With thetake-off in global prices (and the Canadian exchange rate) in the early 2000s, however, eventhat growth was reversed. Real GDP in the petroleum products sector has since declined by10 percent, even as the extraction boom accelerated. This decline could get worse, given thefragile prospects facing Canadian refineries in several locations (including B.C., Quebec, andNewfoundland), where security of supply and other challenges are jeopardizing their long-runviability. More positively, some new investments are being made in upgrading (largely in
29
30
Western Canada), but not enough to reverse the overall trend. Therefore, the stagnation, at best, of Canada’s petroleum products sector continues, even as our production of rawpetroleum has exploded. This is a damning indicator of the failure of our energy policy tocapture the value-added opportunities arising from our own non-renewable resources.
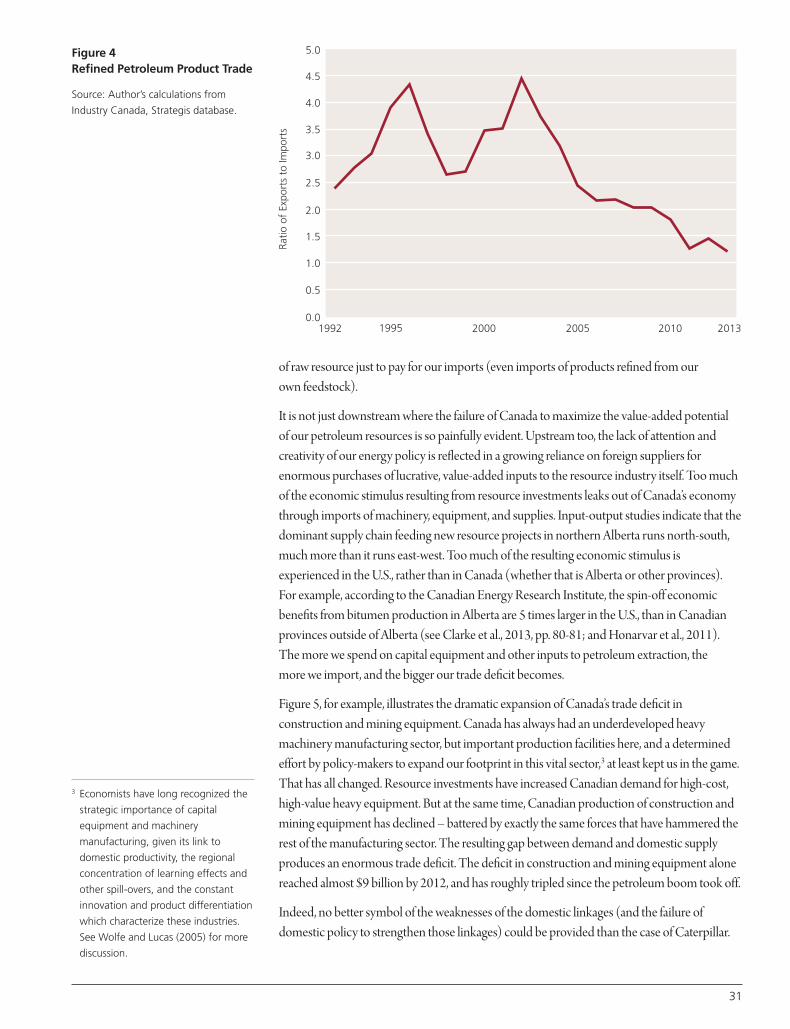
The lack of attention provided to downstream activity in the context of the overall boom isalso readily visible in our flagging international trade performance in that end of the business.One would think that, as a leading global petroleum producer, Canada would naturally also be successful in international petroleum products trade. But Canada’s status in this regard isincreasingly in question. Changes in the regional patterns of energy supply and demand withinNorth America have resulted in Canada becoming a major importer of petroleum products(both from offshore and from the U.S.). Petroleum product imports have exploded five-fold(in nominal dollars) since 2004, mostly destined for consumers in eastern Canada. Canada’sexports of refined products, on the other hand, only doubled during the same time (drivensolely by higher prices, not increased real output).
The curious result is that Canada now barely exports as much refined petroleum products as it imports, as illustrated in Figure 4. The ratio of exports to imports in this important value-added sector has plunged from over 4-to-1 early in this century, to just 1.2-to-1 in 2013.Relatively minor additional shifts in supply patterns (or, worse yet, the possible closure of oneor more Canadian refineries) could easily tip this balance into the red. What an incredibleirony that Canada, a dominant source of global petroleum, could soon become a net importerof refined petroleum products. The jobs, incomes, and innovation potential associated withmanufacturing our own petroleum, are all given up to foreign suppliers. Meanwhile, as wecontinue to pump as much unrefined product into foreign markets as possible (for now, onlyto the U.S.), the earned price of those exports is suppressed by regional supply gluts and thelower quality of the product. The faster we export unrefined product, the lower its pricebecomes. By focusing so exclusively on extracting and exporting a base product, we digourselves into a bigger and bigger hole. We are left needing to exploit increasing volumes
Figure 3Extraction vs. Value-Added: GDP
Source: Author’s calculations from
Statistics Canada CANSIM Table
379-0004 and 379-0031.
1980
170
160
150
140
130
120
110
100
90
Real
GD
P In
dex
(199
0 =
100
)
1995 2000 2005 2010 2013
Oil & Gas Extraction
Refining & Processing
of raw resource just to pay for our imports (even imports of products refined from our own feedstock).
It is not just downstream where the failure of Canada to maximize the value-added potential of our petroleum resources is so painfully evident. Upstream too, the lack of attention andcreativity of our energy policy is reflected in a growing reliance on foreign suppliers forenormous purchases of lucrative, value-added inputs to the resource industry itself. Too muchof the economic stimulus resulting from resource investments leaks out of Canada’s economythrough imports of machinery, equipment, and supplies. Input-output studies indicate that thedominant supply chain feeding new resource projects in northern Alberta runs north-south,much more than it runs east-west. Too much of the resulting economic stimulus isexperienced in the U.S., rather than in Canada (whether that is Alberta or other provinces). For example, according to the Canadian Energy Research Institute, the spin-off economicbenefits from bitumen production in Alberta are 5 times larger in the U.S., than in Canadianprovinces outside of Alberta (see Clarke et al., 2013, pp. 80-81; and Honarvar et al., 2011).The more we spend on capital equipment and other inputs to petroleum extraction, the more we import, and the bigger our trade deficit becomes.
Figure 5, for example, illustrates the dramatic expansion of Canada’s trade deficit inconstruction and mining equipment. Canada has always had an underdeveloped heavymachinery manufacturing sector, but important production facilities here, and a determinedeffort by policy-makers to expand our footprint in this vital sector,3 at least kept us in the game.That has all changed. Resource investments have increased Canadian demand for high-cost,high-value heavy equipment. But at the same time, Canadian production of construction andmining equipment has declined – battered by exactly the same forces that have hammered therest of the manufacturing sector. The resulting gap between demand and domestic supplyproduces an enormous trade deficit. The deficit in construction and mining equipment alonereached almost $9 billion by 2012, and has roughly tripled since the petroleum boom took off.
Indeed, no better symbol of the weaknesses of the domestic linkages (and the failure ofdomestic policy to strengthen those linkages) could be provided than the case of Caterpillar.
1992
5.0
4.5
4.0
3.5
3.0
2.5
2.0
1.5
1.0
0.5
0.0
Ratio
of
Expo
rts
to Im
port
s
1995 2000 2005 2010 2013
Figure 4Refined Petroleum Product Trade
Source: Author’s calculations from
Industry Canada, Strategis database.
31
3 Economists have long recognized the
strategic importance of capital
equipment and machinery
manufacturing, given its link to
domestic productivity, the regional
concentration of learning effects and
other spill-overs, and the constant
innovation and product differentiation
which characterize these industries.
See Wolfe and Lucas (2005) for more
discussion.
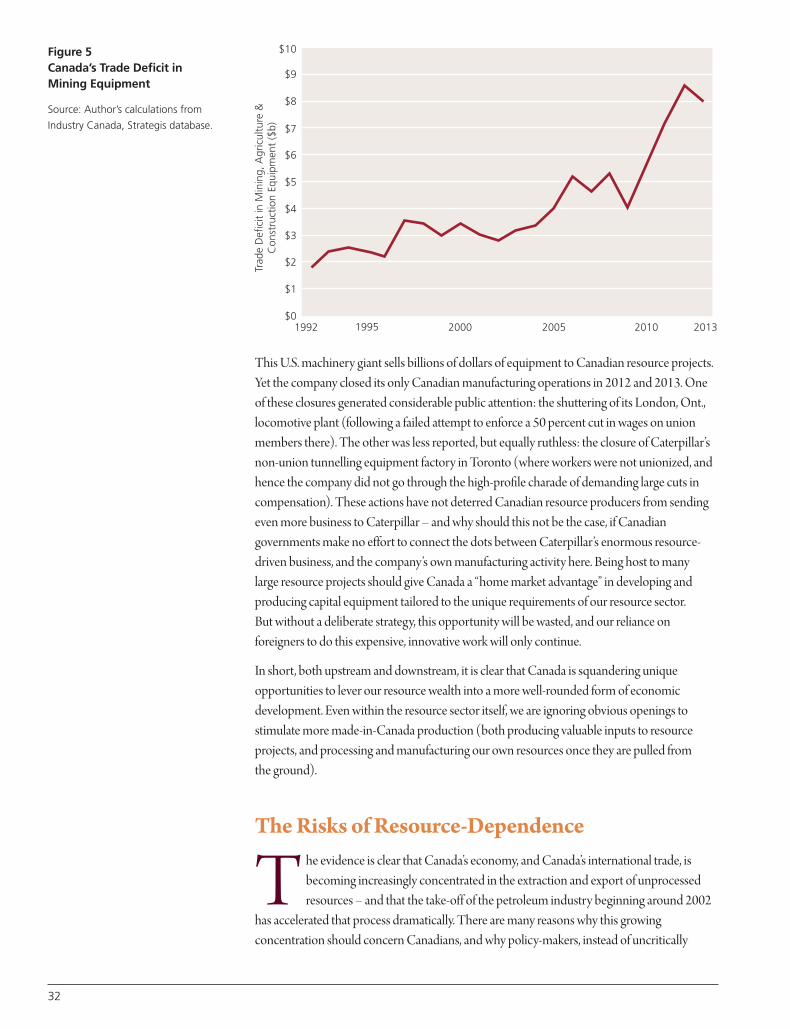
32
This U.S. machinery giant sells billions of dollars of equipment to Canadian resource projects.Yet the company closed its only Canadian manufacturing operations in 2012 and 2013. Oneof these closures generated considerable public attention: the shuttering of its London, Ont.,locomotive plant (following a failed attempt to enforce a 50 percent cut in wages on unionmembers there). The other was less reported, but equally ruthless: the closure of Caterpillar’snon-union tunnelling equipment factory in Toronto (where workers were not unionized, andhence the company did not go through the high-profile charade of demanding large cuts incompensation). These actions have not deterred Canadian resource producers from sendingeven more business to Caterpillar – and why should this not be the case, if Canadiangovernments make no effort to connect the dots between Caterpillar’s enormous resource-driven business, and the company’s own manufacturing activity here. Being host to many large resource projects should give Canada a “home market advantage” in developing andproducing capital equipment tailored to the unique requirements of our resource sector. But without a deliberate strategy, this opportunity will be wasted, and our reliance onforeigners to do this expensive, innovative work will only continue.
In short, both upstream and downstream, it is clear that Canada is squandering uniqueopportunities to lever our resource wealth into a more well-rounded form of economicdevelopment. Even within the resource sector itself, we are ignoring obvious openings tostimulate more made-in-Canada production (both producing valuable inputs to resourceprojects, and processing and manufacturing our own resources once they are pulled from the ground).
The Risks of Resource-Dependence
T he evidence is clear that Canada’s economy, and Canada’s international trade, isbecoming increasingly concentrated in the extraction and export of unprocessedresources – and that the take-off of the petroleum industry beginning around 2002
has accelerated that process dramatically. There are many reasons why this growingconcentration should concern Canadians, and why policy-makers, instead of uncritically
1992
$10
$9
$8
$7
$6
$5
$4
$3
$2
$1
$0
Trad
e D
efic
it in
Min
ing,
Agr
icul
ture
&C
onst
ruct
ion
Equi
pmen
t ($
b)
1995 2000 2005 2010 2013
Figure 5Canada’s Trade Deficit in Mining Equipment
Source: Author’s calculations from
Industry Canada, Strategis database.
celebrating this boom for its immediate economic benefits, should consider ways to manageand plan the expansion, and support as much Canadian value-added as possible.
For example, Canada’s national business innovation performance has long been a source of national and international concern.4 And Canada is getting worse in this regard, not better.Business investment in research development has declined by one-third as a share of GDPsince the turn of the century – even as the petroleum boom was gathering momentum. The private sector invested just 0.8 percent of GDP in R&D in 2013 (down from 1.3 percentin 2001). That’s the lowest R&D intensity since Statistics Canada began collecting these data.Canada now badly underperforms other industrial countries (and even some emergingmarket economies) in R&D spending, and the decline in R&D spending (relative to GDP)has been bigger in Canada over the last decade than in any other OECD economy. In otherwords, our innovation effort and performance has been deteriorating, even as the importanceof innovative capacity to long-run productivity and competitiveness is increasingly recognized.
The petroleum-driven structural change in the Canadian economy has been an importantpart of the deterioration of overall innovation performance during the last decade. Petroleumcompanies and other resource-extraction businesses do conduct R&D, but significantly less as a share of the industry’s GDP than the rest of the economy. Hence, the expanded relativeimportance of extraction activities will automatically be associated with a decline in overallinnovation effort. The related contraction of the manufacturing sector (discussed furtherbelow) has a similar effect, since manufacturing is the strongest source of R&D spending. The manufacturing sector in Canada typically invests around 4 percent of GDP in R&Dactivity, versus only 0.6 percent for the petroleum and mining industries, so a reorientation of Canadian economic activity from manufacturing toward resource extraction will inevitablyproduce poorer R&D outcomes. That lack of innovation, in turn, then reinforces oureconomic reliance on the straight extraction of raw resources (since the less we invest ininnovation, the less competitive we are in international trade in value-added products).
The impact of the resource boom on national productivity performance is another drawbackof our growing dependence on the extraction and export of raw resources. Productivity inresource extraction tends to decline over time, as the most readily available reserves of desiredminerals are harvested first – requiring more capital and labour effort to exploit less lucrativedeposits.5 This effect can be offset to some extent by progress in extraction technologies. The tremendous effort (including expenditure of energy) required to extract bitumen is anextreme example of this fundamental “Ricardian” problem in resource industries. Since theturn of the century, Canada’s labour productivity has grown at the anemic rate of 0.6 percentper year: putting us 29th among the 34 countries of the OECD, with less than half the averagerate of productivity growth in the industrialized world. Resource extraction is certainlyprofitable (especially when global commodity prices are high), but its productivity declinesover time – and this poses significant long-term economic risks to any country which places a growing share of its economic eggs in this particular basket. So as the composition of theeconomy shifts in favour of resource industries, each of which experiences diminishing returns,overall composite productivity performance suffers accordingly.
The unplanned, “gold rush”-like approach to investment in new resource projects (especially innorthern Alberta) further undermines productivity. Mammoth, helter-skelter capital spending,with little attention paid to infrastructure, bottlenecks, and labour supply planning, regularly
33
4 See Council of Canadian Academies
(2013) for a useful overview of the
evidence and causes.
5 See Stanford (2011) for more
discussion of this relationship between
resource extraction and productivity.
34
produces huge cost overruns and other problems in those new projects, and negativeoutcomes in terms of realized productivity.
Research by Sharpe (2013) confirms the negative impact of growing resource dependence on national productivity. Average labour productivity in mineral and oil and gas extraction hasbeen declining since the turn of the century at the rapid pace of over 5 percent per year, givingthis sector the dubious distinction of making the largest negative contribution to Canada’soverall productivity performance. The growing share of national output accounted for by pure extraction activities thus has been an important factor in Canada’s miserable overallproductivity record.
Undue reliance on the export of unprocessed commodities also poses substantial risks to thenational economy, in the event of negative shifts in global demand, technology, or prices forthose particular products. Indeed, the past history of Canada’s staples-driven economicdevelopment features many examples of industries (and regions) wiped out by changes inglobal demand for the products concerned. In some cases the staples industry disappearedbecause of the exhaustion of supplies. But in other cases the decline reflected changes inforeign technology and tastes, which undermined demand for the staple export in ways overwhich Canada had no control – then necessitating a painful restructuring.6 To take a vividexample, Canada no longer exports beaver pelts, and not because we ran out of beavers. Rather,foreign demand for the product disappeared due to changes in taste and technology. Foreignappetite for our other staple exports, including petroleum, is equally unpredictable. For manyreasons (technological, environmental, and geopolitical) the strength of global demand forCanada’s petroleum output cannot be taken for granted. This risk is not eliminated by merelytrying to diversify the destinations of our exports of raw petroleum. Basic prudence wouldsuggest that we should diversify our economic portfolio to reduce the potential damage from future cycles in demand, prices, and activity.
Even business leaders in Canada express concern about the increasingly resource-dependentnature of Canada’s economic direction – even though many of those leaders are personallyemployed in resource-related companies. For example, in a recent survey of CEOs conductedby the Globe and Mail, nearly two-thirds agreed with the statement that Canada is too relianton commodities, and needs more diversification (Blackwell, 2014). One technology CEOexpressed his concern bluntly: “We have become more hewers of wood and drawers of water than we were. There is no doubt in my mind that we have created more risk in oureconomic environment.”
The consequences of the petroleum boom for Canada’s international environmentalcitizenship provide another reason to reconsider the current trajectory. Our resource policies(and, indeed, all economic policy) must now be evaluated in light of our overarching needto limit and reduce greenhouse gas pollution. The environmental problems associated withbitumen production are well-known, including both localized effects (tailings ponds, waterpollution, and land reclamation issues) and emissions of greenhouse gases (since bitumenproduction is itself very energy intensive, it releases more carbon dioxide in extraction andprocessing than conventional oil). Pressed by regulators and public opinion alike, thepetroleum industry has been working to reduce the emissions-intensity of production, butthose efforts are being swamped by the dramatic expansion in the sheer scale of production(which some forecasts expect to triple over the next two decades). According to the federal
6 Haley (2011) discusses the dimensions
of these risks, and highlights the
continuing relevance of this problem –
especially regarding environmental
factors which will inevitably affect the
demand for Canadian energy staples
in the future.
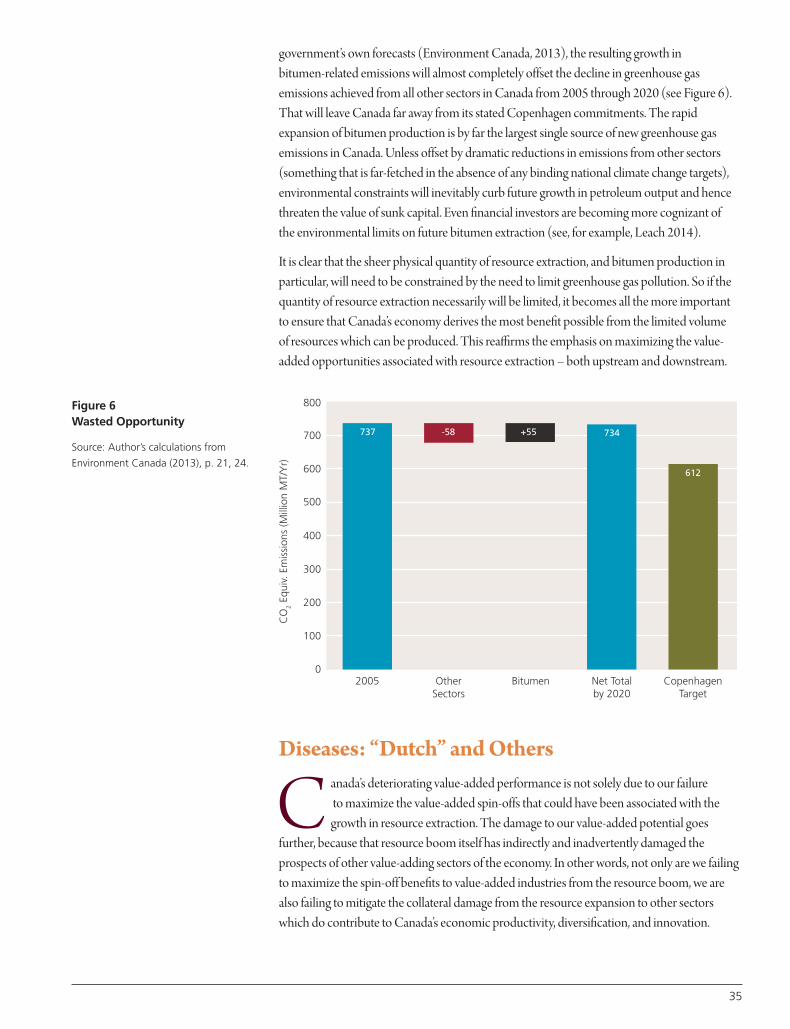
government’s own forecasts (Environment Canada, 2013), the resulting growth in bitumen-related emissions will almost completely offset the decline in greenhouse gasemissions achieved from all other sectors in Canada from 2005 through 2020 (see Figure 6).That will leave Canada far away from its stated Copenhagen commitments. The rapidexpansion of bitumen production is by far the largest single source of new greenhouse gasemissions in Canada. Unless offset by dramatic reductions in emissions from other sectors(something that is far-fetched in the absence of any binding national climate change targets),environmental constraints will inevitably curb future growth in petroleum output and hencethreaten the value of sunk capital. Even financial investors are becoming more cognizant of the environmental limits on future bitumen extraction (see, for example, Leach 2014).
It is clear that the sheer physical quantity of resource extraction, and bitumen production inparticular, will need to be constrained by the need to limit greenhouse gas pollution. So if thequantity of resource extraction necessarily will be limited, it becomes all the more importantto ensure that Canada’s economy derives the most benefit possible from the limited volume of resources which can be produced. This reaffirms the emphasis on maximizing the value-added opportunities associated with resource extraction – both upstream and downstream.
Diseases: “Dutch” and Others
C anada’s deteriorating value-added performance is not solely due to our failureto maximize the value-added spin-offs that could have been associated with thegrowth in resource extraction. The damage to our value-added potential goes
further, because that resource boom itself has indirectly and inadvertently damaged theprospects of other value-adding sectors of the economy. In other words, not only are we failingto maximize the spin-off benefits to value-added industries from the resource boom, we arealso failing to mitigate the collateral damage from the resource expansion to other sectorswhich do contribute to Canada’s economic productivity, diversification, and innovation.
35
2005
800
700
600
500
400
300
200
100
0
CO
2 Eq
uiv.
Em
issi
ons
(Mill
ion
MT/
Yr)
OtherSectors
Bitumen Net Totalby 2020
CopenhagenTarget
737 -58 +55 734
612
Figure 6Wasted Opportunity
Source: Author’s calculations from
Environment Canada (2013), p. 21, 24.
36
The most important channel for this negative collateral damage on other tradable industrieshas been through the exchange rate. For various reasons, the rapid expansion in petroleumproduction and export was associated with the dramatic appreciation of the Canadian dollar,also beginning in 2002. That badly undermined Canadian production and exports of non-resource tradable products – including manufacturing, of course, but other tradable industriesas well (such as tourism and tradable services).
This phenomenon is commonly called “Dutch disease” in popular discourse (so-named bythe Economist magazine in 1977 to describe the evolution of the Dutch economy followingthe discovery of North Sea gas there some years earlier). In my view, that term is moreconfusing than illuminating – all the more so in light of the heated debates that have occurredin Canada over this issue in recent years. Indeed, the Dutch and Canadian experiences withdeindustrialization were very different – not least because the downturn in Dutchmanufacturing exports that followed the North Sea discoveries was modest and temporary,compared to the more dramatic and long-lasting erosion of Canada’s manufacturing sector. I prefer a more descriptive phrase, “resource-led deindustrialization,” to refer to thephenomenon whereby value-added industries are crowded out by a resource boom. There are many potential channels for this effect,7 but the impact of resource extraction and exporton the exchange rate is clearly the most important.
The composite hypothesis of resource-led deindustrialization depends on two distinct sub-hypotheses. First, it needs to be shown that the expansion of natural resource exports (and petroleum in particular) pushes up the value of the exchange rate. Second, it needs to beshown that exchange rate appreciation in turn causes contraction in the scale of productionand export of non-resource-based tradable industries – including, but not limited to,manufacturing. Other tradable industries affected by exchange rate appreciation includeservices exports and tourism. Both of these propositions would seem relatively common-sense and uncontroversial when expressed independently. For example, few Bay Street traderswould question that the high price of oil, and Canada’s growing presence in the global oilindustry, was an important factor in the rise of the dollar beginning in 2002. Similarly, fewmanufacturing analysts would question that the dramatic rise in the dollar had something todo with the accelerating decline in Canadian manufacturing activity, output, and exports. Inneither case does the causal relationship need to be exclusive: that is, other factors may alsocontribute to the rise in the dollar and/or the contraction of manufacturing. To sustain thehypothesis of resource-led deindustrialization, we merely need to accept that both factors are relevant.
Put these two seemingly innocuous sub-hypotheses together, however, and the explosivepolitical implications begin to distort the nature of analysis and discourse. Suggesting that theexpansion of an export-oriented petroleum industry (concentrated in the west of Canada) hasanything to do with the troubles of manufacturing (concentrated in central Canada) raisesuncomfortable questions and conflicts. Some economic and political commentators wouldrather not talk about the issue at all.
For example, when former Ontario Premier Dalton McGuinty and Federal NDP leaderThomas Mulcair independently suggested in 2012 that Canada’s manufacturing industry was experiencing negative side-effects related to the speed and scale of the resource expansion,they were met with a daunting and highly-politicized reaction. Both were accused of being
7 If capital and labour markets were
constrained on the supply side, then a
resource boom could crowd out other
sectors simply by bidding up the price
of those inputs and facilitating their
reallocation away from other sectors.
That type of restructuring would
hardly be a problem, however, since
owners of capital and labour (even in
declining sectors) would experience
rising incomes, and no difficulty
finding alternative employment. In
Canada’s recent experience, it is clear
that neither employment nor
investment are constrained by supply,
and the impact of the resource
expansion on other sectors has been
experienced through other, less
benign channels.
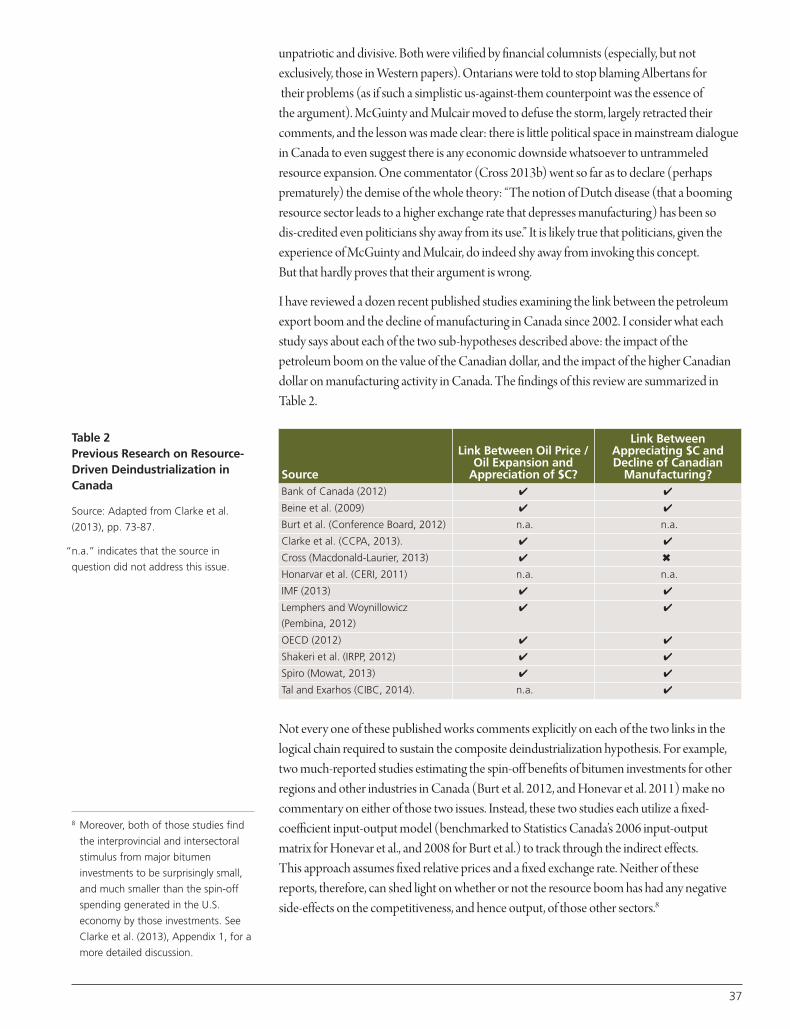
unpatriotic and divisive. Both were vilified by financial columnists (especially, but notexclusively, those in Western papers). Ontarians were told to stop blaming Albertans fortheir problems (as if such a simplistic us-against-them counterpoint was the essence of the argument). McGuinty and Mulcair moved to defuse the storm, largely retracted theircomments, and the lesson was made clear: there is little political space in mainstream dialoguein Canada to even suggest there is any economic downside whatsoever to untrammeledresource expansion. One commentator (Cross 2013b) went so far as to declare (perhapsprematurely) the demise of the whole theory: “The notion of Dutch disease (that a boomingresource sector leads to a higher exchange rate that depresses manufacturing) has been so dis-credited even politicians shy away from its use.” It is likely true that politicians, given theexperience of McGuinty and Mulcair, do indeed shy away from invoking this concept. But that hardly proves that their argument is wrong.
I have reviewed a dozen recent published studies examining the link between the petroleumexport boom and the decline of manufacturing in Canada since 2002. I consider what eachstudy says about each of the two sub-hypotheses described above: the impact of thepetroleum boom on the value of the Canadian dollar, and the impact of the higher Canadiandollar on manufacturing activity in Canada. The findings of this review are summarized inTable 2.
Not every one of these published works comments explicitly on each of the two links in thelogical chain required to sustain the composite deindustrialization hypothesis. For example,two much-reported studies estimating the spin-off benefits of bitumen investments for otherregions and other industries in Canada (Burt et al. 2012, and Honevar et al. 2011) make nocommentary on either of those two issues. Instead, these two studies each utilize a fixed-coefficient input-output model (benchmarked to Statistics Canada’s 2006 input-outputmatrix for Honevar et al., and 2008 for Burt et al.) to track through the indirect effects. This approach assumes fixed relative prices and a fixed exchange rate. Neither of these reports, therefore, can shed light on whether or not the resource boom has had any negativeside-effects on the competitiveness, and hence output, of those other sectors.8
Table 2Previous Research on Resource-Driven Deindustrialization inCanada
Source: Adapted from Clarke et al.
(2013), pp. 73-87.
“n.a.” indicates that the source in
question did not address this issue.
Source
Link Between Oil Price /Oil Expansion andAppreciation of $C?
Link BetweenAppreciating $C andDecline of CanadianManufacturing?
Bank of Canada (2012) 4 4
Beine et al. (2009) 4 4
Burt et al. (Conference Board, 2012) n.a. n.a.
Clarke et al. (CCPA, 2013). 4 4
Cross (Macdonald-Laurier, 2013) 4 6�
Honarvar et al. (CERI, 2011) n.a. n.a.
IMF (2013) 4 4
Lemphers and Woynillowicz
(Pembina, 2012)
4 4
OECD (2012) 4 4
Shakeri et al. (IRPP, 2012) 4 4
Spiro (Mowat, 2013) 4 4
Tal and Exarhos (CIBC, 2014). n.a. 4
37
8 Moreover, both of those studies find
the interprovincial and intersectoral
stimulus from major bitumen
investments to be surprisingly small,
and much smaller than the spin-off
spending generated in the U.S.
economy by those investments. See
Clarke et al. (2013), Appendix 1, for a
more detailed discussion.
38
Of the other studies listed in Table 2, all but one confirm that the run-up in oil prices, andthe corresponding expansion of investment, production, and exports in Canada’s petroleumindustry, has been a significant factor (not necessarily the only factor) in the sharp appreciationof the Canadian dollar since 2002. The only exception is the work of Tal and Exarhos (2014),who did not attempt to explain the causes of the dollar’s appreciation, but rather focused onlyon its consequences.
Regarding the second sub-hypothesis, all but one of the remaining studies (again, other thanthe two input-output models) also confirmed that the appreciation of the Canadian dollar wasa significant factor (again, not the only factor) in the contraction of Canadian manufacturing.The only exception in this case was the report by Cross (2013a), who, surprisingly, actuallydenied that any such contraction in manufacturing has, in fact, occurred. Cross measured thesize of the manufacturing sector on the basis of nominal sales (rather than more conventionalmeasures such as real value-added or employment), and concluded that overall manufacturingoutput was stable through the decade of Canadian-dollar appreciation (with sectors enjoyinggrowing sales offsetting those experiencing falling sales). On this basis, Cross concludes thatdeindustrialization has not occurred.9 He is the only author among the twelve surveyed toargue that manufacturing has not declined. Most other analysts would conclude from the lossof employment (down by 600,000 positions in Canada since 2001) and real value-added(which declined 14 percent between 2004 and 2013)10 that manufacturing has indeedexperienced a contraction.
The strong majority of research surveyed and summarized in Table 2, therefore, confirms bothsub-hypotheses in the theory that the petroleum boom, primarily through its impact on theexchange rate, has indeed had a negative impact on manufacturing (and other tradable sectors,as well). Research confirms that the rapid expansion of petroleum production and export hasbeen a major factor in the appreciation of the dollar, and also that the stronger exchange ratehas predictably undermined investment and export opportunities in other trade-sensitivesectors. Only one cell in the matrix depicted in Table 2 (namely, Cross’s argument that the highdollar has not damaged the manufacturing sector, which has enjoyed stable aggregate nominalsales) reflects the presence of counter-evidence to either of the two sub-hypotheses embeddedin the composite hypothesis of resource-driven deindustrialization. Eight of the twelve studiesconfirm both links in that logical chain, two confirm one of the two links, and the remainingtwo (the input-output studies) do not comment on either link.
Published economic research, therefore, confirms that the resource boom has had animportant set of unintended side-effects on the well-being of other sectors in Canada’seconomy. This hardly implies that the petroleum industry should somehow be vilified or
“shut down.” Instead of pretending that these unintended side-effects do not exist (or, worse yet,suggesting that it is somehow “un-Canadian” to even discuss them), surely it is more effectiveto recognize that there are both costs and benefits to the petroleum boom. The expansion ofpetroleum extraction and export has created potential and opportunity, but also risk andchallenge. The goal of policy should be to actively enhance the benefits and reduce the costs of this fundamental change in Canada’s economic structure, thus achieving a higher netbenefit outcome for Canadians. Efforts to enhance the Canadian value-added associated with resource developments (both upstream and downstream) would certainly constitute one important component of such a policy framework.
9 The use of nominal sales as a measure
of total industry output is
questionable given the impact of
inflation on nominal values. Two of
the most resilient sub-sectors
identified by Cross (food
manufacturing and petroleum
refining) were also the ones
experiencing the fastest nominal
inflation, which should not be
misinterpreted as evidence of “growth”
in any real sense.
10In 2000 manufacturing accounted for
16 percent of Canada’s GDP at factor
cost; by 2013 that had declined to
10 percent. While manufacturing
tends to decline gradually as a share
of GDP in the industrialized countries,
the decline in Canada has been much
faster since 2000, and to a lower level,
than in other OECD countries. And in
Canada there has also been a decline
in absolute real manufacturing output
which has not been experienced in
most other OECD countries.
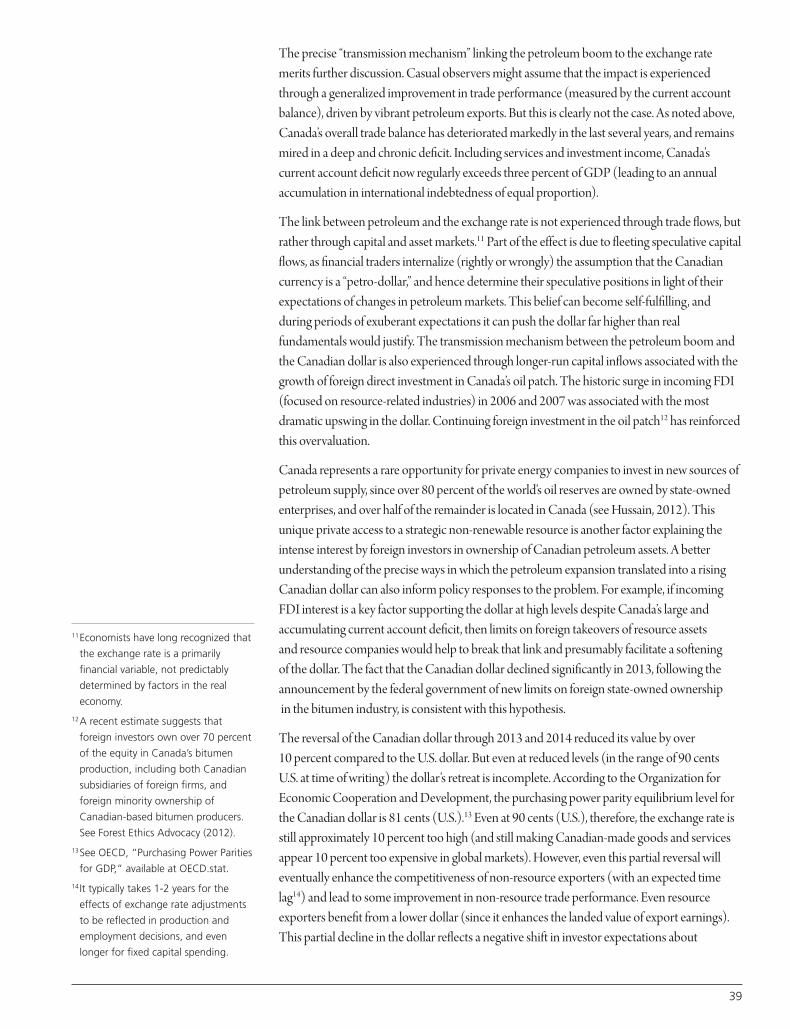
The precise “transmission mechanism” linking the petroleum boom to the exchange ratemerits further discussion. Casual observers might assume that the impact is experiencedthrough a generalized improvement in trade performance (measured by the current accountbalance), driven by vibrant petroleum exports. But this is clearly not the case. As noted above,Canada’s overall trade balance has deteriorated markedly in the last several years, and remainsmired in a deep and chronic deficit. Including services and investment income, Canada’scurrent account deficit now regularly exceeds three percent of GDP (leading to an annualaccumulation in international indebtedness of equal proportion).
The link between petroleum and the exchange rate is not experienced through trade flows, butrather through capital and asset markets.11 Part of the effect is due to fleeting speculative capitalflows, as financial traders internalize (rightly or wrongly) the assumption that the Canadiancurrency is a “petro-dollar,” and hence determine their speculative positions in light of theirexpectations of changes in petroleum markets. This belief can become self-fulfilling, andduring periods of exuberant expectations it can push the dollar far higher than realfundamentals would justify. The transmission mechanism between the petroleum boom andthe Canadian dollar is also experienced through longer-run capital inflows associated with thegrowth of foreign direct investment in Canada’s oil patch. The historic surge in incoming FDI(focused on resource-related industries) in 2006 and 2007 was associated with the mostdramatic upswing in the dollar. Continuing foreign investment in the oil patch12 has reinforcedthis overvaluation.
Canada represents a rare opportunity for private energy companies to invest in new sources ofpetroleum supply, since over 80 percent of the world’s oil reserves are owned by state-ownedenterprises, and over half of the remainder is located in Canada (see Hussain, 2012). Thisunique private access to a strategic non-renewable resource is another factor explaining theintense interest by foreign investors in ownership of Canadian petroleum assets. A betterunderstanding of the precise ways in which the petroleum expansion translated into a risingCanadian dollar can also inform policy responses to the problem. For example, if incomingFDI interest is a key factor supporting the dollar at high levels despite Canada’s large andaccumulating current account deficit, then limits on foreign takeovers of resource assets and resource companies would help to break that link and presumably facilitate a softening of the dollar. The fact that the Canadian dollar declined significantly in 2013, following theannouncement by the federal government of new limits on foreign state-owned ownershipin the bitumen industry, is consistent with this hypothesis.
The reversal of the Canadian dollar through 2013 and 2014 reduced its value by over 10 percent compared to the U.S. dollar. But even at reduced levels (in the range of 90 cents U.S. at time of writing) the dollar’s retreat is incomplete. According to the Organization forEconomic Cooperation and Development, the purchasing power parity equilibrium level forthe Canadian dollar is 81 cents (U.S.).13 Even at 90 cents (U.S.), therefore, the exchange rate isstill approximately 10 percent too high (and still making Canadian-made goods and servicesappear 10 percent too expensive in global markets). However, even this partial reversal willeventually enhance the competitiveness of non-resource exporters (with an expected timelag14) and lead to some improvement in non-resource trade performance. Even resourceexporters benefit from a lower dollar (since it enhances the landed value of export earnings).This partial decline in the dollar reflects a negative shift in investor expectations about
39
11Economists have long recognized that
the exchange rate is a primarily
financial variable, not predictably
determined by factors in the real
economy.
12A recent estimate suggests that
foreign investors own over 70 percent
of the equity in Canada’s bitumen
production, including both Canadian
subsidiaries of foreign firms, and
foreign minority ownership of
Canadian-based bitumen producers.
See Forest Ethics Advocacy (2012).
13See OECD, “Purchasing Power Parities
for GDP,” available at OECD.stat.
14It typically takes 1-2 years for the
effects of exchange rate adjustments
to be reflected in production and
employment decisions, and even
longer for fixed capital spending.
40
Canada’s general economic recovery, the expected “tapering” of quantitative easing by U.S.monetary authorities, the recent softening of global commodity prices (and expectations offuture price changes), and a realization by investors that Canada’s bitumen expansion facesmany risks and constraints (economic and otherwise). The softer dollar will assist manyexport industries, but it cannot bring back all the non-resource jobs lost during the dollar’supswing. Moreover, many firms will wonder if the dollar might shoot upward again in thefuture (if and when oil prices strengthen further). Given the inaction of Canadian policy-makers (in government and the Bank of Canada) when the dollar took off after 2002, this is areasonable concern, and it may serve to inhibit the rebound in investment in manufacturingand other trade-sensitive activities.
Nevertheless, the recent decline of the Canadian dollar has been almost universally welcomedby economic analysts who expect it to have an eventual and significant positive impact onexports (which has been the weakest component of national GDP performance). This isironic, given the intense debate which erupted when the dollar was high, over whether or notthis appreciation had any negative implications for the rest of the economy or not. If resource-driven deindustrialization does not exist, and the high dollar was not the cause of Canadianmanufacturing problems, then why do economists now so energetically welcome the dollar’sdecline?
The erosion of manufacturing in Canada was far faster over the past decade than wasexperienced in most other OECD countries. It was not inevitable, and has had major negativeeffects on Canada’s productivity, investment, incomes, and exports. Moreover, the decline inother export industries in the era of over-valuation (including tourism and tradable services)shows this is not solely a manufacturing issue. All trade-sensitive industries (includingpetroleum itself ) have been damaged by the sharp currency appreciation which was so clearlya side-effect of the petroleum expansion. Notwithstanding the over-heated political rhetoricthat was sparked by the issue, policy-makers should think about ways to ensure that thisunfortunate experience is not repeated in the future.
Toward a More Diversified Economy
A s a major petroleum producer, Canada is squandering the opportunity to generateadditional jobs, incomes, and exports from petroleum production (keeping in mindthat the level of petroleum extraction must be managed, as well, in light of both
economic and environmental considerations). We need a proactive strategy to maximize forwardand backward linkages from petroleum extraction to other value-added sectors. In this way,resource production can support (rather than undermine) broader economic development goals.
“Less extraction and more value-added” is a motto which summarizes this philosophy. Applied tothe petroleum industry, this approach would feature several key policy measures:
• Active efforts are needed to boost Canadian-content in the machinery, capital, and serviceswhich are purchased as inputs to resource projects. Given the enormous capital investmentsbeing made in new projects (especially bitumen), the industrial spin-offs to other Canadiansectors have been far from optimal. Capturing those spin-off benefits requires planning andencouragement, rather than simply assuming that a rising bitumen tide will automatically liftall boats.
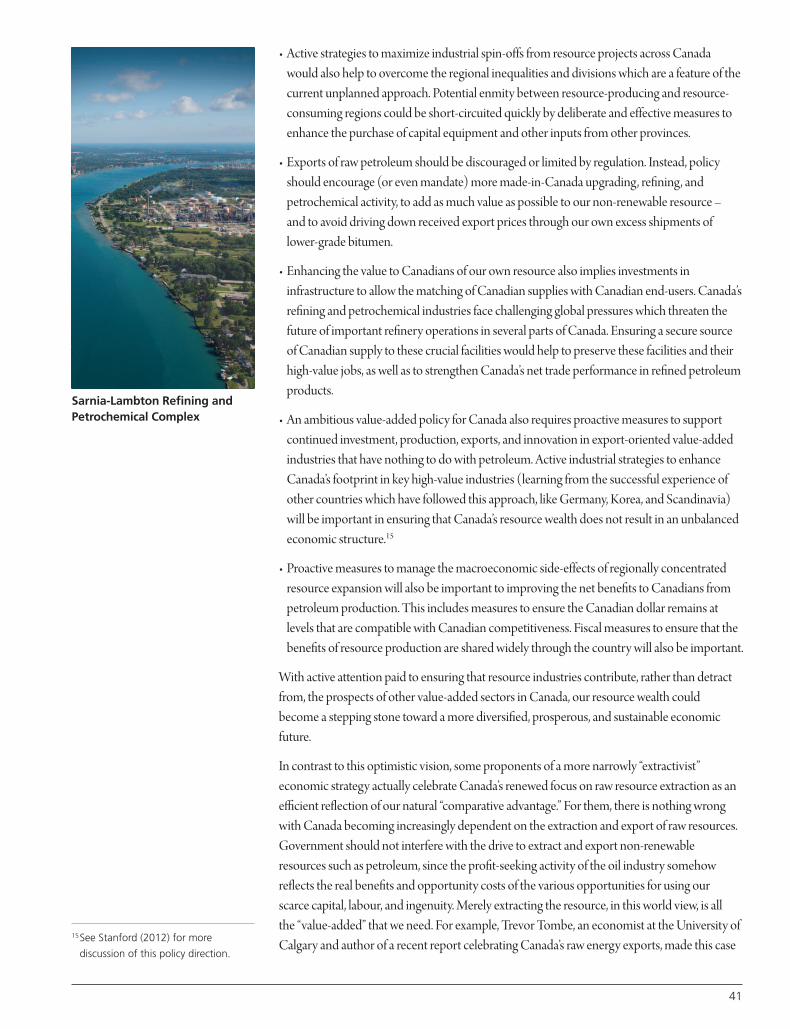
• Active strategies to maximize industrial spin-offs from resource projects across Canadawould also help to overcome the regional inequalities and divisions which are a feature of thecurrent unplanned approach. Potential enmity between resource-producing and resource-consuming regions could be short-circuited quickly by deliberate and effective measures toenhance the purchase of capital equipment and other inputs from other provinces.
• Exports of raw petroleum should be discouraged or limited by regulation. Instead, policyshould encourage (or even mandate) more made-in-Canada upgrading, refining, andpetrochemical activity, to add as much value as possible to our non-renewable resource –and to avoid driving down received export prices through our own excess shipments oflower-grade bitumen.
• Enhancing the value to Canadians of our own resource also implies investments ininfrastructure to allow the matching of Canadian supplies with Canadian end-users. Canada’srefining and petrochemical industries face challenging global pressures which threaten thefuture of important refinery operations in several parts of Canada. Ensuring a secure sourceof Canadian supply to these crucial facilities would help to preserve these facilities and theirhigh-value jobs, as well as to strengthen Canada’s net trade performance in refined petroleumproducts.
• An ambitious value-added policy for Canada also requires proactive measures to supportcontinued investment, production, exports, and innovation in export-oriented value-addedindustries that have nothing to do with petroleum. Active industrial strategies to enhanceCanada’s footprint in key high-value industries (learning from the successful experience ofother countries which have followed this approach, like Germany, Korea, and Scandinavia)will be important in ensuring that Canada’s resource wealth does not result in an unbalancedeconomic structure.15
• Proactive measures to manage the macroeconomic side-effects of regionally concentratedresource expansion will also be important to improving the net benefits to Canadians frompetroleum production. This includes measures to ensure the Canadian dollar remains atlevels that are compatible with Canadian competitiveness. Fiscal measures to ensure that thebenefits of resource production are shared widely through the country will also be important.
With active attention paid to ensuring that resource industries contribute, rather than detractfrom, the prospects of other value-added sectors in Canada, our resource wealth couldbecome a stepping stone toward a more diversified, prosperous, and sustainable economicfuture.
In contrast to this optimistic vision, some proponents of a more narrowly “extractivist”economic strategy actually celebrate Canada’s renewed focus on raw resource extraction as anefficient reflection of our natural “comparative advantage.” For them, there is nothing wrongwith Canada becoming increasingly dependent on the extraction and export of raw resources.Government should not interfere with the drive to extract and export non-renewableresources such as petroleum, since the profit-seeking activity of the oil industry somehowreflects the real benefits and opportunity costs of the various opportunities for using ourscarce capital, labour, and ingenuity. Merely extracting the resource, in this world view, is all the “value-added” that we need. For example, Trevor Tombe, an economist at the University ofCalgary and author of a recent report celebrating Canada’s raw energy exports, made this case
41
15See Stanford (2012) for more
discussion of this policy direction.
Sarnia-Lambton Refining andPetrochemical Complex
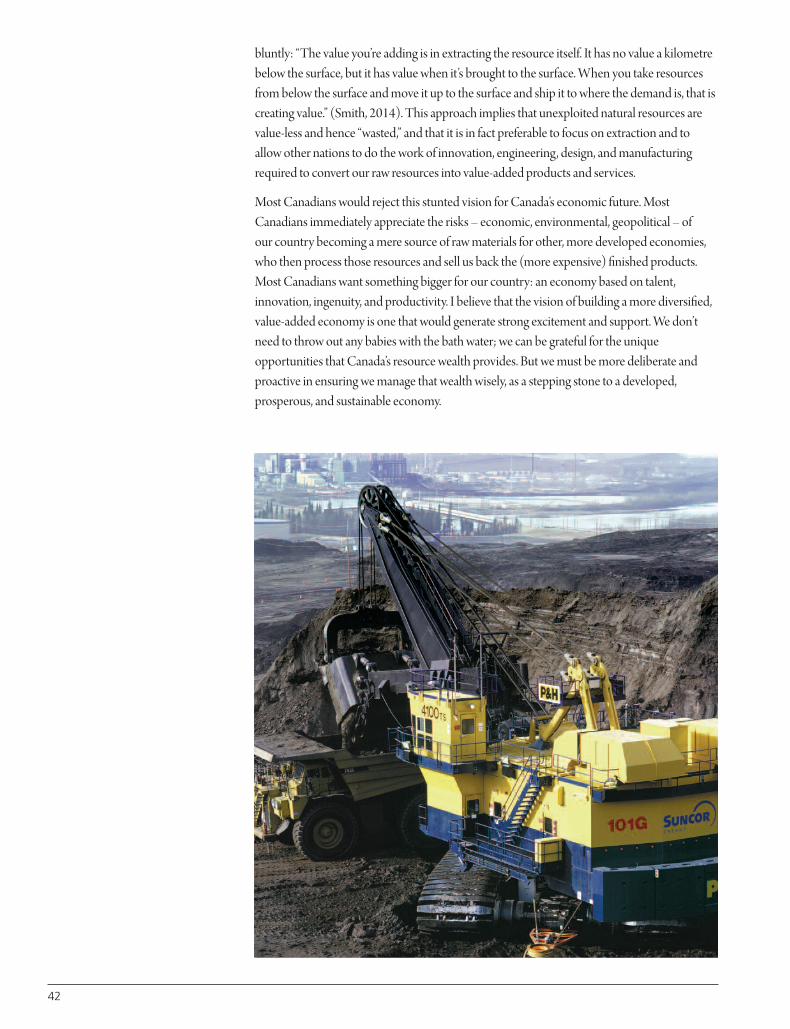
bluntly: “The value you’re adding is in extracting the resource itself. It has no value a kilometrebelow the surface, but it has value when it’s brought to the surface. When you take resourcesfrom below the surface and move it up to the surface and ship it to where the demand is, that iscreating value.” (Smith, 2014). This approach implies that unexploited natural resources arevalue-less and hence “wasted,” and that it is in fact preferable to focus on extraction and toallow other nations to do the work of innovation, engineering, design, and manufacturingrequired to convert our raw resources into value-added products and services.
Most Canadians would reject this stunted vision for Canada’s economic future. MostCanadians immediately appreciate the risks – economic, environmental, geopolitical – of our country becoming a mere source of raw materials for other, more developed economies,who then process those resources and sell us back the (more expensive) finished products.Most Canadians want something bigger for our country: an economy based on talent,innovation, ingenuity, and productivity. I believe that the vision of building a more diversified,value-added economy is one that would generate strong excitement and support. We don’tneed to throw out any babies with the bath water; we can be grateful for the uniqueopportunities that Canada’s resource wealth provides. But we must be more deliberate andproactive in ensuring we manage that wealth wisely, as a stepping stone to a developed,prosperous, and sustainable economy.
42

Bank of Canada (2012b). “Dutch Disease,” Remarks by Mark Carney, Governor of the Bank of
Canada, Spruce Meadows Round Table, Calgary, Alberta, 7 September 2012.
Beine, Michel, Charles S. Bos, and Serge Coulombe (2009). “Does the Canadian Economy Suffer
from ‘Dutch Disease’?”, mimeo, University of Ottawa.
Blackwell, Richard (2014). “Tunnel Vision,” The Globe and Mail (March 31).
Burt, Michael, Todd Crawford, and Alan Arcand (2012). Fuel for Thought: The Economic Benefits
of Oil Sands Investment for Canada’s Regions (Ottawa: Conference Board of Canada).
Clarke, Tony, Diana Gibson, Brendan Haley, and Jim Stanford (2013). Bitumen Cliff: Lessons and
Challenges of Bitumen Mega-Developments for Canada’s Economy in an Age of Climate Change
(Ottawa: Canadian Centre for Policy Alternatives).
Council of Canadian Academies (2013). The State of Industrial Research and Development in
Canada (Ottawa: Council of Canadian Academies).
Cross, Philip (2013a). Dutch Disease, Canadian Cure: How Manufacturers Adapted to the Higher
Dollar (Ottawa: Macdonald- Laurier Institute).
Cross, Philip (2013b). “The Logic Cliff,” Financial Post (February 25).
Environment Canada (2013). Canada’s Emissions Trends (Ottawa: Minister of the Environment),
October.
Forest Ethics Advocacy (2012). Who Benefits? (Vancouver: Forest Ethics Advocacy).
Haley, Brendan (2011). “From Staples Trap to Carbon Trap: Canada’s Peculiar Form of Carbon
Lock-In,” Studies in Political Economy 88, pp. 97–132.
Honarvar, Afshin, et al. (2011). Economic Impacts of New Oil Sands Projects in Alberta (2010–35)
(Calgary: Canadian Energy Research Institute).
Hussain, Yadullah (2012). “Oil Explorers’ New Challenges,” Financial Post, May 3.
International Monetary Fund (2013). “Article 4 Consultation, Country Report 13/40,” February.
Leach, Andrew (2014). “How the Oil Sands Could Very Quickly Become Unviable,” Maclean’s
(March 20).
Lemphers, Nathan, and Dan Woynillowicz (2012). In the Shadow of the Boom: How Oilsands
Development is Reshaping Canada’s Economy (Drayton Valley: Pembina Institute).
Organization for Economic Cooperation and Development (2012). OECD Economic Surveys:
Canada (Paris: Organization for Economic Cooperation and Development).
Shakeri, Mohammad, Richard S. Gray and Jeremy Leonard (2012). Dutch Disease or Failure to
Compete? A Diagnosis of Canada’s Manufacturing Woes (Montreal: Institute for Research on
Public Policy).
Sharpe, Andrew (2013). “What Do We Know About Productivity and What is the Best Focus for
Future Research?,” Presentation to Ontario Ministry of Finance, Centre for the Study of Living
Standards, September 30, http://www.csls.ca/news/presentations/OntarioMinistryFinance.pdf.
Smith, Dale (2014). “The Smell O’ Jobs,” Blacklocks Reporter (March 19).
Spiro, Peter (2013). More Stability Please: A New Policy Approach to Canada’s Exchange Rate
(Toronto: Mowat Centre for Policy Innovation).
Stanford, Jim, ed. (2014). The Staple Theory @ 50: Reflections on the Lasting Significance of Mel
Watkins’ “A Staple Theory of Economic Growth” (Ottawa: Canadian Centre for Policy Alternatives).
43
References

44
Stanford, Jim (2012). A Cure for Dutch Disease: Active Sector Strategies for Canada’s Economy
(Ottawa: Canadian Centre for Policy Alternatives), 11 pp.
Stanford, Jim (2011). “Canada’s Productivity and Innovation Failures: Questioning the
Conventional View,” in The Canada We Want in 2020: Towards a Strategic Policy Roadmap for the
Federal Government (Ottawa: Canada 2020).
Tal, Benjamin, and Nick Exarhos (2014). “Canadian Manufacturing: Survival of the Fittest,” CIBC
Economics In Focus (April 1), http://research.cibcwm.com/economic_public/download/if_2014-
0401.pdf.
Watkins, Mel (1963). “A Staple Theory of Economic Development,” Canadian Journal of
Economics and Political Science 29/2 (1963), pp. 49–73.
Wolfe, David A. and Matthew Lucas, eds. (2005). Global Networks and Local Linkages: The
Paradox of Cluster Development in an Open Economy (McGill-Queen’s University Press, Montreal
and Kingston).
Jim Stanford is an economist with Unifor, Canada’s largest private sector trade union. He received
his Ph.D. in Economics in 1995 from the New School for Social Research in New York, and also
holds economics degrees from Cambridge University and the University of Calgary. Jim is the
author of “Economics for Everyone,”published in 2008 by Pluto Press and the Canadian Centre for
Policy Alternatives. He writes an economics column for the “Globe and Mail,” and is a member of
CBC TV’s regular National News economics panel, “The Bottom Line.” He lives inToronto with his
partner and two daughters.
Biography
45
ABSTRACT
The conference “Bitumen – Adding Value: Canada’s National
Opportunity,” was initiated and sponsored by the Bowman Centre
at the Western Sarnia-Lambton Research Park, in partnership with
Alberta Innovates – Energy and Environment Solutions, Sarnia-Lambton
Economic Partnership and the Canadian Academy of Engineering. The
conference brought together representatives from the private sector,
the political scene at three levels of government, as well as labour,
lobby groups, agencies and technical professionals (contributors
shown on page 46).
The purpose of the conference was to focus on oil sands bitumen
with a view towards enhancing the discourse about adding value
to Canada’s resources, specifically that of bitumen extraction and
additional value-added processing in Canada.The goal was to stem
the loss of wealth inherent in exporting the raw resource. This chapter
focuses on the views and perspectives of the many contributors who
participated in the conference’s five sessions. The keynote presentations
were highlighted by the Honourable Frank McKenna, Deputy Chair of
the TD Bank Group, and Dr. Jim Stanford, Economist for Unifor. In
addition, a key address was made by the Honourable Senator Elaine
McCoy from Alberta. A further key address came from Mr. Kirk Bailey,
President of Kushog Consulting, and former executive of Suncor Energy
Ltd., addressing the perspective of the private sector from a position of
his active involvement in oil sands development.
Bitumen – Adding Value:Canada’s National Opportunity
Katherine J. AlbionMarshall J. Kern
Walter F. Petryschuk
3
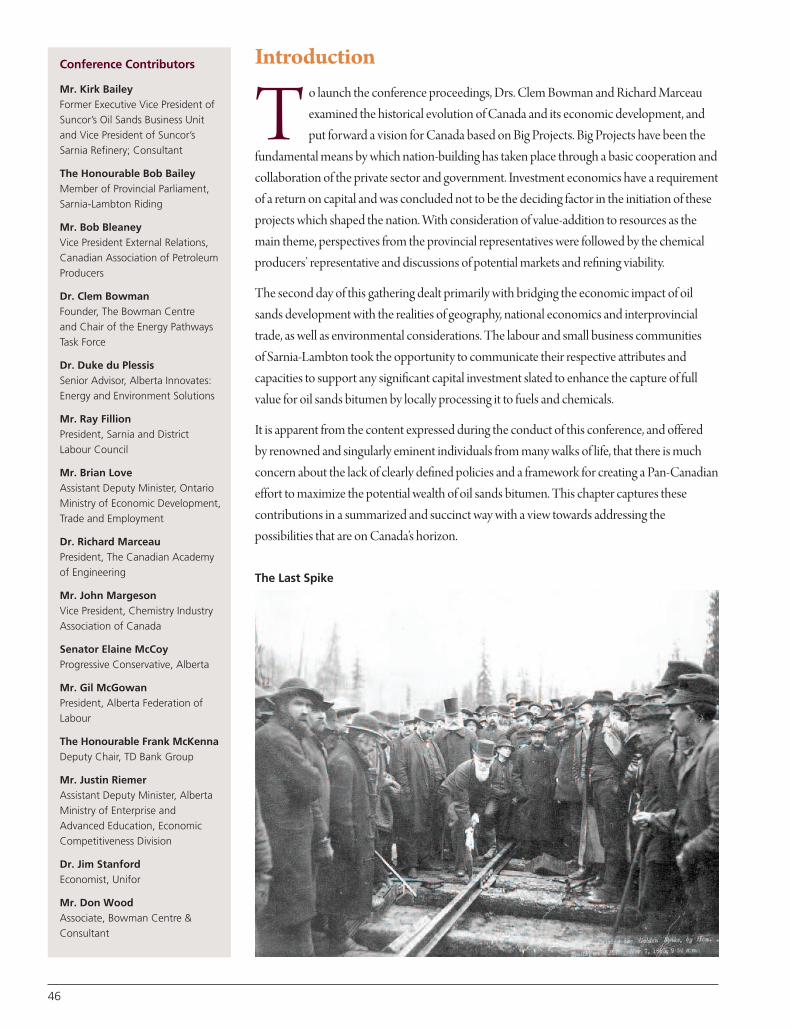
Introduction
T o launch the conference proceedings, Drs. Clem Bowman and Richard Marceauexamined the historical evolution of Canada and its economic development, andput forward a vision for Canada based on Big Projects. Big Projects have been the
fundamental means by which nation-building has taken place through a basic cooperation andcollaboration of the private sector and government. Investment economics have a requirementof a return on capital and was concluded not to be the deciding factor in the initiation of theseprojects which shaped the nation. With consideration of value-addition to resources as themain theme, perspectives from the provincial representatives were followed by the chemicalproducers’ representative and discussions of potential markets and refining viability.
The second day of this gathering dealt primarily with bridging the economic impact of oilsands development with the realities of geography, national economics and interprovincialtrade, as well as environmental considerations. The labour and small business communities of Sarnia-Lambton took the opportunity to communicate their respective attributes andcapacities to support any significant capital investment slated to enhance the capture of fullvalue for oil sands bitumen by locally processing it to fuels and chemicals.
It is apparent from the content expressed during the conduct of this conference, and offered by renowned and singularly eminent individuals from many walks of life, that there is muchconcern about the lack of clearly defined policies and a framework for creating a Pan-Canadianeffort to maximize the potential wealth of oil sands bitumen. This chapter captures thesecontributions in a summarized and succinct way with a view towards addressing thepossibilities that are on Canada’s horizon.
Conference Contributors
Mr. Kirk BaileyFormer Executive Vice President of
Suncor’s Oil Sands Business Unit
and Vice President of Suncor’s
Sarnia Refinery; Consultant
The Honourable Bob BaileyMember of Provincial Parliament,
Sarnia-Lambton Riding
Mr. Bob BleaneyVice President External Relations,
Canadian Association of Petroleum
Producers
Dr. Clem BowmanFounder, The Bowman Centre
and Chair of the Energy Pathways
Task Force
Dr. Duke du PlessisSenior Advisor, Alberta Innovates:
Energy and Environment Solutions
Mr. Ray FillionPresident, Sarnia and District
Labour Council
Mr. Brian LoveAssistant Deputy Minister, Ontario
Ministry of Economic Development,
Trade and Employment
Dr. Richard MarceauPresident, The Canadian Academy
of Engineering
Mr. John MargesonVice President, Chemistry Industry
Association of Canada
Senator Elaine McCoyProgressive Conservative, Alberta
Mr. Gil McGowanPresident, Alberta Federation of
Labour
The Honourable Frank McKennaDeputy Chair, TD Bank Group
Mr. Justin RiemerAssistant Deputy Minister, Alberta
Ministry of Enterprise and
Advanced Education, Economic
Competitiveness Division
Dr. Jim StanfordEconomist, Unifor
Mr. Don WoodAssociate, Bowman Centre &
Consultant
The Last Spike
46

Conference Communiqué
The following set of statements represents the consensus conclusions of the conference.
1. Lack of access to international pricing for Canada’s oil products represents a valuedestruction of $20 to $30 billion per year.
2. An expanded pan-Canadian pipeline network is key to accessing both domestic andgrowing global markets.
3. Canada should launch national-scale energy projects as the foundation of its energystrategy and its pathway to sustainable wealth creation and jobs.
4. The Ontario and Alberta governments commit to dramatically enhance their value-addedcollaboration to improve energy supply chain opportunities, to enhance transportationnetworks and to develop new energy-efficient and environmentally-advanced technology.
5. A Sarnia-Lambton bitumen upgrading project to produce refinery ready crudes wasidentified as a high priority national-scale project, with a call for action, with strong supportby a committed region.
6. Delegates urged Canada to shift to a more diversified value-added economy, away from itshistoric staple-based economy.
7. An Alberta Government/Industry study is being launched to identify pathways to increasethe competiveness of oil sand products in North American and International markets.
8. New technology is key for the long term sustainable development of Canada’s naturalresources. (The COSIA initiative was identified as an example of the commitment of oilcompanies to collaborate and share advances in improving environmental performance).
Background to ConferenceCommuniqué Statements
T he following sections contain the background discussions of the conclusions that led tothe eight communique statements.
1. Lack of access to international pricing for Canada’s oil productsrepresents a value destruction of $20 to $30 billion per year.
Value Destruction: According to the Honourable Frank McKenna, Canada is seeing “value destruction of a scale we’ve never witnessed before in this country.” The lack of take-awaypipeline capacity means Canada is captive to a single purchaser, and this purchaser does whatall purchasers do in a monopoly situation: gives Canada a discount to the benchmark price ofoil. “The result of that has been an enormous economic and fiscal catastrophe for Canada.” It isa catastrophe that Canadians don’t speak of, because the magnitude of what is taking place isnot appreciated. TD Economics Group estimates that:
47
48
• $25 to $30 billion in value will be destroyed in 2013,
• $276 billion will be lost in taxes by 2025, and
• $1.3 trillion will be lost in GDP by 2025.
The amount of money lost is so staggering that it is overwhelming, and must be reduced tomeaningful terms. The Hon. Frank McKenna said this represents thousands of nursing andteaching jobs, new schools, better highways, better healthcare, and more money for those inneed. “Any fraction of that amount of money that we are vapourizing every day would makethe life better of every single Canadian.”
The Call: Frank McKenna issued a call not just for a value-added national energyinfrastructure, but a call to create a symbol that will make Canada a better country. “Thiscountry could lead the world in growth if we could just get off the launching pad some of theexciting projects that we are capable of delivering.” All Canadians must be part of the solutionto build a national energy infrastructure from coast to coast. “So it brings the country togetherand I think that represents probably the most important value-added components of all.” A pipeline from sea-to-sea will demonstrate that Canada is a country where provincialboundaries are not toll booths, where Canadians are working together to enhance the well-being of every citizen in this country.
The History: Dr. Jim Stanford shared the observation that Canada’s economic history can be traced “from beavers to bitumen”. Canada has a long history of exploiting staples, or naturalresource-based products, for export. Canada sold staples in unprocessed or barely-processedforms to more advanced trading partners and, in turn, imported manufactured goods.Canada’s earliest history is based on fishing and the fur trade. Later, timber was cut andexported, or processed to paper and exported. Canada continues to export grains, minerals,forestry products, energy, and petroleum products such as bitumen. Now, approximately two-thirds of all exports are unprocessed. “Canadians are asking is there not more for us in the world economy than just digging stuff out of the ground?” To answer this question, Dr. Stanford stated that “we have to be thoughtful about making the most of our resource base.” The problem of over-reliance on staples production and a resulting structuralunderdevelopment of our national economy has been with Canadians since Confederation.The cycles of staples extraction and export have marked the chapters of the country’s nationaleconomic history.
The Economics: Dr. Stanford added that resource development and export has costs as well as benefits to Canadians. Canada has seen these economic cycles and mechanisms in the staples industries in the past. Dr. Stanford has worked with the Canadian Centre for PolicyAlternatives to understand the current so-called “Bitumen Cliff.” Their report1 states that thereare declining exports from other Canadian merchandise and service sectors. This hascontributed to a cumulative current account deficit of over $150 billion since 2008. The
“Bitumen Cliff ” report goes further to state that the country’s resource dependence hasnegative implications for innovation, and productivity growth.1 Canadian Centre for Policy
Alternatives: The Bitumen Cliff (2013),
Tony Clarke, Diana Gibson, Brendan
Haley, and Jim Stanford
Potential Policies: Dr. Stanford drew several conclusions. He stated that there is nothingautomatic about the flow of oil sands benefits to research and development, nor to theeconomic activity of the other provinces. It was determined that interprovincial economicactivity spin-offs from Alberta developments are surprisingly weak. “We have to go out andseek them. We have to put in place policy levers to maximize them.” He emphasized that thelong-run implications of resource dependence are serious and include economic impacts,environmental concerns, and geopolitical influence. This was confirmed by Senator ElaineMcCoy, who explained Canada’s current position in the world economy: Canada ranks thirdin the world for oil reserves, after Saudi Arabia and Venezuela. But Canada is sixth in the worldfor annual oil production. Sen. McCoy drew from a Senate report2 to state that Canada is inthis position because the country has not become a global trader. To become a global traderrequires an attitudinal shift and a reconfiguration of the way Canadians view their country and its behaviour.
A Labour Perspective: Mr. Gil McGowan posed a challenge to create a new consensus ofwhat Albertans and Canadians can do to add value to Canada’s resources. Canadians cannotallow others, such as “Big Oil”, to continue to create a consensus for Canada. When there is aconflict between the positions of industry and the expectations of the public, the broad publicinterest must trump narrow private interests. Mr. McGowan also added that former AlbertaPremier Peter Lougheed was correct, and Albertans must “think like owners”, such that ownersshould never let others make all the important decisions regarding their assets. In this regard,Mr. McGowan pointed to the experience of Norway and the development of North Seaoilfields. The Norwegian developments occurred within a framework that the oilfields are apublic resource. The development of this public resource would be public policy thatrecognized the public interest, and is strengthened by public participation. Policy must not shyaway from public participation and even public ownership to ensure that public interest goalsare met, Mr. McGowan concluded “the oil sands are one of Canada’s most important publicresources. We need a clear public policy framework that ensures it is developed in theCanadian public interest.”
2. An expanded pan-Canadian pipeline network is key toaccessing both domestic and growing global markets.
Senate Perspective: Sen. McCoy brought two priorities from the Senate Report “Now orNever” supporting the conclusion that an expanded pan-Canadian pipeline network is key for access to both domestic and growing global markets. The priorities are:
1. Canada must strive for collaborative energy leadership. The federal, provincial, territorial and municipal governments, industry, environmental
groups and Aboriginal leaders need to come together to chart a course for responsibledevelopment and marketing of Canada’s energy resources.
2. Advance nation-building through energy infrastructure. Canada must modernize and expand its electricity systems and oil and gas pipelines to
connect regions and diversify export markets to further strengthen the national economy.
49
2 “Now or Never” The Standing Senate
Committee on Energy, the
Environment and Natural Resources:
July 2012
Pipeline Discussion: Mr. Kirk Bailey emphasized that while concerns about the economyare mainly expressed by Canadians, there are international concerns about the environmentalimpacts of the oil sands. These concerns centre on pipelines, greenhouse gas emissions, wateruse, and land impacts. Recent evidence and historical experience continue to support theassertion that pipelines are the safest way to transport crude oil. The next best alternative is rail.While this does not mean that leaks from either pipelines or rail are acceptable, it confirms thatthe safest way forward is to continue pipeline capacity growth.
Several contributors noted that, in the midst of the bitumen value destruction, there is a hugepipeline debate in Canada. Canada has had pipeline debates before, such as the Trans-Canadapipeline debate and the MacKenzie Valley pipeline debate. The current debate is differentbecause it is a proxy for other issues such as Aboriginal land claims, the rights of provinces, and the development of the oil sands. This has led to the emotion of the debate beingmagnified a hundred-fold by vested interests. The specific case of the proposed West-to-EastEnergy Pipeline project was brought forward because of its significant impacts:
• A ship takes 9 days less to reach Mumbai, India from New Brunswick than from the Pacificcoast. This is one of the huge market opportunities off the East coast of Canada.
• Over 5,700 direct construction jobs in New Brunswick and Quebec, and more jobs to movethe product through terminals and shipping facilities are at stake.
• If the West-to-East pipeline can be built to Montreal, there is an even bigger opportunity for upgrading more of our petroleum. It just makes sense that if more processing occurs inCanada, then more jobs and wealth stay in Canada.
• Moving the oil from Alberta to the west coast or east coast allows for the transport of oil tothe skilled workers. This leads to the distribution of the demand for human resources aroundthe country.
Policy Considerations: Dr. Stanford urged adoption of several policy levers including oneto target higher Canadian value-added content both upstream in the extraction of staples, anddownstream in the upgrading and processing of raw materials through to final manufacturing.This includes the consumption of Canadian bitumen. Another policy lever is to have a pro-active national strategy to expand interprovincial links. Pipelines are an example of the interprovincial links and the flow of raw materials to the end users.
Mr. Bob Bleaney shared recent data on global crude oil reserves by country. Canada is at thetop of a list of 14 countries for openness and attention given to environmental rigour andstewardship of the resource. Canada’s petroleum producers have a number of initiativesunderway to continue to improve environmental performance. These efforts addressproduction, the integrity and operation of pipelines, and protection of marine environmentswith the prevention of spills and improved abilities to respond and recover oil from spills.
50
3. Canada should launch national-scale energy projects as thefoundation of its energy strategy and its pathway to sustainablewealth creation and jobs.
Economic and Social Balance: Dr. Stanford urged that active management of resourcedevelopments is essential to increase the benefits to all Canadians, and to reduce economicand social costs. There is an opportunity to enhance national net benefits from both sides ofthe equation. The first key policy priority Dr. Stanford put forward was to constrain the pace of development consistent with Canada’s environmental and economic objectives. He pointedout that former Alberta Premier Peter Lougheed also called for this. Dr. Stanford added thatresource development is a tremendous source of potential opportunity for Canadians, but the country must be smart and proactive about how the resource is used. He added, “I amheartened by the fact that we are meeting here together, all of us stakeholders, business, labour, government, community, with the goal of trying to do that.”
Markets and Government: The cost of doing nothing is the destruction of health care,education and many other services Canadians hold dear. Canada is a country of dialogue andconsensus. Economic theories tell Canadians the markets should find, finance and profit fromadding value to our resources. As history has proven, however, this is not the case. If it were notfor government intervention, Canada would not have had the Hibernia oil field, the ChurchillFalls hydro-electric development, the St. Lawrence Seaway, and even the Oil Sanddevelopments. There are times government has to give a helping push. Governments can givea legal licence to operate and Canadian society gives a social licence after reaching a consensuson key issues. There is a need for a clear call to the federal government to launch national-scaleenergy projects as the foundation of its energy strategy and its pathway to sustainable wealthcreation and jobs.
BIG Projects: Dr. Bowman and Dr. Marceau examined 12 past Big Projects in Canada, tounderstand the driving forces and the financial structures that led to their launch. Two formsof partnerships were identified as significant to the launch of the projects: the first form ofpartnership involved the establishment of crown corporations – seven of the twelve bigprojects involved this model, and in five of these projects, the government has since divestedfully to the private sector. The second form of partnership is that of a private sector companyentering the market with the negotiated support of a range of government risk sharingmechanisms, such as technology support, pioneer project grants, tax policies, and even equity participation. Four of the big projects involved this type of partnership.
Additional commonalities of Big Projects include:
1. Big Projects are nation-wide, or enable connections between Canadians in the east and the west. None of the projects have a north to south, nor export focus.
2. Big Projects have been used, or have become, symbols of nation-building.
For decades it has been commonly known that Canada has strengths in basic and appliedresearch. Canada’s weakness has been crossing the chasm from research to successfulcommercialization. Big Projects are the enablers of transitioning Canadian research to
51
52
successful commercial applications. Canada must now identify champions to execute the nextBig Projects, such as bitumen upgraders for Lambton County, Montreal, St. John and Kitimat.Based on prior public and private sector risk sharing examples, a suitable financial architecturecan be established.
4. The Ontario and Alberta governments commit to dramaticallyenhance their value-added collaboration to improve energy supplychain opportunities, to enhance transportation networks and todevelop new energy efficient and environmentally advancedtechnology.
Pan-Canada: The base case of goods and services flow from Ontario to Alberta is:
• $8.4 billion of goods in 2010, and
• $16.0 billion of services in 2010 (more than doubled since 1999)3.
This conference called on the Ontario and Alberta governments to dramatically enhancethese figures.
Mr. Justin Reimer and Mr. Brian Love addressed the topic of value-added collaborationsbetween Alberta and Ontario. Mr. Reimer referred to the report “Fuel for Thought”4
published by the Conference Board of Canada. It indicated that nearly one-third of thedomestic inputs for oil sands investment are from outside Alberta, and 15% of the domesticinputs come from Ontario. This investment translates into direct and indirect jobs, includingthe manufacturing industries in Ontario.
Mr. Love referred to a Canadian Energy Research Institute report5 which projected annualsales of Ontario products and services to the oil sands could potentially surpass most ofOntario’s traditional international export markets. It is expected that approximately 80% of the oil sands reserves will be developed by in situ or drilling technologies. This will demandthe sophisticated engineering and manufacturing capabilities which exist in Ontario.
Mr. Reimer emphasized that oil sands production facilities are increasingly engineered formodular construction, shipping, and assembly. This provides many advantages includingcapital cost savings, Canadian sources of materials, and the use of Canadian skilled labour.Currently, there are logistics limitations regarding the size of modules that can be moved fromOntario to Alberta. Innovations in module construction, as well as improvements of thetransportation corridors, will support the growth of modular facilities. Mr. Love added thatOntario offers a number of advantages, compared to international suppliers, for collaborationwith Alberta. These include no foreign exchange, cross-border or customs issues. There are no language or cultural barriers between the two provinces. Ontario offers top-notchmanufacturing, quality, and labour standards. As well, there is a large existing manufacturingcapacity, with potential for growth.
Mr. Reimer offered that there are four areas of policy collaboration between Alberta andOntario in the areas of transportation, manufacturing, technology, and also in value-added
3 “National and provincial-territorial
input-output tables, 2010”; CANSIM
386-0003, released November 8,
2013
4 “Fuel for Thought: The Economic
Benefits of Oil Sands Investment for
Canada’s Regions”; The Conference
Board of Canada report by Alan
Arcand, Michael Burt, Todd A.
Crawford: October 2012
5 Canadian Energy Research Institute
(CERI) Study No. 125, Aug 20122, A
Decade of Staged Oil Sands Growth
(2010-2020)
upgrading and refining facilities. In addition to all the business-to-business collaboration that is well-established, the provincial governments are already collaborating in other areas. An example of a government program is the “Energy Connections – Oil Sands” program6
which engages Ontario manufacturers directly with Alberta project owners, engineeringprocurement companies, and tier-one suppliers.
Mr. Reimer noted “our two provinces are pillars of the petrochemical industry”, and this pointwas confirmed by Mr. John Margeson of the Chemistry Industry Association of Canada.Alberta and Ontario are the home of many key participants in the Canadian downstreamchemical industry, which is the fourth largest amongst all domestic manufacturing industries.Chemical product exports rank second among all manufacturing industries.
The Canadian chemical industry links Canada’s rich resource endowment to recognizablevalue-added manufacturing products used in construction, textiles, electronics, and other day-to-day goods. Petrochemical products are a higher value-added end product for bitumenthan fuels. The value of petrochemicals can be four times greater than the value of bitumen,while further manufacturing to raw materials for consumer goods can generate productsvalued at over five times greater than the value of bitumen.
While the Canadian chemicals industry has had limited investment in new capacity over thepast 10 years, it is now poised for growth. The situation has changed due to new governmentpolicies as well as changes in feedstocks. The emergence of Sarnia as a bio-hybrid chemistrycluster is also an advantage.
The history of the Canadian chemical industry is defined by step-changes in growth driven by government policy or strategic decisions. Mr. Margeson gave three examples of decisions,starting in 1915 in Quebec, when acetone was first produced to supply the munitions industry.This decision catalyzed the growth of the chemical industry in Quebec. The second examplewas the manufacture of synthetic rubber in Sarnia during World War II. This strategic decisionlaid the foundation for the Chemical Valley in Sarnia. The final example is Alberta, where in1974 the government influenced companies to use ethane to produce ethylene. Now, twoworld-scale petrochemical clusters exist in Alberta.
Several speakers indicated that the inter-provincial benefits of the oil sands are limited now, but there are opportunities. Mr. Reimer was clear that “these benefits can only be realized if we take a strategic, collaborative, and intentional approach.” He went on to challenge theconference participants to do something “to optimize the value of this resource for Alberta,Ontario, and Canada”.
Labour’s Views: The perspective and situation of labour in Sarnia and Lambton waspresented by Mr. Ray Fillion, President of the Sarnia and District Labour Council. Heconfirmed that Sarnia has the capabilities to fulfill Alberta’s needs for skilled trades andavailable labour. The Labour Council works diligently with its membership to assure thatthere is a match between the demand for labour, and the availability of skilled trades. Therehave been many recent examples of how the Labour Council has drawn workers from outsidethe region to meet the timelines of local projects. A unique advantage brought forward by the
53
6 This is an ongoing effort with the
Canadian Manufacturers and
Exporters (CME) comprised of regular
conferences and trade shows to bring
businesses in Alberta and Ontario
together.
local labour movement, supported by the government and industry, is the opportunity to haveproject agreements which assure steady work without any interruptions during the term of theproject agreement. Another local strength is the ongoing education of members through theSarnia-Lambton Industrial Education Co-operative. This effort avoids expensive duplicationof training, and delivers current and world-class education. The result is an exceptional safetyrecord in Sarnia-Lambton.
5. A Sarnia-Lambton bitumen upgrading project to producerefinery ready crudes was identified as a high priority national-scale project, with a call for action, with strong support by acommitted region.
Case Study: Mr. Don Wood examined the business case for an upgrader in Sarnia-Lambton.A hypothesis was proposed that a Sarnia-Lambton upgrader is viable. This hypothesis wasevaluated by examining the following six essential and supporting conditions.
1. Capture of the value-added will benefit all Canadians.
2. Bitumen is deliverable through existing pipelines.
3. All stakeholders will be advantaged.
4. Production will be globally competitive and markets are available.
5. A social license is obtainable.
6. The project is financeable via single proponent or multiple partners.
The development of a business case has continued from the date of the conference to thepublishing of this book and has confirmed the validity of these conditions. The details of thebusiness case are presented in chapter 4 of this book.
6. Delegates urged Canada to shift to a more diversified value-added economy, away from its historic staple-based economy.
Dr. Stanford explained that dependence on staples leads to a number of concerns. In general,staples are globally traded commodities with volatile price and demand cycles. Dr. Stanfordreminded conference attendees that resources, such as the cod fishery on the east coast, willeventually run out. Value-adding jobs in the many processing industries are located abroadinstead of in Canada, and the extraction of staples in Canada is both capital and infrastructureintense. There can be a disproportionate reliance on foreign capital, as seen recently withforeign ownership of companies in the oil sands. Due to the significance of the oil sands on thedomestic economy, companies in the staples extraction industry may have disproportionatepolitical influence.
Canada has witnessed wave after wave of interest in the country’s abundant natural resourcesand has not captured their full value in Canada. Dr. Stanford clarified this by stating, “thatproblem of over-reliance on staples production and a resulting under-development of ournational economy has been with us since Confederation. The cycles of staples extraction andexport have defined our national economic history. The pejorative term of “hewers of wood
54

and drawers of water” now has been expanded in the current decade to “hewers of wood,drawers of water, and scrapers of tar.”
Dr. Stanford asserted that, “We have to be thoughtful about making the most of our resourcebase,” to allow workers to add value to the economy, as well as be part of their communities.On this point Mr. Bob Bailey added, “I think a big part of being a responsible political leader isto have these men and women at home every night with their children.” Mr. McGowan addedthat jobs at upgrading sites are not remote, so workers get home each day, and that is importantto the labour movement. Frank McKenna emphasized these points by saying, “So it brings thecountry together and I think that represents probably the most important of the value-addedcomponents of all.” Mr. Kirk Bailey added that Canada can reduce exposure to boom-and-bustcommodity price cycles where success is dictated by global pricing by investing in innovativevalue-adding processing of resources into competitive products.
Fundamentally, if Canadians are to realize the value of the country’s resources, Canadians mustheed the advice of Sen. McCoy, who urged that the time is “now or never.” Sen. McCoy mused,that even if Canada does not seize the opportunity to become a global trader in diversifiedmarkets and products, then Canadians will continue with safe, peaceful and rewarding lives.However, Canada has a national opportunity to go beyond seeking simple “access to markets”for our raw materials. This applies not only to the oil industry, but also to other Canadianindustries such as Ontario’s manufacturing base, and the British Columbian forest productsindustry.
Reviewing recent research, Dr. Stanford concludes that there is strong evidence of resource-driven deindustrialization in Canada. “This doesn’t mean that we have to leave everything inthe ground – that’s not what I’ve argued nor what most participants in this debate have argued.What it does mean is that we have to be cognizant of the risks of resource-drivendeindustrialization and take policy measures to look at it.” Dr. Stanford elaborates on thisimportant topic in Chapter 2 of this book.
7. An Alberta Government/Industry study is being launched toidentify pathways to increase the competiveness of oil sandproducts in North American and International markets.
Today’s oil sands export products fall into two main categories of crude oils: diluted bitumen(dilbit) and Synthetic Crude Oils (SCO). Various blends of these products are also marketed.Bitumen-derived refinery feedstocks have several challenges that impact their marketability,including market value, growth potential and the overall competitive position in US andinternational markets. Several government initiated studies have been carried out tounderstand the challenges and opportunities in different markets. A study conducted by theInstitute of Energy Economics Japan (IEEJ) examined the marketability of various oil sandsproducts in Asian Countries7.
More recently AI-EES working in partnership with other government departments andindustry has embarked on a phased investigation of the competitiveness of oil sands productsin North American and international markets. Phase 1, completed in 2012, examined how
55
7 Marketability of Oil Sands Products in
Asian Countries; Prepared for: The
Alberta Government by: The Institute
of Energy Economics, Japan (IEEJ),
March 2007
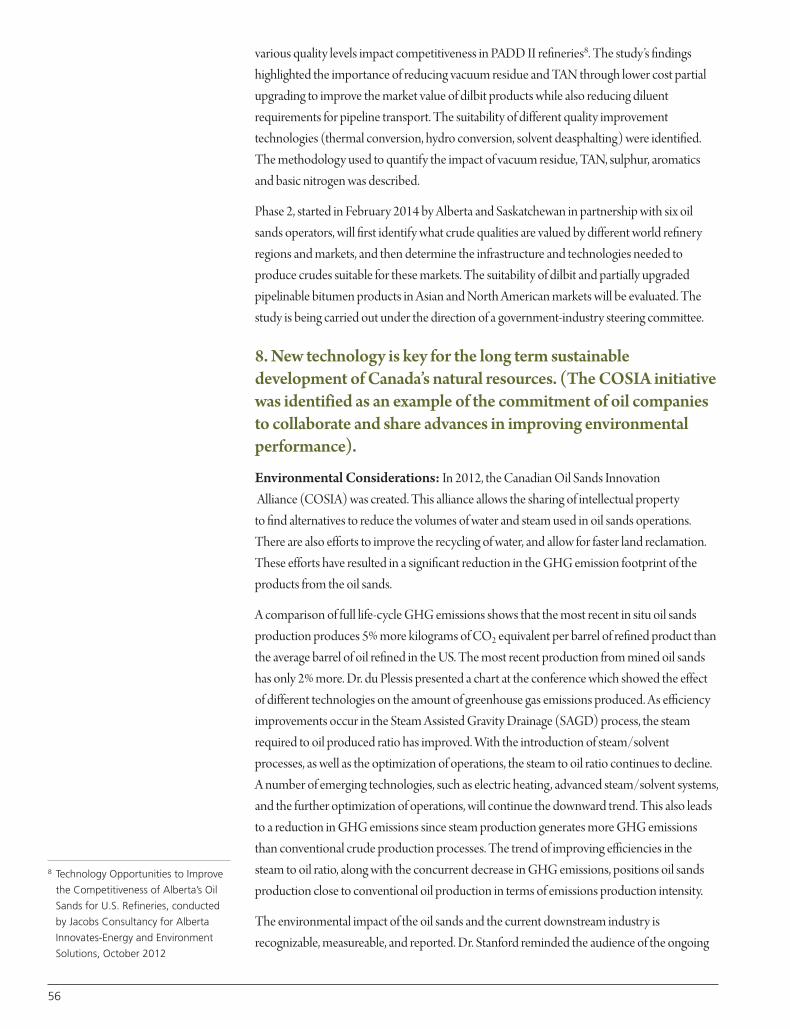
various quality levels impact competitiveness in PADD II refineries8. The study’s findingshighlighted the importance of reducing vacuum residue and TAN through lower cost partialupgrading to improve the market value of dilbit products while also reducing diluentrequirements for pipeline transport. The suitability of different quality improvementtechnologies (thermal conversion, hydro conversion, solvent deasphalting) were identified.The methodology used to quantify the impact of vacuum residue, TAN, sulphur, aromaticsand basic nitrogen was described.
Phase 2, started in February 2014 by Alberta and Saskatchewan in partnership with six oilsands operators, will first identify what crude qualities are valued by different world refineryregions and markets, and then determine the infrastructure and technologies needed toproduce crudes suitable for these markets. The suitability of dilbit and partially upgradedpipelinable bitumen products in Asian and North American markets will be evaluated. Thestudy is being carried out under the direction of a government-industry steering committee.
8. New technology is key for the long term sustainabledevelopment of Canada’s natural resources. (The COSIA initiativewas identified as an example of the commitment of oil companiesto collaborate and share advances in improving environmentalperformance).
Environmental Considerations: In 2012, the Canadian Oil Sands InnovationAlliance (COSIA) was created. This alliance allows the sharing of intellectual property to find alternatives to reduce the volumes of water and steam used in oil sands operations. There are also efforts to improve the recycling of water, and allow for faster land reclamation.These efforts have resulted in a significant reduction in the GHG emission footprint of theproducts from the oil sands.
A comparison of full life-cycle GHG emissions shows that the most recent in situ oil sandsproduction produces 5% more kilograms of CO2 equivalent per barrel of refined product thanthe average barrel of oil refined in the US. The most recent production from mined oil sandshas only 2% more. Dr. du Plessis presented a chart at the conference which showed the effectof different technologies on the amount of greenhouse gas emissions produced. As efficiencyimprovements occur in the Steam Assisted Gravity Drainage (SAGD) process, the steamrequired to oil produced ratio has improved. With the introduction of steam/solventprocesses, as well as the optimization of operations, the steam to oil ratio continues to decline.A number of emerging technologies, such as electric heating, advanced steam/solvent systems,and the further optimization of operations, will continue the downward trend. This also leadsto a reduction in GHG emissions since steam production generates more GHG emissionsthan conventional crude production processes. The trend of improving efficiencies in thesteam to oil ratio, along with the concurrent decrease in GHG emissions, positions oil sandsproduction close to conventional oil production in terms of emissions production intensity.
The environmental impact of the oil sands and the current downstream industry isrecognizable, measureable, and reported. Dr. Stanford reminded the audience of the ongoing
8 Technology Opportunities to Improve
the Competitiveness of Alberta’s Oil
Sands for U.S. Refineries, conducted
by Jacobs Consultancy for Alberta
Innovates-Energy and Environment
Solutions, October 2012
56
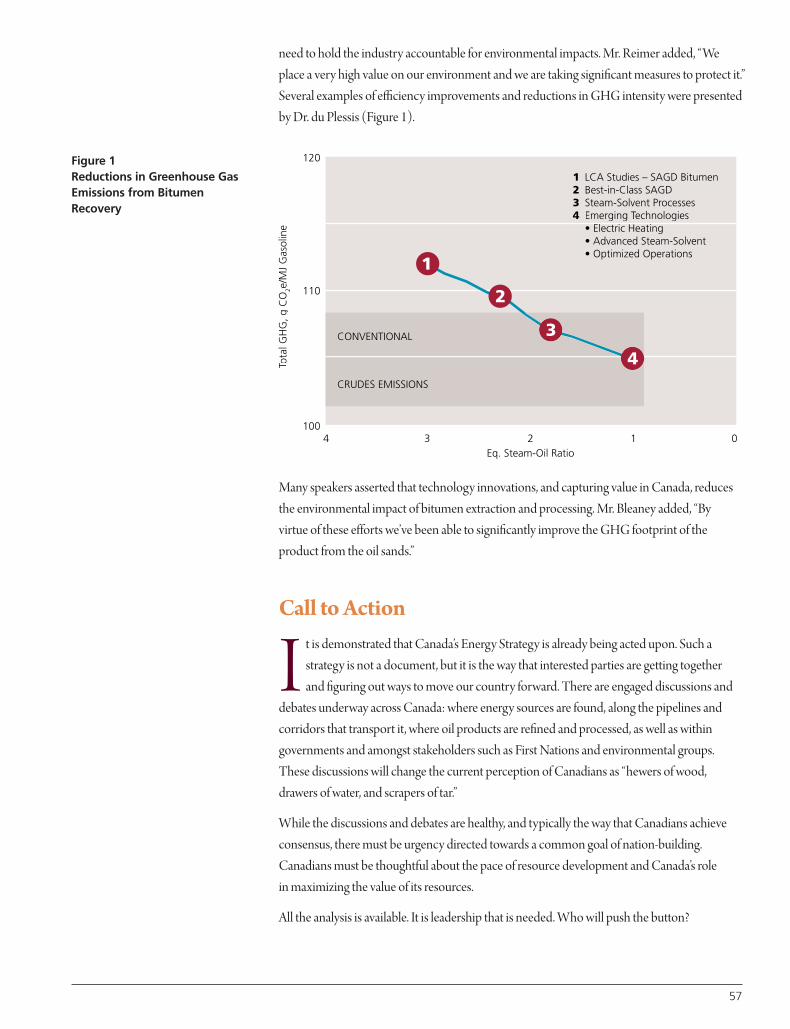
need to hold the industry accountable for environmental impacts. Mr. Reimer added, “Weplace a very high value on our environment and we are taking significant measures to protect it.”Several examples of efficiency improvements and reductions in GHG intensity were presentedby Dr. du Plessis (Figure 1).
Many speakers asserted that technology innovations, and capturing value in Canada, reducesthe environmental impact of bitumen extraction and processing. Mr. Bleaney added, “Byvirtue of these efforts we’ve been able to significantly improve the GHG footprint of theproduct from the oil sands.”
Call to Action
I t is demonstrated that Canada’s Energy Strategy is already being acted upon. Such astrategy is not a document, but it is the way that interested parties are getting togetherand figuring out ways to move our country forward. There are engaged discussions and
debates underway across Canada: where energy sources are found, along the pipelines andcorridors that transport it, where oil products are refined and processed, as well as withingovernments and amongst stakeholders such as First Nations and environmental groups.These discussions will change the current perception of Canadians as “hewers of wood,drawers of water, and scrapers of tar.”
While the discussions and debates are healthy, and typically the way that Canadians achieveconsensus, there must be urgency directed towards a common goal of nation-building.Canadians must be thoughtful about the pace of resource development and Canada’s role in maximizing the value of its resources.
All the analysis is available. It is leadership that is needed. Who will push the button?
57
Figure 1Reductions in Greenhouse GasEmissions from BitumenRecovery
CRUDES EMISSIONS
• Optimized Operations
01
CONVENTIONAL
• Advanced Steam-Solvent• Electric Heating
echnologies:Emerging T Technologies:4ocessesSteam-Solvent Pr3
Best-in-Class SAGD2LCA Studies – SAGD Bitumen1
Eq. Steam-Oil Ratio234
100
110
120
otal
GH
G, g
CO
TTo
2e/M
J G
asol
ine
1
2
3
4

58
Biography Dr. Katherine Albion is the Director of the Bowman Centre, located at the Western
Sarnia-Lambton Research Park. Dr. Albion joined the Western Research Park in 2008, as the
Commercialization and Research Engineer. Katherine is a graduate of Western University, where
she received a Bachelor’s Degree in Biochemical and Environmental Engineering, and was awarded
a PhD in Chemical Engineering. Her PhD research involved the development of non-invasive
acoustic flow monitoring techniques for pneumatic and hydraulic transport pipelines. As Director
of the Bowman Centre, Dr. Albion is responsible for the research and small business centre at the
Research Park, where she works with industry, entrepreneurs, and academic researchers to
advance and commercialize their technologies and processes. Since joining the Research Park,
Katherine has co-authored Academy reports focused on the development of renewable and
sustainable energy technologies identified as having a significant impact on the future of Canada’s
energy supply. She has also made energy presentations to the private and public sectors, including
the Federal Conservative Energy Caucus in Ottawa.
Marshall Kern is an Associate at The Bowman Centre. He is a corporate director in the healthcare
sector, and a conference speaker on governance processes. He teaches ethics through the
Nipissing University School of Business. Marshall completed a career with Dow Chemical; leaving
from a global position where he was recognized with the company’s highest honour for his
environmental commitment.
Walter F. Petryschuk was born outside the Point Pelee National Park in the most southerly part of
Canada. Raised on a farm, his schooling included a one-room elementary facility, his secondary
education was in Leamington, attending the University of Toronto for his Bachelor’s degree and
McMaster University for his Masters and Doctorate degrees in Chemical Engineering. His
professional career led to plant and site management of Polysar Corporation’s facilities and
Suncor’s refinery in Sarnia and the presidency of the Sun-Canadian Pipeline. Subsequently, he was
responsible for McMaster University’s spin-off start-up, the Management of Technology and
Innovation Institute, and ended as Director General of the National Research Council’s
manufacturing technology institutes in London and Vancouver. He is currently a volunteer
contributor as Associate, the Bowman Centre.

59
ABSTRACT
The oil sand industry was initially launched by a few large multi-
national oil companies with surface-mining operations who produced
and upgraded the bitumen in Alberta. Today, a broad mix of oil sand
companies produces bitumen from both surface-mining operations
and ‘in situ’ thermal processes, such as steam-assisted gravity drainage
(SAGD). Some of these companies have refineries in the United States
and, for corporate economic reasons, have opted to pipeline the raw
bitumen to these refineries for upgrading to value-added products.
However, there are an increasing number of independent companies
that produce bitumen without an internal capacity to produce high-
value finished products. These companies would clearly benefit from
additional upgrading capacity in Canada.
Ontario’s Sarnia-Lambton region offers a unique and early opportunity
to increase Canada’s bitumen upgrading capacity, using existing pipeline
networks to safely deliver the bitumen. The refinery would produce
high-value products on the threshold of one of the world’s largest
energy market, the US Midwest. The St. Lawrence Seaway would
provide ready access to global markets.
A team of pro bono ex-senior executives and recent retirees was
assembled from Bayer, Imperial Oil, Nova Chemicals, Polysar, Shell, and
Suncor to provide greater definition for this opportunity. The team
identified the fact that benefits from this major project would accrue
to all Canadians. Bitumen producers obtain the benefits of downstream
integration. The Sarnia-Lambton community would spearhead the
effort to develop the project. Alberta would gain a new market for
100,000 BPD of bitumen with more stable revenue. Ontario would
receive a major increase in employment, though benefits would
eventually be spread across Canada. From a national perspective,
Canada would capture the value-added with a significant increase
in export revenue.
Responding to the Call to Action: The Case fora Sarnia-Lambton Bitumen Upgrader Refinery Donald E. Wood
4

An acceptable Return on Investment (ROI) can be achieved if the new
upgrader is built to produce gasoline, diesel and other value-added
petroleum products. At current prices the value-added is $2.5 billion
per year, an additional $45 per barrel of diluted bitumen. Capital
Expenditure (CAPEX) is expected to be in the order of $10 billion.
The team has recognized that for this opportunity to be realized,
a corporate champion will be needed, ideally from the ranks of
experienced refiners with the skills to market the product. A financial
feasibility study was determined to be the next step.
60
Introduction
C hapter 3, which summarized the “Bitumen – Adding Value: Canada’s NationalOpportunity” Conference held in Sarnia in May 2013, presented the case thatCanada can capture enormous wealth by upgrading its raw natural resources to
value-added products. Four communiqués from that conference are highly relevant to thesubject of this chapter:
1. Delegates urged Canada to shift to a more diversified value-added economy, diverting fromits historic staple-based economy.
2. Canada should launch national-scale energy projects as the foundation of its energystrategy and its pathway to sustainable wealth creation and jobs.
3. The Ontario and Alberta governments should commit to dramatically enhancing theirvalue-added collaboration to improve energy supply chain opportunities, to enhancetransportation networks and to develop new energy-efficient and environmentallyadvanced technology.
4. A Sarnia-Lambton bitumen upgrading project to produce refinery ready crudes wasidentified as a high priority national-scale project, with a call for action, with strong supportby a committed region.
The Hypothesis
T he momentum behind the project continued. The Sarnia-Lambton Research Park’sBowman Centre next assembled a team of executives with petroleum industryexperience to study the viability of the project. They gathered at the Sarnia-
Lambton Research Park to respond to the Call to Action that had emerged from the SarniaConference. This team hypothesized that a Sarnia-Lambton bitumen upgrader refinery isviable for six major reasons.
First, the value added will benefit all Canadians: a strong economic stimulus locally, higher employment and taxes for Ontario, new markets for Alberta, and a significant increase in export revenue for the country as a whole. Secondly, they identified the ability to deliver bitumen through existing pipelines, and pointed to the advantages accruing to all stakeholders. They recognized that production will be globally competitive, and cited Sarnia’s proximity to American and global markets through its advantageous location on the St. Lawrence Seaway. They stated that a social license is available as a result of strong localsupport and, finally, they deemed the project to be financeable by means of either a singleproponent or multiple partners.
The actual financial performance of the Marathon Detroit refinery was cited as an example1, as shown in Figure 1. Market pricing from 2012 and 2013 indicates that this project is makingEarnings before Interest, Taxes, Depreciation & Amortization (EBITDA)2 returns of 15 to20% on CAPEX. Since this refinery is only 100 kilometers from Sarnia, this represents a strongindication that a Sarnia- Lambton project could also be profitable, either as a new stand-aloneupgrader or as an add-on to an existing refinery.
61
1 Marathon September 2013 Investor
Presentation
2 Earnings Before Interest, Taxes,
Depreciation and Amortization
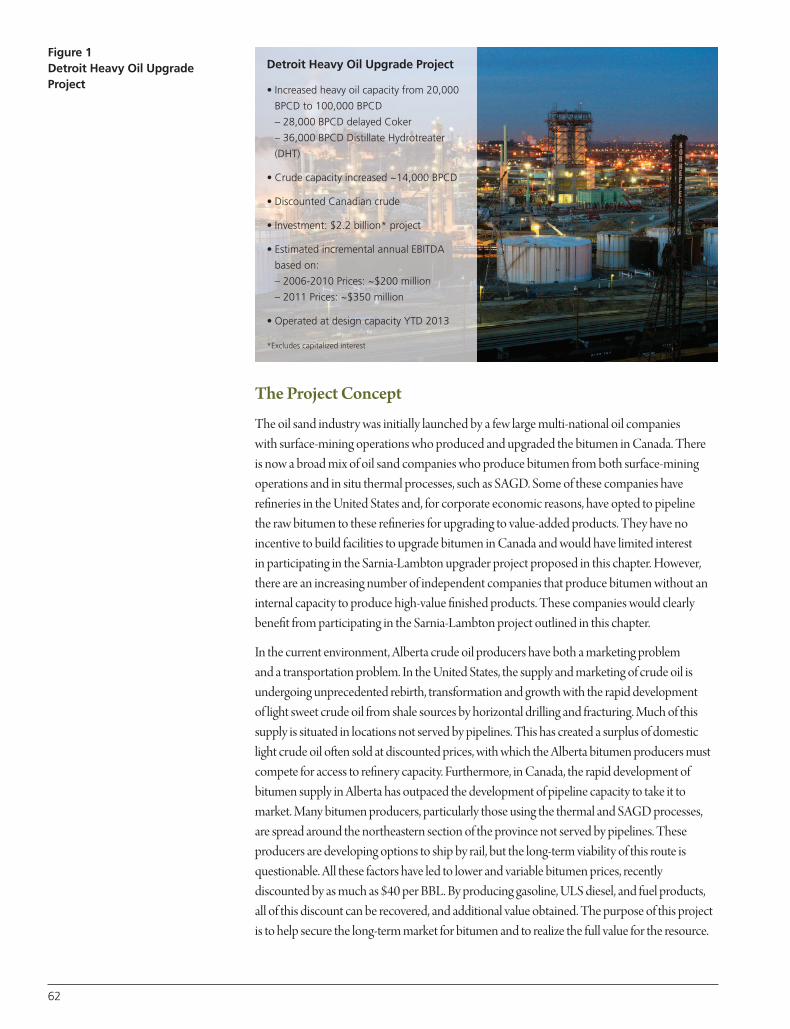
62
The Project Concept
The oil sand industry was initially launched by a few large multi-national oil companies with surface-mining operations who produced and upgraded the bitumen in Canada. There is now a broad mix of oil sand companies who produce bitumen from both surface-miningoperations and in situ thermal processes, such as SAGD. Some of these companies haverefineries in the United States and, for corporate economic reasons, have opted to pipeline the raw bitumen to these refineries for upgrading to value-added products. They have noincentive to build facilities to upgrade bitumen in Canada and would have limited interest in participating in the Sarnia-Lambton upgrader project proposed in this chapter. However,there are an increasing number of independent companies that produce bitumen without aninternal capacity to produce high-value finished products. These companies would clearlybenefit from participating in the Sarnia-Lambton project outlined in this chapter.
In the current environment, Alberta crude oil producers have both a marketing problem and a transportation problem. In the United States, the supply and marketing of crude oil isundergoing unprecedented rebirth, transformation and growth with the rapid development of light sweet crude oil from shale sources by horizontal drilling and fracturing. Much of thissupply is situated in locations not served by pipelines. This has created a surplus of domesticlight crude oil often sold at discounted prices, with which the Alberta bitumen producers mustcompete for access to refinery capacity. Furthermore, in Canada, the rapid development ofbitumen supply in Alberta has outpaced the development of pipeline capacity to take it tomarket. Many bitumen producers, particularly those using the thermal and SAGD processes,are spread around the northeastern section of the province not served by pipelines. Theseproducers are developing options to ship by rail, but the long-term viability of this route isquestionable. All these factors have led to lower and variable bitumen prices, recentlydiscounted by as much as $40 per BBL. By producing gasoline, ULS diesel, and fuel products, all of this discount can be recovered, and additional value obtained. The purpose of this projectis to help secure the long-term market for bitumen and to realize the full value for the resource.
Detroit Heavy Oil Upgrade Project
• Increased heavy oil capacity from 20,000
BPCD to 100,000 BPCD
– 28,000 BPCD delayed Coker
– 36,000 BPCD Distillate Hydrotreater
(DHT)
• Crude capacity increased ~14,000 BPCD
• Discounted Canadian crude
• Investment: $2.2 billion* project
• Estimated incremental annual EBITDA
based on:
– 2006-2010 Prices: ~$200 million
– 2011 Prices: ~$350 million
• Operated at design capacity YTD 2013
*Excludes capitalized interest
Figure 1Detroit Heavy Oil UpgradeProject
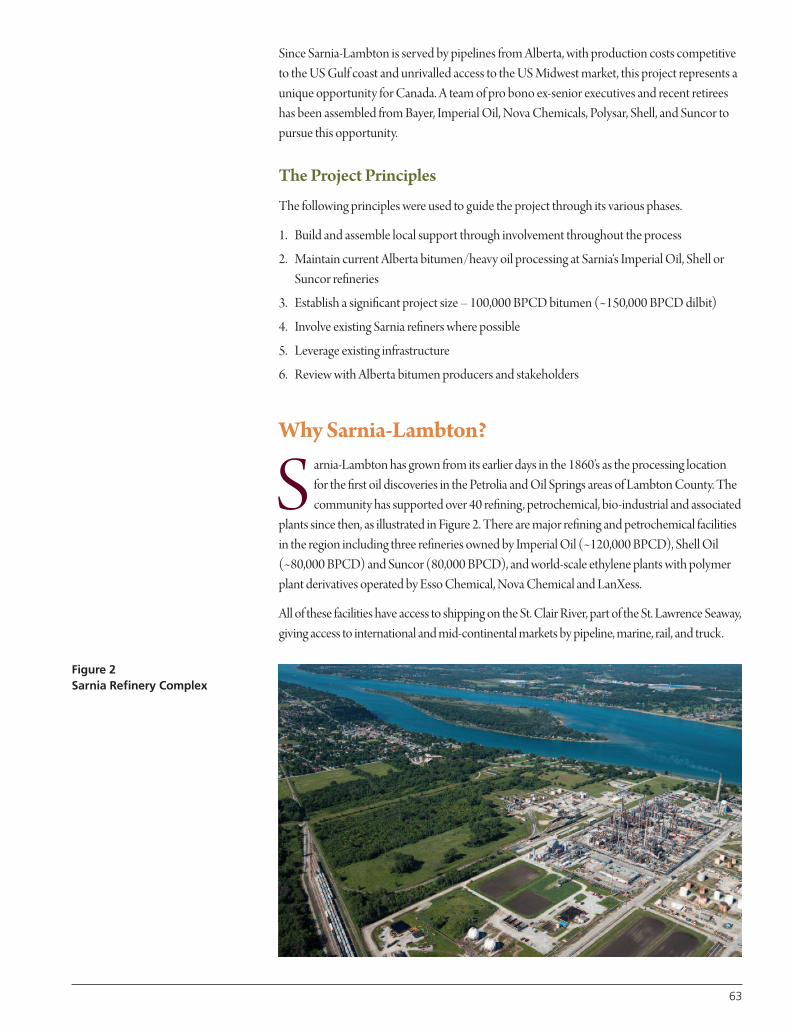
Since Sarnia-Lambton is served by pipelines from Alberta, with production costs competitiveto the US Gulf coast and unrivalled access to the US Midwest market, this project represents aunique opportunity for Canada. A team of pro bono ex-senior executives and recent retireeshas been assembled from Bayer, Imperial Oil, Nova Chemicals, Polysar, Shell, and Suncor topursue this opportunity.
The Project Principles
The following principles were used to guide the project through its various phases.
1. Build and assemble local support through involvement throughout the process
2. Maintain current Alberta bitumen/heavy oil processing at Sarnia‘s Imperial Oil, Shell orSuncor refineries
3. Establish a significant project size – 100,000 BPCD bitumen (~150,000 BPCD dilbit)
4. Involve existing Sarnia refiners where possible
5. Leverage existing infrastructure
6. Review with Alberta bitumen producers and stakeholders
Why Sarnia-Lambton?
S arnia-Lambton has grown from its earlier days in the 1860’s as the processing locationfor the first oil discoveries in the Petrolia and Oil Springs areas of Lambton County. Thecommunity has supported over 40 refining, petrochemical, bio-industrial and associated
plants since then, as illustrated in Figure 2. There are major refining and petrochemical facilitiesin the region including three refineries owned by Imperial Oil (~120,000 BPCD), Shell Oil(~80,000 BPCD) and Suncor (80,000 BPCD), and world-scale ethylene plants with polymerplant derivatives operated by Esso Chemical, Nova Chemical and LanXess.
All of these facilities have access to shipping on the St. Clair River, part of the St. Lawrence Seaway,giving access to international and mid-continental markets by pipeline, marine, rail, and truck.
Figure 2Sarnia Refinery Complex
63
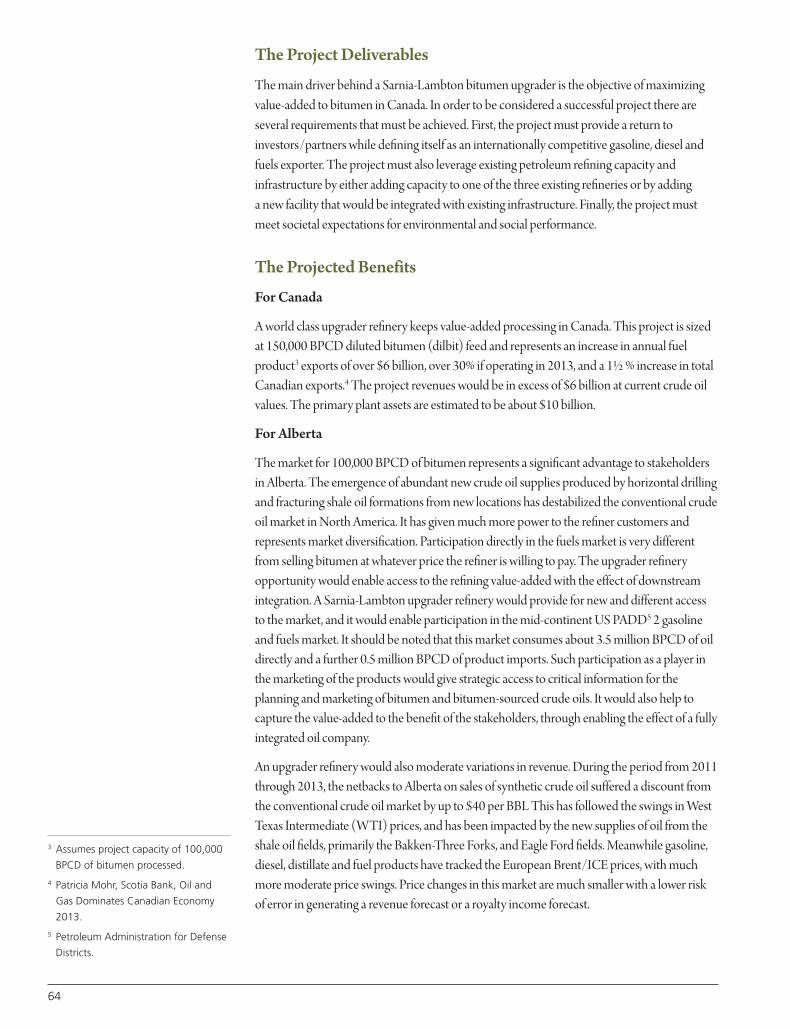
64
The Project Deliverables
The main driver behind a Sarnia-Lambton bitumen upgrader is the objective of maximizingvalue-added to bitumen in Canada. In order to be considered a successful project there areseveral requirements that must be achieved. First, the project must provide a return toinvestors/partners while defining itself as an internationally competitive gasoline, diesel andfuels exporter. The project must also leverage existing petroleum refining capacity andinfrastructure by either adding capacity to one of the three existing refineries or by adding a new facility that would be integrated with existing infrastructure. Finally, the project mustmeet societal expectations for environmental and social performance.
The Projected Benefits
For Canada
A world class upgrader refinery keeps value-added processing in Canada. This project is sizedat 150,000 BPCD diluted bitumen (dilbit) feed and represents an increase in annual fuelproduct3 exports of over $6 billion, over 30% if operating in 2013, and a 1½ % increase in totalCanadian exports.4 The project revenues would be in excess of $6 billion at current crude oilvalues. The primary plant assets are estimated to be about $10 billion.
For Alberta
The market for 100,000 BPCD of bitumen represents a significant advantage to stakeholdersin Alberta. The emergence of abundant new crude oil supplies produced by horizontal drillingand fracturing shale oil formations from new locations has destabilized the conventional crudeoil market in North America. It has given much more power to the refiner customers andrepresents market diversification. Participation directly in the fuels market is very differentfrom selling bitumen at whatever price the refiner is willing to pay. The upgrader refineryopportunity would enable access to the refining value-added with the effect of downstreamintegration. A Sarnia-Lambton upgrader refinery would provide for new and different accessto the market, and it would enable participation in the mid-continent US PADD5 2 gasolineand fuels market. It should be noted that this market consumes about 3.5 million BPCD of oildirectly and a further 0.5 million BPCD of product imports. Such participation as a player inthe marketing of the products would give strategic access to critical information for theplanning and marketing of bitumen and bitumen-sourced crude oils. It would also help tocapture the value-added to the benefit of the stakeholders, through enabling the effect of a fullyintegrated oil company.
An upgrader refinery would also moderate variations in revenue. During the period from 2011through 2013, the netbacks to Alberta on sales of synthetic crude oil suffered a discount fromthe conventional crude oil market by up to $40 per BBL This has followed the swings in WestTexas Intermediate (WTI) prices, and has been impacted by the new supplies of oil from theshale oil fields, primarily the Bakken-Three Forks, and Eagle Ford fields. Meanwhile gasoline,diesel, distillate and fuel products have tracked the European Brent/ICE prices, with muchmore moderate price swings. Price changes in this market are much smaller with a lower risk of error in generating a revenue forecast or a royalty income forecast.
3 Assumes project capacity of 100,000
BPCD of bitumen processed.
4 Patricia Mohr, Scotia Bank, Oil and
Gas Dominates Canadian Economy
2013.
5 Petroleum Administration for Defense
Districts.
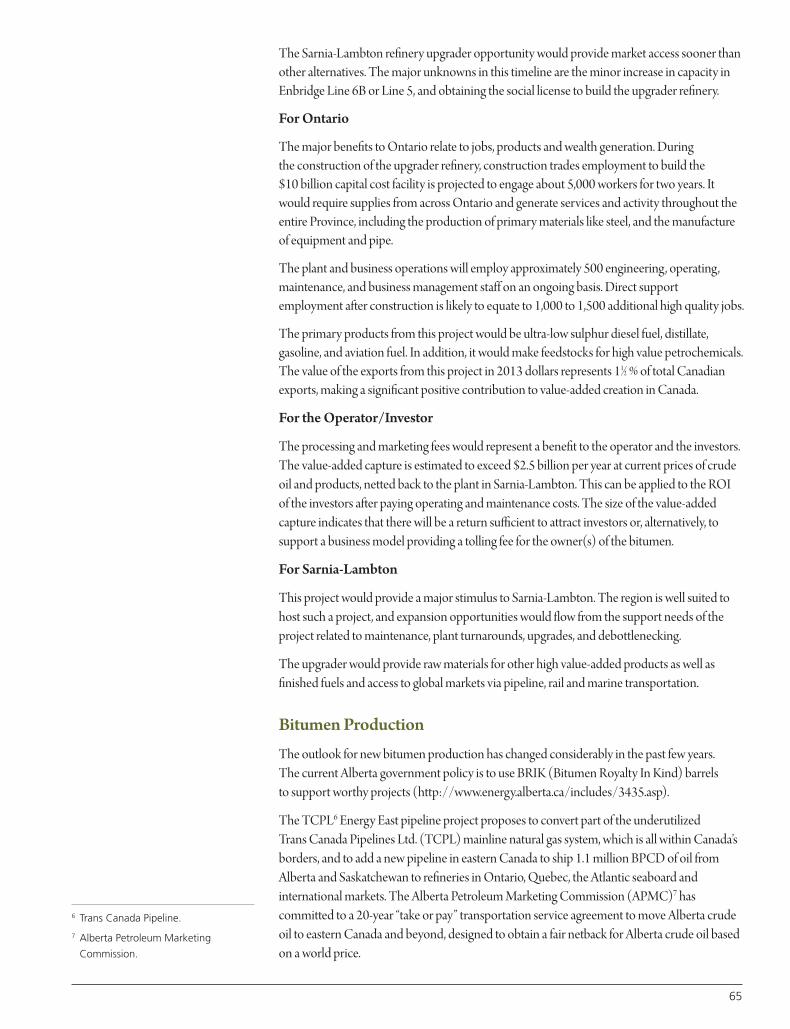
The Sarnia-Lambton refinery upgrader opportunity would provide market access sooner thanother alternatives. The major unknowns in this timeline are the minor increase in capacity inEnbridge Line 6B or Line 5, and obtaining the social license to build the upgrader refinery.
For Ontario
The major benefits to Ontario relate to jobs, products and wealth generation. During the construction of the upgrader refinery, construction trades employment to build the$10 billion capital cost facility is projected to engage about 5,000 workers for two years. Itwould require supplies from across Ontario and generate services and activity throughout theentire Province, including the production of primary materials like steel, and the manufactureof equipment and pipe.
The plant and business operations will employ approximately 500 engineering, operating,maintenance, and business management staff on an ongoing basis. Direct supportemployment after construction is likely to equate to 1,000 to 1,500 additional high quality jobs.
The primary products from this project would be ultra-low sulphur diesel fuel, distillate,gasoline, and aviation fuel. In addition, it would make feedstocks for high value petrochemicals.The value of the exports from this project in 2013 dollars represents 11⁄2 % of total Canadianexports, making a significant positive contribution to value-added creation in Canada.
For the Operator/Investor
The processing and marketing fees would represent a benefit to the operator and the investors.The value-added capture is estimated to exceed $2.5 billion per year at current prices of crudeoil and products, netted back to the plant in Sarnia-Lambton. This can be applied to the ROIof the investors after paying operating and maintenance costs. The size of the value-addedcapture indicates that there will be a return sufficient to attract investors or, alternatively, tosupport a business model providing a tolling fee for the owner(s) of the bitumen.
For Sarnia-Lambton
This project would provide a major stimulus to Sarnia-Lambton. The region is well suited tohost such a project, and expansion opportunities would flow from the support needs of theproject related to maintenance, plant turnarounds, upgrades, and debottlenecking.
The upgrader would provide raw materials for other high value-added products as well asfinished fuels and access to global markets via pipeline, rail and marine transportation.
Bitumen Production
The outlook for new bitumen production has changed considerably in the past few years. The current Alberta government policy is to use BRIK (Bitumen Royalty In Kind) barrels to support worthy projects (http://www.energy.alberta.ca/includes/3435.asp).
The TCPL6 Energy East pipeline project proposes to convert part of the underutilized Trans Canada Pipelines Ltd. (TCPL) mainline natural gas system, which is all within Canada’sborders, and to add a new pipeline in eastern Canada to ship 1.1 million BPCD of oil fromAlberta and Saskatchewan to refineries in Ontario, Quebec, the Atlantic seaboard andinternational markets. The Alberta Petroleum Marketing Commission (APMC)7 hascommitted to a 20-year “take or pay” transportation service agreement to move Alberta crudeoil to eastern Canada and beyond, designed to obtain a fair netback for Alberta crude oil basedon a world price.
65
6 Trans Canada Pipeline.
7 Alberta Petroleum Marketing
Commission.
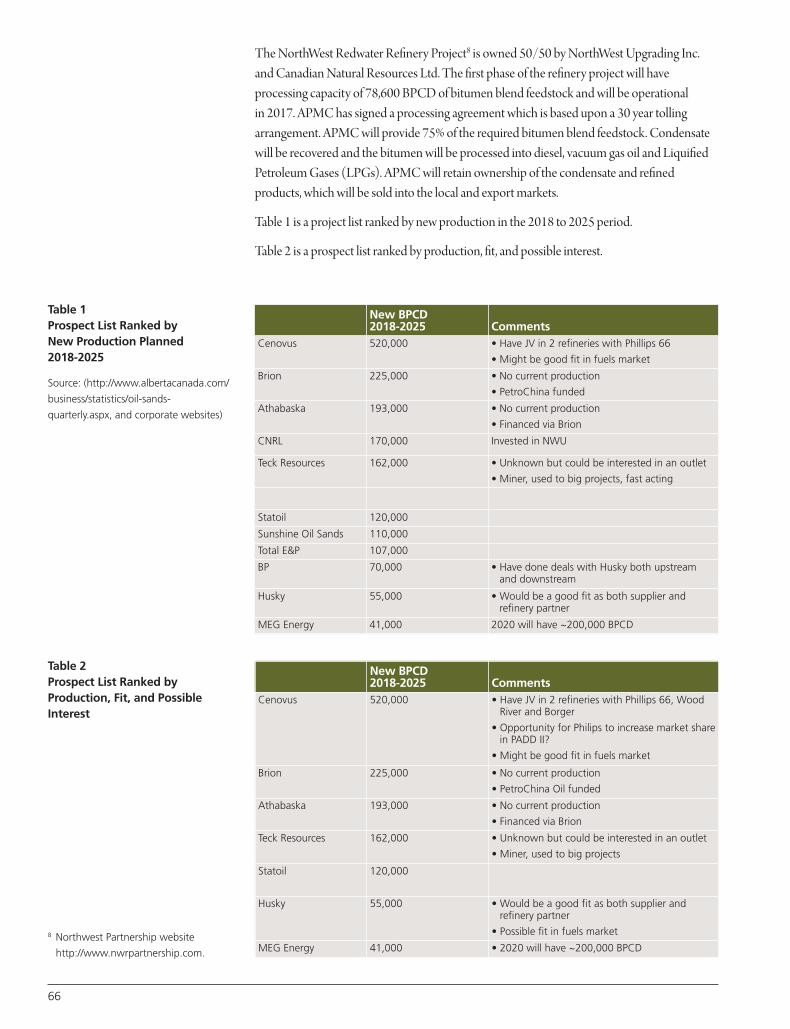
The NorthWest Redwater Refinery Project8 is owned 50/50 by NorthWest Upgrading Inc.and Canadian Natural Resources Ltd. The first phase of the refinery project will haveprocessing capacity of 78,600 BPCD of bitumen blend feedstock and will be operational in 2017. APMC has signed a processing agreement which is based upon a 30 year tollingarrangement. APMC will provide 75% of the required bitumen blend feedstock. Condensatewill be recovered and the bitumen will be processed into diesel, vacuum gas oil and LiquifiedPetroleum Gases (LPGs). APMC will retain ownership of the condensate and refinedproducts, which will be sold into the local and export markets.
Table 1 is a project list ranked by new production in the 2018 to 2025 period.
Table 2 is a prospect list ranked by production, fit, and possible interest.
Table 1Prospect List Ranked by New Production Planned 2018-2025
Source: (http://www.albertacanada.com/
business/statistics/oil-sands-
quarterly.aspx, and corporate websites)
Table 2Prospect List Ranked by Production, Fit, and PossibleInterest
New BPCD2018-2025 Comments
Cenovus 520,000 • Have JV in 2 refineries with Phillips 66
• Might be good fit in fuels market
Brion 225,000 • No current production
• PetroChina funded
Athabaska 193,000 • No current production
• Financed via Brion
CNRL 170,000 Invested in NWU
Teck Resources 162,000 • Unknown but could be interested in an outlet
• Miner, used to big projects, fast acting
Statoil 120,000
Sunshine Oil Sands 110,000
Total E&P 107,000
BP 70,000 • Have done deals with Husky both upstreamand downstream
Husky 55,000 • Would be a good fit as both supplier andrefinery partner
MEG Energy 41,000 2020 will have ~200,000 BPCD
New BPCD2018-2025 Comments
Cenovus 520,000 • Have JV in 2 refineries with Phillips 66, WoodRiver and Borger
• Opportunity for Philips to increase market sharein PADD II?
• Might be good fit in fuels market
Brion 225,000 • No current production
• PetroChina Oil funded
Athabaska 193,000 • No current production
• Financed via Brion
Teck Resources 162,000 • Unknown but could be interested in an outlet
• Miner, used to big projects
Statoil 120,000
Husky 55,000 • Would be a good fit as both supplier andrefinery partner
• Possible fit in fuels market
MEG Energy 41,000 • 2020 will have ~200,000 BPCD8 Northwest Partnership website
http://www.nwrpartnership.com.
66

Deliverable Bitumen
Enbridge presented the following information at the Canaccord Genuity InfrastructureConference which was held in Toronto in September 2012. Unlike other prospective bitumendestinations where no pipelines exist, Enbridge has two lines, shown in Figure 3, which at thetime of commitment may require only minor capacity expansion. The company expects thatsuch expansion will be relatively inexpensive.
Sarnia-Lambton is now served by line 5 and line 6B with a total capacity of over 800,000 BPCD.
Line 9 reversal and expansion is planned to take away 300,000 BPCD. Line 6B expansion is in the Enbridge 2016 CAPEX plan. The current tariff is approximately $5.50 per barrel fromHardisty, Alberta to Sarnia-Lambton.
Sarnia-Lambton Area Advantages
Sarnia-Lambton is situated at a strategic location on the Ontario/Michigan border. Half of the Canadian and American populations live within 500 miles – a day’s drive! It is one hour toDetroit, three hours to Toronto, and five hours to Chicago. Sarnia-Lambton is connected onthe Ontario 400 series highways and to the USA Interstate highway system – Interstate 94starts at the Bluewater Bridge. The Chris Hadfield International Airport is located 9 KM fromthe Sarnia city centre. In addition, Sarnia-Lambton offers affordable housing, short commutesto and from work, as well as outstanding recreational amenities.
This region includes the city of Sarnia and ten municipalities in Lambton County (see Figure 4), and offers many attractive features for such a project. First, Sarnia-Lambton, which is located at approximately the same latitude as Oregon, has a population of 129,000with a labour force of 62,000 workers. A surplus number of these workers are skilled in theconstruction trades. There is an adjacent labour force of 300,000 workers within a 100 KMradius of Sarnia-Lambton, including highly educated engineers, process operators and
Figure 3Enbridge Pipeline Systems
t
e he h
•
mama
memtnana
BuB
oronoron
CC
or rt McMurray
t
a
oClearbroo
naFlan
Cushing
WW
ok
lofalo
dvMontreal
Fo
• •
oronto
• • er r
agoChicagooledooledo
or
d R
nagan i
River
CaCaC
• •
o mmg g he Highest netback
•
L • w Low
es:es:itiv etitiv
quality/reliability
roitogo
k
n
k
o
Advupe or
T
na
perior
• Buf
anton
•
n
Hardisty
Edmonton
Kerrobert
ReginCromer
k
Gret
nia
Sup
gookpLockkport
CC goDD
ood River
a
aW
atokaPa
Limaima
eoledoTTT
Detroit
Sa nSarniaSa
Multiple lines: • Predictable tolls• Common carrier• marketsMultiple accessible marketsHig Hig ghest netback ow ow w cost expansion• •
S ca Sc le cale e: 2.5 million bpdS • dd ntadvantages:ntages:m eti mpet ve ve tive Com
67
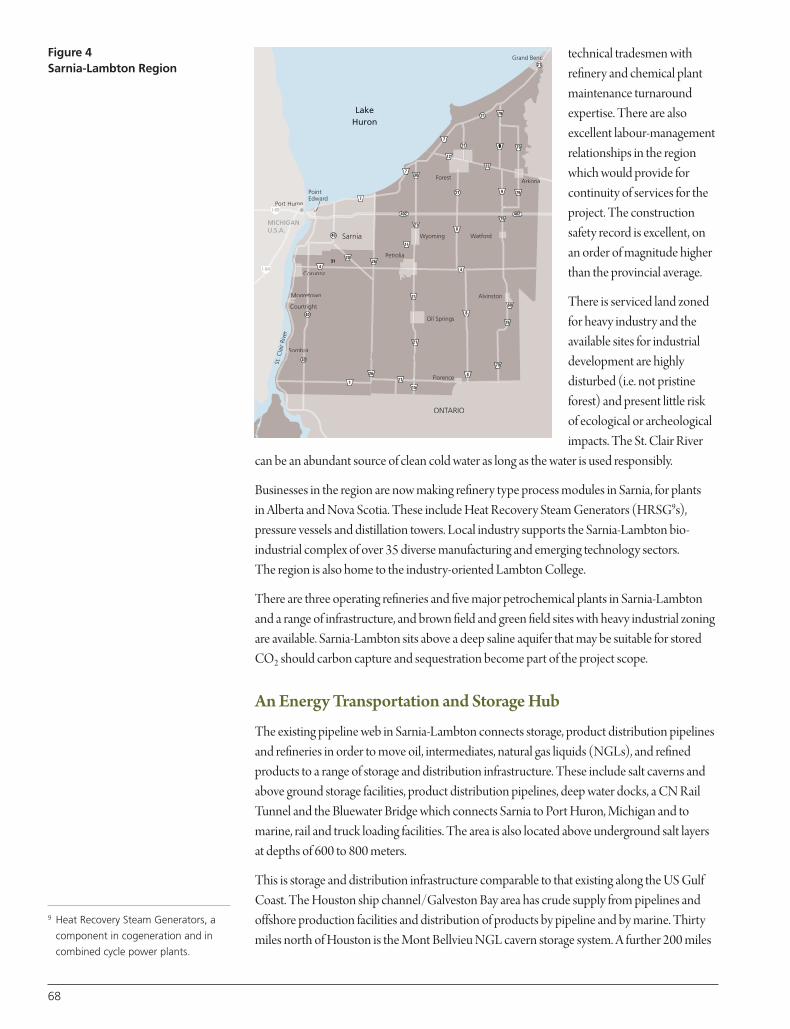
68
technical tradesmen withrefinery and chemical plantmaintenance turnaroundexpertise. There are alsoexcellent labour-managementrelationships in the regionwhich would provide forcontinuity of services for theproject. The constructionsafety record is excellent, onan order of magnitude higherthan the provincial average.
There is serviced land zonedfor heavy industry and theavailable sites for industrialdevelopment are highlydisturbed (i.e. not pristineforest) and present little risk of ecological or archeologicalimpacts. The St. Clair River
can be an abundant source of clean cold water as long as the water is used responsibly.
Businesses in the region are now making refinery type process modules in Sarnia, for plants in Alberta and Nova Scotia. These include Heat Recovery Steam Generators (HRSG9s),pressure vessels and distillation towers. Local industry supports the Sarnia-Lambton bio-industrial complex of over 35 diverse manufacturing and emerging technology sectors. The region is also home to the industry-oriented Lambton College.
There are three operating refineries and five major petrochemical plants in Sarnia-Lambtonand a range of infrastructure, and brown field and green field sites with heavy industrial zoningare available. Sarnia-Lambton sits above a deep saline aquifer that may be suitable for storedCO2 should carbon capture and sequestration become part of the project scope.
An Energy Transportation and Storage Hub
The existing pipeline web in Sarnia-Lambton connects storage, product distribution pipelinesand refineries in order to move oil, intermediates, natural gas liquids (NGLs), and refinedproducts to a range of storage and distribution infrastructure. These include salt caverns andabove ground storage facilities, product distribution pipelines, deep water docks, a CN RailTunnel and the Bluewater Bridge which connects Sarnia to Port Huron, Michigan and tomarine, rail and truck loading facilities. The area is also located above underground salt layersat depths of 600 to 800 meters.
This is storage and distribution infrastructure comparable to that existing along the US GulfCoast. The Houston ship channel/Galveston Bay area has crude supply from pipelines andoffshore production facilities and distribution of products by pipeline and by marine. Thirtymiles north of Houston is the Mont Bellvieu NGL cavern storage system. A further 200 miles
9 Heat Recovery Steam Generators, a
component in cogeneration and in
combined cycle power plants.
Figure 4Sarnia-Lambton Region
d
n
a
O
O N
M
21 nd
21
21
40
o
40
40
21
79
79
79
999
7
7
26
26
7
nia
30
21
21
21
21
15
12
9
79
79
79
14
431
4
80
8
8
8
1
20
Corunna
12
402 402
ence
d
A
I-69
I-94
etetown
ri
Moor
Courtr ght
rSomb a
Flor
Arkona
EdwarPoint
Grand Bend
St. C
lair
Rive
r
ARIO
estFor
WyomingSar
ONTTARIO
datforW
Alvinston
oliaPetr
Oil Springs
LAMBTO
Huron
U.S.A.
ON COUNTY
MICHIGAN
nonPort Hur
Lake
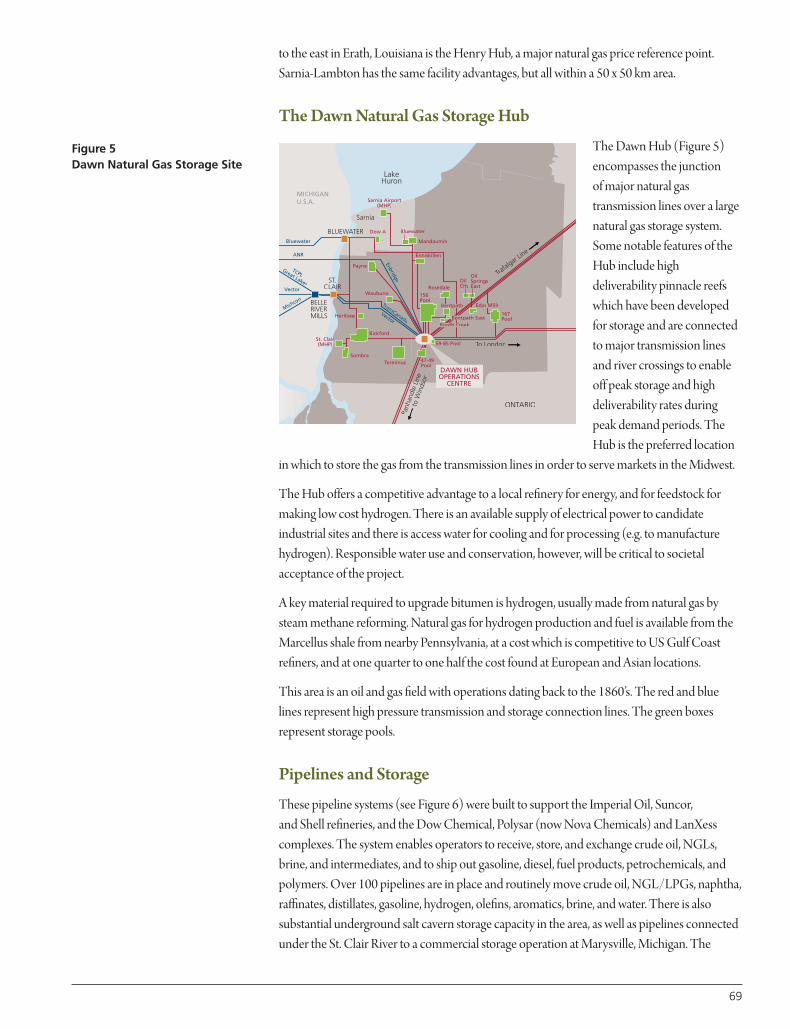
to the east in Erath, Louisiana is the Henry Hub, a major natural gas price reference point.Sarnia-Lambton has the same facility advantages, but all within a 50 x 50 km area.
The Dawn Natural Gas Storage Hub
The Dawn Hub (Figure 5)encompasses the junction of major natural gastransmission lines over a largenatural gas storage system.Some notable features of theHub include highdeliverability pinnacle reefswhich have been developedfor storage and are connectedto major transmission linesand river crossings to enableoff peak storage and highdeliverability rates duringpeak demand periods. TheHub is the preferred location
in which to store the gas from the transmission lines in order to serve markets in the Midwest.
The Hub offers a competitive advantage to a local refinery for energy, and for feedstock formaking low cost hydrogen. There is an available supply of electrical power to candidateindustrial sites and there is access water for cooling and for processing (e.g. to manufacturehydrogen). Responsible water use and conservation, however, will be critical to societalacceptance of the project.
A key material required to upgrade bitumen is hydrogen, usually made from natural gas bysteam methane reforming. Natural gas for hydrogen production and fuel is available from theMarcellus shale from nearby Pennsylvania, at a cost which is competitive to US Gulf Coastrefiners, and at one quarter to one half the cost found at European and Asian locations.
This area is an oil and gas field with operations dating back to the 1860’s. The red and bluelines represent high pressure transmission and storage connection lines. The green boxesrepresent storage pools.
Pipelines and Storage
These pipeline systems (see Figure 6) were built to support the Imperial Oil, Suncor, and Shell refineries, and the Dow Chemical, Polysar (now Nova Chemicals) and LanXesscomplexes. The system enables operators to receive, store, and exchange crude oil, NGLs,brine, and intermediates, and to ship out gasoline, diesel, fuel products, petrochemicals, andpolymers. Over 100 pipelines are in place and routinely move crude oil, NGL/LPGs, naphtha,raffinates, distillates, gasoline, hydrogen, olefins, aromatics, brine, and water. There is alsosubstantial underground salt cavern storage capacity in the area, as well as pipelines connectedunder the St. Clair River to a commercial storage operation at Marysville, Michigan. The
Figure 5Dawn Natural Gas Storage Site
ARIO
IR
TER
LAI
MILLS
n
o London
CENTRE
RIVERBELLE
CLAaubuno
T.S
TBLUEW
TIONSOPERAATIONSWN HUBDA
nia
AATERWWA
on
U.S.A.
TTo London
Pool
Sar
Bluewater
HurLake
H
ONTTARIO
inds
MICHIGAN
Great Lakes
W
Payne
Heritage
erminus
HP)
T
Bickford
Sombra
Enbridge
47-49
59-85 Pool
Pool167
Pool156
EastSpringsOil
CityOil
Rosedale
Enniskillen
Mandaumin
water
TTCPLt L
Michcon
ector
ransCanadaVVeVe
TTr
ector
VVVe
r
V
ANR
Bluewater
(MH
Dow A
(MHP)
ClairSt. C
(MHP) p rtSarnia Airport
sor
nd
to W
Lin
e L
ine
Lin
d W
i
rafalg
ar Lin
e
Panh
andl
e L
TTr
Edys Mills Mills
h East
e
Booth CBentpath East
a
Creek
Bentpath
69

70
pipeline system delivers gasoline, diesel, and other refined fuel products to major Midwestmarkets. There is marine loading capability for both barges for distribution through the GreatLakes and the St. Lawrence Seaway system, and ocean vessels to global markets. The storagesystems are also connected to load rail and trucks for product distribution to Midwest markets.
Globally Competitive with Accessible Markets
I n 2009, the United States became a net exporter of gasoline and refined products(exports minus imports, Figure 7). When the imports on the US east coast (primarilyfrom Canadian refineries) are removed, actual exports from the USGC in 2012 averaged
2,430,000 BPCD, with 2013 indications projected slightly higher.
The US Gulf Coast refiners’ exports into the Atlantic Basin markets surged, enabled by“advantaged” competitive crude and super competitive natural gas costs. Sarnia-Lambtonproduct sales would represent about 5% of the current US Gulf Coast exports.
Atlantic Basin refinery closures since 2008 totaled 4,000,000 BPCD of crude running capacity,including the shutdown of refineries in Aruba and St. Croix, reduced operating rates due topolitical intervention in Venezuela, and the shutdown of 1,000,000 BPCD of Europeancapacities, including many low complexity refineries.
BRENT/ICE European markets became the pricing basis in early 2011 (Figure 8). Prior tothat the US gasoline prices tracked the US WTI crude oil price postings.
Figure 6Pipeline and Storage Facilities
The coloured lines show pipeline
corridors containing multiple lines in
each.
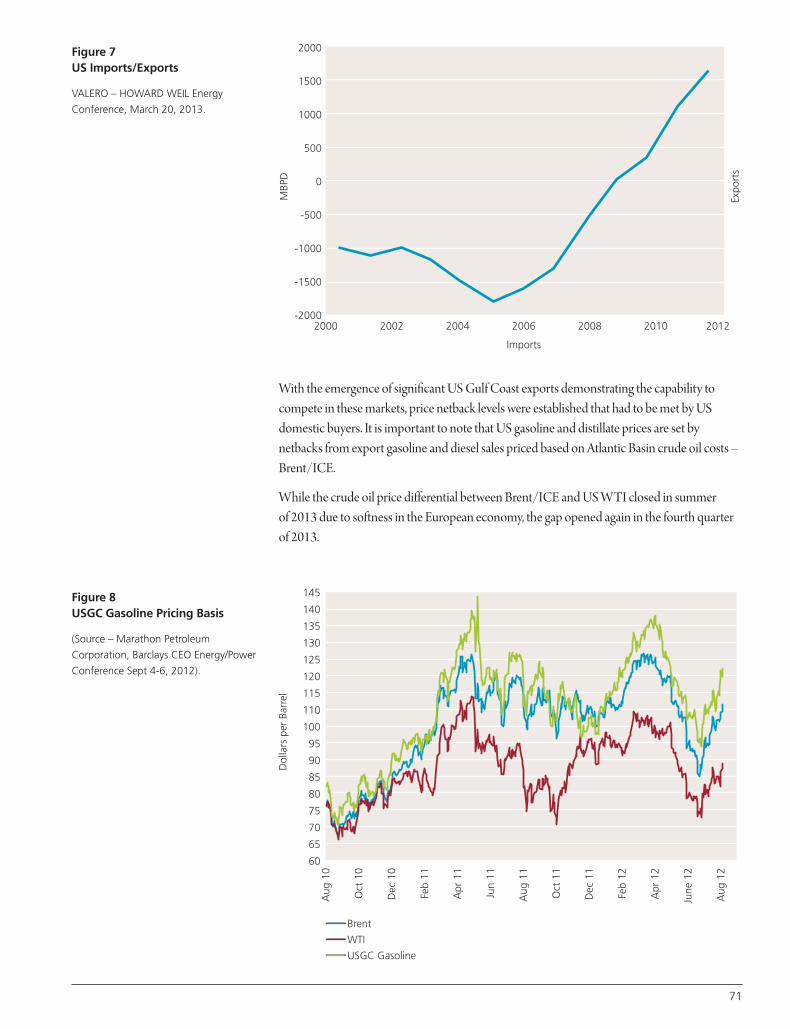
With the emergence of significant US Gulf Coast exports demonstrating the capability tocompete in these markets, price netback levels were established that had to be met by USdomestic buyers. It is important to note that US gasoline and distillate prices are set bynetbacks from export gasoline and diesel sales priced based on Atlantic Basin crude oil costs –Brent/ICE.
While the crude oil price differential between Brent/ICE and US WTI closed in summer of 2013 due to softness in the European economy, the gap opened again in the fourth quarterof 2013.
Figure 7US Imports/Exports
VALERO – HOWARD WEIL Energy
Conference, March 20, 2013.
Figure 8USGC Gasoline Pricing Basis
(Source – Marathon Petroleum
Corporation, Barclays CEO Energy/Power
Conference Sept 4-6, 2012).
2000
1500
1000
500
0
-500
-1000
-1500
-20002000 2002 2004 2006
Imports
2008 2010 2012
MBP
D
Expo
rts
145
140
135
130
125
120
115
110
100
95
90
85
80
75
70
65
60
Brent
WTI
USGC Gasoline
Aug
10
Oct
10
Dec
10
Feb
11
Apr
11
Jun
11
Aug
11
Oct
11
Dec
11
Feb
12
Apr
12
June
12
Aug
12
Dol
lars
per
Bar
rel
71

The US PADD 2 Midwest market is a major importer of gasoline, diesel, and fuel products(Figure 9).
The PADD 2 market has approximately 3.5 million BPCD refining capacity, with a 4.0 millionBPCD market demand, per US EIA10 data. Imports into the market, primarily from the US GulfCoast refineries, correspond to 13% of the PADD 2 gasoline, diesel and fuel products’ demand.This is per the Marathon Petroleum Corporation Business Update, December 2012, andconfirmed by the Valero presentation at the Howard Weil Energy Conference, March 20, 2013.
A Sarnia-Lambton refinery upgrader processing 150,000 BPCD of diluted bitumen wouldrepresent about 3.5% of this market. A new Sarnia-Lambton refinery upgrader using locallyavailable natural gas from the Marcellus shale for hydrogen production and fuels would becost competitive with the US Gulf Coast refineries. Product distribution costs by productpipeline from the US Gulf Coast to this market are about $2.00 per BBL. Distribution costsfrom Sarnia-Lambton by marine barge and pipeline would be equal to or lower than thedistribution costs from the US Gulf Coast refineries.
A Sarnia-Lambton refinery upgrader would have additional markets including those adjacentto US PADD 2, and markets in Ontario and along the US East Coast. For eight months of theyear there would also be marine access to world markets.
It is important to consider that the US Gulf Coast refiner has access to substantial additionalexport markets, and it would be indifferent on a pricing basis in terms of selling into the PADD2 market or to the world market.
Clearly the participation of a refiner marketer as a stakeholder in the project is desirable.
Figure 9US PADD 2 Midwest Market
MI
OHIN
KY
TN
IL
Chicago Cleveland
WI
MN
MO
IA
ND
SD
NE
KS
OK
Imports
13%
10Energy Information Administration
72
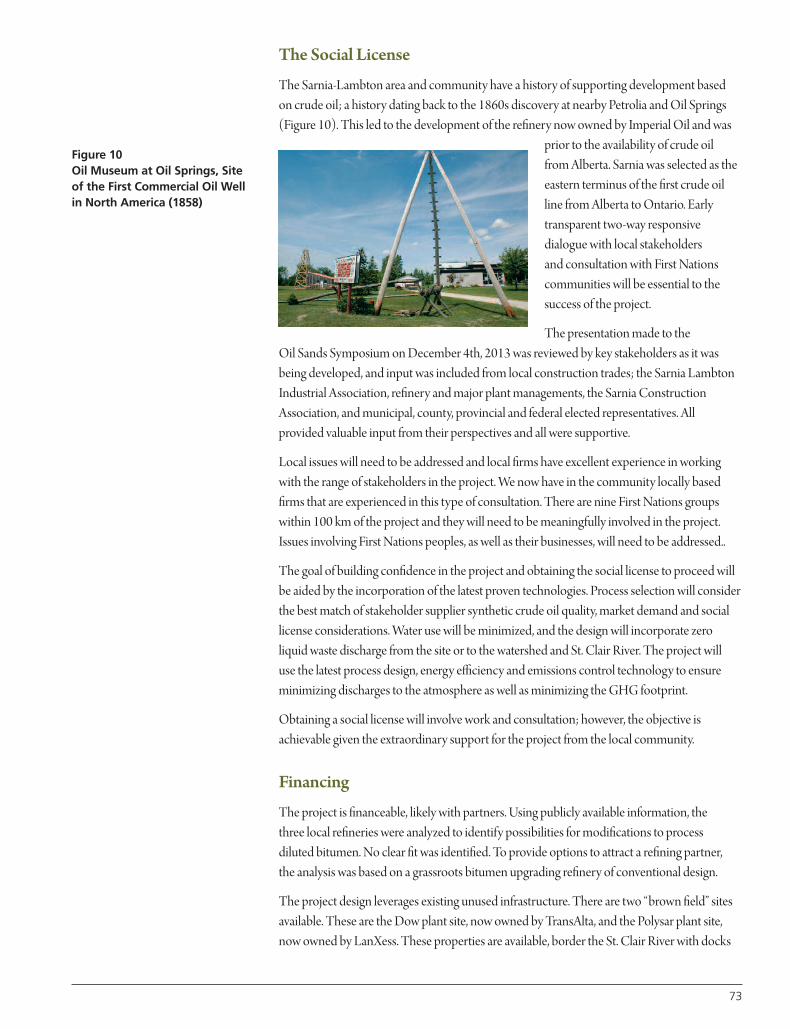
The Social License
The Sarnia-Lambton area and community have a history of supporting development based on crude oil; a history dating back to the 1860s discovery at nearby Petrolia and Oil Springs(Figure 10). This led to the development of the refinery now owned by Imperial Oil and was
prior to the availability of crude oil from Alberta. Sarnia was selected as theeastern terminus of the first crude oilline from Alberta to Ontario. Earlytransparent two-way responsivedialogue with local stakeholders and consultation with First Nationscommunities will be essential to thesuccess of the project.
The presentation made to the Oil Sands Symposium on December 4th, 2013 was reviewed by key stakeholders as it wasbeing developed, and input was included from local construction trades; the Sarnia LambtonIndustrial Association, refinery and major plant managements, the Sarnia ConstructionAssociation, and municipal, county, provincial and federal elected representatives. Allprovided valuable input from their perspectives and all were supportive.
Local issues will need to be addressed and local firms have excellent experience in workingwith the range of stakeholders in the project. We now have in the community locally basedfirms that are experienced in this type of consultation. There are nine First Nations groupswithin 100 km of the project and they will need to be meaningfully involved in the project.Issues involving First Nations peoples, as well as their businesses, will need to be addressed..
The goal of building confidence in the project and obtaining the social license to proceed willbe aided by the incorporation of the latest proven technologies. Process selection will considerthe best match of stakeholder supplier synthetic crude oil quality, market demand and sociallicense considerations. Water use will be minimized, and the design will incorporate zeroliquid waste discharge from the site or to the watershed and St. Clair River. The project will use the latest process design, energy efficiency and emissions control technology to ensureminimizing discharges to the atmosphere as well as minimizing the GHG footprint.
Obtaining a social license will involve work and consultation; however, the objective isachievable given the extraordinary support for the project from the local community.
Financing
The project is financeable, likely with partners. Using publicly available information, the three local refineries were analyzed to identify possibilities for modifications to process diluted bitumen. No clear fit was identified. To provide options to attract a refining partner, the analysis was based on a grassroots bitumen upgrading refinery of conventional design.
The project design leverages existing unused infrastructure. There are two “brown field” sitesavailable. These are the Dow plant site, now owned by TransAlta, and the Polysar plant site,now owned by LanXess. These properties are available, border the St. Clair River with docks
73
Figure 10Oil Museum at Oil Springs, Siteof the First Commercial Oil Wellin North America (1858)

74
still in place, and have utilities readily available. Nova Chemicals is converting its Corunnapetrochemical refinery to ethane and propane feed stocks from the Marcellus shale fields. This leaves crude oil atmospheric and vacuum distillation towers unused, along with crude oilpipelines and onsite storage It also leaves multiple pipelines connecting to the Shell andSuncor refineries, the LanXess site, and to product pipelines to markets, all unused. Access tounderground salt cavern storage is also available. It is assumed that a new facility will makeoptimal use of this infrastructure.
The design elements for the upgrader refinery include a feed stream of 150,000 BPCD ofdiluted bitumen (dilbit) with 30% diluent, and 70% bitumen. Additionally, a number ofprocess units would be required. These include an Atmospheric and Vacuum Distillation unit,Coker and Hydrocracking units. A Hydrogen Plant would be required, together with aSulphuric Acid Alkylation unit, Intermediate and Product Hydrotreaters, and units for BTXextraction and Isomerization. A Catalytic Reformer unit would be required, as well as a GasPlant and Sulphur Recovery unit.
Product streams that would be produced by the project include:
a. 9,000 BPCD Liquified Petroleum gases
b. 5,000 BPCD Jet Fuel
c. 7,000 BPCD Aromatic solvents (BTX)
d. 70,000 BPCD Gasoline
e. 44,000 BPCD Low Sulphur Diesel
f. 1300 BPCD Heavy Fuel Oil
g. 600 TPD Sulphur
h. 2,900 TPD Petroleum Coke
i. Gasoline/Diesel (G/D) ratio: 1.5
The Capital Cost Estimate, Class 5 Magnitude, equates to $8.6 billion in Canadian funds. Fordiscussion purposes, a CAPEX of $10 billion Canadian funds has been assumed. The estimateis based upon current Greenfield site, process unit capacity factored estimates, and a Sarnia/US. Gulf Coast cost ratio of 1.33. A contingency of 30% has been factored, as well as aCanadian/ US rate of exchange of $1.05.
No detailed feasibility studies have been undertaken to date. It was recognized that thecombination of partners in the project would undertake their own feasibility studies todetermine the optimum design, considering their supply and marketing positions and theirperspective on design considerations needed to obtain the social contract for the facility. Thisbasic design is well understood by refiners, and represents an understandable starting point.
Value-Added Capture
Using an assumed input of 150,000 BPCD of dilbit and the refinery configuration andproduct slate outlined above, a value added calculation can be easily projected. The first step is to assume a West Texas Intermediate (WTI) crude oil price of $100 per BBL. If the dilutedbitumen is sold to a US Gulf Coast refinery, there is a pipeline transportation cost of $7.35 perBBL. There is also a quality differential which has varied from time to time, and which has
been assumed as $20 per BBL, based upon the IHS CERA study Alberta Upgrading, March2013, Table 2, and multiple other studies. This gives a netback to Hardisty, AB of $73.65 perBBL. The Enbridge Pipeline transportation tariff from Hardisty to Sarnia is $5.50 per BBL,which lands the dilbit mix in Sarnia at an input cost of $78.15 per BBL. The weighted averagenetback of the product slate yielded by the refinery design, based on an analysis done by theBowman Centre for 2011 is $123.98 per BBL. This gives a value added capture of $45.83 perBBL or $2.5 billion per year, or over $62 billion over $25 years.
The export potential of this project is significant to Canada11. Refined products exports fromthis refinery upgrader would be valued at over $6 billion Canadian funds, or 1.5% of the total2012 Canadian products exported valued at over $400 billion. This would also correspond to30% of total 2012 Canadian refined product export of over $20 billion.
The Path Forward
T here will be eleven Alberta bitumen producers coming on stream between 2018and 2025, with a total production of over 1.5 million BPCD. An initial analysissuggests that participation in a Sarnia-Lambton Upgrader might fit the interests
of seven of these companies, totaling over 1.2 million BPCD of bitumen production.
A corporate champion, however, is required for the Sarnia-Lambton Upgrader. Ideally thechampion would be an experienced refiner that knows how to build and operate refineries and is experienced in marketing the products, ideally with a PADD 2 market position.
The energy world is dominated by super international oil companies, and national oilcompanies like Total, Statoil, Aramco, Pemex, Petrobras, IPIC, and YPF to name a few. Canada,Alberta and Ontario need to be involved and supportive of the project to help to level theplaying field.
There are many levers that government partners can pull to enable financing. One verypromising lever is BRIK (Alberta Bitumen Royalty In Kind) barrels to support worthyprojects. The NW Upgrader project has a commitment of BRIK barrels for 30 years, while theAlberta Petroleum Marketing Commission has committed barrels to the TransCanada EnergyEast project for 20 years.
A financial feasibility study is the next step for this project. The Bowman Centre is followingthe “Call to Action” to proactively take this business case to potential corporate partners to tryto convert this into a feasibility study that fits with the partners’ business interests.
The creation of a bitumen upgrader refinery in Sarnia-Lambton is one of the “big picture, bigproject” undertakings that can begin to recharge Canada’s pursuit of recapturing our nationalimage as a sustainable energy powerhouse.
Sarnia-Lambton was there at the beginning of North America’s oil industry. The men of theAamjiwnaang First Nation saw it first, seeping from the sticky gum beds near Oil Spring’sBlack Creek. This was followed by the continent’s first oil wells, and the construction ofSarnia’s Chemical Valley, where the oil refineries and production of synthetic rubber helped tolead the Allies to victory in WW II. The people of Sarnia-Lambton are ready, willing, and ableonce again to do their part in this new national quest.
75
11Patricia Mohr, Vice President, Scotia
Bank, Canada’s Merchant Trade in
Oil & Gas 2012
Clement Bowman, C.M., PhD, PEng, HCIC, FCAE: Founder, The Bowman Centre for Technology
Commercialization; Past Chairperson of the Alberta Oil Sands Technology and Research Authority
(AOSTRA)
Walter F. Petryschuk, PhD, PEng, FCIC, FCAE: Associate, The Bowman Centre for Technology
Commercialization; Retired – Manager, Suncor Sarnia; Retired – Sarnia Site Manager, Polysar Ltd.
Bruce Cater: Retired – Refinery Economics, Suncor
Kirk M. Wilson: Retired – Senior Vice President and Head of Bayer Technology Services Americas,
Bayer Business and Technology Services, LLC.
Ed Brost: President, JE&M Consulting Ltd.
Terrence Hoffman, PhD, FCIC, FEIC: Emeritus Professor of Chemical Engineering, McMaster
University; Retired – Principal Chemical Engineer, Polysar Ltd.; Retired – Senior R&D Technology
Leader, Polysar Ltd.
Larry MacDonald: Retired – CFO, Nova Chemicals
Co-Authors and Support Team
Donald E. Wood, B.Sc. (RMC), B.A.Sc. (U of Toronto), is Associate and Advisory Board member of
the Sarnia-based Bowman Centre, and is president of his own consulting firm. He has had 45
years experience in the energy and petrochemical industries, including natural gas utility (Union
Gas), petrochemical refinery restructuring (Polysar Limited, retired Vice President Logistics and
Business Development), greenhouse gas capture, conversion and management (Marsulex, retired
senior operating Vice President), merger and acquisitions (15 M&A projects completed). His efforts
in the Sarnia-Lambton region have helped medium-sized organizations assess strategic alternatives.
On a broader front, he has acted on behalf of owners and been involved within many mergers,
joint venture establishments, divestitures and acquisitions, and acquisition integrations.
Biography
76
APMC .............Alberta Petroleum Marketing
Commission
BBL .................Barrel (oil barrel)
BPD .................Barrel (oil) per day
BPCD ..............Barrels (oil) per Calendar Day
BRENT/ICE........Brent/Intercontinental Exchange
(European)
BRIK ................Bitumen Royalty In Kind
BTX..................Benzene, Toluene and Xylene
CAPEX ............Capital Expense
CN ..................Canadian National (rail)
COSIA .............Canadian Oil Sands Innovation
Alliance
Dilbit ...............Diluted bitumen (diluted with
naphtha or similar light
hydrocarbon)
DHT ................Distillate Hydrotreater
EBITDA ............Earnings Before Interest, Taxes,
Depreciation and Amortization
EIA...................Energy Information
Administration (US)
FCC .................Fluidized Catalytic Cracking
G/D..................Gasoline to Distillate (ratio)
HRSG ..............Heat Recovery Steam Generator
ISBL..................Inside Battery Limit
LPG .................Liquefied Petroleum Gas
LTPD.................Long Ton per Day
MBPD .............Thousand Barrels per Day (“M”
refers to 1000 in Imperial system
MTD ................Metric Tonne per Day
NGL ................Natural Gas Liquids
NWU ...............Northweast Upgrader
OSBL................Outside Battery Limit
OPEX ..............Operating Expense
PADD ..............Petroleum Administration
Defense District
ROI .................Return on Investment
PSA..................Pressure Swing Absorber
Synbit .............Bitumen diluted with synthetic
crude oil
TCPL ...............Trans Canada Pipelines Ltd.
YTD ................Year to date
TPD..................Ton (Tonne) per day
UDEX ...............Union Dow Extractor
USGC ..............United States Gulf Coast
WCS ................Western Canadian Synthetic
WTI..................West Texas Intermediate
List of Abbreviations
77
ABSTRACT
The first oil discovery was made on the Grand Banks in 1979 and
the first oil development project commenced in 1990. Since then the
offshore oil and gas industry has, at an increasing pace, transformed
the Newfoundland and Labrador economy. It has not simply provided
government revenues and an additional economic sector, but has
delivered: new industrial investment and capabilities, training and
education, increased business confidence, innovation and
entrepreneurship, and success working in other industries and other
markets at local, national and international levels. This chapter
summarizes the growth of the offshore oil and gas industry in
Newfoundland and Labrador, describes its effects on the economy, and
then outlines industry-related initiatives in the areas of infrastructure,
education, training and R&D. This is followed by a description of the
ways in which a number of Newfoundland and Labrador companies
have prospered through work in this very demanding industry.
This chapter provides a dramatic and ongoing case study of the effects
of megaprojects on one province, and thereby on Canada as a whole.
Dependent as it was on the confluence of natural resource potential,
private-sector enterprise and investment, and strategic government
support for, and leveraging of, the economic benefits from industrial
development, it is an excellent example of the creation of a high
value-added innovation ecosystem from “big projects,” resulting in
the transformation of the economy and society of the host region.
The Case of the Dramatic Emergence ofNewfoundland & Labrador’s Petroleum Industry Mark Shrimpton
5
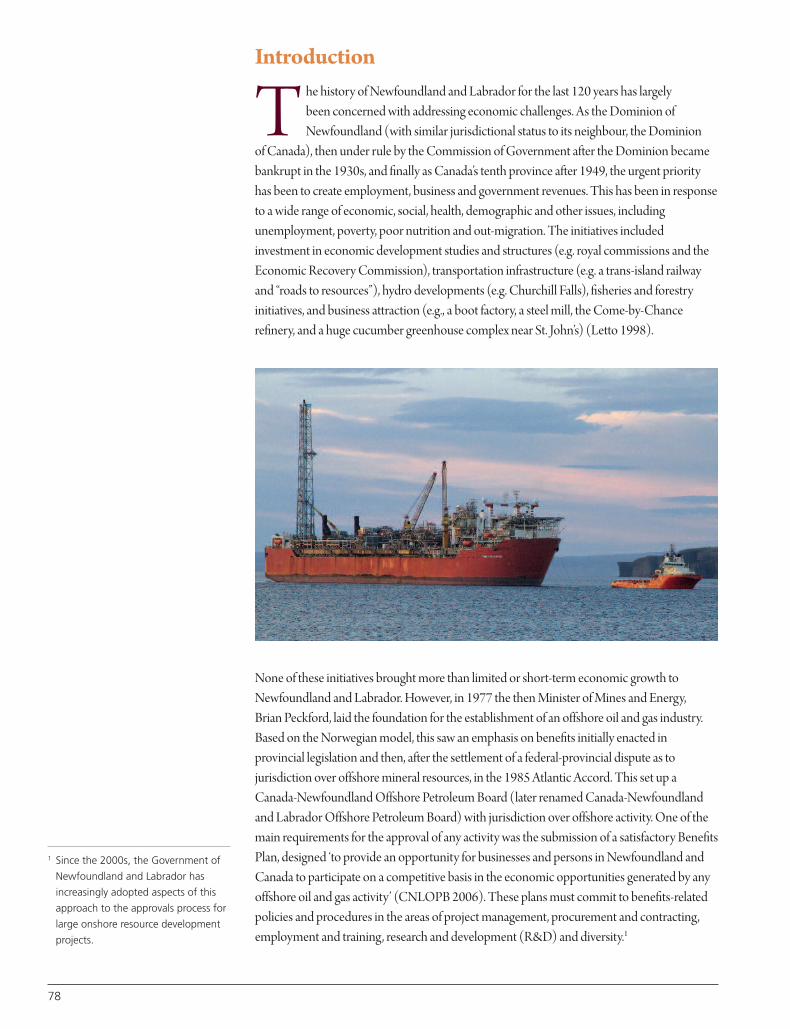
Introduction
T he history of Newfoundland and Labrador for the last 120 years has largely been concerned with addressing economic challenges. As the Dominion ofNewfoundland (with similar jurisdictional status to its neighbour, the Dominion
of Canada), then under rule by the Commission of Government after the Dominion becamebankrupt in the 1930s, and finally as Canada’s tenth province after 1949, the urgent priorityhas been to create employment, business and government revenues. This has been in responseto a wide range of economic, social, health, demographic and other issues, includingunemployment, poverty, poor nutrition and out-migration. The initiatives includedinvestment in economic development studies and structures (e.g. royal commissions and theEconomic Recovery Commission), transportation infrastructure (e.g. a trans-island railwayand “roads to resources”), hydro developments (e.g. Churchill Falls), fisheries and forestryinitiatives, and business attraction (e.g., a boot factory, a steel mill, the Come-by-Chancerefinery, and a huge cucumber greenhouse complex near St. John’s) (Letto 1998).
None of these initiatives brought more than limited or short-term economic growth toNewfoundland and Labrador. However, in 1977 the then Minister of Mines and Energy, Brian Peckford, laid the foundation for the establishment of an offshore oil and gas industry.Based on the Norwegian model, this saw an emphasis on benefits initially enacted inprovincial legislation and then, after the settlement of a federal-provincial dispute as tojurisdiction over offshore mineral resources, in the 1985 Atlantic Accord. This set up aCanada-Newfoundland Offshore Petroleum Board (later renamed Canada-Newfoundlandand Labrador Offshore Petroleum Board) with jurisdiction over offshore activity. One of themain requirements for the approval of any activity was the submission of a satisfactory BenefitsPlan, designed ‘to provide an opportunity for businesses and persons in Newfoundland andCanada to participate on a competitive basis in the economic opportunities generated by anyoffshore oil and gas activity’ (CNLOPB 2006). These plans must commit to benefits-relatedpolicies and procedures in the areas of project management, procurement and contracting,employment and training, research and development (R&D) and diversity.1
78
1 Since the 2000s, the Government of
Newfoundland and Labrador has
increasingly adopted aspects of this
approach to the approvals process for
large onshore resource development
projects.

The first oil discovery was made on the Grand Banks in 1979 and the first oil developmentproject commenced in 1990. Since then, the offshore oil and gas industry has, at an increasingpace, transformed the Newfoundland and Labrador economy. It has not simply providedgovernment revenues and an additional economic sector, but has delivered: new industrialinvestment and capabilities; increased business confidence, innovation and entrepreneurship;training and education; and success working in other industries and other markets at local,national and international levels. As such, the offshore oil and gas industry provides a dramaticand ongoing case study of the effects of megaprojects on one province, and thereby on Canadaas a whole.
This chapter summarizes the growth of the offshore oil and gas industry on Newfoundlandand Labrador and goes on to describe its effects on the economy and on industry-relatedinitiatives in the areas of infrastructure, education and training infrastructure, and R&D. This is followed by a series of case studies of Newfoundland and Labrador companies that haveworked within the industry. Much of the material is drawn from studies of Newfoundland andLabrador’s socio-economic benefits from the petroleum industry between 1999 and 2002(Community Resource Services Ltd. 2003), 2003 and 2004 ( Jacques Whitford 2005), 2005and 2007 (Stantec 2009) and especially 2008 and 2010 (Stantec 2012). The preparation of anupdate for the 2010-2012 period is in progress.
It should be noted that the focus here is on the effects of offshore oil and gas activity itself; this chapter does not document the taxes and royalties the industry pays (for example, a totalpayment of $2.4 billion to the Government of Newfoundland and Labrador in the 2010-2011fiscal year) or the major financial contributions oil companies make to local charities andcommunity groups.
The Growth of the Offshore Oil and Gas Industry
O ffshore petroleum activity in Newfoundland and Labrador began in 1963, and thefirst exploration well was drilled in 1966. In the 50 years that have followed thisinitial work, the industry has experienced fluctuating levels of exploration,
development and production activity. In the first case, the pace of exploration has differed inresponse to varying levels of success, changing oil prices, and the availability of governmentsupport (e.g. federal Petroleum Incentive Plan grants in the 1970s). Exploration, includingboth drilling and seismic activity, peaked in the early-1980s, with minor other peaks in themid-1990s and late 2000s. This exploration led to the discovery of the Hibernia oilfield in1979, the Hebron field in 1981, and the Terra Nova and White Rose fields in 1984.
However, the first development activity did not occur until 1990, after the HiberniaDevelopment Agreement was signed between Mobil Oil, its partners, and the federal andprovincial governments. Because of low oil prices at the time, the development of the Hiberniafield was not commercial; the Government of Canada intervened to facilitate the developmentof the Hibernia project and hence new industry as an economic development initiative. Theagreement involved a federal contribution of $1 billion and loan guarantees. The federalgovernment subsequently took an 8.5% working interest in Hibernia, after Gulf Oil had towithdraw. This stake, held by the Canada Hibernia Holding Corporation, has proved to be avery remunerative federal investment.
79

80
Since then, three major Grand Banks oilfields have been successfully developed:
• Hibernia: The approximately $5.2-billion development of this field by Mobil Oil (nowExxonMobil), including the construction of a concrete gravity based structure (GBS) andsome topsides components at Bull Arm, Trinity Bay, started in 1990. The GBS and topsideswere mated in early 1997, and the complete platform was towed to the field in time for firstoil production in November 1997.
• Terra Nova: In 1998, Petro-Canada (now Suncor) decided to develop the Terra Nova fieldusing a floating production storage and offloading (FPSO) vessel with a South Korean-builthull, but with much of the topsides fabrication and installation occurring at Bull Arm. TheFPSO arrived at the field in August 2001 and produced first oil in January 2002. The totalTerra Nova pre-production capital expenditures were approximately $2.8 billion.
• White Rose: Husky Energy’s work developing this field started in 2002. Like Terra Nova,White Rose uses an FPSO with a hull built in South Korea. However, much of the topsidesfabrication and installation work occurred in Marystown, Placentia Bay, while somefabrication work and the testing of some sub-sea components took place at Bull Arm. Theproject had a total capital cost of approximately $2.35 billion and first oil was produced inlate 2005.
A fourth major oilfield and a satellite field are currently under development. The constructionof ExxonMobil’s Hebron GBS and topsides began at Bull Arm in 2013, with an estimated totalcost of $14 billion. Production is targeted to commence in 2017 and expected to continueuntil at least 2047. Work on Husky Energy’s $2.3 billion White Rose Extension Project, whichwill see the first North American use of a concrete well-head platform, recently started nearPlacentia in Eastern Newfoundland. The presence of this structure in the field will reduce the drilling and production costs, and thus increase the viability of various other satellitedevelopments in the White Rose area. The fact that the graving dock for the platformconstruction is designed to be reusable would reduce the costs of any future similar well-head platforms.
The satellite field developments, such as North Amethyst (a satellite of the Husky’s WhiteRose field) and Hibernia South (a satellite of the ExxonMobil Hibernia field), are often almost overlooked as components of Newfoundland and Labrador industry growth. The $1.3-billion North Amethyst development provides an example of how such a project canresult in substantial benefits to the local industry. In addition to exceeding original estimates of1.6 million person-hours taking place in Newfoundland and Labrador, all subsea engineeringtook place within the province. It is also noteworthy that, with less than four years betweendiscovery and development, the North Amethyst project saw a drastic reduction fromprevious development timelines in the province.
The growth in the scale of total oil industry expenditures in Newfoundland and Labrador, as shown in Figure 1, has been impressive. Fluctuating exploration figures have beensupplemented, post-1990, with very large but similarly variable development spending toconstruct and commission offshore facilities. Since 1997, production-related expenditureshave seen a steady and relatively predictable increase. Total expenditures rose to a record$2.36 billion in 2011 and then jumped again to $2.89 billion, including $1.68 billion inproduction expenditures, in 2012.
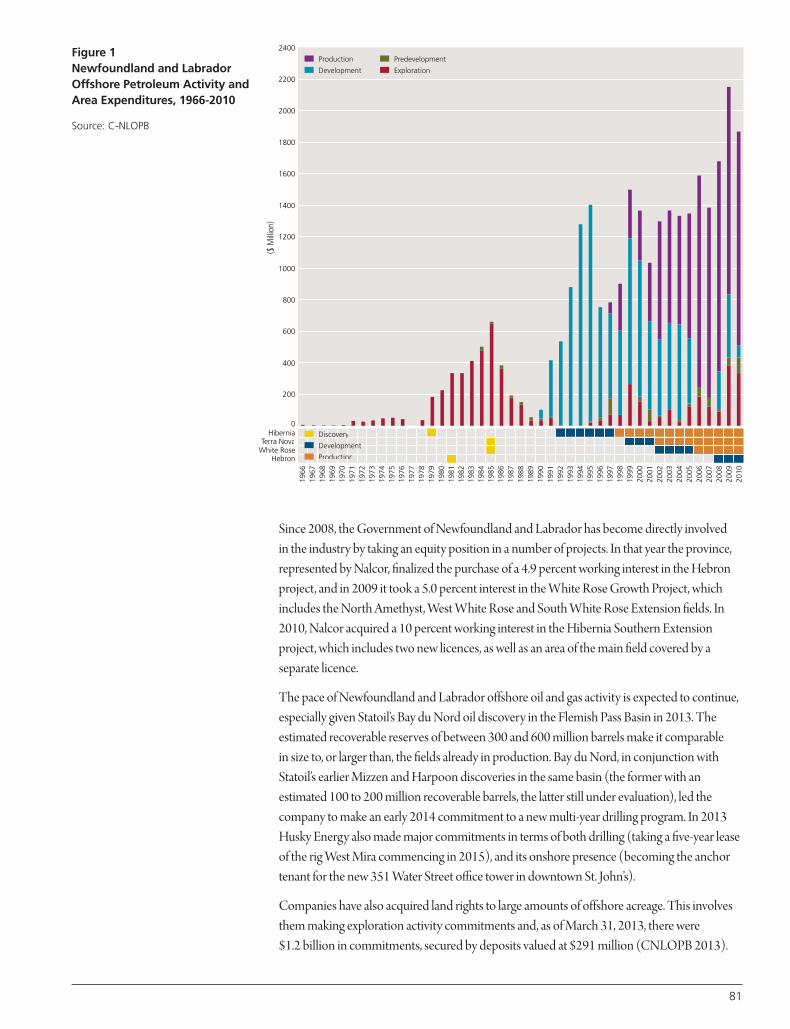
Since 2008, the Government of Newfoundland and Labrador has become directly involved in the industry by taking an equity position in a number of projects. In that year the province,represented by Nalcor, finalized the purchase of a 4.9 percent working interest in the Hebronproject, and in 2009 it took a 5.0 percent interest in the White Rose Growth Project, whichincludes the North Amethyst, West White Rose and South White Rose Extension fields. In2010, Nalcor acquired a 10 percent working interest in the Hibernia Southern Extensionproject, which includes two new licences, as well as an area of the main field covered by aseparate licence.
The pace of Newfoundland and Labrador offshore oil and gas activity is expected to continue,especially given Statoil’s Bay du Nord oil discovery in the Flemish Pass Basin in 2013. Theestimated recoverable reserves of between 300 and 600 million barrels make it comparable in size to, or larger than, the fields already in production. Bay du Nord, in conjunction withStatoil’s earlier Mizzen and Harpoon discoveries in the same basin (the former with anestimated 100 to 200 million recoverable barrels, the latter still under evaluation), led thecompany to make an early 2014 commitment to a new multi-year drilling program. In 2013Husky Energy also made major commitments in terms of both drilling (taking a five-year leaseof the rig West Mira commencing in 2015), and its onshore presence (becoming the anchortenant for the new 351 Water Street office tower in downtown St. John’s).
Companies have also acquired land rights to large amounts of offshore acreage. This involvesthem making exploration activity commitments and, as of March 31, 2013, there were$1.2 billion in commitments, secured by deposits valued at $291 million (CNLOPB 2013).
81
Figure 1Newfoundland and LabradorOffshore Petroleum Activity andArea Expenditures, 1966-2010
Source: C-NLOPB
Development
oduction
n
ouco
Discovery
Development
d ti
1200
1400
1600
1800
2000
2200
2010
2009
2008
2007
2006
2005
2004
2003
2002
2001
2000
1999
1998
1997
1996
1995
1994
1993
1992
1991
1990
1989
1988
1987
1986
1985
1984
1983
1982
1981
1980
1979
1978
1977
1976
1975
1974
1973
1972
1971
1970
1969
1968
1967
1966
2400
($ M
illio
n)
oductionPr Pr
onHebrWhite Rose
erra NovaTTerra NovaniaHiber
0
200
400
600
800
1000
Pr
mov
P
Development
Discoveryyvs
edevelopment
Exploration

In June 2013, Scott Tessier, Chair of the CNLOPB, indicated that the Board was expecting a33% increase in the number of applications for approvals and authorizations in 2013, makingit the busiest year on record, with a further approximate 25% increase expected in 2014.
It is worth noting that the industry is also looking at using Newfoundland and Labrador as a centre for activity in more northerly and Arctic waters, an area of increasing interest to the oil industry given large reserve estimates and the shrinking of the ice surface. For example,Husky Energy is using St. John’s as the operational centre for its exploration work in Western Greenland.
Economic Benefits
T otal offshore petroleum industry expenditures (i.e., capital plus operating costs) in Newfoundland and Labrador over the 2002-2010 period peaked at $2.2 billionin 2009, comprised of over $1.4 billion in capital costs and over $0.7 billion in
operating costs. Operating costs have generally grown steadily, from $230 to $280 millionbetween 2002 and 2005, $600 to $620 million in 2006 and 2007, and about $700 millionfrom 2008 to 2010. As was noted above, total expenditures reached a record $2.89 billion in 2012.
A substantial portion of the local benefits from the offshore petroleum industry activityaccrues to companies providing goods and services to oil companies. On average, theseindirect linkages account for total annual direct and indirect nominal GDP impacts ofapproximately $7.6 billion, and annual direct and indirect employment impacts averagingapproximately 9,200 person-years.
Data on direct and indirect economic impacts provide key inputs to simulations of the overall effects of the offshore petroleum industry on the economy of the province, using theDepartment of Finance’s Newfoundland and Labrador Econometric Model (NALEM)(Table 1).
Over the 2002-2010 period, the GDP impacts (i.e. the business and labour income earnedwithin the geographic boundaries of the province) increased steadily to a peak in 2008 andthen decreased sharply from 28.3 percent of the total GDP (Real GDP chained) to 25.1percent in 2010 as a result of the global economic downturn. Aside from these impacts, theoverall pattern of change in total impacts reflects the increased development activity andrelatively stable production costs.
Much of the business income earned in Newfoundland and Labrador’s offshore petroleumindustry accrues to non-resident companies. Therefore, business income directly related to the industry generally would not accrue to residents and is not reflected in the personalincome impact. Personal income impacts, primarily wages and salaries, reflect only incomereceived by provincial residents. Consequently, the personal income impacts are smaller than the GDP impacts.
Personal income from the offshore petroleum industry was $955 million per year higherduring the 2002-2010 period and represented 6.7 percent of total personal income inNewfoundland and Labrador. Personal income from the industry declined between 2004
82
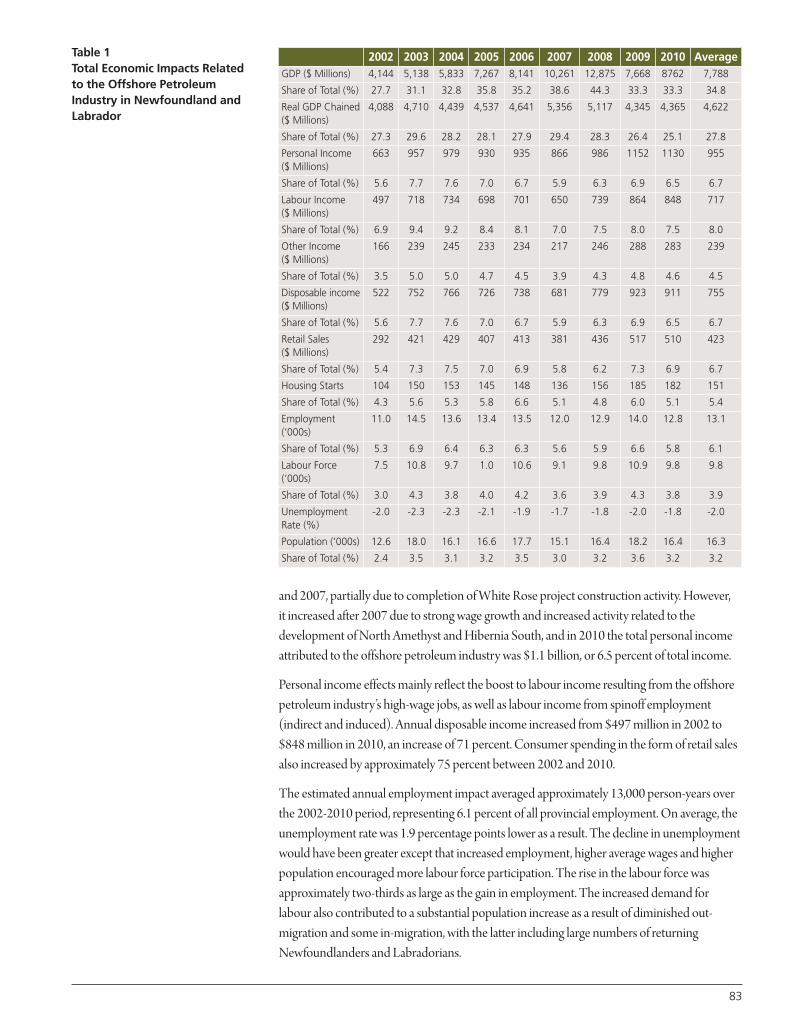
and 2007, partially due to completion of White Rose project construction activity. However, it increased after 2007 due to strong wage growth and increased activity related to thedevelopment of North Amethyst and Hibernia South, and in 2010 the total personal incomeattributed to the offshore petroleum industry was $1.1 billion, or 6.5 percent of total income.
Personal income effects mainly reflect the boost to labour income resulting from the offshorepetroleum industry’s high-wage jobs, as well as labour income from spinoff employment(indirect and induced). Annual disposable income increased from $497 million in 2002 to$848 million in 2010, an increase of 71 percent. Consumer spending in the form of retail salesalso increased by approximately 75 percent between 2002 and 2010.
The estimated annual employment impact averaged approximately 13,000 person-years overthe 2002-2010 period, representing 6.1 percent of all provincial employment. On average, theunemployment rate was 1.9 percentage points lower as a result. The decline in unemploymentwould have been greater except that increased employment, higher average wages and higherpopulation encouraged more labour force participation. The rise in the labour force wasapproximately two-thirds as large as the gain in employment. The increased demand forlabour also contributed to a substantial population increase as a result of diminished out-migration and some in-migration, with the latter including large numbers of returningNewfoundlanders and Labradorians.
83
Table 1Total Economic Impacts Relatedto the Offshore PetroleumIndustry in Newfoundland andLabrador
2002 2003 2004 2005 2006 2007 2008 2009 2010 AverageGDP ($ Millions) 4,144 5,138 5,833 7,267 8,141 10,261 12,875 7,668 8762 7,788
Share of Total (%) 27.7 31.1 32.8 35.8 35.2 38.6 44.3 33.3 33.3 34.8
Real GDP Chained($ Millions)
4,088 4,710 4,439 4,537 4,641 5,356 5,117 4,345 4,365 4,622
Share of Total (%) 27.3 29.6 28.2 28.1 27.9 29.4 28.3 26.4 25.1 27.8
Personal Income ($ Millions)
663 957 979 930 935 866 986 1152 1130 955
Share of Total (%) 5.6 7.7 7.6 7.0 6.7 5.9 6.3 6.9 6.5 6.7
Labour Income ($ Millions)
497 718 734 698 701 650 739 864 848 717
Share of Total (%) 6.9 9.4 9.2 8.4 8.1 7.0 7.5 8.0 7.5 8.0
Other Income ($ Millions)
166 239 245 233 234 217 246 288 283 239
Share of Total (%) 3.5 5.0 5.0 4.7 4.5 3.9 4.3 4.8 4.6 4.5
Disposable income($ Millions)
522 752 766 726 738 681 779 923 911 755
Share of Total (%) 5.6 7.7 7.6 7.0 6.7 5.9 6.3 6.9 6.5 6.7
Retail Sales($ Millions)
292 421 429 407 413 381 436 517 510 423
Share of Total (%) 5.4 7.3 7.5 7.0 6.9 5.8 6.2 7.3 6.9 6.7
Housing Starts 104 150 153 145 148 136 156 185 182 151
Share of Total (%) 4.3 5.6 5.3 5.8 6.6 5.1 4.8 6.0 5.1 5.4
Employment(‘000s)
11.0 14.5 13.6 13.4 13.5 12.0 12.9 14.0 12.8 13.1
Share of Total (%) 5.3 6.9 6.4 6.3 6.3 5.6 5.9 6.6 5.8 6.1
Labour Force(‘000s)
7.5 10.8 9.7 1.0 10.6 9.1 9.8 10.9 9.8 9.8
Share of Total (%) 3.0 4.3 3.8 4.0 4.2 3.6 3.9 4.3 3.8 3.9
UnemploymentRate (%)
-2.0 -2.3 -2.3 -2.1 -1.9 -1.7 -1.8 -2.0 -1.8 -2.0
Population (‘000s) 12.6 18.0 16.1 16.6 17.7 15.1 16.4 18.2 16.4 16.3
Share of Total (%) 2.4 3.5 3.1 3.2 3.5 3.0 3.2 3.6 3.2 3.2
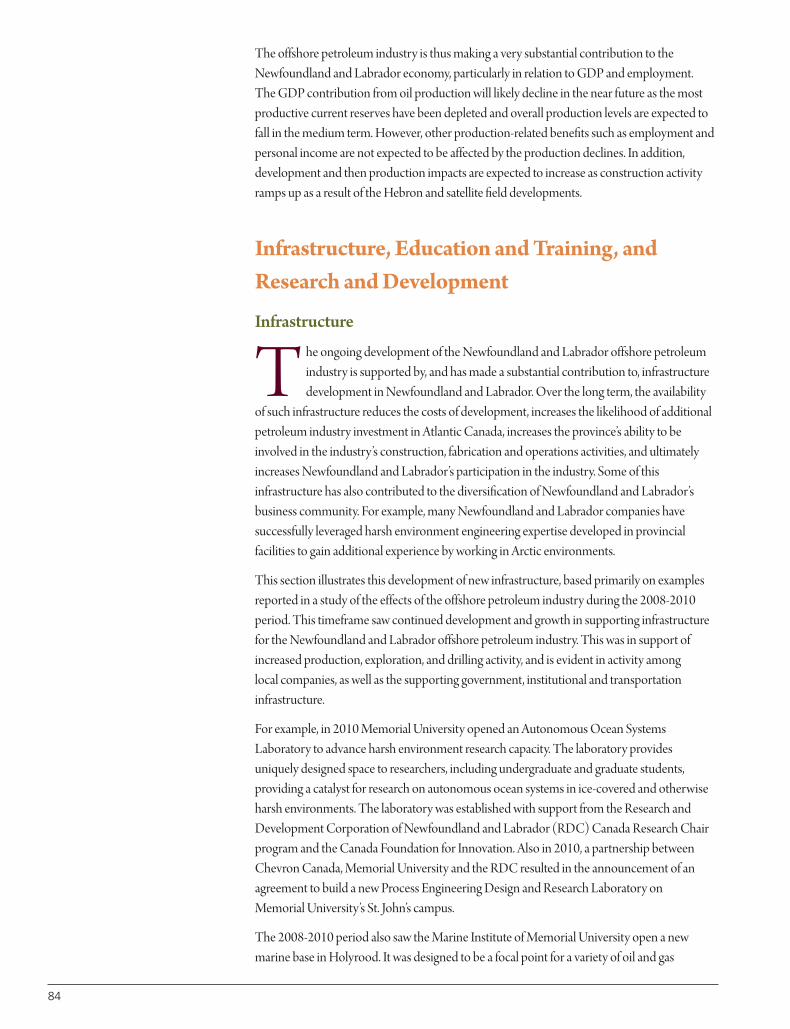
84
The offshore petroleum industry is thus making a very substantial contribution to theNewfoundland and Labrador economy, particularly in relation to GDP and employment. The GDP contribution from oil production will likely decline in the near future as the mostproductive current reserves have been depleted and overall production levels are expected tofall in the medium term. However, other production-related benefits such as employment andpersonal income are not expected to be affected by the production declines. In addition,development and then production impacts are expected to increase as construction activityramps up as a result of the Hebron and satellite field developments.
Infrastructure, Education and Training, andResearch and Development
Infrastructure
T he ongoing development of the Newfoundland and Labrador offshore petroleumindustry is supported by, and has made a substantial contribution to, infrastructuredevelopment in Newfoundland and Labrador. Over the long term, the availability
of such infrastructure reduces the costs of development, increases the likelihood of additionalpetroleum industry investment in Atlantic Canada, increases the province’s ability to beinvolved in the industry’s construction, fabrication and operations activities, and ultimatelyincreases Newfoundland and Labrador’s participation in the industry. Some of thisinfrastructure has also contributed to the diversification of Newfoundland and Labrador’sbusiness community. For example, many Newfoundland and Labrador companies havesuccessfully leveraged harsh environment engineering expertise developed in provincialfacilities to gain additional experience by working in Arctic environments.
This section illustrates this development of new infrastructure, based primarily on examplesreported in a study of the effects of the offshore petroleum industry during the 2008-2010period. This timeframe saw continued development and growth in supporting infrastructurefor the Newfoundland and Labrador offshore petroleum industry. This was in support ofincreased production, exploration, and drilling activity, and is evident in activity among local companies, as well as the supporting government, institutional and transportationinfrastructure.
For example, in 2010 Memorial University opened an Autonomous Ocean SystemsLaboratory to advance harsh environment research capacity. The laboratory providesuniquely designed space to researchers, including undergraduate and graduate students,providing a catalyst for research on autonomous ocean systems in ice-covered and otherwiseharsh environments. The laboratory was established with support from the Research andDevelopment Corporation of Newfoundland and Labrador (RDC) Canada Research Chairprogram and the Canada Foundation for Innovation. Also in 2010, a partnership betweenChevron Canada, Memorial University and the RDC resulted in the announcement of anagreement to build a new Process Engineering Design and Research Laboratory on Memorial University’s St. John’s campus.
The 2008-2010 period also saw the Marine Institute of Memorial University open a newmarine base in Holyrood. It was designed to be a focal point for a variety of oil and gas
industry-related research and educational activities, including such areas as ocean technology,fisheries, marine environment, diving, offshore safety and survival, oil spill response,oceanography and marine biology. The same period saw the Marine Institute purchase newocean-mapping equipment in support of its ocean technology programs. The equipment,including multi-beam sonar, a sub-bottom profile, will support programs such as the new jointDiploma of Technology/Bachelor of Technology in Ocean Mapping and enable the MarineInstitute to conduct applied research in ocean mapping. Applications include determiningpipeline routes for offshore oil production and identifying safer routes for vessel traffic. In2010, the Marine Institute purchased a wave piercing catamaran, the MV Atlanticat, to providea marine platform to deploy research equipment. This vessel was funded through a $1.5-million investment from the provincial government and Memorial University, and hasincreased research and training capacity for the Marine Institute.
The period also saw continued private-sector investment in infrastructure. For example,Pennecon Energy Marine Base invested more than $3.5 million in infrastructure developmentat its Bay Bulls facility. In addition to the installation of a concrete caisson that expanded itsdock space from 60 m to 90 m, Pennecon increased warehouse space by approximately 1,021 m2 (11,000 ft2) and expanded its secure laydown area.
Education and Training
The 2008-2010 period saw further advances in education and training, in addition to theinfrastructure investments described above. For example, C-CORE, a separately incorporatedresearch and development (R&D) corporation at Memorial University specializing in coldoceans engineering, matched funding from the provincial government’s Department ofIndustry, Trade and Rural Development to provide work-terms and internships to newgraduates pursuing careers in geotechnical engineering. In total, C-CORE employed 33 work-term and other undergraduate students and the organization’s total 2008-2010 investment instudents was $323,429. C-CORE’s contribution to develop the province’s base of expertise inthis field also extended to a partnership with Memorial University to cost-share a Chair inGeotechnical Engineering, allowing Memorial University to attract a senior Professor to theprovince to develop new academic programs within the Faculty of Engineering.
Undergraduate enrollment in the Faculty of Engineering and Applied Science at MemorialUniversity grew steadily over the study period, with 1,039 students in 2008, 1,128 in 2009 and 1,203 in 2010. During this period, the Faculty awarded 480 undergraduate engineeringdegrees and there was a rapid increase in the number of graduate students, many engaged inpetroleum industry-related work. Approximately 400 Memorial co-op students are placedwith oil and gas companies each year. These are mostly engineering students, but also includebusiness students.
Also during this period, the College of the North Atlantic vocational school increased theintake into the Process Operator Engineering Technology Program at its St. John’s campusthrough its oil and gas funding. This three-year program has an annual capacity of 20 studentsand previously had an alternate year intake. In 2010, a new three-year co-op program inChemical Process Engineering Technology was introduced with an annual capacity of 24 students.
85
Photo courtesy of Memorial University
Research and Development
Research and development is an area of high activity in the provincial offshore petroleumindustry, with industry, educational institutions, and research organizations providing supportfor the advancement of industry locally, as well as providing a mechanism for the transfer oflocal expertise into international markets.
The 2008-2010 period saw this continue with a number of major R&D initiatives. Forexample, in 2009 Memorial University announced a partnership with the American Bureau of Shipping to create a new Harsh Environment Technology Centre. Responding to a demandfor ice class guidance for offshore structures in harsh environments, the new centre is designedto support the development of technologies for ships and offshore structures operating inharsh environments, particularly the Arctic. Applied research will be conducted to studyvessels and units operating in ice covered waters, low temperature environments, and severewave and wind climates.
The Institute for Ocean Technology (IOT), now part of the National Research Council’s(NRC’s) Ocean, Coastal and River Engineering Institute, was involved in a number of projectseither directly related to, or with applications in, the offshore petroleum industry. For example,working with Memorial University and other NRC institutes, the IOT took the lead in theEscape, Evacuation and Rescue Project. This has tested different lifeboat hull designs in packice and wave conditions as well as conducting tests of marine safety systems in extremeenvironments to update safety equipment guidelines, while transferring research data and newtechnologies to the private sector. With funding from Transport Canada and Natural ResourceCanada’s Program on Energy Research and Development, the IOT has also been involved in asurvival research project concerning the effects of wind and waves on the thermal regulation ofpeople in immersion suits. The results of this study will be incorporated into any future reviewof regulations for marine safety and survival equipment.
Petroleum Research Newfoundland and Labrador (PRNL) (formerly Petroleum ResearchAtlantic Canada [PRAC]) is an industry-funded federally-incorporated not-for-profit agencythat facilitates R&D development projects with application in both the Newfoundland andLabrador offshore sites, and in Arctic areas such as Greenland, where Newfoundland andLabrador companies have begun to operate in support of exploration activities. During the2008-2010 period, PRNL awarded approximately $1.8 million in funding to companies andinstitutions undertaking research with application in the offshore petroleum industry. WithPRNL funding, Memorial University’s Ocean Engineering Research Centre (OERC) and the IOT became engaged in a project building on a related undertaking Ice Data Analysis andMechanics for Design Load Estimation previously funded by industry (Husky, Petro-Canada,and Chevron Canada Resources), NRC, PRAC, and the National Sciences and EngineeringResearch Council of Canada (NSERC). This project studied ice composition, structuraldesign, and iceberg impact modelling to examine ways of minimizing the risks of damagecaused by icebergs. The study also incorporated risk analysis and probability into the largerchallenge of operating offshore structures in iceberg-busy waters.
Petroleum Research Newfoundland and Labrador also funded studies in reservoircharacterization and health, safety and environment. The latter included funding provided to Virtual Marine Technologies, in partnership with OERC, and Marine Institute’s Centre for
86

Marine Simulation (MI-CMS), to develop a virtual trainer and curriculum to expand upon theexisting live boat training program.
The RDC of Newfoundland and Labrador also made important R&D investments, fundingseveral projects through the Industrial Research and Innovation Fund (IRIF). In 2008, a five-year, $3.7 million, Advanced Exploration Drilling Technology project was initiated by apartnership that includes ACOA, RDC, Husky Energy and Suncor. This applied researchproject is undertaking an experimental and numerical investigation of vibration-assisted rotarydrilling leading to the development of a prototype drilling tool.
In 2010, RDC invested more than $400,000 in research into the use of underwater vehicles in extreme environments, such as the Arctic. This funding was provided through the LeverageR&D component of the IRIF which enables researchers to leverage additional funding fromother sources such as NSERC. Additional funding for research in the design, navigation andcontrol of Autonomous Ocean Systems was provided through the Ignite R&D portion of the IRIF.
In 2009, with a $500,000 investment from the Wood Group, an Aberdeen-based energyservices company, and an additional $500,000 in support from RDC through the IRIF,Memorial University established the Wood Group Chair in Arctic and Cold RegionEngineering. The objective of the chair is the development of technology for application in Arctic and cold region oil and gas development, specifically pipeline design, constructionand operations in northern regions.
Early in 2010, Chevron Canada announced that the Chevron Corporation had selectedMemorial University to join its University Partnership Program (UPP). Memorial is the firstuniversity in Canada selected for this program, which includes approximately 100 universitiesand colleges worldwide. In late 2010, Chevron and RDC also announced the creation of theChevron Chair in Petroleum Engineering with a $500,000 investment from Chevron and anadditional $500,000 in support from RDC through the IRIF. The chair establishes, promotesand focuses research and teaching in petroleum engineering with the objective of petroleumengineering capability within the current undergraduate programs.
Additional R&D work undertaken by such private-sector and non-profit companies asOceanic, C-CORE, PAL and VMT is described in the company case studies that follow.
Company Case Studies
T he success of the offshore petroleum industry in Newfoundland and Labrador isboth a result of, and exemplified by, the success of local companies. This sectionsummarizes the involvement of a range of such companies with this very
demanding industry, and explains how this has led them to develop new goods and services,hire new personnel, provide them with further training, acquire new facilities and equipment,and improve quality, health, safety and environmental policies and practices. It alsodemonstrates the ways in which the resultant increases in experience and capabilities have ledto them winning petroleum industry work in other jurisdictions, and undertaking work inother industries at local, national, and international levels.
87
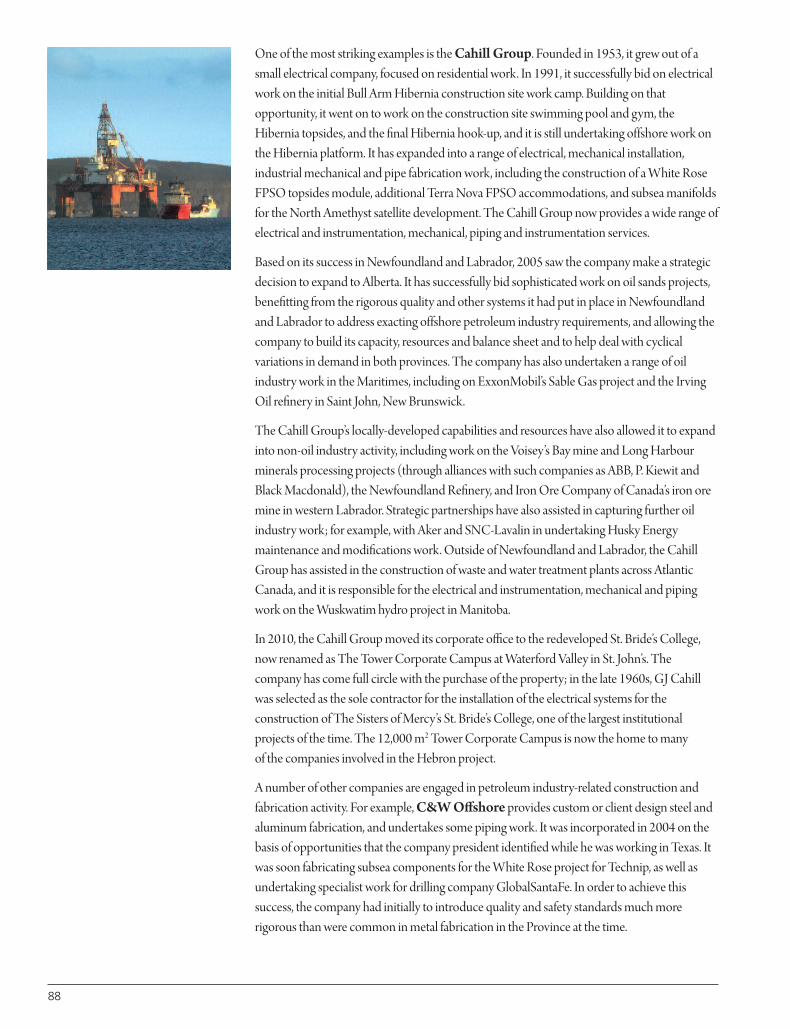
One of the most striking examples is the Cahill Group. Founded in 1953, it grew out of asmall electrical company, focused on residential work. In 1991, it successfully bid on electricalwork on the initial Bull Arm Hibernia construction site work camp. Building on thatopportunity, it went on to work on the construction site swimming pool and gym, theHibernia topsides, and the final Hibernia hook-up, and it is still undertaking offshore work onthe Hibernia platform. It has expanded into a range of electrical, mechanical installation,industrial mechanical and pipe fabrication work, including the construction of a White RoseFPSO topsides module, additional Terra Nova FPSO accommodations, and subsea manifoldsfor the North Amethyst satellite development. The Cahill Group now provides a wide range ofelectrical and instrumentation, mechanical, piping and instrumentation services.
Based on its success in Newfoundland and Labrador, 2005 saw the company make a strategicdecision to expand to Alberta. It has successfully bid sophisticated work on oil sands projects,benefitting from the rigorous quality and other systems it had put in place in Newfoundlandand Labrador to address exacting offshore petroleum industry requirements, and allowing thecompany to build its capacity, resources and balance sheet and to help deal with cyclicalvariations in demand in both provinces. The company has also undertaken a range of oilindustry work in the Maritimes, including on ExxonMobil’s Sable Gas project and the IrvingOil refinery in Saint John, New Brunswick.
The Cahill Group’s locally-developed capabilities and resources have also allowed it to expandinto non-oil industry activity, including work on the Voisey’s Bay mine and Long Harbourminerals processing projects (through alliances with such companies as ABB, P. Kiewit andBlack Macdonald), the Newfoundland Refinery, and Iron Ore Company of Canada’s iron oremine in western Labrador. Strategic partnerships have also assisted in capturing further oilindustry work; for example, with Aker and SNC-Lavalin in undertaking Husky Energymaintenance and modifications work. Outside of Newfoundland and Labrador, the CahillGroup has assisted in the construction of waste and water treatment plants across AtlanticCanada, and it is responsible for the electrical and instrumentation, mechanical and pipingwork on the Wuskwatim hydro project in Manitoba.
In 2010, the Cahill Group moved its corporate office to the redeveloped St. Bride’s College,now renamed as The Tower Corporate Campus at Waterford Valley in St. John’s. Thecompany has come full circle with the purchase of the property; in the late 1960s, GJ Cahillwas selected as the sole contractor for the installation of the electrical systems for theconstruction of The Sisters of Mercy’s St. Bride’s College, one of the largest institutionalprojects of the time. The 12,000 m2 Tower Corporate Campus is now the home to many of the companies involved in the Hebron project.
A number of other companies are engaged in petroleum industry-related construction andfabrication activity. For example, C&W Offshore provides custom or client design steel andaluminum fabrication, and undertakes some piping work. It was incorporated in 2004 on thebasis of opportunities that the company president identified while he was working in Texas. Itwas soon fabricating subsea components for the White Rose project for Technip, as well asundertaking specialist work for drilling company GlobalSantaFe. In order to achieve thissuccess, the company had initially to introduce quality and safety standards much morerigorous than were common in metal fabrication in the Province at the time.
88
Subsequent oil industry work has included the fabrication of lifeboat decks for a drilling rig(for TransOcean), subsea assemblies for Husky Energy’s North Amethyst satellitedevelopment (for Technip), custom ROV components (for Oceaneering) and componentsfor the Hibernia gas lift (for Wood Group/PSN). C&W Offshore has also undertaken workfor projects outside Newfoundland and Labrador, both for the oil industry, in the form ofROV and launch recovery system components for a company in Morgan City, Louisiana, andfor the mining industry, fabricating steel tanks for a mine in the Northwest Territories. Overall,the oil industry accounts for over 95 percent of C&W’s business. It now occupies a custom-built 1,500 m2 building, including a 1,100 m2 fabrication space with a 50 tonne crane, inMount Pearl.
In support of offshore petroleum construction and fabrication activity, Pennecon Energyhas developed and operates a Marine Base in Bay Bulls, approximately 30 km south of St. John’s. It provides a service facility for a wide range of marine operations, which haveincluded such oil industry activity as drilling rig servicing, rock dumping, chain inspection,pipe inspection and other support for a range of offshore construction and maintenanceprojects. The clients for this work have included Husky Energy, Technip, Tideway, Transocean,Rowan and GlobalSantaFe. This work has seen a progressive expansion and improvement inthe Marine Base, with increased ocean frontage, water depth, bollards and crane pads, and theconstruction of an office/warehouse, an encapsulated sewer system and a garage. These havehelped attract work on both oil and non-oil industry activity, with the latter including work onfishing vessels and the transshipment of wind turbines. However, the oil industry still providesapproximately 90 percent of the base’s business.
Marine activity is also the focus of oil industry work by A. Harvey Group. Founded in the 1860s, it first became involved in offshore petroleum activity in the 1960s, acting as shipsagents and customs brokers, and providing crewing, for drillships engaged in exploration offLabrador. While St. John’s Harbour was once the home of a number of single-operator supplybases, increased asset sharing has led to A. Harvey becoming the main provider to the oilcompanies operating in the Newfoundland and Labrador offshore sites. Its Offshore MarineBase encompasses almost five hectares of waterfront property. It can accommodate fiveoffshore supply vessels, providing fuel and water via pipeline, drilling bulks, 24 hour-security,and a heavy lift crane capable of 44-tonne lift. A. Harvey has been active in offshore logisticssince the start of exploration, with experience in vessel operations, cargo planning, safe riggingand slinging practices, container repairs and certification, heavy lift management, freightforwarding, oil spill response, and crane and equipment maintenance.
As demonstrated above, a number of Newfoundland and Labrador companies are workingdirectly for the industry developing and delivering the results of R&D activity. For example,C-CORE was founded in 1975 under a five-year Devonian Foundation grant to addresschallenges facing oil and gas development offshore Newfoundland and Labrador and otherice-prone regions. It was incorporated as a federal non-profit in 1992, and has become a major international player in the fields of remote sensing, ice engineering and geotechnicalengineering.
As a key contributor to Memorial University’s research capacity, C-CORE undertakes morethan 100 R&D projects annually, as single client or multi-participant joint industry projects,and works with the oil and gas industry to define R&D priorities to meet the requirements of
89

90
this sector. It is committed to building Newfoundland and Labrador’s knowledge base foroffshore engineering, particularly ice and geotechnical engineering aspects, and to furtheracceptance of new engineering concepts for oil and gas development. This knowledge baseincludes unique familiarity with Atlantic Canada and a growing understanding of engineeringconsiderations for such other harsh cold-ocean environments as the Barents, Beaufort andCaspian Seas. C-CORE successfully worked with industry to secure funding and othersupport for long-term R&D addressing barriers to development of hydrocarbon resources in Arctic and other ice and iceberg prone regions.
C-CORE has branch offices in Ottawa, Halifax and Calgary and is active on every continent,providing research-based advisory services and technology solutions to clients in the naturalresource, energy, security and transportation sectors. In 2010, oil industry work accounted for60 to 70 percent of its turnover, with 20 percent directly concerned with the Newfoundlandand Labrador offshore sites.
Since 1993, Oceanic’s researchers, engineers, and technical personnel, working with one ofthe world’s most comprehensive collections of hydrodynamic research facilities, have madethe company a world leader in commercial R&D. Developing out of Marineering in analliance with the NRC, based around the IOT, Oceanic emerged as an independent entity in1998. Marineering had undertaken a range of work in the oil industry, including evaluationstudies for Global Marine, Noble Drilling and for the Terra Nova FPSO in the late 1990s.There was then a lull in Oceanic’s local oil industry work until it undertook studies for theWhite Rose project (examining green water impacts, combined wind, current and wave loads,and the effectiveness of disconnectable moorings for the SeaRose FPSO) and subsequentwork on the Hebron GBS and Hibernia offshore loading system. Based on its early local FPSOwork, Oceanic has gone on to work on more than 60 FPSO-related projects worldwide forclients such as ExxonMobil, Husky Energy, Single Buoy Moorings, Suncor, Technip andWoodside Energy. The company’s work has reached as far as the Tatar Strait, the South ChinaSea, the Sea of Okhotsk, Australia, Brazil, Italy and West Africa.
Oceanic’s range of physical modeling and numerical simulation research has included: sea-keeping studies (with one or more floating or fixed structures); free running and captive shipmanoeuvering tests; evaluations of current loads on moored structures; hull resistance in leveland pack ice as well as in open water; ship performance in ridged ice; and ice abrasion studies.In recent years the oil industry has been responsible for approximately 70 percent of Oceanic’sbusiness, of which approximately 70 percent is in export markets. In 2011, Oceanic becamepart of the J. D. Irving Limited Group of Companies, providing new opportunities for growthin the oil and gas industry, in Newfoundland and Labrador, nationally, and internationally.
The aviation sector is also important to, and a beneficiary of, the oil industry. ProvincialAerospace (PAL) started life in 1974 as a St. John’s flying school with less than 10 employeesbut, primarily thanks to opportunities presented by the oil industry, it has developed into aglobal leader in aerospace and defence. It now provides highly tailored airborne and maritimesurveillance solutions, including custom aircraft design and modification, mission systemdesign and integration, and mission operations, training and support. It has more than 900employees, approximately 750 of them in Newfoundland and Labrador, with domesticoperating bases in Newfoundland and Labrador, Nova Scotia and British Columbia, and
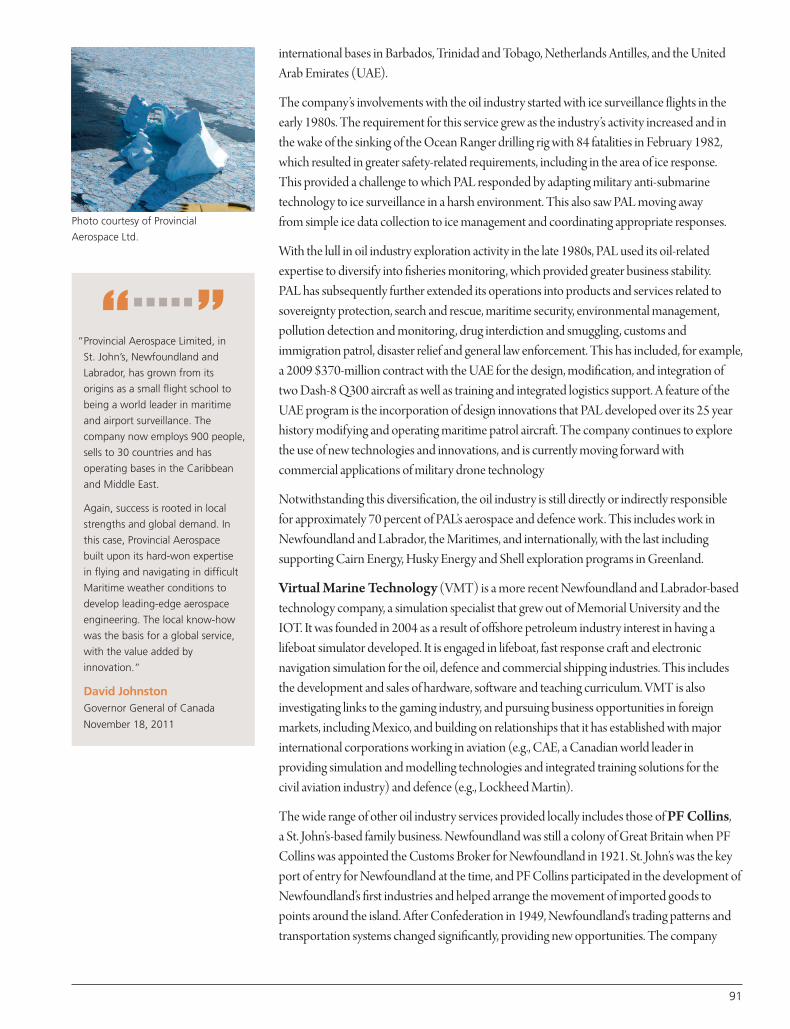
international bases in Barbados, Trinidad and Tobago, Netherlands Antilles, and the UnitedArab Emirates (UAE).
The company’s involvements with the oil industry started with ice surveillance flights in theearly 1980s. The requirement for this service grew as the industry’s activity increased and inthe wake of the sinking of the Ocean Ranger drilling rig with 84 fatalities in February 1982,which resulted in greater safety-related requirements, including in the area of ice response.This provided a challenge to which PAL responded by adapting military anti-submarinetechnology to ice surveillance in a harsh environment. This also saw PAL moving away from simple ice data collection to ice management and coordinating appropriate responses.
With the lull in oil industry exploration activity in the late 1980s, PAL used its oil-relatedexpertise to diversify into fisheries monitoring, which provided greater business stability. PAL has subsequently further extended its operations into products and services related tosovereignty protection, search and rescue, maritime security, environmental management,pollution detection and monitoring, drug interdiction and smuggling, customs andimmigration patrol, disaster relief and general law enforcement. This has included, for example,a 2009 $370-million contract with the UAE for the design, modification, and integration oftwo Dash-8 Q300 aircraft as well as training and integrated logistics support. A feature of theUAE program is the incorporation of design innovations that PAL developed over its 25 yearhistory modifying and operating maritime patrol aircraft. The company continues to explorethe use of new technologies and innovations, and is currently moving forward withcommercial applications of military drone technology
Notwithstanding this diversification, the oil industry is still directly or indirectly responsiblefor approximately 70 percent of PAL’s aerospace and defence work. This includes work inNewfoundland and Labrador, the Maritimes, and internationally, with the last includingsupporting Cairn Energy, Husky Energy and Shell exploration programs in Greenland.
Virtual Marine Technology (VMT) is a more recent Newfoundland and Labrador-basedtechnology company, a simulation specialist that grew out of Memorial University and theIOT. It was founded in 2004 as a result of offshore petroleum industry interest in having alifeboat simulator developed. It is engaged in lifeboat, fast response craft and electronicnavigation simulation for the oil, defence and commercial shipping industries. This includesthe development and sales of hardware, software and teaching curriculum. VMT is alsoinvestigating links to the gaming industry, and pursuing business opportunities in foreignmarkets, including Mexico, and building on relationships that it has established with majorinternational corporations working in aviation (e.g., CAE, a Canadian world leader inproviding simulation and modelling technologies and integrated training solutions for the civil aviation industry) and defence (e.g., Lockheed Martin).
The wide range of other oil industry services provided locally includes those of PF Collins, a St. John’s-based family business. Newfoundland was still a colony of Great Britain when PFCollins was appointed the Customs Broker for Newfoundland in 1921. St. John’s was the keyport of entry for Newfoundland at the time, and PF Collins participated in the development ofNewfoundland’s first industries and helped arrange the movement of imported goods topoints around the island. After Confederation in 1949, Newfoundland’s trading patterns andtransportation systems changed significantly, providing new opportunities. The company
91
Photo courtesy of Provincial
Aerospace Ltd.
“Provincial Aerospace Limited, in
St. John’s, Newfoundland and
Labrador, has grown from its
origins as a small flight school to
being a world leader in maritime
and airport surveillance. The
company now employs 900 people,
sells to 30 countries and has
operating bases in the Caribbean
and Middle East.
Again, success is rooted in local
strengths and global demand. In
this case, Provincial Aerospace
built upon its hard-won expertise
in flying and navigating in difficult
Maritime weather conditions to
develop leading-edge aerospace
engineering. The local know-how
was the basis for a global service,
with the value added by
innovation.”
David JohnstonGovernor General of Canada
November 18, 2011
“.....”

92
participated in early industrial developments such as the pulp and paper mills, the U.S. militarybases built during the Second World War, refineries at Holyrood and Come-By-Chance, andthe Churchill Falls hydro project.
In the 1970s, the company initiated its involvement in offshore petroleum exploration.Working with operators and government legislators, the company implemented manyoperational procedures to accommodate the then “customs free zone” on the ContinentalShelf. As the company continued to grow, it expanded its services and capabilities and itsinternational network of agents and affiliates. At the same time, the company initiated anextensive program to incorporate the latest advances in technology and automation, and itexpanded into Nova Scotia and Alberta. PF Collins now provides custom brokerage, freightservices, warehouse and distribution services, project logistics, project administration, marineagency services, immigration consulting, and compliance consulting services. Companymanagers are proud of the fact that more than half of its personnel, including many in seniorpositions, are women.
The founder of St. John’s-based Atlantic Offshore Medical Services (AOMS) beganworking with a commercial diving company in the late 1970s, leading to his establishingAOMS in 1978 and success in capturing work on the Hibernia project. AOMS offers harshenvironment occupational health and emergency medical services, both onshore and offshore.They include the assessment of occupational health and safety practices, pre-employmentexaminations, health surveillance programs, periodic medical examinations, independentmedical examinations, disability management programs, workplace drug testing, occupationaltherapy, vaccinations and immunizations. AOMS also provides response teams for medicalemergencies at remote sites, and it has extensive experience in setting up medical services foroffshore drilling rigs.
The company has provided its services to all the oil companies operating in theNewfoundland and Labrador offshore, and to the Come-by-Chance oil refinery. It also has a Halifax-based Nova Scotia affiliate which has supported the Sable Gas and Deep Panukeoffshore gas projects. Drawing on its Newfoundland and Labrador-developed expertise,AOMS has also provided medical support for the Sunrise (Husky Energy), Kearl(ExxonMobil) and Albian Sands oil sands projects in Alberta. The company has used itsoil industry-based expertise to expand into other sectors, working for such organizations asworkers compensation commissions in both Newfoundland and Labrador and Nova Scotia,and the cities of St. John’s and Mount Pearl. However, the oil industry is still responsible forabout two-thirds of company revenues.
East Coast Catering (ECC) was established in St. John’s in 1984, largely on the basis ofperceived opportunities related to offshore oil exploration. The company now operates inseven Canadian provinces and in Ireland, and it is the dominant workforce catering serviceprovider to the offshore petroleum industry in Atlantic Canada, supporting three of theregion’s four producing projects and many of the drilling rigs operating in the region. ECC’s oil industry clients include or have included ExxonMobil, Suncor, Husky Energy, CanshipUgland, Transocean, GlobalSantaFe, Petrodrill, Sedco and Rigco. It has also provided campfacilities for drilling rig refit work at Bull Arm in Eastern Newfoundland.

The company has long recognized that the oil industry is very demanding in the areas of safetyand training. However, the adoption of such standards for the oil industry has been beneficialin bidding work in both that industry and historically less-demanding sectors, helping thecompany to expand into other jurisdictions and to get work on mining, hydro and otherprojects. In the former case, ECC operates four camps associated with onshore oil activity in Alberta and British Columbia.
In an early example of work in other industries, ECC provided accommodations, catering andhousekeeping services at the Hope Brook gold mine in southwestern Newfoundland in the1990s. The company has subsequently provided similar services for the construction and/oroperation of Vale’s Voisey’s Bay mine and Long Harbour minerals processing project, miningprojects in Western Labrador, Ontario, Manitoba, British Columbia and Northwest Territories,and a number of hydro projects in Newfoundland and Labrador. ECC also providedworkforce accommodations for the Confederation Bridge construction project in PEI, andEast Coast (Ireland) Limited has operated accommodations for asylum seekers for the IrishDepartment of Justice since 2002.
Smaller Newfoundland and Labrador companies provide a range of specialist services to theindustry. For example, Strategic Concepts was originally established in 1990 to assist smallbusinesses with business planning and marketing. However, the company principals soonrecognized that there were opportunities associated with forecasting and demonstrating theeconomic impacts of major resource development projects. Strategic Concepts hassubsequently expanded its offerings to include: cash flow and economic impacts analysis;strategic advice re advancing projects; the provision of software to monitor project benefitsand commitments; specialist studies, such as project labour requirements and supply; and the negotiation and implementation of Impact and Benefits Agreements.
The local oil industry clients for Strategic Concepts services have included ExxonMobil,Chevron and Husky Energy, and local success has led to its benefits monitoring software beingadopted for projects elsewhere in Canada, including the Mackenzie Valley Gas Pipeline andKearl oil sands projects for ExxonMobil and the Surmont oil sands and Parson’s Lake gasprojects for ConocoPhillips. However, non-oil projects, such as the Vale’s Voisey’s Bay mine inLabrador, have become increasingly important to the extent that, at times, work for the oilindustry has only been responsible for 20 to 25 percent of the company’s turnover.
In another example of a small specialist company working in the oil and other industries,Canning & Pitt was established in 1991, primarily to support the Hibernia developmentproject in its relations with fisheries interests. Since that time it has worked for such companiesas Husky Energy, Suncor, ConocoPhillips, Hebron, WesternGeco, PGS and GXT, developingand supporting operational management plans and compensation programs, providingconsultation services, and assisting in the development of environmental assessments. Thishas included seismic-related work in Nova Scotia, the Beaufort Sea, and Greenland. While theoil industry accounts for approximately 80 to 85 percent of the company’s business, it hasdiversified into work on minerals processing and subsea transmission line projects.
The oil industry supply and service sector is not just comprised of companies engaged inindustry-specific activity. For example, Greg Locke was originally a freelance photographerand reporter, working for the Globe and Mail, Maclean’s and other newspapers and magazines.
93

94
He increasingly became involved in corporate photography for such companies as Ford, Toyotaand Imperial Oil, while based in Ottawa. Greg moved back to Newfoundland in 1988 and inthe 1990s he became involved in local photography for the oil industry, including documentingthe Hibernia construction site preparation for HMDC. This led to work for Chevron, Petro-Canada, GJ Cahill, Texas Instruments, Schlumberger, Baker Hughes, and other companiesengaged in oil activity. Greg’s recent work has included what he calls “engineering telemedicine,”photographing damaged offshore equipment for evaluation by experts onshore.
Working in such a demanding industry has driven Greg’s professional development, furtherexpanding his business. For example, he has had to acquire suitable equipment for workingoffshore (where, for example, flash cannot be used because it might set off sensors) and tomaintain current safety training certification for working offshore. These have helped Greg getwork at other types of industrial sites, within and outside the province, including work for suchcompanies as Teck-Cominco, Sandwell Engineering, and Schneider Electric. The importanceof the oil industry to Greg Locke has been quite variable, representing between 10 and 60percent of his total business income.
While St. John’s is the Province’s largest city, the centre of oil industry management, regulationand R&D, and the location of the main marine supply base and helibase for offshore activity,not all oil industry business occurs there. For example, the construction of the Hibernia, Terra Nova, White Rose, North Amethyst and Hebron projects, and rig mobilization andrefurbishment work, has mostly been concentrated around the Isthmus of Avalon and inMarystown. Work on the White Rose Extension Project is primarily occurring near Placentia,and the transshipment of Grand Banks’ oil occurs at a terminal near Arnold’s Cove onPlacentia Bay.
Some supply and service companies are also located outside of the St. John’s region. For example, Dynamic Air Shelters is based in Grand Bank on the Burin Peninsula,approximately 360 km by road west of St. John’s. It evolved from Calgary-based AeroDynamics Inflatable Shelters Inc., which originally focused on designing and manufacturinginflatable shelters for promotional events. Involvement with the oil and gas industry had animportant influence on product development, and it was through the industry that it firstbegan working in Newfoundland and Labrador in 2002, leading to it moving itsmanufacturing operations to Grand Bank in 2004.
The company began engineering and testing its shelters for explosion resistance in response to petroleum industry demand. A turning point came when the company demonstrated thatits structures could withstand pressures from an explosion of up to four pounds per squareinch (psi), with later tests concluding that they would likely withstand a blast of nine or ten psi.The product is now being used on work sites for offices, warehouses and lunchrooms, with thecompany becoming heavily involved with the oil industry internationally, producingstructures for refineries and other sites across North America, the Caribbean and Australia.
Contracts with oil and gas companies represent about half of its sales; however, engineeringand manufacturing capabilities developed to meet oil industry requirements have helpedDynamic sell its products to the construction and fabrication industries. The company hasalso worked with the Canadian Armed Forces to provide protective structures for use inmilitary operations. About a quarter of its business comes from construction and fabrication
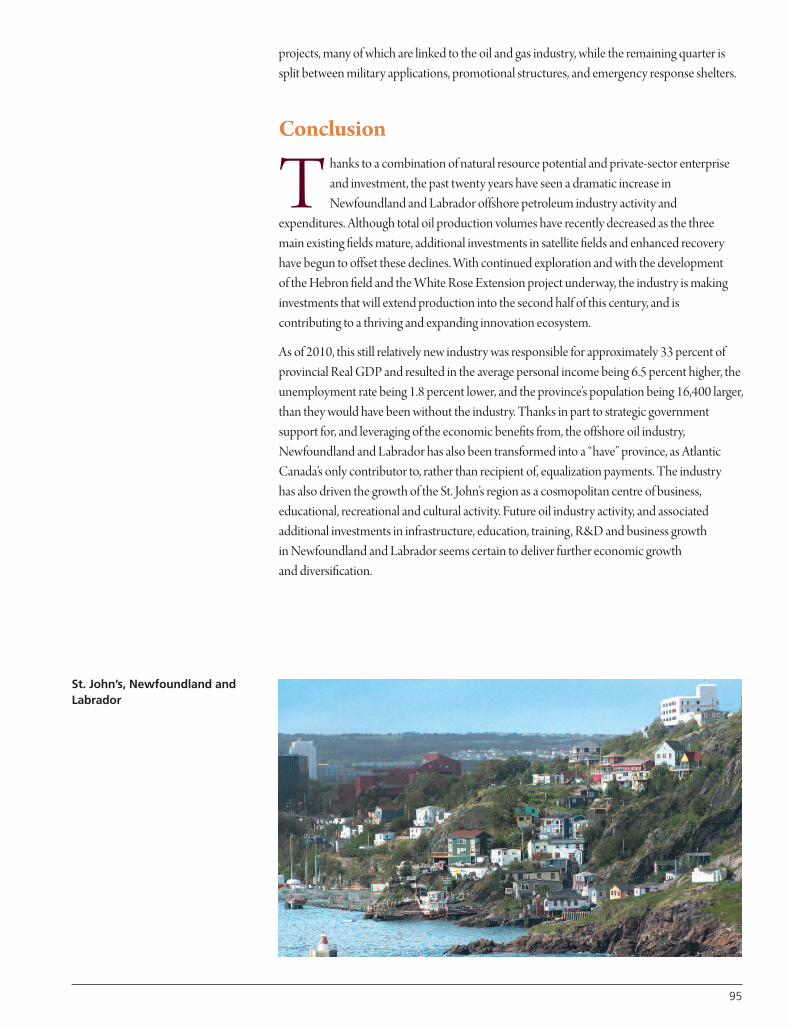
projects, many of which are linked to the oil and gas industry, while the remaining quarter issplit between military applications, promotional structures, and emergency response shelters.
Conclusion
T hanks to a combination of natural resource potential and private-sector enterpriseand investment, the past twenty years have seen a dramatic increase inNewfoundland and Labrador offshore petroleum industry activity and
expenditures. Although total oil production volumes have recently decreased as the three main existing fields mature, additional investments in satellite fields and enhanced recoveryhave begun to offset these declines. With continued exploration and with the development of the Hebron field and the White Rose Extension project underway, the industry is makinginvestments that will extend production into the second half of this century, and iscontributing to a thriving and expanding innovation ecosystem.
As of 2010, this still relatively new industry was responsible for approximately 33 percent ofprovincial Real GDP and resulted in the average personal income being 6.5 percent higher, theunemployment rate being 1.8 percent lower, and the province’s population being 16,400 larger,than they would have been without the industry. Thanks in part to strategic governmentsupport for, and leveraging of the economic benefits from, the offshore oil industry,Newfoundland and Labrador has also been transformed into a “have” province, as AtlanticCanada’s only contributor to, rather than recipient of, equalization payments. The industry has also driven the growth of the St. John’s region as a cosmopolitan centre of business,educational, recreational and cultural activity. Future oil industry activity, and associatedadditional investments in infrastructure, education, training, R&D and business growth in Newfoundland and Labrador seems certain to deliver further economic growth and diversification.
St. John’s, Newfoundland andLabrador
95

96
Canada-Newfoundland and Labrador Offshore Petroleum Board (CNLOPB), 2006, ‘Canada-
Newfoundland and Labrador Benefits Plan Guidelines’, St. John’s, NL.
Canada-Newfoundland and Labrador Offshore Petroleum Board (CNLOPB), 2013, ‘Annual
Report, 2012-13’, St. John’s, NL.
Community Resource Services Ltd., 2003, ‘Socio-Economic Benefits from Petroleum Activity in
Newfoundland and Labrador’, for Petroleum Research Atlantic Canada, Halifax, NS.
Jacques Whitford, 2005, ‘Socio-Economic Benefits from Petroleum Activity in Newfoundland
and Labrador, 2003 and 2004’, for Petroleum Research Atlantic Canada, Halifax, NS.
Letto, Doug, 1998, ‘Chocolate Bars and Rubber Boots: The Smallwood Industrialization Plan’,
Blue Hill Publishing, Paradise, NL.
Stantec, 2009, ‘Socio-Economic Benefits from Petroleum Activity in Newfoundland and
Labrador, 2005 and 2007’, for Petroleum Research Atlantic Canada, St. John’s, NL.
Stantec, 2012, ‘Socio-Economic Benefits from Petroleum Activity in Newfoundland and
Labrador, 2008 and 2010’, for Petroleum Research Newfoundland Labrador, St. John’s, NL.
Mark Shrimpton (Principal, Stantec Consulting Ltd.) has over 30 years’ experience assessing,
planning and managing the socio-economic impacts of large natural resource and
infrastructure projects. He has played a lead role in preparing requirements studies, impact
assessments and benefits plans for petroleum, mining, hydro and transportation projects in
Canada, and assisted project proponents, governments, regulators, industry groups and non-
governmental organizations in the US, Greenland, Iceland, the Faroe Islands, the UK, France,
Argentina, the Falkland Islands and Australia. He has also undertaken policy-related studies of
resource development activity, including for the US Minerals Management Service and UN
International Labour Office, and he is a member of the Pool of Experts for the UN Regular
Process for Global Reporting and Assessment of the State of the Marine Environment,
including Socioeconomic aspects, focusing on offshore petroleum activity.
Mark has published and presented widely on his research, including conference presentations
in Canada, the US, Norway, Denmark, Greenland, Iceland, the Faroe Islands, the UK, France,
Lithuania, Russia, Malaysia and Australia. In addition to his consulting work, Mark holds
Professional Associate positions with the Leslie Harris Centre for Policy and Regional
Development and the Faculty of Business Administration, at Memorial University.
A large number of people contributed to the reports on which this chapter is based, but special
mention must be made of Ken Hicks (Department of Finance, Government of Newfoundland
and Labrador) and of Dana Feltham and the other members of the Stantec Consulting Ltd.
socio-economic team in St. John’s.
References
Biography
Acknowledgements:
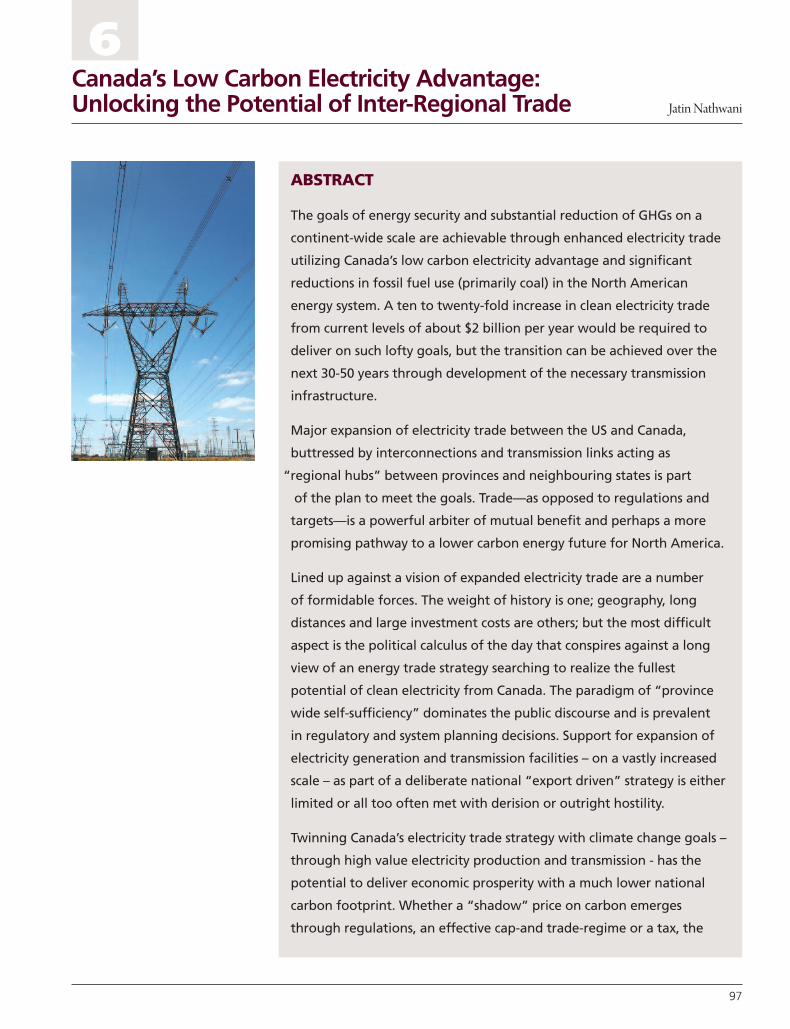
97
ABSTRACT
The goals of energy security and substantial reduction of GHGs on a
continent-wide scale are achievable through enhanced electricity trade
utilizing Canada’s low carbon electricity advantage and significant
reductions in fossil fuel use (primarily coal) in the North American
energy system. A ten to twenty-fold increase in clean electricity trade
from current levels of about $2 billion per year would be required to
deliver on such lofty goals, but the transition can be achieved over the
next 30-50 years through development of the necessary transmission
infrastructure.
Major expansion of electricity trade between the US and Canada,
buttressed by interconnections and transmission links acting as
“regional hubs” between provinces and neighbouring states is part
of the plan to meet the goals. Trade—as opposed to regulations and
targets—is a powerful arbiter of mutual benefit and perhaps a more
promising pathway to a lower carbon energy future for North America.
Lined up against a vision of expanded electricity trade are a number
of formidable forces. The weight of history is one; geography, long
distances and large investment costs are others; but the most difficult
aspect is the political calculus of the day that conspires against a long
view of an energy trade strategy searching to realize the fullest
potential of clean electricity from Canada. The paradigm of “province
wide self-sufficiency” dominates the public discourse and is prevalent
in regulatory and system planning decisions. Support for expansion of
electricity generation and transmission facilities – on a vastly increased
scale – as part of a deliberate national “export driven” strategy is either
limited or all too often met with derision or outright hostility.
Twinning Canada’s electricity trade strategy with climate change goals –
through high value electricity production and transmission - has the
potential to deliver economic prosperity with a much lower national
carbon footprint. Whether a “shadow” price on carbon emerges
through regulations, an effective cap-and trade-regime or a tax, the
Canada’s Low Carbon Electricity Advantage:Unlocking the Potential of Inter-Regional Trade Jatin Nathwani
6

economic rationale for specific investments will pivot on a price that
internalizes the economic cost of emissions. Currently, the lack of a high
enough price signal for carbon emissions, combined with expectations
that low natural gas prices will prevail, presents barriers to investment
decisions for an alternate future. Beyond pricing of carbon, strong
policies and commitments to incent investments in transmission and
interconnections may be necessary to pave the way for enhanced trade.
A dramatic shift in thinking and support for a national energy strategy
is required that has, at its fulcrum, large-scale cross border inter-regional
trade in electricity. The national strategic opportunity is for Canada’s
low carbon electricity advantage to become fully integrated with
energy trade and climate change policies of Canada and the US
synchronized for mutual benefit.
98

Introduction
I s there an economic opportunity for Canada to promote trade in electricity based on its existing clean energy advantage? If so, can electricity trade become a central force inhelping decarbonize the North American energy system through large-scale expansion?
Can a carbon mitigation strategy deliver a cost effective solution compared with other optionson a scale large enough and timelines meaningful enough to make a difference to the threat ofclimate change?
It is widely recognized that the transition from a fossil fuel-based energy system to a low-carbon energy system will be a slow process spanning decades. Resource availability andforecasts of scarcity or abundance of fossil fuels (coal, oil, and gas) at the right price is onefactor. However, emerging constraints on carbon emissions—either through stringentregulations, a carbon tax or a cap-and-trade regime, will put an upward pressure on electricityprices in those jurisdictions where coal is dominant.
In the short term, low prices of natural gas will be driven by the US shale gas boom. In themedium to long term, electricity prices and profits will be determined by the rate ofsubstitution of non-carbon generation and the advantage will shift to these resources becausethey will not attract a carbon penalty. The rate of change will undoubtedly vary across regionsdepending upon the existing supply mix, the strength of policy interventions and the specificstringency of environmental compliance requirements (i.e. GHG prices or abatement costs)and broader macro-economic factors.
It is in this context that we investigate whether enhanced electricity trade between Canada andthe US offers a strategic environmental and economic advantage that would benefit the entireNorth American economy and accelerate the process of low-carbon development in ameaningful way.
99
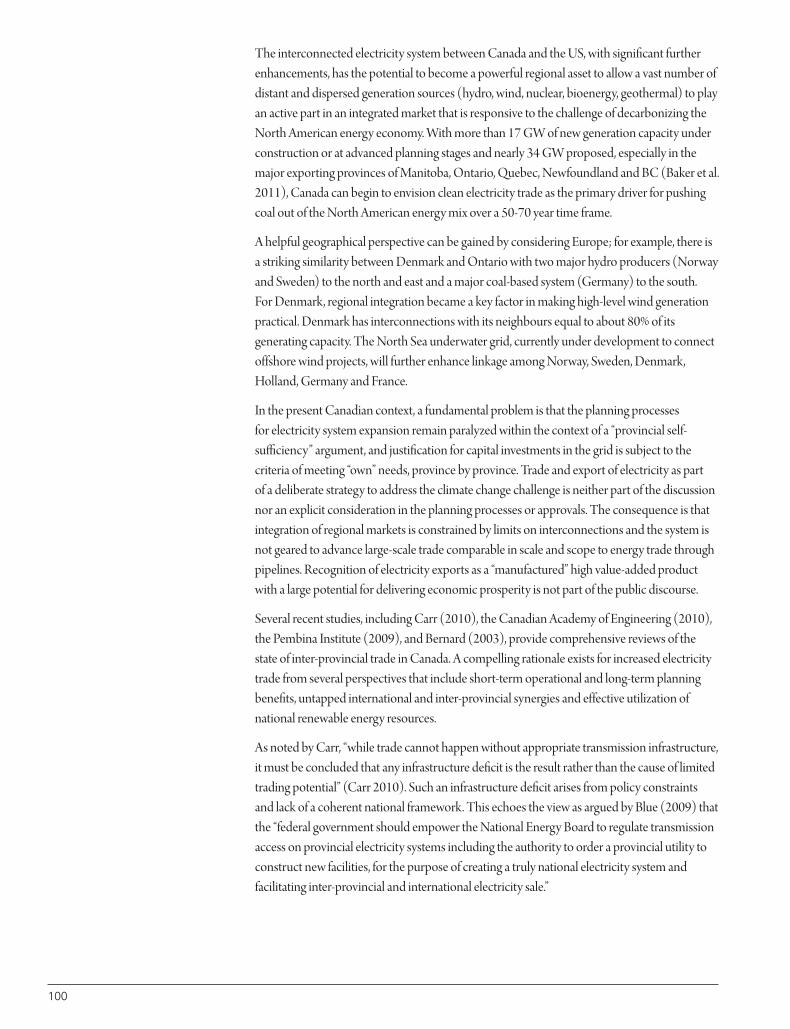
100
The interconnected electricity system between Canada and the US, with significant furtherenhancements, has the potential to become a powerful regional asset to allow a vast number ofdistant and dispersed generation sources (hydro, wind, nuclear, bioenergy, geothermal) to playan active part in an integrated market that is responsive to the challenge of decarbonizing theNorth American energy economy. With more than 17 GW of new generation capacity underconstruction or at advanced planning stages and nearly 34 GW proposed, especially in themajor exporting provinces of Manitoba, Ontario, Quebec, Newfoundland and BC (Baker et al.2011), Canada can begin to envision clean electricity trade as the primary driver for pushingcoal out of the North American energy mix over a 50-70 year time frame.
A helpful geographical perspective can be gained by considering Europe; for example, there isa striking similarity between Denmark and Ontario with two major hydro producers (Norwayand Sweden) to the north and east and a major coal-based system (Germany) to the south. For Denmark, regional integration became a key factor in making high-level wind generationpractical. Denmark has interconnections with its neighbours equal to about 80% of itsgenerating capacity. The North Sea underwater grid, currently under development to connectoffshore wind projects, will further enhance linkage among Norway, Sweden, Denmark,Holland, Germany and France.
In the present Canadian context, a fundamental problem is that the planning processes for electricity system expansion remain paralyzed within the context of a “provincial self-sufficiency” argument, and justification for capital investments in the grid is subject to thecriteria of meeting “own” needs, province by province. Trade and export of electricity as part of a deliberate strategy to address the climate change challenge is neither part of the discussionnor an explicit consideration in the planning processes or approvals. The consequence is thatintegration of regional markets is constrained by limits on interconnections and the system isnot geared to advance large-scale trade comparable in scale and scope to energy trade throughpipelines. Recognition of electricity exports as a “manufactured” high value-added productwith a large potential for delivering economic prosperity is not part of the public discourse.
Several recent studies, including Carr (2010), the Canadian Academy of Engineering (2010),the Pembina Institute (2009), and Bernard (2003), provide comprehensive reviews of thestate of inter-provincial trade in Canada. A compelling rationale exists for increased electricitytrade from several perspectives that include short-term operational and long-term planningbenefits, untapped international and inter-provincial synergies and effective utilization ofnational renewable energy resources.
As noted by Carr, “while trade cannot happen without appropriate transmission infrastructure,it must be concluded that any infrastructure deficit is the result rather than the cause of limitedtrading potential” (Carr 2010). Such an infrastructure deficit arises from policy constraintsand lack of a coherent national framework. This echoes the view as argued by Blue (2009) thatthe “federal government should empower the National Energy Board to regulate transmissionaccess on provincial electricity systems including the authority to order a provincial utility toconstruct new facilities, for the purpose of creating a truly national electricity system andfacilitating inter-provincial and international electricity sale.”

Historical Context
T he existing interconnection between Canada and the US, which has its roots inhistorical developments, is an artifact of geography and history. Ever since theNortheast Blackout of 1965, reliability has been the primary focus in the design,
development, and operation of the interconnected grid.
The three principal electric networks in North America are the Eastern Interconnection, the Western Interconnection and the Electric Reliability Council of Texas (ERCOT)Interconnection. The Hydro Quebec system is distinct from these three systems but isconnected to Ontario, New York and New England by DC interconnections. Each of theseoperates synchronously and each can be viewed as a single machine comprising manyconnected generators. The three interconnections are independent in that they are notsynchronized with each other, but are linked through limited direct current (DC) ties. TheEastern and Western Interconnections are linked to the electrical grids in Canada. The EasternInterconnection is the largest synchronous electrical system in the world comprising morethan 60% of the circuit length of the transmission lines.
The map below shows the North American Electric Reliability Corporation (NERC)Interconnections and its networks and regions. The entire system has some 211,000 miles(340,000 km) of high-voltage transmission lines and serves 334 million people (NorthAmerican Electric Reliability Corporation 2012).
101
Figure 1Networks and Regions withinthe NERC Interconnections(North American ElectricReliability Corporation 2012)
WECCRFC
SSSSERC
SPP
MRO
TRE
NPCC
FRCC
InterconnectionEastern
InterconnectionErcot
InterconnectionesternW
InterconnectionQuebec

102
Power can flow from James Bay in Northern Quebec or from anywhere in Ontario as far southas Florida or through any of the contiguous states such as Michigan, Ohio or Pennsylvaniawithin the Eastern Interconnection.
The benefits, delivered through the interconnections across a vast geography, have beenwidely recognized in terms of provision of emergency support, reserve sharing, improvedreliability and mitigation of supply risk. Over the past four decades, the system has deliveredimpressive results in its capability to withstand unanticipated disturbances of bulk powerproduction in the network.
After the 2003 Blackout, however, the North American Electric Reliability Council (NERC)was reformulated from what was effectively a voluntary organization to a self-funding quasi-governmental organization operating under delegated authority from the Federal EnergyRegulatory Commission (Cooper 2011). This change has resulted in NERC reliabilitystandards moving from being voluntary to becoming mandatory and enforceable standardsthrough compliance.
What Role for Electricity Trade?
E ven though the historical roots of the North American grid can be traced to theparadigm of reliability as the primary determinant, it is worthwhile to explore howthis vast interconnected system of wires and generators over a large geography,
operating as a synchronous machine, can also be used to lower energy costs and reducegreenhouse gas emissions on a continent-wide scale. Figure 2 below shows the extensivenature of the high voltage electricity transmission system on the continental scale.
This extensive network of existing assets and its potential to shape the broader climate changepolicy and the political discourse on a strategy for enhancing inter-regional electricity tradehas not been explored fully. A national strategy to promote significant expansion of electricitytrade, perhaps by ten to twenty-fold or higher, would test this central premise and help toidentify limitations of the existing infrastructure and to answer practical questions such as:
Figure 2Major US-Canada TransmissionInterconnections
(Canadian Electricity Association 2011)
Map copyright CEA
Lines shown are 345 kV and above.
There are numerous interconnections
between Canada and the U.S. under
345 kV that do not appear on this map.
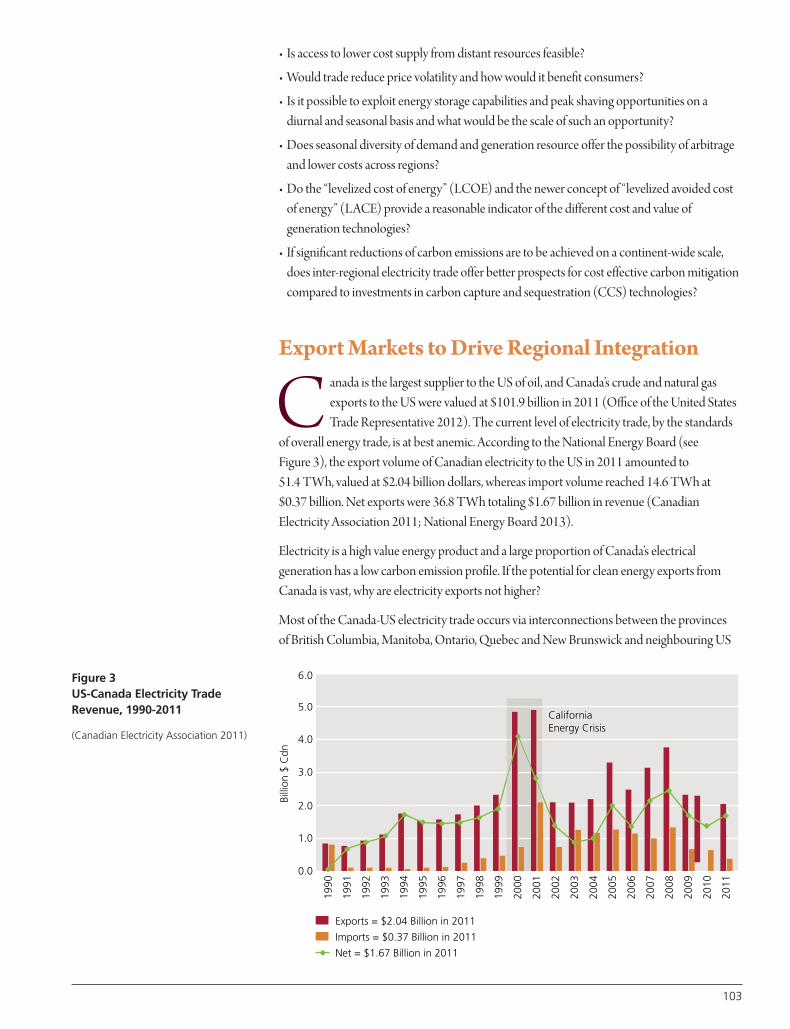
• Is access to lower cost supply from distant resources feasible?
• Would trade reduce price volatility and how would it benefit consumers?
• Is it possible to exploit energy storage capabilities and peak shaving opportunities on adiurnal and seasonal basis and what would be the scale of such an opportunity?
• Does seasonal diversity of demand and generation resource offer the possibility of arbitrageand lower costs across regions?
• Do the “levelized cost of energy” (LCOE) and the newer concept of “levelized avoided costof energy” (LACE) provide a reasonable indicator of the different cost and value ofgeneration technologies?
• If significant reductions of carbon emissions are to be achieved on a continent-wide scale,does inter-regional electricity trade offer better prospects for cost effective carbon mitigationcompared to investments in carbon capture and sequestration (CCS) technologies?
Export Markets to Drive Regional Integration
C anada is the largest supplier to the US of oil, and Canada’s crude and natural gasexports to the US were valued at $101.9 billion in 2011 (Office of the United StatesTrade Representative 2012). The current level of electricity trade, by the standards
of overall energy trade, is at best anemic. According to the National Energy Board (seeFigure 3), the export volume of Canadian electricity to the US in 2011 amounted to 51.4 TWh, valued at $2.04 billion dollars, whereas import volume reached 14.6 TWh at $0.37 billion. Net exports were 36.8 TWh totaling $1.67 billion in revenue (CanadianElectricity Association 2011; National Energy Board 2013).
Electricity is a high value energy product and a large proportion of Canada’s electricalgeneration has a low carbon emission profile. If the potential for clean energy exports fromCanada is vast, why are electricity exports not higher?
Most of the Canada-US electricity trade occurs via interconnections between the provinces of British Columbia, Manitoba, Ontario, Quebec and New Brunswick and neighbouring US
Energy Crisis
3.0
4.0
niaCalifor5.0
2011
2010
2009
2008
2007
2006
2005
2004
2003
2002
2001
2000
1999
1998
1997
1996
1995
1994
1993
1992
1991
1990
6.0
Billi
on $
Cdn
Net = $1.67 Billion in 2011
Imports = $0.37 Billion in 2011
Exports = $2.04 Billion in 2011
0.0
1.0
2.0
Figure 3US-Canada Electricity TradeRevenue, 1990-2011
(Canadian Electricity Association 2011)
103
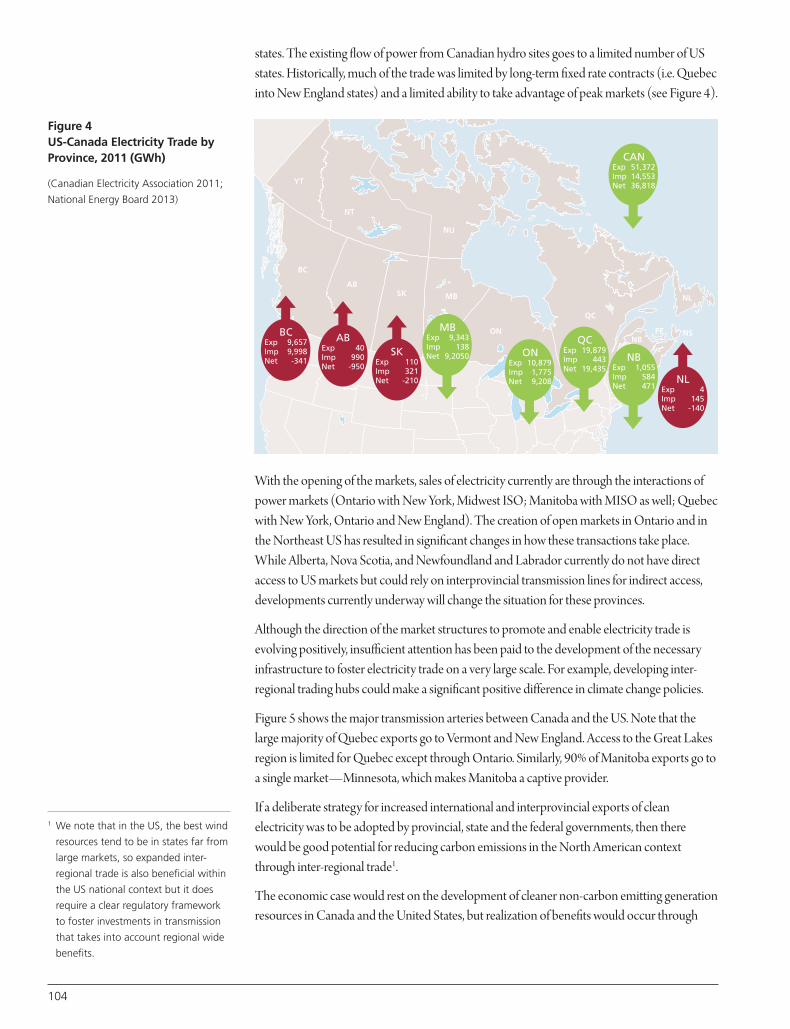
104
states. The existing flow of power from Canadian hydro sites goes to a limited number of USstates. Historically, much of the trade was limited by long-term fixed rate contracts (i.e. Quebecinto New England states) and a limited ability to take advantage of peak markets (see Figure 4).
With the opening of the markets, sales of electricity currently are through the interactions ofpower markets (Ontario with New York, Midwest ISO; Manitoba with MISO as well; Quebecwith New York, Ontario and New England). The creation of open markets in Ontario and inthe Northeast US has resulted in significant changes in how these transactions take place.While Alberta, Nova Scotia, and Newfoundland and Labrador currently do not have directaccess to US markets but could rely on interprovincial transmission lines for indirect access,developments currently underway will change the situation for these provinces.
Although the direction of the market structures to promote and enable electricity trade isevolving positively, insufficient attention has been paid to the development of the necessaryinfrastructure to foster electricity trade on a very large scale. For example, developing inter-regional trading hubs could make a significant positive difference in climate change policies.
Figure 5 shows the major transmission arteries between Canada and the US. Note that thelarge majority of Quebec exports go to Vermont and New England. Access to the Great Lakesregion is limited for Quebec except through Ontario. Similarly, 90% of Manitoba exports go toa single market—Minnesota, which makes Manitoba a captive provider.
If a deliberate strategy for increased international and interprovincial exports of cleanelectricity was to be adopted by provincial, state and the federal governments, then therewould be good potential for reducing carbon emissions in the North American contextthrough inter-regional trade1.
The economic case would rest on the development of cleaner non-carbon emitting generationresources in Canada and the United States, but realization of benefits would occur through
YT
BC
ABSK MB
ON
QC
NL
NSNB
PE
NU
NT
BCExp 9,657Imp 9,998Net -341
ABExp 40Imp 990Net -950
SKExp 110Imp 321Net -210 NL
Exp 4Imp 145Net -140
MBExp 9,343Imp 138Net 9,2050 ON
Exp 10,879Imp 1,775Net 9,208
QCExp 19,879Imp 443Net 19,435
NBExp 1,055Imp 584Net 471
CANExp 51,372Imp 14,553Net 36,818
Figure 4US-Canada Electricity Trade byProvince, 2011 (GWh)
(Canadian Electricity Association 2011;
National Energy Board 2013)
1 We note that in the US, the best wind
resources tend to be in states far from
large markets, so expanded inter-
regional trade is also beneficial within
the US national context but it does
require a clear regulatory framework
to foster investments in transmission
that takes into account regional wide
benefits.

trade on a continent-wide scale made possible by the transmission network. Such an approach– as distinct from arduous negotiations about regulations, or carbon taxes or emission targets– would also introduce more flexibility and ensure reliability of the system. For cost-effectiveinvestments, either in generation or transmission assets, a price on carbon would be necessaryfor optimal decisions.
Canada’s Clean Energy: A Strategic Environmental Advantage
A s the threat of anthropogenic climate change increasingly becomes a concern forpolicy makers, the need for economy-wide decarbonization becomes urgent. In thiscase, clean energy (in the form of electricity from low-carbon energy sources) trade
between Canada and the US offers a strategic environmental advantage from a NorthAmerican perspective.
Evidence of Canada’s clean electricity advantage is found in the existing installed capacity ofthe generation supply mix and the low level of greenhouse gas emissions from the generationoutput. Figure 6 shows the installed base of generation capacity (in GW).
Figure 7 illustrates the significant differences in the mix of generation supplies between the USand Canada on the basis of actual generation (in TWh) as reflected in the capacity utilizationof the installed generation base. Whereas Canada has over 75% clean non-carbon energy(nuclear, wind and hydro) in the mix, the US has only a little over 30%. Coal fire plants accountfor 18% of electricity generation in Canada compared to 44.8% in the US—a 14.8% increasefrom its 2009 level (Canadian Electricity Association 2011) and Ontario is on track tobecoming coal-free by 2014. Canada’s electricity generation contributed 14.2% of thecountry’s total GHG emissions in contrast to the US electric power sector, which accounts for 33.1% of that country’s total GHG emissions.
The abundance of clean energy resources puts Canada in a strong position to expand its low-carbon generation export portfolio. Canada releases 0.122 Mt of CO2 per TWh2 of electricitygeneration compared to 0.58 Mt of CO2 per TWh of electricity in the US (approximately 5
105
Figure 5Major US-Canada TransmissionInterconnections
(Canadian Electricity Association 2011)
YT
BC
ABSK MB
ON
QC
NL
NSNB
PE
NU
NT
500 kV(2)
115 kV
230 kV(2)
230 kV(2)
120 kV(2)
± 450 kV(2)500 kV230 kV
230 kV(3)345 kV
765 kV
120 kV(2)
115 kV230 kV(4)345 kV(2)
345 kV(2)130 kV69 kV(3)
230 kV
2 Alternatively: Canada’s emissions = 34
Mt CO2 per EJ and US = 162 Mt per EJ.
1 EJ = 1018 J = 277.7 TWh
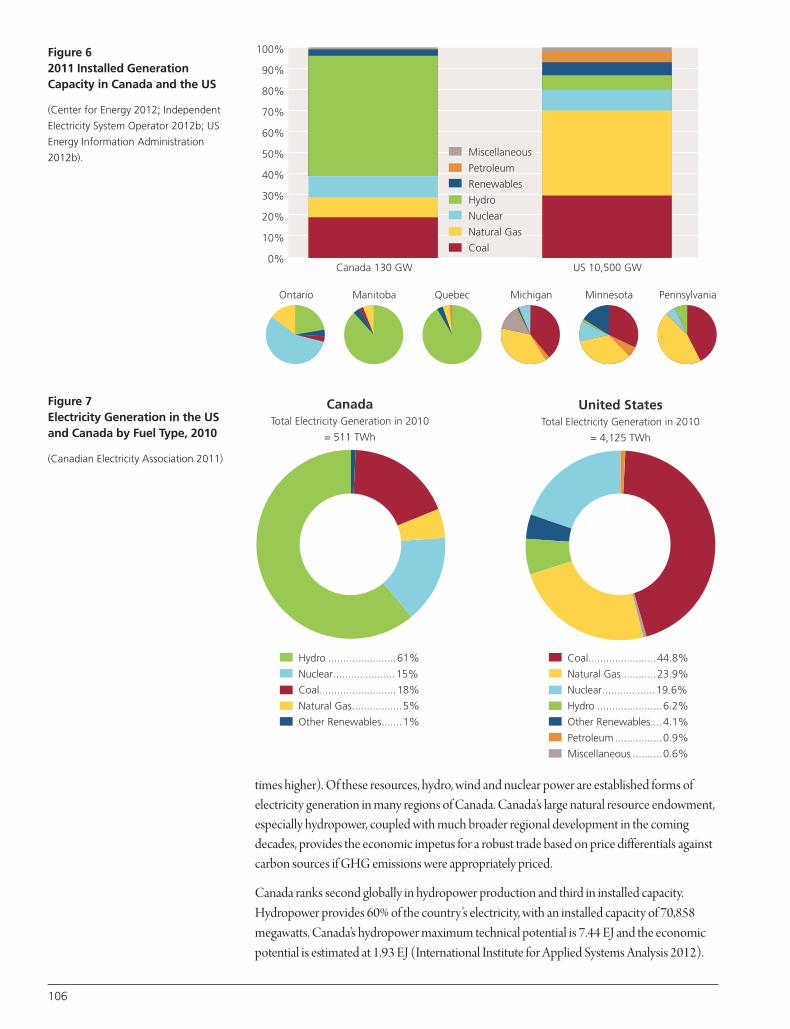
106
times higher). Of these resources, hydro, wind and nuclear power are established forms ofelectricity generation in many regions of Canada. Canada’s large natural resource endowment,especially hydropower, coupled with much broader regional development in the comingdecades, provides the economic impetus for a robust trade based on price differentials againstcarbon sources if GHG emissions were appropriately priced.
Canada ranks second globally in hydropower production and third in installed capacity.Hydropower provides 60% of the country’s electricity, with an installed capacity of 70,858megawatts. Canada’s hydropower maximum technical potential is 7.44 EJ and the economicpotential is estimated at 1.93 EJ (International Institute for Applied Systems Analysis 2012).
100%
90%
80%
70%
60%
50%
40%
30%
20%
10%
0%Canada 130 GW
Ontario Manitoba Quebec Michigan Minnesota Pennsylvania
US 10,500 GW
Miscellaneous
Petroleum
Renewables
Hydro
Nuclear
Natural Gas
Coal
Figure 62011 Installed GenerationCapacity in Canada and the US
(Center for Energy 2012; Independent
Electricity System Operator 2012b; US
Energy Information Administration
2012b).
Figure 7Electricity Generation in the USand Canada by Fuel Type, 2010
(Canadian Electricity Association 2011)
CanadaTotal Electricity Generation in 2010
= 511 TWh
United StatesTotal Electricity Generation in 2010
= 4,125 TWh
Hydro .......................61%
Nuclear.....................15%
Coal..........................18%
Natural Gas.................5%
Other Renewables.......1%
Coal.......................44.8%
Natural Gas............23.9%
Nuclear..................19.6%
Hydro ......................6.2%
Other Renewables....4.1%
Petroleum................0.9%
Miscellaneous ..........0.6%
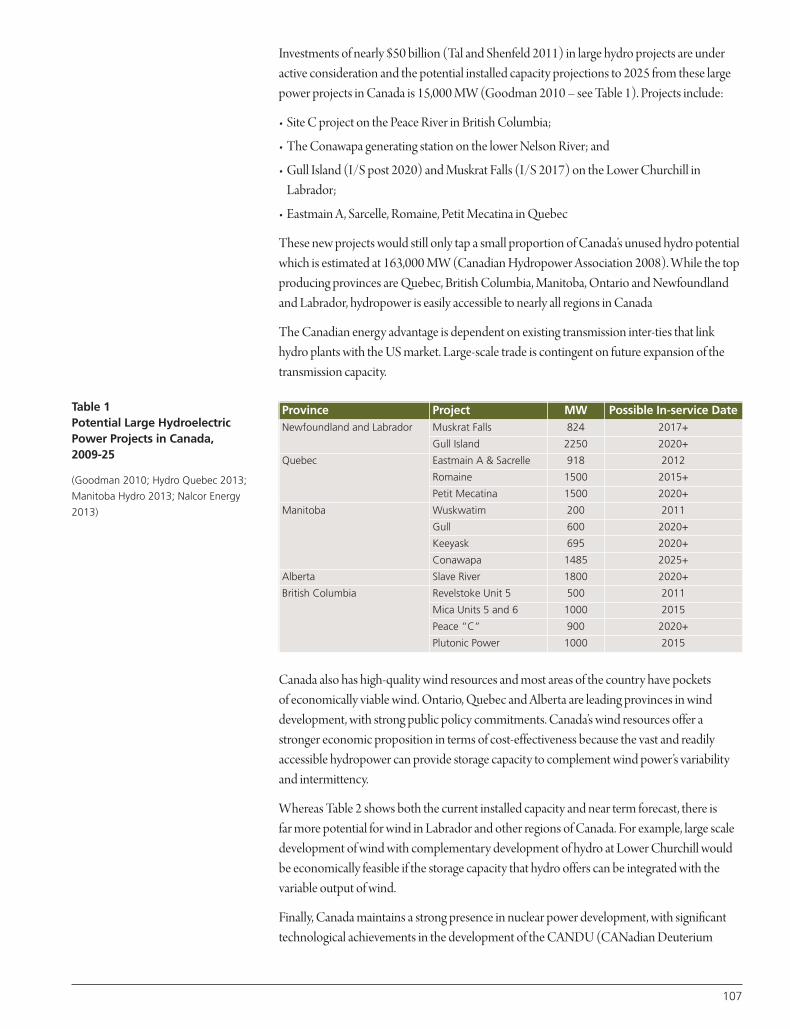
Investments of nearly $50 billion (Tal and Shenfeld 2011) in large hydro projects are underactive consideration and the potential installed capacity projections to 2025 from these largepower projects in Canada is 15,000 MW (Goodman 2010 – see Table 1). Projects include:
• Site C project on the Peace River in British Columbia;
• The Conawapa generating station on the lower Nelson River; and
• Gull Island (I/S post 2020) and Muskrat Falls (I/S 2017) on the Lower Churchill inLabrador;
• Eastmain A, Sarcelle, Romaine, Petit Mecatina in Quebec
These new projects would still only tap a small proportion of Canada’s unused hydro potentialwhich is estimated at 163,000 MW (Canadian Hydropower Association 2008). While the topproducing provinces are Quebec, British Columbia, Manitoba, Ontario and Newfoundlandand Labrador, hydropower is easily accessible to nearly all regions in Canada
The Canadian energy advantage is dependent on existing transmission inter-ties that linkhydro plants with the US market. Large-scale trade is contingent on future expansion of thetransmission capacity.
Canada also has high-quality wind resources and most areas of the country have pockets of economically viable wind. Ontario, Quebec and Alberta are leading provinces in winddevelopment, with strong public policy commitments. Canada’s wind resources offer astronger economic proposition in terms of cost-effectiveness because the vast and readilyaccessible hydropower can provide storage capacity to complement wind power’s variabilityand intermittency.
Whereas Table 2 shows both the current installed capacity and near term forecast, there is far more potential for wind in Labrador and other regions of Canada. For example, large scaledevelopment of wind with complementary development of hydro at Lower Churchill wouldbe economically feasible if the storage capacity that hydro offers can be integrated with thevariable output of wind.
Finally, Canada maintains a strong presence in nuclear power development, with significanttechnological achievements in the development of the CANDU (CANadian Deuterium
107
Table 1Potential Large HydroelectricPower Projects in Canada,2009-25
(Goodman 2010; Hydro Quebec 2013;
Manitoba Hydro 2013; Nalcor Energy
2013)
Province Project MW Possible In-service DateNewfoundland and Labrador Muskrat Falls 824 2017+
Gull Island 2250 2020+
Quebec Eastmain A & Sacrelle 918 2012
Romaine 1500 2015+
Petit Mecatina 1500 2020+
Manitoba Wuskwatim 200 2011
Gull 600 2020+
Keeyask 695 2020+
Conawapa 1485 2025+
Alberta Slave River 1800 2020+
British Columbia Revelstoke Unit 5 500 2011
Mica Units 5 and 6 1000 2015
Peace “C” 900 2020+
Plutonic Power 1000 2015
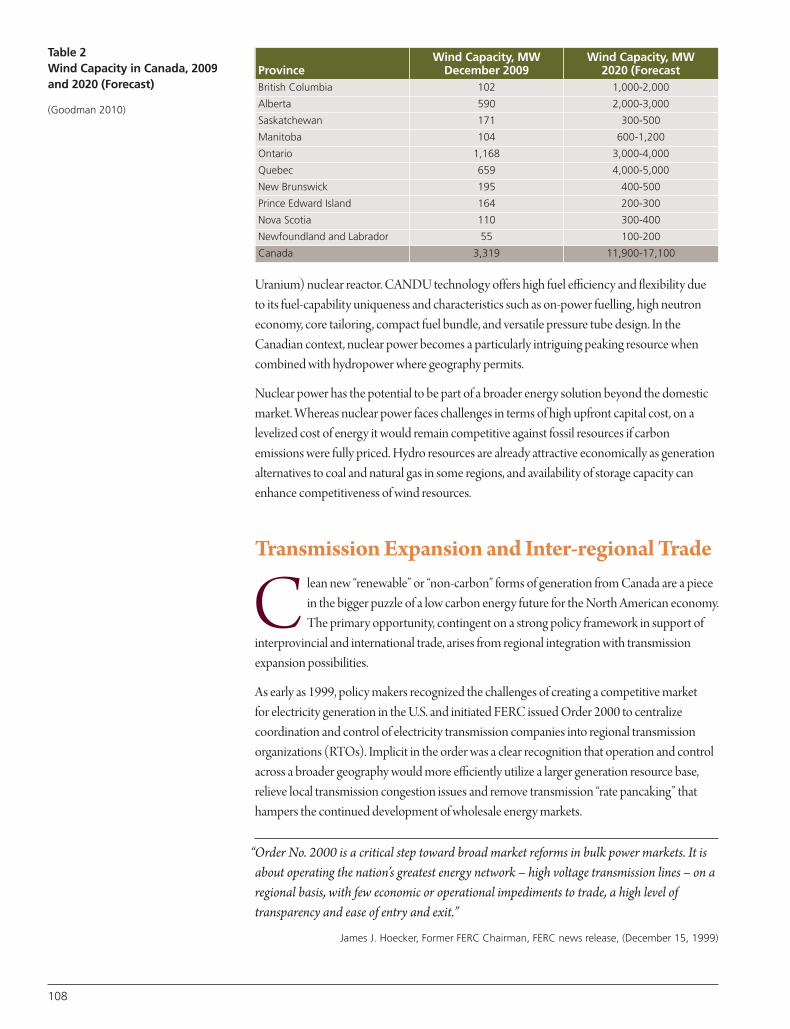
108
Uranium) nuclear reactor. CANDU technology offers high fuel efficiency and flexibility dueto its fuel-capability uniqueness and characteristics such as on-power fuelling, high neutroneconomy, core tailoring, compact fuel bundle, and versatile pressure tube design. In theCanadian context, nuclear power becomes a particularly intriguing peaking resource whencombined with hydropower where geography permits.
Nuclear power has the potential to be part of a broader energy solution beyond the domesticmarket. Whereas nuclear power faces challenges in terms of high upfront capital cost, on alevelized cost of energy it would remain competitive against fossil resources if carbonemissions were fully priced. Hydro resources are already attractive economically as generationalternatives to coal and natural gas in some regions, and availability of storage capacity canenhance competitiveness of wind resources.
Transmission Expansion and Inter-regional Trade
C lean new “renewable” or “non-carbon” forms of generation from Canada are a piecein the bigger puzzle of a low carbon energy future for the North American economy.The primary opportunity, contingent on a strong policy framework in support of
interprovincial and international trade, arises from regional integration with transmissionexpansion possibilities.
As early as 1999, policy makers recognized the challenges of creating a competitive market for electricity generation in the U.S. and initiated FERC issued Order 2000 to centralizecoordination and control of electricity transmission companies into regional transmissionorganizations (RTOs). Implicit in the order was a clear recognition that operation and controlacross a broader geography would more efficiently utilize a larger generation resource base,relieve local transmission congestion issues and remove transmission “rate pancaking” thathampers the continued development of wholesale energy markets.
“Order No. 2000 is a critical step toward broad market reforms in bulk power markets. It isabout operating the nation’s greatest energy network – high voltage transmission lines – on aregional basis, with few economic or operational impediments to trade, a high level oftransparency and ease of entry and exit.”
James J. Hoecker, Former FERC Chairman, FERC news release, (December 15, 1999)
Table 2Wind Capacity in Canada, 2009and 2020 (Forecast)
(Goodman 2010)
ProvinceWind Capacity, MWDecember 2009
Wind Capacity, MW2020 (Forecast
British Columbia 102 1,000-2,000
Alberta 590 2,000-3,000
Saskatchewan 171 300-500
Manitoba 104 600-1,200
Ontario 1,168 3,000-4,000
Quebec 659 4,000-5,000
New Brunswick 195 400-500
Prince Edward Island 164 200-300
Nova Scotia 110 300-400
Newfoundland and Labrador 55 100-200
Canada 3,319 11,900-17,100
The importance of expanded access to and from neighbouring regions to support competitiveelectricity markets has been clearly recognized through various restructurings of the electricitysector around the world.
The concept of expanded transmission capacity and interconnections as part of an inter-regional electricity trading “Hub” creates a wide range of benefits, principally, through lowerprices, improved reliability and positive environmental impact.
Lower Prices
The most significant benefit from an inter-regional trading “Hub” is a more efficient use of generation resources across a broader geography. By strengthening the transmissioninterconnections and removing inter-regional bottlenecks, the market (and utilities) can moreefficiently operate generating resources to meet the hour-by-hour needs of customers across alarger region. Aggregating the generation units would allow the market to utilize limited butvaluable resources during periods of high demand (e.g., storable hydro) and to make better useof the operating characteristics of individual plants (i.e., run base-load plants as base-loadwithout having to “back-down” the units during off-peak hours). Without adequatetransmission investment, these units would remain isolated or inaccessible within theirimmediate locations
Reducing Congestion Costs
Congestion costs are largely driven by local imbalances between supply and demand that areexacerbated by transmission constraints. By improving access to new markets and facilitatinglarger scale energy transfers, the Hub will help reduce inter-regional congestion costs thatunderlie market price differentials. Ultimately, decreased congestion results in lower prices to consumers.
Reducing Price Volatility by Diversifying the Supply Base
Local supply and demand imbalances also contribute to price volatility. Competitive marketsthat are more physically isolated tend to experience greater volatility in price than those withgreater resource diversity and supply liquidity. By creating greater access to generatingresources throughout the region, local imbalances can be mitigated as more competitorsparticipate in meeting energy requirements.
Increased interconnectivity also allows a broader geographic region to benefit from access to a more diverse portfolio of generation sources. Interconnections can provide a hedge againstoutages, equipment failures, and fuel price volatility arising from extreme weather events orbottlenecks in the supply chain for any particular fuel source. Over the past decade, forexample, natural gas prices have exhibited sufficient price volatility to suggest unpredictablereversals of low price forecasts. By providing access to a greater mix of generating resources,energy providers can protect against rising natural gas prices (and periodic spikes in the pricesof other fuels) and thereby lower the overall cost to consumers.
109
110
Improved Reliability
The future cannot be predicted with certainty and thus a robust network helps mitigate therisks associated with unforeseen events. For example, when a large portion of Ontario’s nuclearfleet went down for safety reasons in 1997, the transmission infrastructure protected thecitizens of Ontario from rolling brownouts and blackouts. Similarly, during the 1998 ice storm,Ontario’s interconnectedness helped reduce the impact of severe energy shortages. Withoutthe inter-ties to surrounding regions, far more than 230,000 households would have lostpower as downed transmission lines isolated certain generators from the rest of the grid.
Although the ability to mitigate the impact of a major contingency in the past does notnecessarily guarantee energy system security in the future, system planners in variousjurisdictions have recognized the values of flexibility and strength that existing regionalinterconnections provide to enhance reliability. Leveraging a neighbour’s assets in times ofcrisis is good practice. The ability to provide protection by any one utility across a region is a positive, but unintended, consequence of an inter-regional electricity trade system thatimproves the general robustness of the grid.
Positive Environmental Impact
An inter-regional electricity “Hub” provides significant environmental benefits through a moreefficient use of regional generating resources. By substituting low-emission Canadian hydroand nuclear for high emission thermal generation, aggregate regional emissions are reducedsignificantly.
As the markets for emissions trading develop, Ontario, and Canada as a whole may be able torealize the financial upside of cleaner electricity resources. In doing so, generators avoid costsassociated with the purchase of environmental “pollution credits” and additional equipmentrequired for abatement.
Enhancing Canadian Regional Integration
L ow-carbon generation projects, when developed, would be connected into the high voltage grid in order to deliver their power to markets through strong regionalintegration. Projects to link remote renewable generation (mostly hydro) with major
markets are currently being developed in Canada. The concept of regional integrationopportunities, on a continent-wide scale, is shown in Figure 8.
Integration on a vast geographic scale can also unlock lower cost supply by reducing pricevolatility. For example, it offers opportunities for peak shaving through the utilization ofseasonal diversity between regions. In the US-Canadian context, seasonal factors areparticularly relevant, given that Canada generally has a winter-peaking electricity system whilethe US has a summer-peaking system. Similar complementarities exist between Ontario, nowa summer peaking system, and Quebec, Manitoba and Newfoundland – all winter peakingsystems. Stronger interprovincial connections would create the capacity for arbitrage betweenoff-peak and on-peak prices on a seasonal and diurnal basis. This would allow utilities to bettermanage their resources and optimize their operational needs by meeting their peak demand
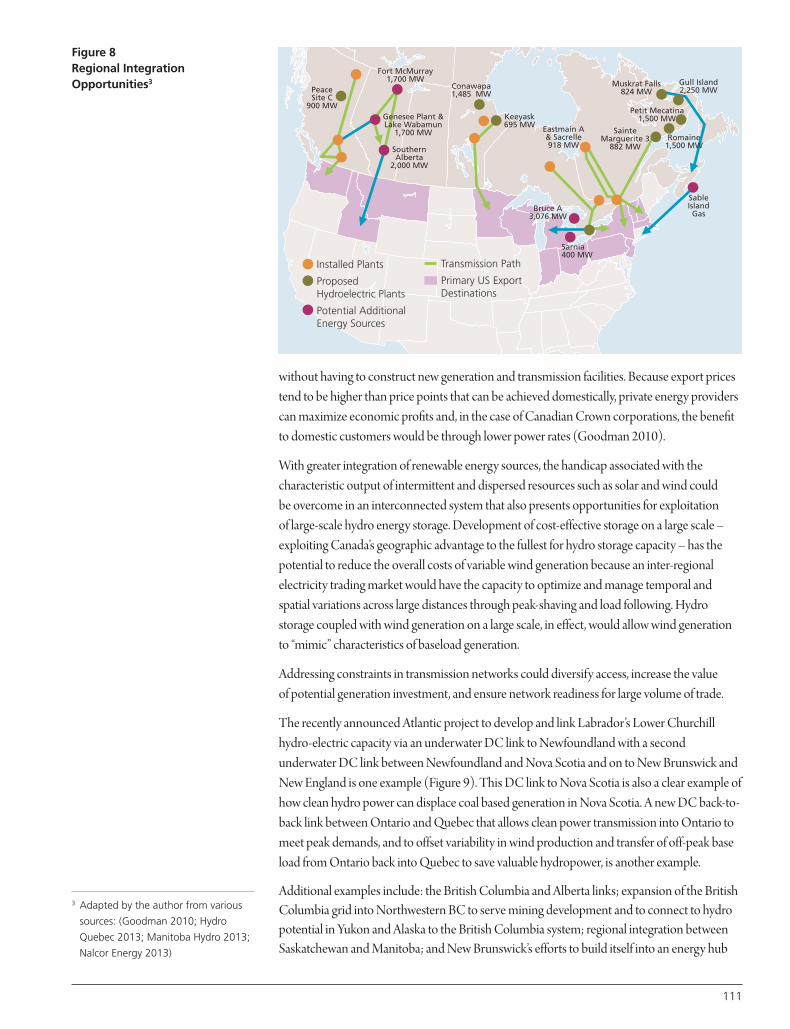
without having to construct new generation and transmission facilities. Because export pricestend to be higher than price points that can be achieved domestically, private energy providerscan maximize economic profits and, in the case of Canadian Crown corporations, the benefitto domestic customers would be through lower power rates (Goodman 2010).
With greater integration of renewable energy sources, the handicap associated with thecharacteristic output of intermittent and dispersed resources such as solar and wind could be overcome in an interconnected system that also presents opportunities for exploitation of large-scale hydro energy storage. Development of cost-effective storage on a large scale –exploiting Canada’s geographic advantage to the fullest for hydro storage capacity – has thepotential to reduce the overall costs of variable wind generation because an inter-regionalelectricity trading market would have the capacity to optimize and manage temporal andspatial variations across large distances through peak-shaving and load following. Hydrostorage coupled with wind generation on a large scale, in effect, would allow wind generationto “mimic” characteristics of baseload generation.
Addressing constraints in transmission networks could diversify access, increase the value of potential generation investment, and ensure network readiness for large volume of trade.
The recently announced Atlantic project to develop and link Labrador’s Lower Churchillhydro-electric capacity via an underwater DC link to Newfoundland with a secondunderwater DC link between Newfoundland and Nova Scotia and on to New Brunswick andNew England is one example (Figure 9). This DC link to Nova Scotia is also a clear example ofhow clean hydro power can displace coal based generation in Nova Scotia. A new DC back-to-back link between Ontario and Quebec that allows clean power transmission into Ontario tomeet peak demands, and to offset variability in wind production and transfer of off-peak baseload from Ontario back into Quebec to save valuable hydropower, is another example.
Additional examples include: the British Columbia and Alberta links; expansion of the BritishColumbia grid into Northwestern BC to serve mining development and to connect to hydropotential in Yukon and Alaska to the British Columbia system; regional integration betweenSaskatchewan and Manitoba; and New Brunswick’s efforts to build itself into an energy hub
111
Figure 8Regional IntegrationOpportunities3
Sarnia400 MW
Fort McMurray1,700 MW
Genesee Plant &Lake Wabamun
1,700 MW
SouthernAlberta
2,000 MW
PeaceSite C
900 MW
Conawapa1,485 MW
Keeyask695 MW Eastmain A
& Sacrelle918 MW
Muskrat Falls824 MW
SainteMarguerite 3
882 MW
Gull Island2,250 MW
SableIslandGas
Romaine1,500 MW
Petit Mecatina1,500 MW
Bruce A3,076 MW
Installed Plants
ProposedHydroelectric Plants
Potential Additional Energy Sources
Transmission Path
Primary US Export Destinations
3 Adapted by the author from various
sources: (Goodman 2010; Hydro
Quebec 2013; Manitoba Hydro 2013;
Nalcor Energy 2013)
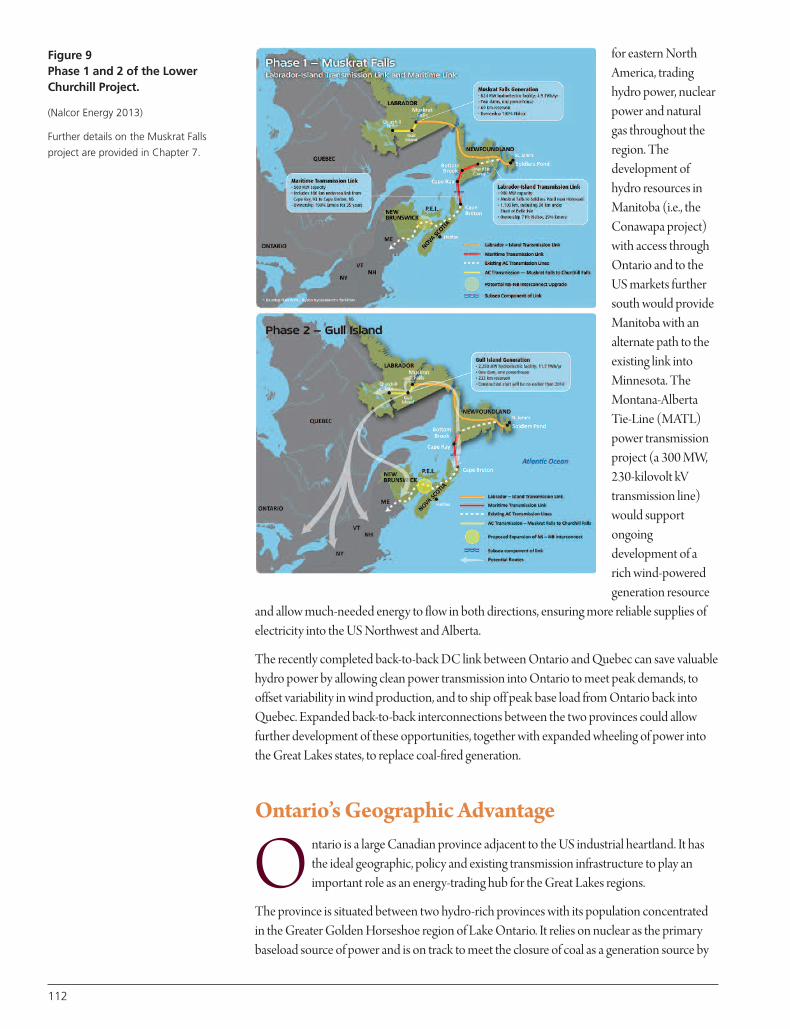
112
for eastern NorthAmerica, tradinghydro power, nuclearpower and naturalgas throughout theregion. Thedevelopment ofhydro resources inManitoba (i.e., theConawapa project)with access throughOntario and to theUS markets furthersouth would provideManitoba with analternate path to theexisting link intoMinnesota. TheMontana-AlbertaTie-Line (MATL)power transmissionproject (a 300 MW,230-kilovolt kVtransmission line)would supportongoingdevelopment of arich wind-poweredgeneration resource
and allow much-needed energy to flow in both directions, ensuring more reliable supplies ofelectricity into the US Northwest and Alberta.
The recently completed back-to-back DC link between Ontario and Quebec can save valuablehydro power by allowing clean power transmission into Ontario to meet peak demands, tooffset variability in wind production, and to ship off peak base load from Ontario back intoQuebec. Expanded back-to-back interconnections between the two provinces could allowfurther development of these opportunities, together with expanded wheeling of power intothe Great Lakes states, to replace coal-fired generation.
Ontario’s Geographic Advantage
O ntario is a large Canadian province adjacent to the US industrial heartland. It hasthe ideal geographic, policy and existing transmission infrastructure to play animportant role as an energy-trading hub for the Great Lakes regions.
The province is situated between two hydro-rich provinces with its population concentratedin the Greater Golden Horseshoe region of Lake Ontario. It relies on nuclear as the primarybaseload source of power and is on track to meet the closure of coal as a generation source by
Figure 9Phase 1 and 2 of the LowerChurchill Project.
(Nalcor Energy 2013)
Further details on the Muskrat Falls
project are provided in Chapter 7.
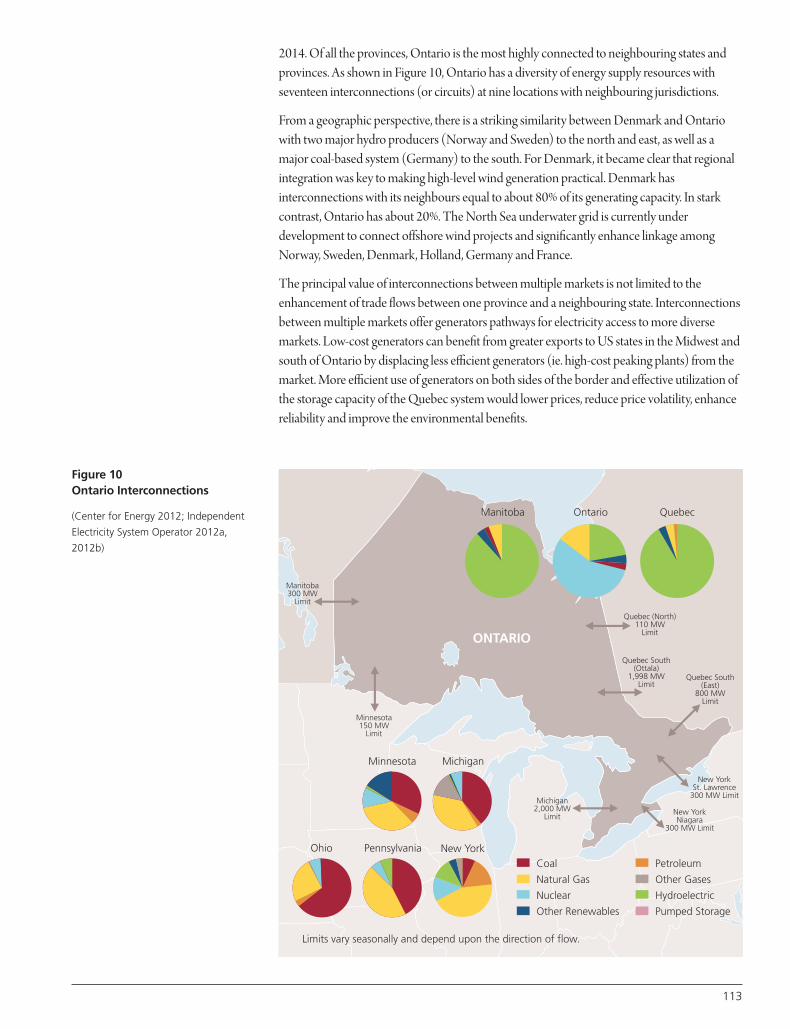
2014. Of all the provinces, Ontario is the most highly connected to neighbouring states andprovinces. As shown in Figure 10, Ontario has a diversity of energy supply resources withseventeen interconnections (or circuits) at nine locations with neighbouring jurisdictions.
From a geographic perspective, there is a striking similarity between Denmark and Ontariowith two major hydro producers (Norway and Sweden) to the north and east, as well as amajor coal-based system (Germany) to the south. For Denmark, it became clear that regionalintegration was key to making high-level wind generation practical. Denmark hasinterconnections with its neighbours equal to about 80% of its generating capacity. In starkcontrast, Ontario has about 20%. The North Sea underwater grid is currently underdevelopment to connect offshore wind projects and significantly enhance linkage amongNorway, Sweden, Denmark, Holland, Germany and France.
The principal value of interconnections between multiple markets is not limited to theenhancement of trade flows between one province and a neighbouring state. Interconnectionsbetween multiple markets offer generators pathways for electricity access to more diversemarkets. Low-cost generators can benefit from greater exports to US states in the Midwest andsouth of Ontario by displacing less efficient generators (ie. high-cost peaking plants) from themarket. More efficient use of generators on both sides of the border and effective utilization ofthe storage capacity of the Quebec system would lower prices, reduce price volatility, enhancereliability and improve the environmental benefits.
Figure 10Ontario Interconnections
(Center for Energy 2012; Independent
Electricity System Operator 2012a,
2012b)
ONTARIO
Coal
Natural Gas
Nuclear
Other Renewables
Petroleum
Other Gases
Hydroelectric
Pumped Storage
Limits vary seasonally and depend upon the direction of flow.
Ontario
Manitoba300 MW
Limit
Quebec (North)110 MW
Limit
Michigan2,000 MW
Limit
Minnesota150 MW
Limit
Manitoba Quebec
MichiganMinnesota
PennsylvaniaOhio New York
Quebec South(Ottala)
1,998 MWLimit
Quebec South(East)
800 MWLimit
New YorkSt. Lawrence
300 MW Limit
New YorkNiagara
300 MW Limit
113
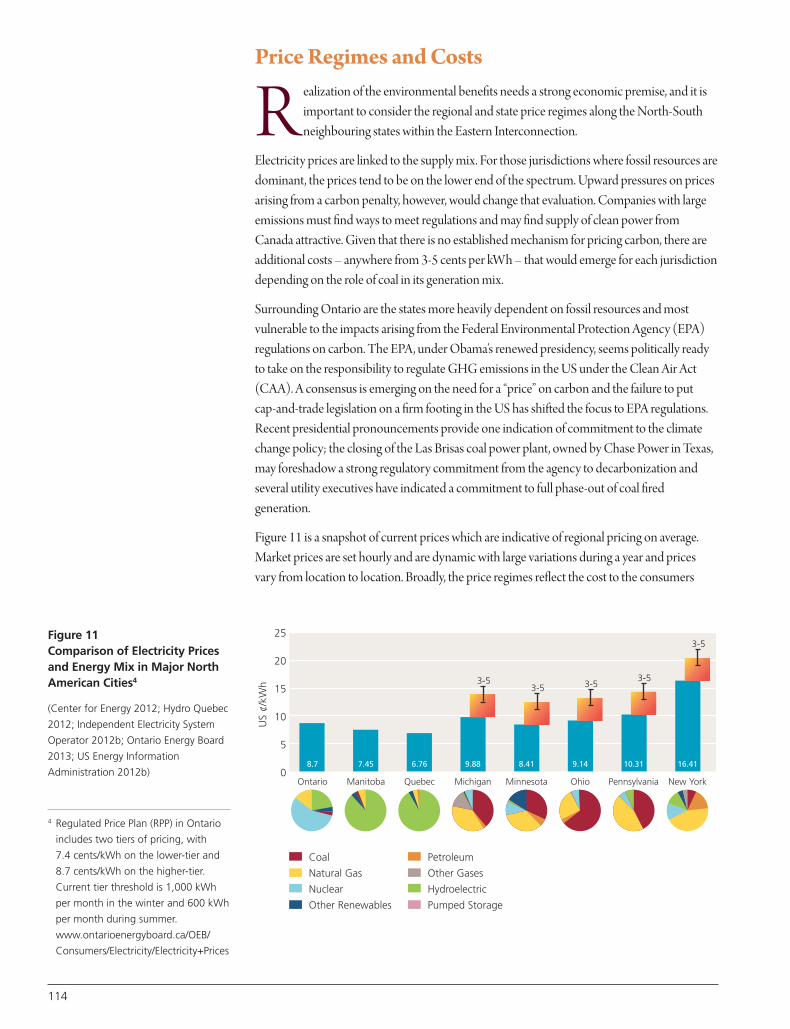
114
Price Regimes and Costs
R ealization of the environmental benefits needs a strong economic premise, and it isimportant to consider the regional and state price regimes along the North-Southneighbouring states within the Eastern Interconnection.
Electricity prices are linked to the supply mix. For those jurisdictions where fossil resources aredominant, the prices tend to be on the lower end of the spectrum. Upward pressures on pricesarising from a carbon penalty, however, would change that evaluation. Companies with largeemissions must find ways to meet regulations and may find supply of clean power fromCanada attractive. Given that there is no established mechanism for pricing carbon, there areadditional costs – anywhere from 3-5 cents per kWh – that would emerge for each jurisdictiondepending on the role of coal in its generation mix.
Surrounding Ontario are the states more heavily dependent on fossil resources and mostvulnerable to the impacts arising from the Federal Environmental Protection Agency (EPA)regulations on carbon. The EPA, under Obama’s renewed presidency, seems politically readyto take on the responsibility to regulate GHG emissions in the US under the Clean Air Act(CAA). A consensus is emerging on the need for a “price” on carbon and the failure to put cap-and-trade legislation on a firm footing in the US has shifted the focus to EPA regulations.Recent presidential pronouncements provide one indication of commitment to the climatechange policy; the closing of the Las Brisas coal power plant, owned by Chase Power in Texas,may foreshadow a strong regulatory commitment from the agency to decarbonization andseveral utility executives have indicated a commitment to full phase-out of coal firedgeneration.
Figure 11 is a snapshot of current prices which are indicative of regional pricing on average.Market prices are set hourly and are dynamic with large variations during a year and pricesvary from location to location. Broadly, the price regimes reflect the cost to the consumers
Figure 11Comparison of Electricity Pricesand Energy Mix in Major NorthAmerican Cities4
(Center for Energy 2012; Hydro Quebec
2012; Independent Electricity System
Operator 2012b; Ontario Energy Board
2013; US Energy Information
Administration 2012b)
Coal
Natural Gas
Nuclear
Other Renewables
25
20
15
US
¢/kW
h
10
5
0
Petroleum
Other Gases
Hydroelectric
Pumped Storage
Ontario Manitoba Quebec Michigan Minnesota PennsylvaniaOhio New York
3-5 3-5 3-5
3-5
3-5
8.7 7.45 6.76 9.88 8.41 10.319.14 16.41
4 Regulated Price Plan (RPP) in Ontario
includes two tiers of pricing, with
7.4 cents/kWh on the lower-tier and
8.7 cents/kWh on the higher-tier.
Current tier threshold is 1,000 kWh
per month in the winter and 600 kWh
per month during summer.
www.ontarioenergyboard.ca/OEB/
Consumers/Electricity/Electricity+Prices
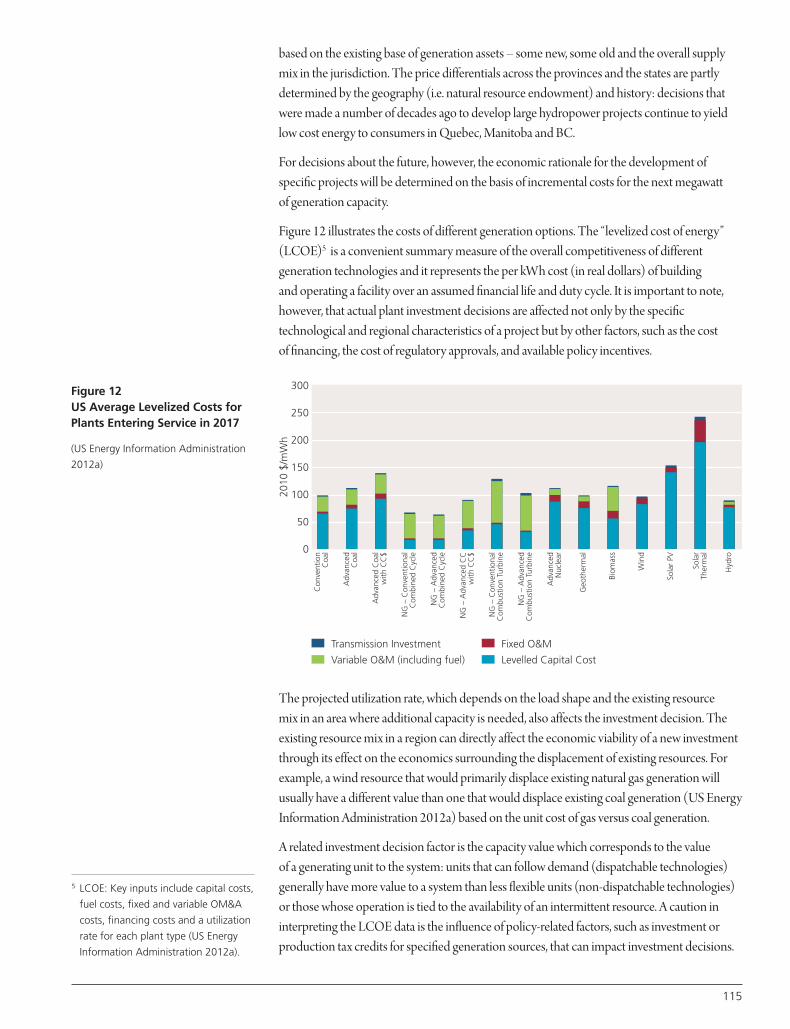
based on the existing base of generation assets – some new, some old and the overall supplymix in the jurisdiction. The price differentials across the provinces and the states are partlydetermined by the geography (i.e. natural resource endowment) and history: decisions thatwere made a number of decades ago to develop large hydropower projects continue to yieldlow cost energy to consumers in Quebec, Manitoba and BC.
For decisions about the future, however, the economic rationale for the development ofspecific projects will be determined on the basis of incremental costs for the next megawatt of generation capacity.
Figure 12 illustrates the costs of different generation options. The “levelized cost of energy”(LCOE)5 is a convenient summary measure of the overall competitiveness of differentgeneration technologies and it represents the per kWh cost (in real dollars) of building and operating a facility over an assumed financial life and duty cycle. It is important to note,however, that actual plant investment decisions are affected not only by the specifictechnological and regional characteristics of a project but by other factors, such as the cost of financing, the cost of regulatory approvals, and available policy incentives.
The projected utilization rate, which depends on the load shape and the existing resource mix in an area where additional capacity is needed, also affects the investment decision. Theexisting resource mix in a region can directly affect the economic viability of a new investmentthrough its effect on the economics surrounding the displacement of existing resources. Forexample, a wind resource that would primarily displace existing natural gas generation willusually have a different value than one that would displace existing coal generation (US EnergyInformation Administration 2012a) based on the unit cost of gas versus coal generation.
A related investment decision factor is the capacity value which corresponds to the value of a generating unit to the system: units that can follow demand (dispatchable technologies)generally have more value to a system than less flexible units (non-dispatchable technologies)or those whose operation is tied to the availability of an intermittent resource. A caution ininterpreting the LCOE data is the influence of policy-related factors, such as investment orproduction tax credits for specified generation sources, that can impact investment decisions.
115
5 LCOE: Key inputs include capital costs,
fuel costs, fixed and variable OM&A
costs, financing costs and a utilization
rate for each plant type (US Energy
Information Administration 2012a).
Figure 12US Average Levelized Costs forPlants Entering Service in 2017
(US Energy Information Administration
2012a)
Transmission Investment
Variable O&M (including fuel)
300
250
200
150
2010
$/m
Wh
100
Con
vent
ion
Coa
l
Adv
ance
dC
oal
Adv
ance
d C
oal
with
CC
$
NG
– C
onve
ntio
nal
Com
bine
d C
ycle
NG
– A
dvan
ced
Com
bine
d C
ycle
NG
– A
dvan
ced
CC
with
CC
$
NG
– C
onve
ntio
nal
Com
bust
ion
Turb
ine
NG
– A
dvan
ced
Com
bust
ion
Turb
ine
Adv
ance
dN
ucle
ar
Geo
ther
mal
Biom
ass
Win
d
Sola
r PV
Sola
rTh
erm
al
Hyd
ro
50
0
Fixed O&M
Levelled Capital Cost
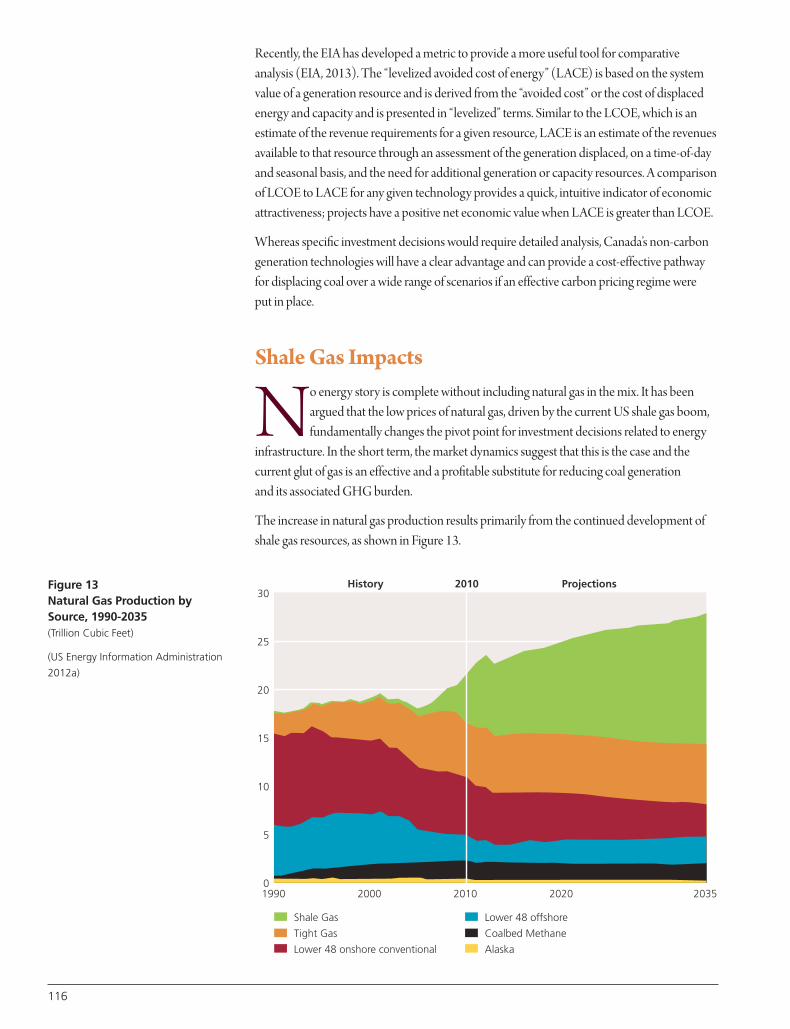
Recently, the EIA has developed a metric to provide a more useful tool for comparativeanalysis (EIA, 2013). The “levelized avoided cost of energy” (LACE) is based on the systemvalue of a generation resource and is derived from the “avoided cost” or the cost of displacedenergy and capacity and is presented in “levelized” terms. Similar to the LCOE, which is anestimate of the revenue requirements for a given resource, LACE is an estimate of the revenuesavailable to that resource through an assessment of the generation displaced, on a time-of-dayand seasonal basis, and the need for additional generation or capacity resources. A comparisonof LCOE to LACE for any given technology provides a quick, intuitive indicator of economicattractiveness; projects have a positive net economic value when LACE is greater than LCOE.
Whereas specific investment decisions would require detailed analysis, Canada’s non-carbongeneration technologies will have a clear advantage and can provide a cost-effective pathwayfor displacing coal over a wide range of scenarios if an effective carbon pricing regime were put in place.
Shale Gas Impacts
No energy story is complete without including natural gas in the mix. It has beenargued that the low prices of natural gas, driven by the current US shale gas boom,fundamentally changes the pivot point for investment decisions related to energy
infrastructure. In the short term, the market dynamics suggest that this is the case and thecurrent glut of gas is an effective and a profitable substitute for reducing coal generation and its associated GHG burden.
The increase in natural gas production results primarily from the continued development ofshale gas resources, as shown in Figure 13.
Figure 13Natural Gas Production bySource, 1990-2035 (Trillion Cubic Feet)
(US Energy Information Administration
2012a)
1990
History 201030
25
20
15
10
5
0
Projections
2000 2010 2020 2035
Shale Gas
Tight Gas
Lower 48 onshore conventional
Lower 48 offshore
Coalbed Methane
Alaska
116
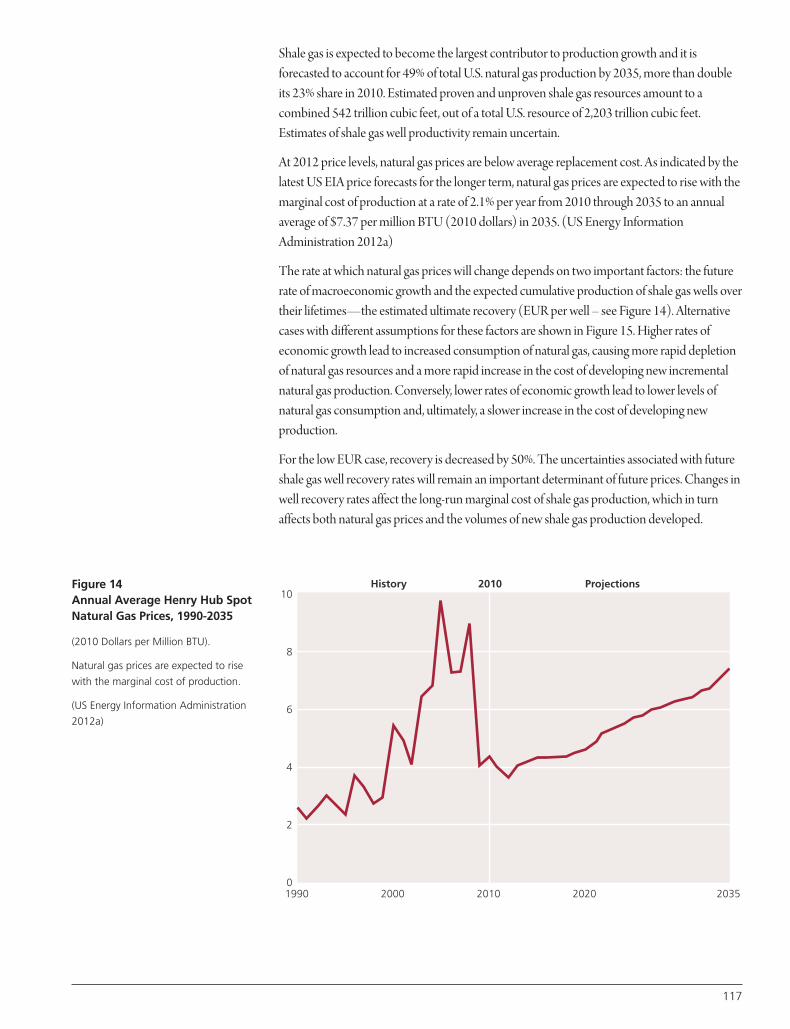
Shale gas is expected to become the largest contributor to production growth and it isforecasted to account for 49% of total U.S. natural gas production by 2035, more than doubleits 23% share in 2010. Estimated proven and unproven shale gas resources amount to acombined 542 trillion cubic feet, out of a total U.S. resource of 2,203 trillion cubic feet.Estimates of shale gas well productivity remain uncertain.
At 2012 price levels, natural gas prices are below average replacement cost. As indicated by thelatest US EIA price forecasts for the longer term, natural gas prices are expected to rise with themarginal cost of production at a rate of 2.1% per year from 2010 through 2035 to an annualaverage of $7.37 per million BTU (2010 dollars) in 2035. (US Energy InformationAdministration 2012a)
The rate at which natural gas prices will change depends on two important factors: the futurerate of macroeconomic growth and the expected cumulative production of shale gas wells overtheir lifetimes—the estimated ultimate recovery (EUR per well – see Figure 14). Alternativecases with different assumptions for these factors are shown in Figure 15. Higher rates ofeconomic growth lead to increased consumption of natural gas, causing more rapid depletionof natural gas resources and a more rapid increase in the cost of developing new incrementalnatural gas production. Conversely, lower rates of economic growth lead to lower levels ofnatural gas consumption and, ultimately, a slower increase in the cost of developing newproduction.
For the low EUR case, recovery is decreased by 50%. The uncertainties associated with futureshale gas well recovery rates will remain an important determinant of future prices. Changes inwell recovery rates affect the long-run marginal cost of shale gas production, which in turnaffects both natural gas prices and the volumes of new shale gas production developed.
Figure 14Annual Average Henry Hub SpotNatural Gas Prices, 1990-2035
(2010 Dollars per Million BTU).
Natural gas prices are expected to rise
with the marginal cost of production.
(US Energy Information Administration
2012a)
1990
History 201010
8
6
4
2
0
Projections
2000 2010 2020 2035
117
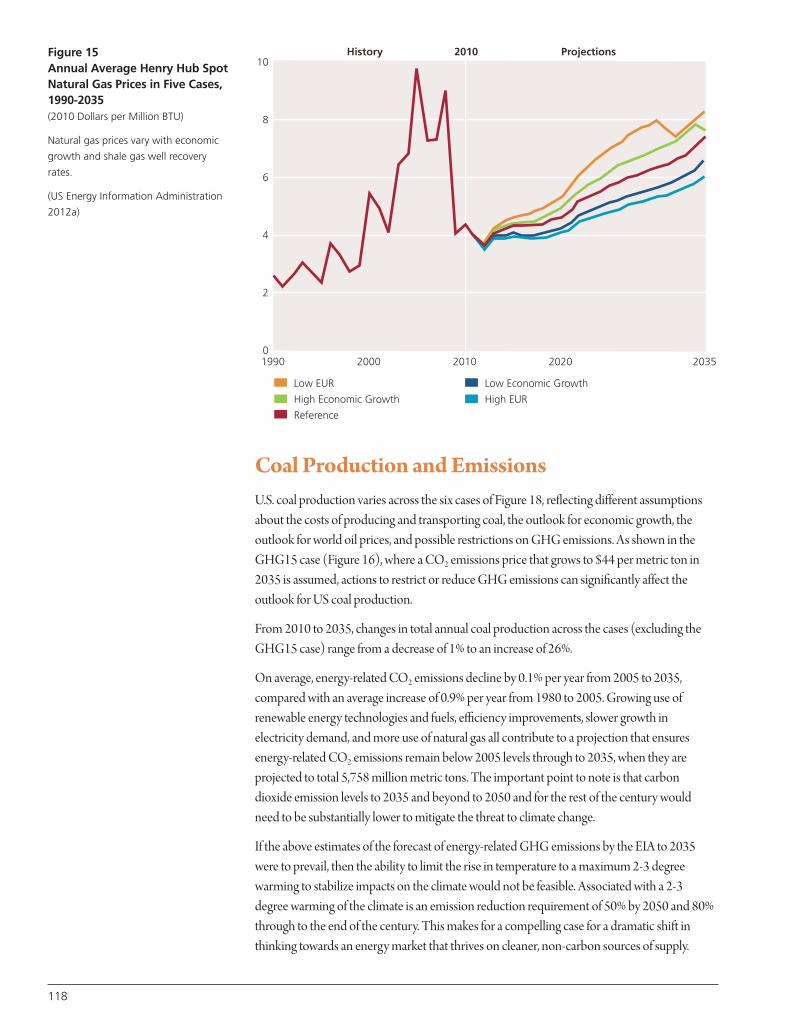
118
Coal Production and EmissionsU.S. coal production varies across the six cases of Figure 18, reflecting different assumptionsabout the costs of producing and transporting coal, the outlook for economic growth, theoutlook for world oil prices, and possible restrictions on GHG emissions. As shown in theGHG15 case (Figure 16), where a CO2 emissions price that grows to $44 per metric ton in2035 is assumed, actions to restrict or reduce GHG emissions can significantly affect theoutlook for US coal production.
From 2010 to 2035, changes in total annual coal production across the cases (excluding theGHG15 case) range from a decrease of 1% to an increase of 26%.
On average, energy-related CO2 emissions decline by 0.1% per year from 2005 to 2035,compared with an average increase of 0.9% per year from 1980 to 2005. Growing use ofrenewable energy technologies and fuels, efficiency improvements, slower growth inelectricity demand, and more use of natural gas all contribute to a projection that ensuresenergy-related CO2 emissions remain below 2005 levels through to 2035, when they areprojected to total 5,758 million metric tons. The important point to note is that carbondioxide emission levels to 2035 and beyond to 2050 and for the rest of the century would need to be substantially lower to mitigate the threat to climate change.
If the above estimates of the forecast of energy-related GHG emissions by the EIA to 2035were to prevail, then the ability to limit the rise in temperature to a maximum 2-3 degreewarming to stabilize impacts on the climate would not be feasible. Associated with a 2-3degree warming of the climate is an emission reduction requirement of 50% by 2050 and 80%through to the end of the century. This makes for a compelling case for a dramatic shift inthinking towards an energy market that thrives on cleaner, non-carbon sources of supply.
Figure 15Annual Average Henry Hub SpotNatural Gas Prices in Five Cases,1990-2035 (2010 Dollars per Million BTU)
Natural gas prices vary with economic
growth and shale gas well recovery
rates.
(US Energy Information Administration
2012a)
1990
History 201010
8
6
4
2
0
Projections
2000 2010 2020 2035
Low EUR
High Economic Growth
Reference
Low Economic Growth
High EUR
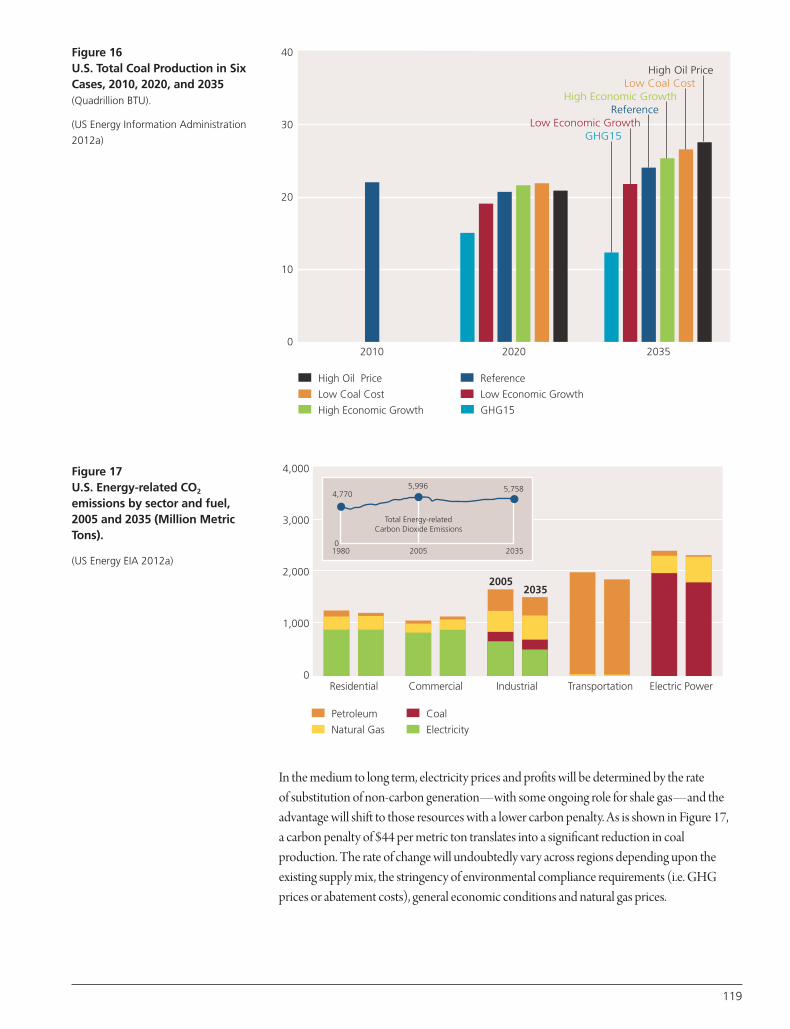
In the medium to long term, electricity prices and profits will be determined by the rate of substitution of non-carbon generation—with some ongoing role for shale gas—and theadvantage will shift to those resources with a lower carbon penalty. As is shown in Figure 17, a carbon penalty of $44 per metric ton translates into a significant reduction in coalproduction. The rate of change will undoubtedly vary across regions depending upon theexisting supply mix, the stringency of environmental compliance requirements (i.e. GHGprices or abatement costs), general economic conditions and natural gas prices.
119
Figure 16U.S. Total Coal Production in SixCases, 2010, 2020, and 2035 (Quadrillion BTU).
(US Energy Information Administration
2012a)
High Oil Price
Low Coal Cost
High Economic Growth
2010 2020 2035
Reference
Low Economic Growth
GHG15
40
30
20
10
0
High Oil PriceLow Coal Cost
High Economic GrowthReference
Low Economic GrowthGHG15
Figure 17U.S. Energy-related CO2
emissions by sector and fuel,2005 and 2035 (Million MetricTons).
(US Energy EIA 2012a)
4,000
3,000
2,000
1,000
0Residential Commercial Industrial Transportation Electric Power
Petroleum
Natural Gas
Coal
Electricity
4,770 5,996
01980 2005
20052035
Total Energy-relatedCarbon Dioxide Emissions
2035
5,758
120
While Canada is well-equipped with clean energy capacity that is economically attractive forexport, trading of electricity in the North American context would not make sense if it bringsinefficiency, higher power prices, decreased reliability or creates large environmental liabilities.
Canada’s clean electricity advantage can be realized through new transmission upgrades thatwould increase the available markets for Canadian generation in the US Northeast and to thesouth and west of Ontario. Such transmission upgrades would also offer a good possibility foroptimizing power flows that can exploit diurnal and seasonal arbitrage through storage ofhydro resources. Production from different generation resources can be brought intoalignment and optimized for cost and environmental performance even if the generationresources are spread over a large area. The adequacy of transmission capability becomes a key facet of how this can be achieved on a continent-wide scale. This promise needs to beexplored fully.
Summary and Conclusions
I n this chapter, it is argued that Canada’s low carbon electricity advantage is capable of making a major contribution to the reduction of greenhouse gases (GHGs) on acontinent-wide scale through a strategy that has, at its core, the promotion of inter-
regional trade in electricity. Large scale trade in electricity, across provincial and nationalboundaries, is a cost effective mechanism for alignment of Canada’s climate change policiesrequired for a transition to a low-carbon energy economy.
Enhanced electricity trade – an increase from present levels by ten to twenty-fold or higher to a level greater than $40 billion per year – between Canada and the US offers a strategicenvironmental and economical advantage that would benefit the entire North Americaneconomy. Such an epochal change is conceivable over a 30-50 year time frame consistent with the time lines for achieving a low carbon energy economy.
Realizing the full potential of clean electricity exports from Canada to the US through anexpanded power grid requires the provinces, states and federal government to establish a clear policy framework and specific mechanisms to reduce barriers to investment and to thedevelopment and approval of specific projects. Upgrades to the existing interconnections andtransmission system would be necessary to overcome the current limits to large-scale trade.
Electricity generation is a “high value” manufactured good that has the promise and potentialof delivering large economic benefits through inter-regional trade enabled by transmission andinterconnections.
To achieve such a goal, however, will require a dramatic shift away from the “provincial self-sufficiency paradigm” to a coherent national energy strategy. Congruent with climate changepolicies, large scale electricity trade is a promising pathway to a lower carbon energy future forNorth America. This is in contrast to a climate change policy focused primarily on regulations,targets and treaties.
121
Baker, Barbara et al. 2011. Canada’s Electricity Infrastructure: Building a Case for Investment.
The Conference Board of Canada.
Bernard, Jean-Thomas. 2003. Seamless Electricity Trade between Canada and US Northeast.
Quebec: Universite Laval, Department of Economics.
Blue, Ian. 2009. “Off the Grid: Jurisdiction and the Canadian Electricity Sector.” The Dalhousie
Law Journal 32.
Canadian Academy of Engineering. 2010. Electricity: Interconnecting Canada, A Strategic
Advantage. Ottawa: Canadian Academy of Engineering.
Canadian Electricity Association. 2011. Canada’s Electricity Industry. Canadian Electricity
Association.
Canadian Hydropower Association. 2008. Hydropower in Canada: Past, Present and Future.
Canadian Hydropower Association.
Carr, Jan. 2010. Power Sharing: Developing Inter-Provincial Electricity Trade. C.D. Howe
Institute. C.D. Howe Institute Commentary.
Center for Energy. 2012. “Energy Facts & Statistics.” centreforenergy.com.
http://www.centreforenergy.com/FactsStats.
Cooper, Daniel E. 2011. “What’s Happening with NERC Reliability Standards.” Michigan
Municipal Electric Association Currents Newsletter.
Goodman, Roger J. 2010. Power Connections: Canadian Electricity Trade and Foreign Policy.
Canadian International Council.
Hydro Quebec. 2012. Comparison of Electricity Prices in Major North American Cities: Rates in
Effect April 1, 2012. Hydro Quebec.
Hydro Quebec. 2013. “Eastmain-A/Sacrelle/Rupert Project.” Hydroquebec.com.
http://www.hydroquebec.com/rupert/en/.
Independent Electricity System Operator. 2012a. Ontario Transmission System. Independent
Electricity System Operator (IESO).
Independent Electricity System Operator. 2012b. “Supply Review.”
http://www.ieso.ca/imoweb/media/md_supply.asp.
International Institute for Applied Systems Analysis. 2012. Global Energy Assessment.
International Institute for Applied Systems Analysis (IIASA).
Manitoba Hydro. 2013. “Conawapa Generating Station.” hydro.mb.ca.
http://www.hydro.mb.ca/projects/conawapa/index.shtml.
Nalcor Energy. 2013. “Lower Churchill Project.” http://www.nalcorenergy.com/Lower-Churchill-
Project.asp.
National Energy Board. 2013. “Electricity Export and Imports 2011.” http://www.neb.gc.ca/clf-
nsi/rnrgynfmtn/sttstc/lctrctyxprtmprt/lctrctyxprtmprt-eng.html.
North American Electric Reliability Corporation. 2012. “NERC Regional Entities.”
http://www.nerc.com/page.php?cid=1%7C9%7C119.
Office of the United States Trade Representative. 2012. “US-Canada Trade Fact.”
http://www.ustr.gov/countries-regions/americas/canada.
Ontario Energy Board. 2013. “Electricity Prices.”
http://www.ontarioenergyboard.ca/OEB/Consumers/Electricity/Electricity+Prices.
Pembina Institute, and David Suzuki Foundation. 2009. "Climate Leadership, Economic
Prosperity: Final Report on an Economic Study of Greenhouse Gas Targets and Policies for
Canada.” Ottawa: Pembina Institute and David Suzuki Foundation.
Tal, Benjamin, and Avery Shenfeld. 2011. Energizing Infrastructure. Toronto: CIBC World
Markets Inc.
Works Cited
122
US Energy Information Administration. 2012a. Annual Energy Outlook 2012 with Projections
to 2035. US Energy Information Administration (EIA).
US Energy Information Administration. 2012b. State Electricity Profiles 2010. US Energy
Information Administration (EIA).
US Energy Information Administration. 2013. Assessing the economic value of new utility scale
renewable generation, Chris Namovicz, (EIA)
The author would like to acknowledge the important contributions of Mr. Steve Dorey, Chairof the Energy Council of Canada’s Studies Committee, in helping shape the concepts and ideas
to foster inter-regional trade in the North American context and Zhewen Chen as a co-author
for an earlier version of the concept paper. The author would also like to acknowledge the
Ontario Council of Universities for support through the Ontario Research Chair Program.
Professor Jatin Nathwani is the founding Executive Director, Waterloo Institute for Sustainable
Energy (WISE). The Institute comprises 95 plus faculty members drawn from all the six faculties
at the University of Waterloo. As the Executive Director, he provides leadership to the Institute’s
research and development efforts to foster the development of large-scale multi-disciplinary
research projects in close collaboration with business, industry, government and civil society
groups. The vision of the Institute is simple: clean energy, accessible and affordable for all. His
current focus is on energy policy developments to enable the social and technological
innovations required for the transition of the global energy system to a lower carbon energy
economy for long term sustainability. Energy research at WISE spans the full range of
renewable energy technologies, energy storage, smart energy networks, sustainable mobility
and ICT for micro-power and off-grid access. For additional information, please see:
www.wise.uwaterloo.ca. Prof. Nathwani’s experience in the Canadian energy sector includes
corporate planning and strategy, sector policy developments, regulatory affairs, innovation and
R&D linkages and long term plans for the energy sector. He has advised the Ontario Power
Authority and the Ministry of Energy on evolving electricity sector issues. Prof. Nathwani serves
on several Boards at the provincial and national levels and has appeared frequently in the
media (print, TV, radio) and has over 100 publications related to energy and risk management,
including seven books.
Acknowledgments
Biography
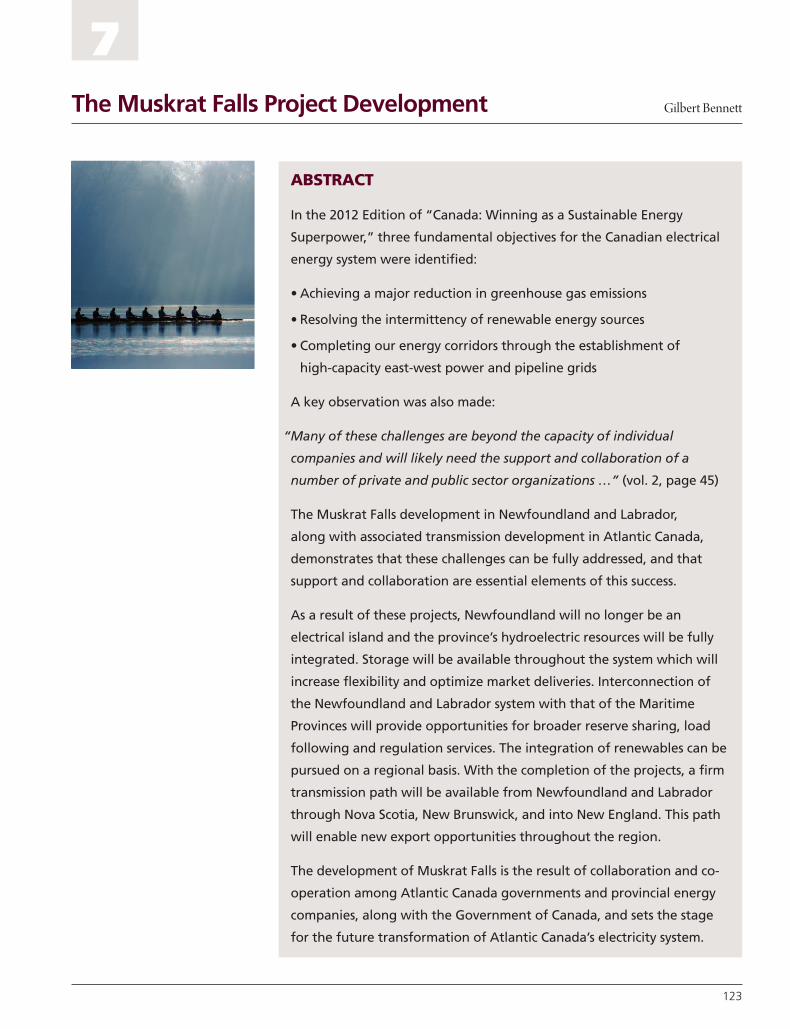
123
ABSTRACT
In the 2012 Edition of “Canada: Winning as a Sustainable Energy
Superpower,” three fundamental objectives for the Canadian electrical
energy system were identified:
• Achieving a major reduction in greenhouse gas emissions
• Resolving the intermittency of renewable energy sources
• Completing our energy corridors through the establishment of
high-capacity east-west power and pipeline grids
A key observation was also made:
“Many of these challenges are beyond the capacity of individual
companies and will likely need the support and collaboration of a
number of private and public sector organizations …” (vol. 2, page 45)
The Muskrat Falls development in Newfoundland and Labrador,
along with associated transmission development in Atlantic Canada,
demonstrates that these challenges can be fully addressed, and that
support and collaboration are essential elements of this success.
As a result of these projects, Newfoundland will no longer be an
electrical island and the province’s hydroelectric resources will be fully
integrated. Storage will be available throughout the system which will
increase flexibility and optimize market deliveries. Interconnection of
the Newfoundland and Labrador system with that of the Maritime
Provinces will provide opportunities for broader reserve sharing, load
following and regulation services. The integration of renewables can be
pursued on a regional basis. With the completion of the projects, a firm
transmission path will be available from Newfoundland and Labrador
through Nova Scotia, New Brunswick, and into New England. This path
will enable new export opportunities throughout the region.
The development of Muskrat Falls is the result of collaboration and co-
operation among Atlantic Canada governments and provincial energy
companies, along with the Government of Canada, and sets the stage
for the future transformation of Atlantic Canada’s electricity system.
The Muskrat Falls Project Development Gilbert Bennett
7
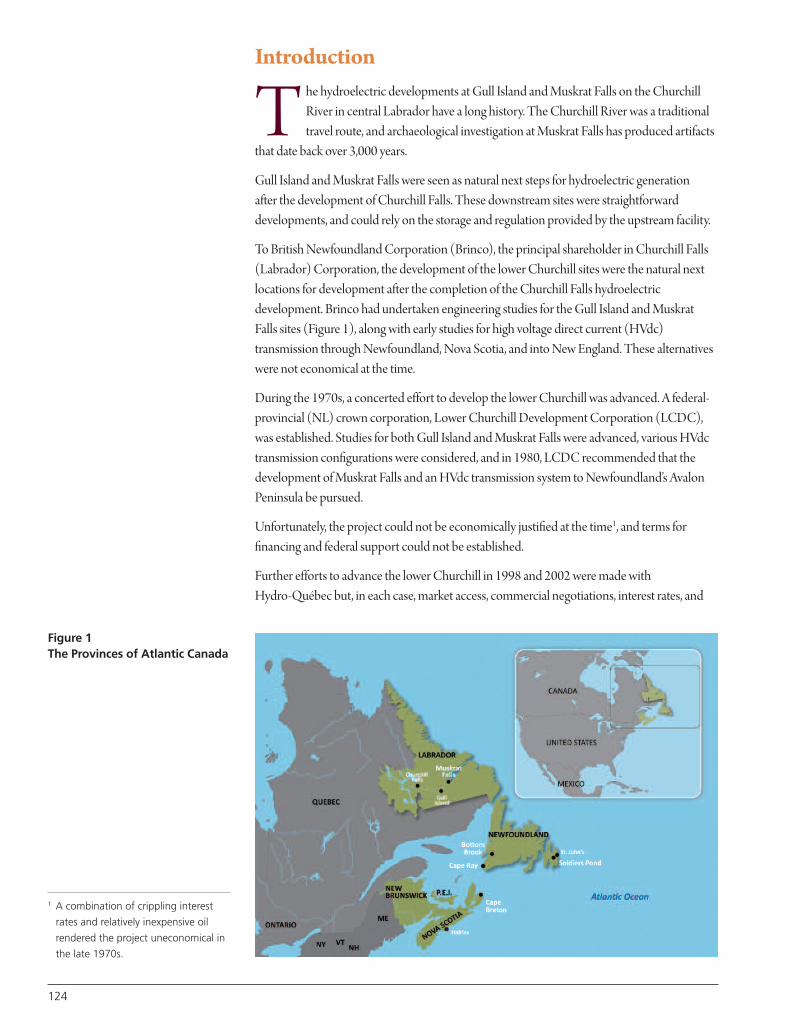
Introduction
T he hydroelectric developments at Gull Island and Muskrat Falls on the ChurchillRiver in central Labrador have a long history. The Churchill River was a traditionaltravel route, and archaeological investigation at Muskrat Falls has produced artifacts
that date back over 3,000 years.
Gull Island and Muskrat Falls were seen as natural next steps for hydroelectric generation after the development of Churchill Falls. These downstream sites were straightforwarddevelopments, and could rely on the storage and regulation provided by the upstream facility.
To British Newfoundland Corporation (Brinco), the principal shareholder in Churchill Falls(Labrador) Corporation, the development of the lower Churchill sites were the natural nextlocations for development after the completion of the Churchill Falls hydroelectricdevelopment. Brinco had undertaken engineering studies for the Gull Island and MuskratFalls sites (Figure 1), along with early studies for high voltage direct current (HVdc)transmission through Newfoundland, Nova Scotia, and into New England. These alternativeswere not economical at the time.
During the 1970s, a concerted effort to develop the lower Churchill was advanced. A federal-provincial (NL) crown corporation, Lower Churchill Development Corporation (LCDC),was established. Studies for both Gull Island and Muskrat Falls were advanced, various HVdctransmission configurations were considered, and in 1980, LCDC recommended that thedevelopment of Muskrat Falls and an HVdc transmission system to Newfoundland’s AvalonPeninsula be pursued.
Unfortunately, the project could not be economically justified at the time1, and terms forfinancing and federal support could not be established.
Further efforts to advance the lower Churchill in 1998 and 2002 were made with Hydro-Québec but, in each case, market access, commercial negotiations, interest rates, and
Figure 1The Provinces of Atlantic Canada
1 A combination of crippling interest
rates and relatively inexpensive oil
rendered the project uneconomical in
the late 1970s.
124
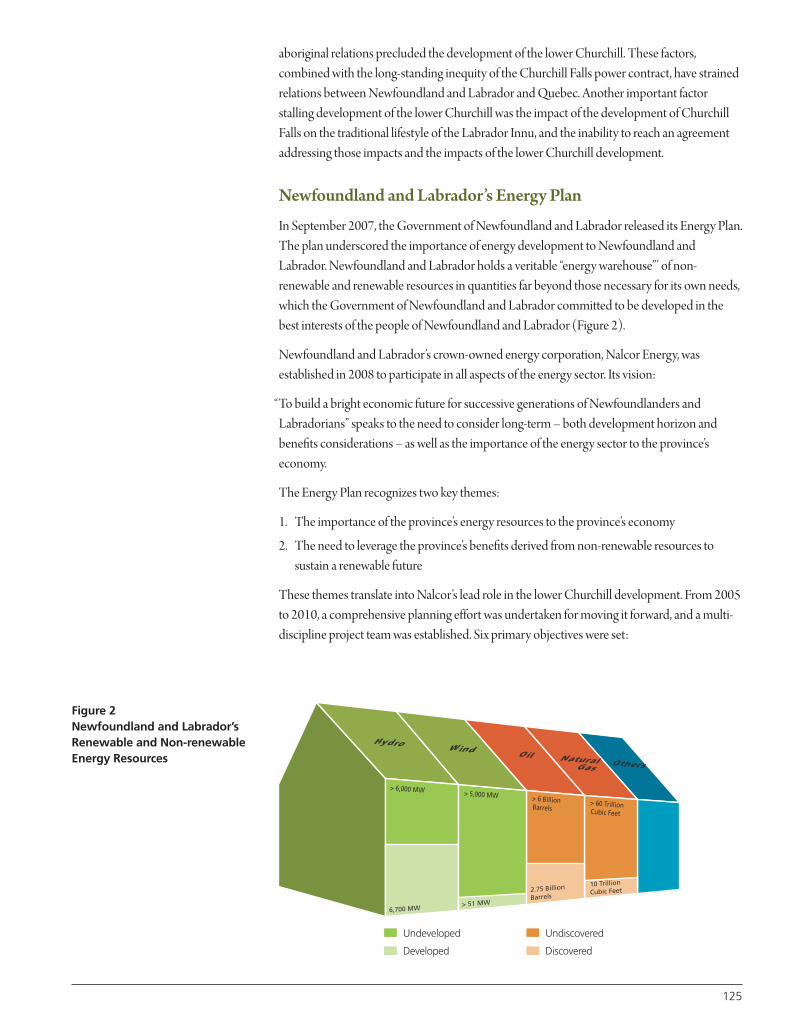
aboriginal relations precluded the development of the lower Churchill. These factors,combined with the long-standing inequity of the Churchill Falls power contract, have strainedrelations between Newfoundland and Labrador and Quebec. Another important factorstalling development of the lower Churchill was the impact of the development of ChurchillFalls on the traditional lifestyle of the Labrador Innu, and the inability to reach an agreementaddressing those impacts and the impacts of the lower Churchill development.
Newfoundland and Labrador’s Energy Plan
In September 2007, the Government of Newfoundland and Labrador released its Energy Plan.The plan underscored the importance of energy development to Newfoundland andLabrador. Newfoundland and Labrador holds a veritable “energy warehouse”’ of non-renewable and renewable resources in quantities far beyond those necessary for its own needs,which the Government of Newfoundland and Labrador committed to be developed in thebest interests of the people of Newfoundland and Labrador (Figure 2).
Newfoundland and Labrador’s crown-owned energy corporation, Nalcor Energy, wasestablished in 2008 to participate in all aspects of the energy sector. Its vision:
“To build a bright economic future for successive generations of Newfoundlanders andLabradorians” speaks to the need to consider long-term – both development horizon andbenefits considerations – as well as the importance of the energy sector to the province’seconomy.
The Energy Plan recognizes two key themes:
1. The importance of the province’s energy resources to the province’s economy
2. The need to leverage the province’s benefits derived from non-renewable resources tosustain a renewable future
These themes translate into Nalcor’s lead role in the lower Churchill development. From 2005to 2010, a comprehensive planning effort was undertaken for moving it forward, and a multi-discipline project team was established. Six primary objectives were set:
Figure 2Newfoundland and Labrador’sRenewable and Non-renewableEnergy Resources
2.75 Billion
Barrels
10 Trillion
Cubic Feet
6,700 MW
> 6,000 MW > 5,000 MW > 6 BillionBarrels
> 60 TrillionCubic Feet
> 51 MW
Undeveloped
Developed
Undiscovered
Discovered
Hydro
Others
Wind Oil NaturalGas
125
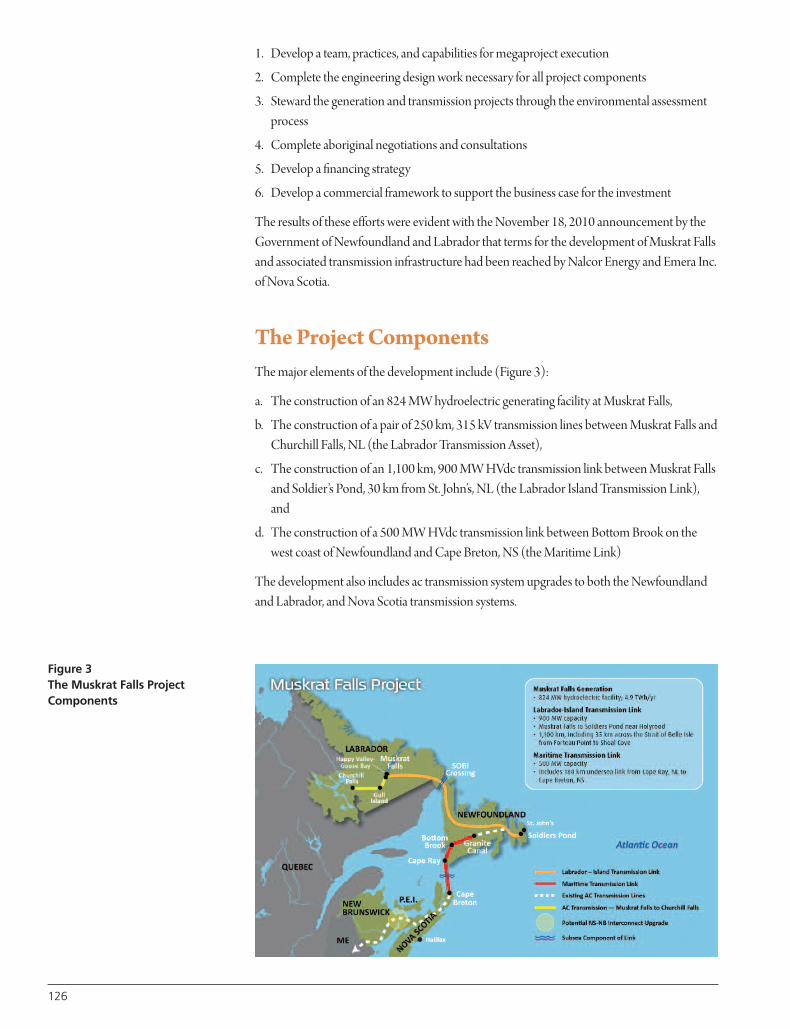
1. Develop a team, practices, and capabilities for megaproject execution
2. Complete the engineering design work necessary for all project components
3. Steward the generation and transmission projects through the environmental assessmentprocess
4. Complete aboriginal negotiations and consultations
5. Develop a financing strategy
6. Develop a commercial framework to support the business case for the investment
The results of these efforts were evident with the November 18, 2010 announcement by theGovernment of Newfoundland and Labrador that terms for the development of Muskrat Fallsand associated transmission infrastructure had been reached by Nalcor Energy and Emera Inc.of Nova Scotia.
The Project ComponentsThe major elements of the development include (Figure 3):
a. The construction of an 824 MW hydroelectric generating facility at Muskrat Falls,
b. The construction of a pair of 250 km, 315 kV transmission lines between Muskrat Falls andChurchill Falls, NL (the Labrador Transmission Asset),
c. The construction of an 1,100 km, 900 MW HVdc transmission link between Muskrat Fallsand Soldier’s Pond, 30 km from St. John’s, NL (the Labrador Island Transmission Link),and
d. The construction of a 500 MW HVdc transmission link between Bottom Brook on thewest coast of Newfoundland and Cape Breton, NS (the Maritime Link)
The development also includes ac transmission system upgrades to both the Newfoundlandand Labrador, and Nova Scotia transmission systems.
Figure 3The Muskrat Falls ProjectComponents
126

The commercial underpinnings of the development, however, clearly establish long-termbenefits for both Newfoundland and Labrador, and Nova Scotia electricity customers, andestablish a foundation for further opportunities for regional benefits.
Newfoundland and Labrador’s Electrical Options
A key factor leading to the development of Muskrat Falls was an evaluation of the lowest costelectricity supply option for the island of Newfoundland. While approximately 80% ofNewfoundland’s electricity supply is derived from hydroelectric generation, includinggenerating facilities at Bay d’Espoir, Cat Arm, Upper Salmon River, Hinds Lake, and GraniteCanal, the largest and most attractive generation sources have been developed, and thermalgeneration will dominate Newfoundland’s future electricity supply. Newfoundland’s electricalsystem is isolated from North America, and opportunities for integrating non-dispatchablerenewables such as wind are limited.
An optimized portfolio of generation expansion alternatives with the island of Newfoundlandoperating on an isolated basis (Newfoundland’s Isolated Island Alternative) was compared toan optimized portfolio that included Muskrat Falls and the Labrador-Island Transmission Link(Newfoundland’s Interconnected Island Alternative). The Interconnected Island Alternativedemonstrated a $2.4 billion2 cumulative present worth preference over the Isolated IslandAlternative.
Muskrat Falls, however, will provide substantially more energy than will be required by theisland of Newfoundland, and efforts to develop value for this surplus focused on Nova Scotia.
Nova Scotia’s Energy Outlook
Nova Scotia is heavily dependent on thermal generation, with thermal alternatives making up80% of the energy supply in that province. In 2010, the Government of Nova Scotiaintroduced legislation requiring that 25% of Nova Scotia’s energy supply be derived fromrenewable alternatives by 2015, growing to 40% in 2020. Energy from Muskrat Falls qualifiedfor inclusion under Nova Scotia’s regulations. With a surplus of energy from Muskrat Falls anda market for renewable energy in Nova Scotia, Nalcor and Emera turned their attention todeveloping a technical solution to deliver energy from Muskrat Falls and to develop a businesscase for that solution.
In some jurisdictions, renewable portfolio standards are sometimes limited to only includedomestic projects, and the Government of Nova Scotia’s decision to qualify imported energyas a renewable source was a key factor in facilitating this regional project, as energy suppliedfrom Muskrat Falls was demonstrated as the lowest-cost means of meeting Nova Scotia’srenewable energy targets.
Canada’s Support
Requests for support of the lower Churchill development have been made by successivegovernments of Newfoundland and Labrador, and on November 30, 2012, Prime MinisterHarper announced Canada’s commitment to a federal loan guarantee for the projects. Theloan guarantee was predicated on it demonstrating benefits not just for Newfoundland andLabrador, but on a regional basis to Atlantic Canada.
127
2 This analysis, completed in October
2012, was based on the Project
obtaining a loan guarantee from the
Government of Canada, which was
ultimately obtained.
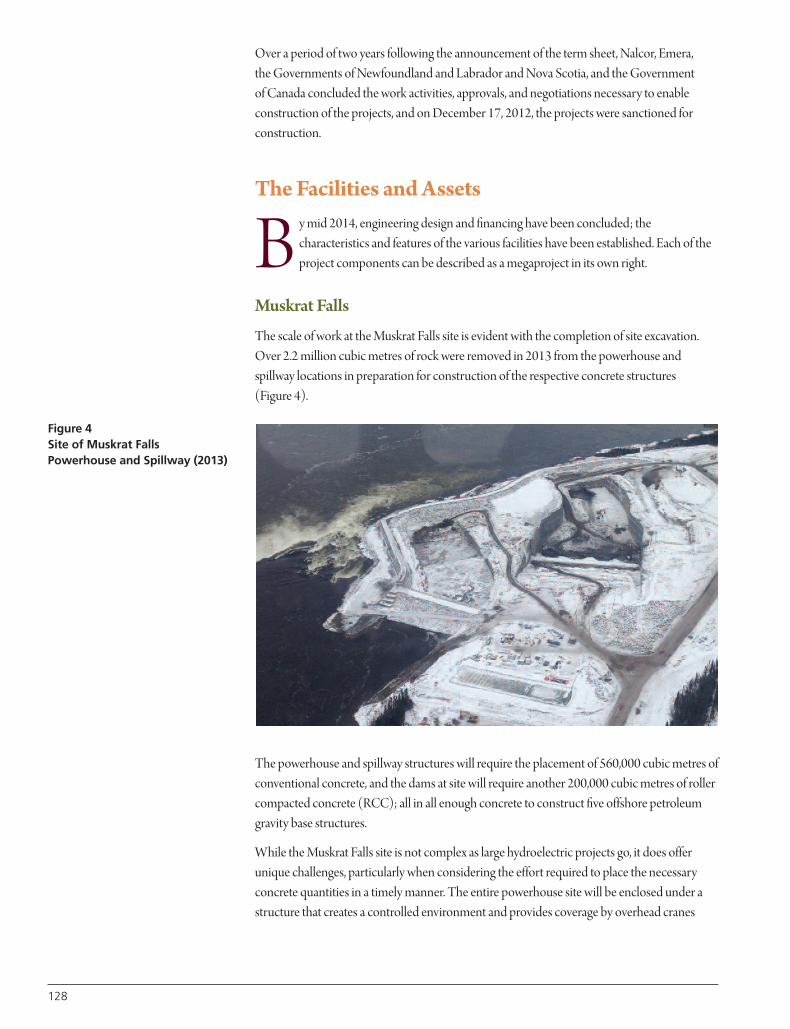
128
Over a period of two years following the announcement of the term sheet, Nalcor, Emera, the Governments of Newfoundland and Labrador and Nova Scotia, and the Government of Canada concluded the work activities, approvals, and negotiations necessary to enableconstruction of the projects, and on December 17, 2012, the projects were sanctioned forconstruction.
The Facilities and Assets
B y mid 2014, engineering design and financing have been concluded; thecharacteristics and features of the various facilities have been established. Each of theproject components can be described as a megaproject in its own right.
Muskrat Falls
The scale of work at the Muskrat Falls site is evident with the completion of site excavation.Over 2.2 million cubic metres of rock were removed in 2013 from the powerhouse andspillway locations in preparation for construction of the respective concrete structures(Figure 4).
The powerhouse and spillway structures will require the placement of 560,000 cubic metres ofconventional concrete, and the dams at site will require another 200,000 cubic metres of rollercompacted concrete (RCC); all in all enough concrete to construct five offshore petroleumgravity base structures.
While the Muskrat Falls site is not complex as large hydroelectric projects go, it does offerunique challenges, particularly when considering the effort required to place the necessaryconcrete quantities in a timely manner. The entire powerhouse site will be enclosed under astructure that creates a controlled environment and provides coverage by overhead cranes
Figure 4Site of Muskrat FallsPowerhouse and Spillway (2013)
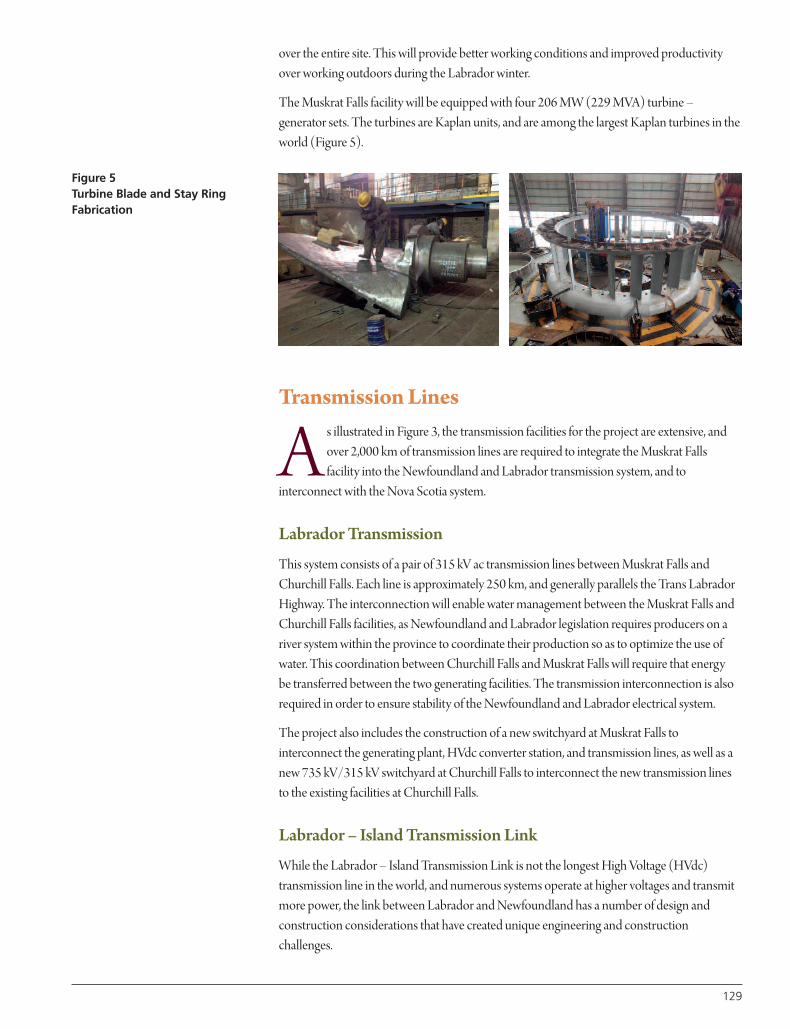
over the entire site. This will provide better working conditions and improved productivityover working outdoors during the Labrador winter.
The Muskrat Falls facility will be equipped with four 206 MW (229 MVA) turbine –generator sets. The turbines are Kaplan units, and are among the largest Kaplan turbines in theworld (Figure 5).
Transmission Lines
A s illustrated in Figure 3, the transmission facilities for the project are extensive, andover 2,000 km of transmission lines are required to integrate the Muskrat Fallsfacility into the Newfoundland and Labrador transmission system, and to
interconnect with the Nova Scotia system.
Labrador Transmission
This system consists of a pair of 315 kV ac transmission lines between Muskrat Falls andChurchill Falls. Each line is approximately 250 km, and generally parallels the Trans LabradorHighway. The interconnection will enable water management between the Muskrat Falls andChurchill Falls facilities, as Newfoundland and Labrador legislation requires producers on ariver system within the province to coordinate their production so as to optimize the use ofwater. This coordination between Churchill Falls and Muskrat Falls will require that energy be transferred between the two generating facilities. The transmission interconnection is alsorequired in order to ensure stability of the Newfoundland and Labrador electrical system.
The project also includes the construction of a new switchyard at Muskrat Falls tointerconnect the generating plant, HVdc converter station, and transmission lines, as well as anew 735 kV/315 kV switchyard at Churchill Falls to interconnect the new transmission linesto the existing facilities at Churchill Falls.
Labrador – Island Transmission Link
While the Labrador – Island Transmission Link is not the longest High Voltage (HVdc)transmission line in the world, and numerous systems operate at higher voltages and transmitmore power, the link between Labrador and Newfoundland has a number of design andconstruction considerations that have created unique engineering and constructionchallenges.
129
Figure 5Turbine Blade and Stay RingFabrication
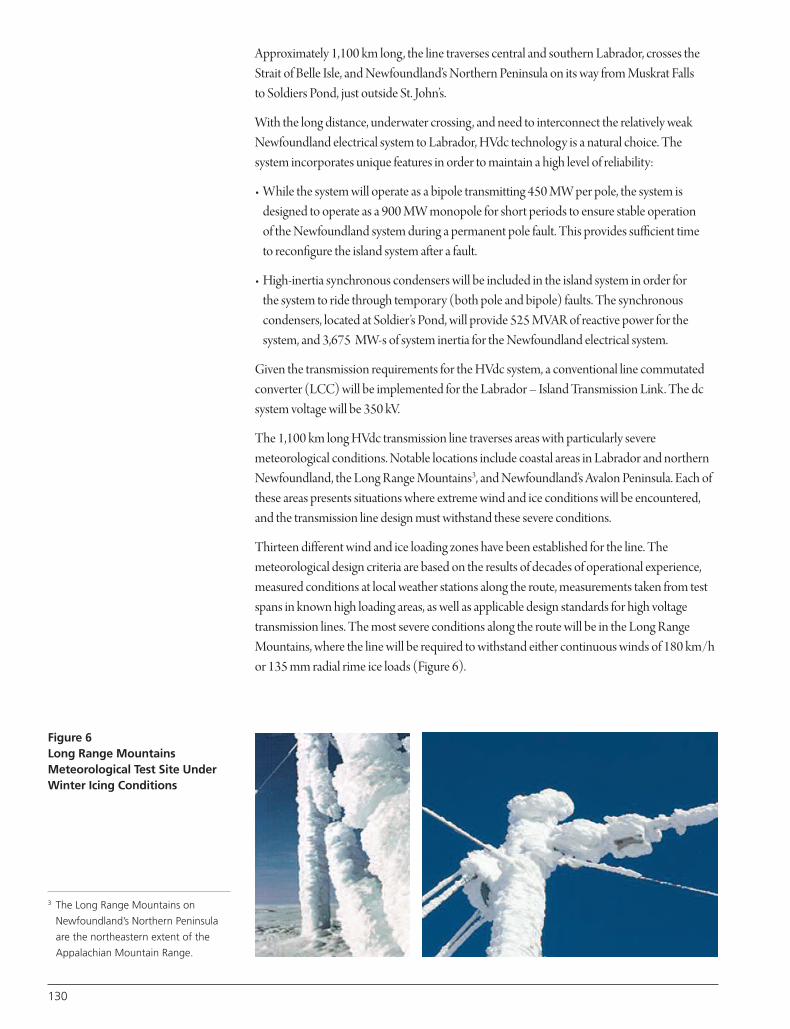
Approximately 1,100 km long, the line traverses central and southern Labrador, crosses theStrait of Belle Isle, and Newfoundland’s Northern Peninsula on its way from Muskrat Falls to Soldiers Pond, just outside St. John’s.
With the long distance, underwater crossing, and need to interconnect the relatively weakNewfoundland electrical system to Labrador, HVdc technology is a natural choice. Thesystem incorporates unique features in order to maintain a high level of reliability:
• While the system will operate as a bipole transmitting 450 MW per pole, the system isdesigned to operate as a 900 MW monopole for short periods to ensure stable operation of the Newfoundland system during a permanent pole fault. This provides sufficient time to reconfigure the island system after a fault.
• High-inertia synchronous condensers will be included in the island system in order for the system to ride through temporary (both pole and bipole) faults. The synchronouscondensers, located at Soldier’s Pond, will provide 525 MVAR of reactive power for thesystem, and 3,675 MW-s of system inertia for the Newfoundland electrical system.
Given the transmission requirements for the HVdc system, a conventional line commutatedconverter (LCC) will be implemented for the Labrador – Island Transmission Link. The dcsystem voltage will be 350 kV.
The 1,100 km long HVdc transmission line traverses areas with particularly severemeteorological conditions. Notable locations include coastal areas in Labrador and northernNewfoundland, the Long Range Mountains3, and Newfoundland’s Avalon Peninsula. Each ofthese areas presents situations where extreme wind and ice conditions will be encountered,and the transmission line design must withstand these severe conditions.
Thirteen different wind and ice loading zones have been established for the line. Themeteorological design criteria are based on the results of decades of operational experience,measured conditions at local weather stations along the route, measurements taken from testspans in known high loading areas, as well as applicable design standards for high voltagetransmission lines. The most severe conditions along the route will be in the Long RangeMountains, where the line will be required to withstand either continuous winds of 180 km/hor 135 mm radial rime ice loads (Figure 6).
Figure 6Long Range MountainsMeteorological Test Site UnderWinter Icing Conditions
3 The Long Range Mountains on
Newfoundland’s Northern Peninsula
are the northeastern extent of the
Appalachian Mountain Range.
130
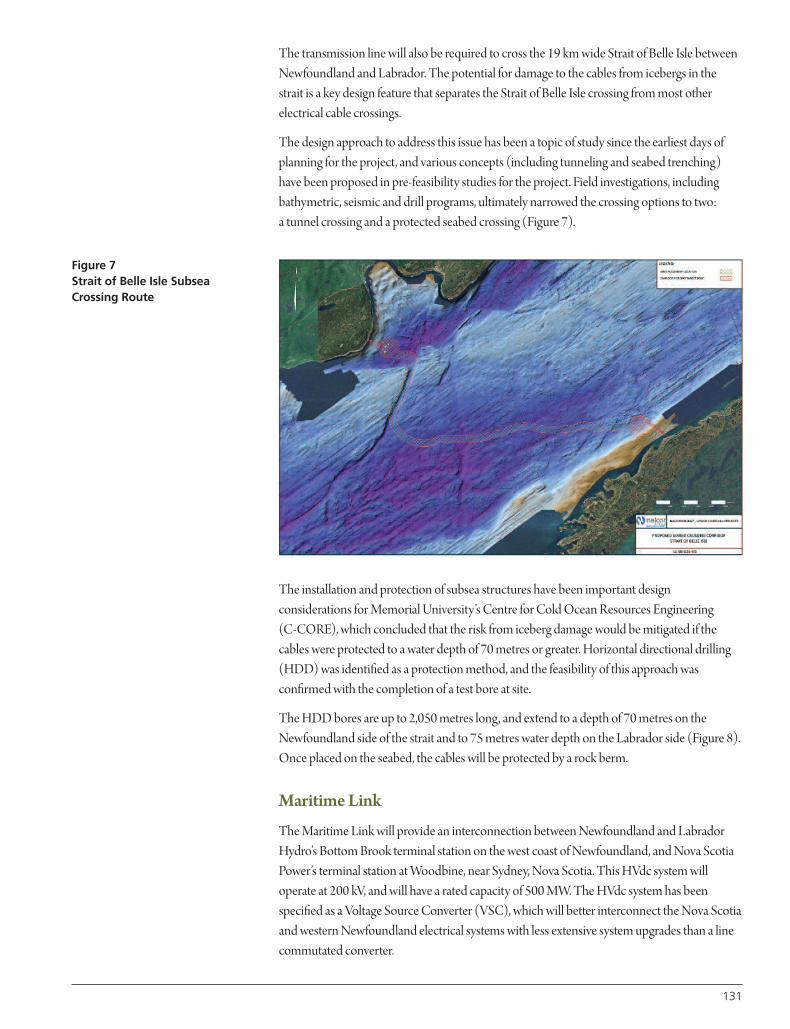
The transmission line will also be required to cross the 19 km wide Strait of Belle Isle betweenNewfoundland and Labrador. The potential for damage to the cables from icebergs in thestrait is a key design feature that separates the Strait of Belle Isle crossing from most otherelectrical cable crossings.
The design approach to address this issue has been a topic of study since the earliest days ofplanning for the project, and various concepts (including tunneling and seabed trenching)have been proposed in pre-feasibility studies for the project. Field investigations, includingbathymetric, seismic and drill programs, ultimately narrowed the crossing options to two: a tunnel crossing and a protected seabed crossing (Figure 7).
The installation and protection of subsea structures have been important designconsiderations for Memorial University’s Centre for Cold Ocean Resources Engineering (C-CORE), which concluded that the risk from iceberg damage would be mitigated if thecables were protected to a water depth of 70 metres or greater. Horizontal directional drilling(HDD) was identified as a protection method, and the feasibility of this approach wasconfirmed with the completion of a test bore at site.
The HDD bores are up to 2,050 metres long, and extend to a depth of 70 metres on theNewfoundland side of the strait and to 75 metres water depth on the Labrador side (Figure 8).Once placed on the seabed, the cables will be protected by a rock berm.
Maritime Link
The Maritime Link will provide an interconnection between Newfoundland and LabradorHydro’s Bottom Brook terminal station on the west coast of Newfoundland, and Nova ScotiaPower’s terminal station at Woodbine, near Sydney, Nova Scotia. This HVdc system willoperate at 200 kV, and will have a rated capacity of 500 MW. The HVdc system has beenspecified as a Voltage Source Converter (VSC), which will better interconnect the Nova Scotiaand western Newfoundland electrical systems with less extensive system upgrades than a linecommutated converter.
131
Figure 7Strait of Belle Isle SubseaCrossing Route
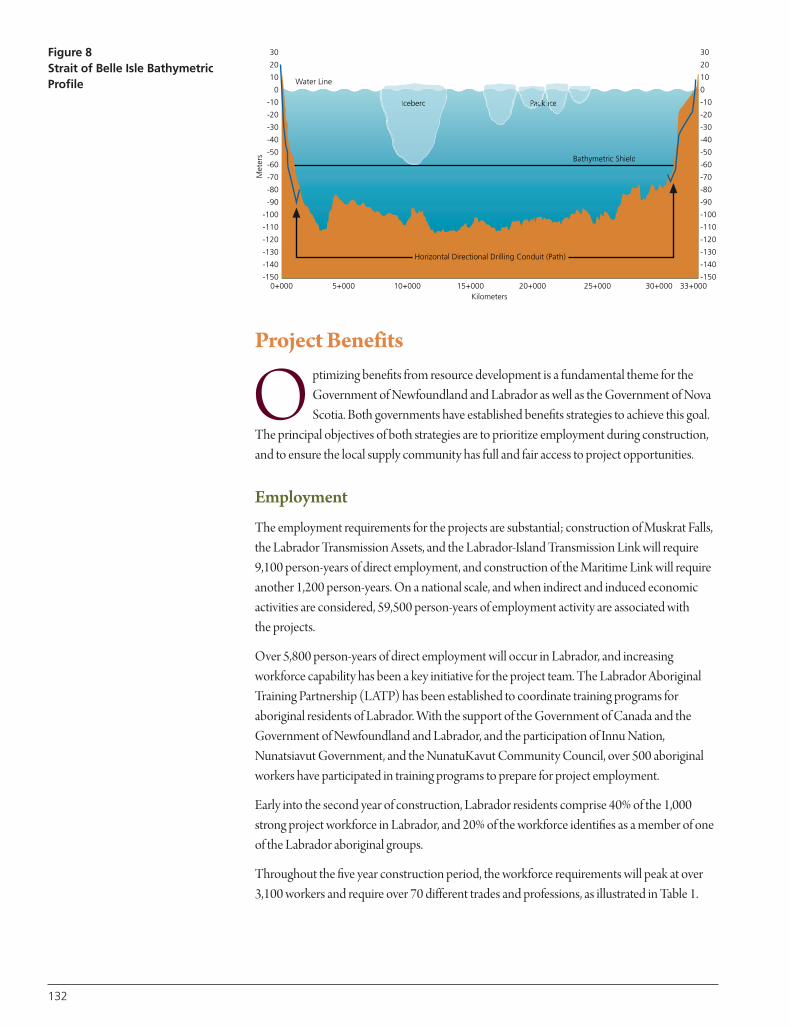
132
Project Benefits
O ptimizing benefits from resource development is a fundamental theme for theGovernment of Newfoundland and Labrador as well as the Government of NovaScotia. Both governments have established benefits strategies to achieve this goal.
The principal objectives of both strategies are to prioritize employment during construction,and to ensure the local supply community has full and fair access to project opportunities.
Employment
The employment requirements for the projects are substantial; construction of Muskrat Falls,the Labrador Transmission Assets, and the Labrador-Island Transmission Link will require9,100 person-years of direct employment, and construction of the Maritime Link will requireanother 1,200 person-years. On a national scale, and when indirect and induced economicactivities are considered, 59,500 person-years of employment activity are associated with the projects.
Over 5,800 person-years of direct employment will occur in Labrador, and increasingworkforce capability has been a key initiative for the project team. The Labrador AboriginalTraining Partnership (LATP) has been established to coordinate training programs foraboriginal residents of Labrador. With the support of the Government of Canada and theGovernment of Newfoundland and Labrador, and the participation of Innu Nation,Nunatsiavut Government, and the NunatuKavut Community Council, over 500 aboriginalworkers have participated in training programs to prepare for project employment.
Early into the second year of construction, Labrador residents comprise 40% of the 1,000strong project workforce in Labrador, and 20% of the workforce identifies as a member of oneof the Labrador aboriginal groups.
Throughout the five year construction period, the workforce requirements will peak at over3,100 workers and require over 70 different trades and professions, as illustrated in Table 1.
Figure 8Strait of Belle Isle BathymetricProfile
a ack Ice Ice IceIceberg ck Ice ce Ice Ice cack IcePack Icec ack Iceack Ice
Ba -60
-50
-40
-30
-20
-10
0
10
20
30
Met
ers
ater LineW
-90
-80
-70
thymetric Shield
0
-150
-140
-130
-120
-110
-100
-90
-80
-70
-60
-50
-40
-30
-20
-10
10
20
30
33+00030+00025+000
ectional Drilling Conduit (Path)
20+000
Horizontal Dir
Kilometers15+00010+0005+0000+000
-150
-140
-130
-120
-110
-100

Business Opportunities
Although the electrical industry is highly globalized, and key equipment is sourced fromspecialized suppliers, enabling the local supply community is an important objective. Theproject team has worked with chambers of commerce, economic development associations,and contractor organizations to communicate both opportunities and expectations to thesupplier community.
During the first 15 months of construction, over $420 million has been spent withNewfoundland and Labrador-based businesses.
On a provincial scale, total expenditures in Newfoundland and Labrador (including wages,salaries, and payments to Newfoundland and Labrador-based businesses) are expected toexceed $1.9 billion.
Supply Chain
T he project draws on a global supply chain for material, equipment, and contractorcapability. With project procurement almost two thirds complete, the suppliers andcontractors for the projects represent major players around the world (Figure 9).
Procurement activities are continuing, and contract award information is available at theproject’s website at muskratfalls.nalcorenergy.com.
133
Table 1Muskrat Falls Project WorkforceRequirements(Number of Workers)
2013 2014 2015 2016 2017Management 34 56 79 45 19
Business Support Services & Administration 148 169 176 144 72
Engineering & Geosciences 126 146 188 120 45
Technologists & Technicians 102 112 126 99 64
Researchers & Scientists 13 10 10 7 4
Inspectors 35 61 89 40 9
Site Services 110 242 344 216 90
Truck Drivers 69 73 99 43 14
Logging, Forestry & Mining 78 103 95 37 1
Heavy Equipment & Crane Operators 194 210 335 176 29
Structural Trades 35 93 162 61 11
Electrical Trades 59 232 440 313 81
Construction Labourers 219 278 464 257 34
Carpentry Trades 59 150 314 155 27
Other Trades 35 35 51 29 5
Mechanical Trades 84 122 215 158 55
Totals 1400 2091 3186 1898 557
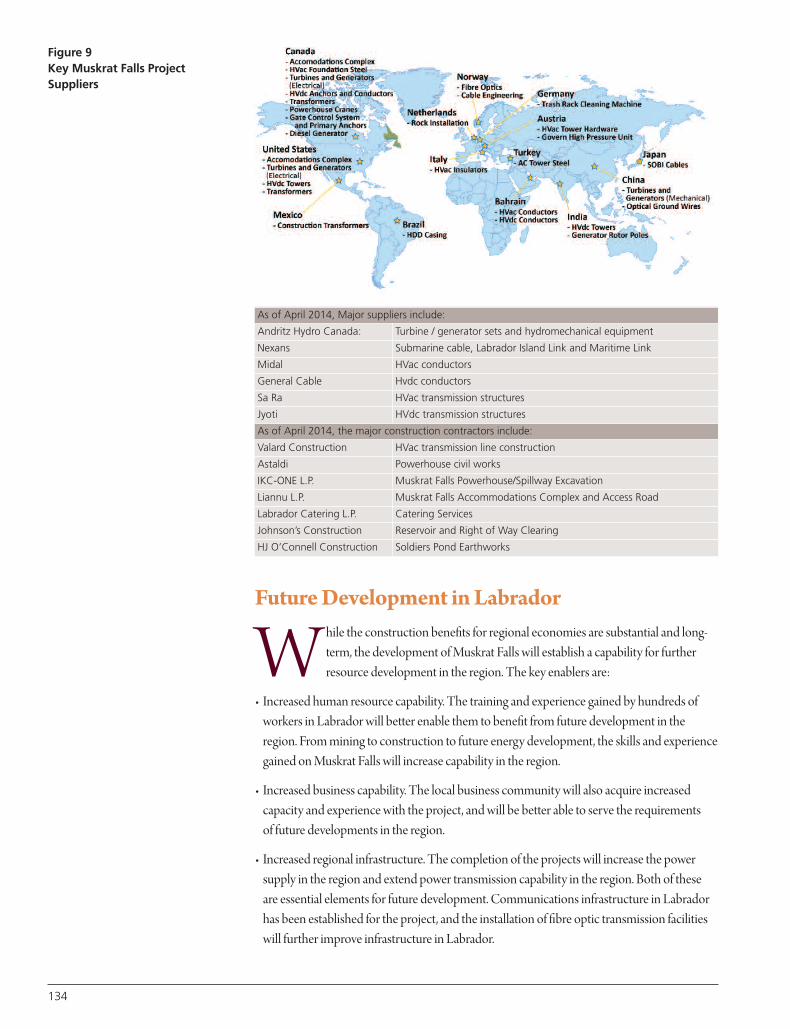
134
Future Development in Labrador
W hile the construction benefits for regional economies are substantial and long-term, the development of Muskrat Falls will establish a capability for furtherresource development in the region. The key enablers are:
• Increased human resource capability. The training and experience gained by hundreds ofworkers in Labrador will better enable them to benefit from future development in theregion. From mining to construction to future energy development, the skills and experiencegained on Muskrat Falls will increase capability in the region.
• Increased business capability. The local business community will also acquire increasedcapacity and experience with the project, and will be better able to serve the requirements of future developments in the region.
• Increased regional infrastructure. The completion of the projects will increase the powersupply in the region and extend power transmission capability in the region. Both of theseare essential elements for future development. Communications infrastructure in Labradorhas been established for the project, and the installation of fibre optic transmission facilitieswill further improve infrastructure in Labrador.
Figure 9Key Muskrat Falls ProjectSuppliers
As of April 2014, Major suppliers include:
Andritz Hydro Canada: Turbine / generator sets and hydromechanical equipment
Nexans Submarine cable, Labrador Island Link and Maritime Link
Midal HVac conductors
General Cable Hvdc conductors
Sa Ra HVac transmission structures
Jyoti HVdc transmission structures
As of April 2014, the major construction contractors include:
Valard Construction HVac transmission line construction
Astaldi Powerhouse civil works
IKC-ONE L.P. Muskrat Falls Powerhouse/Spillway Excavation
Liannu L.P. Muskrat Falls Accommodations Complex and Access Road
Labrador Catering L.P. Catering Services
Johnson’s Construction Reservoir and Right of Way Clearing
HJ O’Connell Construction Soldiers Pond Earthworks
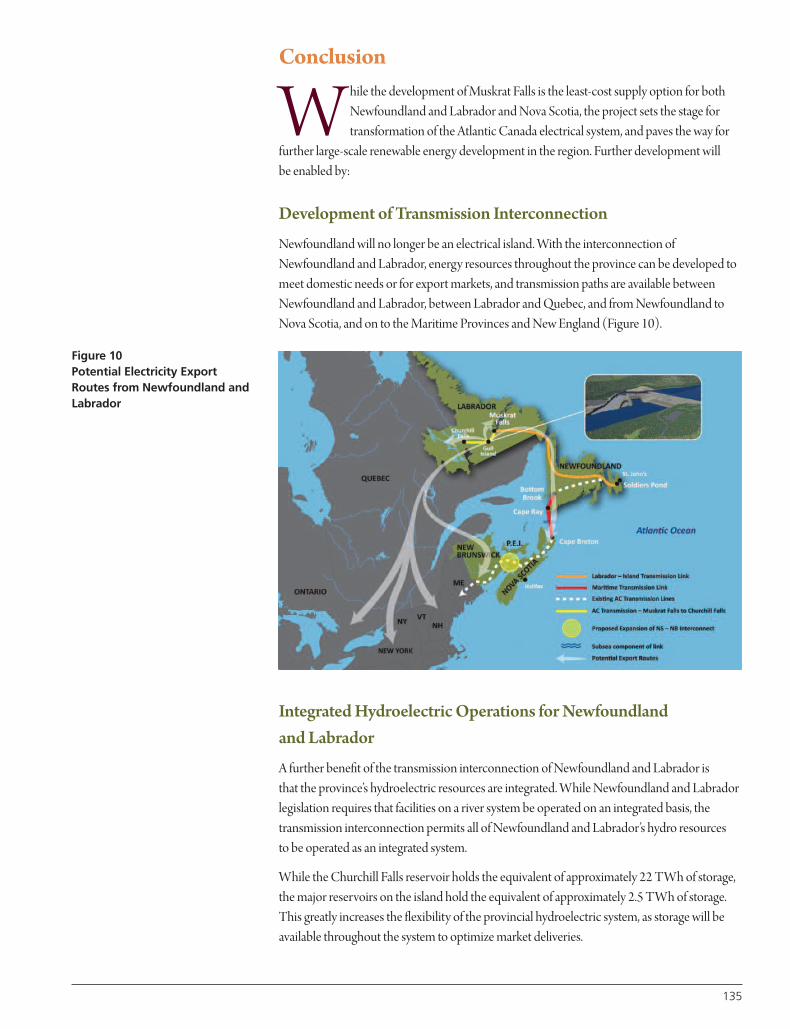
Conclusion
W hile the development of Muskrat Falls is the least-cost supply option for bothNewfoundland and Labrador and Nova Scotia, the project sets the stage fortransformation of the Atlantic Canada electrical system, and paves the way for
further large-scale renewable energy development in the region. Further development will be enabled by:
Development of Transmission Interconnection
Newfoundland will no longer be an electrical island. With the interconnection ofNewfoundland and Labrador, energy resources throughout the province can be developed tomeet domestic needs or for export markets, and transmission paths are available betweenNewfoundland and Labrador, between Labrador and Quebec, and from Newfoundland toNova Scotia, and on to the Maritime Provinces and New England (Figure 10).
Integrated Hydroelectric Operations for Newfoundland and Labrador
A further benefit of the transmission interconnection of Newfoundland and Labrador is that the province’s hydroelectric resources are integrated. While Newfoundland and Labradorlegislation requires that facilities on a river system be operated on an integrated basis, thetransmission interconnection permits all of Newfoundland and Labrador’s hydro resources to be operated as an integrated system.
While the Churchill Falls reservoir holds the equivalent of approximately 22 TWh of storage,the major reservoirs on the island hold the equivalent of approximately 2.5 TWh of storage.This greatly increases the flexibility of the provincial hydroelectric system, as storage will beavailable throughout the system to optimize market deliveries.
135
Figure 10Potential Electricity ExportRoutes from Newfoundland andLabrador
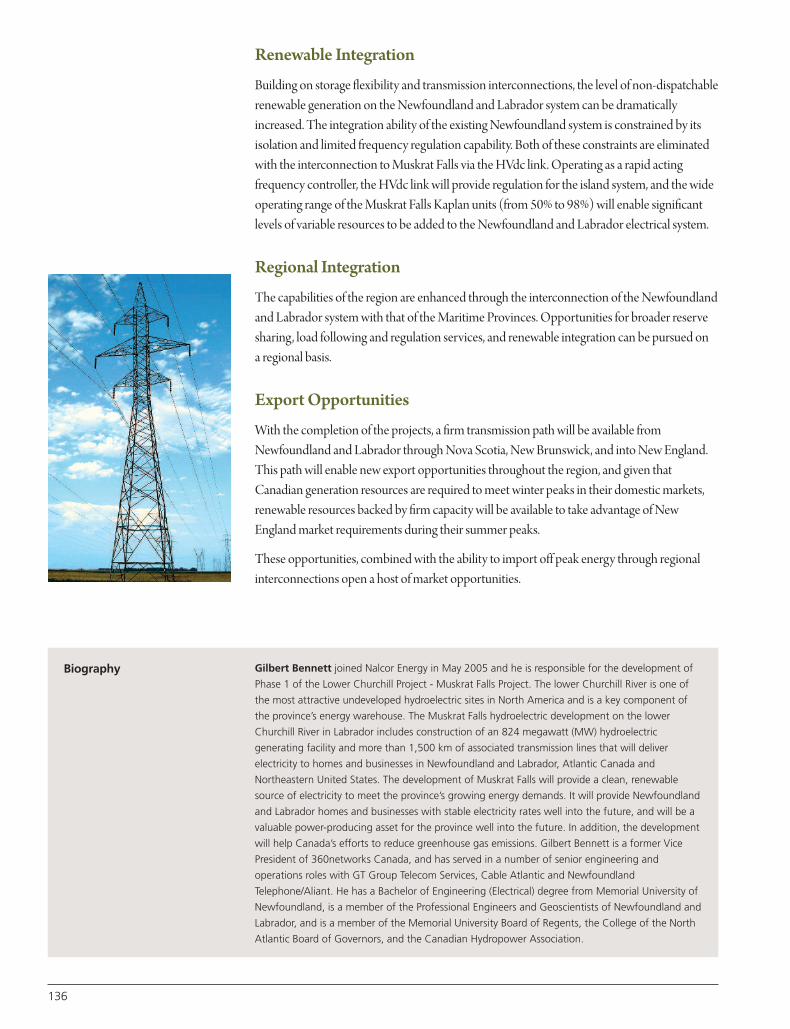
Renewable Integration
Building on storage flexibility and transmission interconnections, the level of non-dispatchablerenewable generation on the Newfoundland and Labrador system can be dramaticallyincreased. The integration ability of the existing Newfoundland system is constrained by itsisolation and limited frequency regulation capability. Both of these constraints are eliminatedwith the interconnection to Muskrat Falls via the HVdc link. Operating as a rapid actingfrequency controller, the HVdc link will provide regulation for the island system, and the wideoperating range of the Muskrat Falls Kaplan units (from 50% to 98%) will enable significantlevels of variable resources to be added to the Newfoundland and Labrador electrical system.
Regional Integration
The capabilities of the region are enhanced through the interconnection of the Newfoundlandand Labrador system with that of the Maritime Provinces. Opportunities for broader reservesharing, load following and regulation services, and renewable integration can be pursued on a regional basis.
Export Opportunities
With the completion of the projects, a firm transmission path will be available fromNewfoundland and Labrador through Nova Scotia, New Brunswick, and into New England.This path will enable new export opportunities throughout the region, and given thatCanadian generation resources are required to meet winter peaks in their domestic markets,renewable resources backed by firm capacity will be available to take advantage of NewEngland market requirements during their summer peaks.
These opportunities, combined with the ability to import off peak energy through regionalinterconnections open a host of market opportunities.
136
Gilbert Bennett joined Nalcor Energy in May 2005 and he is responsible for the development of
Phase 1 of the Lower Churchill Project - Muskrat Falls Project. The lower Churchill River is one of
the most attractive undeveloped hydroelectric sites in North America and is a key component of
the province’s energy warehouse. The Muskrat Falls hydroelectric development on the lower
Churchill River in Labrador includes construction of an 824 megawatt (MW) hydroelectric
generating facility and more than 1,500 km of associated transmission lines that will deliver
electricity to homes and businesses in Newfoundland and Labrador, Atlantic Canada and
Northeastern United States. The development of Muskrat Falls will provide a clean, renewable
source of electricity to meet the province’s growing energy demands. It will provide Newfoundland
and Labrador homes and businesses with stable electricity rates well into the future, and will be a
valuable power-producing asset for the province well into the future. In addition, the development
will help Canada’s efforts to reduce greenhouse gas emissions. Gilbert Bennett is a former Vice
President of 360networks Canada, and has served in a number of senior engineering and
operations roles with GT Group Telecom Services, Cable Atlantic and Newfoundland
Telephone/Aliant. He has a Bachelor of Engineering (Electrical) degree from Memorial University of
Newfoundland, is a member of the Professional Engineers and Geoscientists of Newfoundland and
Labrador, and is a member of the Memorial University Board of Regents, the College of the North
Atlantic Board of Governors, and the Canadian Hydropower Association.
Biography
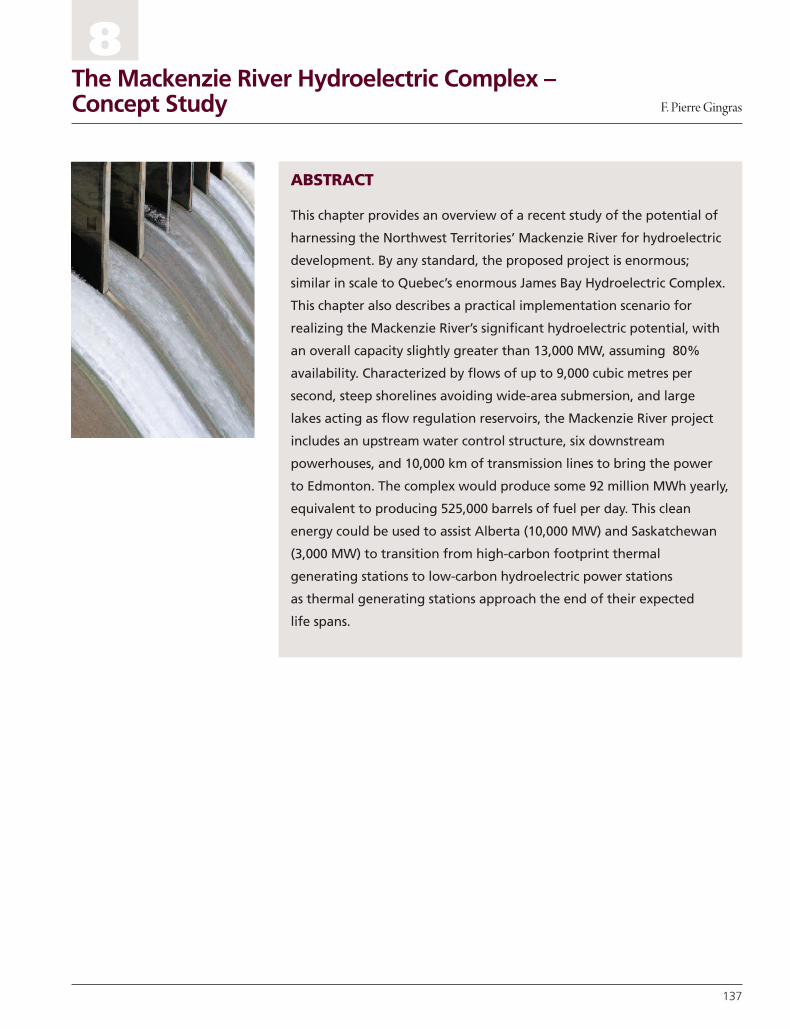
137
ABSTRACT
This chapter provides an overview of a recent study of the potential of
harnessing the Northwest Territories’ Mackenzie River for hydroelectric
development. By any standard, the proposed project is enormous;
similar in scale to Quebec’s enormous James Bay Hydroelectric Complex.
This chapter also describes a practical implementation scenario for
realizing the Mackenzie River’s significant hydroelectric potential, with
an overall capacity slightly greater than 13,000 MW, assuming 80%
availability. Characterized by flows of up to 9,000 cubic metres per
second, steep shorelines avoiding wide-area submersion, and large
lakes acting as flow regulation reservoirs, the Mackenzie River project
includes an upstream water control structure, six downstream
powerhouses, and 10,000 km of transmission lines to bring the power
to Edmonton. The complex would produce some 92 million MWh yearly,
equivalent to producing 525,000 barrels of fuel per day. This clean
energy could be used to assist Alberta (10,000 MW) and Saskatchewan
(3,000 MW) to transition from high-carbon footprint thermal
generating stations to low-carbon hydroelectric power stations
as thermal generating stations approach the end of their expected
life spans.
The Mackenzie River Hydroelectric Complex –Concept Study F. Pierre Gingras
8
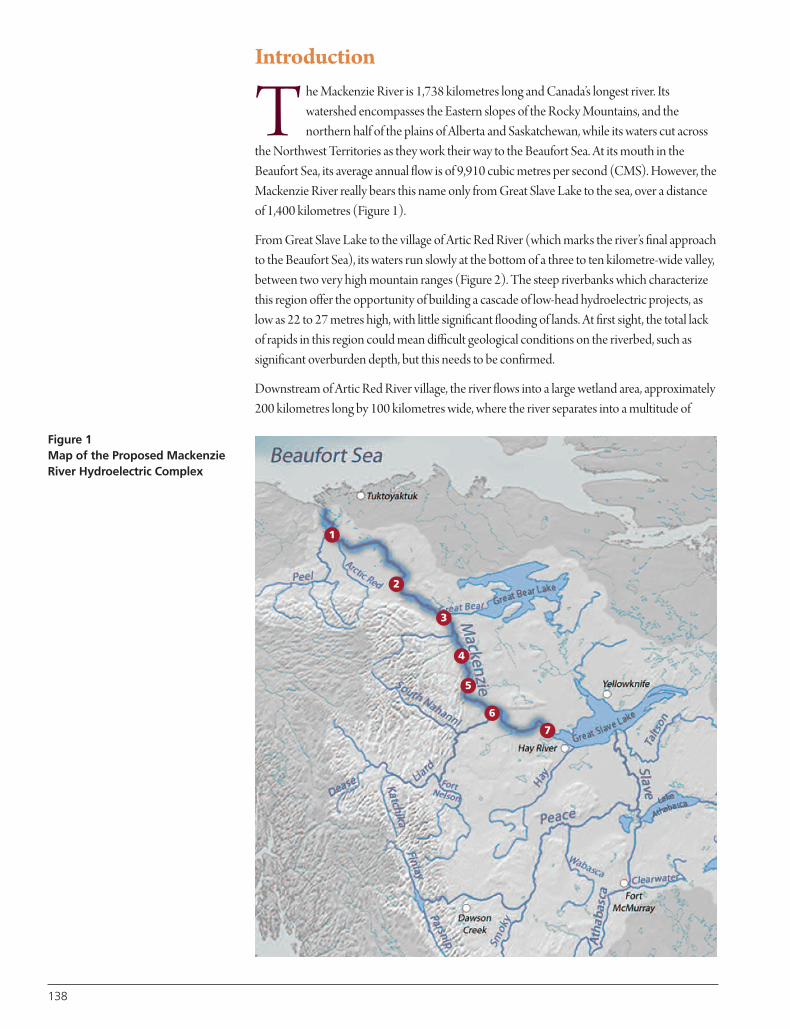
Introduction
T he Mackenzie River is 1,738 kilometres long and Canada’s longest river. Itswatershed encompasses the Eastern slopes of the Rocky Mountains, and thenorthern half of the plains of Alberta and Saskatchewan, while its waters cut across
the Northwest Territories as they work their way to the Beaufort Sea. At its mouth in theBeaufort Sea, its average annual flow is of 9,910 cubic metres per second (CMS). However, theMackenzie River really bears this name only from Great Slave Lake to the sea, over a distanceof 1,400 kilometres (Figure 1).
From Great Slave Lake to the village of Artic Red River (which marks the river’s final approachto the Beaufort Sea), its waters run slowly at the bottom of a three to ten kilometre-wide valley,between two very high mountain ranges (Figure 2). The steep riverbanks which characterizethis region offer the opportunity of building a cascade of low-head hydroelectric projects, aslow as 22 to 27 metres high, with little significant flooding of lands. At first sight, the total lackof rapids in this region could mean difficult geological conditions on the riverbed, such assignificant overburden depth, but this needs to be confirmed.
Downstream of Artic Red River village, the river flows into a large wetland area, approximately200 kilometres long by 100 kilometres wide, where the river separates into a multitude of
Figure 1Map of the Proposed MackenzieRiver Hydroelectric Complex
1
2
3
4
5
6
7
138
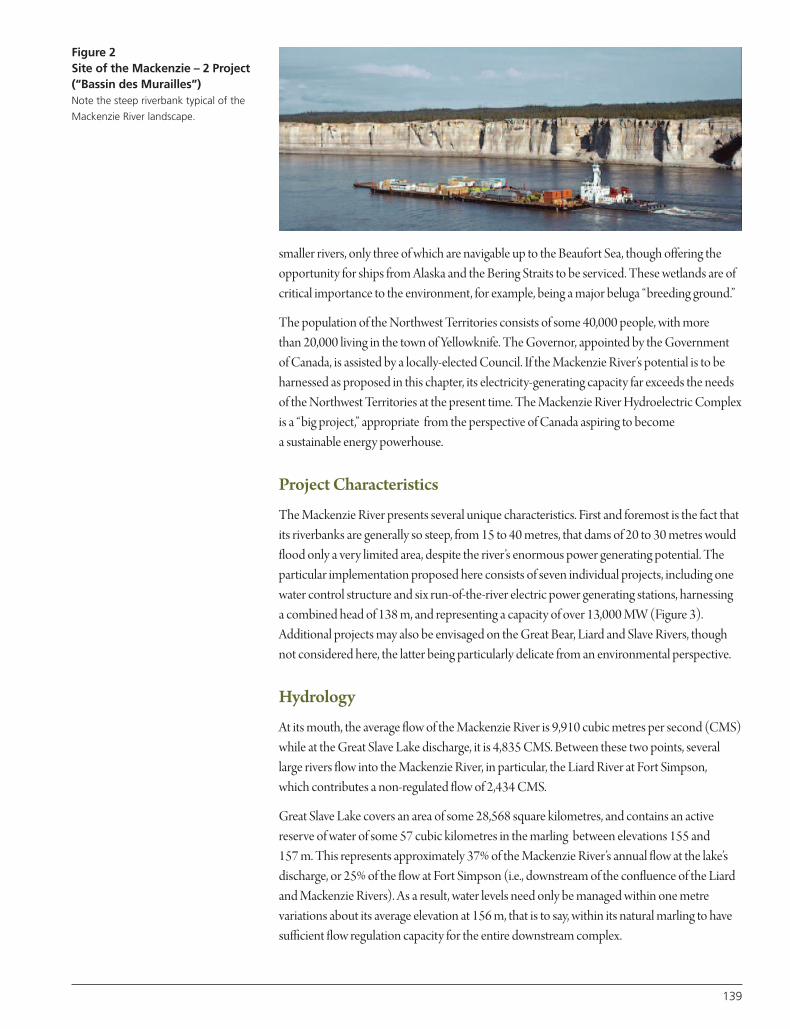
smaller rivers, only three of which are navigable up to the Beaufort Sea, though offering theopportunity for ships from Alaska and the Bering Straits to be serviced. These wetlands are ofcritical importance to the environment, for example, being a major beluga “breeding ground.”
The population of the Northwest Territories consists of some 40,000 people, with more than 20,000 living in the town of Yellowknife. The Governor, appointed by the Government of Canada, is assisted by a locally-elected Council. If the Mackenzie River’s potential is to beharnessed as proposed in this chapter, its electricity-generating capacity far exceeds the needsof the Northwest Territories at the present time. The Mackenzie River Hydroelectric Complexis a “big project,” appropriate from the perspective of Canada aspiring to become a sustainable energy powerhouse.
Project Characteristics
The Mackenzie River presents several unique characteristics. First and foremost is the fact thatits riverbanks are generally so steep, from 15 to 40 metres, that dams of 20 to 30 metres wouldflood only a very limited area, despite the river’s enormous power generating potential. Theparticular implementation proposed here consists of seven individual projects, including onewater control structure and six run-of-the-river electric power generating stations, harnessing a combined head of 138 m, and representing a capacity of over 13,000 MW (Figure 3).Additional projects may also be envisaged on the Great Bear, Liard and Slave Rivers, thoughnot considered here, the latter being particularly delicate from an environmental perspective.
Hydrology
At its mouth, the average flow of the Mackenzie River is 9,910 cubic metres per second (CMS)while at the Great Slave Lake discharge, it is 4,835 CMS. Between these two points, severallarge rivers flow into the Mackenzie River, in particular, the Liard River at Fort Simpson, which contributes a non-regulated flow of 2,434 CMS.
Great Slave Lake covers an area of some 28,568 square kilometres, and contains an activereserve of water of some 57 cubic kilometres in the marling between elevations 155 and 157 m. This represents approximately 37% of the Mackenzie River’s annual flow at the lake’sdischarge, or 25% of the flow at Fort Simpson (i.e., downstream of the confluence of the Liardand Mackenzie Rivers). As a result, water levels need only be managed within one metrevariations about its average elevation at 156 m, that is to say, within its natural marling to havesufficient flow regulation capacity for the entire downstream complex.
139
Figure 2Site of the Mackenzie – 2 Project(“Bassin des Murailles”)Note the steep riverbank typical of the
Mackenzie River landscape.
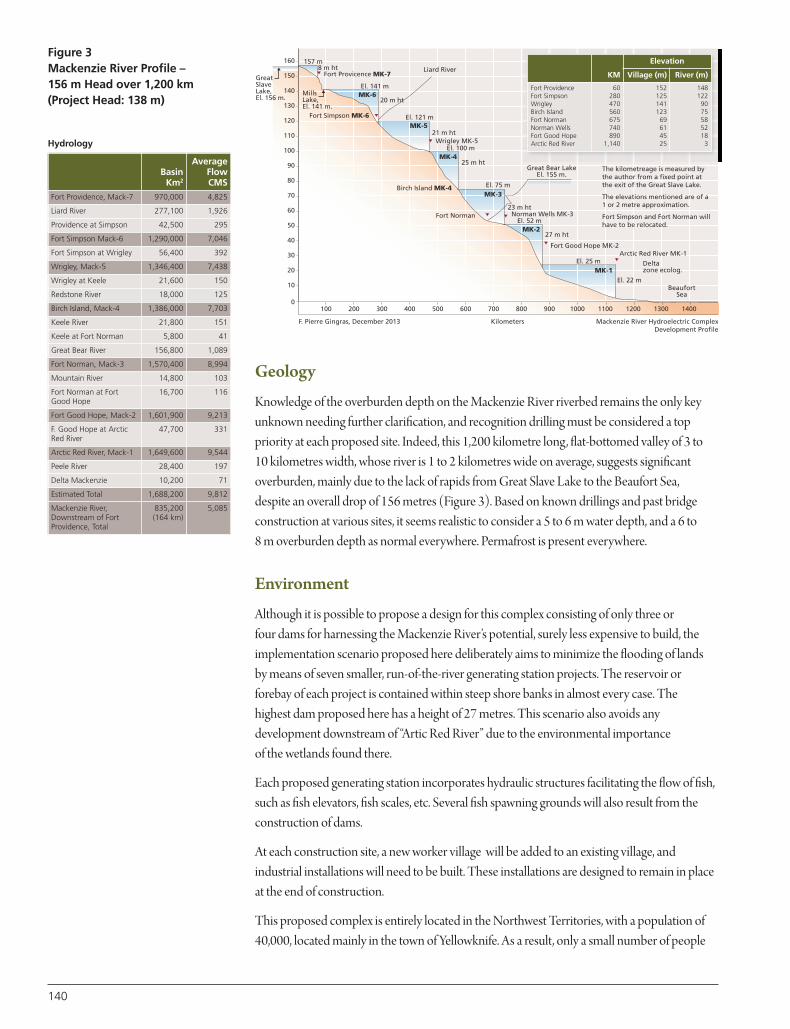
140
Geology
Knowledge of the overburden depth on the Mackenzie River riverbed remains the only keyunknown needing further clarification, and recognition drilling must be considered a toppriority at each proposed site. Indeed, this 1,200 kilometre long, flat-bottomed valley of 3 to 10 kilometres width, whose river is 1 to 2 kilometres wide on average, suggests significantoverburden, mainly due to the lack of rapids from Great Slave Lake to the Beaufort Sea, despite an overall drop of 156 metres (Figure 3). Based on known drillings and past bridgeconstruction at various sites, it seems realistic to consider a 5 to 6 m water depth, and a 6 to 8 m overburden depth as normal everywhere. Permafrost is present everywhere.
Environment
Although it is possible to propose a design for this complex consisting of only three or four dams for harnessing the Mackenzie River’s potential, surely less expensive to build, theimplementation scenario proposed here deliberately aims to minimize the flooding of lands by means of seven smaller, run-of-the-river generating station projects. The reservoir orforebay of each project is contained within steep shore banks in almost every case. The highest dam proposed here has a height of 27 metres. This scenario also avoids anydevelopment downstream of “Artic Red River” due to the environmental importance of the wetlands found there.
Each proposed generating station incorporates hydraulic structures facilitating the flow of fish,such as fish elevators, fish scales, etc. Several fish spawning grounds will also result from theconstruction of dams.
At each construction site, a new worker village will be added to an existing village, andindustrial installations will need to be built. These installations are designed to remain in placeat the end of construction.
This proposed complex is entirely located in the Northwest Territories, with a population of40,000, located mainly in the town of Yellowknife. As a result, only a small number of people
Figure 3Mackenzie River Profile – 156 m Head over 1,200 km(Project Head: 138 m)
GreatSlaveLake,El. 156 m.
MillsLake,El. 141 m.
Fort Simpson MK-6
Birch Island MK-4
Fort Norman
157 m
El. 141 m
El. 121 m
Liard River160
150
140
130
120
110
100
90
80
70
60
50
40
30
20
10
0100 200 300 400 500 600 700
KilometersF. Pierre Gingras, December 2013 Mackenzie River Hydroelectric ComplexDevelopment Profile
800 900 1000 1100 1200 1300 1400
El. 100 m
El. 75 m
El. 52 m
El. 25 m
El. 22 m
MK-6
MK-5
MK-4
MK-3
MK-2
MK-1
8 m ht
20 m ht
21 m ht
25 m ht
23 m ht
27 m ht
Wrigley MK-5
Norman Wells MK-3
Fort Good Hope MK-2Arctic Red River MK-1
Deltazone ecolog.
BeaufortSea
Great Bear LakeEl. 155 m.
Fort Provicence MK-7
The kilometreage is measured by the author from a fixed point at the exit of the Great Slave Lake.
The elevations mentioned are of a 1 or 2 metre approximation.
Fort Simpson and Fort Norman will have to be relocated.
KM
Elevation
Village (m) River (m)
Fort ProvidenceFort SimpsonWrigleyBirch IslandFort NormanNorman WellsFort Good HopeArctic Red River
60280470560675740890
1,140
15212514112369614525
14812290755852183
BasinKm2
AverageFlowCMS
Fort Providence, Mack-7 970,000 4,825
Liard River 277,100 1,926
Providence at Simpson 42,500 295
Fort Simpson Mack-6 1,290,000 7,046
Fort Simpson at Wrigley 56,400 392
Wrigley, Mack-5 1,346,400 7,438
Wrigley at Keele 21,600 150
Redstone River 18,000 125
Birch Island, Mack-4 1,386,000 7,703
Keele River 21,800 151
Keele at Fort Norman 5,800 41
Great Bear River 156,800 1,089
Fort Norman, Mack-3 1,570,400 8,994
Mountain River 14,800 103
Fort Norman at FortGood Hope
16,700 116
Fort Good Hope, Mack-2 1,601,900 9,213
F. Good Hope at ArcticRed River
47,700 331
Arctic Red River, Mack-1 1,649,600 9,544
Peele River 28,400 197
Delta Mackenzie 10,200 71
Estimated Total 1,688,200 9,812
Mackenzie River,Downstream of FortProvidence, Total
835,200(164 km)
5,085
Hydrology
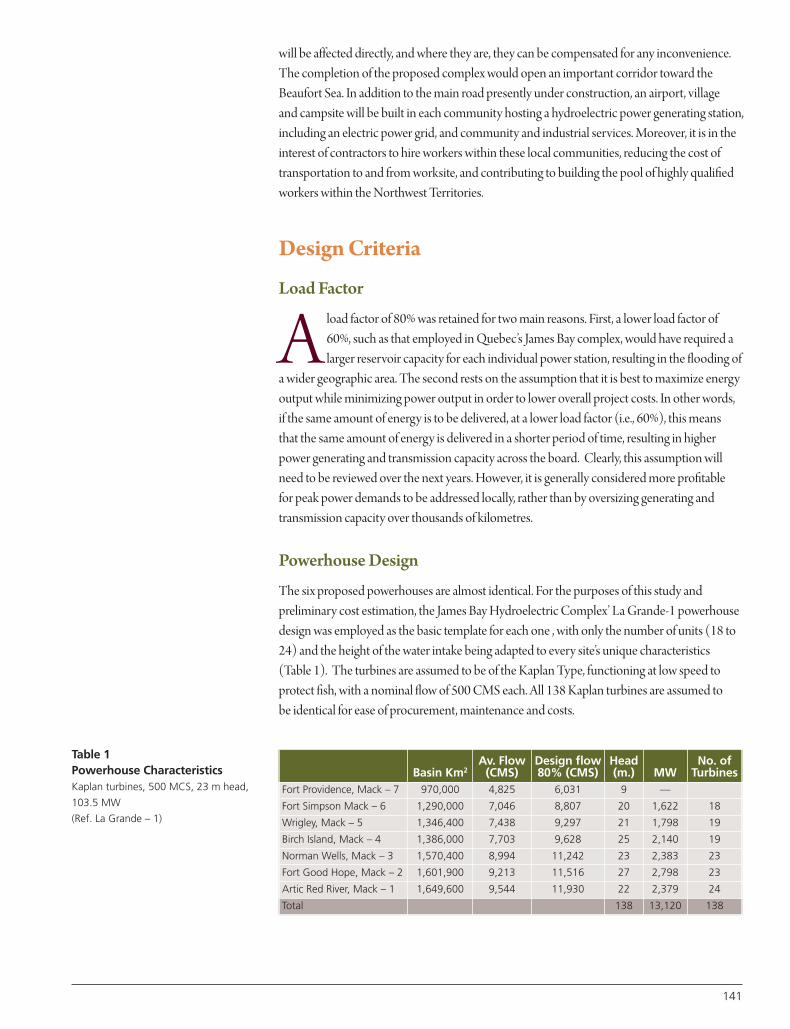
will be affected directly, and where they are, they can be compensated for any inconvenience.The completion of the proposed complex would open an important corridor toward theBeaufort Sea. In addition to the main road presently under construction, an airport, village and campsite will be built in each community hosting a hydroelectric power generating station,including an electric power grid, and community and industrial services. Moreover, it is in theinterest of contractors to hire workers within these local communities, reducing the cost oftransportation to and from worksite, and contributing to building the pool of highly qualifiedworkers within the Northwest Territories.
Design Criteria
Load Factor
A load factor of 80% was retained for two main reasons. First, a lower load factor of60%, such as that employed in Quebec’s James Bay complex, would have required alarger reservoir capacity for each individual power station, resulting in the flooding of
a wider geographic area. The second rests on the assumption that it is best to maximize energyoutput while minimizing power output in order to lower overall project costs. In other words,if the same amount of energy is to be delivered, at a lower load factor (i.e., 60%), this meansthat the same amount of energy is delivered in a shorter period of time, resulting in higherpower generating and transmission capacity across the board. Clearly, this assumption willneed to be reviewed over the next years. However, it is generally considered more profitable for peak power demands to be addressed locally, rather than by oversizing generating andtransmission capacity over thousands of kilometres.
Powerhouse Design
The six proposed powerhouses are almost identical. For the purposes of this study andpreliminary cost estimation, the James Bay Hydroelectric Complex’ La Grande-1 powerhousedesign was employed as the basic template for each one , with only the number of units (18 to24) and the height of the water intake being adapted to every site’s unique characteristics(Table 1). The turbines are assumed to be of the Kaplan Type, functioning at low speed toprotect fish, with a nominal flow of 500 CMS each. All 138 Kaplan turbines are assumed to be identical for ease of procurement, maintenance and costs.
141
Table 1Powerhouse CharacteristicsKaplan turbines, 500 MCS, 23 m head,
103.5 MW
(Ref. La Grande – 1)
Basin Km2Av. Flow(CMS)
Design flow80% (CMS)
Head(m.) MW
No. ofTurbines
Fort Providence, Mack – 7 970,000 4,825 6,031 9 —
Fort Simpson Mack – 6 1,290,000 7,046 8,807 20 1,622 18
Wrigley, Mack – 5 1,346,400 7,438 9,297 21 1,798 19
Birch Island, Mack – 4 1,386,000 7,703 9,628 25 2,140 19
Norman Wells, Mack – 3 1,570,400 8,994 11,242 23 2,383 23
Fort Good Hope, Mack – 2 1,601,900 9,213 11,516 27 2,798 23
Artic Red River, Mack – 1 1,649,600 9,544 11,930 22 2,379 24
Total 138 13,120 138
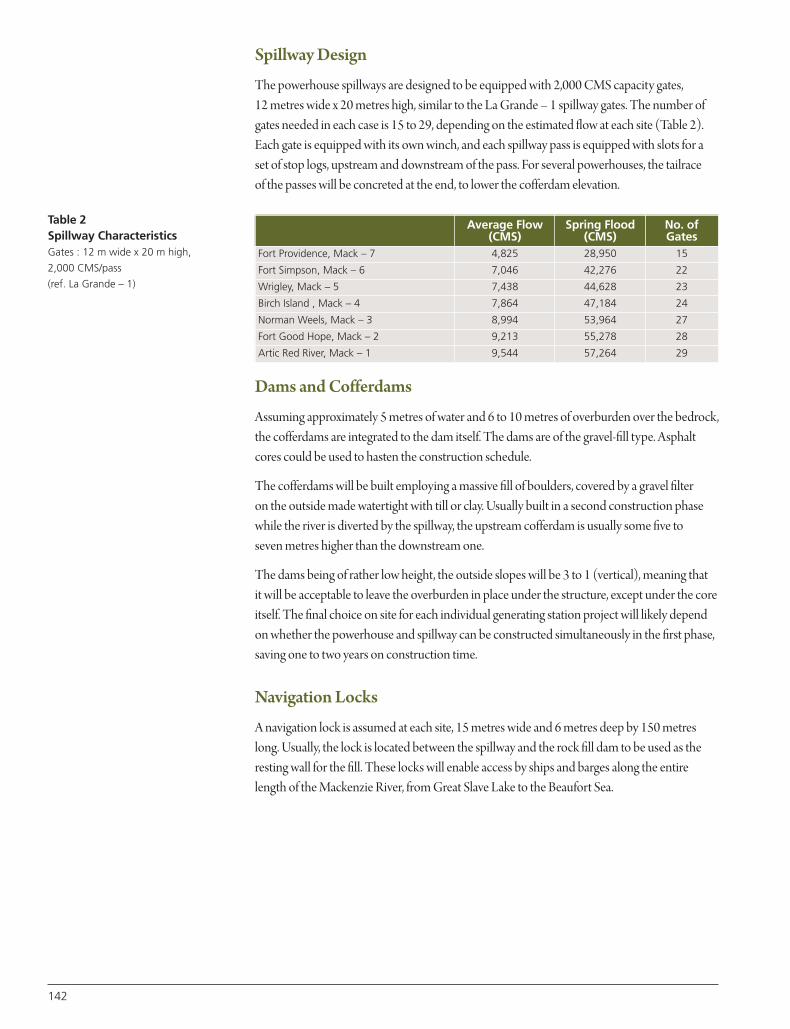
142
Spillway Design
The powerhouse spillways are designed to be equipped with 2,000 CMS capacity gates, 12 metres wide x 20 metres high, similar to the La Grande – 1 spillway gates. The number ofgates needed in each case is 15 to 29, depending on the estimated flow at each site (Table 2).Each gate is equipped with its own winch, and each spillway pass is equipped with slots for aset of stop logs, upstream and downstream of the pass. For several powerhouses, the tailrace of the passes will be concreted at the end, to lower the cofferdam elevation.
Dams and Cofferdams
Assuming approximately 5 metres of water and 6 to 10 metres of overburden over the bedrock,the cofferdams are integrated to the dam itself. The dams are of the gravel-fill type. Asphaltcores could be used to hasten the construction schedule.
The cofferdams will be built employing a massive fill of boulders, covered by a gravel filter on the outside made watertight with till or clay. Usually built in a second construction phasewhile the river is diverted by the spillway, the upstream cofferdam is usually some five to seven metres higher than the downstream one.
The dams being of rather low height, the outside slopes will be 3 to 1 (vertical), meaning that it will be acceptable to leave the overburden in place under the structure, except under the coreitself. The final choice on site for each individual generating station project will likely dependon whether the powerhouse and spillway can be constructed simultaneously in the first phase,saving one to two years on construction time.
Navigation Locks
A navigation lock is assumed at each site, 15 metres wide and 6 metres deep by 150 metreslong. Usually, the lock is located between the spillway and the rock fill dam to be used as theresting wall for the fill. These locks will enable access by ships and barges along the entirelength of the Mackenzie River, from Great Slave Lake to the Beaufort Sea.
Table 2Spillway CharacteristicsGates : 12 m wide x 20 m high,
2,000 CMS/pass
(ref. La Grande – 1)
Average Flow(CMS)
Spring Flood(CMS)
No. ofGates
Fort Providence, Mack – 7 4,825 28,950 15
Fort Simpson, Mack – 6 7,046 42,276 22
Wrigley, Mack – 5 7,438 44,628 23
Birch Island , Mack – 4 7,864 47,184 24
Norman Weels, Mack – 3 8,994 53,964 27
Fort Good Hope, Mack – 2 9,213 55,278 28
Artic Red River, Mack – 1 9,544 57,264 29
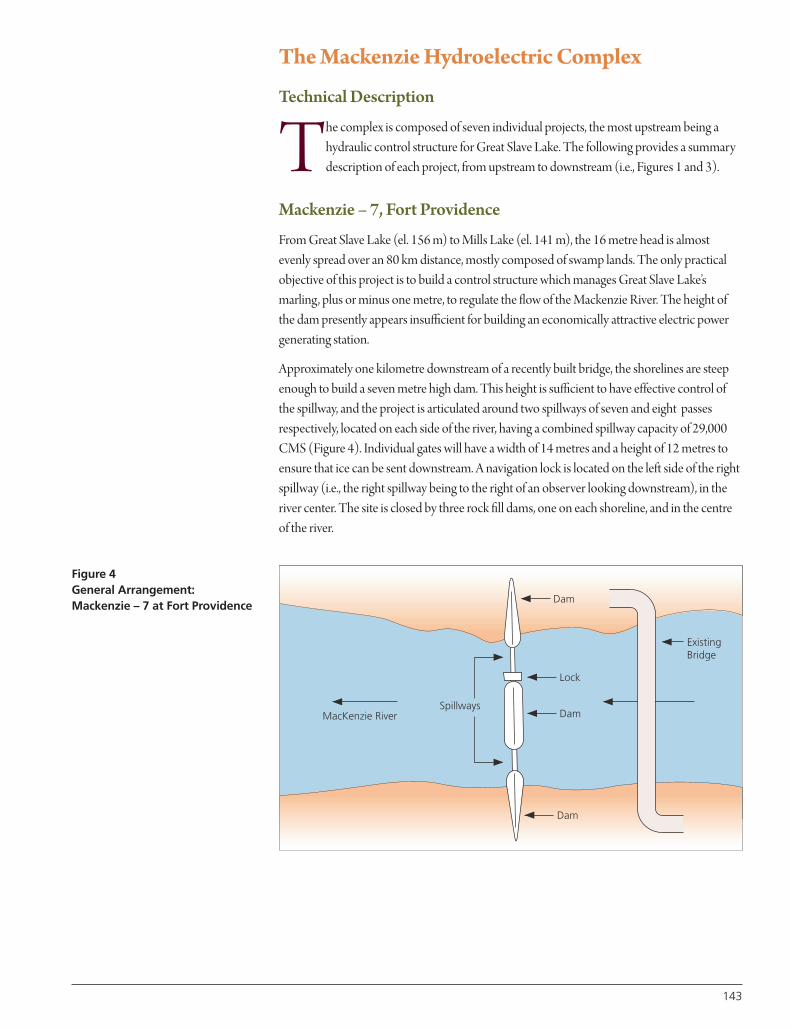
The Mackenzie Hydroelectric Complex
Technical Description
The complex is composed of seven individual projects, the most upstream being ahydraulic control structure for Great Slave Lake. The following provides a summarydescription of each project, from upstream to downstream (i.e., Figures 1 and 3).
Mackenzie – 7, Fort Providence
From Great Slave Lake (el. 156 m) to Mills Lake (el. 141 m), the 16 metre head is almostevenly spread over an 80 km distance, mostly composed of swamp lands. The only practicalobjective of this project is to build a control structure which manages Great Slave Lake’smarling, plus or minus one metre, to regulate the flow of the Mackenzie River. The height ofthe dam presently appears insufficient for building an economically attractive electric powergenerating station.
Approximately one kilometre downstream of a recently built bridge, the shorelines are steepenough to build a seven metre high dam. This height is sufficient to have effective control ofthe spillway, and the project is articulated around two spillways of seven and eight passesrespectively, located on each side of the river, having a combined spillway capacity of 29,000CMS (Figure 4). Individual gates will have a width of 14 metres and a height of 12 metres toensure that ice can be sent downstream. A navigation lock is located on the left side of the rightspillway (i.e., the right spillway being to the right of an observer looking downstream), in theriver center. The site is closed by three rock fill dams, one on each shoreline, and in the centreof the river.
143
Dam
SpillwaysMacKenzie River
ExistingBridge
Dam
Lock
Dam
Figure 4General Arrangement: Mackenzie – 7 at Fort Providence
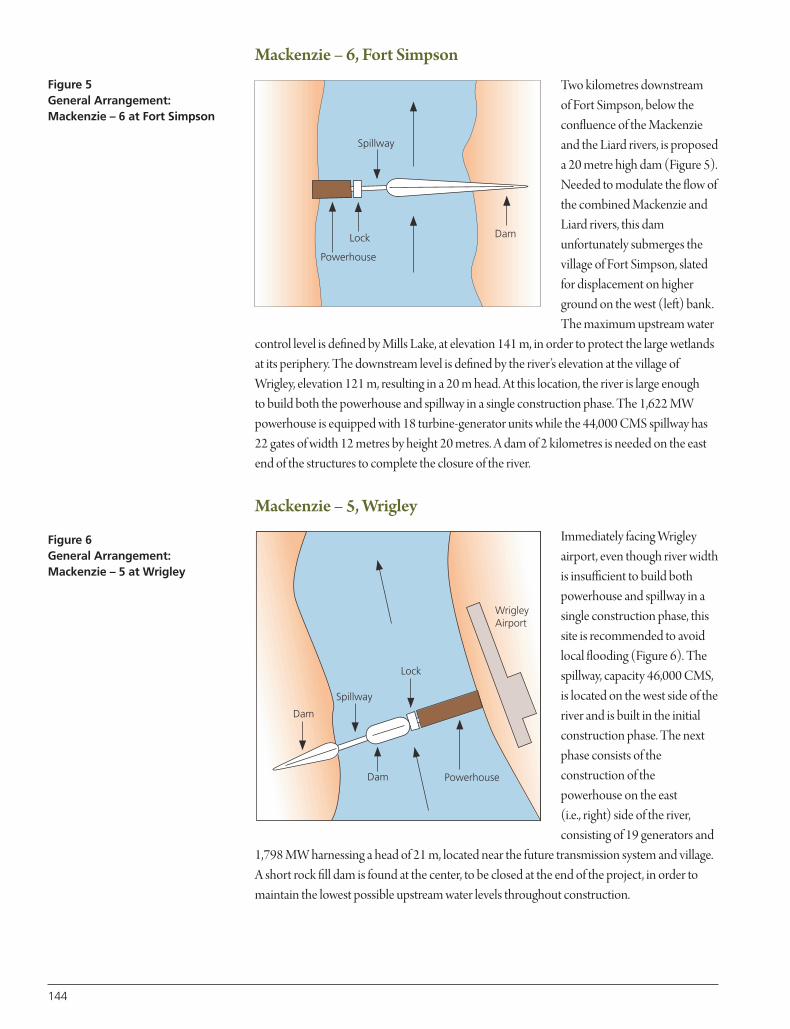
144
Mackenzie – 6, Fort Simpson
Two kilometres downstream of Fort Simpson, below theconfluence of the Mackenzieand the Liard rivers, is proposeda 20 metre high dam (Figure 5).Needed to modulate the flow ofthe combined Mackenzie andLiard rivers, this damunfortunately submerges thevillage of Fort Simpson, slatedfor displacement on higherground on the west (left) bank.The maximum upstream water
control level is defined by Mills Lake, at elevation 141 m, in order to protect the large wetlandsat its periphery. The downstream level is defined by the river’s elevation at the village ofWrigley, elevation 121 m, resulting in a 20 m head. At this location, the river is large enough to build both the powerhouse and spillway in a single construction phase. The 1,622 MWpowerhouse is equipped with 18 turbine-generator units while the 44,000 CMS spillway has22 gates of width 12 metres by height 20 metres. A dam of 2 kilometres is needed on the eastend of the structures to complete the closure of the river.
Mackenzie – 5, Wrigley
Immediately facing Wrigleyairport, even though river widthis insufficient to build bothpowerhouse and spillway in asingle construction phase, thissite is recommended to avoidlocal flooding (Figure 6). Thespillway, capacity 46,000 CMS,is located on the west side of theriver and is built in the initialconstruction phase. The nextphase consists of theconstruction of thepowerhouse on the east (i.e., right) side of the river,consisting of 19 generators and
1,798 MW harnessing a head of 21 m, located near the future transmission system and village.A short rock fill dam is found at the center, to be closed at the end of the project, in order tomaintain the lowest possible upstream water levels throughout construction.
Figure 5General Arrangement:Mackenzie – 6 at Fort Simpson
Dam
Spillway
Lock
Powerhouse
Figure 6General Arrangement:Mackenzie – 5 at Wrigley
DamSpillway
Lock
Powerhouse
Dam
Dam
WrigleyAirport
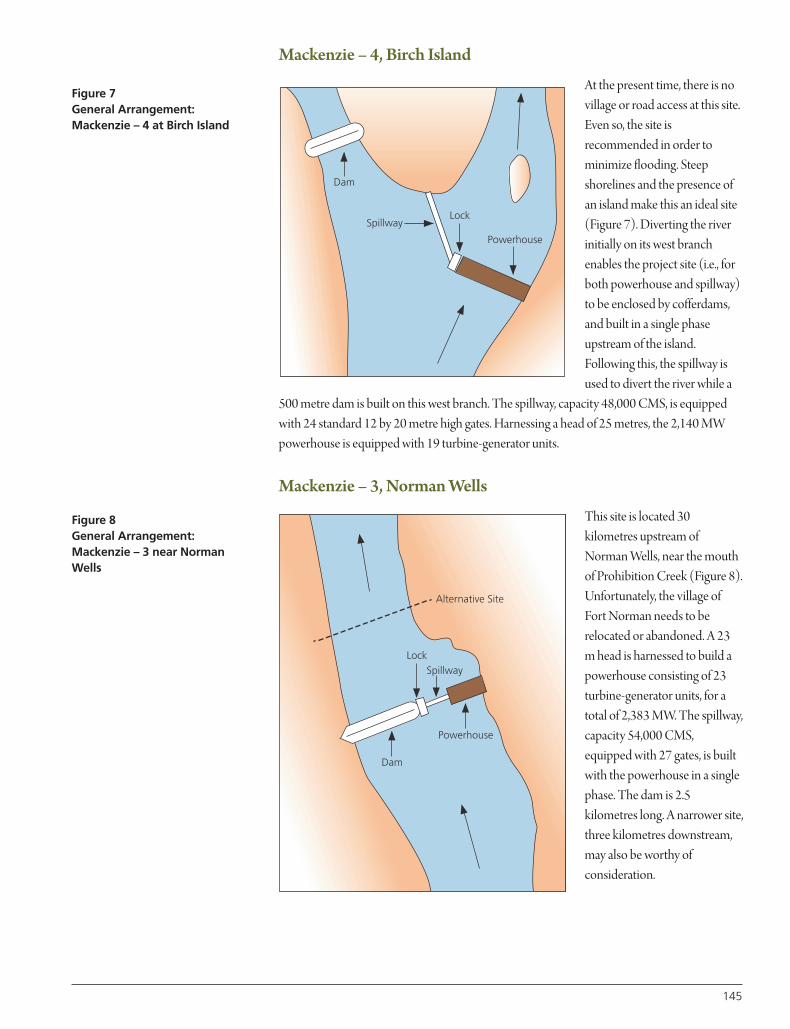
Mackenzie – 4, Birch Island
At the present time, there is novillage or road access at this site.Even so, the site isrecommended in order tominimize flooding. Steepshorelines and the presence ofan island make this an ideal site(Figure 7). Diverting the riverinitially on its west branchenables the project site (i.e., forboth powerhouse and spillway)to be enclosed by cofferdams,and built in a single phaseupstream of the island.Following this, the spillway isused to divert the river while a
500 metre dam is built on this west branch. The spillway, capacity 48,000 CMS, is equippedwith 24 standard 12 by 20 metre high gates. Harnessing a head of 25 metres, the 2,140 MWpowerhouse is equipped with 19 turbine-generator units.
Mackenzie – 3, Norman Wells
This site is located 30kilometres upstream ofNorman Wells, near the mouthof Prohibition Creek (Figure 8).Unfortunately, the village ofFort Norman needs to berelocated or abandoned. A 23m head is harnessed to build apowerhouse consisting of 23turbine-generator units, for atotal of 2,383 MW. The spillway,capacity 54,000 CMS,equipped with 27 gates, is builtwith the powerhouse in a singlephase. The dam is 2.5kilometres long. A narrower site,three kilometres downstream,may also be worthy ofconsideration.
145
Figure 7General Arrangement:Mackenzie – 4 at Birch Island
LockSpillway
Powerhouse
Dam
Figure 8General Arrangement:Mackenzie – 3 near NormanWells
Lock
Spillway
Powerhouse
Dam
Alternative Site
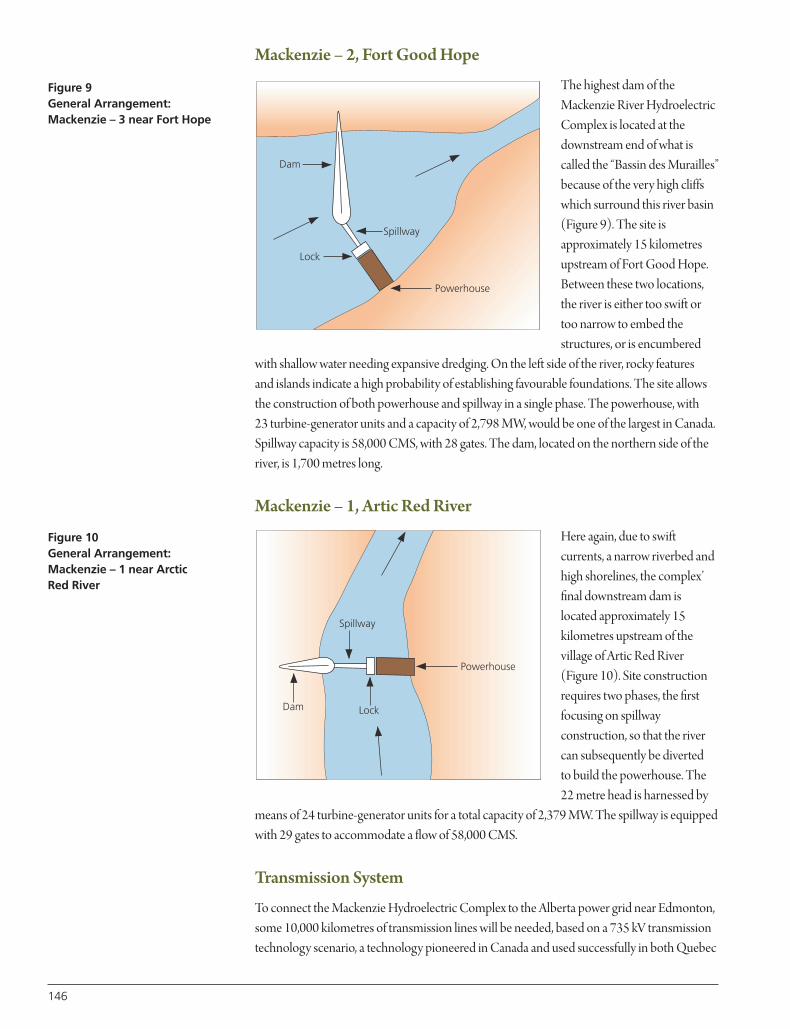
146
Mackenzie – 2, Fort Good Hope
The highest dam of theMackenzie River HydroelectricComplex is located at thedownstream end of what iscalled the “Bassin des Murailles”because of the very high cliffswhich surround this river basin(Figure 9). The site isapproximately 15 kilometresupstream of Fort Good Hope.Between these two locations,the river is either too swift ortoo narrow to embed thestructures, or is encumbered
with shallow water needing expansive dredging. On the left side of the river, rocky features and islands indicate a high probability of establishing favourable foundations. The site allowsthe construction of both powerhouse and spillway in a single phase. The powerhouse, with 23 turbine-generator units and a capacity of 2,798 MW, would be one of the largest in Canada.Spillway capacity is 58,000 CMS, with 28 gates. The dam, located on the northern side of theriver, is 1,700 metres long.
Mackenzie – 1, Artic Red River
Here again, due to swiftcurrents, a narrow riverbed andhigh shorelines, the complex’final downstream dam islocated approximately 15kilometres upstream of thevillage of Artic Red River(Figure 10). Site constructionrequires two phases, the firstfocusing on spillwayconstruction, so that the rivercan subsequently be diverted to build the powerhouse. The22 metre head is harnessed by
means of 24 turbine-generator units for a total capacity of 2,379 MW. The spillway is equippedwith 29 gates to accommodate a flow of 58,000 CMS.
Transmission System
To connect the Mackenzie Hydroelectric Complex to the Alberta power grid near Edmonton,some 10,000 kilometres of transmission lines will be needed, based on a 735 kV transmissiontechnology scenario, a technology pioneered in Canada and used successfully in both Quebec
Figure 9General Arrangement:Mackenzie – 3 near Fort Hope
Dam
Spillway
Lock
Powerhouse
Figure 10General Arrangement:Mackenzie – 1 near Arctic Red River
Dam Lock
Spillway
Powerhouse
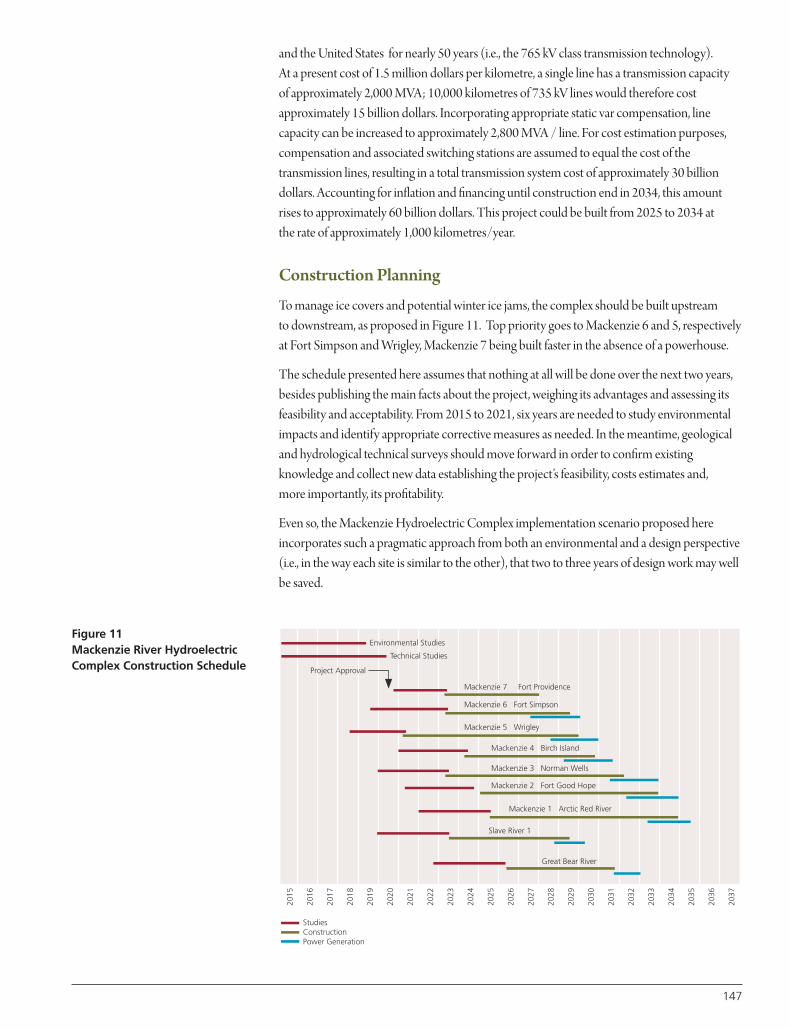
and the United States for nearly 50 years (i.e., the 765 kV class transmission technology). At a present cost of 1.5 million dollars per kilometre, a single line has a transmission capacity of approximately 2,000 MVA; 10,000 kilometres of 735 kV lines would therefore costapproximately 15 billion dollars. Incorporating appropriate static var compensation, linecapacity can be increased to approximately 2,800 MVA / line. For cost estimation purposes,compensation and associated switching stations are assumed to equal the cost of thetransmission lines, resulting in a total transmission system cost of approximately 30 billiondollars. Accounting for inflation and financing until construction end in 2034, this amountrises to approximately 60 billion dollars. This project could be built from 2025 to 2034 at the rate of approximately 1,000 kilometres/year.
Construction Planning
To manage ice covers and potential winter ice jams, the complex should be built upstream to downstream, as proposed in Figure 11. Top priority goes to Mackenzie 6 and 5, respectivelyat Fort Simpson and Wrigley, Mackenzie 7 being built faster in the absence of a powerhouse.
The schedule presented here assumes that nothing at all will be done over the next two years,besides publishing the main facts about the project, weighing its advantages and assessing itsfeasibility and acceptability. From 2015 to 2021, six years are needed to study environmentalimpacts and identify appropriate corrective measures as needed. In the meantime, geologicaland hydrological technical surveys should move forward in order to confirm existingknowledge and collect new data establishing the project’s feasibility, costs estimates and, more importantly, its profitability.
Even so, the Mackenzie Hydroelectric Complex implementation scenario proposed hereincorporates such a pragmatic approach from both an environmental and a design perspective(i.e., in the way each site is similar to the other), that two to three years of design work may wellbe saved.
2015
Environmental Studies
StudiesConstructionPower Generation
Technical Studies
Project Approval
Mackenzie 7
Mackenzie 6 Fort Simpson
Mackenzie 5 Wrigley
Mackenzie 4 Birch Island
Mackenzie 3 Norman Wells
Mackenzie 2 Fort Good Hope
Mackenzie 1 Arctic Red River
Slave River 1
Great Bear River
Fort Providence
2016
2017
2018
2019
2020
2021
2022
2023
2024
2025
2026
2027
2028
2029
2030
2031
2032
2033
2034
2035
2036
2037
Figure 11Mackenzie River HydroelectricComplex Construction Schedule
147
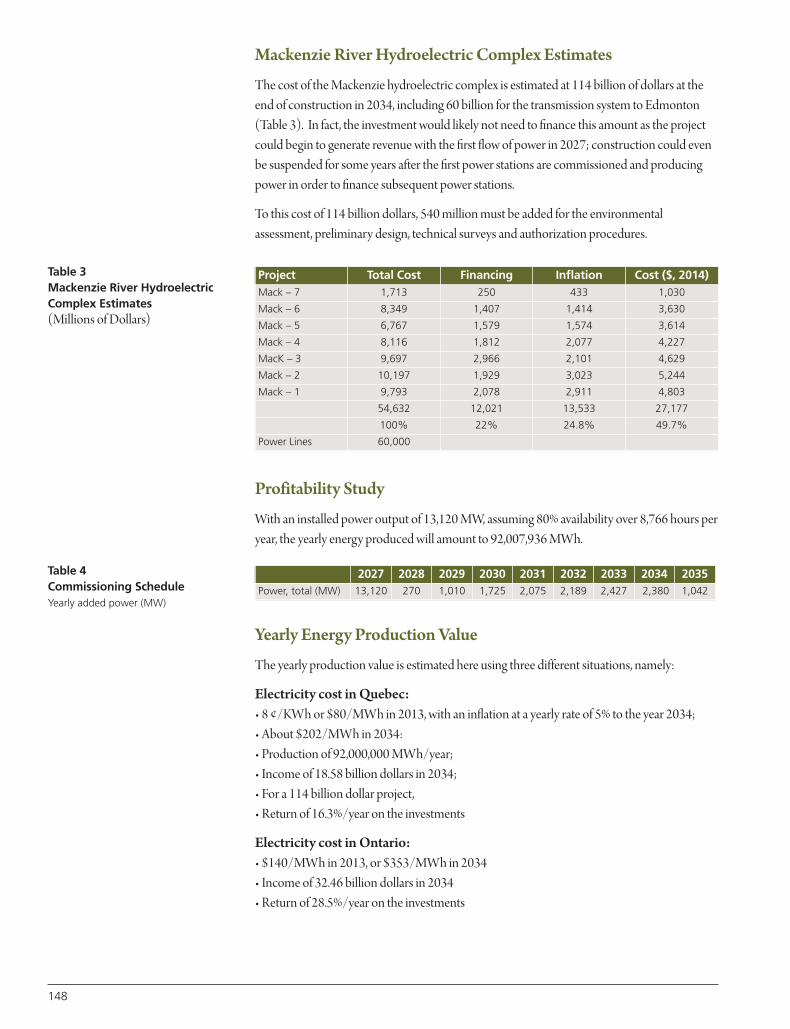
148
Mackenzie River Hydroelectric Complex Estimates
The cost of the Mackenzie hydroelectric complex is estimated at 114 billion of dollars at theend of construction in 2034, including 60 billion for the transmission system to Edmonton(Table 3). In fact, the investment would likely not need to finance this amount as the projectcould begin to generate revenue with the first flow of power in 2027; construction could evenbe suspended for some years after the first power stations are commissioned and producingpower in order to finance subsequent power stations.
To this cost of 114 billion dollars, 540 million must be added for the environmentalassessment, preliminary design, technical surveys and authorization procedures.
Profitability Study
With an installed power output of 13,120 MW, assuming 80% availability over 8,766 hours peryear, the yearly energy produced will amount to 92,007,936 MWh.
Yearly Energy Production Value
The yearly production value is estimated here using three different situations, namely:
Electricity cost in Quebec:• 8 ¢/KWh or $80/MWh in 2013, with an inflation at a yearly rate of 5% to the year 2034;• About $202/MWh in 2034: • Production of 92,000,000 MWh/year;• Income of 18.58 billion dollars in 2034;• For a 114 billion dollar project, • Return of 16.3%/year on the investments
Electricity cost in Ontario:• $140/MWh in 2013, or $353/MWh in 2034• Income of 32.46 billion dollars in 2034• Return of 28.5%/year on the investments
Table 3Mackenzie River HydroelectricComplex Estimates (Millions of Dollars)
Project Total Cost Financing Inflation Cost ($, 2014)Mack – 7 1,713 250 433 1,030
Mack – 6 8,349 1,407 1,414 3,630
Mack – 5 6,767 1,579 1,574 3,614
Mack – 4 8,116 1,812 2,077 4,227
MacK – 3 9,697 2,966 2,101 4,629
Mack – 2 10,197 1,929 3,023 5,244
Mack – 1 9,793 2,078 2,911 4,803
54,632 12,021 13,533 27,177
100% 22% 24.8% 49.7%
Power Lines 60,000
Table 4Commissioning ScheduleYearly added power (MW)
2027 2028 2029 2030 2031 2032 2033 2034 2035 Power, total (MW) 13,120 270 1,010 1,725 2,075 2,189 2,427 2,380 1,042
Equivalent energy for oil production• $100/barrel in the year 2013:• 5% inflation yearly rate to the year 2034, or 252 $/barrel;• Energy production equivalent of 191.5 million barrels yearly; or 525,000 barrels/day, • Income of 55.93 billion dollars in the year 2034;• Return on this investment of 49%/year.
Conclusion
T he Mackenzie River Hydroelectric Complex described in this chapter truly is a “big project,” on a scale comparable to the largest hydroelectric complexes everbuilt. Characterized by flows of up to 9,000 cubic metres per second, steep
shorelines avoiding wide-area submersion, and large lakes acting as flow regulation reservoirs,the project harnesses more than 13,000 MW, available 80% of the time, and delivers its highadded-value energy through a 10,000 kilometre transmission system to Edmonton. Thecomplex would produce some 92 million MWh yearly, equivalent to producing 525,000barrels of fuel oil per day. At current Ontario electricity rates, assuming a 5% yearly inflationrate to 2034, this energy output would produce a gross annual revenue of about 32.4 billiondollars, for a total project cost of 114 billion dollars. This clean energy could be used to assistAlberta (10,000 MW) and Saskatchewan (3,000 MW) transition from high-carbon footprintthermal generating stations at the end of their useful life, to low-carbon hydroelectric power,and powerfully contribute to “Canada becoming a sustainable energy powerhouse!”
149
Biography F. Pierre Gingras has been deeply involved for over 47 years in the execution of major
hydroelectric projects, especially as Chief Planning and Cost Engineer for Hydro-Québec’s Major
Dam Projects like the Manicouagan and James Bay complexes, rebuilding of existing works, and
some 200 other hydroelectric projects studies. Retired, he is continuing to study various projects
with the Montreal Economic Institute, the Canadian Society of Senior Engineers, the Canadian
Academy of Engineering, and some large engineering firms. Among major outcomes of this work
is the “Eau du Nord” (Northern Waters) project, intended to direct additional flows into the
St. Lawrence River Basin, a technical and economic study for a pan-Canadian high-tension
distribution network, and a comprehensive integrated management plan for the entire
St. Lawrence River Basin with emphasis on managing the disastrous environmental effects of
climate change. In 2013, he completed the first preliminary study about the huge Mackenzie River
hydroelectric project.

150

151
ABSTRACT
Petroleum has been the driving force for building and sustaining
societies for more than 100 years. The world now must establish a new
primary energy source to relieve the burden on an increasingly scarce
and costly petroleum supply. The precise timing is unknown but it is
reasonable to assume that, by 2100, a large portion of the world’s
energy needs must be provided by resources other than petroleum.
Uranium is known to be plentiful and, using today’s technology, can
answer all of humanity’s energy needs for at least the next ten
thousand years – and likely much longer.
Canada is blessed with several important energy sources and does not
suffer from an energy shortage. An indigenous fission energy system
named CANDU is fully established, and the required resources of fuel
and other materials are available within Canada’s borders. Safety,
security, and sustainability are demonstrated. It has been shown
statistically that uranium energy is cleaner and safer than oil or coal –
and best of all, it is available. Canada’s uranium resources, both onshore
and in adjacent oceans, are truly inexhaustible.
This chapter proposes the concept of large nuclear generating sites
producing both bulk electricity and process steam, for use by adjacent
industrial parks comprising many high-affinity, energy-intensive
industries. A key feature of this concept is that of the “energy cascade”
where the inputs and outputs of different industrial activities are both
complementary and mutually supportive. Ontario’s Bruce Energy Centre
is presented as an “example case” of the implementation of a number
of these ideas.
Nuclear Energy – The Path Forward Daniel A. Meneley
9
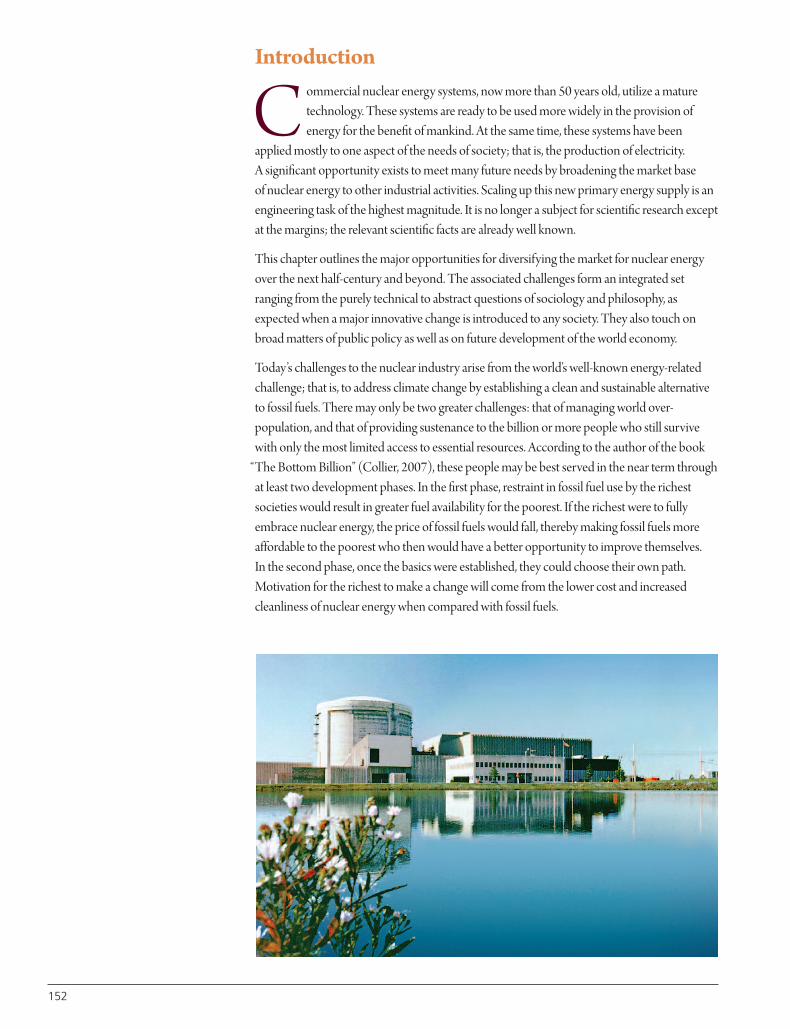
Introduction
C ommercial nuclear energy systems, now more than 50 years old, utilize a maturetechnology. These systems are ready to be used more widely in the provision ofenergy for the benefit of mankind. At the same time, these systems have been
applied mostly to one aspect of the needs of society; that is, the production of electricity. A significant opportunity exists to meet many future needs by broadening the market base of nuclear energy to other industrial activities. Scaling up this new primary energy supply is anengineering task of the highest magnitude. It is no longer a subject for scientific research exceptat the margins; the relevant scientific facts are already well known.
This chapter outlines the major opportunities for diversifying the market for nuclear energyover the next half-century and beyond. The associated challenges form an integrated setranging from the purely technical to abstract questions of sociology and philosophy, asexpected when a major innovative change is introduced to any society. They also touch onbroad matters of public policy as well as on future development of the world economy.
Today’s challenges to the nuclear industry arise from the world’s well-known energy-relatedchallenge; that is, to address climate change by establishing a clean and sustainable alternativeto fossil fuels. There may only be two greater challenges: that of managing world over-population, and that of providing sustenance to the billion or more people who still survivewith only the most limited access to essential resources. According to the author of the book
“The Bottom Billion” (Collier, 2007), these people may be best served in the near term throughat least two development phases. In the first phase, restraint in fossil fuel use by the richestsocieties would result in greater fuel availability for the poorest. If the richest were to fullyembrace nuclear energy, the price of fossil fuels would fall, thereby making fossil fuels moreaffordable to the poorest who then would have a better opportunity to improve themselves. In the second phase, once the basics were established, they could choose their own path.Motivation for the richest to make a change will come from the lower cost and increasedcleanliness of nuclear energy when compared with fossil fuels.
152
Some people believe that petroleum is not, and never will be, in short supply. Better-qualifiedand more convincing persons and organizations point out the error of this thinking. Theworld now uses about 1,000 barrels of oil in each second of every year (Tertzakian, 2007). This cannot last. As stated by the Chief Economist of the International Energy Agency (Birol,2006), “We have to leave oil before it leaves us.” The world must soon switch to an available,boundless, alternative fuel – uranium (Lightfoot et al, 2006).
Assuming a plant capacity availability factor of 90 percent, the heating value of oil beingconsumed in the world today is equivalent to the total fission heat produced by at least 7,000 nuclear units, each with an equivalent electrical production capacity of one billion watts. Building them is no doubt a large job, but it is feasible. There is little time to meet thischallenge; using the most optimistic assumptions, the job should be completed before the year2200. This massive change will require the goodwill and the efforts of many thousands ofpeople, backed by both their governments and by the population at large.
Canada’s challenges are simpler than are those in the wider world. As one of the greatdemocracies of the world, Canada has a single social system, and the necessary resources, tools,and skilled manpower. Canada already owns a fully developed nuclear energy technology inthe CANDU (CANada Deuterium Uranium) system. With strong will and leadership,Canada can install new nuclear plants as a clean, sustainable alternative to fossil fuels and also provide guidance to other countries that share a similar goal.
The Starting Point: Aiming for the Long Term
A t the 2013 winter meeting of the American Nuclear Society, Jim Rogers of DukeEnergy spoke of the need for “Cathedral Thinking” in planning the world energysupply system. Rogers identified the concept some years ago (Zakaria, 2007).
Energy system development is a long, slow, and difficult process similar to that employed inthe building of a large cathedral. It requires careful thought, coupled with a large measure ofhope, a willingness to take risks, and above all a vision of a better future. Leaders in Canadamust begin to practice “Cathedral Thinking.” The likely alternative is chaos and starvation.
Humanity is fast approaching a major shift in its environmental and physical health due to a seemingly accelerating and possibly disastrous change in climatic conditions. It is widelyaccepted that this trend is driven by the accumulation of greenhouse gases in the atmospheredue primarily to the widespread use of fossil fuels. These same fuels are, today, vitallyimportant to human prosperity. Furthermore, the coming environmental crisis may beexacerbated by a shortage of affordable petroleum — the most valuable of available fossil fuels.
These impending difficulties have prompted a number of people to search for means ofalleviating the problems on both the demand and the supply side of energy use. These studiesrapidly concentrate on the demand side because of the steadily increasing world populationand the near-universal aspiration for a better quality of life. Many of these studies, as evidencedin three of them (Cohen, 1983; Till, 2005; Lightfoot et al, 2006), focus on the positive featuresof energy from uranium fission because of the vast scale of this resource, its proven feasibility,and economic attractiveness.
153
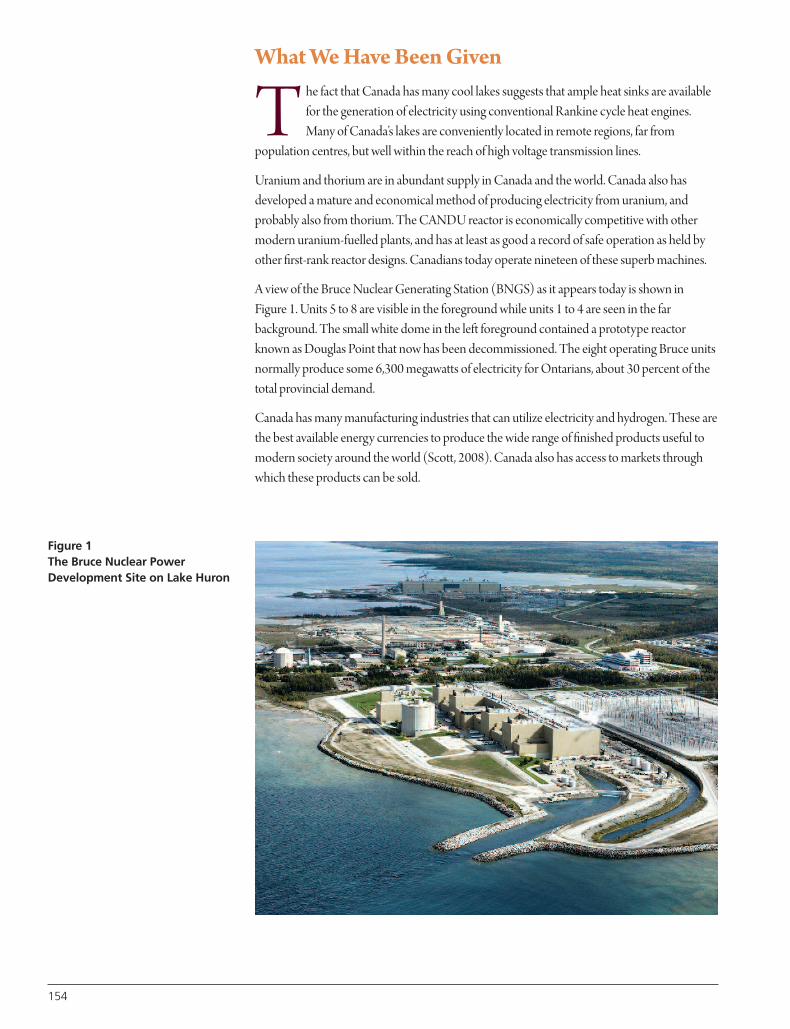
154
What We Have Been Given
T he fact that Canada has many cool lakes suggests that ample heat sinks are availablefor the generation of electricity using conventional Rankine cycle heat engines.Many of Canada’s lakes are conveniently located in remote regions, far from
population centres, but well within the reach of high voltage transmission lines.
Uranium and thorium are in abundant supply in Canada and the world. Canada also hasdeveloped a mature and economical method of producing electricity from uranium, andprobably also from thorium. The CANDU reactor is economically competitive with othermodern uranium-fuelled plants, and has at least as good a record of safe operation as held byother first-rank reactor designs. Canadians today operate nineteen of these superb machines.
A view of the Bruce Nuclear Generating Station (BNGS) as it appears today is shown inFigure 1. Units 5 to 8 are visible in the foreground while units 1 to 4 are seen in the farbackground. The small white dome in the left foreground contained a prototype reactorknown as Douglas Point that now has been decommissioned. The eight operating Bruce unitsnormally produce some 6,300 megawatts of electricity for Ontarians, about 30 percent of thetotal provincial demand.
Canada has many manufacturing industries that can utilize electricity and hydrogen. These arethe best available energy currencies to produce the wide range of finished products useful tomodern society around the world (Scott, 2008). Canada also has access to markets throughwhich these products can be sold.
Figure 1The Bruce Nuclear PowerDevelopment Site on Lake Huron
The Next Big Project
I t is well established that fission chain reactors can be built to provide reliable electricity.What is now proposed is to broaden the product diversity of future reactors to includeother commodities needed by a prosperous society. An excellent beginning in this
direction was made more than twenty years ago with the development of the Bruce EnergyCentre (BEC) on Lake Huron (Gurbin & Talbot, 1994). Figure 2 provides a broad outline of the concept, consisting of an energy cascade powered by uranium energy. To drive thiscascade, in addition to producing electricity, the first four units of BNGS were fitted with steam transformer units. Steam excess to electricity generation needs was sent through thetransformers to produce lower-pressure steam in their secondary circuits. This steam wasdirected to the site-wide bulk steam system, including the BEC steam line.
Delegates to the Engineering Institute of Canada’s third climate change conference(Engineering Institute of Canada, 2013) recognized that energy, water, and food form thenexus of human material needs – those which engineers are fully equipped to provide. Energylies at the very centre of these basic needs; without plentiful energy, it is not possible to
“engineer” any of the other solutions.
Canada, and indeed the whole world, needs to look beyond those energy-rich resources thatare already in service and toward every plentiful and economical new resource that is availablefor use in the future. As is true in most parts of the world, uranium is plentiful, if only at lowconcentrations. Even tiny concentrations of uranium, however, can become importantreserves if Fast Neutron Reactor (FNR) technology is introduced. This is due to the fact thateach gram of uranium yields a very large amount of energy if irradiated by high-velocityneutrons in this special type of fission reactor. Of course, this fact also means that uranium canbe imported or exported without any concern about disturbing the balance of trade, becauseso little uranium is required to support a large fleet of fast reactors – only two tons per year foreach one thousand megawatt electric power plant.
Canadians are familiar with the CANDU reactor that has operated successfully around theworld for more than 50 years. CANDU is a thermal reactor, in which most fission is initiatedby so-called “slow” – also referred to as “thermal” – neutrons (these “slow” neutrons actuallymove quite fast – about 8,000 km/hr.). It is recommended by many technical experts thatCanada should embark on a venture toward adding the fast neutron reactor (FNR) that offersexcellent support advantages for a reactor fleet containing CANDU power plants. FNRreactors have been operated for several decades in a few countries; Russia, China, and India arebuilding this reactor type today. All fission takes place at high neutron velocities in this reactor.At high neutron velocity, the physics of the process is even more advantageous than in the low-velocity CANDU reactor (Till & Chang, 2011). By leveraging their complementary strengths,these two reactor types together offer significant advantages compared to either of themworking as independent, stand-alone units.
Drawing on the analogy of the oil fields in the Middle East, Canada - using technologiesavailable today - can establish a local energy supply larger than that offered by all of the MiddleEast petroleum producing countries taken together. Furthermore, this “Saudi in Canada”concept can be cheaper, cleaner, and more sustainable than those Middle East oil and gas fields.A recent paper (Meneley, 2010) outlines some of the characteristics of a typical industrialcomplex centered on nuclear power plants, using the Bruce site on Lake Huron as an example.
155
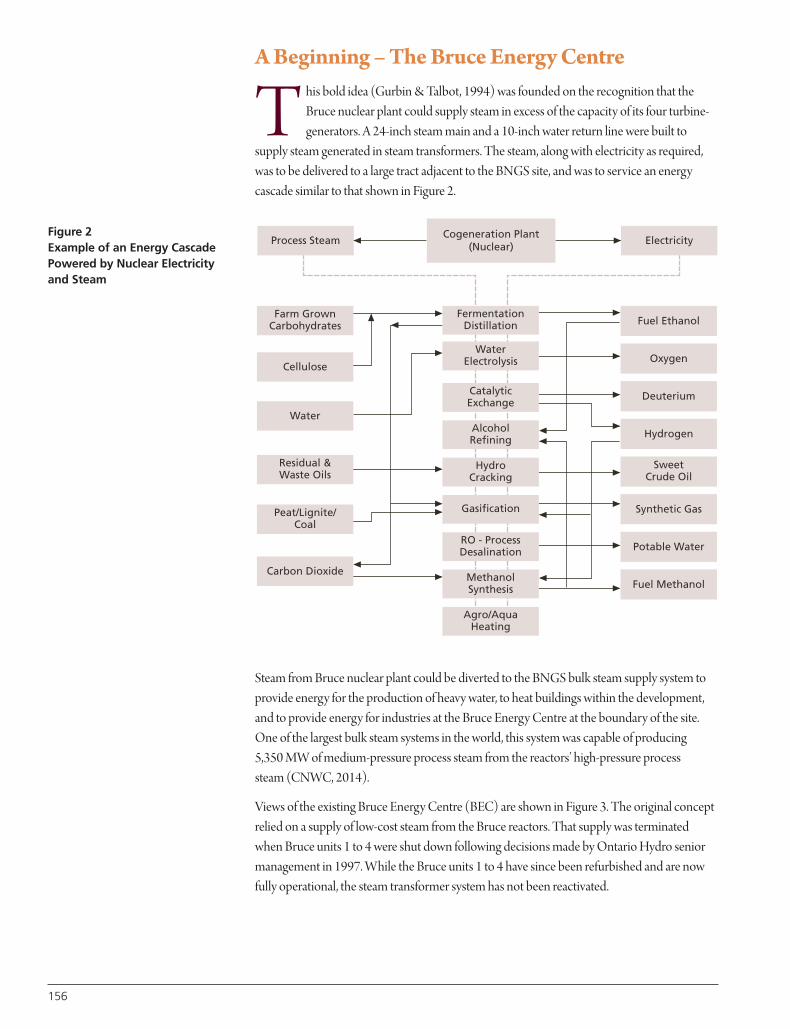
156
A Beginning – The Bruce Energy Centre
T his bold idea (Gurbin & Talbot, 1994) was founded on the recognition that theBruce nuclear plant could supply steam in excess of the capacity of its four turbine-generators. A 24-inch steam main and a 10-inch water return line were built to
supply steam generated in steam transformers. The steam, along with electricity as required,was to be delivered to a large tract adjacent to the BNGS site, and was to service an energycascade similar to that shown in Figure 2.
Steam from Bruce nuclear plant could be diverted to the BNGS bulk steam supply system toprovide energy for the production of heavy water, to heat buildings within the development,and to provide energy for industries at the Bruce Energy Centre at the boundary of the site.One of the largest bulk steam systems in the world, this system was capable of producing5,350 MW of medium-pressure process steam from the reactors’ high-pressure process steam (CNWC, 2014).
Views of the existing Bruce Energy Centre (BEC) are shown in Figure 3. The original conceptrelied on a supply of low-cost steam from the Bruce reactors. That supply was terminatedwhen Bruce units 1 to 4 were shut down following decisions made by Ontario Hydro seniormanagement in 1997. While the Bruce units 1 to 4 have since been refurbished and are nowfully operational, the steam transformer system has not been reactivated.
Cogeneration Plant(Nuclear)
FermentationDistillation Fuel Ethanol
Oxygen
Deuterium
Hydrogen
SweetCrude Oil
Synthetic Gas
Potable Water
Fuel Methanol
Farm GrownCarbohydrates
Process Steam Electricity
Cellulose
Water
Residual &Waste Oils
Peat/Lignite/Coal
Carbon Dioxide
WaterElectrolysis
CatalyticExchange
AlcoholRefining
HydroCracking
Gasification
RO - ProcessDesalination
MethanolSynthesis
Agro/AquaHeating
Figure 2Example of an Energy CascadePowered by Nuclear Electricityand Steam
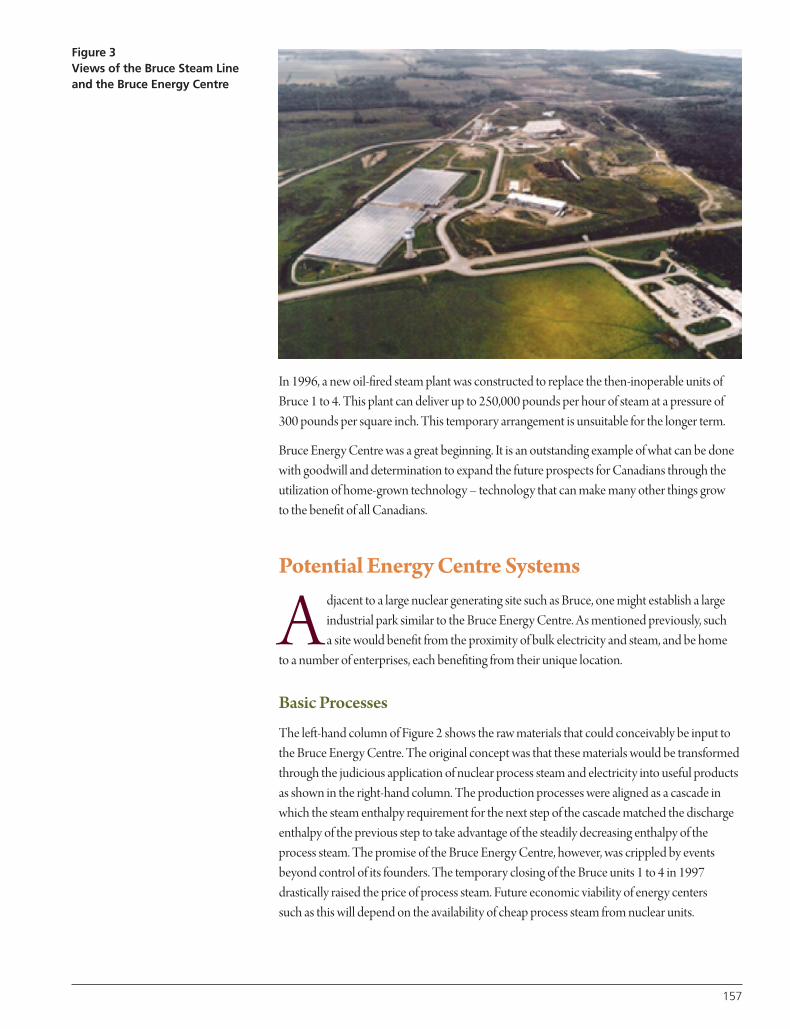
In 1996, a new oil-fired steam plant was constructed to replace the then-inoperable units ofBruce 1 to 4. This plant can deliver up to 250,000 pounds per hour of steam at a pressure of300 pounds per square inch. This temporary arrangement is unsuitable for the longer term.
Bruce Energy Centre was a great beginning. It is an outstanding example of what can be donewith goodwill and determination to expand the future prospects for Canadians through theutilization of home-grown technology – technology that can make many other things grow to the benefit of all Canadians.
Potential Energy Centre Systems
A djacent to a large nuclear generating site such as Bruce, one might establish a largeindustrial park similar to the Bruce Energy Centre. As mentioned previously, such a site would benefit from the proximity of bulk electricity and steam, and be home
to a number of enterprises, each benefiting from their unique location.
Basic Processes
The left-hand column of Figure 2 shows the raw materials that could conceivably be input tothe Bruce Energy Centre. The original concept was that these materials would be transformedthrough the judicious application of nuclear process steam and electricity into useful productsas shown in the right-hand column. The production processes were aligned as a cascade inwhich the steam enthalpy requirement for the next step of the cascade matched the dischargeenthalpy of the previous step to take advantage of the steadily decreasing enthalpy of theprocess steam. The promise of the Bruce Energy Centre, however, was crippled by eventsbeyond control of its founders. The temporary closing of the Bruce units 1 to 4 in 1997drastically raised the price of process steam. Future economic viability of energy centers such as this will depend on the availability of cheap process steam from nuclear units.
157
Figure 3Views of the Bruce Steam Lineand the Bruce Energy Centre
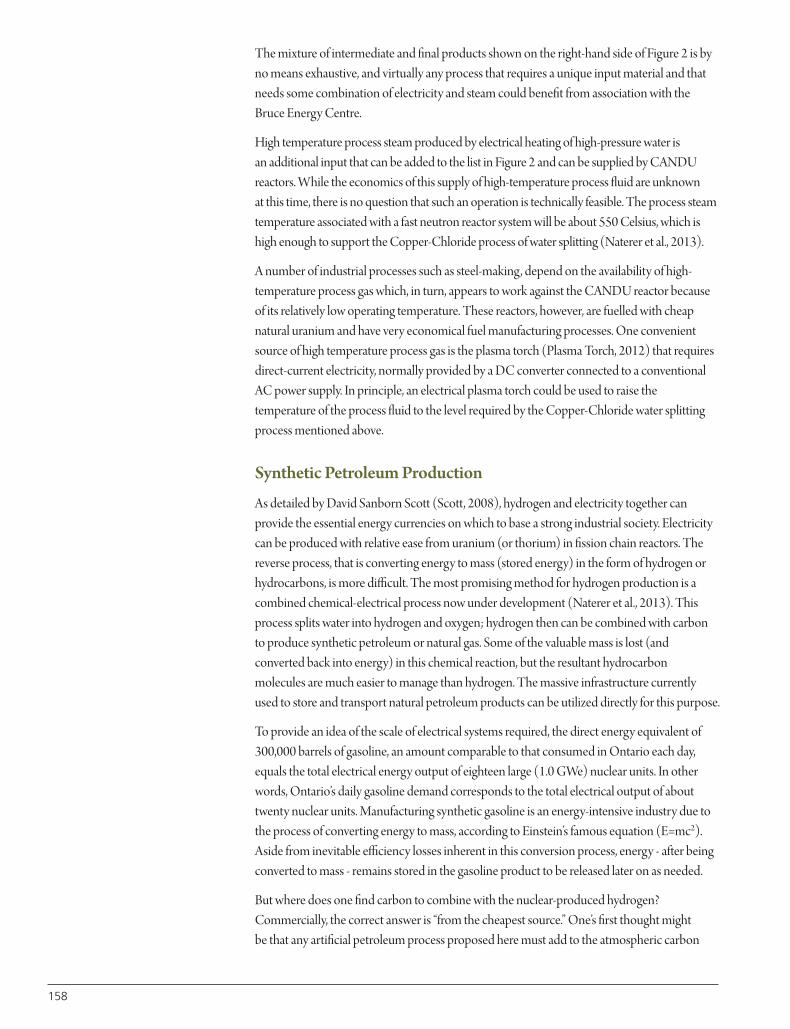
158
The mixture of intermediate and final products shown on the right-hand side of Figure 2 is byno means exhaustive, and virtually any process that requires a unique input material and thatneeds some combination of electricity and steam could benefit from association with theBruce Energy Centre.
High temperature process steam produced by electrical heating of high-pressure water is an additional input that can be added to the list in Figure 2 and can be supplied by CANDUreactors. While the economics of this supply of high-temperature process fluid are unknown at this time, there is no question that such an operation is technically feasible. The process steamtemperature associated with a fast neutron reactor system will be about 550 Celsius, which ishigh enough to support the Copper-Chloride process of water splitting (Naterer et al., 2013).
A number of industrial processes such as steel-making, depend on the availability of high-temperature process gas which, in turn, appears to work against the CANDU reactor becauseof its relatively low operating temperature. These reactors, however, are fuelled with cheapnatural uranium and have very economical fuel manufacturing processes. One convenientsource of high temperature process gas is the plasma torch (Plasma Torch, 2012) that requiresdirect-current electricity, normally provided by a DC converter connected to a conventionalAC power supply. In principle, an electrical plasma torch could be used to raise thetemperature of the process fluid to the level required by the Copper-Chloride water splittingprocess mentioned above.
Synthetic Petroleum Production
As detailed by David Sanborn Scott (Scott, 2008), hydrogen and electricity together canprovide the essential energy currencies on which to base a strong industrial society. Electricitycan be produced with relative ease from uranium (or thorium) in fission chain reactors. Thereverse process, that is converting energy to mass (stored energy) in the form of hydrogen orhydrocarbons, is more difficult. The most promising method for hydrogen production is acombined chemical-electrical process now under development (Naterer et al., 2013). Thisprocess splits water into hydrogen and oxygen; hydrogen then can be combined with carbonto produce synthetic petroleum or natural gas. Some of the valuable mass is lost (andconverted back into energy) in this chemical reaction, but the resultant hydrocarbonmolecules are much easier to manage than hydrogen. The massive infrastructure currentlyused to store and transport natural petroleum products can be utilized directly for this purpose.
To provide an idea of the scale of electrical systems required, the direct energy equivalent of300,000 barrels of gasoline, an amount comparable to that consumed in Ontario each day,equals the total electrical energy output of eighteen large (1.0 GWe) nuclear units. In otherwords, Ontario’s daily gasoline demand corresponds to the total electrical output of abouttwenty nuclear units. Manufacturing synthetic gasoline is an energy-intensive industry due tothe process of converting energy to mass, according to Einstein’s famous equation (E=mc2).Aside from inevitable efficiency losses inherent in this conversion process, energy - after beingconverted to mass - remains stored in the gasoline product to be released later on as needed.
But where does one find carbon to combine with the nuclear-produced hydrogen?Commercially, the correct answer is “from the cheapest source.” One’s first thought might be that any artificial petroleum process proposed here must add to the atmospheric carbon
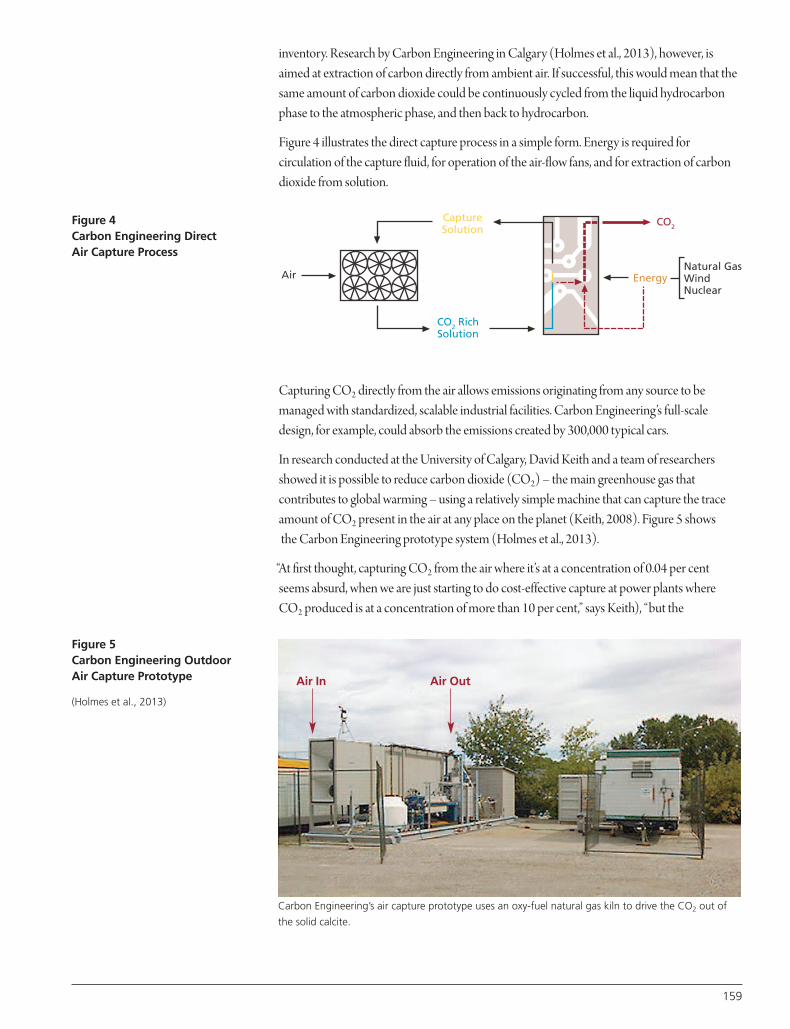
inventory. Research by Carbon Engineering in Calgary (Holmes et al., 2013), however, isaimed at extraction of carbon directly from ambient air. If successful, this would mean that thesame amount of carbon dioxide could be continuously cycled from the liquid hydrocarbonphase to the atmospheric phase, and then back to hydrocarbon.
Figure 4 illustrates the direct capture process in a simple form. Energy is required forcirculation of the capture fluid, for operation of the air-flow fans, and for extraction of carbondioxide from solution.
Capturing CO2 directly from the air allows emissions originating from any source to bemanaged with standardized, scalable industrial facilities. Carbon Engineering’s full-scaledesign, for example, could absorb the emissions created by 300,000 typical cars.
In research conducted at the University of Calgary, David Keith and a team of researchersshowed it is possible to reduce carbon dioxide (CO2) – the main greenhouse gas thatcontributes to global warming – using a relatively simple machine that can capture the traceamount of CO2 present in the air at any place on the planet (Keith, 2008). Figure 5 showsthe Carbon Engineering prototype system (Holmes et al., 2013).
“At first thought, capturing CO2 from the air where it’s at a concentration of 0.04 per centseems absurd, when we are just starting to do cost-effective capture at power plants where CO2 produced is at a concentration of more than 10 per cent,” says Keith), “but the
Figure 4Carbon Engineering DirectAir Capture Process
Figure 5Carbon Engineering OutdoorAir Capture Prototype
(Holmes et al., 2013)
CaptureSolution
Air EnergyNatural GasWindNuclear
CO2 RichSolution
CO2
159
Air In Air Out
Carbon Engineering’s air capture prototype uses an oxy-fuel natural gas kiln to drive the CO2 out of
the solid calcite.
160
thermodynamics suggest that air capture might only be a bit harder than capturing CO2 frompower plants. We are trying to turn that theory into engineering reality.”
This research is significant because air capture technology is the only way to capture CO2
emissions from transportation sources such as vehicles and airplanes. These so-called diffusesources represent more than half of the greenhouse gases emitted on Earth.
“The climate problem is too big to solve easily with the tools we have,” notes Keith. “While it’simportant to get started doing things we know how to do, like wind power, nuclear power and‘regular’ carbon capture and storage, it’s also vital to start thinking about radical new ideas andapproaches to solving this problem.”
Short and Medium Term Electricity Storage
Many people think that large nuclear power plants cannot be operated to adjust to short-termelectricity demand fluctuations. In fact, existing CANDU units, and many others (WorldNuclear Association & EDF, 2010), are designed to maneuver daily. CANDU units can do sodown to about 60% of full power and return. Smaller power reductions are, of course, easier toaccommodate. It is true, however, that power maneuvering is an expensive procedure for alarge generator with relatively high specific capital cost and low fuel cost. Experience hasshown that frequent reactor power changes may cause increased failure rates of plantcomponents. Subsequent aging of units, resulting in the tightening of operating limits, makesdaily maneuvering even more difficult.
Alternatively, it is possible to divert excess generating power to secondary generators(Forsberg, 2011). Night-time storage of hydrogen and oxygen, followed by daytime burning of these gases in specialized gas turbines, provides an efficient electrical system with peakingcapacity. Modern electronic DC conversion technology could instantaneously divert electricpower to hydrogen electrolysis loads, thereby maintaining fission energy production atmaximum levels while producing a second, valuable energy currency. This capability would be most practical for CANDU reactors because of the low cost of natural uranium fuel.
Storage of electricity involves the same basic processes as the production of syntheticpetroleum. Energy is used to produce mass, which can then be stored.
Hydrogen production provides the opportunity for extraction of two other valuable products. The first is oxygen and the second is deuterium. Deuterium is a rare isotope, present in natural hydrogen, in concentrations of approximately 1 in 7,000 molecules. It is avital component in the CANDU reactor. Deuterium can be extracted from hydrogen gas usingthe combined electrolysis catalytic exchange process developed by AECL some years ago(Hammerli et al., 1978).
Industrial Steam Supply
The Bruce Energy Centre (BEC) utilized medium-pressure steam produced on the secondaryside of steam transformers. The maximum energy delivery was approximately 300 megawattsthermal. This steam was used by a variety of facilities on the BEC site.
Other Suitable Energy Centre Industrial Processes
As illustrated in Figure 2, many other processes could benefit from the ready availability ofeconomical heat and electricity, not to mention processes based on a variety of agricultural or biomass feedstocks. These include fermentation, distillation, ethanol and methanolproduction, and purification of water via reverse osmosis. It may also be worth examining the feasibility of connecting a DC generator to the main AC generator shaft, so that bulk DCpower would be available on-site (Scott, 2009) or, alternatively, the addition of electronicconverters to provide bulk DC power supply to the site.
Collaborative Operation of CANDU and Fast Neutron Reactors
A fleet of CANDU power plants can benefit from the exchange of nuclear fuelcomponents within fast neutron reactors (Meneley, 2010). The fast neutron reactor(FNR) creates an excess of fissile isotopes, while a normal CANDU plant is always a
little bit short of those same isotopes. At the same time, used fuel discharged from CANDUreactors contains exactly the mixture of heavy elements (actinides) that are necessary for thefirst fuel charge of any fast reactor. There is significant merit in considering fuel cyclesintegrated between these two nuclear reactor types within the same industrial park.
Fuel Production, Reprocessing, and Waste Management
These separate support functions could be established either at the energy park or might beseparated by some distance, depending on site and other conditions. Fuel production for thereactors located at the main site, or even fuels for use as export commodities, might beassociated with the energy park to some degree.
A large energy park might include the capability of supporting much smaller remotely locatedpower reactor facilities such as the Secure Transportable Autonomous Reactor (STAR)concept (Wade, 2010). The idea is to deliver a “package” system to a remote site, in a stylesimilar to a conventional battery. This nuclear battery would, however, be capable of deliveringmegawatt-scale energy supply for several years, after which the “package” would be returned tothe energy park for reprocessing. A fresh “package” would be shipped to the remote site. Asimple system might consist of a large nuclear plant, local electrical grid, and boilers positionedat or near each major wellhead. Cheap nuclear fuel could make such a network feasible.
Establishment of Functionally Separate Energy Centres
A large nuclear energy park might be developed as separate components; that is, large-scaleelectricity generation might separate naturally from the growing industrial facilities. The mainreason for such separation is the special security and radiation protection requirements at a so-called “nuclear” site. Other industries also may have unique hazard characteristics thatmight best be isolated from nuclear site safety and security requirements – such as deuteriumproduction using hydrogen fluoride gas. It might also prove advantageous to separate thefacilities supported by fast neutron reactors – which, as pointed out in the next section, will
161
162
likely NOT be primarily bulk electricity producers– from the purely electrical utility functions.Once again, security and unique hazards may be sufficient cause for separation of the variousindustrial components.
Challenges
The Nuclear Fission Enterprise
T ransition from a successful stand-alone thermal reactor fleet to a combined thermaland fast reactor fleet will be difficult for several reasons. The first, and perhaps mostdifficult task, will be to convince operating organizations of the need for change.
They have been operating Generation II or III reactors for decades and the price of fuel hasalways been a small fraction of the total operating cost. The price of fuel will rise in the future,however, and (perhaps the most convincing reason) the volume of stored used fuel on the sitewill someday reach difficult proportions.
The above suggests the establishment of a purpose-built fast neutron reactor (FNR) site thatserves three primary functions. The first is for processing used thermal reactor fuel into minoractinides, fission products, and Uranium 238. The second is for producing energy (bothelectrical and thermal) from recovered minor actinides plus a small part of the U238recovered in the separation process. The third is for storing excess recovered U238 in anadjacent underground storage facility that is sufficient also to retain fast reactor waste products(fission products), and to separate useful fission products from true waste. The U238 would beutilized as needed to sustain long-term FNR operations. Given the expected quantities ofactinides and uranium on the site, the fast reactors will never need an off-site source of fuel,after their first startup.
The FNR is, by its nature, a potential net producer of fissionable material. This material couldbe fabricated into new fuel assemblies to be used either to fuel new fast neutron reactors or toprovide thorium fuel containing fissile topping for thorium-fuelled CANDU reactors.
The primary purpose of this distinct type of nuclear site may be to produce products other thanelectricity. It will not likely be owned solely by a single entity, but rather by a consortium led by a provincial or national government, with the operation of particular industries “farmed out” to specialist organizations. In short, it is an industrial complex whose goal is development ofenergy-related enterprises for the benefit of the whole nation, and possibly of the wider world.
Synthetic Oil Production
The primary technical challenge in this case is to determine whether or not it is feasible toproduce sufficient synthetic petroleum economically to replace all or at least a significant partof our natural petroleum supply.
The best known case of such production was in South Africa some years ago, when thepetroleum embargo forced the company known as SASOL (Sasol, 2014) to produce oil fromcoal by means of an improved version of the Fischer-Tropsch (National Energy TechnologyLab, 2014) process developed in Germany before World War II.
Recently, a number of large oil companies have investigated oil and gas production optionsutilizing coal, oil, and other basic hydrocarbon sources. None of these, however, has looked atthe possibility of using cheap uranium as the basic energy source for synthetic fuel production.The most advanced analysis of this type was published in the MIT white paper by Bersak &Kadak, 2007. The specific application was for extraction and upgrading of product fromAlberta’s oil sands. As such, this application is not “portable.” At the same time, the essentialadded ingredient, once hydrogen has been produced, is a cheap source of carbon.Hydrocarbon is, after all, the energy storage medium “chosen” by nature and one from whichhumanity has derived great benefit.
Strong support for the feasibility of synthetic oil production can be found in a recent US Navyreport (Williams et al, 2010). The authors propose using shipboard nuclear power to producehydrogen, along with carbon dioxide extracted from seawater, to produce jet fuel. Cost analysisof this system is shown to be highly favorable. The system using commercial-scale nuclearplants and air-derived carbon dioxide (Keith, 2008) should be even more feasible. Obviously,work must be done before such a system could enter commercial service – and proving out aland-based system will take time. But, the system looks promising for the longer term.
Nuclear Waste Management
While this issue is not a major technical concern within the technical community, it hasbecome a “signature” issue among those dedicated to the opposition of the use of nuclearenergy. It is important to address this issue in some depth.
The materials we now identify as nuclear waste have been present in our environment sincethe earth was born. Ionizing radiation strikes our bodies every second of every day. We haveevolved into our human form in the presence of ionizing radiation. We inhale radioactivematerials, we eat them, and we carry them in our bodies from birth to death. Because ionizing radiation is so pervasive, our bodies have adapted to constant irradiation. It is true that irradiation causes damage to our cells. It is also true that there are many other damagemechanisms, some much more damaging than radiation. Fortunately, powerful defenses exist. Our cells have adapted by producing the means for repairing damage and rejecting badly damaged cells, so that we live normal lives, unaware of all those events going on insideeach of us.
When the centre of an atom changes by releasing a particle, energy is released. The fact thatenergy is stored inside atoms makes them interesting. Heat is released from the breaking up of atoms, in exactly the same way as happens during the burning of fossil fuels, except for aunique advantage granted by the virtually limitless supply of energy available from fission ofuranium or atoms. We know that the supply of electricity from uranium can continue for atleast as long as humanity exists on this planet. The broken fragments of atoms have done theirwork. Energy has been released and used to make electricity. Some of these fragments or
“fission products” emit intense ionizing radiation, most intensely in the first seconds afterfission. The intensity of this radiation decreases steadily but continues at a low level for manyyears. Used fuel material eventually will become almost identical to the uranium ore first takenout of the ground.
163
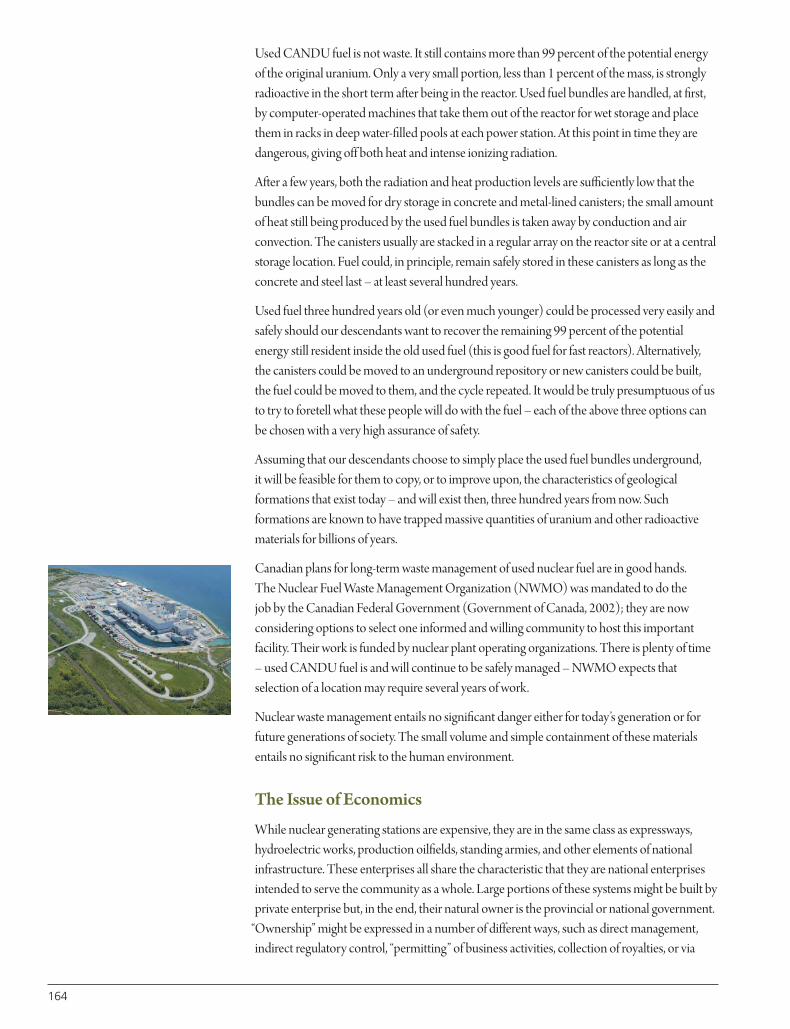
164
Used CANDU fuel is not waste. It still contains more than 99 percent of the potential energyof the original uranium. Only a very small portion, less than 1 percent of the mass, is stronglyradioactive in the short term after being in the reactor. Used fuel bundles are handled, at first,by computer-operated machines that take them out of the reactor for wet storage and placethem in racks in deep water-filled pools at each power station. At this point in time they aredangerous, giving off both heat and intense ionizing radiation.
After a few years, both the radiation and heat production levels are sufficiently low that thebundles can be moved for dry storage in concrete and metal-lined canisters; the small amountof heat still being produced by the used fuel bundles is taken away by conduction and airconvection. The canisters usually are stacked in a regular array on the reactor site or at a centralstorage location. Fuel could, in principle, remain safely stored in these canisters as long as theconcrete and steel last – at least several hundred years.
Used fuel three hundred years old (or even much younger) could be processed very easily andsafely should our descendants want to recover the remaining 99 percent of the potentialenergy still resident inside the old used fuel (this is good fuel for fast reactors). Alternatively,the canisters could be moved to an underground repository or new canisters could be built,the fuel could be moved to them, and the cycle repeated. It would be truly presumptuous of usto try to foretell what these people will do with the fuel – each of the above three options canbe chosen with a very high assurance of safety.
Assuming that our descendants choose to simply place the used fuel bundles underground, it will be feasible for them to copy, or to improve upon, the characteristics of geologicalformations that exist today – and will exist then, three hundred years from now. Suchformations are known to have trapped massive quantities of uranium and other radioactivematerials for billions of years.
Canadian plans for long-term waste management of used nuclear fuel are in good hands. The Nuclear Fuel Waste Management Organization (NWMO) was mandated to do the job by the Canadian Federal Government (Government of Canada, 2002); they are nowconsidering options to select one informed and willing community to host this importantfacility. Their work is funded by nuclear plant operating organizations. There is plenty of time– used CANDU fuel is and will continue to be safely managed – NWMO expects thatselection of a location may require several years of work.
Nuclear waste management entails no significant danger either for today’s generation or forfuture generations of society. The small volume and simple containment of these materialsentails no significant risk to the human environment.
The Issue of Economics
While nuclear generating stations are expensive, they are in the same class as expressways,hydroelectric works, production oilfields, standing armies, and other elements of nationalinfrastructure. These enterprises all share the characteristic that they are national enterprisesintended to serve the community as a whole. Large portions of these systems might be built byprivate enterprise but, in the end, their natural owner is the provincial or national government.
“Ownership” might be expressed in a number of different ways, such as direct management,indirect regulatory control, “permitting” of business activities, collection of royalties, or via

taxation. The common factor is that the enterprise cannot and does not proceed withoutgovernment permission of some sort.
Given the fact of government control of the nuclear energy enterprise, it follows that thisactivity must be deemed of value to the nation before the enterprise actually begins. Given the fact that the enterprise is intended to benefit the whole community, it follows that bothexpenditure and revenue should be shared with that community.
Ontario has a strong industrial base, as is evidenced by the knowledge that more than nine-tenths of the total cost of the Darlington Generating Station was expended in Canada, with the majority of the cost incurred in Ontario. It is fair to say then, that the main expenditure was represented by the energies of the people who designed, manufactured, and constructedthe plant along with those who now operate it. It can be expected that future nuclear capacityexpansion will have a similar ownership distribution, and will bring strong benefits to Canada’s economy.
Public Acceptance
The most powerful factor that delays utilization of uranium and thorium to produce plentifulenergy is the fear of ionizing radiation – a primordial fear that need not have a basis in reality.Spencer Weart presents a careful analysis of this phenomenon (Weart, 2007). Many peoplefear ionizing radiation without understanding that it is actually a very weak carcinogen – inother words this fear is based, wrongly, on fear of cancer (Cuttler, 2013). This climate of dreadhas been stimulated and sustained by a variety of opponents dedicated against the utilizationof nuclear energy. The underlying motives of these opponents range from sincere dislike ofeverything nuclear to obvious self-interest, mostly driven by the possibility of losing marketshare. Political opposition tends to support uninformed public opinion and is likely driven byan overwhelming desire for re-election.
A large amount of scientific research has been conducted to elucidate the effects of ionizingradiation on live cells and their reproduction. The findings are complex but nonethelessstrongly support the case that the earlier assumption that damage is proportional to dose, allthe way down to zero, is incorrect. In fact, low doses of radiation may be beneficial to health; at least, there is no net negative effect. Recognition of this established fact by the public and byhealth regulatory agencies would lead to a profound improvement in the public perception ofthe whole nuclear enterprise. Wade Allison (Allison, 2013) has given simple and useful advicein consideration of this issue:
“There are 3.5 things to be said in a public forum:
1. Radiation is almost harmless (Fukushima, Chernobyl, Goiania, etc.)
2. Fear of low doses of radiation is very dangerous and has killed many and caused greateconomic damage, in Japan and around the world for no benefit. This fear, perpetuated byALARA, was inspired by WWII and the Cold War (but not linked to UV in sunshine).
3. Medium and high doses of radiation as used in medical scans and radiotherapy are highlybeneficial and widely appreciated
3.5. Finally, radiobiologists have shown that low chronic exposure to radiation actually reducescancer risks (which is not surprising if you think about it).”
165
166
The essence of Dr. Allison’s argument is that fear of radiation is a problem of leadership. Thelack of leadership is shown in both government and professional organizations. One suspectsthat the governmental problem arises from the fact that much “scientific” opinion falls withinthe jurisdiction of government-controlled bureaucratic organizations that confuse policyimperatives with the very real need for truth about ionizing radiation.
A closely-related and greatly exaggerated fear is of “radioactive waste,” or more precisely that of used reactor fuel, that must be isolated and stored for a long time. Ted Rockwell (Rossin,2013), a pioneer of radiation study and effects, maintained that there is no problem with usedfuel as long as it is treated with reasonable care and attention – as we must also treat manyother articles we use in our ordinary lives. Rockwell’s statement succinctly captures the essenceof a complex issue. As evidenced above, effective nuclear waste management strikes a balancebetween seizing the vast opportunities for additional energy in used reactor fuel, and storing itsafely in the meantime. Further, safe storage of used thermal reactor fuel is not expected to bedifficult over the next few hundred years. In the very long term, the advent of FNR reactorspromises a definitive solution to the waste disposal question.
In recent years, a number of environmentalists have come to the realization that nuclear energy,though it must be treated with care and due caution, is the best hope for sustaining our energysupply and thereby our social stability (Stone, 2013).
The broader world outside the so-called developed economies already has made the decisionto install large capacity nuclear generating stations. It is to be expected that the demonstratedsuccess of these foreign ventures, combined with steadily increasing costs and pricesassociated with fossil fuels at home, will finally result in a change of opinion in Europe andNorth America, so that a sustained “nuclear renaissance” can arise.
It is well established that acceptance of major activities such as this one are founded on trust. In Canada, public acceptance is a rare and precious commodity, difficult to earn and easy tospend. The good news is that public trust is increasing, especially in the domain of nuclearpower plant operations. This aspect of acceptance will become more and more important asthe number of successful operating stations increases. In contrast, research and developmentdirected toward new plant concepts will gradually become less important as the industryreaches full maturity. Few energy studies recognize this reality but concentrate instead ongovernment, research, export issues and similar subjects (Public Policy Forum, 2014).Meanwhile, the utilities operating nuclear plants work steadily to build their reputation foreconomy, reliability, and safety.
Public acceptance and trust grows from clear evidence of good performance over a longperiod of time. The operating organizations are therefore the logical base from which toexpand public acceptance. In Canada, it can be seen that government backing and supportnormally follows public acceptance rather than leading it. The message, then, is to work fromthe utility operating history toward the goal of general public support for the nuclearenterprise. Development of designs and basic research should now follow what the market (i.e. the utility group) requires. Generally, this leads in the direction of evolutionary rather than revolutionary changes in design, construction, and operation.
The Long-Term Prospect
T he central idea suggested in this chapter is that uranium energy can and should be applied much more broadly in society rather than only to the production ofelectricity, as it is today. Broadening of the market for nuclear energy to the full range
of energy-intensive industries can significantly impact Canada’s ability to add value to a varietyof products while reducing the carbon footprint of energy production and use.
Any energy and industrial facility such as the one proposed here exists to serve the community,and will undoubtedly evolve with the needs and economics of the world. One thing can beassured, however. Given a similar nuclear energy infrastructure, as long as humanity existsthere will be a plentiful and reliable energy supply under control of the citizenry.
167
(Allison, 2013) Prof. Wade Allison, Oxford Magazine No. 332, (2013)
(Bersak & Kadak, 2007) Ashley Finan Bersak, Andrew C. Kadak, “Integration of Nuclear Energywith Oil Sands Projects For Reduced Greenhouse Gas Emissions and Natural Gas Consumption,”MIT White Paper, Department of Nuclear Science and Engineering, Massachusetts Institute ofTechnology, (2007)
(Birol, 2006) Fatih Birol, private communication
(CNWC, 2014) Canadian Nuclear Workers Council, http://www.cnwc-cctn.ca/bruce-power-site-history/
(Cohen, 1983) Cohen, B.L., “Breeder Reactors: A Renewable Energy Source,” Am J. Phys. 51(1)(1983)
Collier, 2007) John Collier, “The Bottom Billion,” Oxford University Press, (2007), ISBN:9780195311457
(Cuttler, 2013) Jerry M. Cuttler, http://nuclearsafety.gc.ca/eng/pdfs/Presentations/GuestSpeakers/2013/20130625-Cuttler-CNSC-Fukushima-and-beneficial-effects-low-radiation.pdf
(Engineering Institute of Canada, 2013) Third Climate Change Technology Conference,Engineering Institute of Canada, Montreal, (May 2013)
(Forsberg, 2011) Charles Forsberg, “Nuclear Beyond Base-Load Electricity, Variable Electricityand Liquid Fuels,” http://canes.mit.edu/sites/default/files/pdf/NES-115.pdf
(Government of Canada, 2002) http://www.nrcan.gc.ca/energy/uranium-nuclear/nuclear-fuel-waste-Bureau/7783
(Gurbin & Talbot, 1994) G.M. Gurbin and K.H. Talbot, “Nuclear Hydrogen - Cogeneration andthe Transitional Pathway of Sustainable Development,” 9th Pacific Basin Nuclear Conference,Sydney, Australia, (1994)
(Hammerli et al., 1978) M. Hammerli, W.H. Stevens, J.P. Butler, “Combined Electrolysis CatalyticExchange (CECE Process for Hydrogen Isotope Separation,” Chapter 8, pp 110-125, ACSSymposium Series Vol. 68 (1978) ISBN 13: 9780841204201
(Holmes et al., 2013) Geoffrey Holmes, Kevin Nold, Tylor Walsh, Kenton Heidel, Matthew A.Henderson, Jane Ritchie, Paul Klavins, Arvinder Singh, and David W. Keith
(Keith, 2008) http://www.ucalgary.ca/news/september2008/keith-carboncapture. Accessed Feb,2014
(Lightfoot et al., 2006) Lightfoot, H.D.; Mannheimer, W.; Meneley, D.A.; Pendergast, D.;Stanford, G.S. “Nuclear Fission Energy is Inexhaustible,” Climate Change TechnologyConference, Engineering Institute of Canada, Ottawa, Canada (2006)
(Meneley, 2010) D.A. Meneley, “Nuclear Energy in this Century – A Bird in the Hand,”Proceedings, 31st Annual Conference of the Canadian Nuclear Society, Montreal, QC, (2010)
(Naterer et al., 2013) G.F. Naterer et al. “Progress of international hydrogen productionnetwork for the thermochemical Cu-Cl cycle,” International Journal of Hydrogen Energy 38(2013), Elsevier Ltd., also online at <www.sciencedirect.com>
References
168
(National Energy Technology Lab, 2014),http://www.netl.doe.gov/publications/factsheets/rd/R&D089.pdf
(Plasma Torch, 2012) Plasma torch outline descriptions. <http://www.alternrg.com/wp-content/uploads/2012/11/WPC-Plasma-Torches-Eng-Email-Feb-2012.pdf>
(Public Policy Forum, 2014) Public Policy Forum, “Canada’s Nuclear Energy Sector: Where toFrom Here?” Final Report, (2014)
(Rossin, 2013) A. David Rossin, “Ted Rockwell shared knowledge to combat Fukushima fears,”Atomic Insights, August 2013, http://atomicinsights.com/ted-rockwell-shared-knowledge-to-combat-fukushima-fears/
(Sasol, 2014) Sasol Synfuels International, Johannesburg, 2196, South Africa (2014)
(Scott, 2008) David Sanborn Scott, “Smelling Land: the hydrogen defense against climatecatastrophe,” Enhanced Edition, Canadian Hydrogen Association, (2008), ISBN 978-0-9809674-0-1
(Scott, 2009) David Sanborn Scott, private communication, (2009)
(Stone, 2013) Robert Stone, Pandora’s Promise (documentary movie), (2013)http://www.imdb.com/title/tt1992193/?licb=0.42513978807255626
(Tertzakian, 2007) Peter Tertzakian, “A Thousand Barrels a Second,” McGraw Hill, (2007) ISBN 978-0-07-149260-7
(Till, 2005) Till, C.E. (2005), Plentiful Energy, The IFR Story, and Related Matters, The RepublicNews and Issues Magazine, (Jun-Sep 2005)
(Till & Chang, 2011) C.E. Till and Y.I. Chang, “Plentiful Energy,” The Story of the Integral FastReactor: The complex history of a simple reactor technology, with emphasis on its scientificbases for non-specialists, Amazon (2011)
(Wade, 2014) David C. Wade, “On the Development of Small Modular Reactors,”http://www.ne.anl.gov/research/ardt/hlmr/, Accessed February 2014
(Weart, 2012} Spencer R. Weart, “The Rise of Nuclear Fear,” Harvard University Press, (2012),ISBN 9780674052338
(Willauer et al, 2010) Heather D. Willauer, Dennis R. Hardy, Frederick W. Williams, “TheFeasibility and Current Estimated Capital Costs of Producing Jet Fuel at Sea Using CarbonDioxide and Hydrogen,” Naval Research Laboratory, Washington, DC, NRL/MRi6180··10·9300
(World Nuclear Association & EDF) “Load Following at French EDF Plants,” COWG Meeting,WNFC 26, World Nuclear Association & EDF, (2010)
(Zakaria, 2007) Fareed Zakaria, “Cathedral Thinking,” ENERGY’S FUTURE: Until we solve climatechange, says James E. Rogers, we need even the dirtiest fuel. Newsweek, August 20-27, 2007
Dr. Daniel A. Meneley is Adjunct Professor, University of Ontario Institute of Technology. Dr. Meneley served as AECL Chief Engineer for 9 years including postings in Korea and China.He established AECL’s Shanghai office and lectured extensively on CANDU. During an earlierseven-year Professorship at UNB, he served on the first IAEA-INSAG safety advisory committee.He was employed by Ontario Hydro from 1972 to 1984; first as supervising design engineer,then Manager of Safety Design and Reactor Licensing, and finally as Manager of the 350-person Nuclear Group responsible for design, safety, licensing, and waste management duringthe building of twelve CANDU stations comprising Pickering B, Bruce B, and Darlington. Beforethat time he supervised fast reactor physics research, development and design at ArgonneNational Laboratory. Dr. Meneley graduated from the University of Saskatchewan (1958) withGreat Distinction in Civil Engineering. He earned a Doctorate from the Imperial College of theUniversity of London in 1963. He is Fellow of the Canadian Academy of Engineering, Fellow ofthe Canadian and American Nuclear Societies and Member of the Canadian Society of SeniorEngineers. He has published in nineteen refereed journals, more than fifty refereed conferenceproceedings and has supervised twelve post-graduate theses.
Biography
169
ABSTRACT
Canadian families need energy to heat and cool their homes, offices,
commercial, industrial and community recreational spaces. In 2010,
the average Canadian home consumed 67% of its total energy for
space heating.1 Approximately one-half (53%)2 of energy use in the
industrial/commercial sectors is spent on space heating and cooling
(i.e. thermal energy use). In aggregate, thermal energy use, mainly to
cool and heat buildings, accounts for roughly one third of all energy
consumed in the country. Becoming more efficient in the way that this
energy is applied represents one of the highest impact ways to reduce
energy consumption, and improve efficiency in Canada. This energy
efficiency opportunity could be exploited through the application of
District Energy thermal grid (DE) solutions. DE remains largely
unexplored in Canada due to the unregulated market structure to
which DE belongs. However, there are many reasons for Canada’s
current interest in the DE thermal network, most of all, its potential
for energy efficiency gains and its ripple social and economic effects.
The large potential for community-scale DE solutions to contribute
to Canada’s aspiration of becoming an energy superpower is
largely untapped.
Nearly all the energy for space heating needs is now met by extremely
high-grade energy sources (i.e., electricity, natural gas, oil). It is not
efficient to be using a high-grade energy resource that burns at several
hundred degrees Celsius in order to maintain a room or building
between 20-23 degrees Celsius. Better to apply such energy forms for
high-grade uses, such as running an elevator or operating a stove.
In most cases, individual home owners and businesses cannot avail
themselves of local fuel resources, or waste heat resources. The
application of DE solutions can facilitate the matching of lower
quality energy sources to the job of meeting the heating and cooling
requirements of communities across Canada. This makes the building
of DE solutions an essential addition to the existing community energy
The Importance of District Energy in Building Resilient Cities
Terri ChuMary Ellen Richardson
Marlena Rogowska
10
1 The average Canadian household
consumed 106 GJ of energy for use in
the home in 2007 of which over 60%
is used for space heating and cooling.
http://oee.nrcan.gc.ca/corporate/statist
ics/neud/dpa/showTable.cfm?type=CP
§or=res&juris=ca&rn=2&page=4&
CFID=31395328&CFTOKEN=87e6577
a24457d03-1C383035-9A93-A2DC-
CF24BB81198976A6 and
http://oee.nrcan.gc.ca/publications/
statistics/sheu-summary07/space-
heating.cfm
2 Figure 4.3, “Energy Efficiency Trends
in Canada 1990-2009”, Natural
Resources Canada, December 2011
http://oee.nrcan.gc.ca/publications/sta
tistics/trends11/pdf/trends.pdf
infrastructure arsenal, and one worthy of engineers” and city planners”
attention.
To accelerate DE implementation, Canada should take the opportunity
to learn from, and catch up to, world-class DE leaders such as Denmark.
The people of Denmark have enjoyed tremendous success in achieving
energy savings through the construction of thermal grid networks
throughout the country. Denmark is a particularly interesting case study
because its weather climate conditions are comparable to much of
Canada’s climate. Many Canadian cities face some of the same energy
challenges as experienced in Copenhagen, so understanding how these
challenges were successfully overcome is instructive. In this chapter, the
Danish approach of using DE solutions to heat and cool buildings is also
examined to illustrate what is possible in our largest Canadian
metropolis, the City of Toronto, and even more broadly, the Province
of Ontario.
In jurisdictions such as Denmark, Sweden and Austria where DE
implementation has been successful, this success has been supported
and enabled by consistent political vision, legislation, regulation, and
fiscal incentives. With the exception of British Columbia, and a few
municipalities, Canada has not embraced this approach. Canada needs
to change its approach and focus more on local energy planning, by
ensuring at all levels of government, that:
1. A long-term thermal energy policy is established.
2. All levels of government adopt, or adhere to, legislation that includes
thermal and electrical energy efficiency as key considerations in land
use planning.
3. Supportive fiscal legislation and tools are put in place to help
municipalities establish a DE network.
4. Supportive local building policies are in place to enable DE within
communities.
Political leadership is needed to apply these tools and invest in Canada’s
vision of becoming a sustainable energy superpower.
170
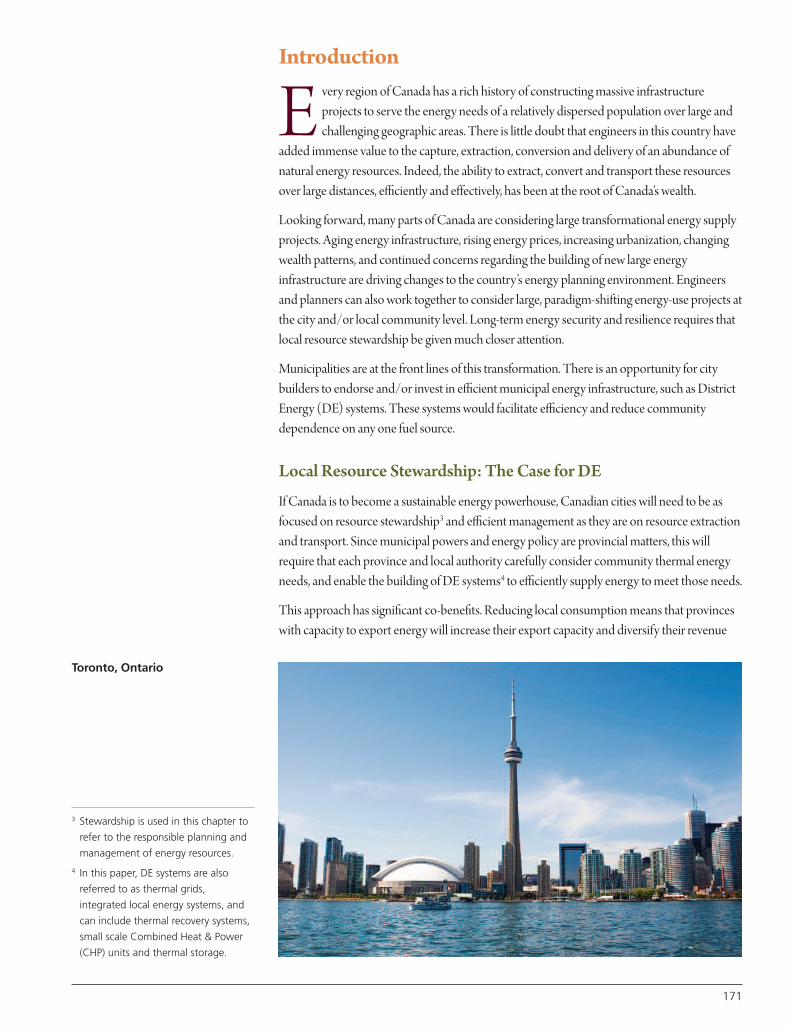
Introduction
E very region of Canada has a rich history of constructing massive infrastructureprojects to serve the energy needs of a relatively dispersed population over large andchallenging geographic areas. There is little doubt that engineers in this country have
added immense value to the capture, extraction, conversion and delivery of an abundance ofnatural energy resources. Indeed, the ability to extract, convert and transport these resourcesover large distances, efficiently and effectively, has been at the root of Canada’s wealth.
Looking forward, many parts of Canada are considering large transformational energy supplyprojects. Aging energy infrastructure, rising energy prices, increasing urbanization, changingwealth patterns, and continued concerns regarding the building of new large energyinfrastructure are driving changes to the country’s energy planning environment. Engineersand planners can also work together to consider large, paradigm-shifting energy-use projects atthe city and/or local community level. Long-term energy security and resilience requires thatlocal resource stewardship be given much closer attention.
Municipalities are at the front lines of this transformation. There is an opportunity for citybuilders to endorse and/or invest in efficient municipal energy infrastructure, such as DistrictEnergy (DE) systems. These systems would facilitate efficiency and reduce communitydependence on any one fuel source.
Local Resource Stewardship: The Case for DE
If Canada is to become a sustainable energy powerhouse, Canadian cities will need to be asfocused on resource stewardship3 and efficient management as they are on resource extractionand transport. Since municipal powers and energy policy are provincial matters, this willrequire that each province and local authority carefully consider community thermal energyneeds, and enable the building of DE systems4 to efficiently supply energy to meet those needs.
This approach has significant co-benefits. Reducing local consumption means that provinceswith capacity to export energy will increase their export capacity and diversify their revenue
171
3 Stewardship is used in this chapter to
refer to the responsible planning and
management of energy resources.
4 In this paper, DE systems are also
referred to as thermal grids,
integrated local energy systems, and
can include thermal recovery systems,
small scale Combined Heat & Power
(CHP) units and thermal storage.
Toronto, Ontario
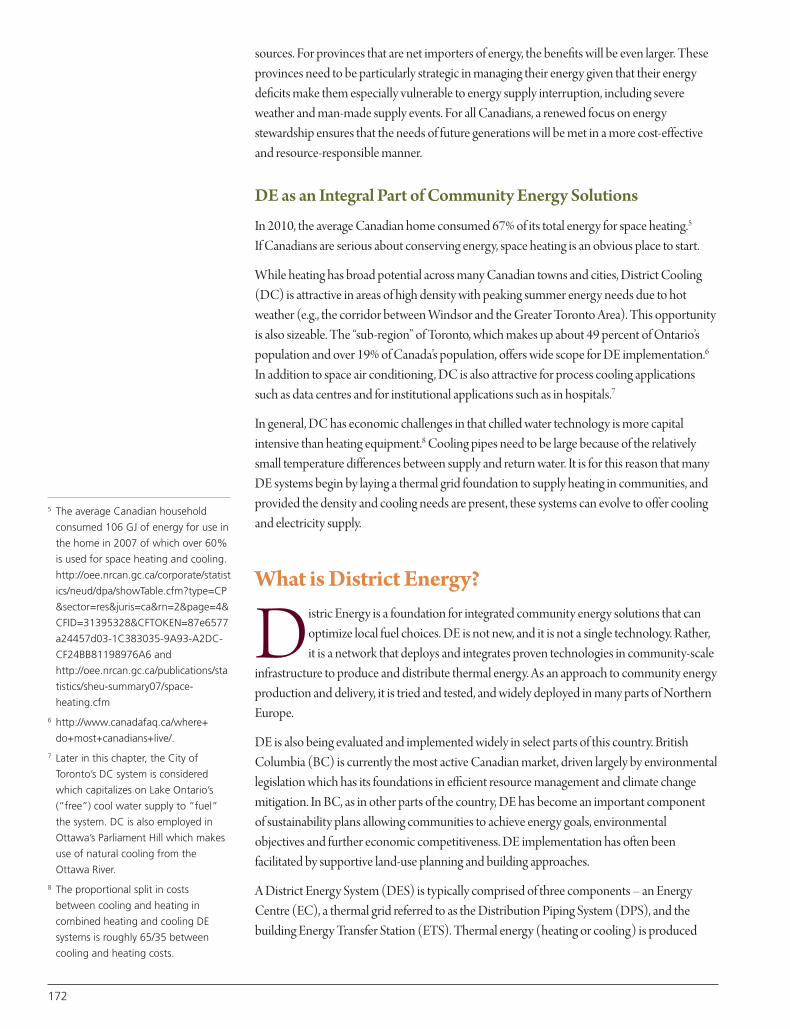
172
sources. For provinces that are net importers of energy, the benefits will be even larger. Theseprovinces need to be particularly strategic in managing their energy given that their energydeficits make them especially vulnerable to energy supply interruption, including severeweather and man-made supply events. For all Canadians, a renewed focus on energystewardship ensures that the needs of future generations will be met in a more cost-effectiveand resource-responsible manner.
DE as an Integral Part of Community Energy Solutions
In 2010, the average Canadian home consumed 67% of its total energy for space heating.5
If Canadians are serious about conserving energy, space heating is an obvious place to start.
While heating has broad potential across many Canadian towns and cities, District Cooling(DC) is attractive in areas of high density with peaking summer energy needs due to hotweather (e.g., the corridor between Windsor and the Greater Toronto Area). This opportunityis also sizeable. The “sub-region” of Toronto, which makes up about 49 percent of Ontario’spopulation and over 19% of Canada’s population, offers wide scope for DE implementation.6
In addition to space air conditioning, DC is also attractive for process cooling applicationssuch as data centres and for institutional applications such as in hospitals.7
In general, DC has economic challenges in that chilled water technology is more capitalintensive than heating equipment.8 Cooling pipes need to be large because of the relativelysmall temperature differences between supply and return water. It is for this reason that manyDE systems begin by laying a thermal grid foundation to supply heating in communities, andprovided the density and cooling needs are present, these systems can evolve to offer coolingand electricity supply.
What is District Energy?
Distric Energy is a foundation for integrated community energy solutions that canoptimize local fuel choices. DE is not new, and it is not a single technology. Rather,it is a network that deploys and integrates proven technologies in community-scale
infrastructure to produce and distribute thermal energy. As an approach to community energyproduction and delivery, it is tried and tested, and widely deployed in many parts of NorthernEurope.
DE is also being evaluated and implemented widely in select parts of this country. BritishColumbia (BC) is currently the most active Canadian market, driven largely by environmentallegislation which has its foundations in efficient resource management and climate changemitigation. In BC, as in other parts of the country, DE has become an important component of sustainability plans allowing communities to achieve energy goals, environmentalobjectives and further economic competitiveness. DE implementation has often beenfacilitated by supportive land-use planning and building approaches.
A District Energy System (DES) is typically comprised of three components – an EnergyCentre (EC), a thermal grid referred to as the Distribution Piping System (DPS), and thebuilding Energy Transfer Station (ETS). Thermal energy (heating or cooling) is produced
5 The average Canadian household
consumed 106 GJ of energy for use in
the home in 2007 of which over 60%
is used for space heating and cooling.
http://oee.nrcan.gc.ca/corporate/statist
ics/neud/dpa/showTable.cfm?type=CP
§or=res&juris=ca&rn=2&page=4&
CFID=31395328&CFTOKEN=87e6577
a24457d03-1C383035-9A93-A2DC-
CF24BB81198976A6 and
http://oee.nrcan.gc.ca/publications/sta
tistics/sheu-summary07/space-
heating.cfm
6 http://www.canadafaq.ca/where+
do+most+canadians+live/.
7 Later in this chapter, the City of
Toronto’s DC system is considered
which capitalizes on Lake Ontario’s
(“free”) cool water supply to “fuel”
the system. DC is also employed in
Ottawa’s Parliament Hill which makes
use of natural cooling from the
Ottawa River.
8 The proportional split in costs
between cooling and heating in
combined heating and cooling DE
systems is roughly 65/35 between
cooling and heating costs.

at the central plant, the energy is then carried down through the DPS (usually steam, hot water, or chilled water), and exchanged at the building’s ETS interface. DE systems have thecapability to deliver heating and cooling to customers and to capture waste heat from buildings(i.e. data centres, treatment plants, etc.) and use that heat to produce needed thermal energyvia a closed loop system.
Energy Centres
The EC is the source of thermal energy in a DES. Given that this thermal energy is transmittedto end users using water (or steam in legacy systems) as a medium, multiple fuel feedstockmaterials can be used to generate the thermal energy. These feedstocks can take many forms,including natural gas, biomass, solar, deep lake water, geothermal energy, thermal storagefacilities and waste heat from adjacent industrial or commercial processes.
Having the thermal grid in place provides scale and scope, and allows communities to heatand cool their buildings by any fuel source, on a mass scale. A built-out thermal grid network,such as that which exists in Denmark and throughout many other European countries, hasenabled the wide-scale use of renewables, in particular low-temperature district heating (e.g.solar heating, geothermal), which would not be possible with individual heating systems. TheEC grid fortifies a community’s energy security, and can reduce GHG emissions and fossil fuelconsumption when combined with lower emitting feedstocks, and/or by substitutingtechnologies over time as alternative fuels become more abundant, or as technology advances.Due to the design of a DES, rather than retrofitting thousands of homes, only a small numberof centralized plants require updates to achieve widespread community benefits.
A DES also reduces communities' dependence on any one fuel, and allows them to respond toenergy price and supply fluctuations over time. This is precisely what happened in NorthernEurope after the oil shock of the 1970s, when countries such as Denmark, Sweden, Finlandand Austria invested heavily in DE infrastructure.
Although the vast majority of thermal heating in Canada still comes from traditional fossil fuelsources, Canadians have experimented with renewable sources of energy in the DE systemsthat are in place.
The Drake’s Landing Solar Community is a master planned community in Okotoks, Albertathat uses solar as its primary source of heating for the DES. Ninety percent of space heatingneeds at Drake’s Landing are met by solar thermal power. Relative to a “conventional approach”to development which relies on individual heating technology, and fossil fuels, Drake’s Ladingsolar thermal community achieves a reduction of 5 tonnes of GHG per home every year.9
Other Canadian communities, like Revelstoke and Prince George, British Columbia, haveturned sawmills into thermal energy sources. Waste from the mill is burned for electricity, and the thermal energy is recovered as “waste heat” which is used to heat buildings in thecommunities. In both of these cases, the EC is on the sawmill site and thermal energy is pipedto the community. Using a similar line of thinking, Vancouver and Halifax have sewage heatrecovery systems that take waste heat (ultimately a “free” fuel resource) from the city sewagesystem. Ouje-Bougoumou, Quebec uses forest biomass; and Charlottetown, PEI usesmunicipal solid waste and biomass to fuel their DE systems.
173
9 http://www.dlsc.ca/
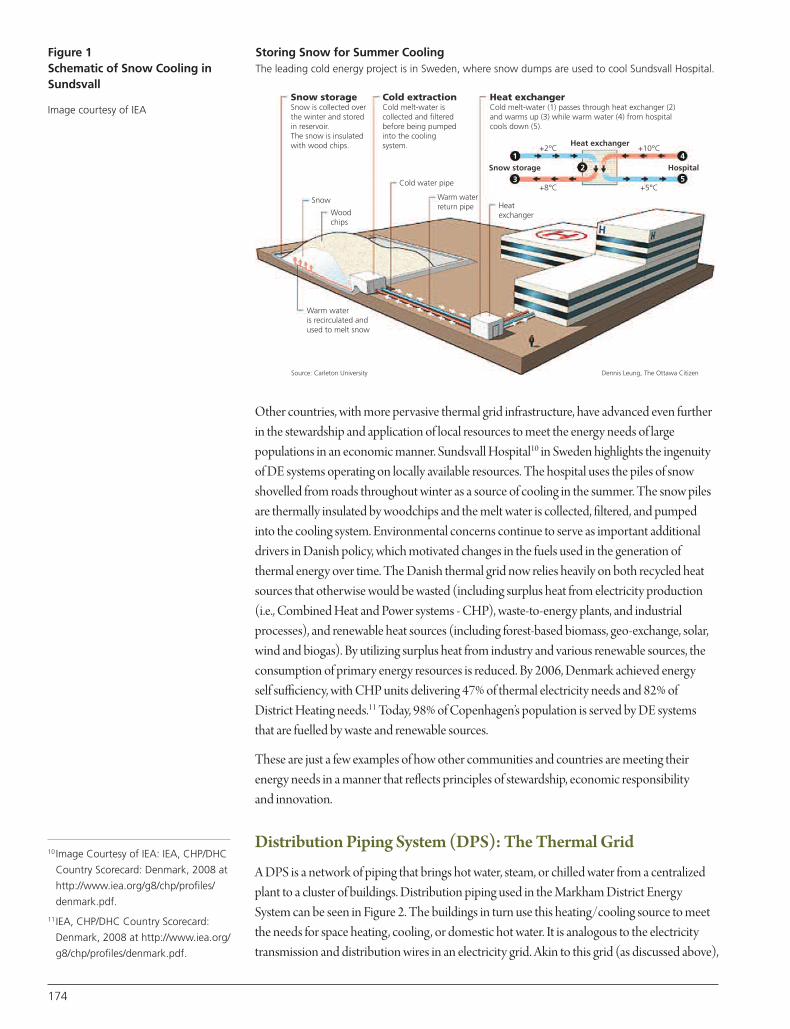
174
Other countries, with more pervasive thermal grid infrastructure, have advanced even furtherin the stewardship and application of local resources to meet the energy needs of largepopulations in an economic manner. Sundsvall Hospital10 in Sweden highlights the ingenuityof DE systems operating on locally available resources. The hospital uses the piles of snowshovelled from roads throughout winter as a source of cooling in the summer. The snow pilesare thermally insulated by woodchips and the melt water is collected, filtered, and pumpedinto the cooling system. Environmental concerns continue to serve as important additionaldrivers in Danish policy, which motivated changes in the fuels used in the generation ofthermal energy over time. The Danish thermal grid now relies heavily on both recycled heatsources that otherwise would be wasted (including surplus heat from electricity production(i.e., Combined Heat and Power systems - CHP), waste-to-energy plants, and industrialprocesses), and renewable heat sources (including forest-based biomass, geo-exchange, solar,wind and biogas). By utilizing surplus heat from industry and various renewable sources, theconsumption of primary energy resources is reduced. By 2006, Denmark achieved energy self sufficiency, with CHP units delivering 47% of thermal electricity needs and 82% of District Heating needs.11 Today, 98% of Copenhagen’s population is served by DE systems that are fuelled by waste and renewable sources.
These are just a few examples of how other communities and countries are meeting theirenergy needs in a manner that reflects principles of stewardship, economic responsibility and innovation.
Distribution Piping System (DPS): The Thermal Grid
A DPS is a network of piping that brings hot water, steam, or chilled water from a centralizedplant to a cluster of buildings. Distribution piping used in the Markham District EnergySystem can be seen in Figure 2. The buildings in turn use this heating/cooling source to meetthe needs for space heating, cooling, or domestic hot water. It is analogous to the electricitytransmission and distribution wires in an electricity grid. Akin to this grid (as discussed above),
Snow storageSnow is collected over the winter and stored in reservoir.The snow is insulated with wood chips.
Cold extractionCold melt-water is collected and filtered before being pumped into the cooling system.
Heat exchangerCold melt-water (1) passes through heat exchanger (2) and warms up (3) while warm water (4) from hospital cools down (5).
Snow
Cold water pipe
Warm waterreturn pipe
+2°C
+8°C
+10°C
+5°C
Heatexchanger
Heat exchanger
12
4
53
Snow storage Hospital
Woodchips
Warm wateris recirculated andused to melt snow
Source: Carleton University Dennis Leung, The Ottawa Citizen
Storing Snow for Summer CoolingThe leading cold energy project is in Sweden, where snow dumps are used to cool Sundsvall Hospital.
Figure 1Schematic of Snow Cooling inSundsvall
Image courtesy of IEA
10Image Courtesy of IEA: IEA, CHP/DHC
Country Scorecard: Denmark, 2008 at
http://www.iea.org/g8/chp/profiles/
denmark.pdf.
11IEA, CHP/DHC Country Scorecard:
Denmark, 2008 at http://www.iea.org/
g8/chp/profiles/denmark.pdf.
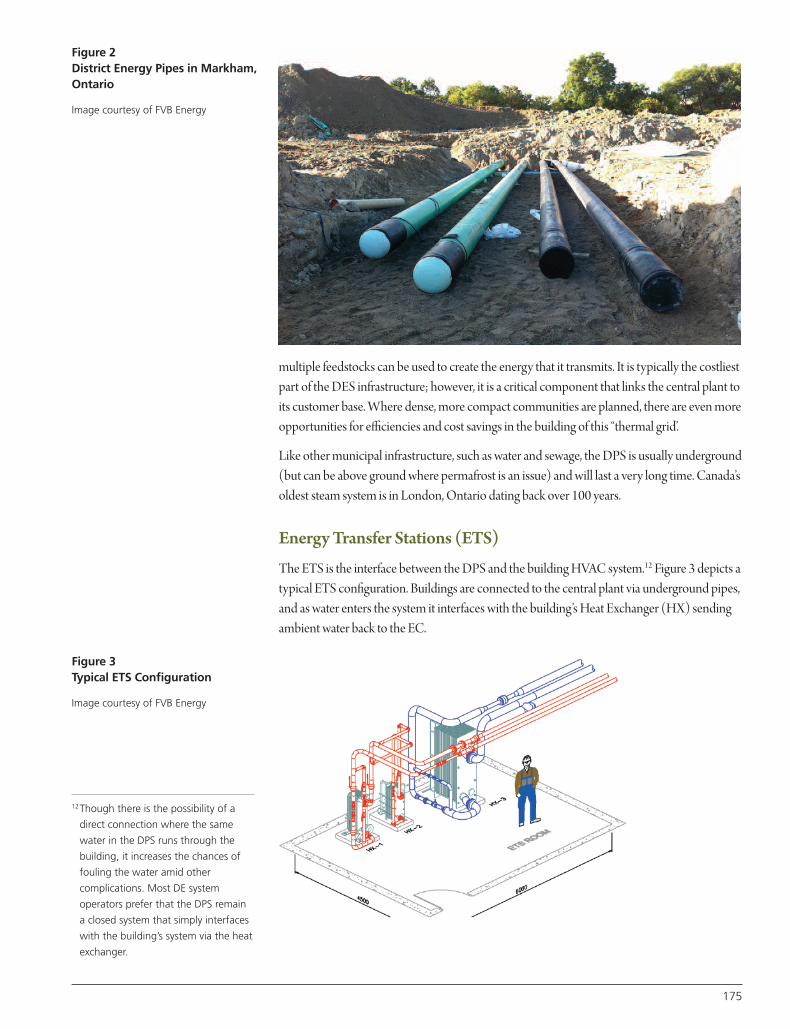
multiple feedstocks can be used to create the energy that it transmits. It is typically the costliestpart of the DES infrastructure; however, it is a critical component that links the central plant toits customer base. Where dense, more compact communities are planned, there are even moreopportunities for efficiencies and cost savings in the building of this “thermal grid’.
Like other municipal infrastructure, such as water and sewage, the DPS is usually underground(but can be above ground where permafrost is an issue) and will last a very long time. Canada’soldest steam system is in London, Ontario dating back over 100 years.
Energy Transfer Stations (ETS)
The ETS is the interface between the DPS and the building HVAC system.12 Figure 3 depicts atypical ETS configuration. Buildings are connected to the central plant via underground pipes,and as water enters the system it interfaces with the building’s Heat Exchanger (HX) sendingambient water back to the EC.
175
Figure 2District Energy Pipes in Markham,Ontario
Image courtesy of FVB Energy
Figure 3Typical ETS Configuration
Image courtesy of FVB Energy
12Though there is the possibility of a
direct connection where the same
water in the DPS runs through the
building, it increases the chances of
fouling the water amid other
complications. Most DE system
operators prefer that the DPS remain
a closed system that simply interfaces
with the building’s system via the heat
exchanger.
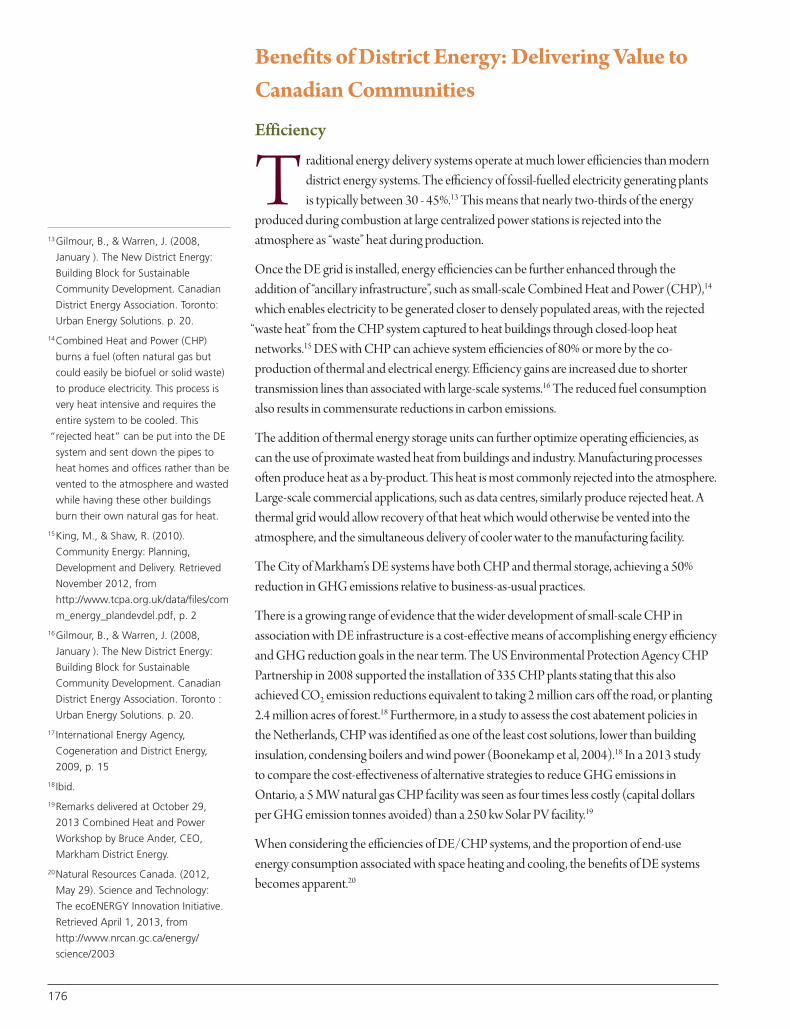
176
Benefits of District Energy: Delivering Value toCanadian Communities
Efficiency
T raditional energy delivery systems operate at much lower efficiencies than moderndistrict energy systems. The efficiency of fossil-fuelled electricity generating plants is typically between 30 - 45%.13 This means that nearly two-thirds of the energy
produced during combustion at large centralized power stations is rejected into theatmosphere as “waste” heat during production.
Once the DE grid is installed, energy efficiencies can be further enhanced through theaddition of “ancillary infrastructure”, such as small-scale Combined Heat and Power (CHP),14
which enables electricity to be generated closer to densely populated areas, with the rejected“waste heat” from the CHP system captured to heat buildings through closed-loop heatnetworks.15 DES with CHP can achieve system efficiencies of 80% or more by the co-production of thermal and electrical energy. Efficiency gains are increased due to shortertransmission lines than associated with large-scale systems.16 The reduced fuel consumptionalso results in commensurate reductions in carbon emissions.
The addition of thermal energy storage units can further optimize operating efficiencies, ascan the use of proximate wasted heat from buildings and industry. Manufacturing processesoften produce heat as a by-product. This heat is most commonly rejected into the atmosphere.Large-scale commercial applications, such as data centres, similarly produce rejected heat. Athermal grid would allow recovery of that heat which would otherwise be vented into theatmosphere, and the simultaneous delivery of cooler water to the manufacturing facility.
The City of Markham’s DE systems have both CHP and thermal storage, achieving a 50%reduction in GHG emissions relative to business-as-usual practices.
There is a growing range of evidence that the wider development of small-scale CHP inassociation with DE infrastructure is a cost-effective means of accomplishing energy efficiencyand GHG reduction goals in the near term. The US Environmental Protection Agency CHPPartnership in 2008 supported the installation of 335 CHP plants stating that this alsoachieved CO2 emission reductions equivalent to taking 2 million cars off the road, or planting2.4 million acres of forest.18 Furthermore, in a study to assess the cost abatement policies in the Netherlands, CHP was identified as one of the least cost solutions, lower than buildinginsulation, condensing boilers and wind power (Boonekamp et al, 2004).18 In a 2013 study to compare the cost-effectiveness of alternative strategies to reduce GHG emissions inOntario, a 5 MW natural gas CHP facility was seen as four times less costly (capital dollars per GHG emission tonnes avoided) than a 250 kw Solar PV facility.19
When considering the efficiencies of DE/CHP systems, and the proportion of end-use energy consumption associated with space heating and cooling, the benefits of DE systemsbecomes apparent.20
13Gilmour, B., & Warren, J. (2008,
January ). The New District Energy:
Building Block for Sustainable
Community Development. Canadian
District Energy Association. Toronto:
Urban Energy Solutions. p. 20.
14Combined Heat and Power (CHP)
burns a fuel (often natural gas but
could easily be biofuel or solid waste)
to produce electricity. This process is
very heat intensive and requires the
entire system to be cooled. This
“rejected heat” can be put into the DE
system and sent down the pipes to
heat homes and offices rather than be
vented to the atmosphere and wasted
while having these other buildings
burn their own natural gas for heat.
15King, M., & Shaw, R. (2010).
Community Energy: Planning,
Development and Delivery. Retrieved
November 2012, from
http://www.tcpa.org.uk/data/files/com
m_energy_plandevdel.pdf, p. 2
16Gilmour, B., & Warren, J. (2008,
January ). The New District Energy:
Building Block for Sustainable
Community Development. Canadian
District Energy Association. Toronto :
Urban Energy Solutions. p. 20.
17International Energy Agency,
Cogeneration and District Energy,
2009, p. 15
18Ibid.
19Remarks delivered at October 29,
2013 Combined Heat and Power
Workshop by Bruce Ander, CEO,
Markham District Energy.
20Natural Resources Canada. (2012,
May 29). Science and Technology:
The ecoENERGY Innovation Initiative.
Retrieved April 1, 2013, from
http://www.nrcan.gc.ca/energy/
science/2003
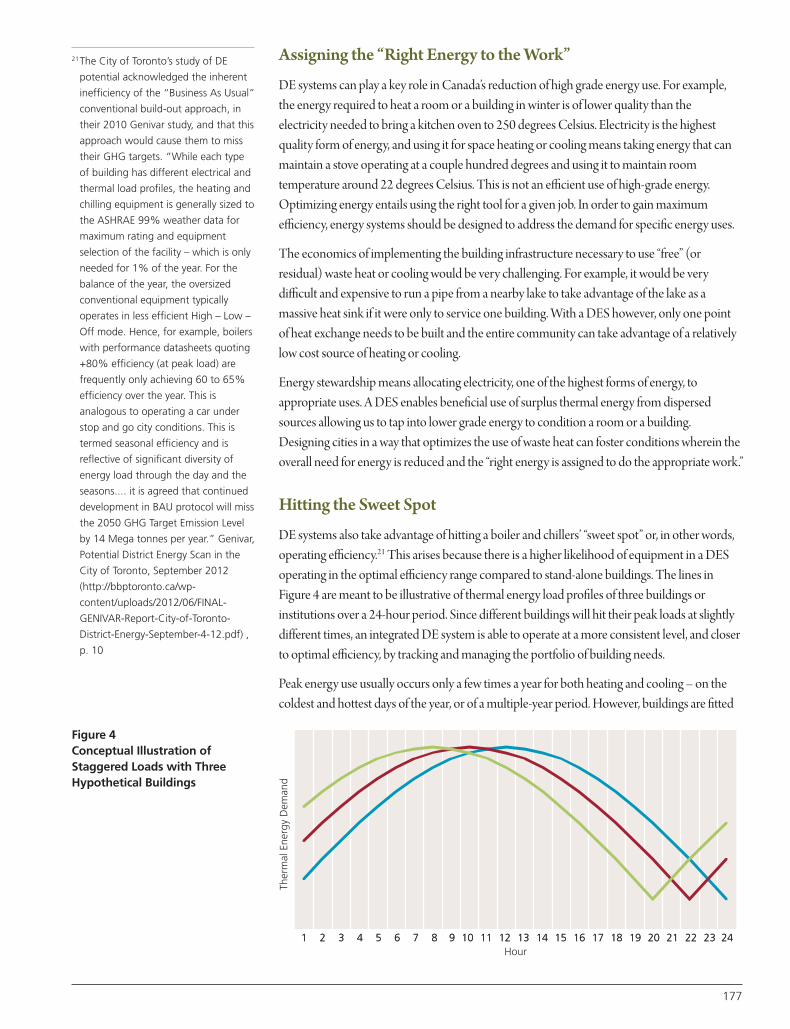
Assigning the “Right Energy to the Work”
DE systems can play a key role in Canada’s reduction of high grade energy use. For example,the energy required to heat a room or a building in winter is of lower quality than theelectricity needed to bring a kitchen oven to 250 degrees Celsius. Electricity is the highestquality form of energy, and using it for space heating or cooling means taking energy that canmaintain a stove operating at a couple hundred degrees and using it to maintain roomtemperature around 22 degrees Celsius. This is not an efficient use of high-grade energy.Optimizing energy entails using the right tool for a given job. In order to gain maximumefficiency, energy systems should be designed to address the demand for specific energy uses.
The economics of implementing the building infrastructure necessary to use “free” (orresidual) waste heat or cooling would be very challenging. For example, it would be verydifficult and expensive to run a pipe from a nearby lake to take advantage of the lake as amassive heat sink if it were only to service one building. With a DES however, only one pointof heat exchange needs to be built and the entire community can take advantage of a relativelylow cost source of heating or cooling.
Energy stewardship means allocating electricity, one of the highest forms of energy, toappropriate uses. A DES enables beneficial use of surplus thermal energy from dispersedsources allowing us to tap into lower grade energy to condition a room or a building.Designing cities in a way that optimizes the use of waste heat can foster conditions wherein theoverall need for energy is reduced and the “right energy is assigned to do the appropriate work.”
Hitting the Sweet Spot
DE systems also take advantage of hitting a boiler and chillers’ “sweet spot” or, in other words,operating efficiency.21 This arises because there is a higher likelihood of equipment in a DESoperating in the optimal efficiency range compared to stand-alone buildings. The lines inFigure 4 are meant to be illustrative of thermal energy load profiles of three buildings orinstitutions over a 24-hour period. Since different buildings will hit their peak loads at slightlydifferent times, an integrated DE system is able to operate at a more consistent level, and closerto optimal efficiency, by tracking and managing the portfolio of building needs.
Peak energy use usually occurs only a few times a year for both heating and cooling – on thecoldest and hottest days of the year, or of a multiple-year period. However, buildings are fitted
Figure 4Conceptual Illustration ofStaggered Loads with ThreeHypothetical Buildings
1 2 3 4 5 6 7 8 9 10 11 12 13 14 15 16 17 18 19 20 21 22 23 241 2 3 4 5 6 7 8 9 10 11 12Hour
Ther
mal
Ene
rgy
Dem
and
13 14 15 16 17 18 19 20 21 22 23 24
177
21The City of Toronto’s study of DE
potential acknowledged the inherent
inefficiency of the “Business As Usual”
conventional build-out approach, in
their 2010 Genivar study, and that this
approach would cause them to miss
their GHG targets. “While each type
of building has different electrical and
thermal load profiles, the heating and
chilling equipment is generally sized to
the ASHRAE 99% weather data for
maximum rating and equipment
selection of the facility – which is only
needed for 1% of the year. For the
balance of the year, the oversized
conventional equipment typically
operates in less efficient High – Low –
Off mode. Hence, for example, boilers
with performance datasheets quoting
+80% efficiency (at peak load) are
frequently only achieving 60 to 65%
efficiency over the year. This is
analogous to operating a car under
stop and go city conditions. This is
termed seasonal efficiency and is
reflective of significant diversity of
energy load through the day and the
seasons.... it is agreed that continued
development in BAU protocol will miss
the 2050 GHG Target Emission Level
by 14 Mega tonnes per year.” Genivar,
Potential District Energy Scan in the
City of Toronto, September 2012
(http://bbptoronto.ca/wp-
content/uploads/2012/06/FINAL-
GENIVAR-Report-City-of-Toronto-
District-Energy-September-4-12.pdf) ,
p. 10
178
with systems that operate year-round tomeet these peak needs. The advantageof the DES is that the boilers andchillers are aggregated in one place. Inpart-load conditions, the energy centremight only run two out of five boilers,but will run both very efficiently.Moreover, aggregating customer loadsacross a community can serve to “levelout” the demand curve by combiningdifferent customers with different peakand off-peak demand periods. Thiscontributes to further optimization ofequipment operation.
Resilience and Security
A thermal grid, with small-scale CHP,also increases the reliability of theelectricity generating system. Giventrends in urban population growth, it islikely that future electricity supplyfacilities will need to be built to
maintain electricity supply reliability (particularly at peak load times), and operate in targetedurban and electricity system-constrained areas.
DE systems can be built so that they can be “isolated” from the main electricity grid —continuing to provide thermal and electrical services to critical loads.
The experience of some New Yorkers during the 2012 Hurricane Sandy illustrates theimmediate benefit that a DES brings to provide backup supply security, islanding capacity andsuch important services as black-start capability. During the hurricane, CHP/DE systemsplayed an important role in providing local resilience in the face of worsening weather and gridoutages caused by climate and man-made supply crises. This mitigated communities”vulnerability to the failure of grids that transmit power over long distances.
In late December 2013, the Toronto region experienced a record ice storm. Hundreds ofthousands were without power for days and, in some cases, more than a week. Several deathshave been attributed to this ice storm as people desperate for heating brought outdoor devicesinside the home, causing carbon monoxide poisoning.22 The DES with CHP facility operatingin Markham, Ontario had the ability to continue to provide power and heat to criticalcustomers throughout this event (15 centres, and approximately 5 million square feet).23
Fuel Flexibility
DE systems offer the flexibility of fuel choice and upgrades over time, allowing Canadians tomore easily modify the type of heating fuel used for space heating. Although the economics ofrenewable fuels may be questionable at the moment, given the low price of natural gas, future
New York: Where the Lights Stayed On
Unprecedented in its size and affecting 21 states, the total estimated cost of the impact of
Sandy’s wrath was over $70 billion. During Hurricane Sandy, it took days – and sometimes
weeks – for utility workers to restore electric services across large swaths of New England and
the Mid-Atlantic region, including New York City. Indeed, 8.5 million customers lost power
during Sandy. Understanding where the lights stayed on during Sandy might provide valuable
lessons to city leaders looking to mitigate the effects of increasingly frequent severe weather
events. For example, in Co-op City, a 40 MW CHP/DE system continued to provide lights for
more than 60,000 residents during and after Sandy’s gale force winds and storm surge. And it
wasn’t just Co-Op City residents. For four days, the CHP system provided the 290 units in this
Manhattan residential complex with all its heating, water, and electrical needs, including
elevators, until the grid was back up. Though typically home to about 720 residents, the
building nearly doubled its population after Sandy as those without power sought refuge
among friends and family who lived there. Contrast that with New York City’s public housing
facilities, which are often well-suited for CHP, where residents went up to two weeks without
electricity and over 15,000 of them were still dealing with no heat or hot water well after that.
In the same way, a small number of other facilities – including hospitals, universities, and public
service facilities – kept their power, heat, and critical equipment running.
Source: Drawn from American Council for an Energy Efficient Economy, December 6, 2012
“How CHP Stepped Up When the Power Went Out During Hurricane Sandy,” By Anna Chittum,
Senior Policy Analyst
http://www.aceee.org/blog/2012/12/how-chp-stepped-when-power-went-out-d; and “Lessons
from where the Lights stayed on During Sandy,” http://www.forbes.com/sites/williampentland/
2012/10/31/where-the-lights-stayed-on-during-hurricane-sandy/
22http://www.cbc.ca/news/canada/ice-
storm-makes-christmas-a-dark-day-for-
tens-of-thousands-1.2476164
23Conversation with Bruce Ander,
President and CEO, Markham District
Energy. The Markham DES capability
was available, but never used, as the
City did not officially declare a state of
emergency during the 2013 Ice Storm.
prices are unpredictable. DE systems enable whole communities to switch from theirindividual natural gas furnaces to whatever heating source is available with minimal retrofits.
GHG Reduction
Energy plays a critical role in the quest to adapt, mitigate and reverse the impacts of climatechange at a community level. According to a study released by the United Nations HumanSettlements Programme (2010), 75% of commercial energy is consumed in urban and semi-urban areas. In addition, up to 60% of GHG emissions, which cause global climatechange, originate from cities.24 Nandi and Bose estimate that 70% of the global population willlive in cities by the year 2050, further amplifying the strain placed on municipalities to provideenergy services.25 Interestingly, the International Energy Agency estimates that the proportionof global energy consumed in cities is greater than the proportion of the world’s populationliving in cities – thus signalling that intervention is needed to reverse this trend.26
Considering the extent to which cities consume energy,27 and the rate at which urbanization is taking place, reducing energy consumption in cities will be of paramount importance tocombating climate change The way cities are planned and local energy systems are built hasenormous potential to affect the efficiency with which energy is used, the type of localconvertible fuels used (from proximate water or snow, to urban biomass and municipal solidwaste), and the resulting quantity of GHG emissions.
A DES allows for optimized local fuel choices and increases the efficiency with which thosefuels are converted to useful energy. Many DE systems in both Europe and Canada make useof local biomass materials (e.g., forest-based wood, urban-based forest materials, cleanconstruction waste, etc.) to generate heat for their communities. In Europe, the use ofmunicipal solid waste to generate heat is commonplace. Sophisticated systems, with advancedemission-mitigation technologies, are viewed as a sensible “closed system” approach tosustainability.
Economic Benefits
Communities can reap economic benefits from DES implementation, thereby providing theopportunity for local investment, jobs, and creation of local fuel resource supply chaindevelopment (e.g., urban forest biomass or clean construction wood waste).
Research undertaken in 201128 by Natural Resources Canada into the quantification of socio-economic benefits associated with DE investment in several Canadian communities indicatedthat there are positive economic multiplier effects for the dollars invested in terms of jobs andcommercial activity. Using the District Energy Economic Model (DEEM),29 the City ofMarkham was one of four systems studied. The DEEM results for Markham, althoughpreliminary, indicate positive net economic benefits from local energy infrastructureinvestment, with every dollar invested by Markham in their DES generating economic impactsequal to $1.37 (i.e., GDP, tax base, wages). This does not include any return on equity of theDE investment itself.30 A recent study of the City of Toronto also documented the potentialeconomic benefits of district energy to that city.31
179
24El Sioufi, M. (2010). Climate Changeand Sustainable Cities: Major ChallengesFacing Cities and Urban Settlements inthe Coming Decades, p. 5. UN-HABITAT,United Nations Human SettlementsProgramme. International Federation ofSurveyors, p. 5
25Nandi, S. & Bose, R.K (2010). TheImperative of Efficient Energy Use inCities: Analytical Approaches and GoodPractices. In Bose, R.K. (Eds.), EnergyEfficient Cities: Assessment Tools andBenchmarking Practices(pp. 1-20).Retrieved fromhttp://www.esmap.org/node/271
26 International Energy Agency. (2008).World Energy Outlook 2008. RetrievedFebruary 7, 2013, from http://www.worldenergyoutlook.org/media/weowebsite/2008-1994/weo2008.pdf
27 In 2006, the global primary energy use incities was 7,900 Mtoe (million tonnes oilequivalent), or 67% of global demand;however, global city energy use isprojected to grow by 1.9% per year, andmake up 73% of global demand by 2030(International Energy Agency, 2008, pp.182, 184). Therefore, urban areas willcontinue to increase in importance asstrategies for mitigating climate changeare developed. Reducing urban energydemand and implementing localembedded energy solutions includingdistrict energy and distributed generationtechnologies must be a component ofthese strategies if climate change goalsare to be realized. This positions our citiesat the crux of the climate challenge wheresolutions to critical energy issues will havemost significant impacts. Municipalitiesgenerally cannot adequately meet thesecomplex challenges on their own.
28This pilot research is not yet publiclyavailable.
29Bruce Ander, President and CEO,Markham District Energy, Presentation toQUEST Conference, November 12, 2013
30Bruce Ander, President and CEO,Markham District Energy, Presentation toQUEST Conference, November 12, 2013.
31Beck, T. et al. (2012). The Power toGrow: The Economic and Fiscal Benefitsof Urban Development Facilitated byLocal Generation, District Energy, andConservation in an ElectricallyConstrained Scenario. University ofToronto Masters paper, prepared for theCity of Toronto, Energy Efficiency Officeand Department of EconomicDevelopment & Culture. Toronto.
180
Learning from DE Leaders
Denmark & Copenhagen
I n just a few decades, Denmark has become a world leader in District Energy solutions. Itssuccess story is based on a package of policies that evolved after the first Heat Supply Lawwas introduced in 1979, followed by a ban on electrical heating in buildings (1988), and
national financial incentives to ensure the ongoing economic viability of CHP/DE.
The strategy was adopted as a result of the oil crisis that Denmark faced during the 1970s, at atime when more than 90% of Danish energy was met by oil imports. The energy crises of 1973and 1979 resulted in long-term increases in energy prices and a heightened awareness forenhanced fuel flexibility. Emphasis was placed on having more secure energy supply and moreefficient generation and use of energy, making CHP/DE a natural, competitive choice.32
The 1979 law required municipalities to carry out studies on their future needs for heating,and on the potential for district heating (DH) in their jurisdictions. It also allowed for thezoning of DH networks to replace individual oil boilers. Crucially, the expanded provision ofDH was supported by a new power for local authorities to require households to connect tothe networks.33 The law created a clear strategic goal, and relied on strong local and municipalparticipation. Sharing responsibility and involving local authorities in this national planningprocess has been an effective way of creating an efficient heating network in Denmark.
A new planning system launched in 1990 mandated local authorities to convert DE providersto CHP providers. DE and CHP played a critical role in reducing Copenhagen’s carbonfootprint and securing fuel supply, primarily using local energy resources as feedstock. Powerplants run as CHP stations where the steam is extracted from a turbine to heat water for largescale DH networks. Fiscal measures related to specific fuels have resulted in 35% of the CHPplant fuelled by surplus heat from waste incineration, and the remaining production of districtheating is based on geothermal energy and fuels such as wood pellets, straw, straw pellets,natural gas, oil and coal.
Environmental concerns have been addressed by the ability to switch feedstock to loweremission fuels, and the addition of CHP.
More recently, the Danes have further benefitted by the synergistic opportunity of a holisticenergy approach—one that realizes the value integrating their thermal planning more broadlywith electricity planning. This has arisen because electricity system changes developed inisolation have resulted in a significant and increasing amount of intermittent electricityproduced by wind. Rather than exporting surplus base load generation at a loss, at times whenthere is surplus (and non-dispatchable) renewable electricity available, the Danes are seekingintegrative solutions to utilize the surplus electricity within the country by using the surplus topower heat pumps in DE systems using geo-exchange technology. The Danish investment in ageographically significant thermal grid has become a crucial part of the energy infrastructure,enabling utilization of fluctuating renewable energy sources.34
Denmark is a leader in DE/CHP, and it is important to learn from those who lead. Theexperience of Copenhagen illustrates the benefits to communities from utilizing DE/CHP to
32IEA, Cogeneration and District Energy,
2009, pp 18-19
33Danish Energy Authority, Heat Supply
in Denmark Who What Where and
Why, 2005,
http://dbdh.dk/images/uploads/pdf-
diverse/varmeforsyning%20i%20DK
%20p%C3%A5%20engelsk.pdf
34Closer to home, this is not dissimilar
to the Markham Ontario DE system,
which is seen by the municipality as
being their most strategic energy asset,
facilitating their economic goals as
well as meeting their energy and
environmental goals. More detail on
the Markham experience is contained
below.
support local economic development, energy efficiency, energy security and resilience tounforeseen events.
Energy strategy is as much a city planning issue as a technical issue, and communities havebeen vital players in achieving greater scales of energy sustainability and increased economicvalue.
A Case Study: Applying the Danish Approach in the Province of Ontario
It is interesting to consider what would happen if Ontario followed the same path as other DEleaders and invested in building DE systems to salvage waste heat.
In Denmark, electricity generation facilities cannot be built unless a recipient for wastethermal energy is first identified for the waste heat. Closer to home, the City of Markham hasbeen a leader in the deployment of DE in two growth nodes. As a result, since 2000, MarkhamDistrict Energy has invested in four small-scale CHP units totalling 15 MW, and uses rejectedheat to supply the thermal energy needs of its customers.
The province of Ontario could insert this requirement into energy policy, particularly withthermal generation stations that are built in proximity to communities. If Ontario were torecover all the “waste” heat generated by gas fired generators and use it for space heatingpurposes, the province could reduce its natural gas consumption by 4.6 billion cubic metresannually.35 This is enough natural gas to heat 1.5 million Canadian homes36 and is equivalentto reducing emissions by 864 Mega tonnes of CO2 annually.37
As illustrated in Figure 5,38 Toronto is growing at an unprecedented rate and is leading in the construction of the most high-rise buildings in all of North America for 2012. The city iswelcoming 178 high-rise construction projects, thereby further increasing the density of thecity’s built form and introducing a need to heat, cool and power a new stock of buildings.
Energy Challenges in the City of Toronto
Toronto, with a population of 2,615,060 (or 7.8% of Canada’s population),39 is already home to Canada’s largest DES. The Enwave system currently keeps 200 downtown buildings airconditioned via a world-famous deep-lake water cooling system. As impressive as this systemis, however, there has been remarkably little new investment in DE infrastructure over the lastseveral decades despite Toronto facing growing energy challenges.
For Toronto, most of the energy supply is produced outside of the city, with approximately$4.5 billion spent on energy each year.40 At the same time, the downtown core of Toronto isexperiencing the highest growth rate in condominium development in North America. Withindustry moving out and condominiums moving in, population and energy intensification arepredicted to continue. On average, two condo proposals add the equivalent of three 8,000-person Ontario towns within a six block area.41
While demand for all types of energy is expected to increase in the city, the electrical capacityand reliability is of particular concern, especially in the downtown core which is supplied withelectricity by just two transmission lines and one small central power plant.
181
35Electricity production data provided by
the Ontario Independent Electricity
System Operator. 28,750,000 MWH
gas fired generation. 60% efficiency
for combined cycle.
36Assuming that, on average, Canadians
use 92 GJ of heating energy per
household. http://www.statcan.gc.ca/
pub/11-526-s/2010001/part-partie1-
eng.htm
37Using emissions factor for Ontario
http://www.ec.gc.ca/ges-ghg/
default.asp?lang=En&n=AC2B7641-1
38Chart adapted from: Baxter, Jim,
Director Environment and Energy
Division, City of Toronto. “Energy
Crunch in the City.” QUEST
Conference Presentation. November
13, 2013.
39Census Canada. (2012). 2011 Census:
Population and Dwelling Counts.
Retrieved from: http://www.toronto.
ca/demographics/pdf/2011-census-
backgrounder.pdf pp. 1
40Genivar, Potential District Energy Scan
in the City of Toronto, September
2012 (http://bbptoronto.ca/wp-
content/uploads/2012/06/FINAL-
GENIVAR-Report-City-of-Toronto-Distri
ct-Energy-September-4-12.pdf) , p. 3.
41Baxter, Jim, Director Environment and
Energy Division, City of Toronto.
“Energy Crunch in the City.” QUEST
Conference Presentation. November
13, 2013.
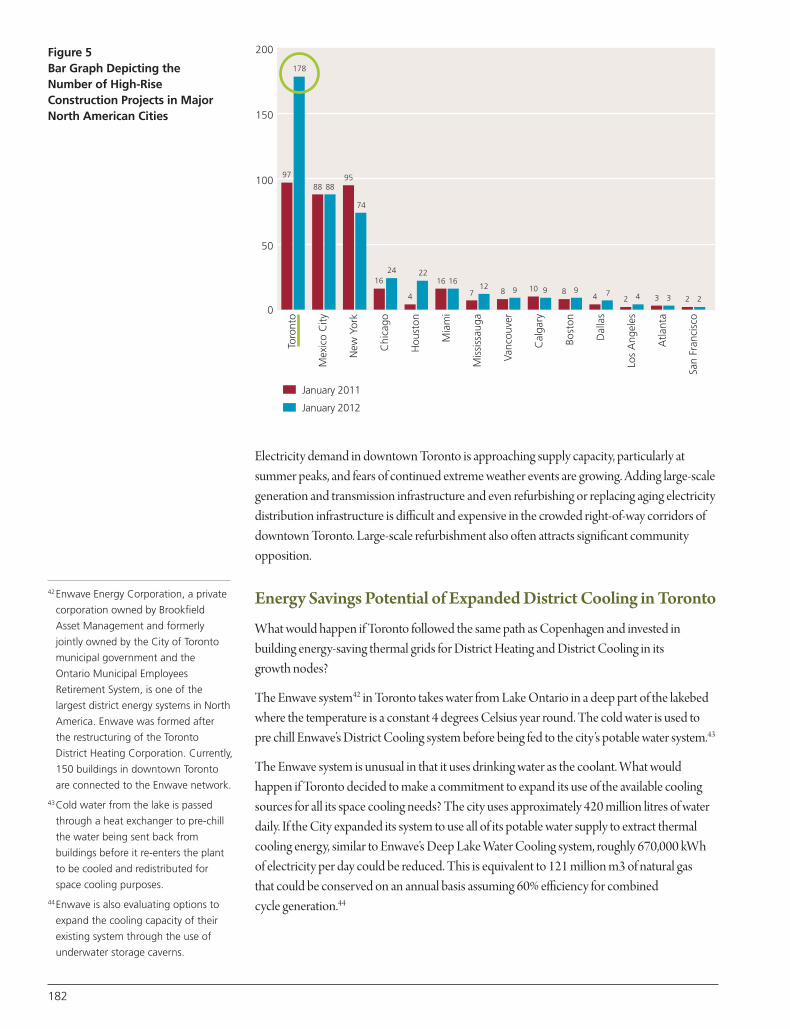
182
Electricity demand in downtown Toronto is approaching supply capacity, particularly atsummer peaks, and fears of continued extreme weather events are growing. Adding large-scalegeneration and transmission infrastructure and even refurbishing or replacing aging electricitydistribution infrastructure is difficult and expensive in the crowded right-of-way corridors ofdowntown Toronto. Large-scale refurbishment also often attracts significant communityopposition.
Energy Savings Potential of Expanded District Cooling in Toronto
What would happen if Toronto followed the same path as Copenhagen and invested inbuilding energy-saving thermal grids for District Heating and District Cooling in its growth nodes?
The Enwave system42 in Toronto takes water from Lake Ontario in a deep part of the lakebedwhere the temperature is a constant 4 degrees Celsius year round. The cold water is used topre chill Enwave’s District Cooling system before being fed to the city’s potable water system.43
The Enwave system is unusual in that it uses drinking water as the coolant. What wouldhappen if Toronto decided to make a commitment to expand its use of the available coolingsources for all its space cooling needs? The city uses approximately 420 million litres of waterdaily. If the City expanded its system to use all of its potable water supply to extract thermalcooling energy, similar to Enwave’s Deep Lake Water Cooling system, roughly 670,000 kWhof electricity per day could be reduced. This is equivalent to 121 million m3 of natural gas that could be conserved on an annual basis assuming 60% efficiency for combined cycle generation.44
0
50
100
150
200
97
178
88 8895
74
1624
4 4 4 3 3
2216 16
7 72 2 2
128 9 8 910 9
Toro
nto
Mex
ico
City
New
Yor
k
Chi
cago
Hou
ston
Mia
mi
Mis
siss
auga
Vanc
ouve
r
Cal
gary
Bost
on
Dal
las
Los
Ang
eles
Atla
nta
San
Fran
cisc
o
January 2011
January 2012
Figure 5Bar Graph Depicting the Number of High-RiseConstruction Projects in MajorNorth American Cities
42Enwave Energy Corporation, a private
corporation owned by Brookfield
Asset Management and formerly
jointly owned by the City of Toronto
municipal government and the
Ontario Municipal Employees
Retirement System, is one of the
largest district energy systems in North
America. Enwave was formed after
the restructuring of the Toronto
District Heating Corporation. Currently,
150 buildings in downtown Toronto
are connected to the Enwave network.
43Cold water from the lake is passed
through a heat exchanger to pre-chill
the water being sent back from
buildings before it re-enters the plant
to be cooled and redistributed for
space cooling purposes.
44Enwave is also evaluating options to
expand the cooling capacity of their
existing system through the use of
underwater storage caverns.
Introduce a Long Term Thermal Energy Policy
Given the benefits of DE systems, it is important for Canadians to consider how DEimplementation could be accelerated.
In jurisdictions where DE supplies a significant portion of the total heating and cooling needs,energy policy has explicitly included both thermal and electrical energy considerations andalso included specific references to DE, with CHP. Public policy drivers have included: energysecurity; environmental issues; increased energy efficiency; and local economic development.Further, public policy goals are supported by enabling legislation, regulation and fiscalincentives to accelerate DE implementation. Left to itself, the market does not adequatelyrecognize the broader public policy goals (i.e., energy prices do not adequately reflect long-term goals or externalities related to carbon).
There are many parallels between the public policy goals espoused in these other jurisdictionsand those of most Canadian provinces with respect to environmental, economic and energygoals (e.g., Ontario’s Green Energy and Economy Act, 2009).45 Adding thermal policies inCanadian energy, environmental and land use planning legislation will allow provinces toaccelerate the accomplishment of these goals.
Including Thermal and Electrical Energy as a Key Elements inLand-Use Planning Requirements
Land-use planning decisions guide the way cities look and grow. Most Canadian provinces lag behind leading jurisdictions in important land-use planning legislation. The political andpractical decisions centre on shaping how and where our communities will grow, and have adirect impact on the social, economic and environmental performance of communities. Land-use planning is also considered a tool to curb sprawl as well as to support rational stewardshipof resources by directing where residential, commercial, institutional, industrial, recreationaland other infrastructure and essential services are located.
Municipalities are required to consider many types of essential infrastructure including water,transit, sewage, and recreational facilities, to ensure adequacy of supply to maximize thewelfare of their citizens. Some provincial planning legislation considers certain kinds ofelectricity generation facilities. By adding thermal energy use and energy production in land-use legislation, land-use planning can also optimize the efficient use of local energy resources,including waste heat, in a way that increases energy efficiency, and reduces the draw onimported energy resources. Considering that thermal energy accounts for a significant portionof community energy needs, the lack of explicit thermal elements in land-use policies emergesas a startling gap that should be redressed through provincial legislation.
Supportive Fiscal Policy Regime
An investment in the Distribution Piping System (DPS) is capital-intensive with up-frontexpenditures yielding benefits over time as communities” thermal energy demands grow.Investment in thermal infrastructure is particularly challenging given the relative low price of competing alternatives, delivered through existing electricity and natural gas gridinfrastructure. Unlike traditional energy delivery systems such as electrical systems with a
183
45In May 2009, the Ontario government
passed the Green Energy and
Economy Act (“GEA”), which further
accelerated the implementation of
renewable energy (i.e. electricity) and
introduced the Feed-in Tariff program
for renewable electricity generation. It
was intended to expand renewable
energy projects, promote a “green
economy,” and encourage all
Ontarians to use energy efficiently.
The GEA is best known for creating a
number of feed-in tariff rates for
different types of energy sources, and
was focused exclusively on matters
related to electricity. Prior to the
introduction of the GEA, Ontario had
enacted a number of different
programs focused on electricity,
introducing renewable energy or
promoting conservation, including the
Energy Conservation Leadership Act
and the Energy Efficiency Act.
184
regulated rate base and recovery of incremental expenditures, there is no regulatory constructto support the up-front capital cost to transition communities to DE.
Many of the benefits of building DE grids are difficult to monetize for the municipal host (e.g., energy security, operating efficiency, economic development), and for many privatesector investors, these benefits are irrelevant. Community resilience is becoming an increasingfocus with every extreme weather event. Despite the benefit of greater local energy resilience,municipalities find it hard to fund capital to achieve the benefit. The private sector will notinvest unless compensated for the incremental investment. Absent a carbon pricing regime,there is less financial motivation to migrate to non-conventional fuel sources. Without assuredeconomic returns, DE projects will struggle to attract willing investors capable of bringing newDE projects forward. It will be difficult to attract large-scale investors, such as municipalities,utilities and pension funds capable of bearing the substantive up-front capital expenditures. Iffinancing cannot be coordinated, developments will default to more conventional forms ofenergy delivery systems where long-term energy contracts and/or regulatory regimes providerevenue certainty, making financing easier.
It is for these reasons that public sector intervention has supported the growth of the DEindustry in every jurisdiction in which it has grown. Fiscal incentives have taken the form oflow interest loans, tax incentives, grants, and direct public investment.
A supportive fiscal framework will assist investors to overcome the fiscal challenge they face inbuilding new thermal infrastructure. In the same way that Canadian electricity policy has beensupported with appropriate fiscal policies, and executed through contracts and programs,DE/CHP systems need fiscal incentives or economic regulation. They are akin to otheressential infrastructure.
Supportive Municipal Policies to Enable DE within Communities
Municipalities not only have the jurisdiction to drive a DE project, they also contribute to thelongevity and success of a project. They have the authority to introduce progressive policyrelated to urban form, define growth nodes, determine areas and levels of density, and makedevelopmental decisions with opportunities to blend residential, commercial, institutional,industrial or cultural uses through zoning bylaws.46 All of these policy elements contribute tocreating communities with the critical mass to support DE. Municipalities are responsible forlocal infrastructure, often own local utility companies, and are in a position to invest in DEprojects, either directly or through a public/private partnership. Municipalities can facilitateDE through ensuring rights-of-way connections. They can also define DE areas whereconnection to an existing DH scheme is obligatory.47 Municipalities have a key role incommunity consultation regarding energy options, communicating and positioning DE as a “green energy option” to key stakeholders. Municipalities can also influence developers toconnect new builds to district energy or to incorporate community energy solutions throughpolicy tools, moral suasion or by mandating connections.
For these reasons, provinces should support municipal planning tools to accelerate DEdevelopment. These planning tools have been used in many jurisdictions to great effect,positioning DE investment as a key part of essential municipal infrastructure, including:
46Compass Resource Management.
(2010, July). Ontario Power Authority:
District Energy Research Report.
Retrieved October 2012, from
http://www.powerauthority.on.ca/sites
/default/files/news/16925_CRM_OPA_
District_Energy_Research_Report_15
July10.pdf.
47Such bylaws are in place in North
Vancouver, Vancouver, Surrey and
Richmond, British Columbia.
• Mandatory (or rewarded) connection
• DE-ready infrastructure
• Zoning bylaws
• Site plan control
• Use of local improvement charges to support grid investment
• Height and density bonusing and /or
• Expedited development permitting for DE connected buildings.
Conclusion
L ike their European counterparts, Canadian communities and municipalitiesincreasingly understand that local sustainable energy development will contribute totheir economic, environmental and social objectives.
Conventional land-use planning approaches tackle energy at the end of the planning process,with energy considerations presently appearing secondary to building or community design.This approach misses the opportunity for increased efficiencies, the use of local energy fuels,and the application of other energy stewardship concepts. As such, the typical planningapproach also fails to acknowledge the many tertiary benefits of including DE in city planningthat are outlined above. This reactive approach promotes business-as-usual practices thatresult in conventional energy systems that lock communities into long-term, less adaptableenergy scenarios.
Unfortunately, in many provincial jurisdictions, energy policies have focused primarily onelectricity. Additionally, despite discussions of “smart grids,” energy investment haspredominately concentrated on large central electricity plants located hundreds of kilometresaway from the communities they serve. This is not only an expensive approach, it condemnsmany provinces to the “status quo” approach for decades, one that is geared towards a “one-size-fits-all” model that is often out-of-sync with the needs of individual communities.
Community energy systems, including DE and small-scale CHP, are more responsive tocommunity needs. These elements clearly affect communities and have the potential offacilitating greater local social acceptance by virtue of what they can contribute to local goals.
In jurisdictions such as Denmark, Sweden and Austria where DE implementation is successful,this success has been supported and enabled by consistent political vision, legislation,regulation, and fiscal incentives. With the exception of British Columbia, and a fewmunicipalities, Canada has not embraced this approach. Canada needs to change its approachand focus more on local energy planning, by ensuring, at all levels of government, that:
1. A long-term thermal energy policy is established.
2. All levels of government adopt, or adhere to, legislation that includes thermal and electricalenergy as key considerations in land use planning.
3. Supportive fiscal legislation and tools are put in place to help municipalities establish a DEnetwork.
4. Supportive local building policies are in place to enable DE within communities.
185
186
Political leadership is needed to apply these tools and invest in Canada’s vision of becoming asustainable energy superpower.
It is time to focus on the full range of the energy cycle, and consider how energy is produced,delivered and used in order to support Canada’s ambition to be a sustainable energysuperpower. A tried and tested way to meet this ambition is to start with community-levelDistrict Energy Systems.
Terri Chu: Terri is project analyst at FVB energy. She has a particular interest in how the interactionof municipal infrastructure can be optimized to reduce overall energy consumption. Terri holds abachelor’s degree in aerospace engineering and a master’s in civil engineering with a specializationin sustainable urban systems. Terri is the lead author of “How District Energy Systems can be usedto reduce Infrastructure Costs and Environmental Burdens.”
Mary Ellen Richardson: Mary Ellen’s career in the oil, natural gas and electricity industries spans30 years. Over the last 10 years, Mary Ellen has held executive positions with the Canadian DistrictEnergy Association (President), the Ontario Power Authority (Vice President Corporate Affairs) andthe Association of Major Power Consumers in Ontario (President). Each of these roles entailed abroad geographic and sector reach, involving frequent interaction with private, public, academicand industry representatives from across Canada and Europe. More recently, Mary Ellen hascontributed as a lead author in the Mowat Centre’s report on energy planning. Mary Ellen hasserved on the management board of the Ontario Centre of Excellence in Energy, as a boardmember for EcoCanada, on Ontario Province’s 2003 Electricity Conservation and Supply Task Force,on the Executive of the Stakeholders” Alliance for Competition and Customer Choice, on theElectric Power Engineering Education Consortium, and as a member of Hydro One’s CustomerAdvisory Board. She has also been a member of both the City of Guelph’s Mayor Advisory TaskForce and the City of Vancouver Community Energy Advisory Committee. Mary Ellen hascompleted the Institute of Corporate Directors program at the University of Toronto.
Marlena Rogowska: Marlena Rogowska is an urban and regional planner with experience inboth the public and non-profit sectors. Her experience in the public sector is focused on land-useplanning and policy development, and climate adaptation strategies whereas her experience in thenon-profit sector provides her with a unique lens of domestic and international approaches to citybuilding and resource management. She has an interest in research exploring opportunities forenergy efficiency gains with a focus on community energy planning and other embedded energysolutions. Marlena holds a Master of Planning degree in Urban Development from RyersonUniversity, and an Honours Bachelor of Arts in Environmental Studies and Political Science from theUniversity of Toronto.
Bruce Ander is President & CEO of Markham District Energy (MDE). With over 30 years inOntario’s energy sector, Mr. Ander is currently Vice Chair of the International District EnergyAssociation (IDEA); an industry association with over 2000 members in 26 countries. Otherindustry affiliations have included his role as Chair of the Canadian Energy Efficiency Alliance andAPPrO (Association of Power Producers of Ontario). Mr. Ander is a Professional Engineer with adegree from the University of Western Ontario and holds a Masters in Business Administrationfrom the University of Toronto.
Richard Damecour, P.Eng., MBA, Chief Executive Officer – FVB Energy Inc., is the InternationalDistrict Energy Association (IDEA)’s Chair of the Canadian Forum. He is the Chief Executive Officerof FVB Energy Inc., a consulting company specializing in district energy and CHP businessdevelopment, engineering and marketing, with offices in Toronto, Edmonton and Vancouver. FVBalso has offices in Minneapolis and Seattle in the US and various cities in Sweden. He has over 30years of experience in the energy industry, including 12 years in oil and gas, and for the past 20years has helped to develop at least 25 new district energy systems that have been successfullybrought into service in North America and the Middle East. Richard is a registered professionalengineer in the Province of Ontario and has an MBA from the University of Alberta.
Biography
Chapter Reviewers


180 Elgin Street, Suite 1402, Ottawa, Ontario K2P 2K3
Tel.: 613-235-9056 • Email: [email protected]
Designed and Produced by Grafiks Marketing & Communications • www.grafiks.com