Embed Size (px)
Citation preview
Solano College
2010 Accreditation Employee Survey
and Student Opinion Survey
Summary Report
Board of Trustees
Denis Honeychurch, J.D., President
A. Marie Young, Vice President
Sarah E. Chapman, Trustee
James M. Claffey, Trustee
Pam Keith, Trustee
Phil McCaffrey, Trustee
Rosemary Thurston, Trustee
John M. Glidden, Student Trustee
Tom Henry, Special Trustee
President/Superintendent Jowel C. Laguerre, Ph.D.
Research Study Conducted by: Research and Planning Office
Christopher J. Myers, Ph.D., Interim Director
Donna Vessels, Research Technician
February 2011

[Intentionally left blank]

ii
Solano College 2010 Accreditation Employee Survey and Student Opinion Survey Summary Report
Executive Summary
In fall 2010, the Solano Community College (SCC) Accreditation Steering Committee surveyed employees
and a sample of students. The purposes of the surveys were to assess the respondents’ perceptions of the
degree to which the college is fulfilling the accreditation standards of the Accrediting Commission for
Community and Junior Colleges (ACCJC), and the students’ opinions of their college experience. The
results are intended to support the Accreditation Self Study, as well as provide information that can be used
for assessing and improving Solano College’s programs and services.
The Accreditation Employee Survey (AES) was completed by 172 employees, who represent
approximately 39% of permanent employees and 6% of part-time faculty. The typical respondent is a
full-time faculty member working at the Fairfield Campus. She also is a White, non-disabled woman who
has worked at Solano College for more than 10 years.
The majority of AES respondents indicated that they were satisfied with how most aspects of Solano
College are functioning. Overall, part-time faculty were most positive and classified/confidential staff were
least positive.
The Student Opinion Survey (SOS) was completed by 1,301 students (approximately 11% of enrolled
students), who are generally representative of the student body. The typical respondent is a 19 year old,
White woman who attends Solano College full-time and is planning to transfer to a four-year college or
university. She also works part-time, does not receive financial aid, and commutes 11-20 miles to the
College.
SOS respondents were generally satisfied with most programs and services. However, they rated some
areas significantly lower than did respondents from the national norm group of other two-year colleges.
Areas of Strength
Survey respondents identified the following strengths and areas in which Solano College is performing
well:
1. Faculty, classified/confidential staff, and managers are dedicated and support student success.
2. Employees are familiar with the Mission Statement, Strategic Goals and Objectives, and the
SLO/SAO process. They have also participated in program review and in developing SLOs/SAOs
and three-year plans.
3. Employees perceive the College to be moving in a positive direction.
4. Students perceive the College’s quality of education and campus climate to be good or excellent.
5. Students have a high level of satisfaction with student health services, day care services, computer
services, the library/learning resource center, veterans services, tutorial services, recreational
programs and services, social activities, and cultural programs and activities.

iii
Areas Needing Improvement
Survey respondents were less satisfied or expressed a need for improvement in the following areas:
1. While employees perceive the campus climate to be improving, a greater percentage rated the
campus climate for employees as fair or poor than rated it very good or excellent. They believe that
there is a need to enhance employee relations.
2. Employees most often disagreed that: the budget reflects the College’s goals and priorities; they
have access to sufficient professional development activities; leaders support empowerment,
innovation, and excellence; and needed data are analyzed, interpreted, and available for planning.
3. Less than one-half of students have an understanding of SLOs.
4. While students are generally satisfied with online courses, they are less satisfied with them than
they are with face-to-face classes.
5. Students are most dissatisfied with: the availability of courses at the times they want to take them;
financial aid processes and information; academic advising, course planning, and the availability of
counselors; and opportunities for student employment.
Recommendations as to how Solano College might address areas needing improvement are also offered for
consideration.
i
Acknowledgements
I would like to acknowledge the contributions of the many persons who provided the guidance, resources,
and support to make this research study possible. Through their contributions, Solano College will be able
to better understand employee and student perceptions about the degree to which the college is fulfilling the
accreditation standards and meeting student needs.
First, I would like to acknowledge the Solano College Accreditation Steering Committee, co-chaired by
Jeff Lamb and Tracy Schneider, and the Accreditation Standard Committee Chairs, who helped to design
and implement this major research project. Other members of the committee and chairs include: Philip
Andreini, Adrienne Cary, Joseph Conrad, George Daugavietis, Erin Duane, Jim Ennis, Erin Farmer, Ruth
Fuller, Les Hubbard, Betsy Julian, Jerry Kea, Corrine Kirkbride, Jowel Laguerre, Shirley Lewis, Yulian
Ligioso, Art Lopez, Debbie Luttrell-Williams, Will Martinelli, Mary Mazzocco, Bob Myers, Arturo Reyes,
Genele Rhoads, Leslie Rota, Teresa Ryland, Cynthia Simon, Roy Stutzman, Zafer Sun, Galen Tom, Karen
Ulrich, Erin Vines, and Thom Watkins.
Second, my appreciation goes to the faculty who administered the Student Opinion Survey and to the
students who completed questionnaires, as well as to the employees who completed the Accreditation
Employee Survey. Lastly, I would like to express my gratitude to Donna Vessels, Research Technician,
whose excellent work provided support for this study and report.
Chris Myers
Project Director

ii
[Intentionally left blank]

iii
Table of Contents
Executive Summary
Acknowledgements .................................................................................................................... i
Introduction ................................................................................................................................1
Method ........................................................................................................................................1
Survey Results .............................................................................................................................1
Respondent Characteristics .....................................................................................................2 Employees ................................................................................................................................... 2
Students ......................................................................................................................................... 2
Reasons for Attending SCC ....................................................................................................3
Campus Climate and Quality of Education ............................................................................4
Student Learning Outcomes ....................................................................................................7
Labs .........................................................................................................................................9
Library Services ....................................................................................................................10
Distance Education ...............................................................................................................12
Student Use of Services ........................................................................................................16
Other Student Opinion Survey Results .................................................................................16
Significant Subgroup Differences .........................................................................................16
Areas of Strength ....................................................................................................................19 Employees ................................................................................................................................... 19
Students ....................................................................................................................................... 20
Areas Needing Improvement ................................................................................................20 Employees .................................................................................................................................... 20
Students ........................................................................................................................................ 21
Summary and Conclusions ......................................................................................................22
Areas of Strength ..................................................................................................................23
Areas Needing Improvement ................................................................................................23
Recommendations .....................................................................................................................23
Appendices .................................................................................................................................25 Appendix A. Student Opinion Survey Results: Satisfaction with College Services by Campus
Appendix B. Student Opinion Survey Results: Satisfaction with the College Environment by
Campus
Appendix C. Accreditation Employee Survey Results: Solano College’s Greatest Strengths
Appendix D. Accreditation Employee Survey Results: How Solano College Can Improve
Appendix E. Accreditation Employee Survey Results: Other Comments
Appendix F. Student Opinion Survey Results: Student Comments
Appendix G. Accreditation Employee Survey
Appendix H. Student Opinion Survey
Appendix I. Student Opinion Survey: Section V-Additional Questions

iv
[Intentionally left blank]

1
Solano College
2010 Accreditation Employee Survey and
Student Opinion Survey Summary Report
In fall 2010, the Solano Community College (SCC) Accreditation Steering Committee surveyed employees
and a sample of students. The purposes of the surveys were to assess the respondents’ perceptions of the
degree to which the college is fulfilling the accreditation standards of the Accrediting Commission for
Community and Junior Colleges (ACCJC), and the students’ opinions of their college experience. The
results are intended to support the Accreditation Self Study, as well as provide information that can be used
for assessing and improving Solano College’s programs and services.
Method
The Research and Planning Office developed the research procedures in collaboration with the
Accreditation Steering Committee. An online employee survey questionnaire was drafted, piloted with a
few employees, and finalized after receiving input from the Steering Committee (see Appendix G). An
email message was sent to all permanent employees and part-time faculty, inviting them to complete the
survey online. Follow-up email messages were sent to the employees, reminding them to complete the
questionnaire.
Students were surveyed with the Student Opinion Survey (2-Year College Form) (SOS), which is a
nationally normed instrument developed by ACT. In addition to the standard questions, students were asked
20 additional questions developed by the Accreditation Steering Committee (see Appendices H and I).
Faculty from a stratified random sample of approximately 70 fall 2010 course sections were asked to
administer the SOS questionnaire to their students during a class session. Courses taught at the Vacaville
and Vallejo Centers were over sampled to assure adequate representation. A sample of students taking
online courses was also invited to complete the online version of the SOS.
Response frequencies and average responses are reported for questions having quantitative ratings.
Average responses among subgroups were also statistically compared using analysis of variance (p ≤ .001).
Subgroups were considered to be significantly different from one another if the subgroup averages were (1)
at least 0.25 point different (on a 4-point or 5-point scale) and (2) were statistically different from one
another. Responses to open-ended questions were categorized and summarized.
Survey Results
This report summarizes the key findings of the Accreditation Employee Survey (AES) and Student Opinion
Survey results. It supplements more detailed and additional AES results broken down by employee group,
which may be found at:
http://www.solano.edu/institutional_research/Assets/1011/Employee%20Summary%20Total%20Revised
%20110910.pdf and
http://www.solano.edu/institutional_research/Assets/1011/Employee%20Summary%20by%20Employee
%20Group%20Revised%20110910.pdf. Similarly, more detailed SOS results may be found at:
http://www.solano.edu/institutional_research/Assets/1011/Solano%20CC%20SOS2yr%20Summ%20101
0.pdf and
http://www.solano.edu/institutional_research/Assets/1011/Solano%20CC%20SOS2yr%20Graphics%201
010.pdf. Student Opinion Survey results for Solano College are also compared to a national norm group of
112 other two-year community and technical colleges.
2
Respondent Characteristics
Demographics and other characteristics of employee and student survey respondents are summarized
below.
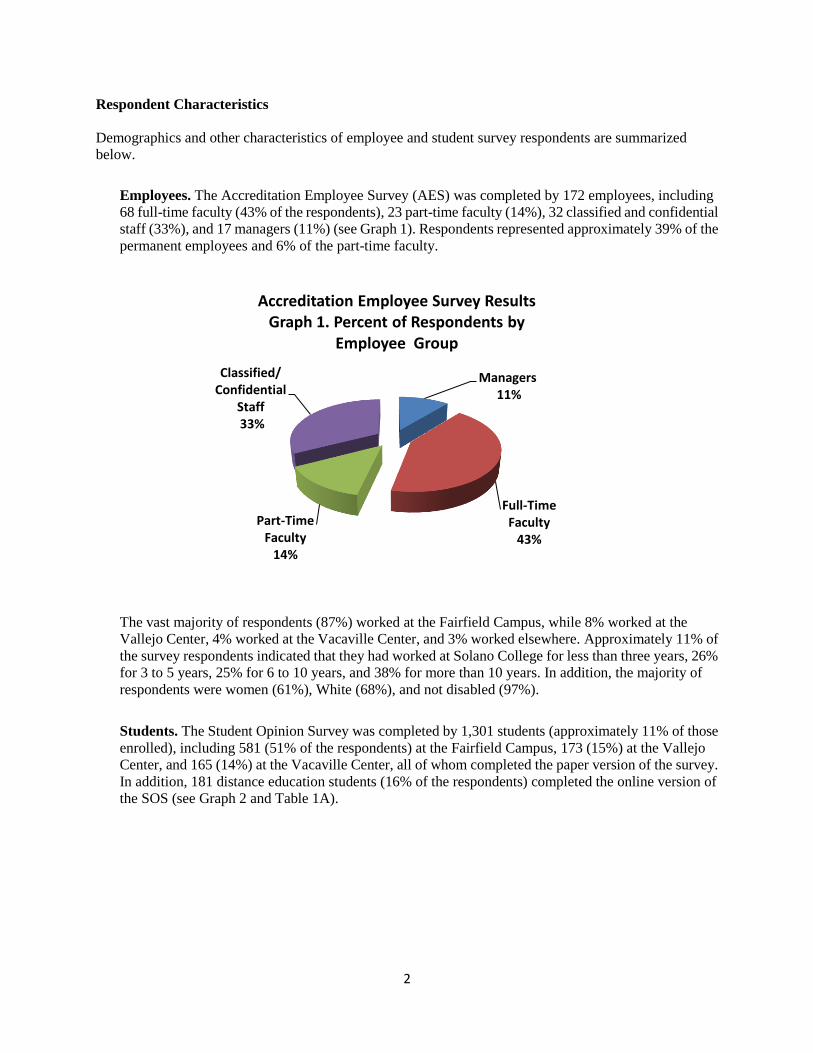
Employees. The Accreditation Employee Survey (AES) was completed by 172 employees, including
68 full-time faculty (43% of the respondents), 23 part-time faculty (14%), 32 classified and confidential
staff (33%), and 17 managers (11%) (see Graph 1). Respondents represented approximately 39% of the
permanent employees and 6% of the part-time faculty.
The vast majority of respondents (87%) worked at the Fairfield Campus, while 8% worked at the
Vallejo Center, 4% worked at the Vacaville Center, and 3% worked elsewhere. Approximately 11% of
the survey respondents indicated that they had worked at Solano College for less than three years, 26%
for 3 to 5 years, 25% for 6 to 10 years, and 38% for more than 10 years. In addition, the majority of
respondents were women (61%), White (68%), and not disabled (97%).
Students. The Student Opinion Survey was completed by 1,301 students (approximately 11% of those
enrolled), including 581 (51% of the respondents) at the Fairfield Campus, 173 (15%) at the Vallejo
Center, and 165 (14%) at the Vacaville Center, all of whom completed the paper version of the survey.
In addition, 181 distance education students (16% of the respondents) completed the online version of
the SOS (see Graph 2 and Table 1A).
Managers11%
Full-Time Faculty
43%
Part-Time Faculty
14%
Classified/Confidential
Staff33%
Accreditation Employee Survey Results Graph 1. Percent of Respondents by
Employee Group

3
The survey respondents fell evenly into thirds by age group: 19 years old or younger, 20 to 24 years old,
and 25 years old or older. In addition, the largest proportion of respondents was White (39%), followed
by Asians (20%), African Americans (17%), and Latinos (16%). Also, 57% of those completing the
survey were female and 63% attended Solano College full-time. Overall, the survey respondents were
relatively representative of the Solano College student population, except that there were greater
proportions of younger and full-time students completing the SOS.
Approximately one-half of the respondents entered Solano College directly from high school and the
majority (57%) intends to transfer to a four-year college or university. Most of the students (58%) were
also employed with approximately two-thirds working part-time. In addition, 42% of the respondents
were receiving financial aid. While 25% of the students live five miles or less from Solano College,
29% commute 6 to 10 miles, 35% travel 11 to 20 miles, and 12% live 21 or more miles from the
College.
Reasons for Attending SCC
SOS results show that the reason most often given by students for attending Solano College was SCC’s
convenient location (93% of respondents), followed by the low cost of attending (87%), offering courses
Fairfield 51%
Vacaville Center 14%
Vallejo Center 15%
Online 16%
Other 4%
Student Opinion Survey Results Graph 2. Percent of Respondents by Location
Student Opinion Survey Results Table 1A. Location Where Respondents Completed Survey
Question²
Fairfield Campus
Vacaville Center
Vallejo Center Online
Other Location
Not Specified
Typical Response N % N % N % N % N % N %
V-1. Where are you are completing this survey?
581 51% 165 14% 173 15% 181 16% 41 4% 160 ―¹ Fairfield Campus
Note: Percentages may not sum to 100% due to rounding. ¹ Not included in percentage calculations. ² Question number references questionnaire.

4
that the students want to take (81%), and providing a schedule that allows them to work while attending
(73%).
Campus Climate and Quality of Education
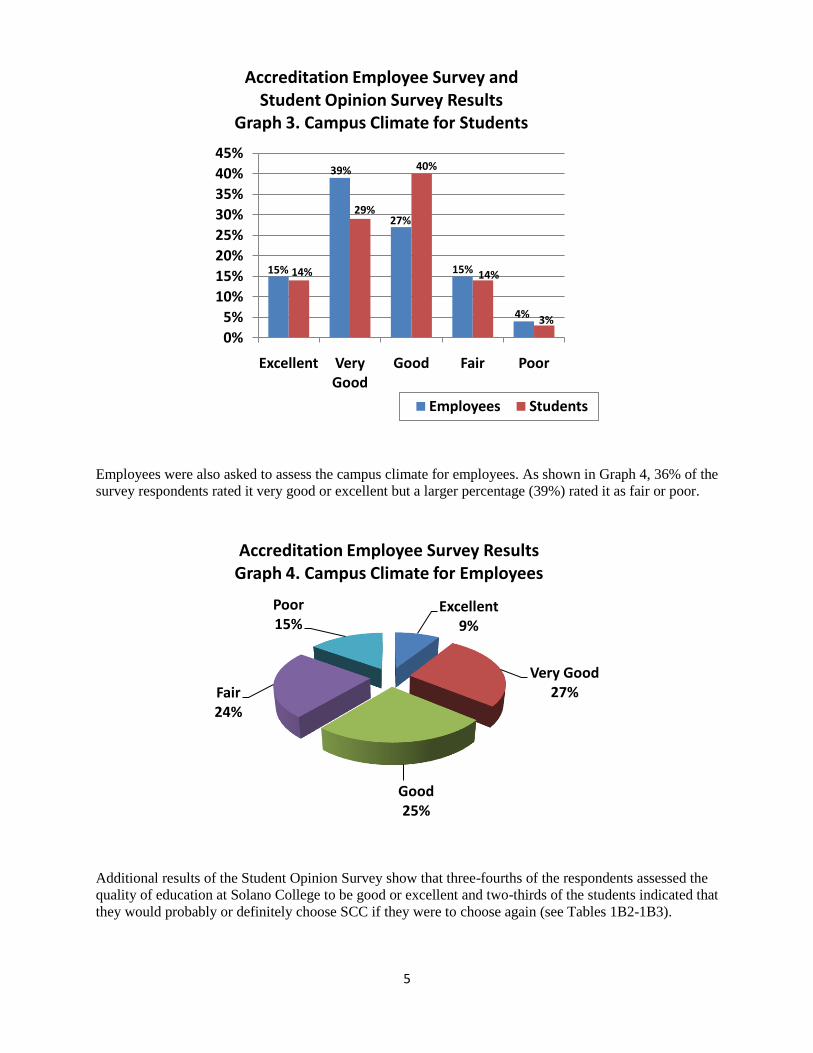
Both employees and students were asked to assess the campus climate for students on their respective
surveys, the results of which are depicted in Graph 3 and Table 1B1. The graph and table show that while
the greatest proportion of respondents rated the campus climate for students as very good or excellent, a
greater proportion of employees (54%) than students (43%) did so. However, similar percentages of
employees (19%) and students (17%) rated it as fair or poor.
Accreditation Employee Survey and Student Opinion Survey Results
Table 1B1. Assessment of Campus Climate for Students by Campus¹
Respondent Group
Fairfield Campus
Vacaville Center
Vallejo Center Online Total²
N % N % N % N % N %
Students:
Excellent 78 14% 27 17% 31 18% 15 9% 157 14%
Very Good 150 27% 53 33% 49 29% 47 28% 312 29%
Good 227 41% 53 33% 62 37% 79 47% 434 40%
Fair 81 15% 20 13% 24 14% 21 13% 152 14%
Poor 18 3% 6 4% 2 1% 5 3% 32 3%
Total Respondents
581 100% 165 100% 173 100% 181 100% 1,301 100%
Typical (Average) Response
Good to Very Good
Good to Very Good
Good to Very Good
Good to Very Good
Good to Very Good
Employees:
Excellent NA NA NA NA NA NA NA NA 24 15%
Very Good NA NA NA NA NA NA NA NA 64 39%
Good NA NA NA NA NA NA NA NA 44 27%
Fair NA NA NA NA NA NA NA NA 24 15%
Poor NA NA NA NA NA NA NA NA 7 4%
Total Respondents NA NA NA NA NA NA NA NA 172 100%
Typical (Average) Response
NA NA NA NA Good to Very
Good
NOTE: Percentages may not sum to 100% due to rounding. ¹Location where student completed survey. Online students were enrolled in an online course. ²Total includes respondents who did not designate a campus.
5
Employees were also asked to assess the campus climate for employees. As shown in Graph 4, 36% of the
survey respondents rated it very good or excellent but a larger percentage (39%) rated it as fair or poor.
Additional results of the Student Opinion Survey show that three-fourths of the respondents assessed the
quality of education at Solano College to be good or excellent and two-thirds of the students indicated that
they would probably or definitely choose SCC if they were to choose again (see Tables 1B2-1B3).
15%
39%
27%
15%
4%
14%
29%
40%
14%
3%
0%
5%
10%
15%
20%
25%
30%
35%
40%
45%
Excellent Very Good
Good Fair Poor
Accreditation Employee Survey and Student Opinion Survey Results
Graph 3. Campus Climate for Students
Employees Students
Excellent 9%
Very Good 27%
Good 25%
Fair 24%
Poor 15%
Accreditation Employee Survey Results Graph 4. Campus Climate for Employees

6
Student Opinion Survey Results
Table 1B3. Overall Assessment of SCC by Campus¹
Question²
Fairfield Campus
Vacaville Center
Vallejo Center Online
Total
Students³
N % N % N % N % N %
Total Respondents 581 100% 165 100% 173 100% 181 100% 1,301 100%
II-D. What is your overall impression of the quality of education at this 2-year college?
Excellent 130 24% 29 19% 45 27% 44 24% 295 24%
Good 285 52% 82 54% 73 45% 96 53% 643 52%
Average 125 23% 34 22% 42 26% 34 19% 268 22%
Below Average 9 2% 4 3% 4 2% 6 3% 26 2%
Very Inadequate 4 1% 3 2% 0 0% 1 1% 10 1%
Typical (Average) Response Good Good Good Good Good
NOTE: Percentages may not sum to 100% due to rounding. ¹Location where student completed survey. Online students were enrolled in an online course. ²Question number references questionnaire. ³Total students includes respondents who did not designate a campus.
Student Opinion Survey Results
Table 1B2. Overall Assessment of SCC by Campus¹
Question²
Fairfield Campus
Vacaville Center
Vallejo Center Online
Total
Students³
N % N % N % N % N %
Total Respondents 581 100% 165 100% 173 100% 181 100% 1,301 100%
II-C. If you could start college over, would you choose to attend this college?
Definitely Yes 172 31% 41 26% 46 28% 56 31% 382 31%
Probably Yes 183 33% 53 34% 61 37% 64 36% 423 34%
Uncertain 110 20% 35 23% 33 20% 31 17% 238 19%
Probably No 62 11% 14 9% 18 11% 16 9% 135 11%
Definitely No 27 5% 12 8% 7 4% 13 7% 68 5%
Typical (Average) Response Uncertain to Probably Yes
Uncertain to Probably
Yes
Uncertain to Probably Yes
Uncertain to Probably Yes
Uncertain to Probably Yes
NOTE: Percentages may not sum to 100% due to rounding. ¹Location where student completed survey. Online students were enrolled in an online course. ²Question number references questionnaire. ³Total students includes respondents who did not designate a campus.

7
Student Learning Outcomes
Three questions added to the Student Opinion Survey by Solano College addressed student learning
outcomes (SLOs) (see Tables 1C1-1C3). Slightly less than one-half of the respondents indicated that they
know what SLOs are (44% of respondents), and about one-half have read the expected SLOs for their
current classes (51%). However, among students who have read the SLOs, most respondents (90%)
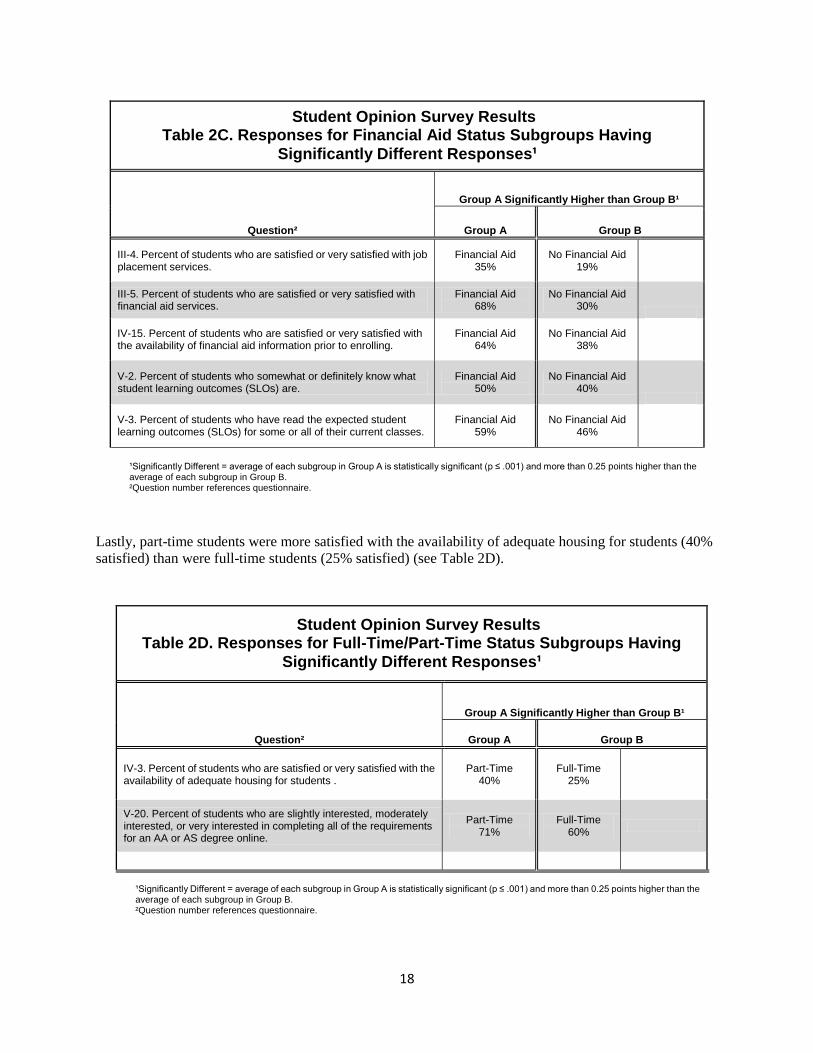
indicated that they understand what they mean. In addition, Table 2C shows that a greater proportion of
financial aid recipients than non financial aid recipients know what SLOs are (50% v. 40%) and have read
the expected SLOs for their current classes (59% v. 46%).
Student Opinion Survey Results
Table 1C1. Perceptions About Student Learning Outcomes (SLOs) by
Campus¹
Question²
Fairfield Campus
Vacaville Center
Vallejo Center Online
Total
Students³
N % N % N % N % N %
Total Respondents 581 100% 165 100% 173 100% 181 100% 1,301 100%
V-2. Do you know what student learning outcomes (SLOs) are?
Yes, Definitely 126 22% 26 16% 38 22% 31 17% 234 21%
Yes, Somewhat 145 25% 28 17% 40 23% 47 26% 267 23%
No 257 44% 94 57% 72 42% 84 47% 528 46%
Unsure 51 9% 16 10% 21 12% 18 10% 108 9%
Typical Response No No No No No
NOTE: Percentages may not sum to 100% due to rounding. ¹Location where student completed survey. Online students were enrolled in an online course. ²Question number references questionnaire. ³Total students includes respondents who did not designate a campus.

8
Student Opinion Survey Results
Table 1C2. Perceptions About Student Learning Outcomes (SLOs) by
Campus¹
Question²
Fairfield Campus
Vacaville Center
Vallejo Center Online
Total
Students³
N % N % N % N % N %
Total Respondents 581 100% 165 100% 173 100% 181 100% 1,301 100%
V-3. Have you read the expected student learning outcomes (SLOs) for your current classes?
Yes, For All of My Classes 125 26% 29 21% 49 34% 35 24% 252 26%
Yes, For Some of My Classes 137 28% 29 21% 26 18% 38 26% 234 25%
No, I Have Not Read Them 211 43% 72 52% 67 46% 65 45% 431 45%
No, Student Learning Outcomes Are Not Available for My Classes 16 3% 8 6% 4 3% 7 5% 37 4%
Typical Response No, I Have Not Read
Them
No, I Have Not Read
Them
No, I Have Not Read
Them
No, I Have Not Read
Them
No, I Have Not Read Them
NOTE: Percentages may not sum to 100% due to rounding. ¹Location where student completed survey. Online students were enrolled in an online course. ²Question number references questionnaire. ³Total students includes respondents who did not designate a campus.
Student Opinion Survey Results
Table 1C3. Perceptions About Student Learning Outcomes (SLOs) by
Campus¹
Question²
Fairfield Campus
Vacaville Center
Vallejo Center Online
Total
Students³
N % N % N % N % N %
Total Respondents 581 100% 165 100% 173 100% 181 100% 1,301 100%
V-4. If you read the expected student learning outcomes (SLOs) for your current classes, how well do you understand what they mean?
Very Well 136 41% 31 42% 55 57% 46 53% 280 46%
Somewhat 166 50% 31 42% 32 33% 34 40% 270 44%
Not at All 27 8% 12 16% 10 10% 6 7% 57 9%
Typical Response Somewhat Very Well/ Somewhat
Very Well Very Well Very Well
NOTE: Percentages may not sum to 100% due to rounding. ¹Location where student completed survey. Online students were enrolled in an online course. ²Question number references questionnaire. ³Total students includes respondents who did not designate a campus.

9
Labs
As shown in Table 1D, students were asked to assess their satisfaction with the College’s reading, writing,
and math labs. The results show that the majority of students who used the labs were satisfied or very
satisfied with them. Specifically, somewhat more than one-half of the respondents were satisfied with the
reading lab (56%) and writing lab (57%), while 66% were satisfied with the math lab.
Student Opinion Survey Results
Table 1D. Satisfaction With Labs by Campus¹
Question²
Fairfield Campus
Vacaville Center
Vallejo Center Online
Total
Students³
N % N % N % N % N %
Total Respondents 581 100% 165 100% 173 100% 181 100% 1,301 100%
V-6. How satisfied are you with the Reading Lab?
Very Satisfied 48 21% 10 18% 23 29% 14 29% 96 23%
Satisfied 79 35% 19 34% 21 26% 14 29% 137 32%
Neutral 77 34% 21 38% 26 33% 15 31% 142 34%
Dissatisfied 14 6% 3 5% 7 9% 4 8% 29 7%
Very Dissatisfied 9 4% 3 5% 3 4% 1 2% 18 4%
Typical (Average) Response Neutral to Satisfied
Neutral to Satisfied
Neutral to Satisfied
Neutral to Satisfied
Neutral to Satisfied
V-7. How satisfied are you with the Writing Skills Lab?
Very Satisfied 54 24% 9 18% 21 27% 15 28% 101 24%
Satisfied 83 36% 13 27% 22 28% 16 30% 139 33%
Neutral 67 29% 19 39% 31 39% 16 30% 138 33%
Dissatisfied 12 5% 5 10% 3 4% 6 11% 27 6%
Very Dissatisfied 12 5% 3 6% 2 3% 1 2% 19 4%
Typical (Average) Response Neutral to Satisfied
Neutral to Satisfied
Neutral to Satisfied
Neutral to Satisfied
Neutral to Satisfied
V-8. How satisfied are you with the Math Activities Center (MAC Lab)?
Very Satisfied 100 26% 21 20% 40 32% 26 27% 191 26%
Satisfied 144 38% 51 49% 45 36% 39 41% 288 40%
Neutral 91 24% 22 21% 29 23% 22 23% 171 23%
Dissatisfied 29 8% 8 8% 2 2% 6 6% 48 7%
Very Dissatisfied 17 4% 2 2% 9 7% 2 2% 30 4%
Typical (Average) Response Neutral to Satisfied
Satisfied Satisfied Satisfied Satisfied
NOTE: Percentages may not sum to 100% due to rounding. ¹Location where student completed survey. Online students were enrolled in an online course. ²Question number references questionnaire. ³Total students includes respondents who did not designate a campus.

10
Library Services
Eighty-three percent of respondents to the Student Opinion Survey indicated that they were satisfied or very
satisfied with the overall library/learning resources center facilities and services. However, as shown in
Table 2A, students attending the Fairfield Campus were more satisfied (82% satisfied) than were Vallejo
Center students (72% satisfied) and the Vacaville Center students (71% satisfied).
Additional questions were added to the SOS to assess specific library services (see Table 1E). Since
students were asked some of the same questions in 2005, the differences in responses between 2005 and
2010 are noted where applicable. The majority of respondents were satisfied or very satisfied with all
services. The students were most satisfied with the library computers (Information Commons) (78%
satisfied) (12% higher than 2005), assistance from library faculty and staff (76% satisfied) (7% higher than
2005), and electronic resources (73% satisfied). In addition, 67% of the respondents were satisfied with the
printed collection and resources (5% lower than 2005), 61% were satisfied with library services for distance
education and off campus access (21% lower than 2005, but the 2005 question did not include off campus
access), and 59% were satisfied with textbook reserves. Table 2B also shows that African Americans were
more satisfied (77% satisfied) with the library’s printed collection and resources than were Asian/Pacific
Islanders (60% satisfied).
Student Opinion Survey Results
Table 1E. Satisfaction With Library Services by Campus¹
Question²
Fairfield Campus
Vacaville Center
Vallejo Center Online
Total
Students³
N % N % N % N % N %
Total Respondents 581 100% 165 100% 173 100% 181 100% 1,301 100%
V-9. Printed collection and resources (books, magazines, newspapers, journals)
Very Satisfied 102 24% 15 16% 32 26% 22 23% 178 23%
Satisfied 195 46% 45 47% 42 34% 45 46% 341 44%
Neutral 106 25% 31 33% 40 32% 27 28% 209 27%
Dissatisfied 20 5% 4 4% 10 8% 3 3% 40 5%
Typical (Average) Response Satisfied Satisfied Satisfied Satisfied Satisfied
V-10. Library computers (Information Commons)
Very Satisfied 139 31% 27 25% 43 33% 27 25% 244 30%
Satisfied 215 49% 53 49% 56 43% 55 50% 394 48%
Neutral 71 16% 26 24% 25 19% 27 25% 153 19%
Dissatisfied 18 4% 2 2% 7 5% 1 1% 31 4%
Typical (Average) Response Satisfied Satisfied Satisfied Satisfied Satisfied
NOTE: Percentages may not sum to 100% due to rounding. ¹Location where student completed survey. Online students were enrolled in an online course. ²Question number references questionnaire. ³Total students includes respondents who did not designate a campus.
(Continued)

11
Student Opinion Survey Results
Table 1E. Satisfaction With Library Services by Campus¹ (continued)
Question²
Fairfield Campus
Vacaville Center
Vallejo Center Online
Total
Students³
N % N % N % N % N %
V-11. Assistance from Library faculty and staff
Very Satisfied 150 32% 26 25% 50 38% 43 36% 277 33%
Satisfied 206 44% 49 48% 51 39% 49 40% 368 43%
Neutral 92 20% 25 24% 25 19% 26 21% 173 20%
Dissatisfied 17 4% 3 3% 4 3% 3 2% 31 4%
Typical (Average) Response Satisfied Satisfied Satisfied Satisfied Satisfied
V-12. Electronic resources (databases, websites, eBooks)
Very Satisfied 156 33% 29 26% 37 28% 40 31% 267 31%
Satisfied 199 43% 49 44% 46 35% 51 40% 363 42%
Neutral 99 21% 26 23% 38 29% 33 26% 202 23%
Dissatisfied 13 3% 8 7% 9 7% 4 3% 36 4%
Typical (Average) Response Satisfied Satisfied Satisfied Satisfied Satisfied
V-13. Textbook reserves
Very Satisfied 97 24% 17 17% 29 24% 19 21% 167 22%
Satisfied 156 39% 34 34% 45 37% 32 35% 278 37%
Neutral 123 31% 40 40% 35 28% 30 33% 235 32%
Dissatisfied 25 6% 10 10% 14 11% 10 11% 64 9%
Typical (Average) Response Satisfied Satisfied Satisfied Satisfied Satisfied
V-14. Library services for distance education and off campus access
Very Satisfied 90 25% 16 20% 21 18% 24 25% 157 23%
Satisfied 144 39% 22 28% 40 35% 41 43% 256 38%
Neutral 110 30% 38 48% 40 35% 25 26% 221 32%
Dissatisfied 23 6% 4 5% 13 11% 6 6% 48 7%
Typical (Average) Response Satisfied Satisfied Satisfied Satisfied Satisfied
NOTE: Percentages may not sum to 100% due to rounding. ¹Location where student completed survey. Online students were enrolled in an online course. ²Question number references questionnaire. ³Total students includes respondents who did not designate a campus.

12
Distance Education
Students who have taken online classes were asked to rate their experiences by responding to questions
added to the Student Opinion Survey, as shown in Tables 1F1-1F6. Based upon the number of students who
responded, it is estimated that approximately two-fifths of Solano College students have taken an online
class. Among survey respondents who are taking or who have taken an online course, approximately
one-half took one class, one-fourth took two or three classes, and one-fourth took three or more classes, as
depicted in Table 1F1.
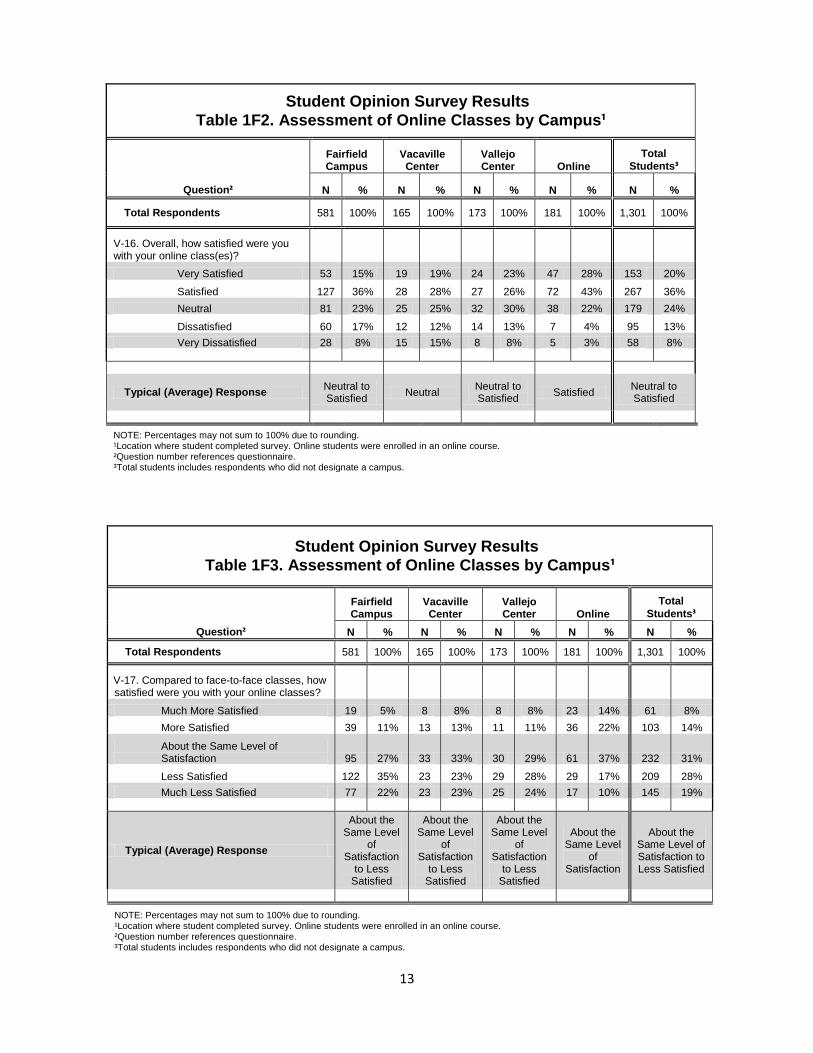
Overall, the survey respondents were satisfied with their online courses (56% satisfied v. 22% dissatisfied).
However, compared to face-to-face classes, only 22% of the respondents were satisfied and 49% felt that
the online classes were more difficult (see Tables 1F2-1F4).
Student Opinion Survey Results
Table 1F1. Assessment of Online Classes by Campus¹
Question²
Fairfield Campus
Vacaville Center
Vallejo Center Online
Total
Students³
N % N % N % N % N %
Total Respondents 581 100% 165 100% 173 100% 181 100% 1,301 100%
V-15. How many online classes have you taken?
1 203 54% 46 43% 57 52% 55 32% 373 47%
2-3 108 29% 35 33% 29 27% 40 23% 220 28%
3-4 39 10% 13 12% 13 12% 26 15% 96 12%
5 or More 24 6% 13 12% 10 9% 53 30% 107 13%
Typical Response One One One One One
NOTE: Percentages may not sum to 100% due to rounding. ¹Location where student completed survey. Online students were enrolled in an online course. ²Question number references questionnaire. ³Total students includes respondents who did not designate a campus.
13
Student Opinion Survey Results
Table 1F2. Assessment of Online Classes by Campus¹
Question²
Fairfield Campus
Vacaville Center
Vallejo Center Online
Total
Students³
N % N % N % N % N %
Total Respondents 581 100% 165 100% 173 100% 181 100% 1,301 100%
V-16. Overall, how satisfied were you with your online class(es)?
Very Satisfied 53 15% 19 19% 24 23% 47 28% 153 20%
Satisfied 127 36% 28 28% 27 26% 72 43% 267 36%
Neutral 81 23% 25 25% 32 30% 38 22% 179 24%
Dissatisfied 60 17% 12 12% 14 13% 7 4% 95 13%
Very Dissatisfied 28 8% 15 15% 8 8% 5 3% 58 8%
Typical (Average) Response Neutral to Satisfied
Neutral Neutral to Satisfied
Satisfied Neutral to Satisfied
NOTE: Percentages may not sum to 100% due to rounding. ¹Location where student completed survey. Online students were enrolled in an online course. ²Question number references questionnaire. ³Total students includes respondents who did not designate a campus.
Student Opinion Survey Results
Table 1F3. Assessment of Online Classes by Campus¹
Question²
Fairfield Campus
Vacaville Center
Vallejo Center Online
Total
Students³
N % N % N % N % N %
Total Respondents 581 100% 165 100% 173 100% 181 100% 1,301 100%
V-17. Compared to face-to-face classes, how satisfied were you with your online classes?
Much More Satisfied 19 5% 8 8% 8 8% 23 14% 61 8%
More Satisfied 39 11% 13 13% 11 11% 36 22% 103 14%
About the Same Level of Satisfaction 95 27% 33 33% 30 29% 61 37% 232 31%
Less Satisfied 122 35% 23 23% 29 28% 29 17% 209 28%
Much Less Satisfied 77 22% 23 23% 25 24% 17 10% 145 19%
Typical (Average) Response
About the Same Level
of Satisfaction
to Less Satisfied
About the Same Level
of Satisfaction
to Less Satisfied
About the Same Level
of Satisfaction
to Less Satisfied
About the Same Level
of Satisfaction
About the Same Level of Satisfaction to Less Satisfied
NOTE: Percentages may not sum to 100% due to rounding. ¹Location where student completed survey. Online students were enrolled in an online course. ²Question number references questionnaire. ³Total students includes respondents who did not designate a campus.

14
Table 1F5 shows that distance education students also indicated that the primary reasons for taking online
classes was convenience (31% of respondents) and because they were unable to attend face-to-face classes
(19%).
Student Opinion Survey Results
Table 1F4. Assessment of Online Classes by Campus¹
Question²
Fairfield Campus
Vacaville Center
Vallejo Center Online
Total
Students³
N % N % N % N % N %
Total Respondents 581 100% 165 100% 173 100% 181 100% 1,301 100%
V-18. Compared to face-to-face classes, how difficult was (were) your online class(es)?
Much More Difficult 56 16% 15 15% 17 17% 15 9% 105 14%
More Difficult 115 33% 39 39% 44 44% 56 34% 262 35%
About the Same Level of Difficulty 101 29% 35 35% 26 26% 65 40% 240 32%
Less Difficult 57 16% 6 6% 13 13% 25 15% 106 14%
Much Less Difficult 19 5% 4 4% 0 0% 3 2% 28 4%
Typical (Average) Response
About the Same Level of Difficulty
to More Difficult
About the Same Level of Difficulty
to More Difficult
About the Same Level of Difficulty
to More Difficult
About the Same Level of Difficulty
to More Difficult
About the Same Level of
Difficulty to More Difficult
NOTE: Percentages may not sum to 100% due to rounding. ¹Location where student completed survey. Online students were enrolled in an online course. ²Question number references questionnaire. ³Total students includes respondents who did not designate a campus.

15
In addition, approximately two-thirds of the students expressed an interest in completing a degree online
(see Table 1F6), although a greater proportion of part-time students (71%) were interested than were
full-time students (60%), as depicted in Table 2D.
Student Opinion Survey Results
Table 1F5. Assessment of Online Classes by Campus¹
Question²
Fairfield Campus
Vacaville Center
Vallejo Center Online
Total
Students³
N % N % N % N % N %
Total Respondents 581 100% 165 100% 173 100% 181 100% 1,301 100%
V-19. What is the primary reason that you took an online class(es)?
Convenience 111 29% 45 42% 32 29% 55 32% 249 31% Unable to Attend Face-to-Face Class 62 16% 14 13% 23 21% 45 26% 152 19% Flexibility in Completing Class Work 30 8% 14 13% 7 6% 21 12% 76 9%
Less Commuting time and/or Cost 22 6% 4 4% 10 9% 14 8% 53 7%
Can Learn at My Own Pace 13 3% 1 1% 1 1% 8 5% 23 3%
Other Reason 141 37% 30 28% 39 35% 30 17% 251 31%
Typical Response Convenience Convenience Convenience Convenience Convenience
NOTE: Percentages may not sum to 100% due to rounding. ¹Location where student completed survey. Online students were enrolled in an online course. ²Question number references questionnaire. ³Total students includes respondents who did not designate a campus.
Student Opinion Survey Results
Table 1F6. Assessment of Online Classes by Campus¹
Question²
Fairfield Campus
Vacaville Center
Vallejo Center Online
Total
Students³
N % N % N % N % N %
Total Respondents 581 100% 165 100% 173 100% 181 100% 1,301 100%
V-20. How interested would you be in completing all of the requirements for an AA or AS degree online?
Very Interested 97 27% 30 30% 30 28% 78 47% 245 32%
Moderately Interested 47 13% 22 22% 18 17% 29 17% 119 16%
Slightly Interested 66 19% 12 12% 14 13% 23 14% 120 16%
Not Interested 146 41% 37 37% 44 42% 36 22% 276 36%
Typical Response Slightly to
Moderately Interested
Slightly to Moderately Interested
Slightly to Moderately Interested
Moderately Interested
Slightly to Moderately Interested
NOTE: Percentages may not sum to 100% due to rounding. ¹Location where student completed survey. Online students were enrolled in an online course. ²Question number references questionnaire. ³Total students includes respondents who did not designate a campus.

16
Student Use of Services
The Student Opinion Survey asked students to specify the services that they use. The services most often
used by survey respondents included parking (71% of respondents), the library (59%), and academic
advising (55%). These were followed by cafeteria/food services (49% of respondents), computer services
(44%), and financial aid services (39%).
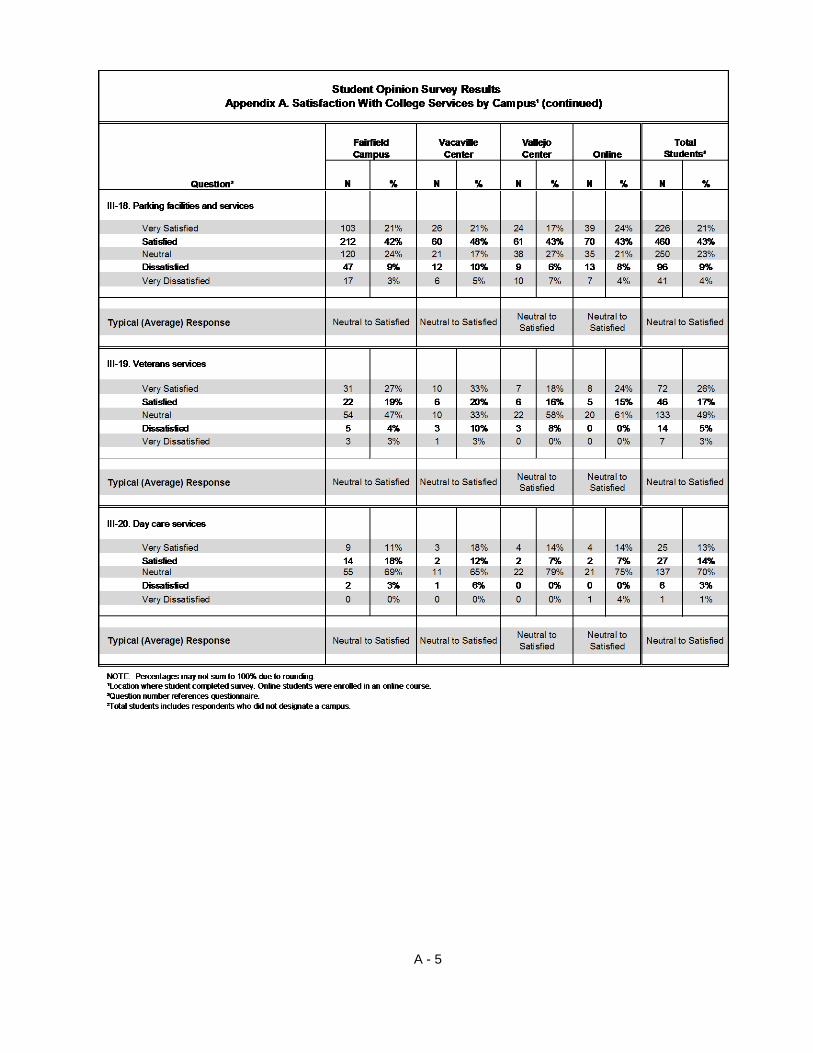
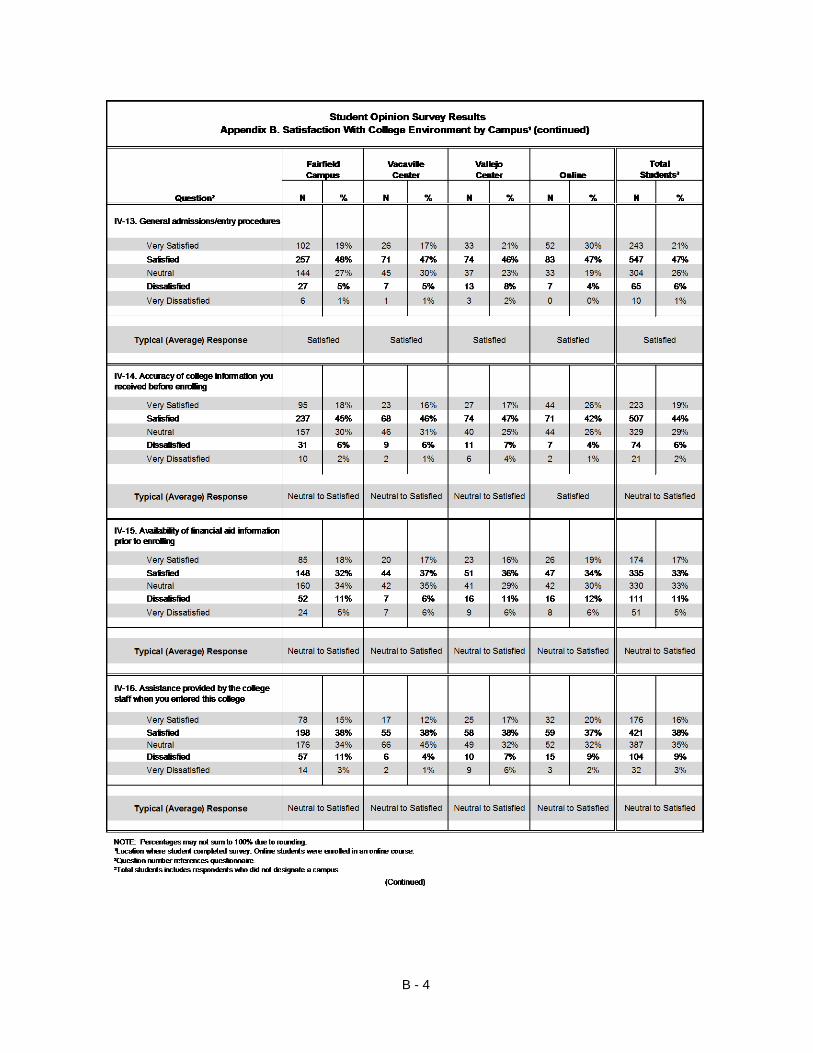
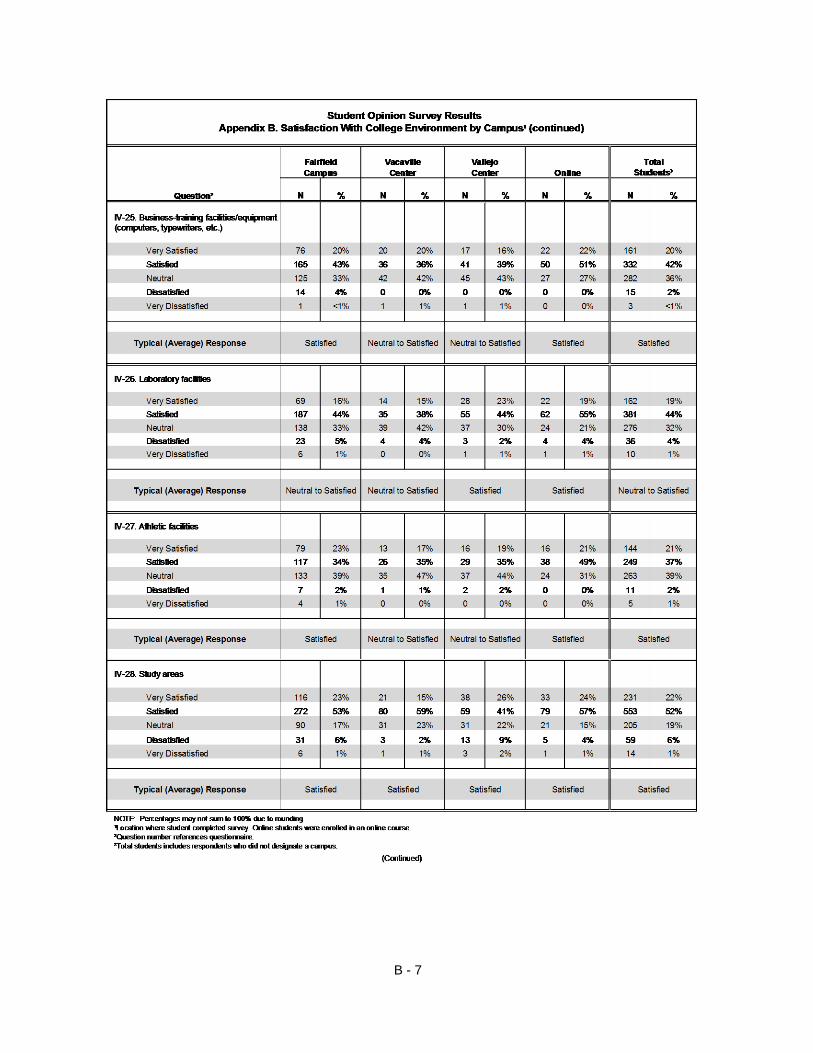
Other Student Opinion Survey Results
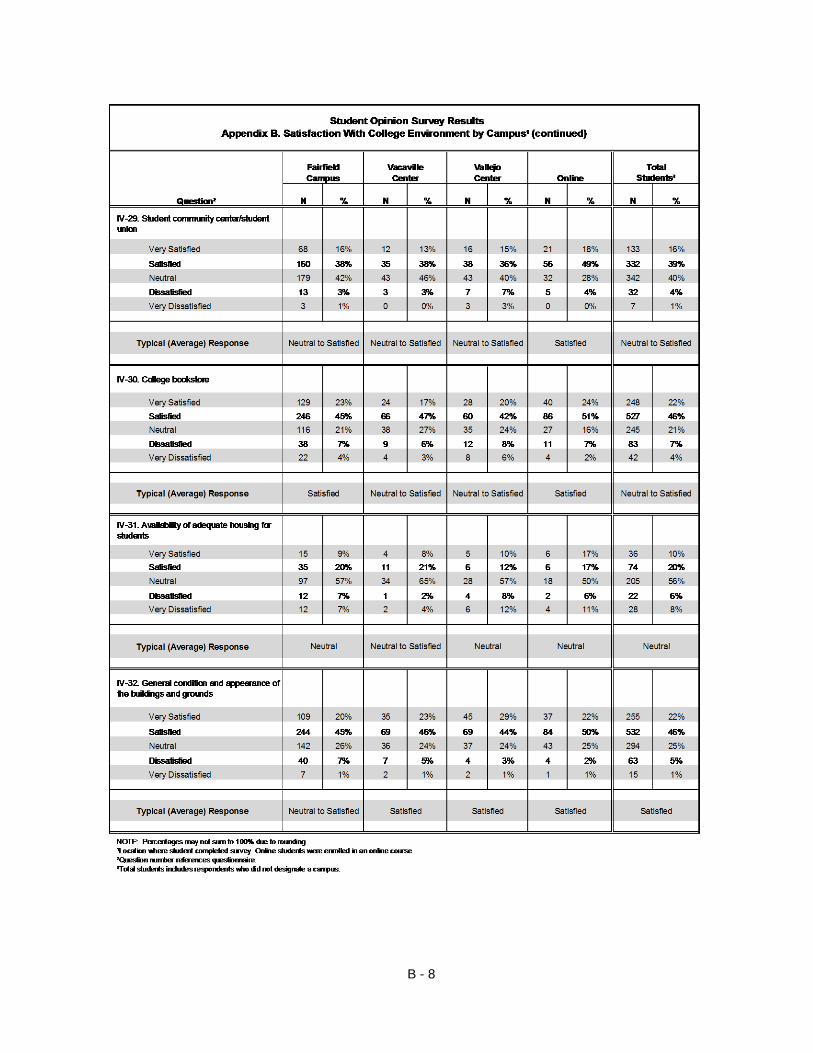
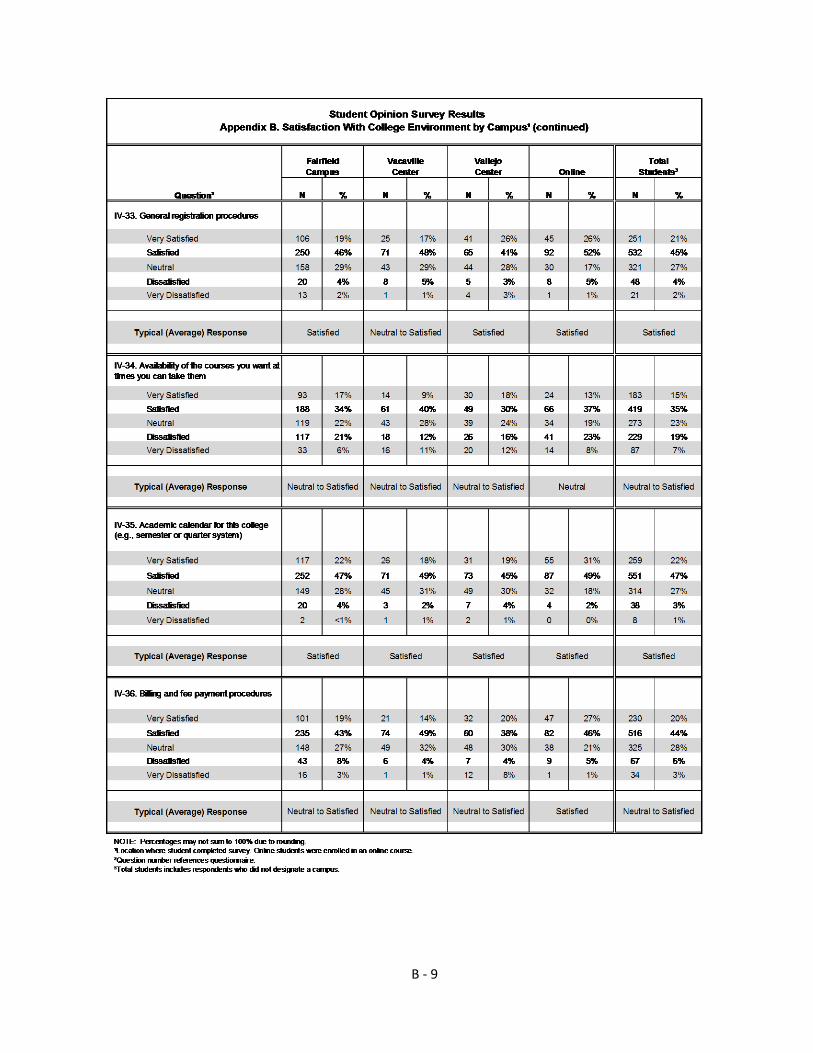
Additional survey results pertaining to college services (Appendix A) and the college environment
(Appendix B), broken down by campus, may be found in the appendices.
Significant Subgroup Differences
Statistical analyses were conducted to determine if there were significant differences among subgroups
based upon campus, ethnicity, financial aid status, full-time/part-time status, and day/evening status. Tables
2A-D list those questions to which the average responses between two or more subgroups were
significantly different from one another. The average response of the subgroup in Group A is significantly
higher than the responses of the subgroup(s) in Group B. However, there were no significant differences
between students who attend classes during the day and those who attend classes at night.
Although there were no significant differences among subgroups on most survey questions, African
Americans and financial aid recipients were most satisfied in some areas.
As shown in Table 2A, students attending the Fairfield Campus were more satisfied with the out-of-class
availability of instructors than were Vacaville Center students (68% v. 56%). In addition, online students
were more satisfied with the academic calendar (80% satisfied) than were Vacaville Center students (66%)
and Vallejo Center students (64%).
Student Opinion Survey Results
Table 2A. Responses for Campus Subgroups Having Significantly Different
Responses¹
Question²
Group A Significantly Higher than Group B¹
Group A Group B
III-7. Percent of students who are satisfied or very satisfied with library/learning resources center facilities and services.
Fairfield 82%
Vallejo 72%
Vacaville 71%
IV-4. Percent of students who are satisfied or very satisfied with out-of-class availability of instructors.
Fairfield 68%
Vacaville 56%
IV-35. Percent of students who are satisfied or very satisfied with the academic calendar.
Online 80%
Vacaville 66%
Vallejo 64%
¹Significantly Different = average of each subgroup in Group A is statistically significant (p ≤ .001) and more than 0.25 points higher than the average of each subgroup in Group B. ²Question number references questionnaire.

17
African American students were more satisfied with several areas than were other ethnic groups.
Specifically, African Americans were more satisfied with academic advising and course planning services
(68% satisfied) than were Whites (58%) and Latinos (55%). In addition, they were more satisfied than were
Asians/Pacific Islanders with the college orientation program (67% v. 50%) and the general condition and
appearance of the buildings and grounds (75% v. 62%). African American students were also more satisfied
with the preparation they are receiving for their chosen occupation (78% satisfied) than were White
students (62%) and Asian/Pacific Islander students (57%). Lastly, they were more satisfied than were
Latino students with the business training facilities and equipment (72% v. 51%) (see Table 2B).
Table 2C shows that Financial Aid recipients were more satisfied than were non financial aid recipients
with respect to job placement services (35% v. 19%), financial aid services (68% v. 30%), and the
availability of financial aid information before enrolling (64% v. 38%). The last two differences likely
relate to the financial aid recipients having a greater interest in the financial aid processes than do non
financial aid recipients.
Student Opinion Survey Results
Table 2B. Responses for Ethnic Subgroups Having Significantly Different
Responses¹
Question²
Group A Significantly Higher than Group B¹
Group A Group B
III-1. Percent of students who are satisfied or very satisfied with academic advising/course planning services.
African American 68%
White 58%
Latino 55%
III-15. Percent of students who are satisfied or very satisfied with the college orientation program.
African American 67%
Asian/Pacific Islander
50%
IV-12. Percent of students who are satisfied or very satisfied with the preparation they are receiving for their chosen occupation.
African American 78%
White 62%
Asian/Pacific Islander
57%
IV-25. Percent of students who are satisfied or very satisfied with the business-training facilities/equipment.
African American 72%
Latino 51%
IV-32. Percent of students who are satisfied or very satisfied with the general condition and appearance of the buildings and grounds.
African American 75%
Asian/Pacific Islander
62%
V-9. Percent of students who are satisfied or very satisfied with the library's printed collection and resources (books, magazines, newspapers, journals).
African American 77%
Asian/Pacific Islander
60%
¹Significantly Different = average of each subgroup in Group A is statistically significant (p ≤ .001) and more than 0.25 points higher than the average of each subgroup in Group B. ²Question number references questionnaire.
18
Lastly, part-time students were more satisfied with the availability of adequate housing for students (40%
satisfied) than were full-time students (25% satisfied) (see Table 2D).
Student Opinion Survey Results
Table 2C. Responses for Financial Aid Status Subgroups Having
Significantly Different Responses¹
Question²
Group A Significantly Higher than Group B¹
Group A Group B
III-4. Percent of students who are satisfied or very satisfied with job placement services.
Financial Aid 35%
No Financial Aid 19%
III-5. Percent of students who are satisfied or very satisfied with financial aid services.
Financial Aid 68%
No Financial Aid 30%
IV-15. Percent of students who are satisfied or very satisfied with the availability of financial aid information prior to enrolling.
Financial Aid 64%
No Financial Aid 38%
V-2. Percent of students who somewhat or definitely know what student learning outcomes (SLOs) are.
Financial Aid 50%
No Financial Aid 40%
V-3. Percent of students who have read the expected student learning outcomes (SLOs) for some or all of their current classes.
Financial Aid 59%
No Financial Aid 46%
¹Significantly Different = average of each subgroup in Group A is statistically significant (p ≤ .001) and more than 0.25 points higher than the average of each subgroup in Group B. ²Question number references questionnaire.
Student Opinion Survey Results
Table 2D. Responses for Full-Time/Part-Time Status Subgroups Having
Significantly Different Responses¹
Question²
Group A Significantly Higher than Group B¹
Group A Group B
IV-3. Percent of students who are satisfied or very satisfied with the availability of adequate housing for students .
Part-Time 40%
Full-Time 25%
V-20. Percent of students who are slightly interested, moderately interested, or very interested in completing all of the requirements for an AA or AS degree online.
Part-Time 71%
Full-Time 60%
¹Significantly Different = average of each subgroup in Group A is statistically significant (p ≤ .001) and more than 0.25 points higher than the average of each subgroup in Group B. ²Question number references questionnaire.
19
Areas of Strength
Programs, support services, and procedures rated highest or identified as being strengths by employees
and/or students are summarized below.
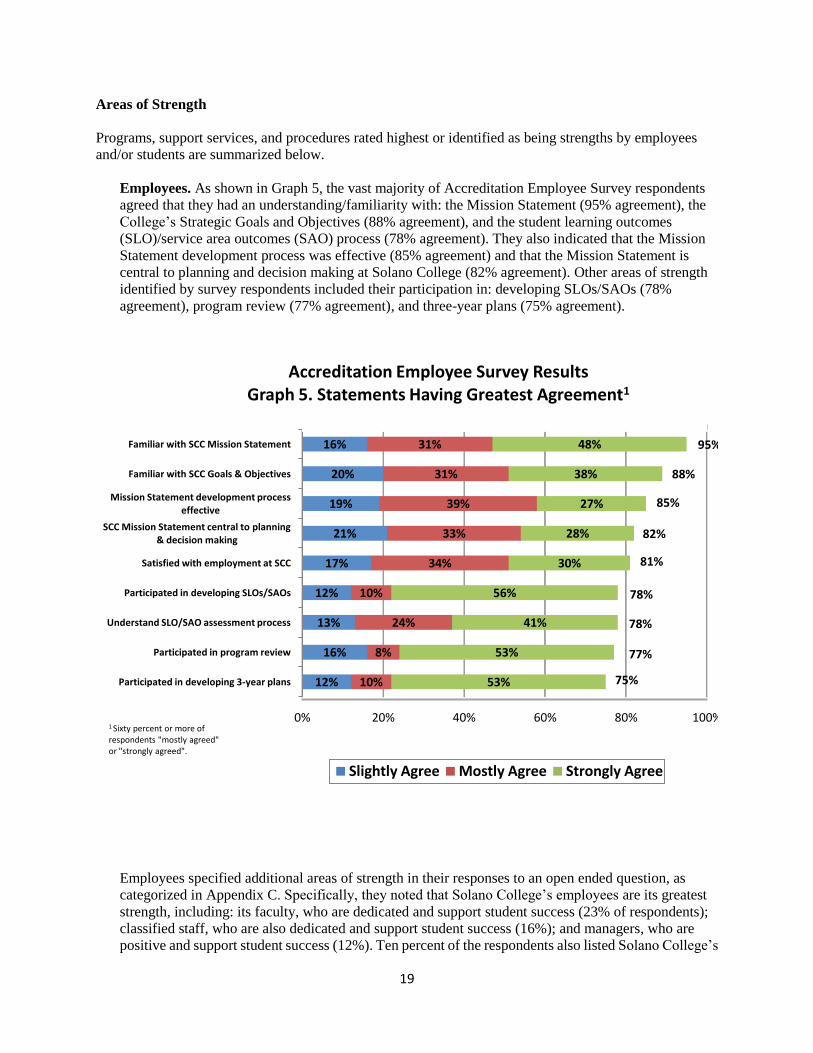
Employees. As shown in Graph 5, the vast majority of Accreditation Employee Survey respondents
agreed that they had an understanding/familiarity with: the Mission Statement (95% agreement), the
College’s Strategic Goals and Objectives (88% agreement), and the student learning outcomes
(SLO)/service area outcomes (SAO) process (78% agreement). They also indicated that the Mission
Statement development process was effective (85% agreement) and that the Mission Statement is
central to planning and decision making at Solano College (82% agreement). Other areas of strength
identified by survey respondents included their participation in: developing SLOs/SAOs (78%
agreement), program review (77% agreement), and three-year plans (75% agreement).
Employees specified additional areas of strength in their responses to an open ended question, as
categorized in Appendix C. Specifically, they noted that Solano College’s employees are its greatest
strength, including: its faculty, who are dedicated and support student success (23% of respondents);
classified staff, who are also dedicated and support student success (16%); and managers, who are
positive and support student success (12%). Ten percent of the respondents also listed Solano College’s
Familiar with SCC Mission Statement
Familiar with SCC Goals & Objectives
Mission Statement development process effective
SCC Mission Statement central to planning & decision making
Satisfied with employment at SCC
Participated in developing SLOs/SAOs
Understand SLO/SAO assessment process
Participated in program review
Participated in developing 3-year plans
0% 20% 40% 60% 80% 100%
16%
20%
19%
21%
17%
12%
13%
16%
12%
31%
31%
39%
33%
34%
10%
24%
8%
10%
48%
38%
27%
28%
30%
56%
41%
53%
53%
Accreditation Employee Survey Results Graph 5. Statements Having Greatest Agreement1
Slightly Agree Mostly Agree Strongly Agree
1 Sixty percent or more of respondents "mostly agreed" or "strongly agreed".
95%
82%
75%
77%
78%
78%
81%
85%
88%

20
facilities, including new and renovated buildings, as being a strength, followed by the variety of the
College’s academic programs (9% of respondents), and its committed and hard working students (9%).
Students. Programs and services rated highest in satisfaction by respondents on the Student Opinion
Survey are depicted in Graph 6. These include the following auxiliary services: student health services
(85% satisfied) and day care services (78% satisfied), both of which Solano students rated significantly
higher than did norm group students from other two-year colleges. Survey respondents also rated these
support services high: computer services (84% satisfied), library/learning resource center (83%
satisfied), veterans services (78% satisfied), and tutorial services (73% satisfied). In addition, they were
highly satisfied with some student activities, including recreational programs and services (82%),
college sponsored social activities (77%), and cultural programs and activities (74%).
As shown in Appendix F (in the Appendices), which categorizes student comments, the most often
mentioned positive comments were that Solano College is a fine institution and that the College has
exceptional instructors.
Areas Needing Improvement
Programs, support services, and procedures rated lowest or identified as needing improvement by
employees and/or students are summarized below.
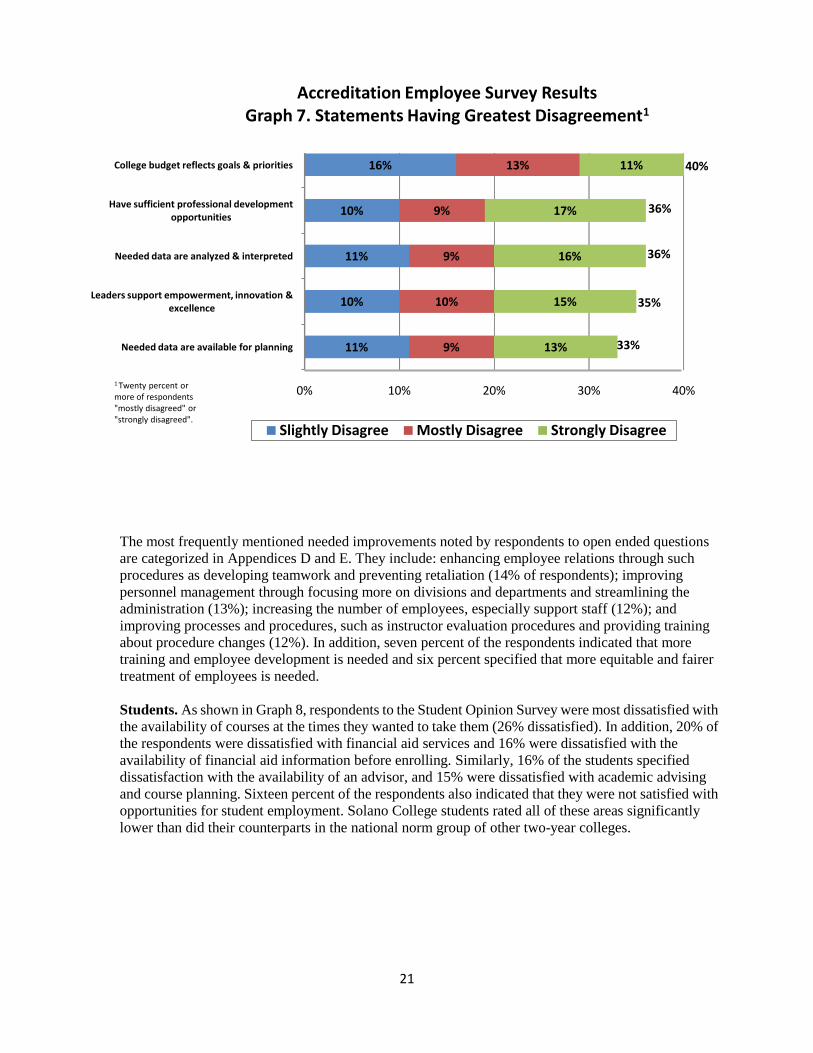
Employees. Graph 7 depicts those areas rated lowest on the Accreditation Employee Survey by
respondents. It shows that 40% of those responding disagreed that the budget reflects the College’s
goals and priorities. In addition, 36% of the respondents disagreed that they have access to sufficient
professional development activities and 35% disagreed that College leaders support empowerment,
innovation, and excellence. The graph also shows that approximately one-third of the employees
disagreed that needed data are analyzed and interpreted (36% disagreed) and are available for planning
(33% disagreed).
Student health services
Computer services
Library/learning resource center
Recreational programs & services
Veterans Services
Day care services
College sponsored social activities
Cultural programs & activites
Tutorial services
0% 20% 40% 60% 80% 100%
39%
48%
44%
40%
25%
30%
30%
27%
33%
46%
36%
39%
42%
53%
48%
47%
47%
40%
Student Opinion Survey Results Graph 6. Programs and Services with Highest Satisfaction1
Satisfied Very Satisfied1 Seventy percent or more of respondents were "satisfied" or "very satisfied".
85%
82%
73%
74%
77%
78%
78%
83%
84%
21
The most frequently mentioned needed improvements noted by respondents to open ended questions
are categorized in Appendices D and E. They include: enhancing employee relations through such
procedures as developing teamwork and preventing retaliation (14% of respondents); improving
personnel management through focusing more on divisions and departments and streamlining the
administration (13%); increasing the number of employees, especially support staff (12%); and
improving processes and procedures, such as instructor evaluation procedures and providing training
about procedure changes (12%). In addition, seven percent of the respondents indicated that more
training and employee development is needed and six percent specified that more equitable and fairer
treatment of employees is needed.
Students. As shown in Graph 8, respondents to the Student Opinion Survey were most dissatisfied with
the availability of courses at the times they wanted to take them (26% dissatisfied). In addition, 20% of
the respondents were dissatisfied with financial aid services and 16% were dissatisfied with the
availability of financial aid information before enrolling. Similarly, 16% of the students specified
dissatisfaction with the availability of an advisor, and 15% were dissatisfied with academic advising
and course planning. Sixteen percent of the respondents also indicated that they were not satisfied with
opportunities for student employment. Solano College students rated all of these areas significantly
lower than did their counterparts in the national norm group of other two-year colleges.
College budget reflects goals & priorities
Have sufficient professional development opportunities
Needed data are analyzed & interpreted
Leaders support empowerment, innovation & excellence
Needed data are available for planning
0% 10% 20% 30% 40%
16%
10%
11%
10%
11%
13%
9%
9%
10%
9%
11%
17%
16%
15%
13%
Accreditation Employee Survey Results Graph 7. Statements Having Greatest Disagreement1
Slightly Disagree Mostly Disagree Strongly Disagree
1 Twenty percent or more of respondents "mostly disagreed" or "strongly disagreed".
40%
33%
35%
36%
36%

22
Some of the same areas of dissatisfaction are identified in the students’ responses to an open ended
question categorized in Appendix F. Seven percent of the SOS respondents made comments related to
improving instruction, including increasing course offerings, improving online courses, improving the
quality of instruction, and improving paired courses. Student services targeted by six percent of the
respondents for needing improvement included counseling, financial aid, support services, and
admissions and records. In addition, three percent of the respondents suggested that facilities, furniture,
and equipment need to be improved and upgraded. Another three percent of respondents specified the
need for changes to auxiliary services, including food services, campus safety, and the bookstore, and
two percent commented on the need to improve faculty and staff behavior.
Summary and Conclusions
These survey results provide information concerning employee and student opinions and beliefs about
programs, services, procedures, and issues impacting them and Solano College as a whole. They should
prove useful in helping to assess the degree to which the College is meeting the accreditation standards, as
well as for improving programs and services.
The Accreditation Employee Survey (AES) was completed by 172 employees, who represent
approximately 39% of permanent employees and 6% of part-time faculty. The typical respondent is a
full-time faculty member working at the Fairfield Campus. She also is a White, non-disabled woman who
has worked at Solano College for more than 10 years.
The majority of AES respondents indicated that they were satisfied with how most aspects of Solano
College are functioning. Overall, part-time faculty were most positive and classified/confidential staff were
least positive.
Availability of courses wanted at times wanted
Financial aid services
Financial aid information available before enrolling
Opportunity for student employment
Availability of advisor
Academic advising & course planning
0% 5% 10% 15% 20% 25% 30%
19%
10%
11%
11%
11%
10%
7%
10%
5%
5%
5%
5%
Student Opinion Survey Results Graph 8. Programs and Services with Highest Dissatisfaction1
Dissatisfied Very Dissatisfied
1 Fifteen percent or more of respondents were "dissatisfied" or "very dissatisfied".
26%
16%
16%
16%
20%
15%

23
The Student Opinion Survey (SOS) was completed by 1,301 students (approximately 11% of enrolled
students), who are generally representative of the student body. The typical respondent is a 19 year old,
White woman who attends Solano College full-time and is planning to transfer to a four-year college or
university. She also works part-time, does not receive financial aid, and commutes 11-20 miles to the
College.
SOS respondents were generally satisfied with most programs and services. However, they rated some
areas significantly lower than did respondents from the national norm group of other two-year colleges.
Areas of Strength
Survey respondents identified the following strengths and areas in which Solano College is performing
well:
1. Faculty, classified/confidential staff, and managers are dedicated and support student success.
2. Employees are familiar with the Mission Statement, Strategic Goals and Objectives, and the
SLO/SAO process. They have also participated in program review and in developing SLOs/SAOs
and three-year plans.
3. Employees perceive the College to be moving in a positive direction.
4. Students perceive the College’s quality of education and campus climate to be good or excellent.
5. Students have a high level of satisfaction with student health services, day care services, computer
services, the library/learning resource center, veterans services, tutorial services, recreational
programs and services, social activities, and cultural programs and activities.
Areas Needing Improvement
Survey respondents were less satisfied or expressed a need for improvement in the following areas:
1. While employees perceive the campus climate to be improving, a greater percentage rated the
campus climate for employees as fair or poor than rated it very good or excellent. They believe that
there is a need to enhance employee relations.
2. Employees most often disagreed that: the budget reflects the College’s goals and priorities; they
have access to sufficient professional development activities; leaders support empowerment,
innovation, and excellence; and needed data are analyzed, interpreted, and available for planning.
3. Less than one-half of students have an understanding of SLOs.
4. While students are generally satisfied with online courses, they are less satisfied with them than
they are with face-to-face classes.
5. Students are most dissatisfied with: the availability of courses at the times they want to take them;
financial aid processes and information; academic advising, course planning, and the availability of
counselors; and opportunities for student employment.
Recommendations
Based upon survey results, the following recommendations are offered for consideration:
1. Enhance the campus climate for employees through:
a. Maintaining transparency and good communication.
b. Providing training for employees in interpersonal relations.
c. Providing more opportunities for faculty, classified/confidential staff, and managers to
socialize together.
2. Enhance the availability and usefulness of data and information for planning and decision making
24
through:
a. Developing a Data Mart to allow easier access to routine data.
b. Providing data and reports that are more understandable by users.
c. Providing ongoing training about how to interpret data.
d. Sharing existing data and documenting where they can be found.
3. Provide customer service training for employees in departments directly serving students.
4. Better support distance education students through:
a. Developing additional degrees that can be obtained online, where feasible.
b. Determining why students are more dissatisfied with online courses than they are with
face-to face courses and making improvements based upon the results.
5. Encourage faculty to spend more time familiarizing students with SLOs.
6. Enhance counseling services through:
a. Identifying and implementing ways to provide more counselor availability for students,
which might include online virtual counseling.
b. Assuring that advising information is accurate and consistent among counselors, including
part-time counselors.
7. Enhance financial aid services through:
a. Determining which processes are most problematic for students and how these processes
can be improved.
b. Identifying and implementing ways to speed up payment to students.
8. Enhance students’ perception about safety on campus through:
a. Publicizing reports reflecting the College’s low crime rate.
b. Making police more visible on campus, particularly at night.
RP /dv/cm 2/08/11 Survey\Accreditation\General\Accreditation surveys report final 020811.docx

25
Appendices
Appendix A. Student Opinion Survey Results: Satisfaction with College Services by Campus
Appendix B. Student Opinion Survey Results: Satisfaction with the College Environment by
Campus
Appendix C. Accreditation Employee Survey Results: Solano College’s Greatest Strengths
Appendix D. Accreditation Employee Survey Results: How Solano College Can Improve
Appendix E. Accreditation Employee Survey Results: Other Comments
Appendix F. Student Opinion Survey Results: Student Comments
Appendix G. Accreditation Employee Survey
Appendix H. Student Opinion Survey
Appendix I. Student Opinion Survey: Section V-Additional Questions

26
[Intentionally left blank]

27
Appendix A:
Student Opinion Survey Results:
Satisfaction with College Services by Campus

28
[Intentionally left blank]

29
30
A - 2

31
A - 3

32
A - 4
33
A - 5

34
[Intentionally left blank]
35
Appendix B:
Student Opinion Survey Results:
Satisfaction with College Environment by Campus

36
[Intentionally left blank]

37
NOTE: Percentages may not sum to 100% due to rounding. ¹Location where student completed survey. Online students were enrolled in an online course. ²Question number references questionnaire. ³Total students includes respondents who did not designate a campus.
(Continued)
B - 1

38
B - 2

1
B - 3
2
B - 4

3
B - 5

4
B - 6
5
B - 7
6
B - 8
7
B - 9

8
B - 10

9
B - 11

10
[Intentionally left blank]

11
Appendix C:
Accreditation Employee Survey Results:
Solano College’s Greatest Strengths

12
[Intentionally left blank]

13
C - 1

14
[Intentionally left blank]
15
Appendix D:
Accreditation Employee Survey Results:
How Solano College Can Improve

16
[Intentionally left blank]

17

18

19
Appendix E:
Accreditation Employee Survey Results:
Other Comments

20
[Intentionally left blank]

21
E - 1

22
[Intentionally left blank]
23
Appendix F:
Student Opinion Survey Results:
Student Comments

24
[Intentionally left blank]

25

26
F - 2

27
F - 3

28
[Intentionally left blank]
29
Appendix G:
Accreditation Employee Survey

30
[Intentionally left blank]

31
G - 1

32
G - 2

33
G - 3

34
G - 4
35
G - 5

36
[Intentionally left blank]

37
Appendix H:
Student Opinion Survey

38
[Intentionally left blank]

39
H - 1

40
H - 2

41
H - 3

42
H - 4

43
Appendix I:
Student Opinion Survey:
Section V – Additional Questions

44
[Intentionally left blank]

45
Section V--Additional Questions Please fill in the oval of the letter below the corresponding number in Section V to indicate your response.
1. Where are you are completing this survey? A. Fairfield Campus B. Vacaville Center C. Vallejo Center D. Online E. Other location
2. Do you know what student learning outcomes (SLOs) are?
A. Yes, definitely B. Yes, somewhat C. No D. Unsure
3. Have you read the expected student learning outcomes (SLOs) for your current classes?
A. Yes, for all of my classes B. Yes, for some of my classes C. No, I have not read them D. No, student learning outcomes are not available for my classes E. Unsure
4. If you read the expected student learning outcomes (SLOs) for your current classes, how well do
you understand what they mean? A. Very well B. Somewhat C. Not at all D. Did not read them
5. Overall, how would you assess the campus climate/environment at Solano College for students? A. Excellent B. Very Good C. Good D. Fair E. Poor F. Don’t Know/No Opinion 6. How satisfied are you with the Reading Lab? A. Very Satisfied B. Satisfied C. Neutral D. Dissatisfied E. Very Dissatisfied F. Have Not Used G. Don’t Know/No Opinion
Continued
I -1

46
Section V--Additional Questions (continued) 7. How satisfied are you with the Writing Skills Lab? A. Very Satisfied B. Satisfied C. Neutral D. Dissatisfied E. Very Dissatisfied F. Have Not Used G. Don’t Know/No Opinion 8. How satisfied are you with the Math Activities Center (MAC Lab)? A. Very Satisfied B. Satisfied C. Neutral D. Dissatisfied E. Very Dissatisfied F. Have Not Used G. Don’t Know/No Opinion Please rate your overall satisfaction with the following Library Services (questions 9-14): 9. Printed collection and resources (books, magazines, newspapers, journals) A. Very Satisfied B. Satisfied C. Neutral D. Dissatisfied E. Unable to Rate 10. Library computers (Information Commons) A. Very Satisfied B. Satisfied C. Neutral D. Dissatisfied E. Unable to Rate 11. Assistance from Library faculty and staff A. Very Satisfied B. Satisfied C. Neutral D. Dissatisfied E. Unable to Rate
Continued
I -2

47
Section V--Additional Questions (continued) 12. Electronic resources (databases, websites, eBooks) A. Very Satisfied B. Satisfied C. Neutral D. Dissatisfied E. Unable to Rate 13. Textbook reserves A. Very Satisfied B. Satisfied C. Neutral D. Dissatisfied E. Unable to Rate 14. Library services for distance education and off campus access A. Very Satisfied B. Satisfied C. Neutral D. Dissatisfied E. Unable to Rate If you are currently taking an online class or if you previously took an online class, please answer questions 15-20: 15. How many online classes have you taken? A. 1 B. 2-3 C. 3-4 D. 5 or more 16. Overall, how satisfied were you with your online class(es)? A. Very Satisfied B. Satisfied C. Neutral D. Dissatisfied E. Very Dissatisfied F. Don’t Know/No Opinion 17. Compared to face-to-face classes, how satisfied were you with your online classes? A. Much More Satisfied B. More Satisfied C. About the Same Level of Satisfaction D. Less Satisfied E. Much Less Satisfied F. Don’t Know/No Opinion Continued
I -3

48
Section V--Additional Questions (continued) 18. Compared to face-to-face classes, how difficult was (were) your online class(es)? A. Much More Difficult B. More Difficult C. About the Same Level of Difficulty D. Less Difficult E. Much Less Difficult F. Don’t Know/No Opinion 19. What is the primary reason that you took an online class(es)? Choose only one. A. Convenience B. Unable to attend face-to-face class C. Flexibility in completing class work D. Less commuting time and/or cost E. Can learn at my own pace F. Other reason 20. How interested would you be in completing all of the requirements for an AA or AS degree
online? A. Very interested B. Moderately interested C. Slightly interested D. Not interested E. Don’t know/No opinion RP /cm 9/23/10 Survey\Accreditation\Student\SOS extra survey questions final 092310.docx
I -4

49