Embed Size (px)
Citation preview
Solano County’s
Streets Need Fixing
Presented to the Solano County Board of Supervisors
January 26, 2016
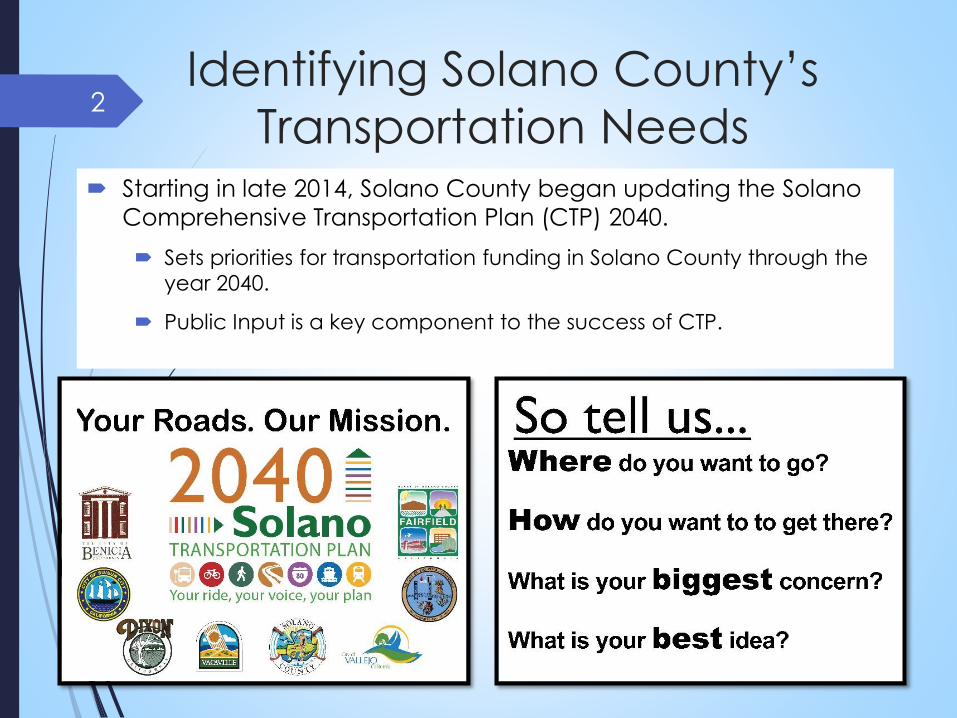
Identifying Solano County’s
Transportation Needs Starting in late 2014, Solano County began updating the Solano
Comprehensive Transportation Plan (CTP) 2040.
Sets priorities for transportation funding in Solano County through the
year 2040.
Public Input is a key component to the success of CTP.
2
Public Opinion Polling for
Transportation Priorities To gauge public opinions about transportation issues, a public
opinion poll was conducted on Jan 24-26, 2015
Road Safety and Filling Potholes was listed as one of 3 top
priorities (Other two were Public Safety and Education)
3
72% of respondents found Filling Potholes and
road safety was a high priority
57% of respondents found that Senior & Disabled
Person Transport was a high priority
Affordability
½ Cent Sales Tax: 60% yes
Strong concern regarding confidence in
government spending (Lack of Trust)
Willingness to consider limited-term sales tax
measure.
4 Year: 52% Yes
8 Year: 44% Yes
4 Highlights & Take-Aways
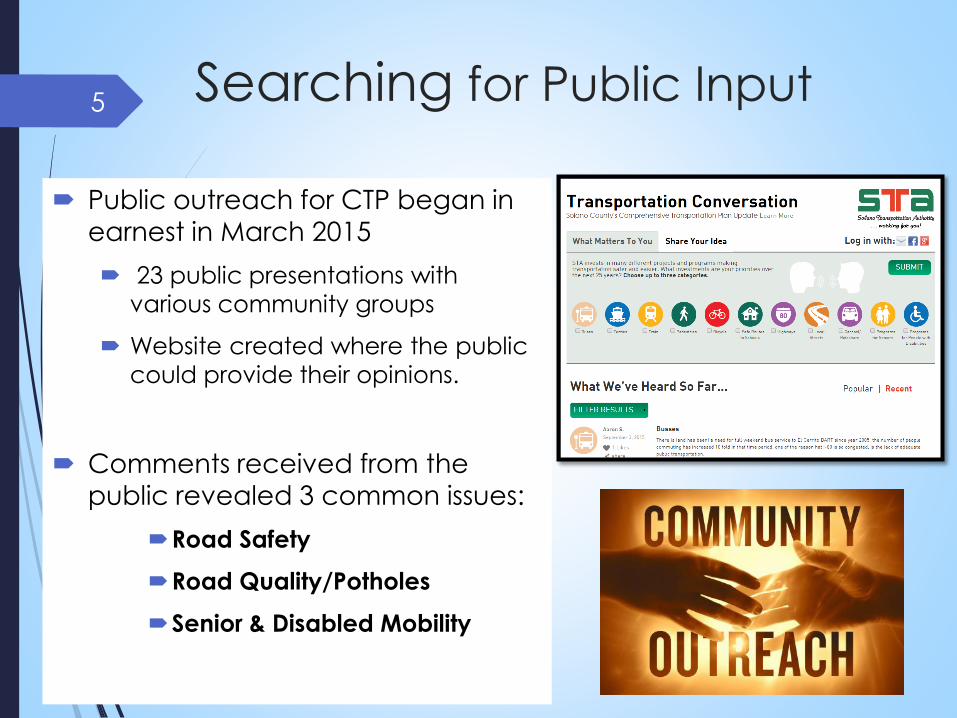
Searching for Public Input
Public outreach for CTP began in
earnest in March 2015
23 public presentations with
various community groups
Website created where the public
could provide their opinions.
Comments received from the
public revealed 3 common issues:
Road Safety
Road Quality/Potholes
Senior & Disabled Mobility
5
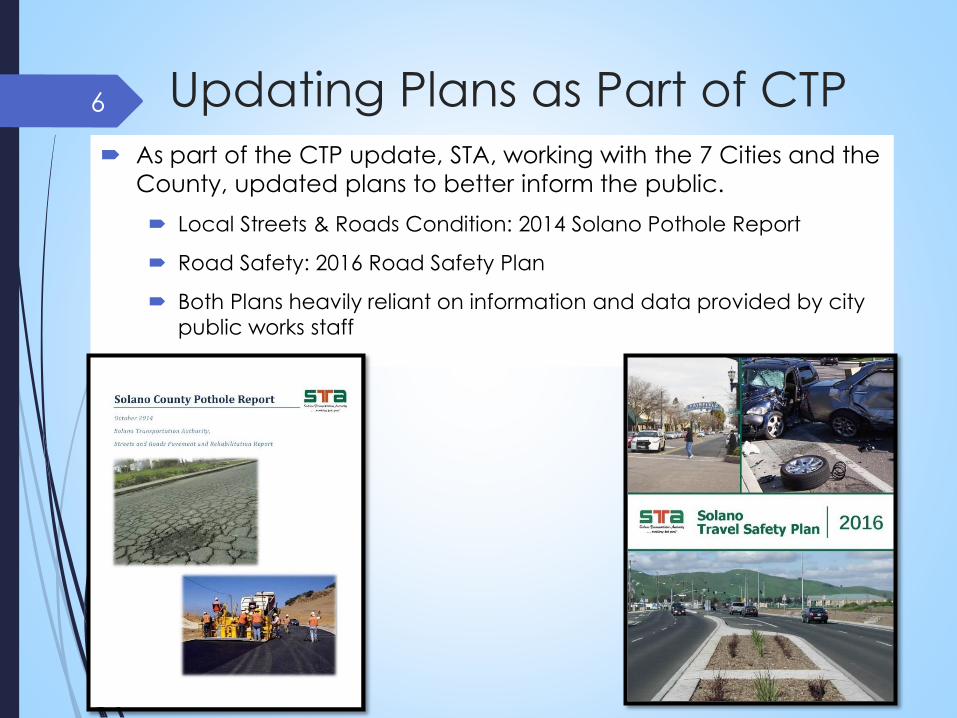
Updating Plans as Part of CTP As part of the CTP update, STA, working with the 7 Cities and the
County, updated plans to better inform the public.
Local Streets & Roads Condition: 2014 Solano Pothole Report
Road Safety: 2016 Road Safety Plan
Both Plans heavily reliant on information and data provided by city
public works staff
6
Current and Projected Status
of Local Streets and Roads
(LS&R) in Solano County
7
Based on 2014 Solano Pothole Report
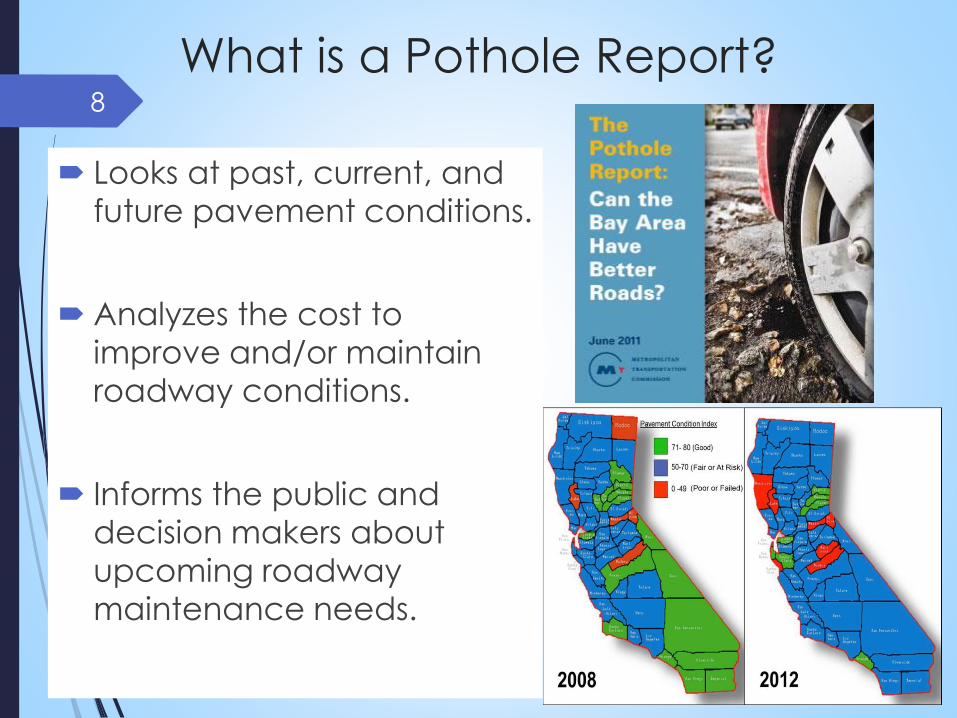
What is a Pothole Report?
Looks at past, current, and
future pavement conditions.
Analyzes the cost to
improve and/or maintain
roadway conditions.
Informs the public and
decision makers about
upcoming roadway
maintenance needs.
8
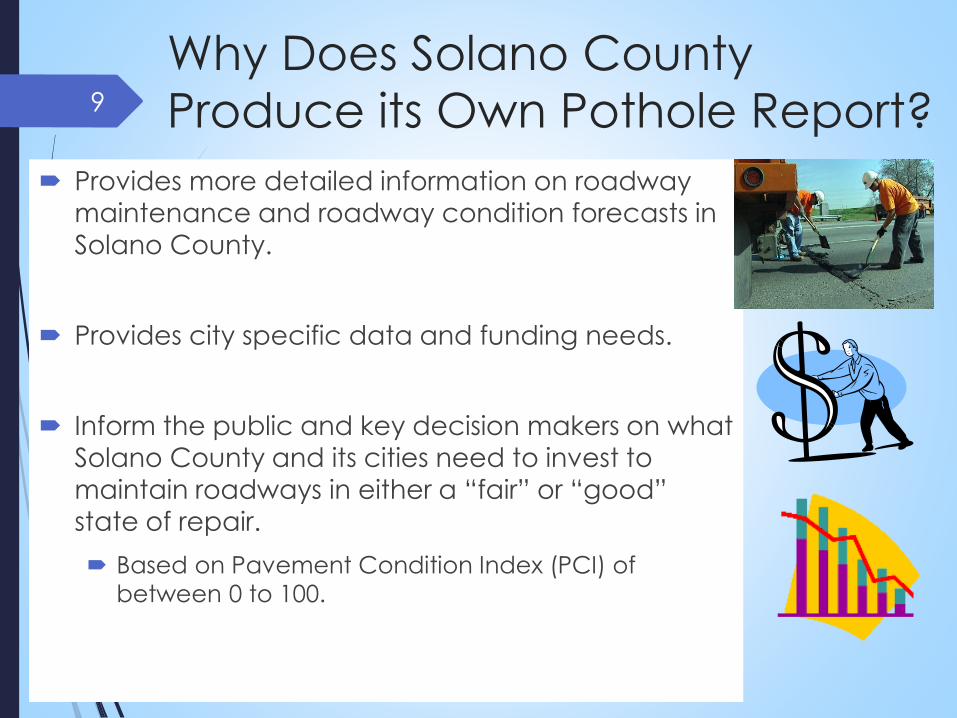
Why Does Solano County
Produce its Own Pothole Report?
Provides more detailed information on roadway
maintenance and roadway condition forecasts in
Solano County.
Provides city specific data and funding needs.
Inform the public and key decision makers on what
Solano County and its cities need to invest to
maintain roadways in either a “fair” or “good”
state of repair.
Based on Pavement Condition Index (PCI) of
between 0 to 100.
9
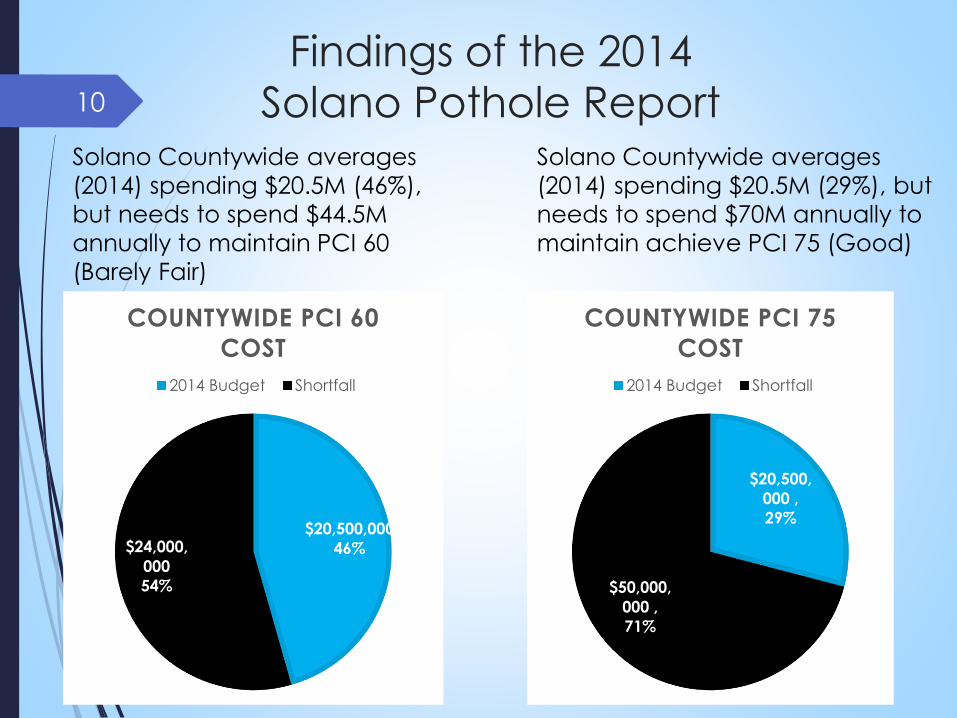
Findings of the 2014
Solano Pothole Report
$20,500,000
46%$24,000,
000
54%
COUNTYWIDE PCI 60
COST
2014 Budget Shortfall
10
Solano Countywide averages
(2014) spending $20.5M (46%),
but needs to spend $44.5M
annually to maintain PCI 60
(Barely Fair)
Solano Countywide averages
(2014) spending $20.5M (29%), but
needs to spend $70M annually to
maintain achieve PCI 75 (Good)
$20,500,
000 ,
29%
$50,000,
000 ,
71%
COUNTYWIDE PCI 75
COST
2014 Budget Shortfall
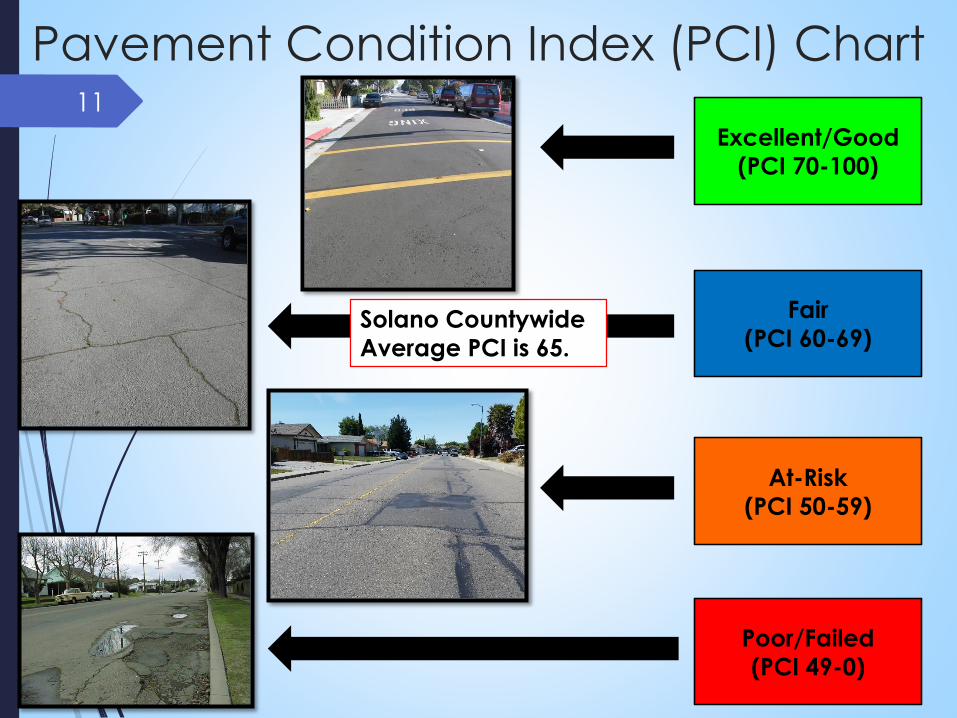
Pavement Condition Index (PCI) Chart11
At-Risk
(PCI 50-59)
Poor/Failed
(PCI 49-0)
Fair
(PCI 60-69)
Excellent/Good
(PCI 70-100)
Solano Countywide
Average PCI is 65.
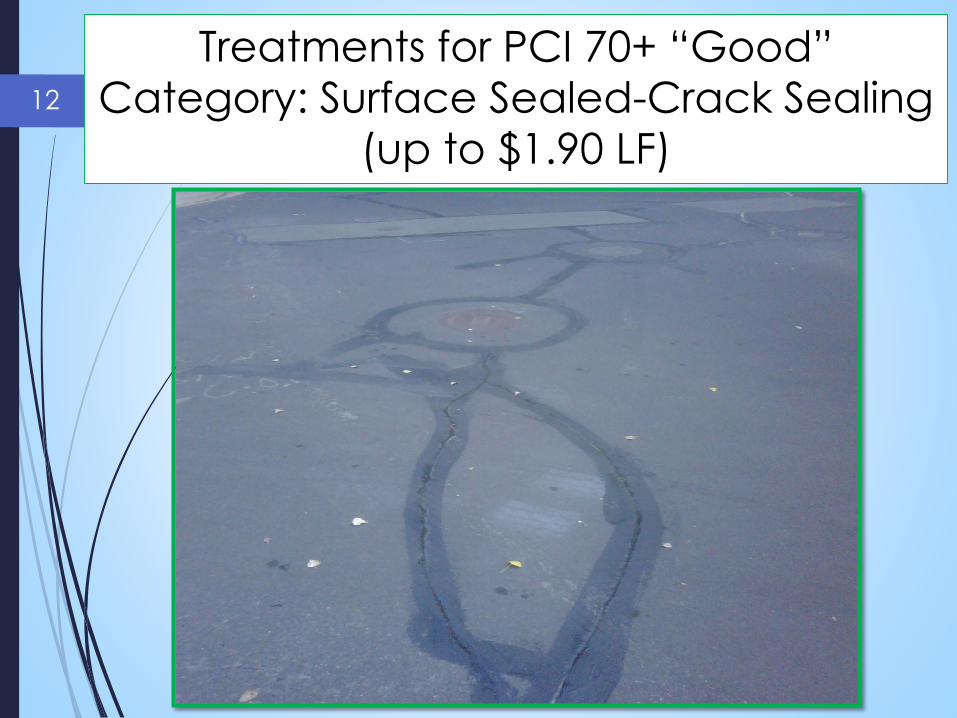
Treatments for PCI 70+ “Good”
Category: Surface Sealed-Crack Sealing
(up to $1.90 LF)
12
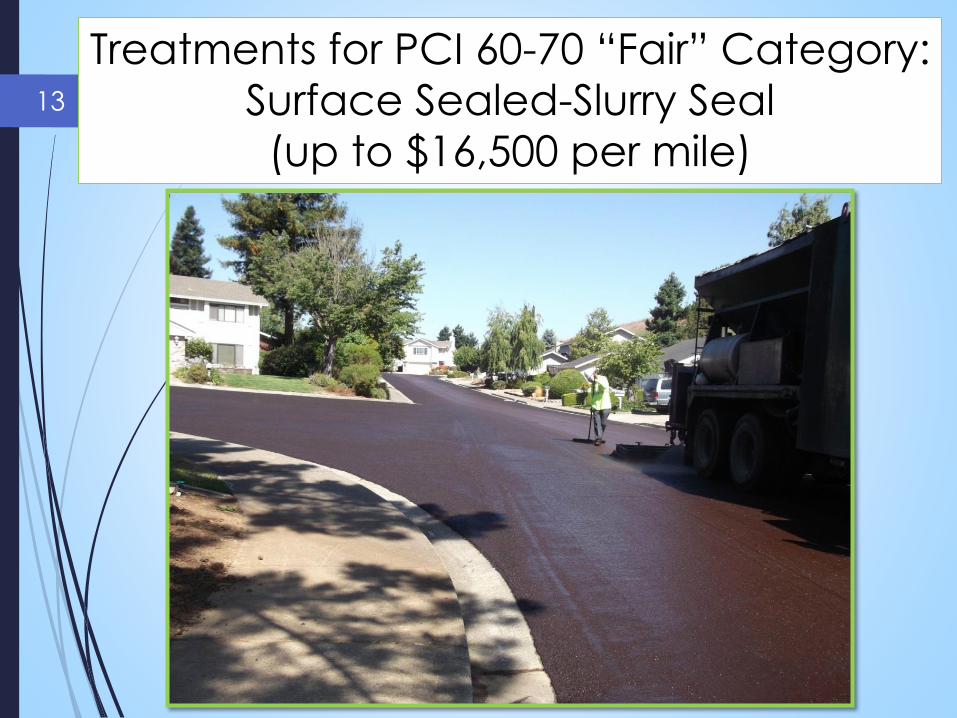
Treatments for PCI 60-70 “Fair” Category:
Surface Sealed-Slurry Seal
(up to $16,500 per mile)
13
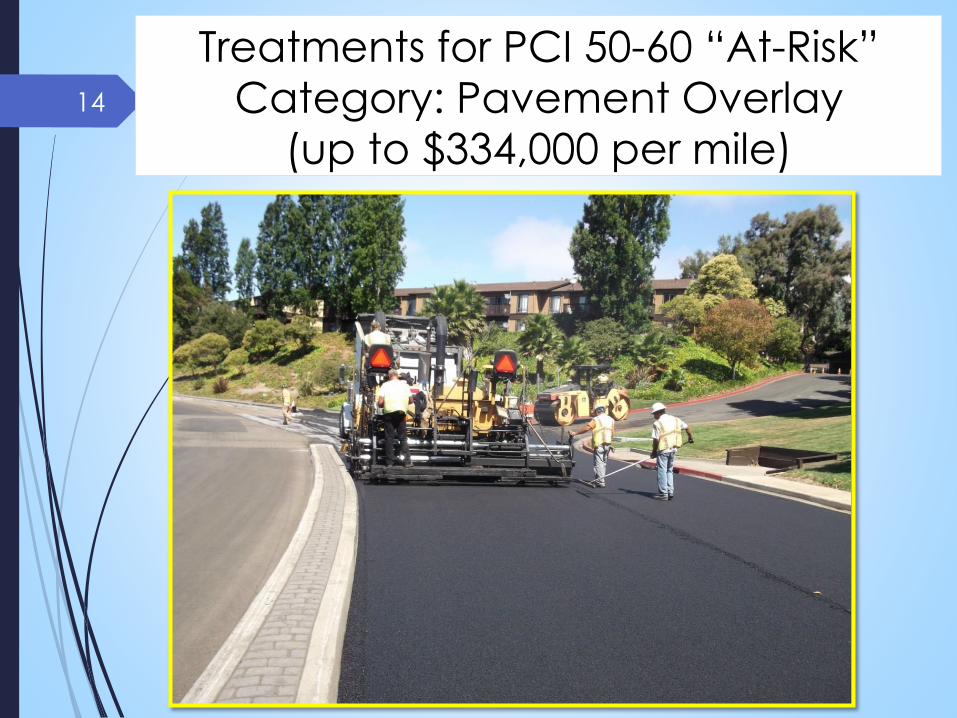
Treatments for PCI 50-60 “At-Risk”
Category: Pavement Overlay
(up to $334,000 per mile)
14
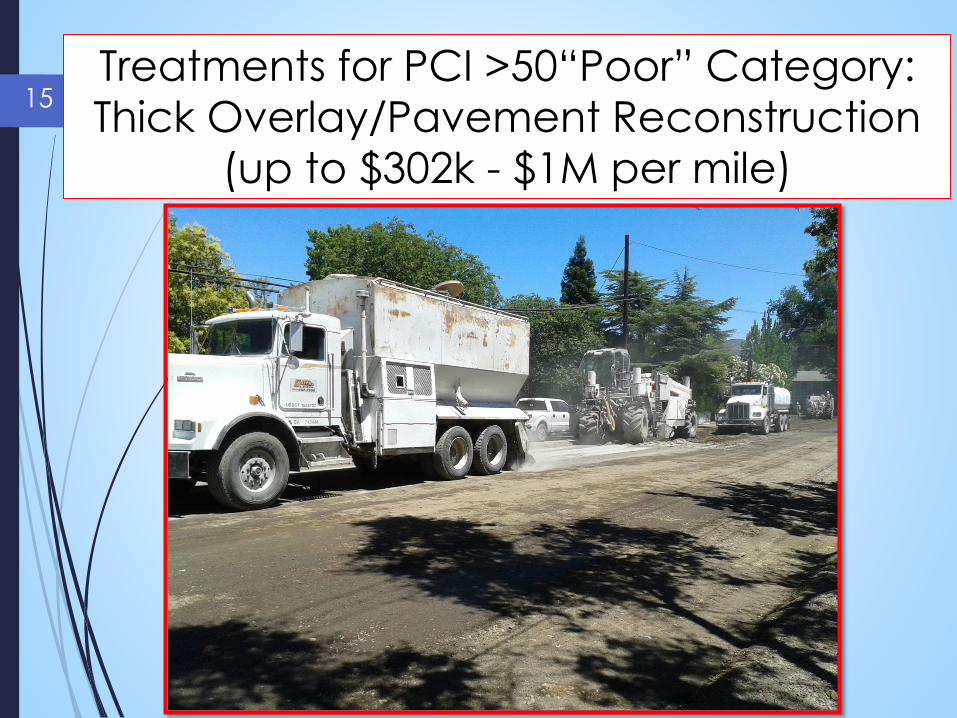
Treatments for PCI >50“Poor” Category:
Thick Overlay/Pavement Reconstruction
(up to $302k - $1M per mile)
15
Additional Cost of Poor Roads
A July 2015 study published by TRIP, a national
transportation research group, stated that poor
roads cost the average driver in the SF Bay Area
an additional $1,044 annually in repairs, increased
gas use, and tire wear.
Poor roads decrease stopping distance and ride
quality, increasing the likelihood of accidents.
Poor roads can have a negative impact on the
perception of a community and make it less likely
for businesses to relocate there.
16
Source: http://www.tripnet.org/docs/Urban_Roads_TRIP_Report_July_2015.pdf
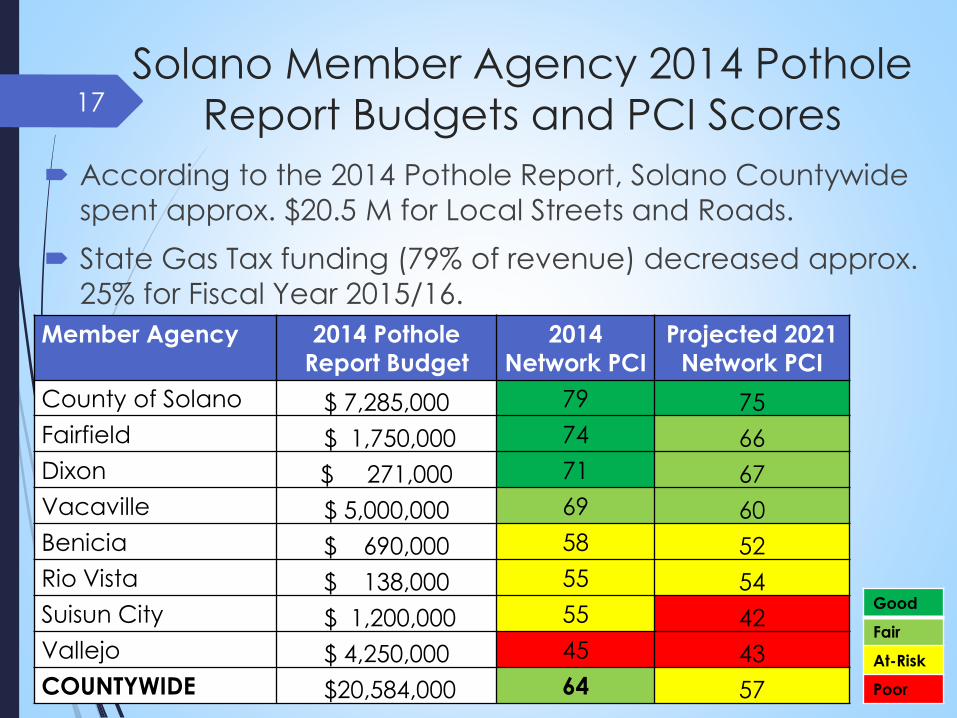
Solano Member Agency 2014 Pothole
Report Budgets and PCI Scores
According to the 2014 Pothole Report, Solano Countywide
spent approx. $20.5 M for Local Streets and Roads.
State Gas Tax funding (79% of revenue) decreased approx.
25% for Fiscal Year 2015/16.
17
Member Agency 2014 Pothole
Report Budget
2014
Network PCI
Projected 2021
Network PCI
County of Solano $ 7,285,000 79 75
Fairfield $ 1,750,000 74 66
Dixon $ 271,000 71 67
Vacaville $ 5,000,000 69 60
Benicia $ 690,000 58 52
Rio Vista $ 138,000 55 54
Suisun City $ 1,200,000 55 42
Vallejo $ 4,250,000 45 43
COUNTYWIDE $20,584,000 64 57
Good
Fair
At-Risk
Poor
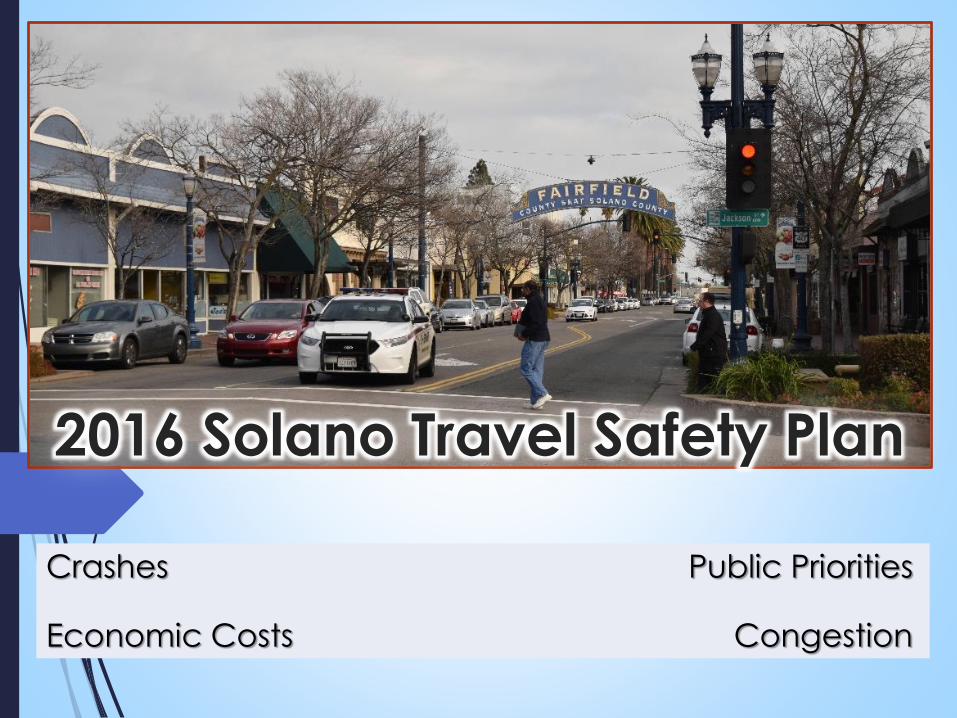
Crashes Public Priorities
Economic Costs Congestion
2016 Solano Travel Safety Plan
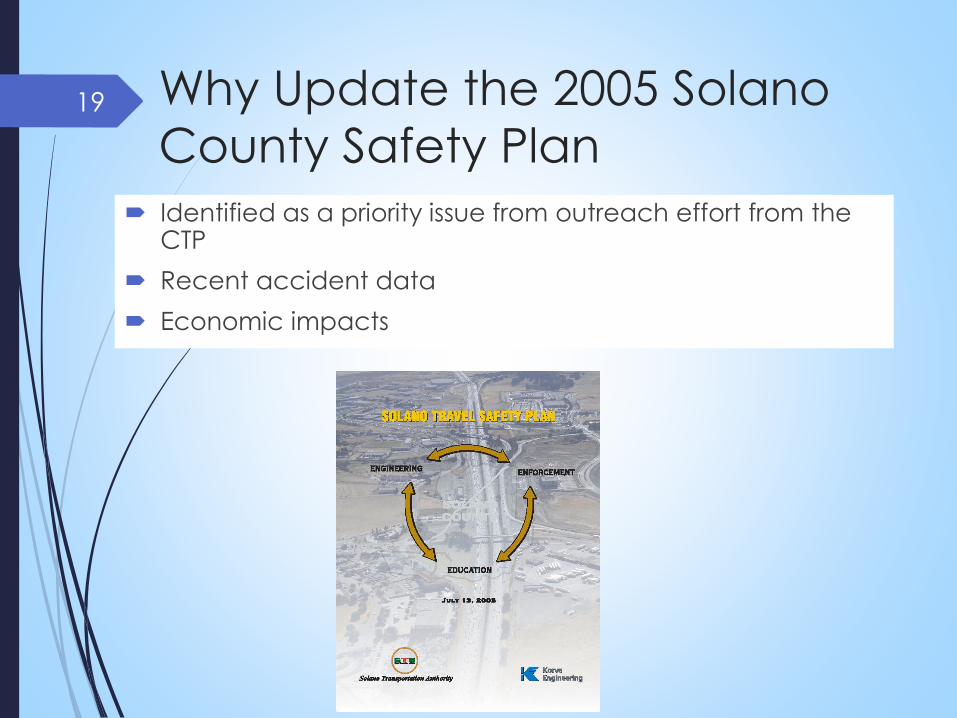
Why Update the 2005 Solano
County Safety Plan
Identified as a priority issue from outreach effort from the CTP
Recent accident data
Economic impacts
19
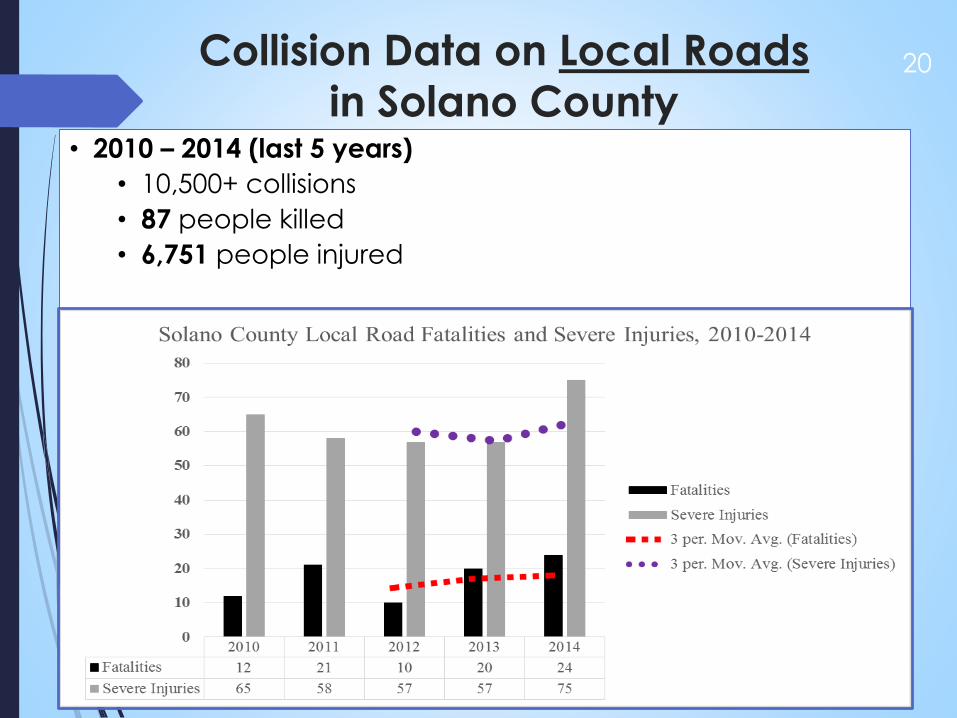
Collision Data on Local Roads
in Solano County• 2010 – 2014 (last 5 years)
• 10,500+ collisions
• 87 people killed
• 6,751 people injured
20
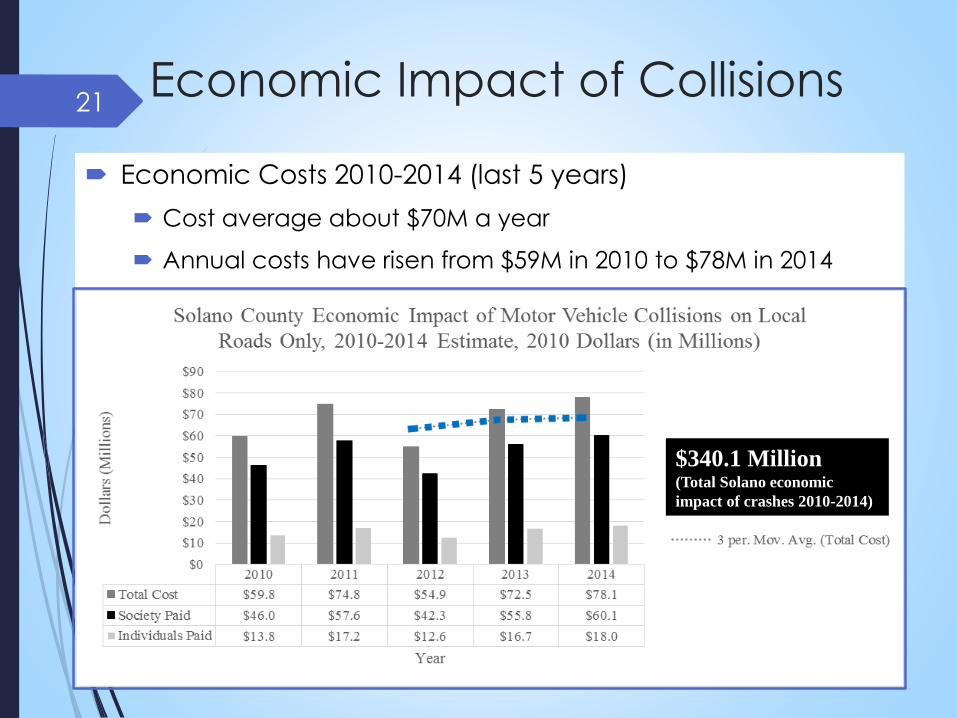
Economic Impact of Collisions
Economic Costs 2010-2014 (last 5 years)
Cost average about $70M a year
Annual costs have risen from $59M in 2010 to $78M in 2014
21
$340.1 Million(Total Solano economic
impact of crashes 2010-2014)
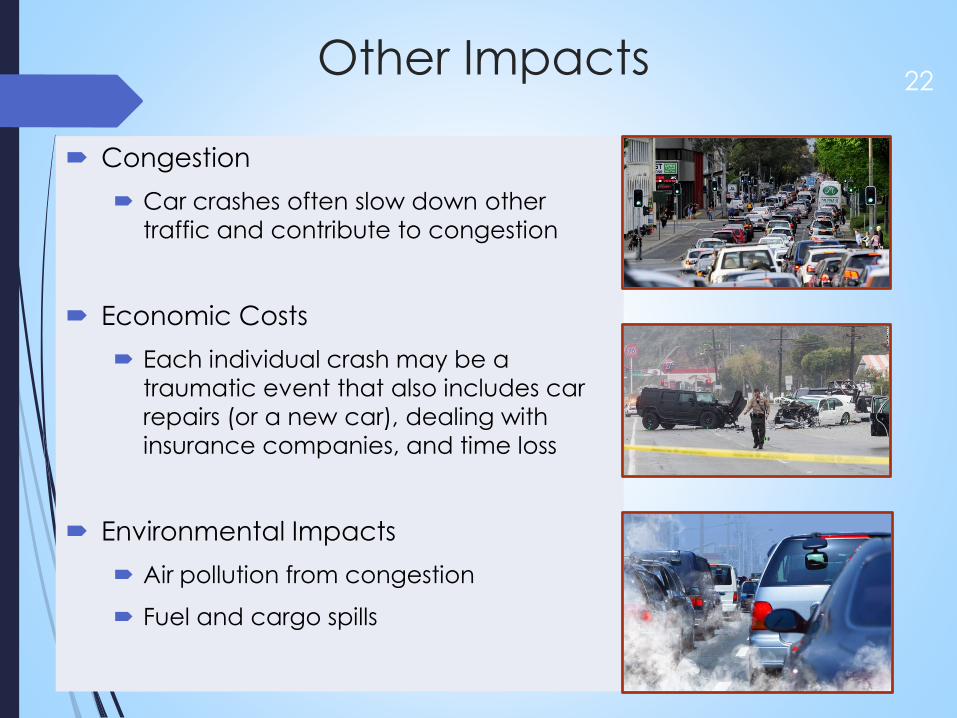
Other Impacts
Congestion
Car crashes often slow down other
traffic and contribute to congestion
Economic Costs
Each individual crash may be a
traumatic event that also includes car
repairs (or a new car), dealing with
insurance companies, and time loss
Environmental Impacts
Air pollution from congestion
Fuel and cargo spills
22
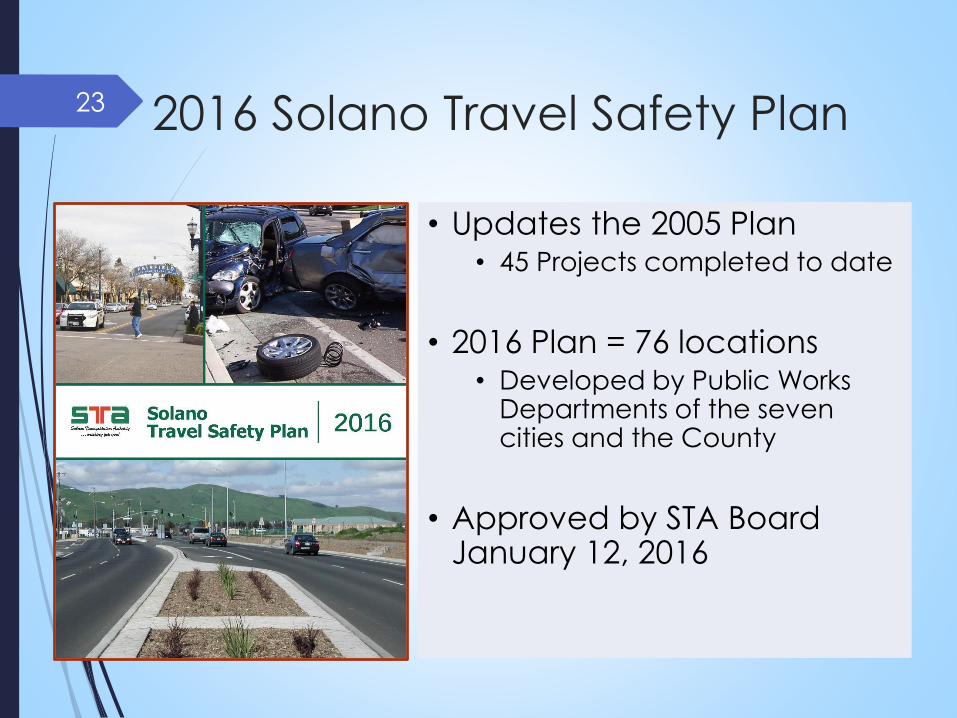
2016 Solano Travel Safety Plan
• Updates the 2005 Plan• 45 Projects completed to date
• 2016 Plan = 76 locations• Developed by Public Works
Departments of the seven cities and the County
• Approved by STA Board January 12, 2016
23
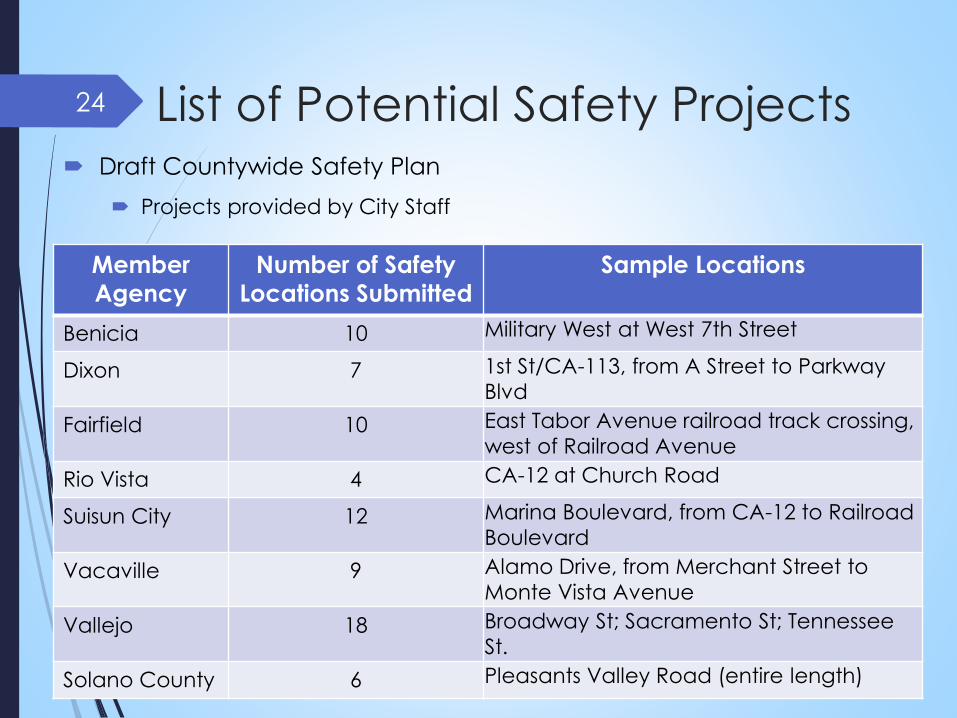
List of Potential Safety Projects Draft Countywide Safety Plan
Projects provided by City Staff
24
Member
Agency
Number of Safety
Locations Submitted
Sample Locations
Benicia 10 Military West at West 7th Street
Dixon 7 1st St/CA-113, from A Street to Parkway
Blvd
Fairfield 10 East Tabor Avenue railroad track crossing,
west of Railroad Avenue
Rio Vista 4 CA-12 at Church Road
Suisun City 12 Marina Boulevard, from CA-12 to Railroad
Boulevard
Vacaville 9 Alamo Drive, from Merchant Street to
Monte Vista Avenue
Vallejo 18 Broadway St; Sacramento St; Tennessee
St.
Solano County 6 Pleasants Valley Road (entire length)

For Seniors and Persons with Disabilities
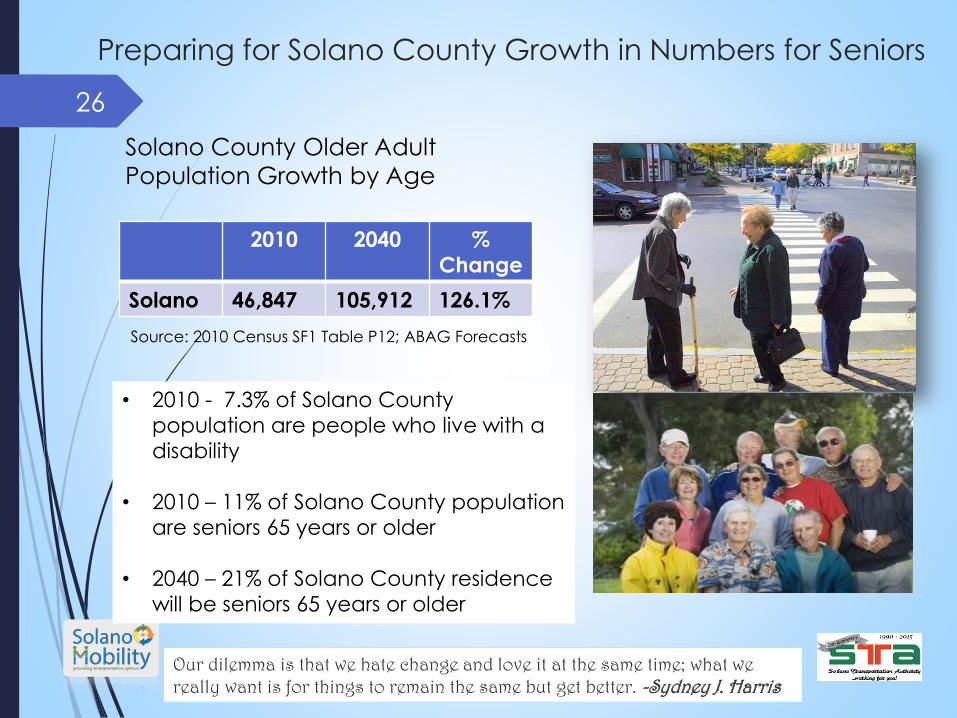
Preparing for Solano County Growth in Numbers for Seniors
26
Our dilemma is that we hate change and love it at the same time; what we really want is for things to remain the same but get better. -Sydney J. Harris
2010 2040 %
Change
Solano 46,847 105,912 126.1%
Solano County Older Adult
Population Growth by Age
Source: 2010 Census SF1 Table P12; ABAG Forecasts
• 2010 - 7.3% of Solano County
population are people who live with a
disability
• 2010 – 11% of Solano County population
are seniors 65 years or older
• 2040 – 21% of Solano County residence
will be seniors 65 years or older
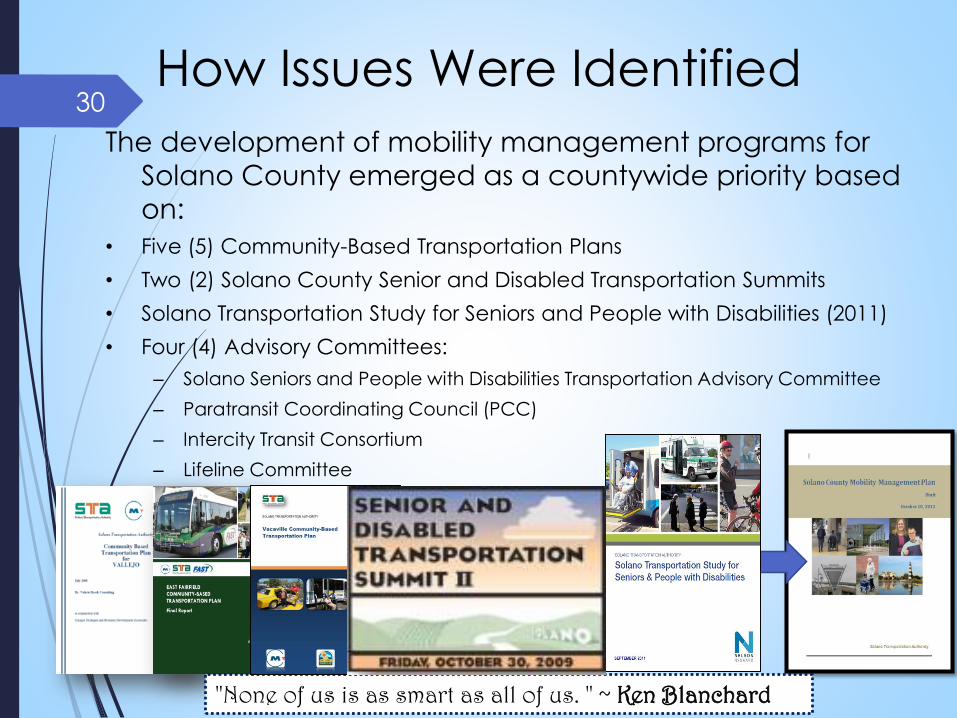
How Issues Were Identified
The development of mobility management programs for
Solano County emerged as a countywide priority based
on:
• Five (5) Community-Based Transportation Plans
• Two (2) Solano County Senior and Disabled Transportation Summits
• Solano Transportation Study for Seniors and People with Disabilities (2011)
• Four (4) Advisory Committees:
– Solano Seniors and People with Disabilities Transportation Advisory Committee
– Paratransit Coordinating Council (PCC)
– Intercity Transit Consortium
– Lifeline Committee
"None of us is as smart as all of us. " ~ Ken Blanchard
30
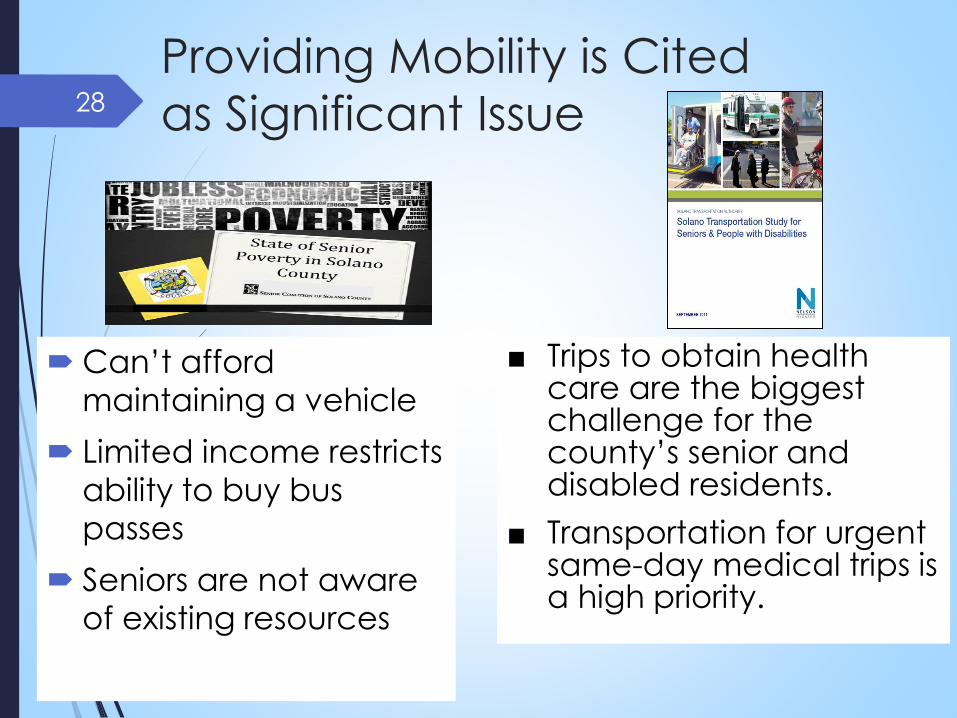
Providing Mobility is Cited
as Significant Issue
Can’t afford
maintaining a vehicle
Limited income restricts
ability to buy bus
passes
Seniors are not aware
of existing resources
28
■ Trips to obtain health care are the biggest challenge for the county’s senior and disabled residents.
■ Transportation for urgent same-day medical trips is a high priority.
29
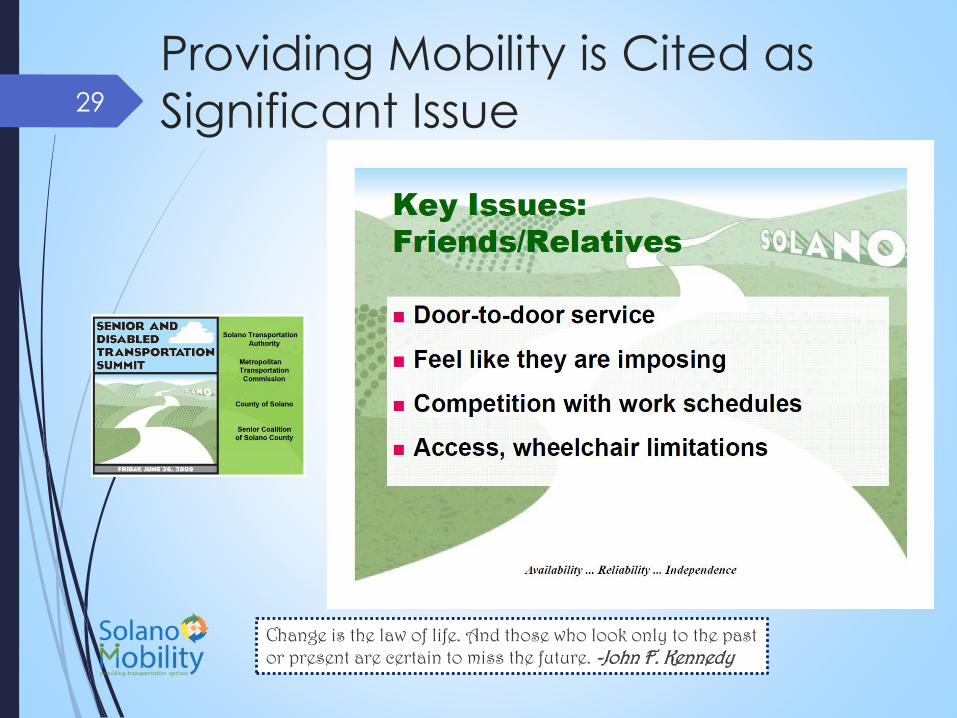
Providing Mobility is Cited as
Significant Issue
Change is the law of life. And those who look only to the past or present are certain to miss the future. -John F. Kennedy
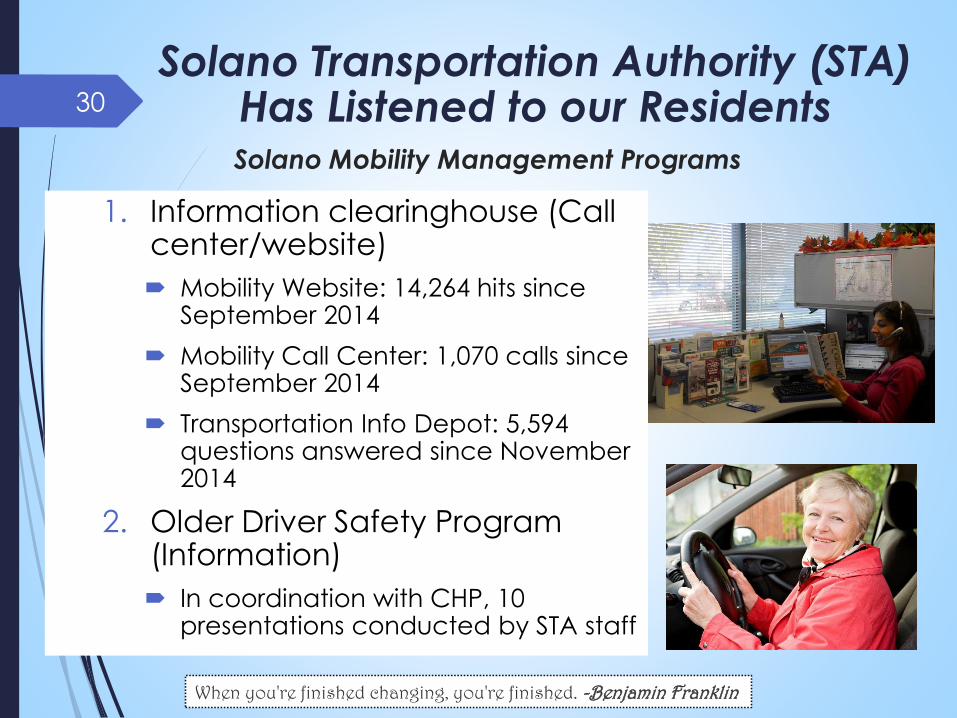
Solano Mobility Management Programs
1. Information clearinghouse (Call center/website)
Mobility Website: 14,264 hits since September 2014
Mobility Call Center: 1,070 calls since September 2014
Transportation Info Depot: 5,594 questions answered since November 2014
2. Older Driver Safety Program (Information)
In coordination with CHP, 10 presentations conducted by STA staff
30
When you're finished changing, you're finished. -Benjamin Franklin
Solano Transportation Authority (STA) Has Listened to our Residents
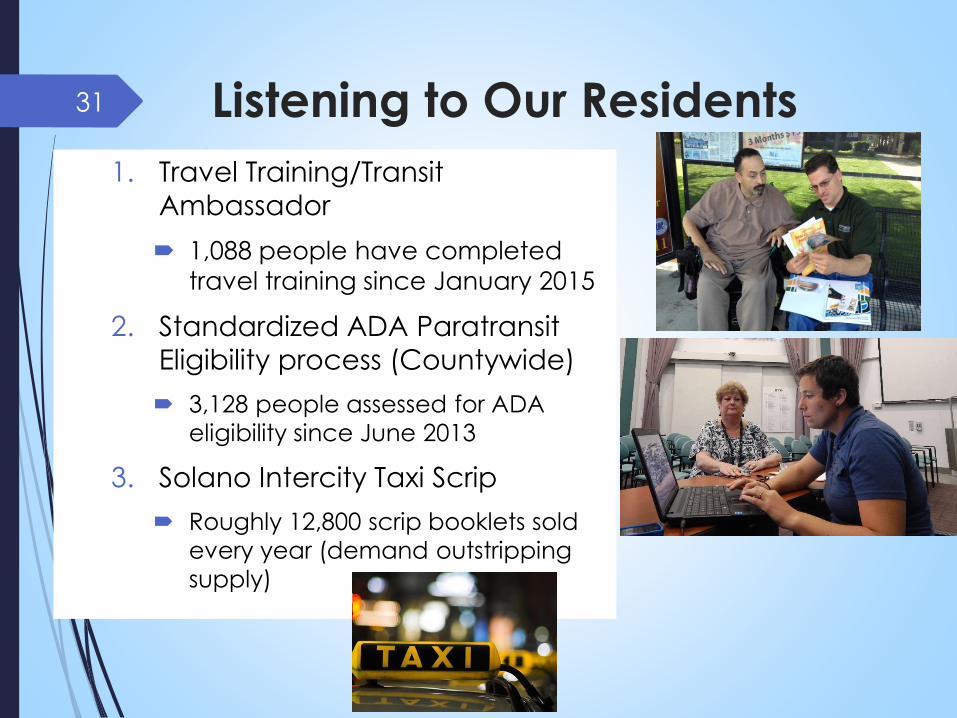
Listening to Our Residents
1. Travel Training/Transit
Ambassador
1,088 people have completed
travel training since January 2015
2. Standardized ADA Paratransit
Eligibility process (Countywide)
3,128 people assessed for ADA
eligibility since June 2013
3. Solano Intercity Taxi Scrip
Roughly 12,800 scrip booklets sold
every year (demand outstripping
supply)
31
32
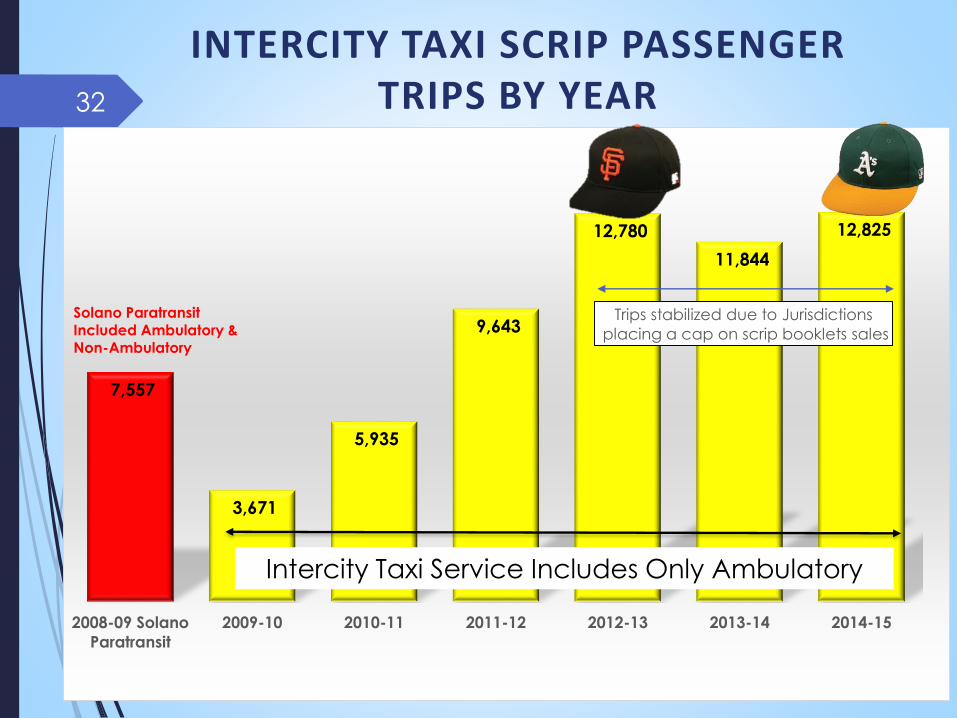
7,557
3,671
5,935
9,643
12,780
11,844
12,825
2008-09 Solano
Paratransit
2009-10 2010-11 2011-12 2012-13 2013-14 2014-15
Trips stabilized due to Jurisdictions
placing a cap on scrip booklets sales
Solano Paratransit Included Ambulatory & Non-Ambulatory
INTERCITY TAXI SCRIP PASSENGER TRIPS BY YEAR
Intercity Taxi Service Includes Only Ambulatory
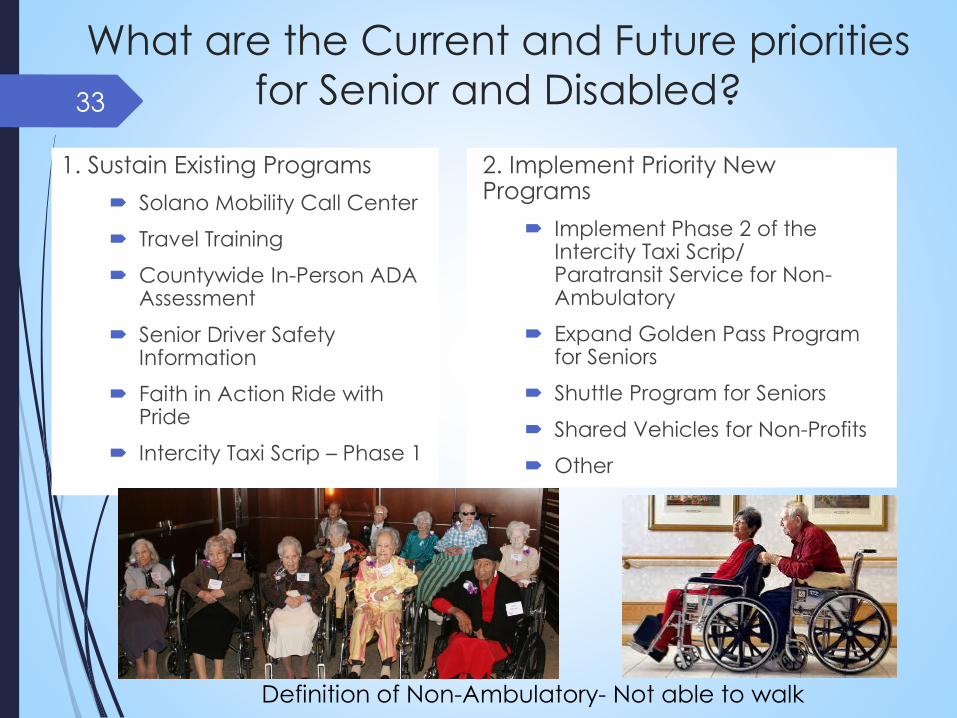
What are the Current and Future priorities
for Senior and Disabled?
1. Sustain Existing Programs
Solano Mobility Call Center
Travel Training
Countywide In-Person ADA Assessment
Senior Driver Safety Information
Faith in Action Ride with Pride
Intercity Taxi Scrip – Phase 1
2. Implement Priority New Programs
Implement Phase 2 of the Intercity Taxi Scrip/ Paratransit Service for Non-Ambulatory
Expand Golden Pass Program for Seniors
Shuttle Program for Seniors
Shared Vehicles for Non-Profits
Other
33
Definition of Non-Ambulatory- Not able to walk
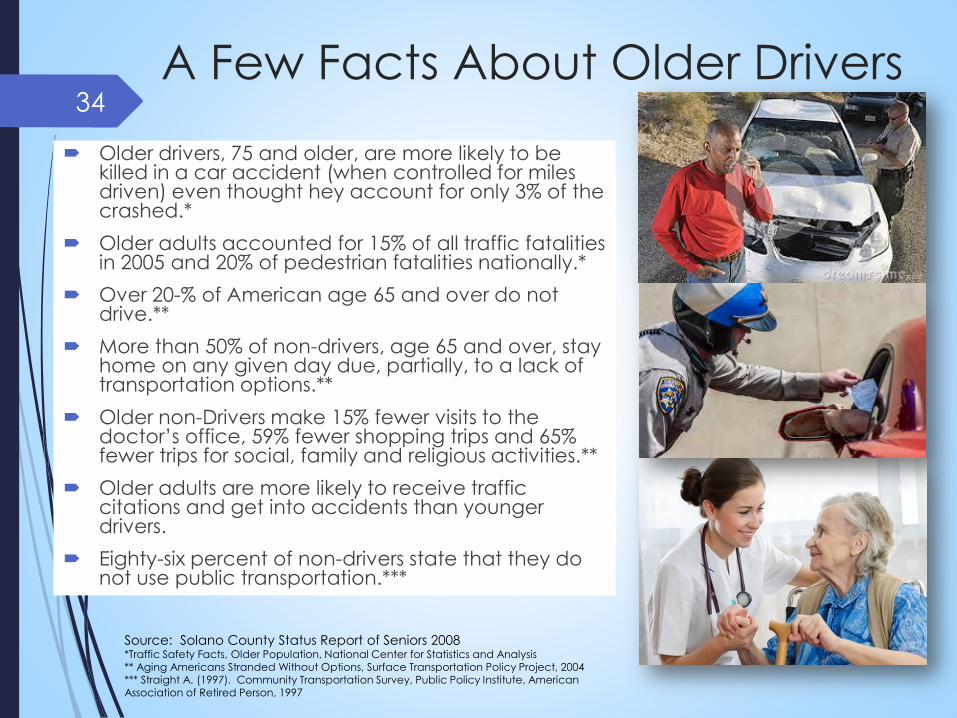
A Few Facts About Older Drivers
Older drivers, 75 and older, are more likely to be killed in a car accident (when controlled for miles driven) even thought hey account for only 3% of the crashed.*
Older adults accounted for 15% of all traffic fatalities in 2005 and 20% of pedestrian fatalities nationally.*
Over 20-% of American age 65 and over do not drive.**
More than 50% of non-drivers, age 65 and over, stay home on any given day due, partially, to a lack of transportation options.**
Older non-Drivers make 15% fewer visits to the doctor’s office, 59% fewer shopping trips and 65% fewer trips for social, family and religious activities.**
Older adults are more likely to receive traffic citations and get into accidents than younger drivers.
Eighty-six percent of non-drivers state that they do not use public transportation.***
34
Source: Solano County Status Report of Seniors 2008*Traffic Safety Facts, Older Population, National Center for Statistics and Analysis** Aging Americans Stranded Without Options, Surface Transportation Policy Project, 2004*** Straight A. (1997). Community Transportation Survey, Public Policy Institute, American Association of Retired Person, 1997
How are Solano County
Local Streets & Roads,
Safety Projects, and
Mobility Programs Funded?
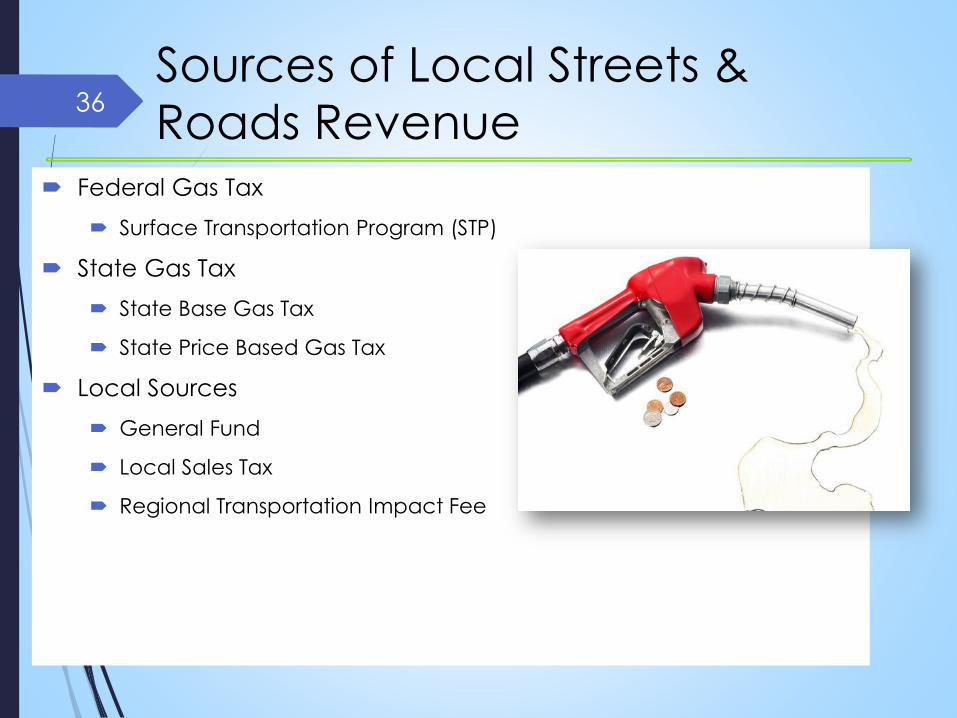
Sources of Local Streets &
Roads Revenue Federal Gas Tax
Surface Transportation Program (STP)
State Gas Tax
State Base Gas Tax
State Price Based Gas Tax
Local Sources
General Fund
Local Sales Tax
Regional Transportation Impact Fee
36
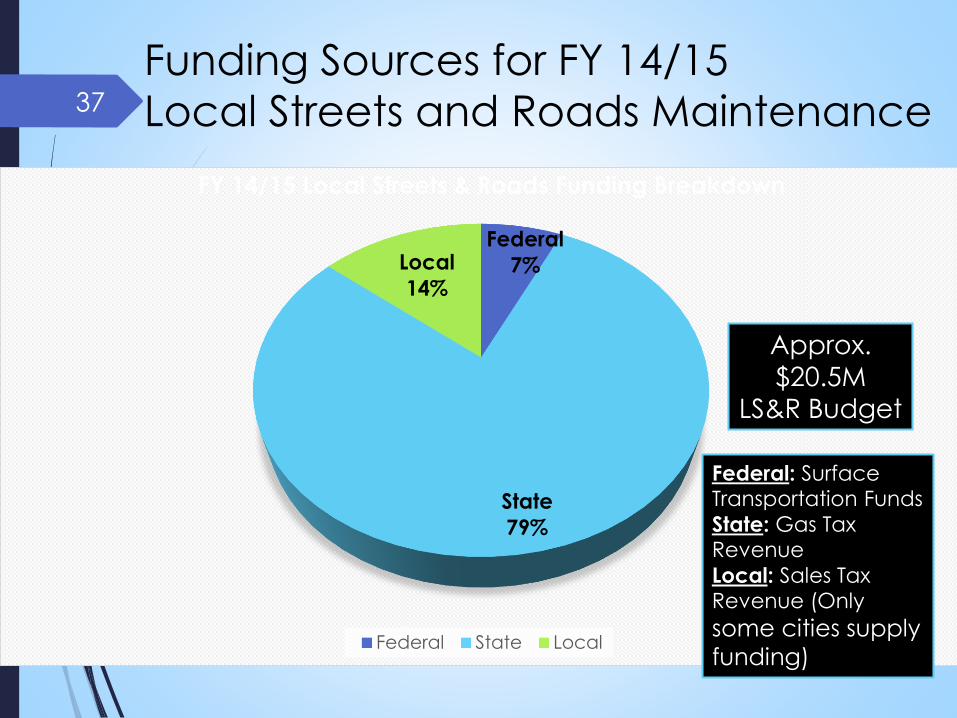
Funding Sources for FY 14/15
Local Streets and Roads Maintenance37
Federal
7%
State
79%
Local
14%
FY 14/15 Local Streets & Roads Funding Breakdown
Federal State Local
Approx.
$20.5M
LS&R Budget
Federal: Surface Transportation Funds
State: Gas Tax Revenue
Local: Sales Tax Revenue (Only
some cities supply
funding)
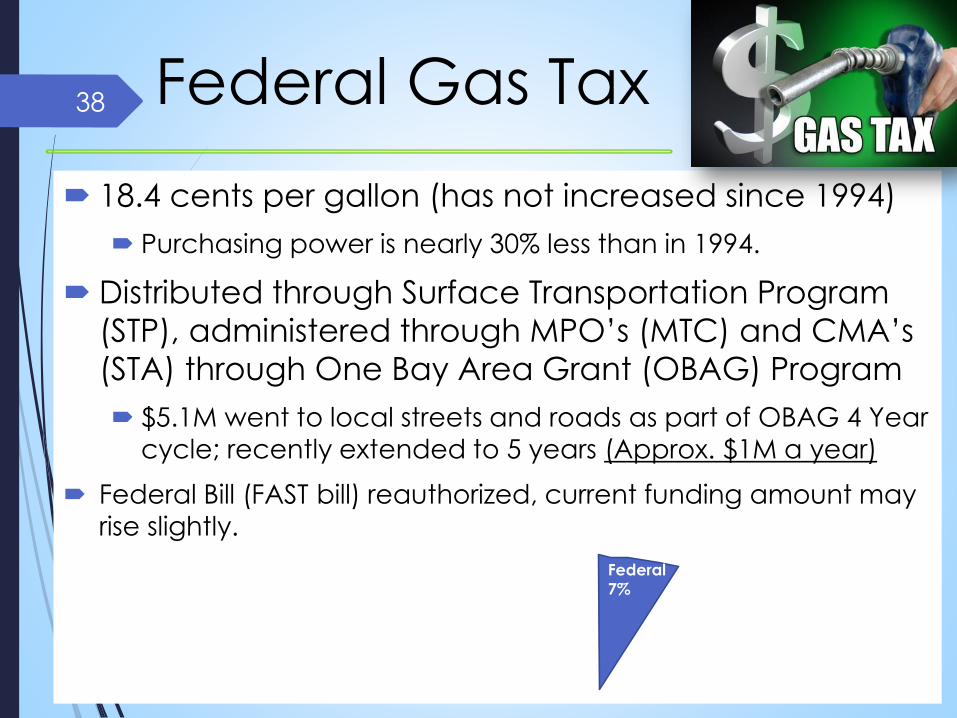
Federal Gas Tax
18.4 cents per gallon (has not increased since 1994)
Purchasing power is nearly 30% less than in 1994.
Distributed through Surface Transportation Program
(STP), administered through MPO’s (MTC) and CMA’s
(STA) through One Bay Area Grant (OBAG) Program
$5.1M went to local streets and roads as part of OBAG 4 Year
cycle; recently extended to 5 years (Approx. $1M a year)
Federal Bill (FAST bill) reauthorized, current funding amount may
rise slightly.
38
Federal
7%
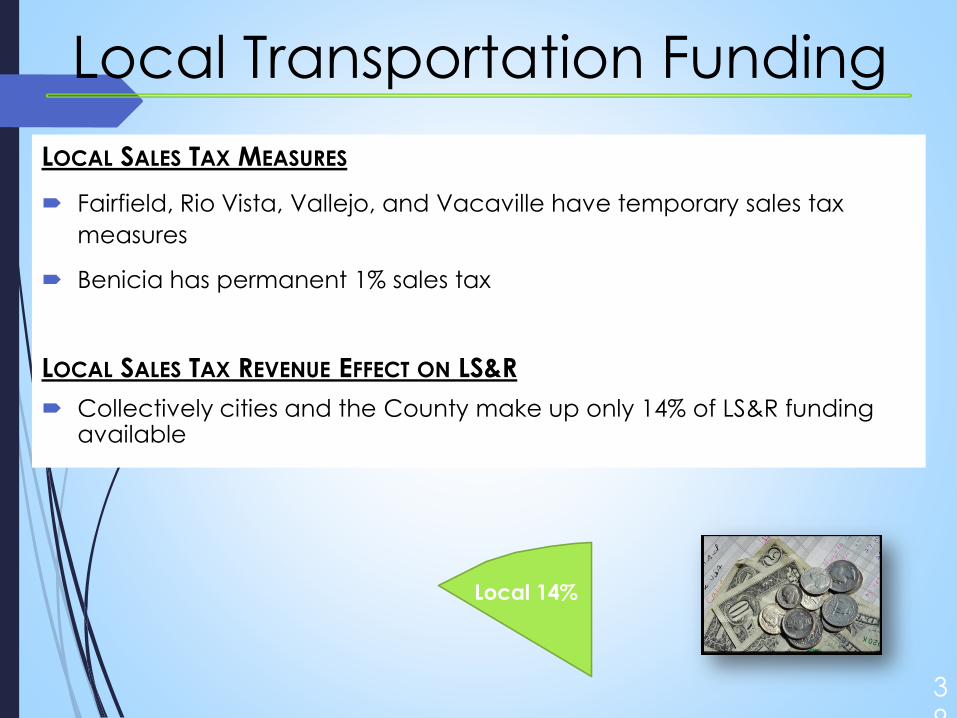
LOCAL SALES TAX MEASURES
Fairfield, Rio Vista, Vallejo, and Vacaville have temporary sales tax
measures
Benicia has permanent 1% sales tax
LOCAL SALES TAX REVENUE EFFECT ON LS&R
Collectively cities and the County make up only 14% of LS&R funding available
3
9
Local Transportation Funding
Local 14%
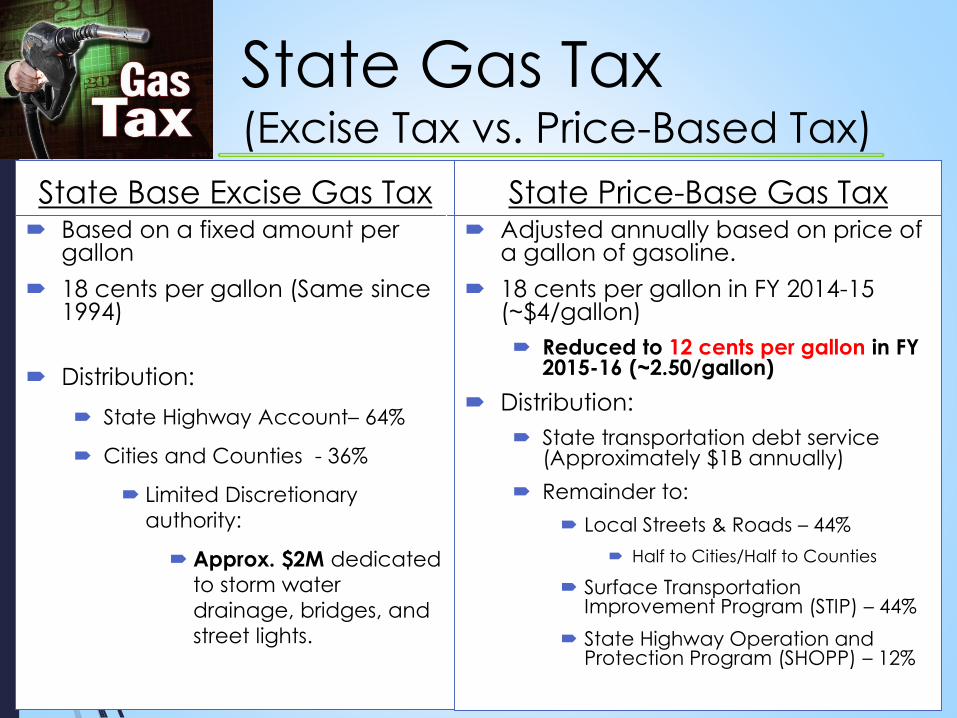
State Gas Tax (Excise Tax vs. Price-Based Tax)
State Base Excise Gas Tax Based on a fixed amount per
gallon
18 cents per gallon (Same since 1994)
Distribution:
State Highway Account– 64%
Cities and Counties - 36%
Limited Discretionary
authority:
Approx. $2M dedicated
to storm water
drainage, bridges, and
street lights.
State Price-Base Gas Tax Adjusted annually based on price of
a gallon of gasoline.
18 cents per gallon in FY 2014-15 (~$4/gallon)
Reduced to 12 cents per gallon in FY 2015-16 (~2.50/gallon)
Distribution:
State transportation debt service (Approximately $1B annually)
Remainder to:
Local Streets & Roads – 44%
Half to Cities/Half to Counties
Surface Transportation Improvement Program (STIP) – 44%
State Highway Operation and Protection Program (SHOPP) – 12%
40
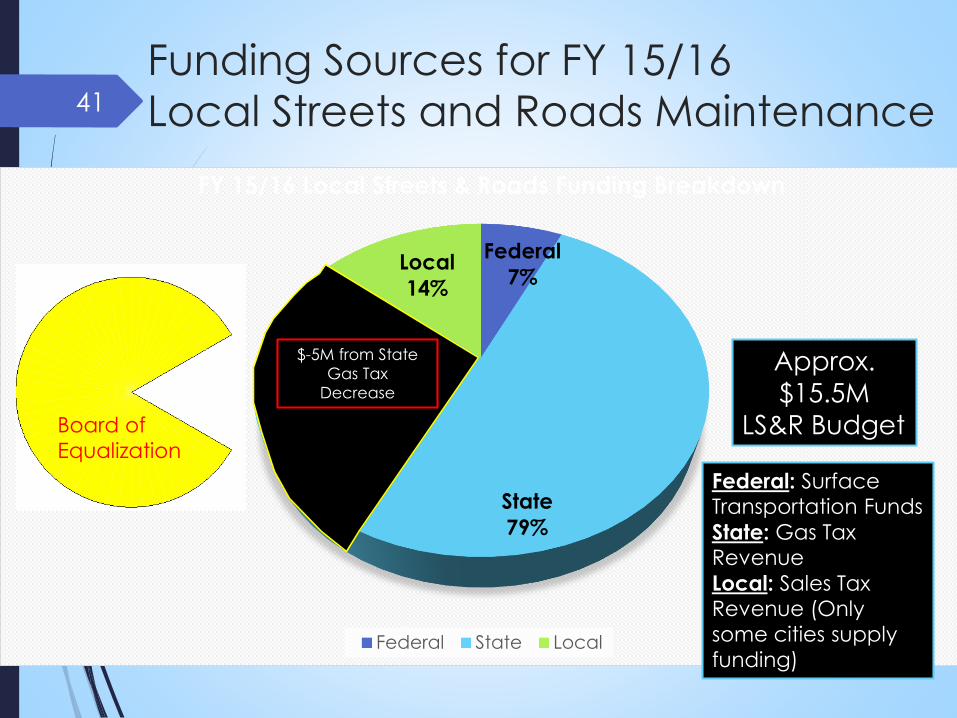
Funding Sources for FY 15/16
Local Streets and Roads Maintenance41
Federal
7%
State
79%
Local
14%
FY 15/16 Local Streets & Roads Funding Breakdown
Federal State Local
Approx.
$15.5M
LS&R Budget
Federal: Surface Transportation Funds
State: Gas Tax Revenue
Local: Sales Tax Revenue (Only
some cities supply
funding)
Board of
Equalization
$-5M from State
Gas Tax
Decrease
42
-
2,000,000
4,000,000
6,000,000
8,000,000
10,000,000
Benicia Dixon Fairfield Rio Vista Solano
County
Suisun City Vacaville Vallejo
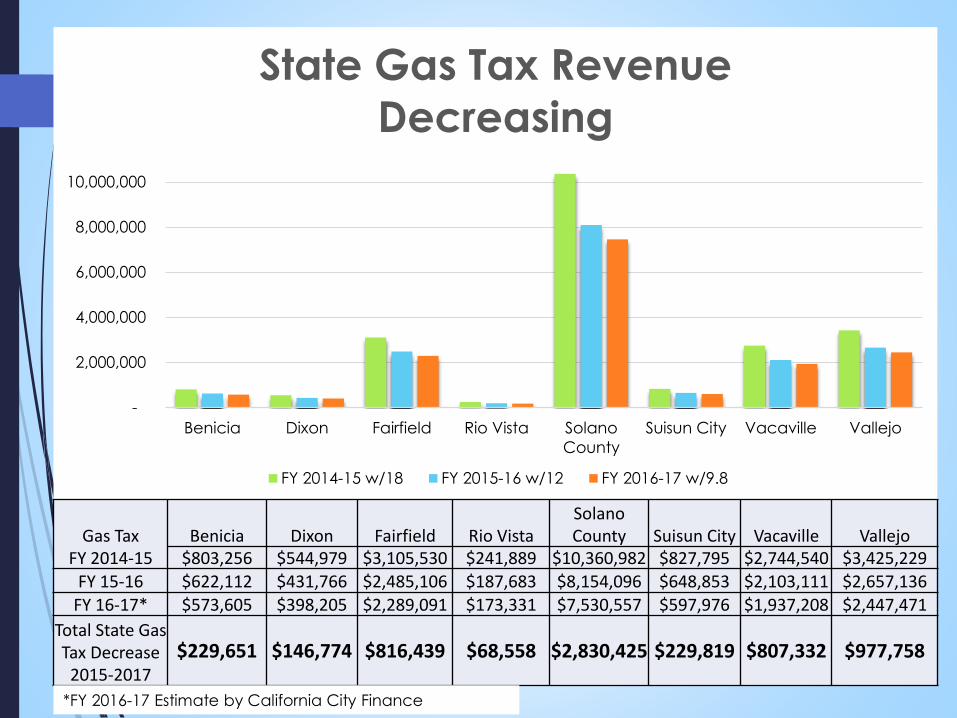
State Gas Tax Revenue
Decreasing
FY 2014-15 w/18 FY 2015-16 w/12 FY 2016-17 w/9.8
Gas Tax FY 2014-15
Benicia Dixon Fairfield Rio VistaSolano County Suisun City Vacaville Vallejo
$803,256 $544,979 $3,105,530 $241,889 $10,360,982 $827,795 $2,744,540 $3,425,229FY 15-16 $622,112 $431,766 $2,485,106 $187,683 $8,154,096 $648,853 $2,103,111 $2,657,136
FY 16-17* $573,605 $398,205 $2,289,091 $173,331 $7,530,557 $597,976 $1,937,208 $2,447,471
Total State Gas Tax Decrease
2015-2017$229,651 $146,774 $816,439 $68,558 $2,830,425 $229,819 $807,332 $977,758
*FY 2016-17 Estimate by California City Finance
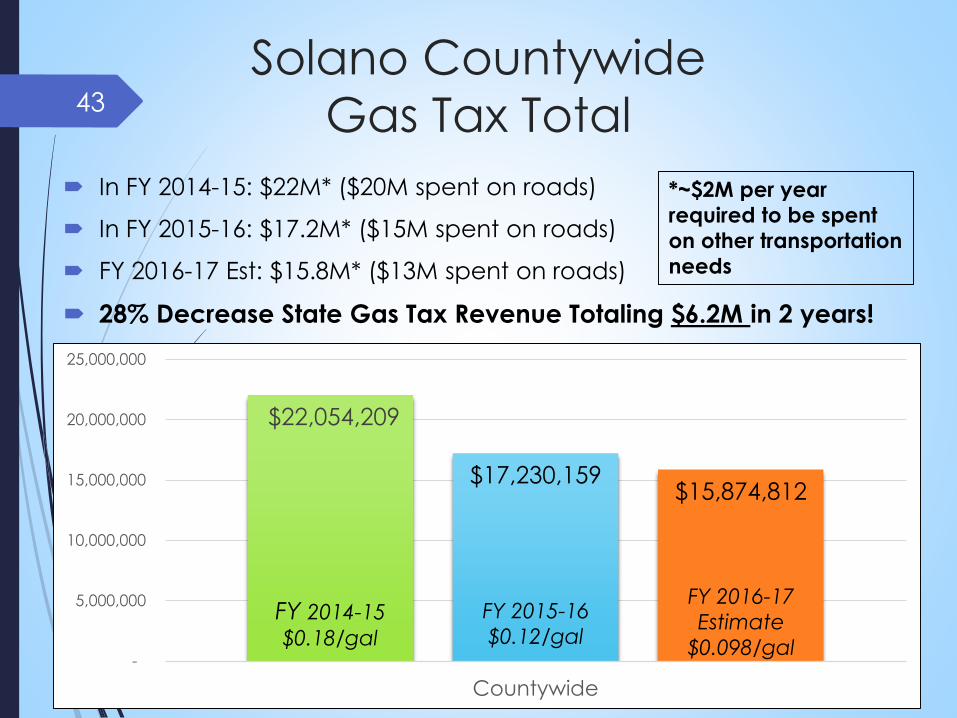
Solano Countywide
Gas Tax Total
In FY 2014-15: $22M* ($20M spent on roads)
In FY 2015-16: $17.2M* ($15M spent on roads)
FY 2016-17 Est: $15.8M* ($13M spent on roads)
28% Decrease State Gas Tax Revenue Totaling $6.2M in 2 years!
43
$22,054,209
$17,230,159$15,874,812
-
5,000,000
10,000,000
15,000,000
20,000,000
25,000,000
Countywide
FY 2014-15
$0.18/gal
FY 2015-16
$0.12/gal
FY 2016-17
Estimate
$0.098/gal
*~$2M per year
required to be spent
on other transportation
needs
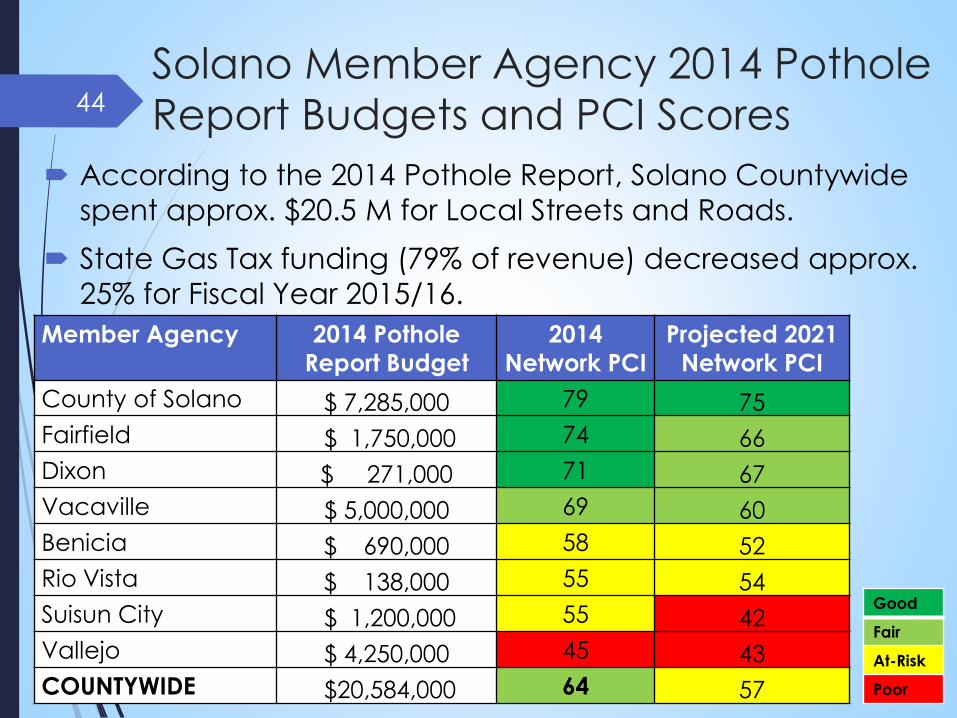
Solano Member Agency 2014 Pothole
Report Budgets and PCI Scores
According to the 2014 Pothole Report, Solano Countywide
spent approx. $20.5 M for Local Streets and Roads.
State Gas Tax funding (79% of revenue) decreased approx.
25% for Fiscal Year 2015/16.
44
Member Agency 2014 Pothole
Report Budget
2014
Network PCI
Projected 2021
Network PCI
County of Solano $ 7,285,000 79 75
Fairfield $ 1,750,000 74 66
Dixon $ 271,000 71 67
Vacaville $ 5,000,000 69 60
Benicia $ 690,000 58 52
Rio Vista $ 138,000 55 54
Suisun City $ 1,200,000 55 42
Vallejo $ 4,250,000 45 43
COUNTYWIDE $20,584,000 64 57
Good
Fair
At-Risk
Poor
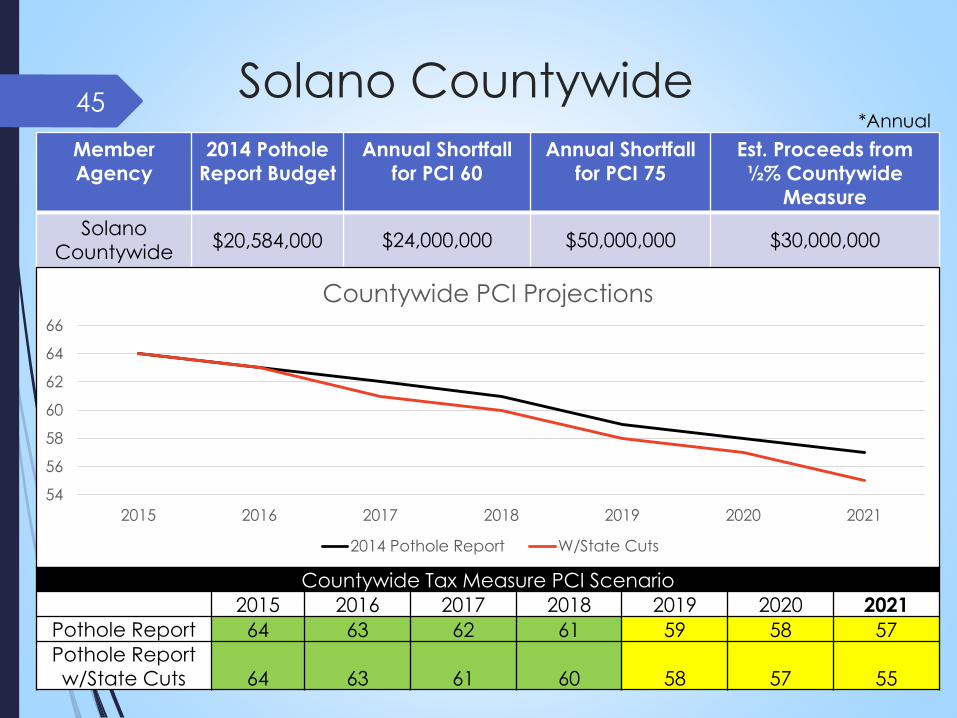
Solano Countywide45
Member
Agency
2014 Pothole
Report Budget
Annual Shortfall
for PCI 60
Annual Shortfall
for PCI 75
Est. Proceeds from
½% Countywide
Measure
Solano
Countywide$20,584,000 $24,000,000 $50,000,000 $30,000,000
*Annual
54
56
58
60
62
64
66
2015 2016 2017 2018 2019 2020 2021
Countywide PCI Projections
2014 Pothole Report W/State Cuts
Countywide Tax Measure PCI Scenario
2015 2016 2017 2018 2019 2020 2021
Pothole Report 64 63 62 61 59 58 57
Pothole Report
w/State Cuts 64 63 61 60 58 57 55
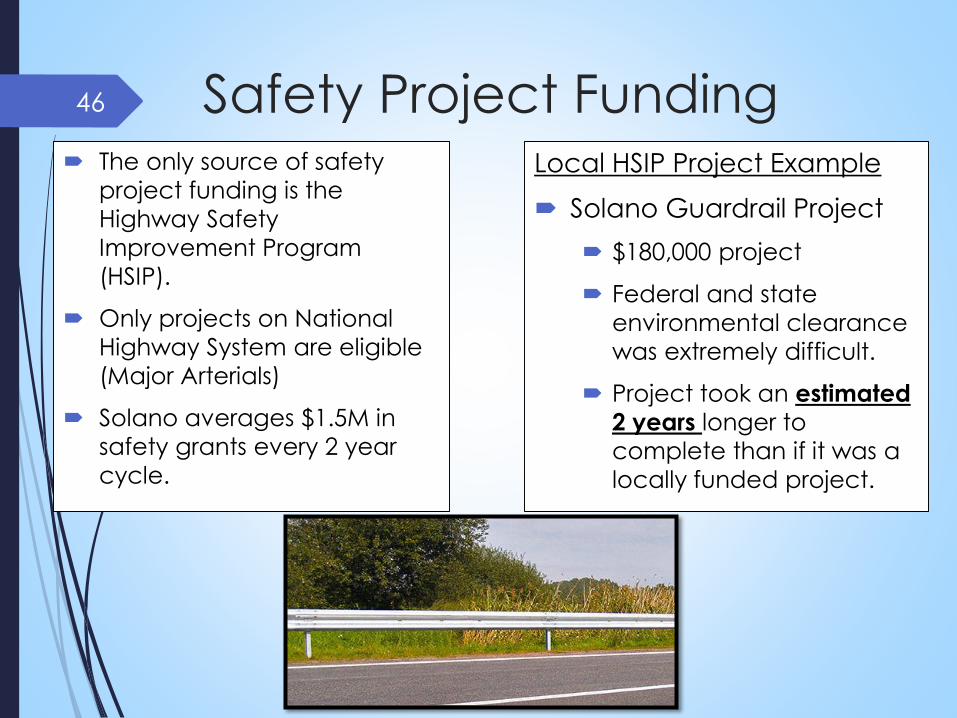
Safety Project Funding The only source of safety
project funding is the
Highway Safety
Improvement Program
(HSIP).
Only projects on National
Highway System are eligible
(Major Arterials)
Solano averages $1.5M in
safety grants every 2 year
cycle.
Local HSIP Project Example
Solano Guardrail Project
$180,000 project
Federal and state
environmental clearance
was extremely difficult.
Project took an estimated
2 years longer to
complete than if it was a
locally funded project.
46
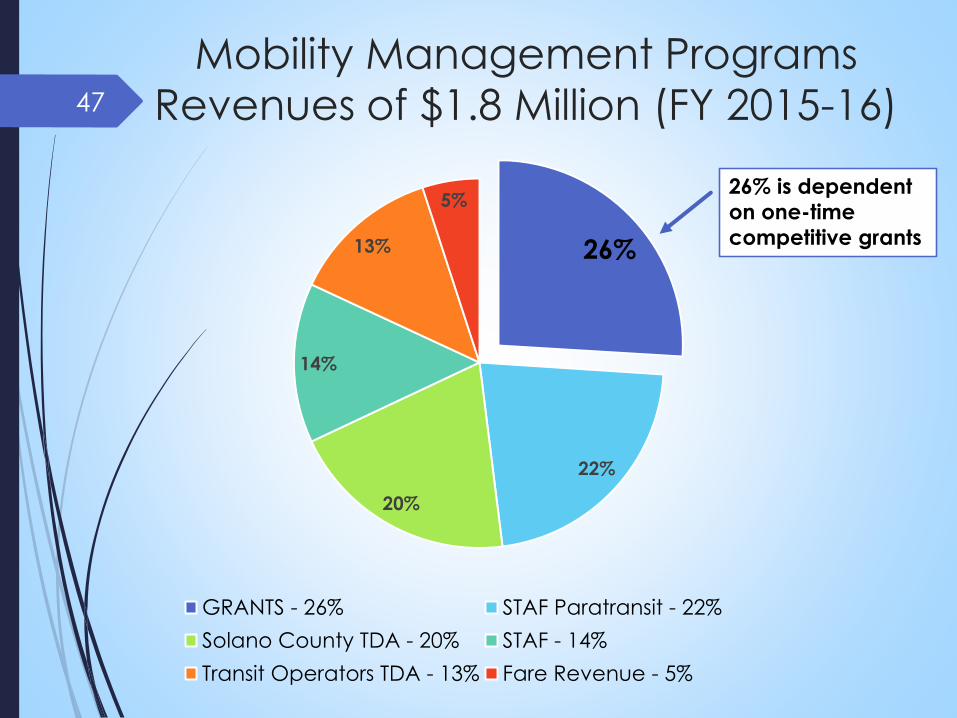
Mobility Management Programs
Revenues of $1.8 Million (FY 2015-16)
26%
22%
20%
14%
13%
5%
GRANTS - 26% STAF Paratransit - 22%
Solano County TDA - 20% STAF - 14%
Transit Operators TDA - 13% Fare Revenue - 5%
26% is dependent
on one-time
competitive grants
47
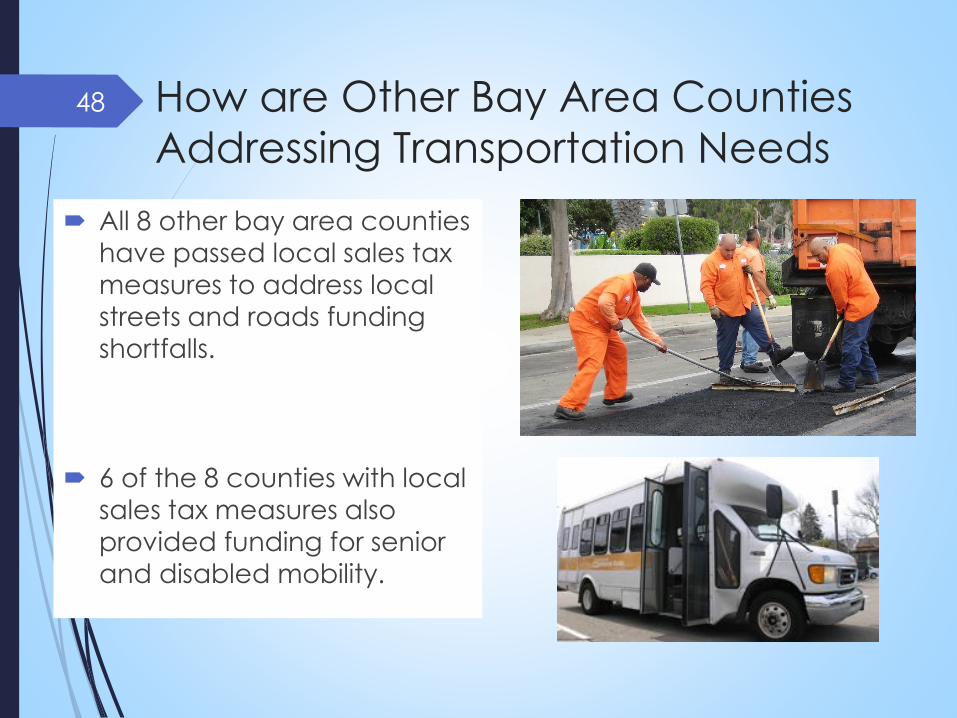
How are Other Bay Area Counties
Addressing Transportation Needs
All 8 other bay area counties
have passed local sales tax
measures to address local
streets and roads funding
shortfalls.
6 of the 8 counties with local
sales tax measures also
provided funding for senior
and disabled mobility.
48
49
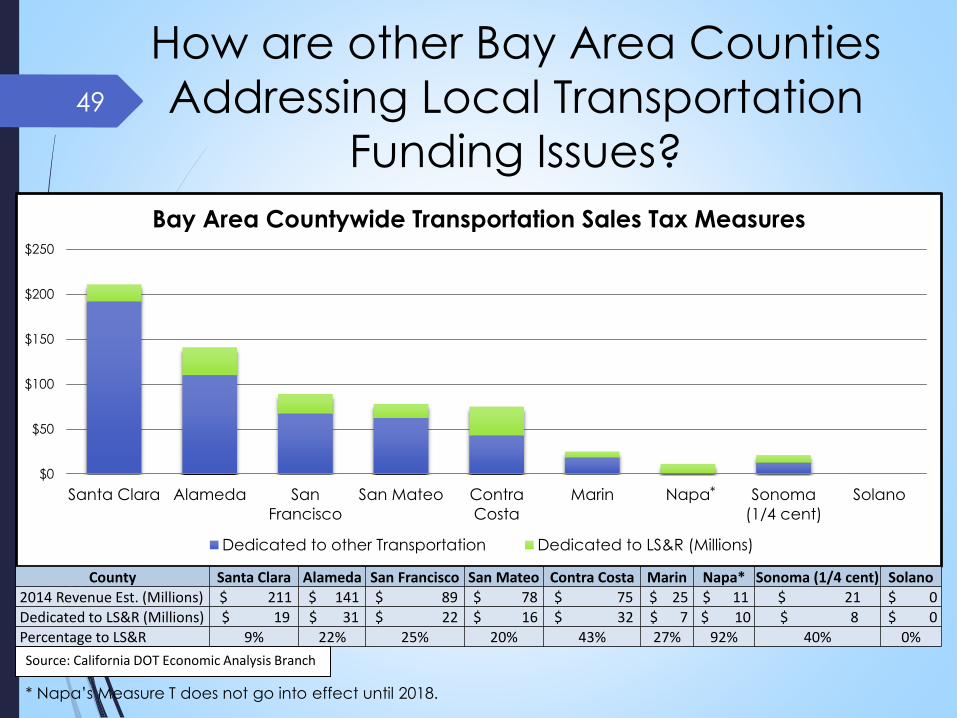
How are other Bay Area Counties
Addressing Local Transportation
Funding Issues?
Source: California DOT Economic Analysis Branch
$0
$50
$100
$150
$200
$250
Santa Clara Alameda San
Francisco
San Mateo Contra
Costa
Marin Napa Sonoma
(1/4 cent)
Solano
Bay Area Countywide Transportation Sales Tax Measures
Dedicated to other Transportation Dedicated to LS&R (Millions)
County Santa Clara Alameda San Francisco San Mateo Contra Costa Marin Napa* Sonoma (1/4 cent) Solano2014 Revenue Est. (Millions) $ 211 $ 141 $ 89 $ 78 $ 75 $ 25 $ 11 $ 21 $ 0 Dedicated to LS&R (Millions) $ 19 $ 31 $ 22 $ 16 $ 32 $ 7 $ 10 $ 8 $ 0 Percentage to LS&R 9% 22% 25% 20% 43% 27% 92% 40% 0%
*
* Napa’s Measure T does not go into effect until 2018.
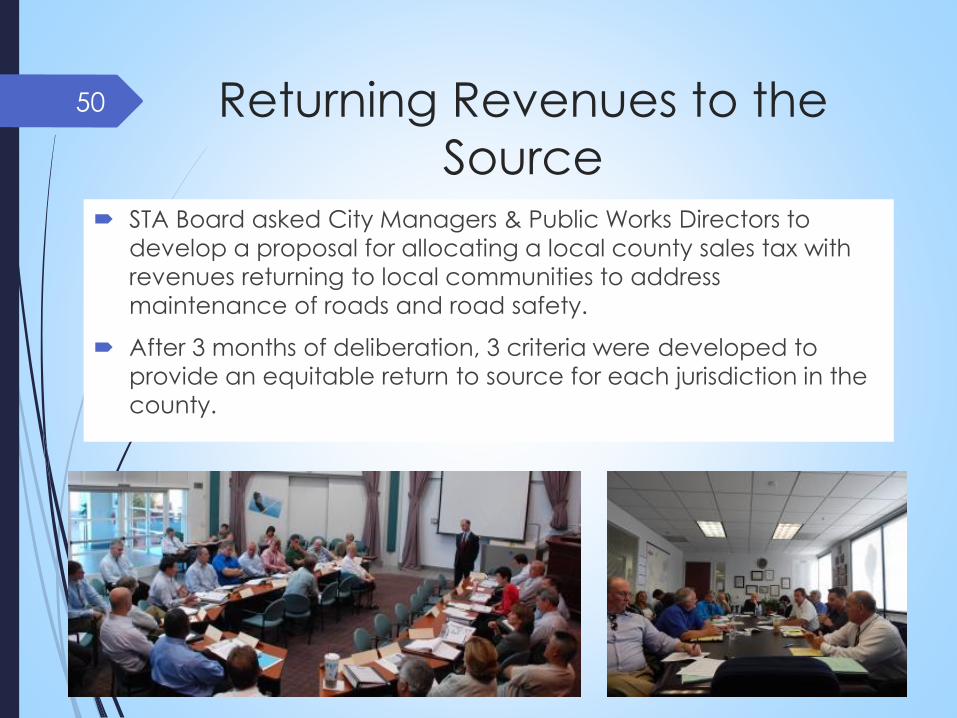
Returning Revenues to the
Source STA Board asked City Managers & Public Works Directors to
develop a proposal for allocating a local county sales tax with
revenues returning to local communities to address
maintenance of roads and road safety.
After 3 months of deliberation, 3 criteria were developed to
provide an equitable return to source for each jurisdiction in the
county.
50
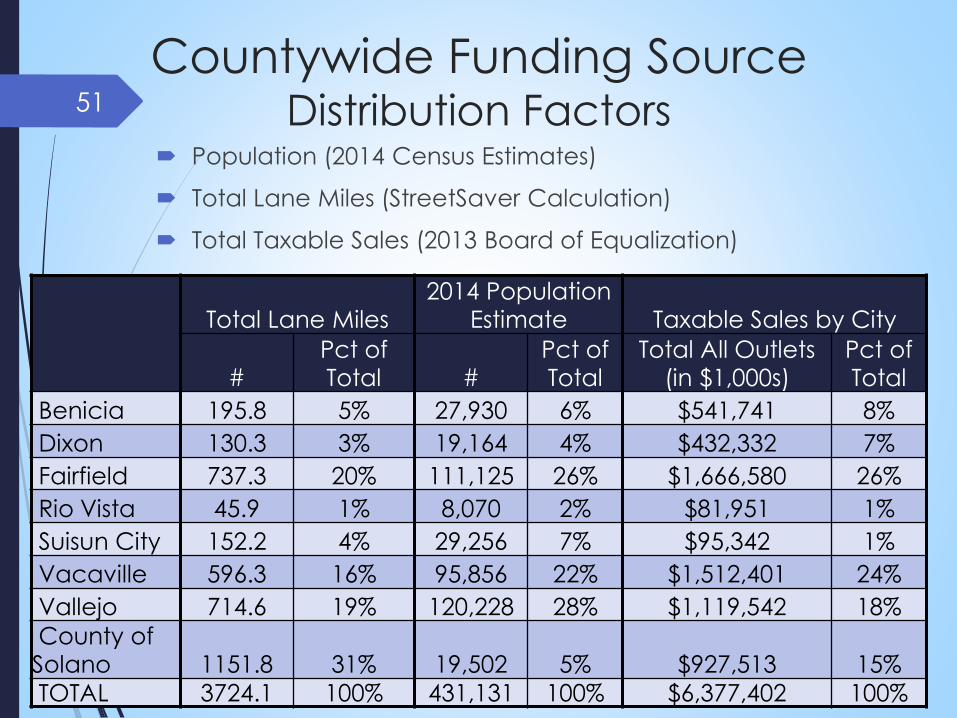
Countywide Funding Source Distribution Factors
Population (2014 Census Estimates)
Total Lane Miles (StreetSaver Calculation)
Total Taxable Sales (2013 Board of Equalization)
51
Total Lane Miles2014 Population
Estimate Taxable Sales by City
#Pct of Total #
Pct of Total
Total All Outlets (in $1,000s)
Pct of Total
Benicia 195.8 5% 27,930 6% $541,741 8%
Dixon 130.3 3% 19,164 4% $432,332 7%
Fairfield 737.3 20% 111,125 26% $1,666,580 26%
Rio Vista 45.9 1% 8,070 2% $81,951 1%
Suisun City 152.2 4% 29,256 7% $95,342 1%
Vacaville 596.3 16% 95,856 22% $1,512,401 24%
Vallejo 714.6 19% 120,228 28% $1,119,542 18%
County of Solano 1151.8 31% 19,502 5% $927,513 15%
TOTAL 3724.1 100% 431,131 100% $6,377,402 100%
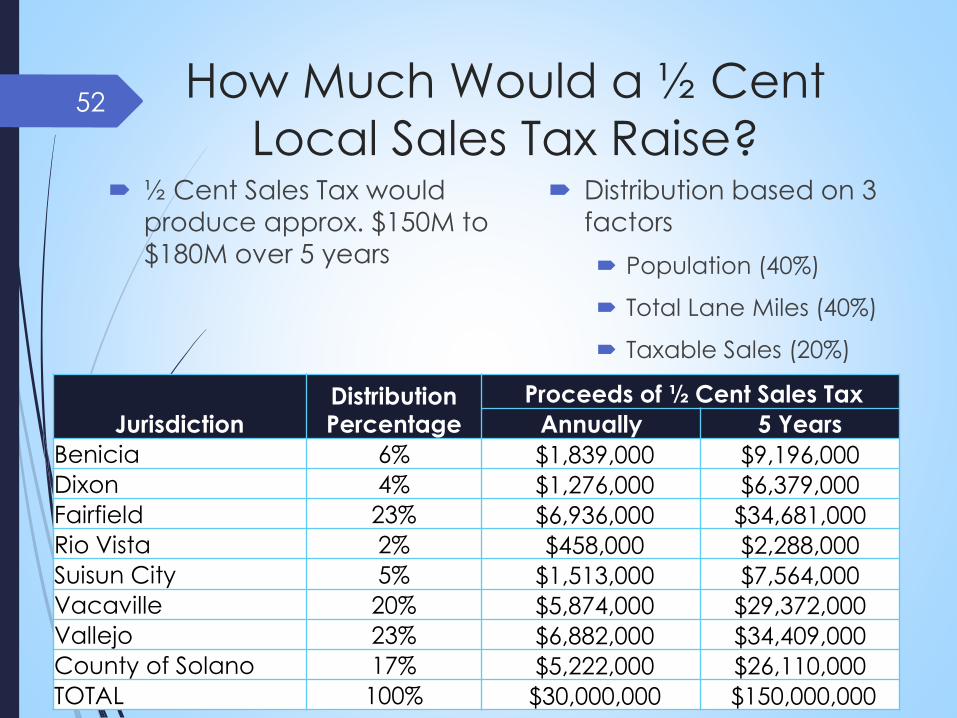
How Much Would a ½ Cent
Local Sales Tax Raise? ½ Cent Sales Tax would
produce approx. $150M to
$180M over 5 years
Distribution based on 3
factors
Population (40%)
Total Lane Miles (40%)
Taxable Sales (20%)
52
JurisdictionDistribution Percentage
Proceeds of ½ Cent Sales Tax
Annually 5 Years
Benicia 6% $1,839,000 $9,196,000
Dixon 4% $1,276,000 $6,379,000
Fairfield 23% $6,936,000 $34,681,000
Rio Vista 2% $458,000 $2,288,000
Suisun City 5% $1,513,000 $7,564,000
Vacaville 20% $5,874,000 $29,372,000
Vallejo 23% $6,882,000 $34,409,000
County of Solano 17% $5,222,000 $26,110,000
TOTAL 100% $30,000,000 $150,000,000
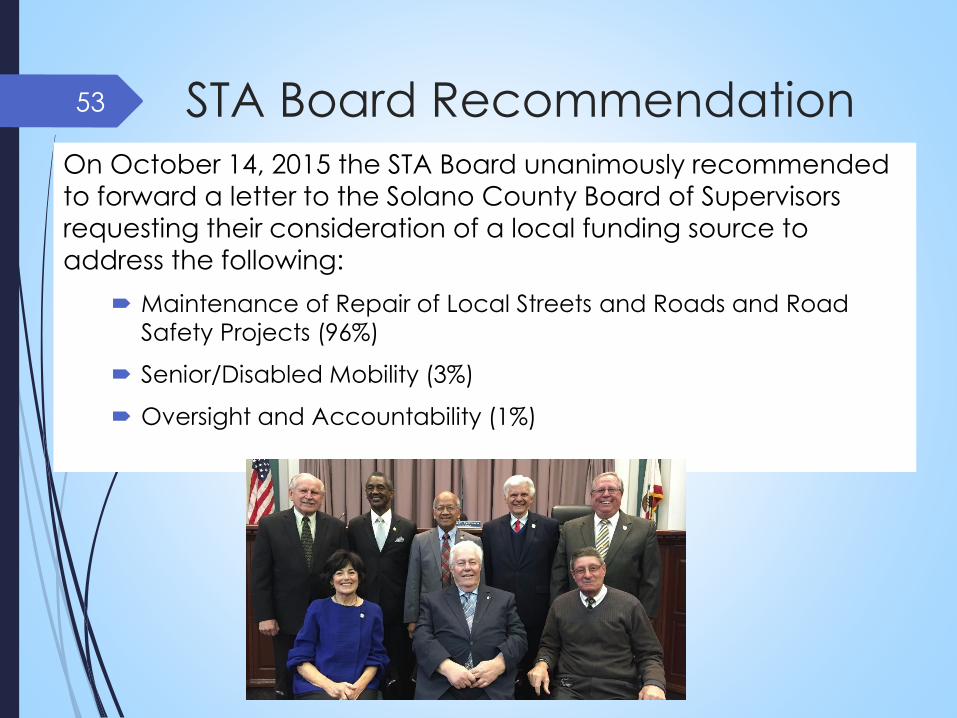
STA Board RecommendationOn October 14, 2015 the STA Board unanimously recommended
to forward a letter to the Solano County Board of Supervisors
requesting their consideration of a local funding source to
address the following:
Maintenance of Repair of Local Streets and Roads and Road
Safety Projects (96%)
Senior/Disabled Mobility (3%)
Oversight and Accountability (1%)
53
Accountability Requirements
Oversight board
Public review and comment period both prior to the funds allocated and
after they are spent.
This recommendation came from comments at the STA Board and the
Solano Taxpayer group.
Maintenance of effort by each of the 7 cities
Timely delivery of projects
54
Why Does Solano Need A Local
Fund Source?
Solano roads countywide face a $24M annual shortfall
to maintain roads in current condition (fair)
With FY 2013/14 funding levels, average road condition
is projected to decrease from PCI 65 (fair) in 2014 to
PCI 49 (poor) by 2028.
26% of roads countywide are in poor condition
Stabilize road funding and safety projects
State Revenue to Solano for LS&R has decreased $6.2M
since 2014.
55
Why Does Solano Need A Local
Fund Source?
Local funding is less cumbersome than federal and
state funding, which would allow for faster and less
expensive projects
Ability to leverage federal, state, and regional funding
and grants
Allows jurisdictions to address their highest priority
safety projects.
Reversing the recent trend of increasing
Accidents/injuries since 2012
Provides stable funding source for the increasing
needs of seniors and disabled in Solano County,
replacing one-time only competitive grants.
56
Solano Transportation Authority
Daryl K. Halls, Executive Director
One Harbor Center, Suite 130
Suisun City CA 94585
707-424-6075
www.sta.ca.gov
57
Questions?