Embed Size (px)
Citation preview
Soil-Landscape Relationships in Virginia: II. Reconstruction Analysisand Soil Genesis
M. H. Stolt,* J. C. Baker, and T. W. Simpson
ABSTRACTReconstruction analysis is a means of quantitatively determining
gains and losses of soil constituents as a result of pedogenesis. Soilreconstruction techniques were employed to examine the relationshipsbetween landscape position and soil genesis in the Piedmont and BlueRidge Highlands regions of Virginia. Backslope soils occurring onslopes of up to 18% have profile morphologies and clay distributionsvery similar to associated summit soils. Footslope soils are bisequal,have less clay in the Bt horizons, and show less profile developmentthan associated summit or backslope soils. Transects across topose-quences indicated minimal differences in profile morphology betweensummits and lower backslopes. The major processes that could bequantified using reconstruction analysis were sand and silt weather-ing, subsequent weathering product transport and leaching, clay il-luviation, and accumulation of free Fe oxides. Soil reconstructionindicated that summit and backslope soils undergo the same soil-form-ing processes. Footslope soil formation is, in part, dependent on thetype and composition of parent material. Footslope horizons formedin substantially weathered local alluvium showed minimal sand andsilt weathering and associated leaching of weathering products. Un-derlying horizons formed from parent rock showed evidence of bothweathering and clay illuviation. Losses of elemental Fe, K, and Tiwere found to coincide with weathering of silt and sand. Losses andgains of dithionite-citrate-bicarbonate (DCB) extractable Fe and Alwere associated with gains or losses of clay-sized material.
SOIL RECONSTRUCTION TECHNIQUES were pioneeredby Marshall and Haseman (1942) and are em-
ployed to quantitatively measure gains and losses ofvarious soil constituents relative to those of the parentmaterial. These techniques are often thought of as cal-culations of soil formation, with the gains and lossesequated to pedogenesis (Brewer, 1976). Reconstruc-tion techniques are most often applied to individualsoils or employed to examine a specific soil-formingprocess. Sudom and St. Arnaud (1971) used recon-struction techniques to examine gains and losses ofsoil constituents in a Boralf (Orthic Gray Luvisol).Wang and Arnold (1973) used these techniques to un-derstand differences in soil formation between a Ha-pludalf and a Fragiochrept formed from similar parentmaterials. Reconstruction techniques have also beenused to explain differences in clay distributions be-tween soils formed from similar parent materials (Smecket al., 1968) and to examine clay accumulations inpoorly drained soils (Smeck et al., 1981).
Relationships between landscape position and soilgenesis have been explored by several authors usingvarious techniques. In Texas, West et al. (1988) usedreconstruction techniques to examine the effects oflandscape position on development of carbonate-richhorizons. They concluded that gains and losses of car-bonates in summit soils could be best explained by
Contribution of the Dep. of Crop and Soil Environmental Sci-ences, Virginia Polytechnic Institute and State Univ., Blacksburg,VA 24061-0404. Received 9 July 1991. 'Corresponding author.
Published in Soil Sci. Soc. Am. J. 57:422-428 (1993).
deeper leaching at this stable position. Backslope soils,however, were unstable, and carbonate distributionwith depth was affected more by erosion than bydownslope enrichment with carbonates.
Much of the soil-landscape research has concernedyoung soils developed in loess. Ruhe and Walker (1968)constructed hillslope models by curve-fitting linear,exponential, power, and polynomial equations to soilsdata. From the hillslope models, these researchersconcluded that the effects of erosion, sedimentation,time, and soil environment on soil properties could bepredicted reasonably well. Walker et al. (1968) usedtrend surface analysis to assess soil-landscape rela-tionships. Summit soils were least affected by erosion,backslopes were most affected, and footslope soilsshowed higher clay and organic matter contents. Kleis(1970) studied soil-landscape relationships in soils< 2900 yr old, finding that a series of equations couldbe used to describe changes in particle size, cation-exchange capacity, base saturation, and organic mat-ter content with distance from the summit. Theseequations indicated that differences in soils betweenthe landscape positions were primarily related to hill-slope sedimentation, with minimal differences relatedto pedogenesis. Huddleston and Riecken (1973) andHuddleston et al. (1975) used principal componentanalysis to distinguish between pedologic and geo-logic processes within a landscape. These studies foundsummits to be the most stable landscape positions,with most of the variability explained by pedogenesis.Substantial erosion and deposition had occurred atbackslope and footslope positions. Therefore, varia-bility observed within backslope and footslope soilswas related to geologic processes such as hillslopeerosion and gully sedimentation.
Little quantitative soil-landscape research has fo-cused on Ultisols showing considerable evidence ofweathering and clay illuviation. In addition, only Westet al. (1988) have used reconstruction techniques toexamine soil-landscape relationships. Therefore, thisstudy was initiated with the following objectives: (i)to describe the soil-landscape relationships in thePiedmont and Blue Ridge Highlands of Virginia; (ii)to determine the gains and losses of the soil constit-uents at the summit, backslope, and footslope posi-tions of these landscapes;; and (iii) to evaluate theapplication of reconstruction techniques to studyingrelationships between soil genesis and landscape po-sition.
MATERIALS AJVD METHODSField and laboratory methods are as described in Stolt et al.
(1993).
Reconstruction TechniquesCalculations for soil reconstruction were taken primarily from
Brewer (1976) and based on a stable constituent. Total Zr inthe silt and sand fractions was used as the stable constituent.
422
STOLT ET AL.: SOIL-LANDSCAPE RELATIONSHIPS IN VIRGINIA: II. 423
Adjustments for changes in volume were made using the vol-ume factor (after Smeck and Wilding, 1980), instead of thereciprocal presented by Brewer (1976). Parent material for theresidual portion of the soils was established using soil micro-morphology (Stolt et al., 1991). Parent materials that were notresidual in nature were assumed to have been transported fromupslope.
RESULTS AND DISCUSSIONSummit and backslope soils at Sites 1 and 2 are typical
of soils in piedmont woodlands formed from mica gneisssaprolite and are classified as clayey, oxidic, mesic TypicHapludults. Surface horizons (A and E combined) ofsummit and backslope soils at Site 1 are relatively thick(Table 1). Profile morphologies and clay distributions(Table 2) are similar, suggesting that both of these po-sitions are relatively stable even though the backslopesoil occurs on an 18% slope. In these woodlands, thetree canopy, surface litter, and root mat have stabilizedand protected these soils from significant surface ero-sion. The footslope soil at Site 1 is bisequal. Lowerhorizons have developed from parent rock, and the upperhorizons from local alluvium (slope wash). This soil liesat the edge of the head of a drainageway, which is aconvergence point on the landscape for waters movingdownslope along the transect examined and surroundinglandscape. Over this rather large area, a minimal amountof erosion could account for the local alluvium depositedat the footslope.
Trends and magnitude of the gains and losses of soilconstituents for the summit and backslope soils of Site1 are similar (Fig. 1, Table 3). The greatest losses occurin the sand fraction, indicating that sand weathering is amajor process occurring in these soils. Losses of sanddecrease with depth, indicating that the degree of weath-ering also decreases with depth. Losses of silt occur inthe A and E horizons, but minimal change in silt contentoccurs below the E horizons.
Sand weathering results in several products includingsilt, clay, and ionic species that may be leached or che-lated and thereby lost from the soil system. In a similarmanner, silt weathering results in clay and ionic species.Unfortunately, we cannot determine the distribution ofthe products when sand or silt is lost from the system.We can only measure the relative gains in the other con-stituents and suggest that they may be a weathering prod-uct of sand- or silt-sized minerals.
Total and fine clay show the largest gains, with sum-mit and backslope soils showing similar gains (Table 3,Fig. 1). Maximum gains occur in the argillic horizon.Gains are sufficient enough in the Bt2 and Bt3 horizonsof the summit soil, and all Bt horizons of the backslopepedon (with the exception of the Btl), to produce a pos-itive net change in soil material. Although gains in clayin the Bt horizons can be the result of physical and chem-ical weathering and clay formation, a substantial portionof the gains can be attributed to illuviation. Gains of clayrelated to illuviation are evidenced by the many contin-uous clay films within these horizons. In addition, thinsections of the summit soil Bt3 horizon shows > 16%oriented clay on an area basis (Stolt et al., 1991). Theseobservations indicate that illuviation is one of the majorsoil-forming processes in these soils. Changes in clay inthe A and E horizons are minimal (Fig. 1, Table 3),
Table 1. Abbreviated profile descriptionsf of summit, backslope,and footslope soils of Site 1.
Horizon Depthcm
Structure Texture Color Clay films
SummitAEBtlBt2Bt3Bt4BCtBC1
BC2
Cl
AEBtl
Bt2
Bt3Bt4
BCt
BC1
BC2
Cl
AABBwlBw22Bt
2Crt
0-77-16
16-3131-4848-6363-126
126-170170-202
202-245
245^*20
0-77-28
28-43
43-70
70-9898-130
130-150
150-187
187-216
216-275
0-1010-2424-4545-6767-100
100-135
wk vf/f grwk f grmod f sbkmod med sbkmod med sbkwk med sbkwk co sbksi ma
si ma
si ma
Backsloiwk f grwk mod sbkwk mod sbk
mod med sbk
mod med sbkmod co sbk
wk co sbk
si ma
si ma
si ma
Footslojwk f grwk mod sbkwk mod sbkwk co sbkmod f sbk
si ma
sifslclcc
sclfslfsl
fsl
fsl
2£fslfsl1
c
cc
1
fsl
fsl
fsl
esfslfslfslfsl
gscl
scl
10YR 3/310YR 5/8SYR 5/62.5YR 5/62.5YR 4/62.5YR 4/62.5YR 5/82.5YR 5/8SYR 6/87.5YR 5/810YR 5/62.5YR 5/8SYR 6/610YR 7/62.5YR 5/8SYR 6/610YR 7/6
10YR 3/37.5YR 6/82.5YR 4/8mottles:SYR 5/62.5YR 4/6mottles:SYR 5/62.5YR 4/62.5YR 4/6mottles:SYR 6/82.5YR 4/6mottles:SYR 6/6,10YR 8/82.5YR 4/6,2.5YR 6/6,7.5YR 3/22.5YR 4/6,SYR 6/8,7.5YR 3/22.5YR 4/6,SYR 6/8,7.5YR 3/2
10YR 4/37.5YR 4/67.5YR 5/67.5YR 5/610YR 5/6mottles:2.5YR 5/8,7.5YR 6/3SYR 6/8,2.5YR 2/1,2.5YR 5/8,7.5YR 6/8,7.5YR 7/2,10YR 6/3
many contmany contfew contfew discfew disc
few disc
.
com cont
many cont
many contcom cont
few disc
few disc
few disc
few clayflows
many disc
com disc
t Abbreviations include: wk = weak, med = medium, mod = moderate,co = coarse, si ma = structureless massive, vf = very fine, f =fine, gr = granular, sbk = subangular blocky, c = clay, cl = clayloam, fsl = fine sandy loam, 1 = loam, sil = silt loam, si = sandyloam, g = gravelly, vg = very gravelly, com = common, cont =continuous, disc = discontinuous.
indicating that a state of equilibrium between clay elu-viation and physical and chemical weathering of largerparticles to clay and fine clay has been reached in thesetwo horizons.
Although the gains are much smaller, DCB-extracta-ble Fe and Al show trends similar to the clay fractions.

424 SOIL SCI. SOC. AM. J., VOL. 57, MARCH-APRIL 1993
Table 2. Selected physical, chemical, and elemental data for the summit, backslope, and footslope soils of Site 1.
Horizon
AEBtlBt2Bt3Bt4BCtBC1BC2Cl
AEBtlBt2Bt3Bt4BCtBC1BC2Cl
AABBwlBw22Bt2CrtRock
Depthcm
0-77-16
16-3131-4848-6363-126
126-170170-202202-245245-420
0-77-28
28-4343-7070-9898-130
130-150150-187187-216216-275
0-1010-2424-4545-6767-100
100—135135 +
BulkdensityMg/m3
1.051.321.521.371.281.371.471.381.341.30
1.171.611.621.471.451.451.391.461.321.36
1.031.431.521.641.451.652.41
Sand
58.259.143.930.732.851.359.666.774.176.2
56.656.445.931.524.736.749.566.066.671.0
53.457.954.653.752.459.60.0
Silt
27.630.527.421.115.718.621.415.117.918.3
30.524.829.925.118.921.620.821.120.921.1
32.032.132.533.424.117.50.0
Clay
Summit14.210.428.748.251.530.119.07.98.05.5
Backslope12.98.8
24.243.456.441.729.712.912.57.9
Footslope14.610.012.912.923.522.90.0
Fineclay
5.32.5
10.120.724.014.29.22.82.61.5
4.31.48.0
18.726.721.013.86.85.33.5
5.02.53.32.77.28.00.0
DCB Fet——— % -
0.780.791.813.353.602.322.101.200.920.84
0.640.681.333.054.323.963.041.951.951.95
0.760.830.931.052.242.900.21
DCB AI
0.160.180.280.420.420.270.220.130.090.08
0.210.140.200.330.460.340.260.170.150.18
0.220.180.180.170.300.340.06
SZr*
0.050.050.040.040.030.030.030.030.020.02
0.110.160.090.120.130.120.110.100.100.08
0.090.130.140.150.200.190.11
STi
0.170.200.180.210.220.220.240.300.260.24
0.300.260.200.360.520.530.640.550.661.11
0.250.230.270.290.420.660.84
SFe
0.030.110.290.370.861.000.951.882.122.01
0.400.340.140.871.632.513.964.014.745.3
0.300.230.430.370.632.626.57
SK
3.193.804.103.564.333.764.274.534.664.74
4.034.083.833.813.533.714.074.054.153.76
4.303.943.983.983.694.193.83
t DCB = dithionite-citrate-bicarbonatej S = sand fraction.
Maximum gains in DCB Fe and DCB Al occur in thesame horizon as the maximum gains in clay. These re-sults are expected, as DCB Fe is generally found in closeassociation with clay.
Elemental constituents for summit and backslope soilsof Site 1 show decreasing losses with depth, which sup-ports the particle-size weathering trends (Table 3). Thinsections of C horizons of these soils show quartz, feld-spar, muscovite, and biotite as the primary sand- andsilt-sized minerals. Biotite is generally Fe rich and mayhave some Ti substitutions (Kaup and Carter, 1987).
0 Site 1 Sand
50-
•§100
150
200BOOBD Summit
Backslope250' .-12000 -6000 ,
g/100 cm2
Site 1 Clay
0 -1 300 3000 7000g/100 cm2
Fig. 1. Cumulative gains and losses of sand and clay of thesummit and backslope soils of Site 1.
Since the backslope has greater Ti and Fe content in theparent material sand fraction, and the losses of theseelements are greater, the backslope soil may containslightly more biotite than the summit soil. Although someFe may be lost during degradation of silt and sand toclay-size particles, most is probably released during theoxidation and weathering of biotite. Losses of elementalFe are similar in magnitude to the gains in DCB Fe inthe summit soil. In the backslope soil, however, lossesof elemental Fe are higher than the gains in DCB Fe,indicating that some Fe released from primary mineralsis being lost from the soil system. Losses in K can beattributed to weathering of feldspars and mica.
About one-half the losses related to sand and siltweathering are balanced by gains in clay. The net lossof soil material from the system can be attributed toleaching of weathering products. Losses of Fe, K, andTi, however, do not account for the net losses of soilmaterial. These soils have formed from phyllosilicateminerals. Therefore, much of the losses may be attrib-uted to leaching of Si (data is not available). Loss of Siwas the major elemental change during saprolite for-mation for these soils (Stolt et al., 1992). Similar changesin Si content would be expected to continue during soilformation.
Wang and Arnold (1973) showed that reconstructiontechniques could be applied to soils with discontinuitiesif the initial soil parent material could be recognized.Physical and chemical properties of the A-Bw2 horizonsof the Site 1 footslope are similar to the A and E horizonsof the summit and backslope soils (Table 2), suggesting
STOLT ET AL.: SOIL-LANDSCAPE RELATIONSHIPS IN VIRGINIA: II. 425
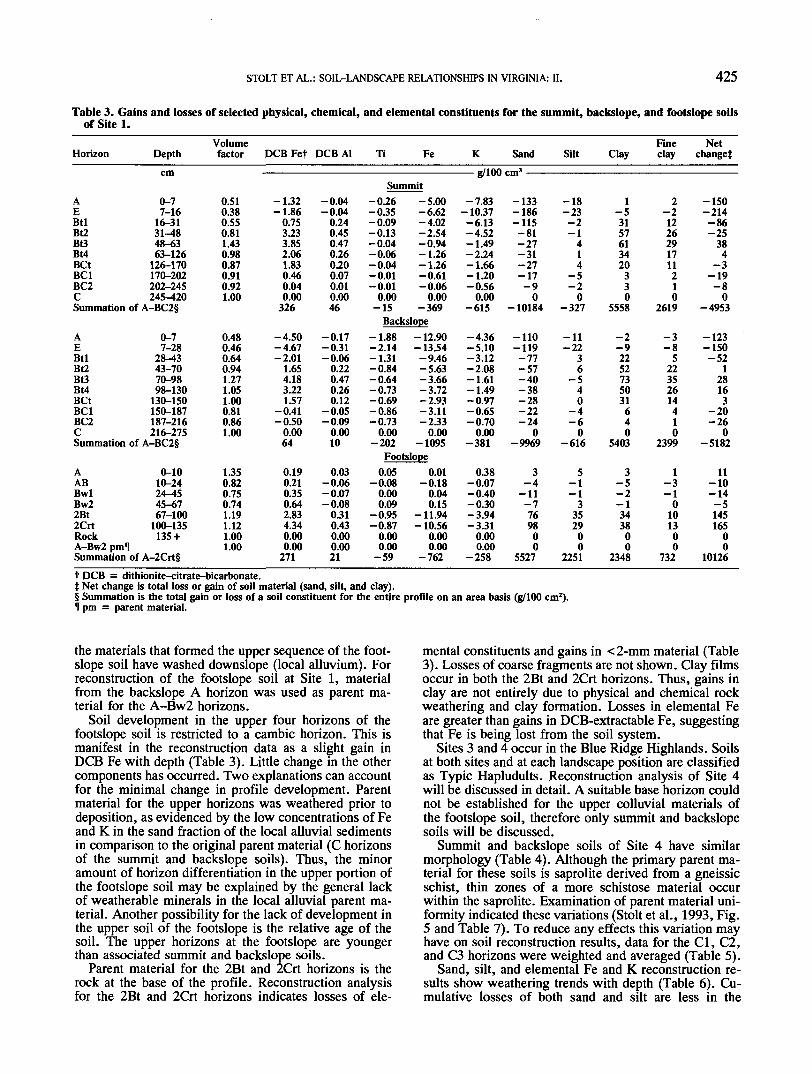
Table 3. Gains and losses of selected physical, chemical, and elemental constituents for the summit, backslope, and footslope soilsof Site 1.
Horizon Depthcm
Volumefactor DCB Fet DCB Al Ti Fe K Sand Silt Clay
Fineclay
Netchanged
-itnn —— 3
SummitA 0-7E 7-16Btl 16-31Bt2 31-48Bt3 48-63Bt4 63-126BCt 126-170BC1 170-202BC2 202-245C 245-420Summation of A-BC2§
0.510.380.550.811.430.980.870.910.921.00
-1.32-1.86
0.753.233.852.061.830.460.040.00
326
-0.04-0.04
0.240.450.470.260.200.070.010.0046
-0.26-0.35-0.09-0.13-0.04-0.06-0.04-0.01-0.01
0.00-15
-5.00-6.62-4.02-2.54-0.94-1.26-1.26-0.61-0.06
0.00-369
-7.83- 10.37-6.13-4.52-1.49-2.24-1.66-1.20-0.56
0.00-615
-133-186-115-81-27-31-27-17-9
0-10184
-18-23-2-1
414
-5-2
0-327
1-53157613420330
5558
2-21226291711210
2619
-150-214-86-25
384
-3-19-8
0-4953
BackslopeA 0-7E 7-28Btl 28-43Bt2 43-70Bt3 70-98Bt4 98-130BCt 130-150BC1 150-187BC2 187-216C 216-275Summation of A-BC2§
0.480.460.640.941.271.051.000.810.861.00
-4.50-4.67-2.01
1.654.183.221.57
-0.41-0.50
0.0064
-0.17-0.31-0.06
0.220.470.260.12
-0.05-0.09
0.0010
-1.88-2.14-1.31-0.84-0.64-0.73-0.69-0.86-0.73
0.00-202
-12.90-13.54-9.46-5.63-3.66-3.72-2.93-3.11-2.33
0.00-1095
-4.36-5.10-3.12-2.08-1.61-1.49-0.97-0.65-0.70
0.00-381
-110-119-77-57-40-38-28-22-24
0-9969
-11-22
36
-540
-4-6
0-616
-2-92252735031640
5403
-3-8
522352614410
2399
-123-150-52
128163
-20-26
0-5182
FootslopeA 0-10AB 10-24Bwl 24-̂ 15Bw2 45-672Bt 67-1002Crt 100-135Rock 135 +A-Bw2 pmfSummation of A-2Crt§
1.350.820.750.741.191.121.001.00
0.190.210.350.642.834.340.000.00
271
0.03-0.06-0.07-0.08
0.310.430.000.0021
0.05-0.08
0.000.09
-0.95-0.87
0.000.00
-59
0.01-0.18
0.040.15
-11.94- 10.56
0.000.00
-762
0.38-0.07-0.40-0.30-3.94-3.31
0.000.00
-258
3-4
-11-7769800
5527
5-1-1
3352900
2251
3-5-2-1343800
2348
1-3-1
0101300
732
11-10-14-5145165
00
10126t DCB = dithionite-citrate-bicarbonate.$ Net change is total loss or gain of soil material (sand, silt, and clay).§ Summation is the total gain or loss of a soil constituent for the entire profile on an area basis (g/100 cm2).11 pm = parent material.
the materials that formed the upper sequence of the foot-slope soil have washed downslope (local alluvium). Forreconstruction of the footslope soil at Site 1, materialfrom the backslope A horizon was used as parent ma-terial for the A-Bw2 horizons.
Soil development in the upper four horizons of thefootslope soil is restricted to a cambic horizon. This ismanifest in the reconstruction data as a slight gain inDCB Fe with depth (Table 3). Little change in the othercomponents has occurred. Two explanations can accountfor the minimal change in profile development. Parentmaterial for the upper horizons was weathered prior todeposition, as evidenced by the low concentrations of Feand K in the sand fraction of the local alluvial sedimentsin comparison to the original parent material (C horizonsof the summit and backslope soils). Thus, the minoramount of horizon differentiation in the upper portion ofthe footslope soil may be explained by the general lackof weatherable minerals in the local alluvial parent ma-terial. Another possibility for the lack of development inthe upper soil of the footslope is the relative age of thesoil. The upper horizons at the footslope are youngerthan associated summit and backslope soils.
Parent material for the 2Bt and 2Crt horizons is therock at the base of the profile. Reconstruction analysisfor the 2Bt and 2Crt horizons indicates losses of ele-
mental constituents and gains in < 2-mm material (Table3). Losses of coarse fragments are not shown. Clay filmsoccur in both the 2Bt and 2Crt horizons. Thus, gains inclay are not entirely due to physical and chemical rockweathering and clay formation. Losses in elemental Feare greater than gains in DCB-extractable Fe, suggestingthat Fe is being lost from the soil system.
Sites 3 and 4 occur in the Blue Ridge Highlands. Soilsat both sites and at each landscape position are classifiedas Typic Hapludults. Reconstruction analysis of Site 4will be discussed in detail. A suitable base horizon couldnot be established for the upper colluvial materials ofthe footslope soil, therefore only summit and backslopesoils will be discussed.
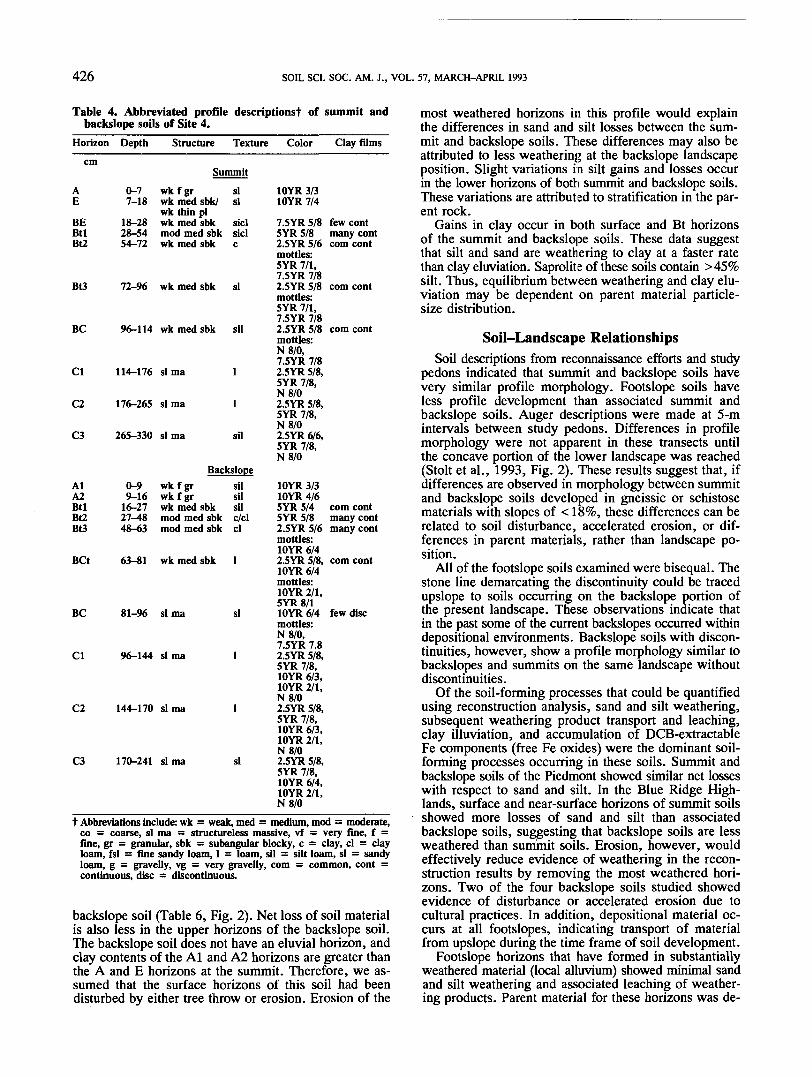
Summit and backslope soils of Site 4 have similarmorphology (Table 4). Although the primary parent ma-terial for these soils is saprolite derived from a gneissicschist, thin zones of a more schistose material occurwithin the saprolite. Examination of parent material uni-formity indicated these variations (Stolt et al., 1993, Fig.5 and Table 7). To reduce any effects this variation mayhave on soil reconstruction results, data for the Cl, C2,and C3 horizons were weighted and averaged (Table 5).
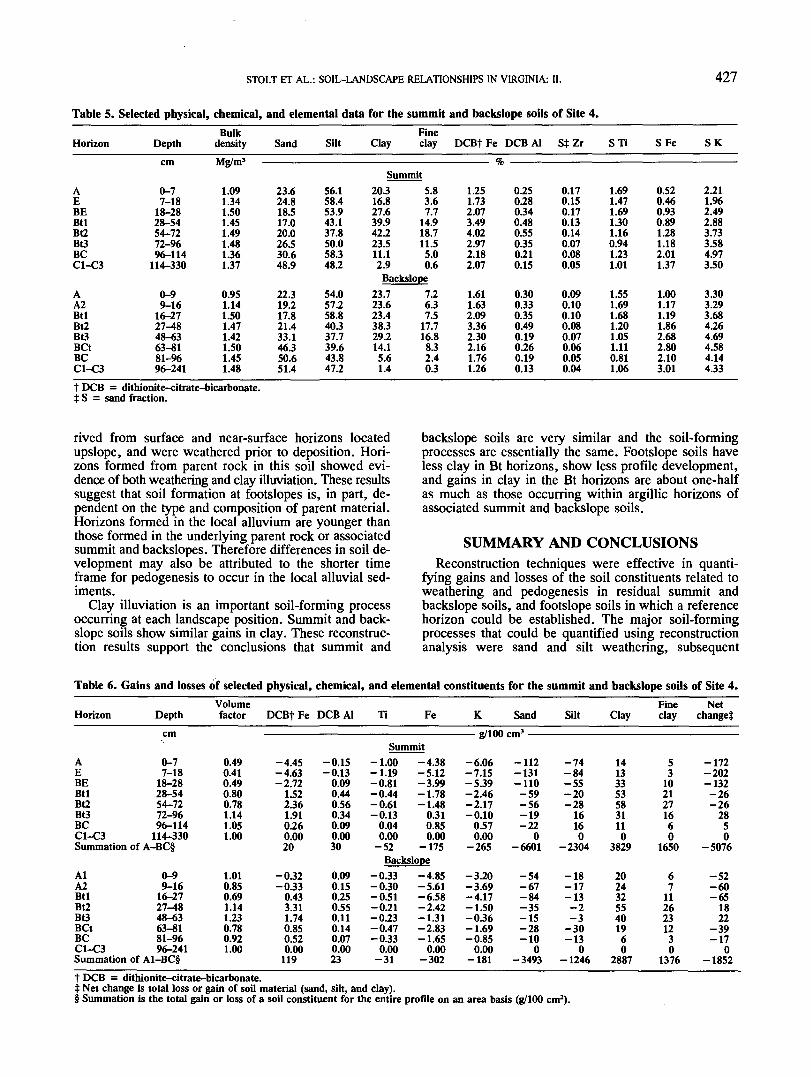
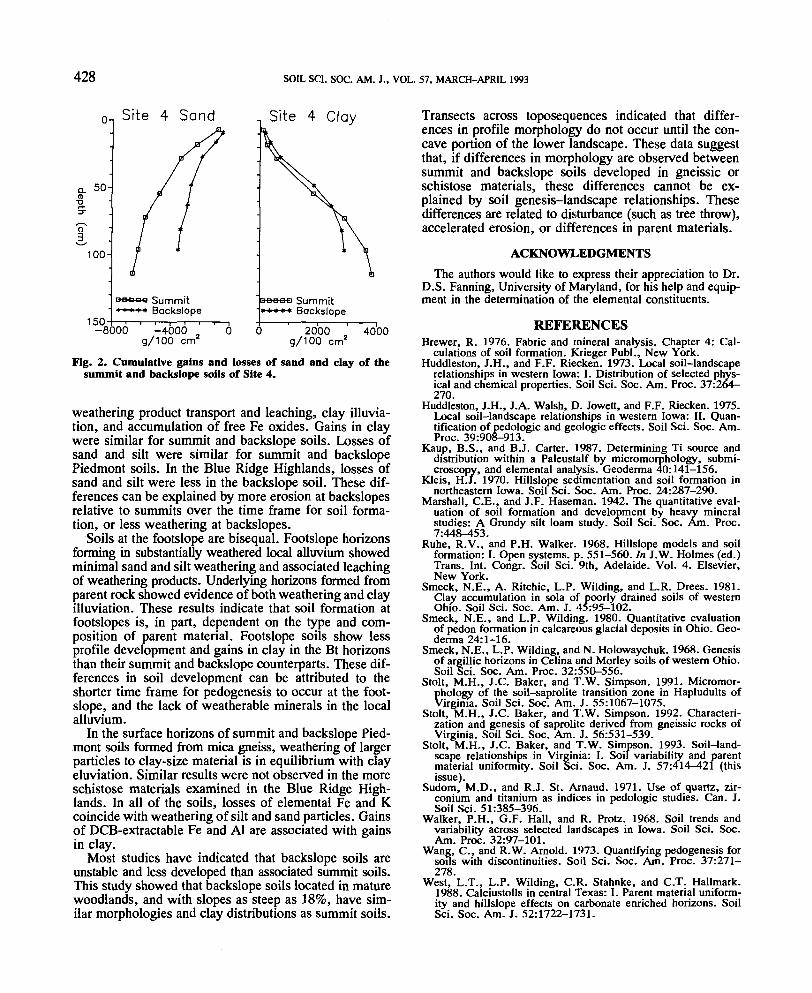
Sand, silt, and elemental Fe and K reconstruction re-sults show weathering trends with depth (Table 6). Cu-mulative losses of both sand and silt are less in the
426 SOIL SCI. SOC. AM. J., VOL. 57, MARCH-APRIL 1993
Table 4. Abbreviated profile descriptions! of summit andbackslope soils of Site 4.
Horizon Depth Structure Texture Color Clay films
SummitAE
BEBtlBt2
Bt3
BC
Cl
C2
C3
0-77-18
18-2828-5454-72
72-96
96-114
114-176
176-265
265-330
wk f grwk med sbk/wk thin piwk med sbkmod med sbkwk med sbk
wk med sbk
wk med sbk
si ma
si ma
si ma
sisi
siclsiclc
si
sil
1
1
sil
10YR 3/310YR 7/4
7.5YR 5/8SYR 5/82.5YR 5/6mottles:SYR 7/1,7.5YR 7/82.5YR 5/8mottles:SYR 7/1,7.5YR 7/82.5YR 5/8mottles:N8/0,7.5YR 7/82.5YR 5/8,SYR 7/8,N8/02.5YR 5/8,SYR 7/8,N8/02.5YR 6/6,SYR 7/8,N8/0
few contmany contcom cont
com cont
com cont
BackslopeAlA2BtlBt2Bt3
BCt
BC
Cl
C2
C3
0-99-16
16-2727-4848-63
63-81
81-96
96-144
144-170
170-241
wk f grwk f grwk med sbkmod med sbkmod med sbk
wk med sbk
si ma
si ma
si ma
si ma
silsilsilc/clCl
I
si
1
1
si
10YR 3/310YR 4/6SYR 5/4SYR 5/82.5YR 5/6mottles:10YR 6/42.5YR 5/8,10YR 6/4mottles:10YR 2/1,SYR 8/110YR 6/4mottles:N8/0,7.5YR 7.82.5YR 5/8,SYR 7/8,10YR 6/3,10YR 2/1,N8/02.5YR 5/8,SYR 7/8,10YR 6/3,10YR 2/1,N8/02.5YR 5/8,SYR 7/8,10YR 6/4,10YR 2/1,N8/0
com contmany contmany cont
com cont
few disc
t Abbreviations include: wk = weak, med = medium, mod = moderate,co = coarse, si ma = structureless massive, vf = very fine, f =fine, gr = granular, sbk = subangular blocky, c = clay, cl = clayloam, fsl = fine sandy loam, 1 = loam, sil = silt loam, si = sandyloam, g = gravelly, vg = very gravelly, com = common, cont =continuous, disc = discontinuous.
backslope soil (Table 6, Fig. 2). Net loss of soil materialis also less in the upper horizons of the backslope soil.The backslope soil does not have an eluvial horizon, andclay contents of the Al and A2 horizons are greater thanthe A and E horizons at the summit. Therefore, we as-sumed that the surface horizons of this soil had beendisturbed by either tree throw or erosion. Erosion of the
most weathered horizons in this profile would explainthe differences in sand and silt losses between the sum-mit and backslope soils. These differences may also beattributed to less weathering at the backslope landscapeposition. Slight variations in silt gains and losses occurin the lower horizons of both summit and backslope soils.These variations are attributed to stratification in the par-ent rock.
Gains in clay occur in both surface and Bt horizonsof the summit and backslope soils. These data suggestthat silt and sand are weathering to clay at a faster ratethan clay eluviation. Saprolite of these soils contain >45%silt. Thus, equilibrium between weathering and clay elu-viation may be dependent on parent material particle-size distribution.
Soil-Landscape RelationshipsSoil descriptions from reconnaissance efforts and study
pedons indicated that summit and backslope soils havevery similar profile morphology. Footslope soils haveless profile development than associated summit andbackslope soils. Auger descriptions were made at 5-mintervals between study pedons. Differences in profilemorphology were not apparent in these transects untilthe concave portion of the lower landscape was reached(Stolt et al., 1993, Fig. 2). These results suggest that, ifdifferences are observed in morphology between summitand backslope soils developed in gneissic or schistosematerials with slopes of < 18%, these differences can berelated to soil disturbance, accelerated erosion, or dif-ferences in parent materials, rather than landscape po-sition.
All of the footslope soils examined were bisequal. Thestone line demarcating the discontinuity could be tracedupslope to soils occurring on the backslope portion ofthe present landscape. These observations indicate thatin the past some of the current backslopes occurred withindepositional environments. Backslope soils with discon-tinuities, however, show a profile morphology similar tobackslopes and summits on the same landscape withoutdiscontinuities.
Of the soil-forming processes that could be quantifiedusing reconstruction analysis, sand and silt weathering,subsequent weathering product transport and leaching,clay illuviation, and accumulation of DCB-extractableFe components (free Fe oxides) were the dominant soil-forming processes occurring in these soils. Summit andbackslope soils of the Piedmont showed similar net losseswith respect to sand and silt. In the Blue Ridge High-lands, surface and near-surface horizons of summit soilsshowed more losses of sand and silt than associatedbackslope soils, suggesting that backslope soils are lessweathered than summit soils. Erosion, however, wouldeffectively reduce evidence of weathering in the recon-struction results by removing the most weathered hori-zons. Two of the four backslope soils studied showedevidence of disturbance or accelerated erosion due tocultural practices. In addition, depositional material oc-curs at all footslopes, indicating transport of materialfrom upslope during the time frame of soil development.
Footslope horizons that have formed in substantiallyweathered material (local alluvium) showed minimal sandand silt weathering and associated leaching of weather-ing products. Parent material for these horizons was de-
STOLT ET AL.: SOIL-LANDSCAPE RELATIONSHIPS IN VIRGINIA: II. 427
Table 5. Selected physical, chemical, and elemental data for the summit and backslope soils of Site 4.
Horizon Depthcm
BulkdensityMg/m3
Sand SiltFine
Clay clay DCBt Fe9
DCB Alfc ————
StZr STi SFe SK
SummitAEBEBtlBt2Bt3BCC1-C3
AA2BtlBtlBt3BCtBCC1-C3
0-77-18
18-2828-5454-7272-9696-114
114-330
0-99-16
16-2727^t848-6363-8181-9696-241
1.091.341.501.451.491.481.361.37
0.951.141.501.471.421.501.451.48
23.624.818.517.020.026.530.648.9
22.319.217.821.433.146.350.651.4
56.158.453.943.137.850.058.348.2
54.057.258.840.337.739.643.847.2
20.316.827.639.942.223.511.12.9Backsloi
23.723.623.438.329.214.15.61.4
5.83.67.7
14.918.711.55.00.6
E£7.26.37.5
17.716.88.32.40.3
1.251.732.073.494.022.972.182.07
1.611.632.093.362.302.161.761.26
0.250.280.340.480.550.350.210.15
0.300.330.350.490.190.260.190.13
0.170.150.170.130.140.070.080.05
0.090.100.100.080.070.060.050.04
1.691.471.691.301.160.941.231.01
1.551.691.681.201.051.110.811.06
0.520.460.930.891.281.182.011.37
1.001.171.191.862.682.802.103.01
2.211.962.492.883.733.584.973.50
3.303.293.684.264.694.584.144.33
t DCB = dithionite-citrate-bicarbonate.i S = sand fraction.
rived from surface and near-surface horizons locatedupslope, and were weathered prior to deposition. Hori-zons formed from parent rock in this soil showed evi-dence of both weathering and clay illuviation. These resultssuggest that soil formation at footslopes is, in part, de-pendent on the type and composition of parent material.Horizons formed in the local alluvium are younger thanthose formed in the underlying parent rock or associatedsummit and backslopes. Therefore differences in soil de-velopment may also be attributed to the shorter timeframe for pedogenesis to occur in the local alluvial sed-iments.
Clay illuviation is an important soil-forming processoccurring at each landscape position. Summit and back-slope soils show similar gains in clay. These reconstruc-tion results support the conclusions that summit and
backslope soils are very similar and the soil-formingprocesses are essentially the same. Footslope soils haveless clay in Bt horizons, show less profile development,and gains in clay in the Bt horizons are about one-halfas much as those occurring within argillic horizons ofassociated summit and backslope soils.
SUMMARY AND CONCLUSIONSReconstruction techniques were effective in quanti-
fying gains and losses of the soil constituents related toweathering and pedogenesis in residual summit andbackslope soils, and footslope soils in which a referencehorizon could be established. The major soil-formingprocesses that could be quantified using reconstructionanalysis were sand and silt weathering, subsequent
Table 6. Gains and losses of selected physical, chemical, and elemental constituents for the summit and backslope soils of Site 4.
Horizon
AEBEBtlBt2Bt3BCC1-C3Summation
Depthcm
0-77-18
18-2828-5454-7272-9696-114
114-330of A-BC§
Volumefactor DCBf Fe DCBA1 Ti Fe
Summit0.490.410.490.800.781.141.051.00
-4.45-4.63-2.72
1.522.361.910.260.0020
-0.15-0.13
0.090.440.560.340.090.0030
-1.00-1.19-0.81-0.44-0.61-0.13
0.040.00
-52
-4.38-5.12-3.99-1.78-1.48
0.310.850.00
-175
K—— g/100
-6.06-7.15-5.39-2.46-2.17-0.10
0.570.00
-265
Sandcm3
-112-131-110-59-56-19-22
0-6601
Silt
-74-84-55-20-28
16160
-2304
Clay
141333535831110
3829
Fine Netclay change}
5 -1723 -202
10 -13221 -2627 -2616 286 50 0
1650 -5076Backslope
AlA2BtlBt2Bt3BCtBCC1-C3Summation
0-99-16
16-2727^»848-6363-8181-9696-241
of A1-BC§
1.010.850.691.141.230.780.921.00
-0.32-0.33
0.433.311.740.850.520.00
119
0.090.150.250.550.110.140.070.0023
-0.33-0.30-0.51-0.21-0.23-0.47-0.33
0.00-31
-4.85-5.61-6.58-2.42-1.31-2.83-1.65
0.00-302
-3.20-3.69-4.17-1.50-0.36-1.69-0.85
0.00-181
-54-67-84-35-15-28-10
0-3493
-18-17-13-2-3
-30-13
0-1246
20243255401960
2887
6 -527 -60
11 -6526 1823 2212 -393 -170 0
1376 -1852tDCB = dithionite-citrate-bicarbonate.$ Net change is total loss or gain of soil material (sand, silt, and clay).§ Summation is the total gain or loss of a soil constituent for the entire profile on an area basis (g/100 cm2).
428 SOIL SCI. SOC. AM. J., VOL. 57, MARCH-APRIL 1993
o Site 4 Sand Site 4 Clay
Q. 50Ha•o
o
100-
150-8000
oooao SummitBackslope-4000
g/100 cmii 2000 4000
g/100 cm2
Fig. 2. Cumulative gains and losses of sand and clay of thesummit and backslope soils of Site 4.
weathering product transport and leaching, clay illuvia-tion, and accumulation of free Fe oxides. Gains in claywere similar for summit and backslope soils. Losses ofsand and silt were similar for summit and backslopePiedmont soils. In the Blue Ridge Highlands, losses ofsand and silt were less in the backslope soil. These dif-ferences can be explained by more erosion at backslopesrelative to summits over the time frame for soil forma-tion, or less weathering at backslopes.
Soils at the footslope are bisequal. Footslope horizonsforming in substantially weathered local alluvium showedminimal sand and silt weathering and associated leachingof weathering products. Underlying horizons formed fromparent rock showed evidence of both weathering and clayilluviation. These results indicate that soil formation atfootslopes is, in part, dependent on the type and com-position of parent material. Footslope soils show lessprofile development and gains in clay in the Bt horizonsthan their summit and backslope counterparts. These dif-ferences in soil development can be attributed to theshorter time frame for pedogenesis to occur at the foot-slope, and the lack of weatherable minerals in the localalluvium.
In the surface horizons of summit and backslope Pied-mont soils formed from mica gneiss, weathering of largerparticles to clay-size material is in equilibrium with clayeluviation. Similar results were not observed in the moreschistose materials examined in the Blue Ridge High-lands. In all of the soils, losses of elemental Fe and Kcoincide with weathering of silt and sand particles. Gainsof DCB-extractable Fe and Al are associated with gainsin clay.
Most studies have indicated that backslope soils areunstable and less developed than associated summit soils.This study showed that backslope soils located in maturewoodlands, and with slopes as steep as 18%, have sim-ilar morphologies and clay distributions as summit soils.
Transects across toposequences indicated that differ-ences in profile morphology do not occur until the con-cave portion of the lower landscape. These data suggestthat, if differences in morphology are observed betweensummit and backslope soils developed in gneissic orschistose materials, these differences cannot be ex-plained by soil genesis-landscape relationships. Thesedifferences are related to disturbance (such as tree throw),accelerated erosion, or differences in parent materials.
ACKNOWLEDGMENTS
The authors would like to express their appreciation to Dr.D.S. Fanning, University of Maryland, for his help and equip-ment in the determination of the elemental constituents.